
Distinct Tomato Cultivars Are Characterized by a Differential Pattern of Biochemical Responses to Drought Stress

 ,
,  , ,
, ,  ,
,  and
and 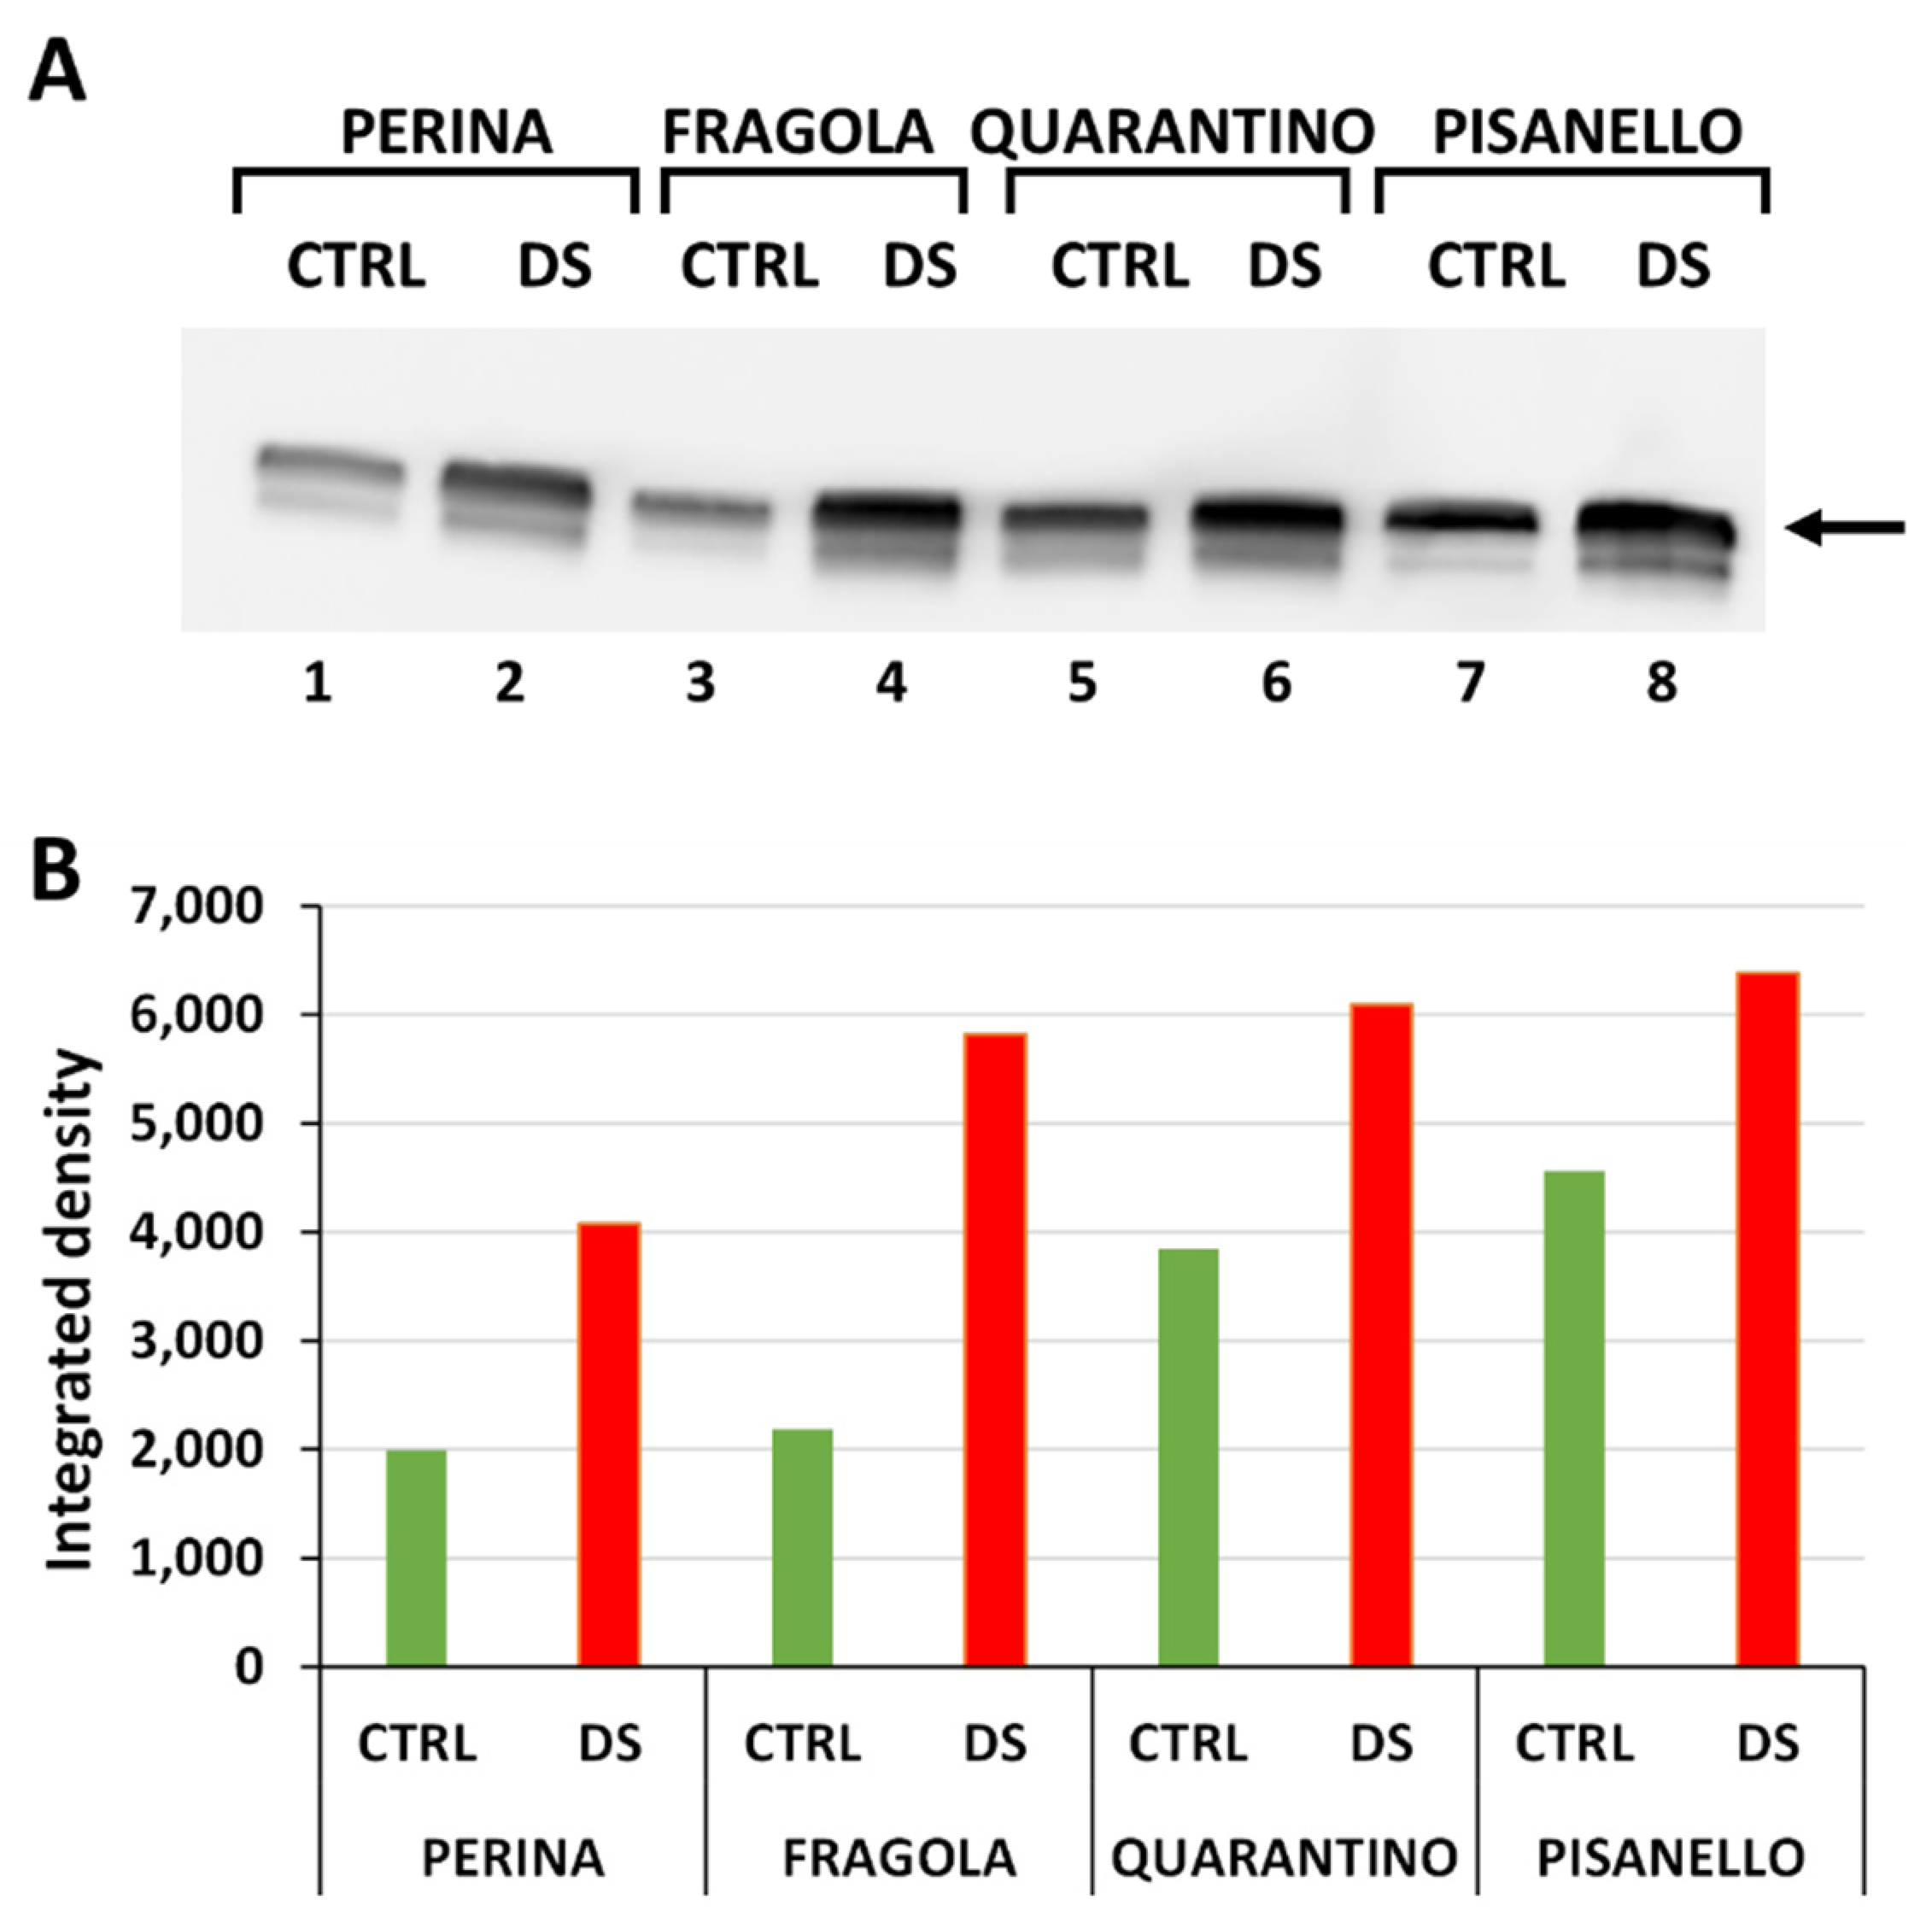
Abstract
:1. Introduction
2. Results and Discussion
2.1. Levels of HSP70 Increase after Drought Stress
2.2. Cyclophilin Levels Also Trend Upward in Drought-Stressed Cultivars
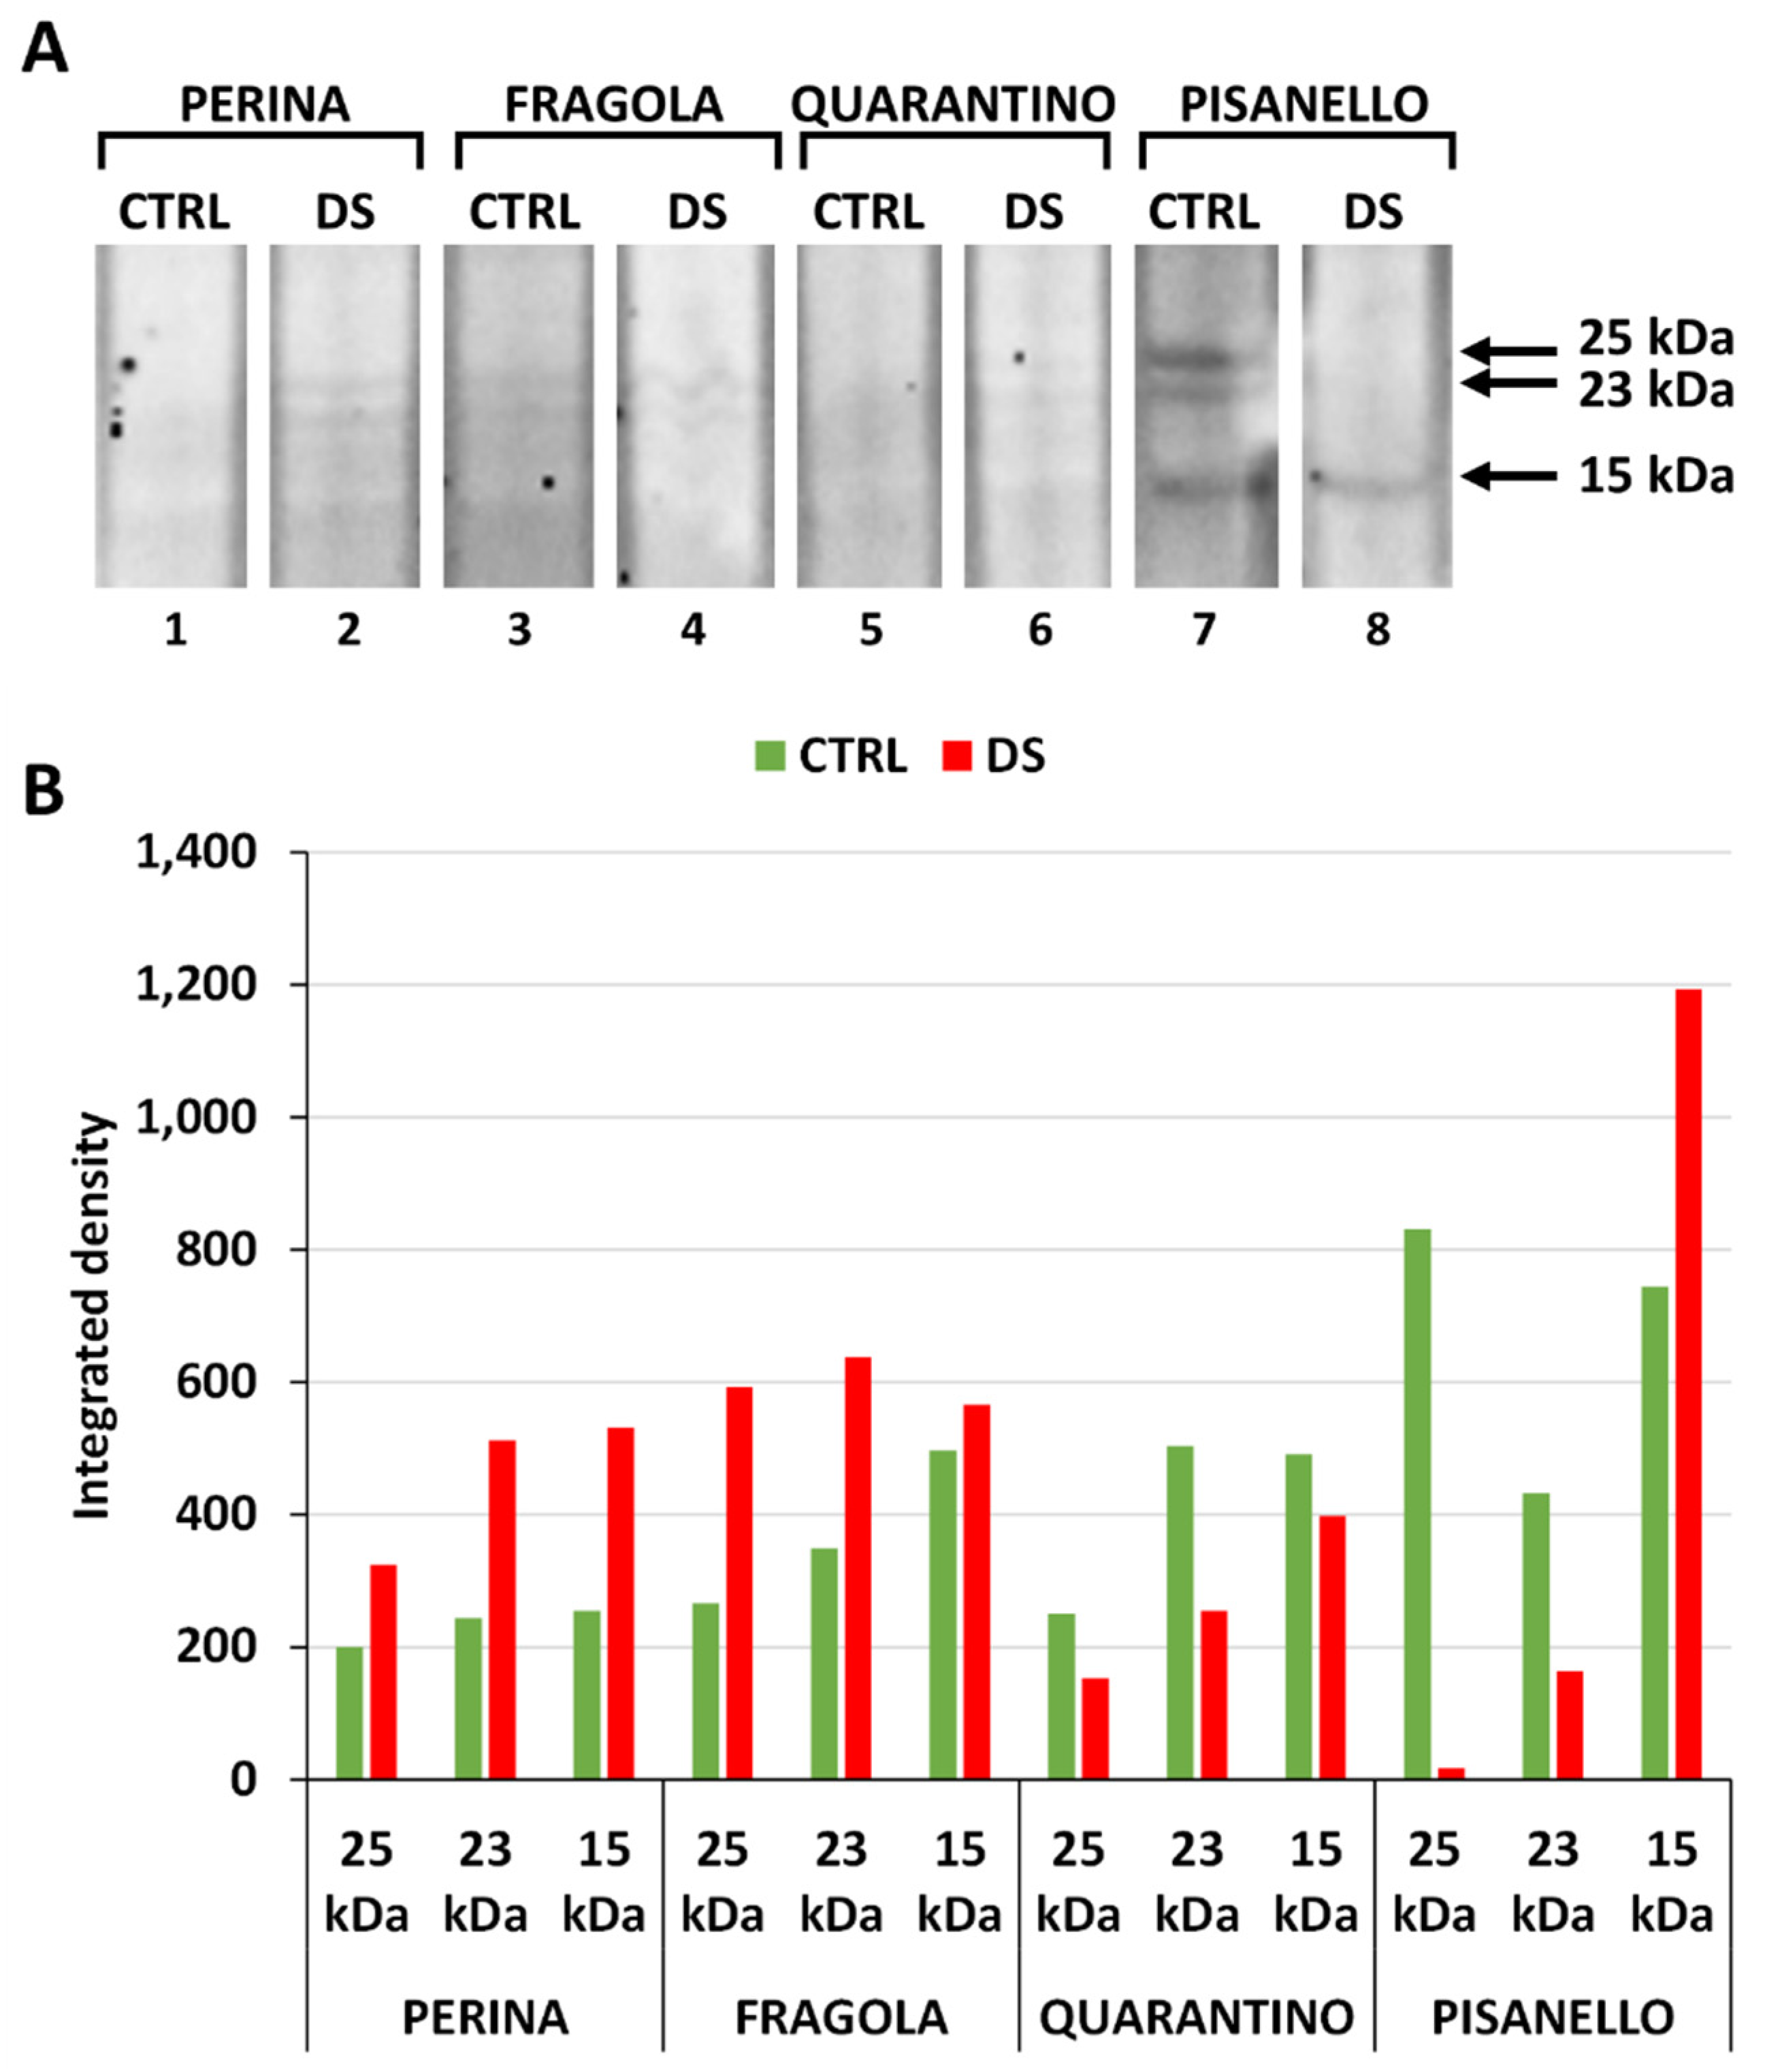
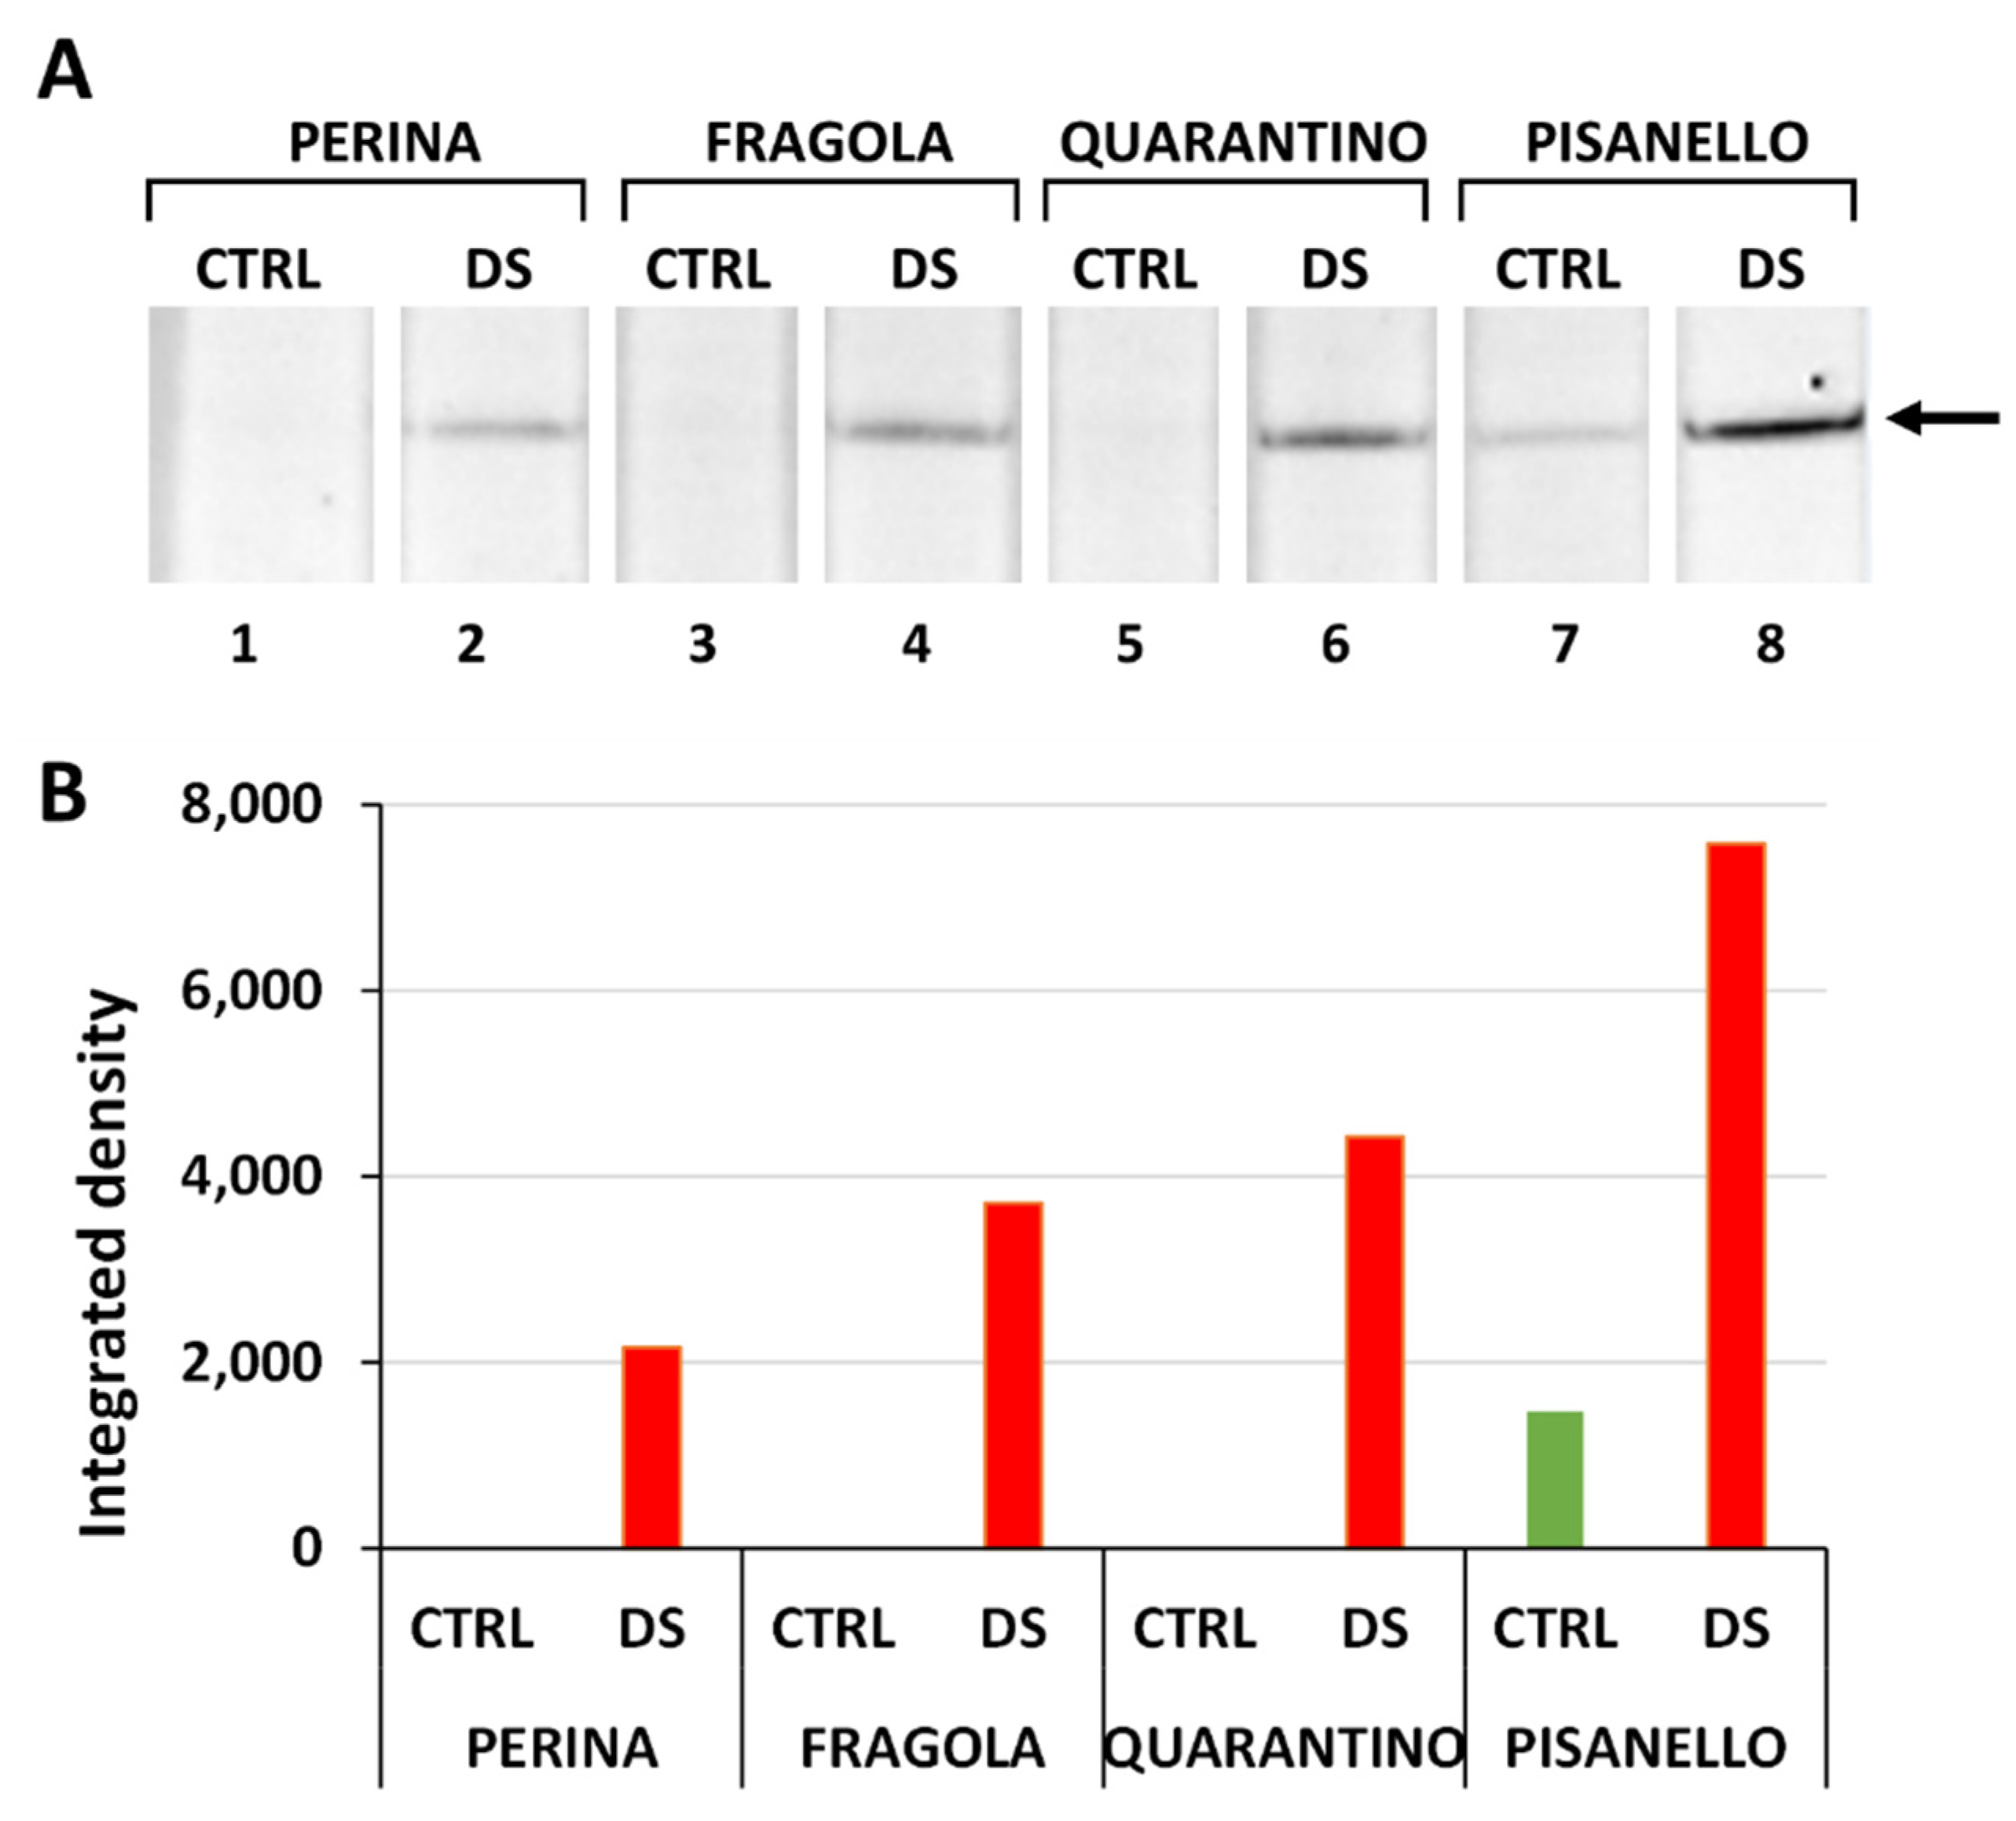
2.3. Cultivars under Drought Stress Exhibit a Significant Increase in Dehydrin Levels
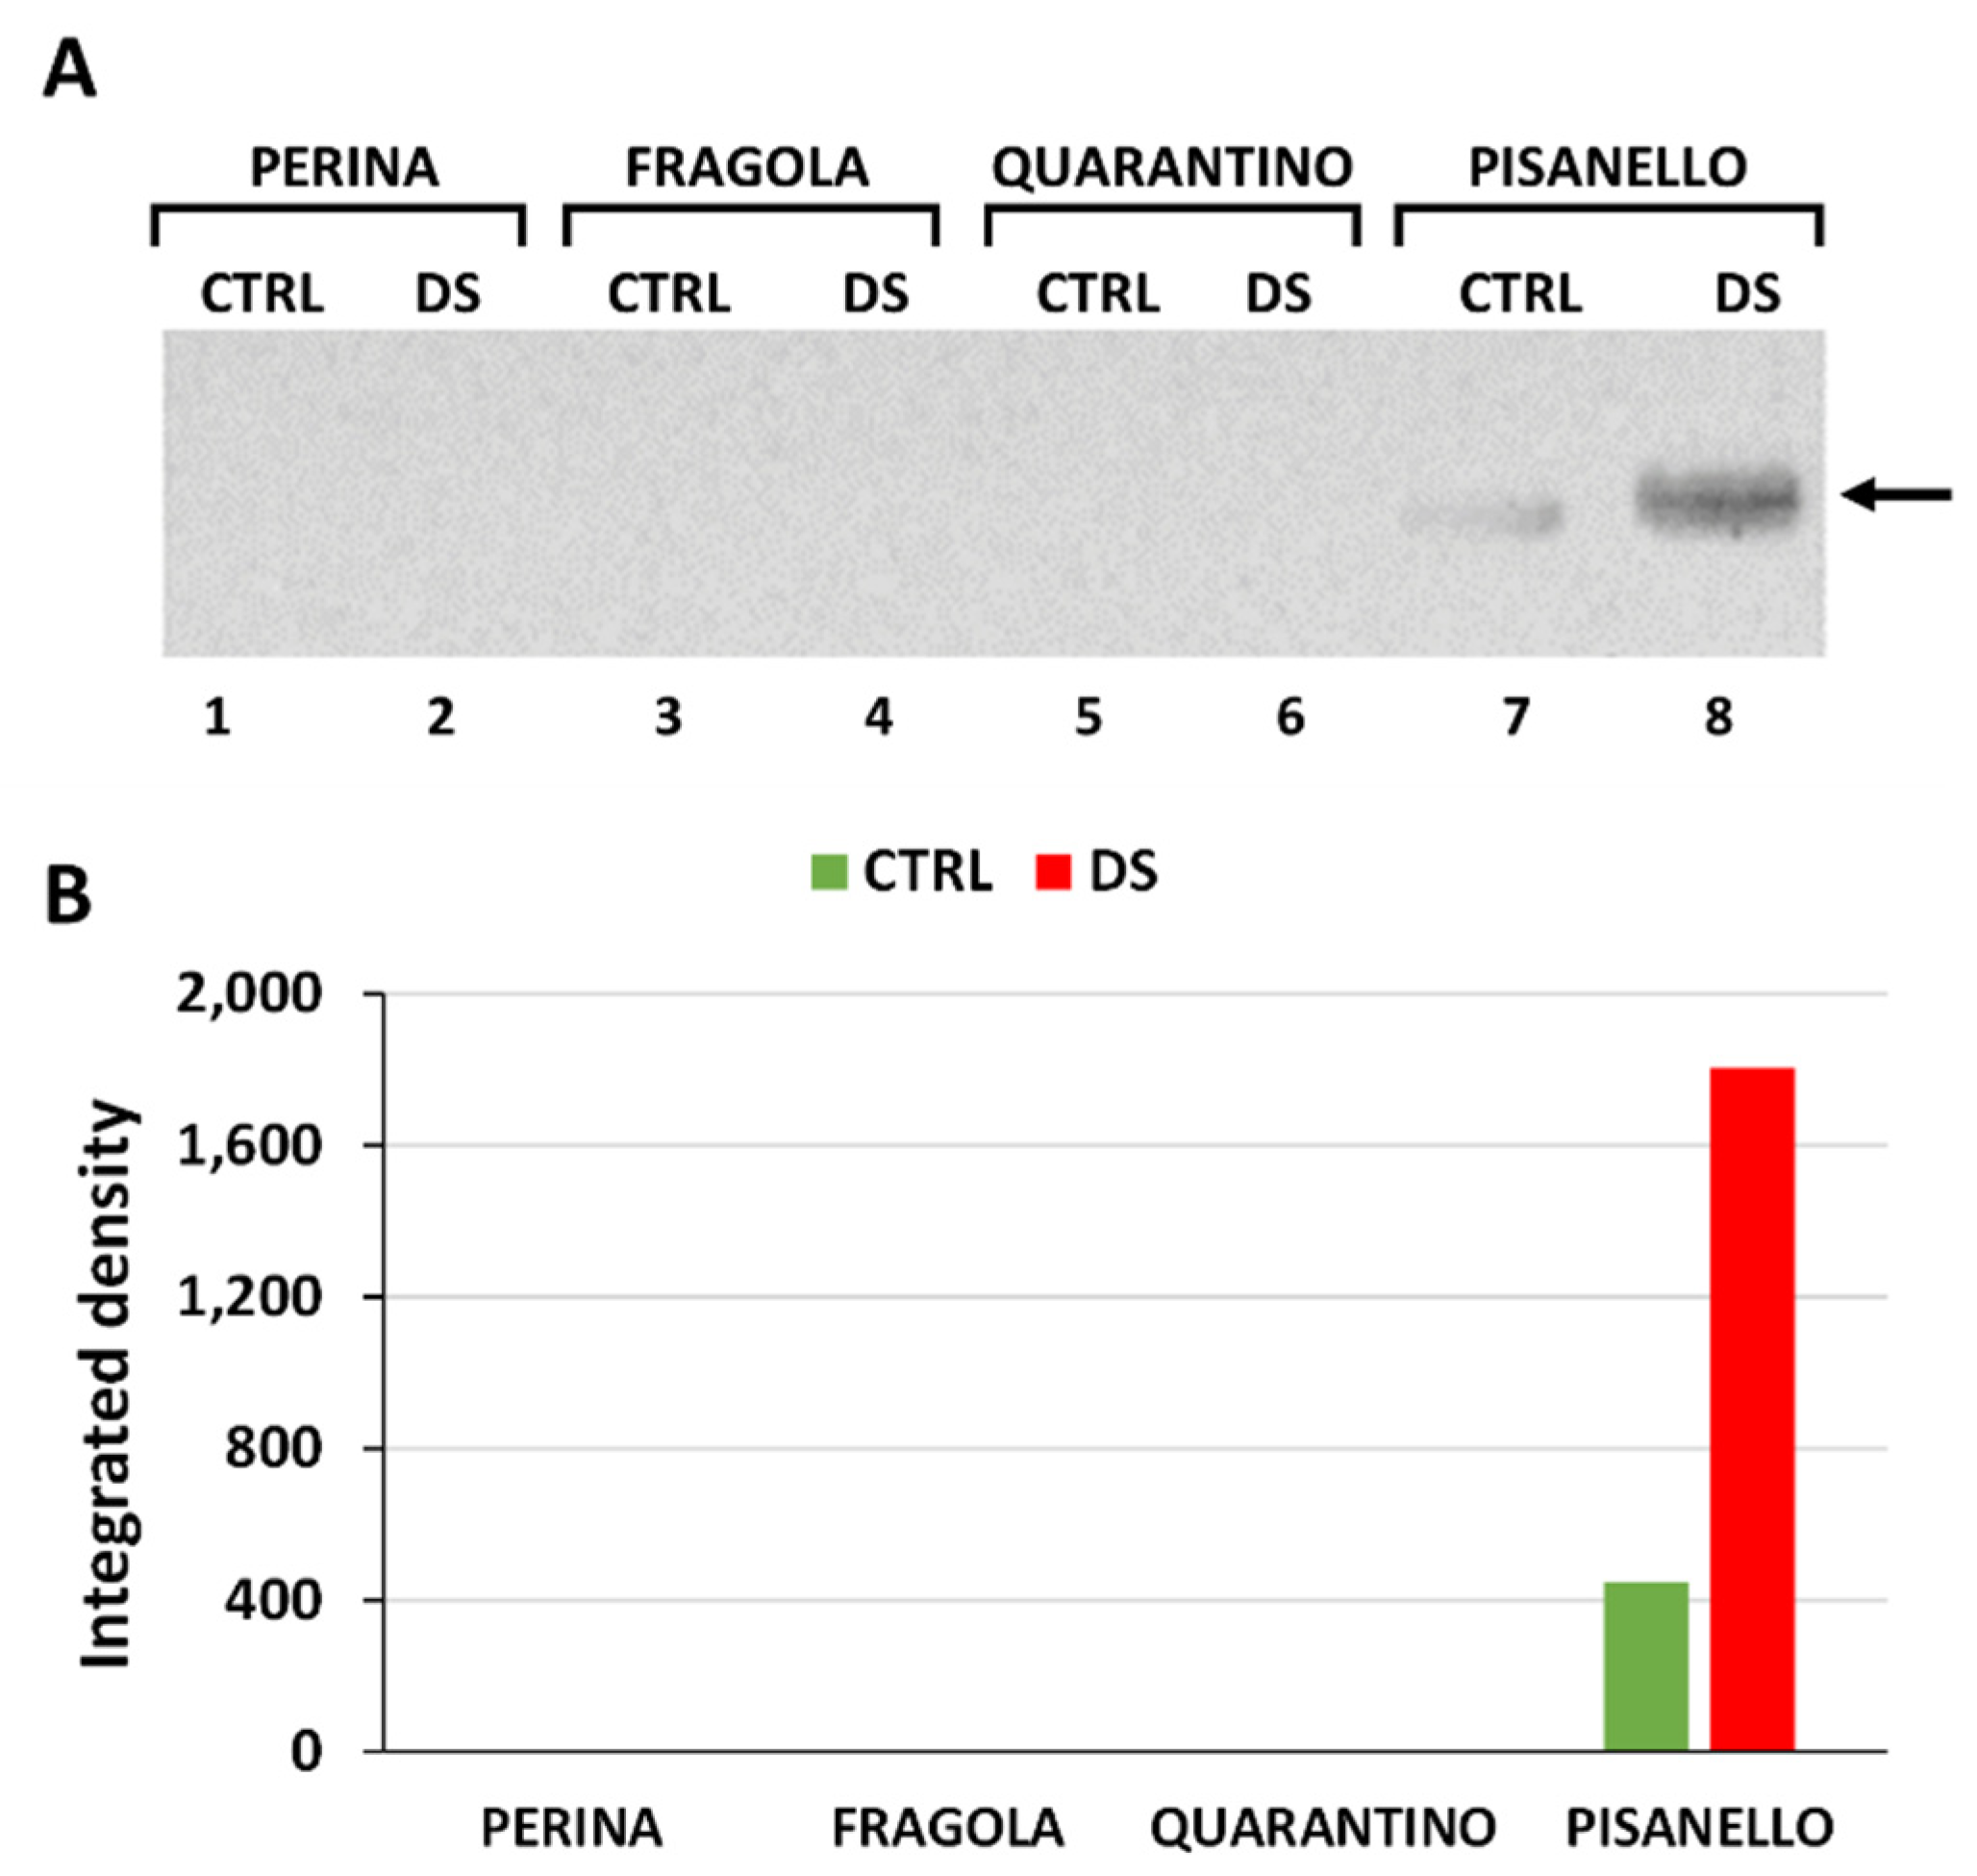
2.4. Osmotin Levels Increased Only in the Pisanello Cultivar under Drought Stress
2.5. Aquaporins
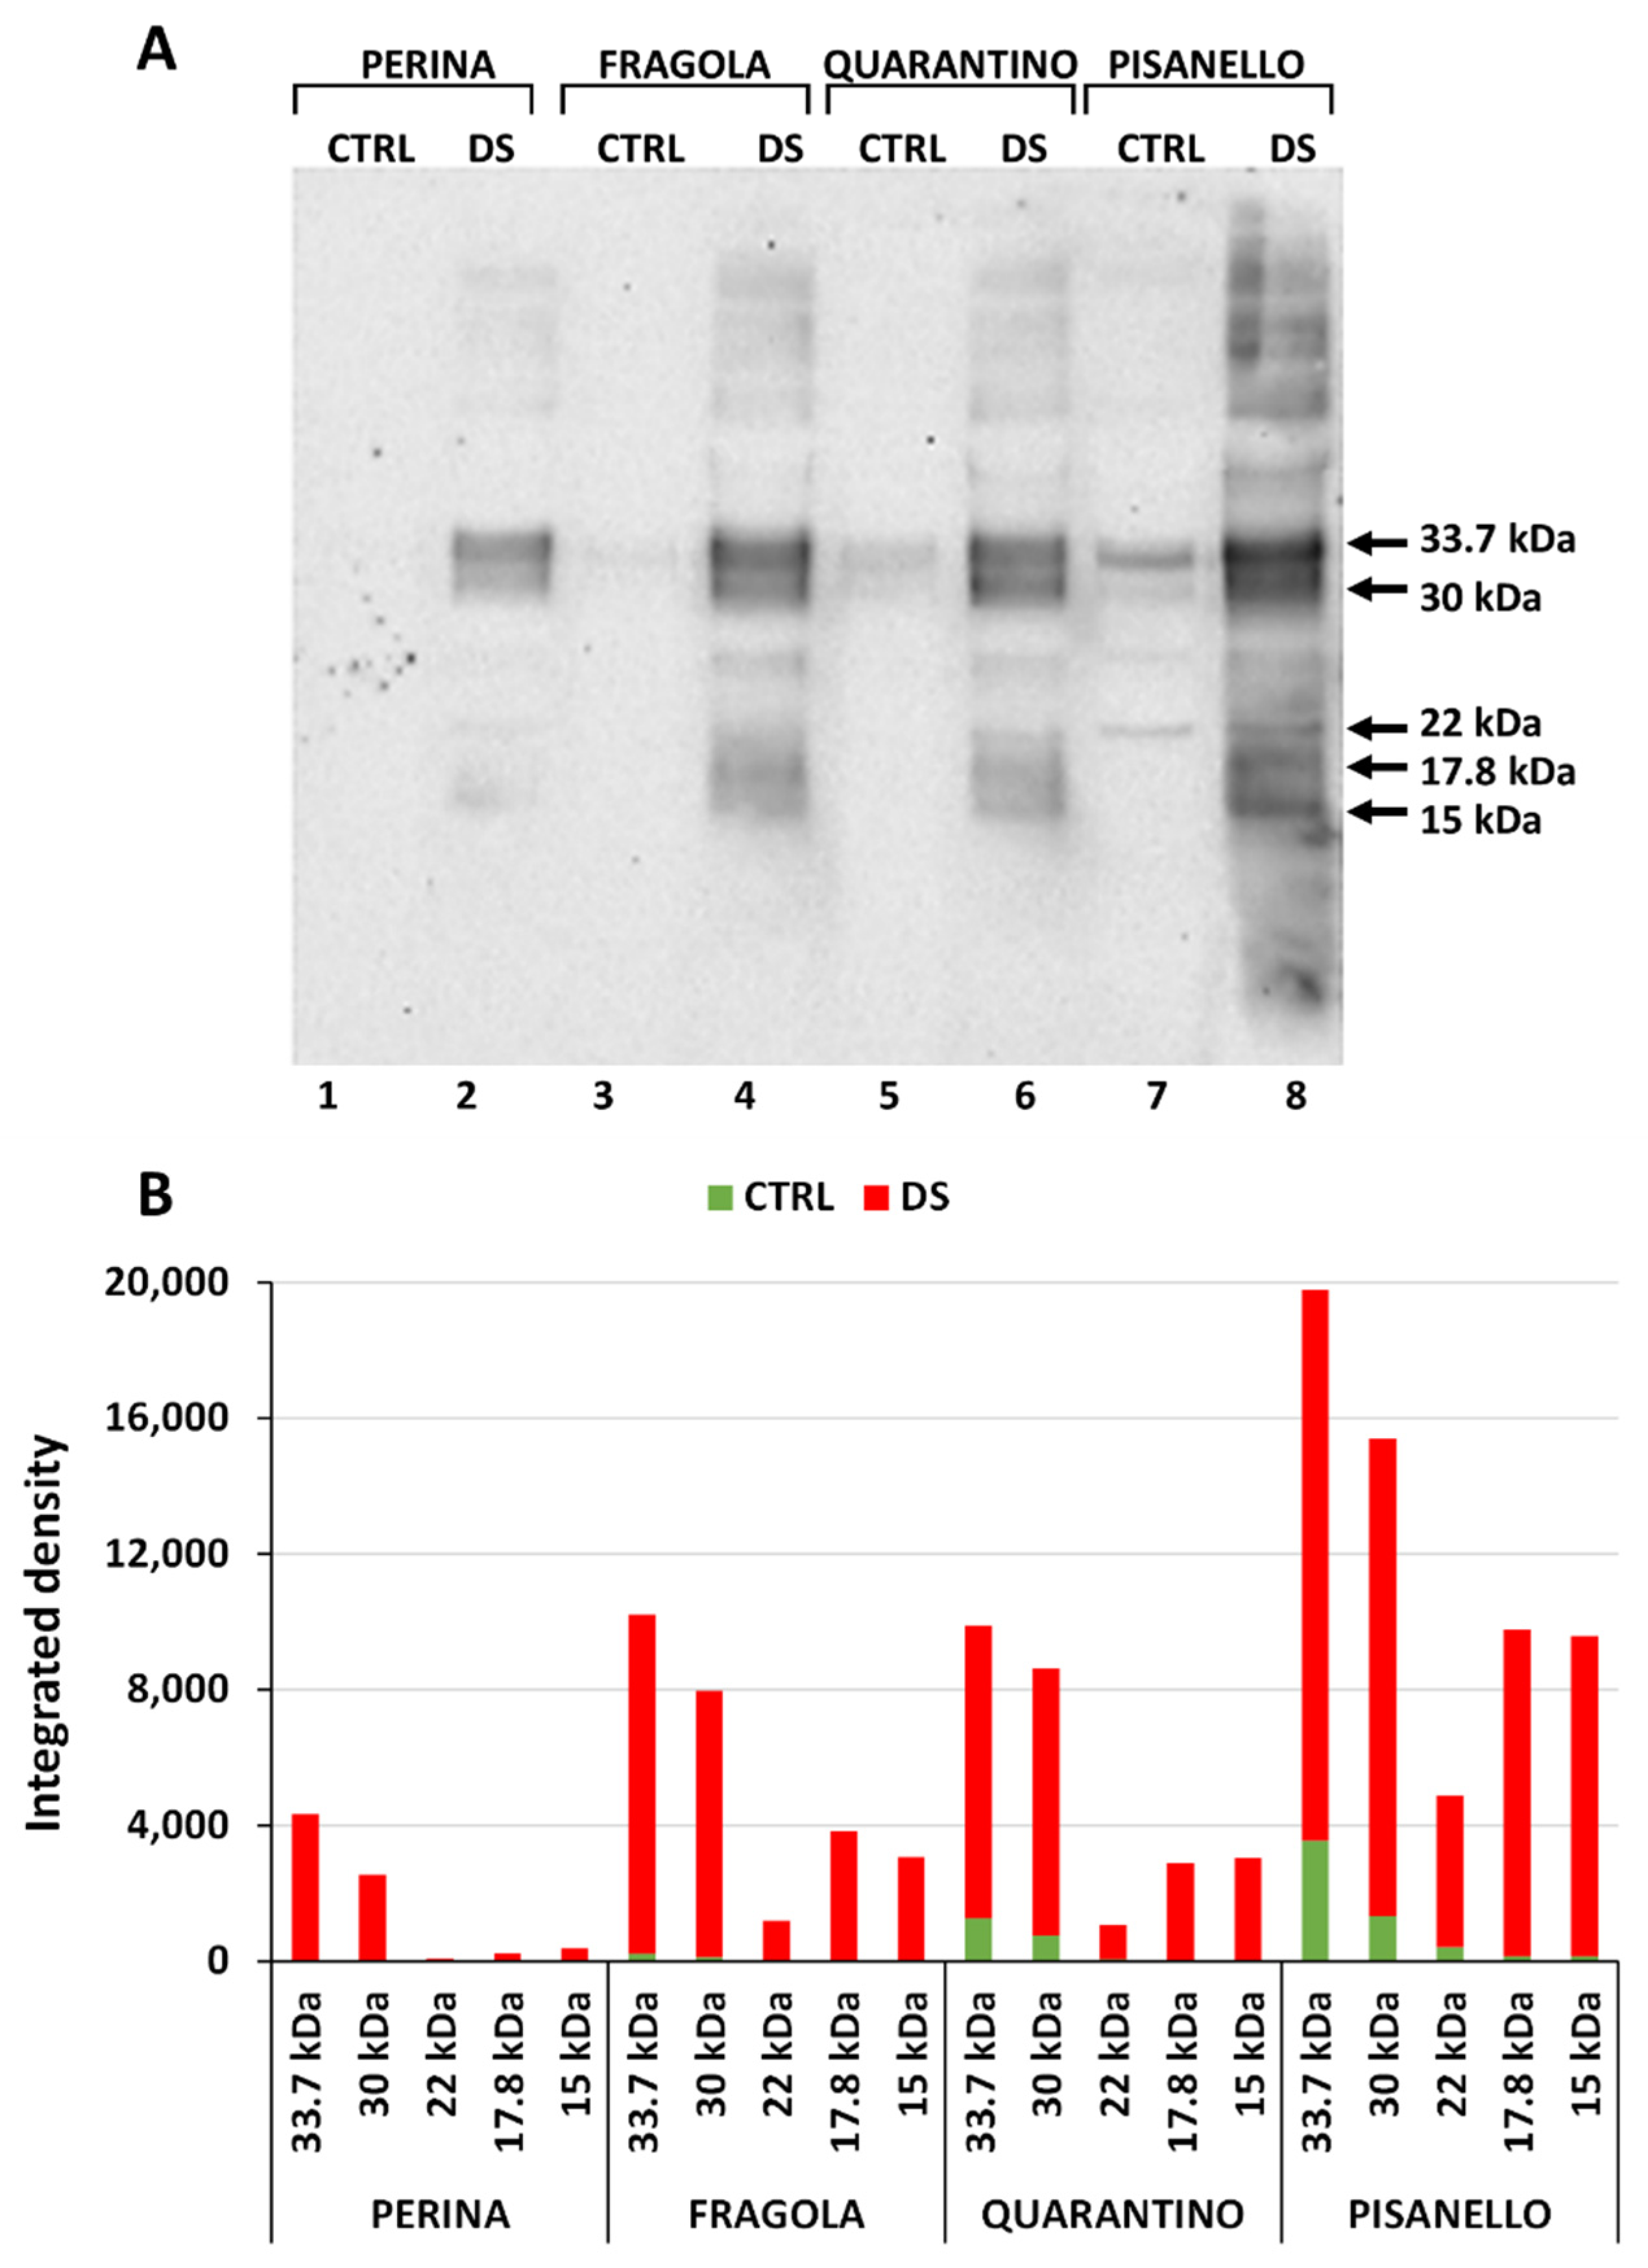
2.6. RuBisCO Levels Decrease Significantly in the Pisanello Cultivar While the Four Cultivars Make Differential Use of RuBisCO Isoforms
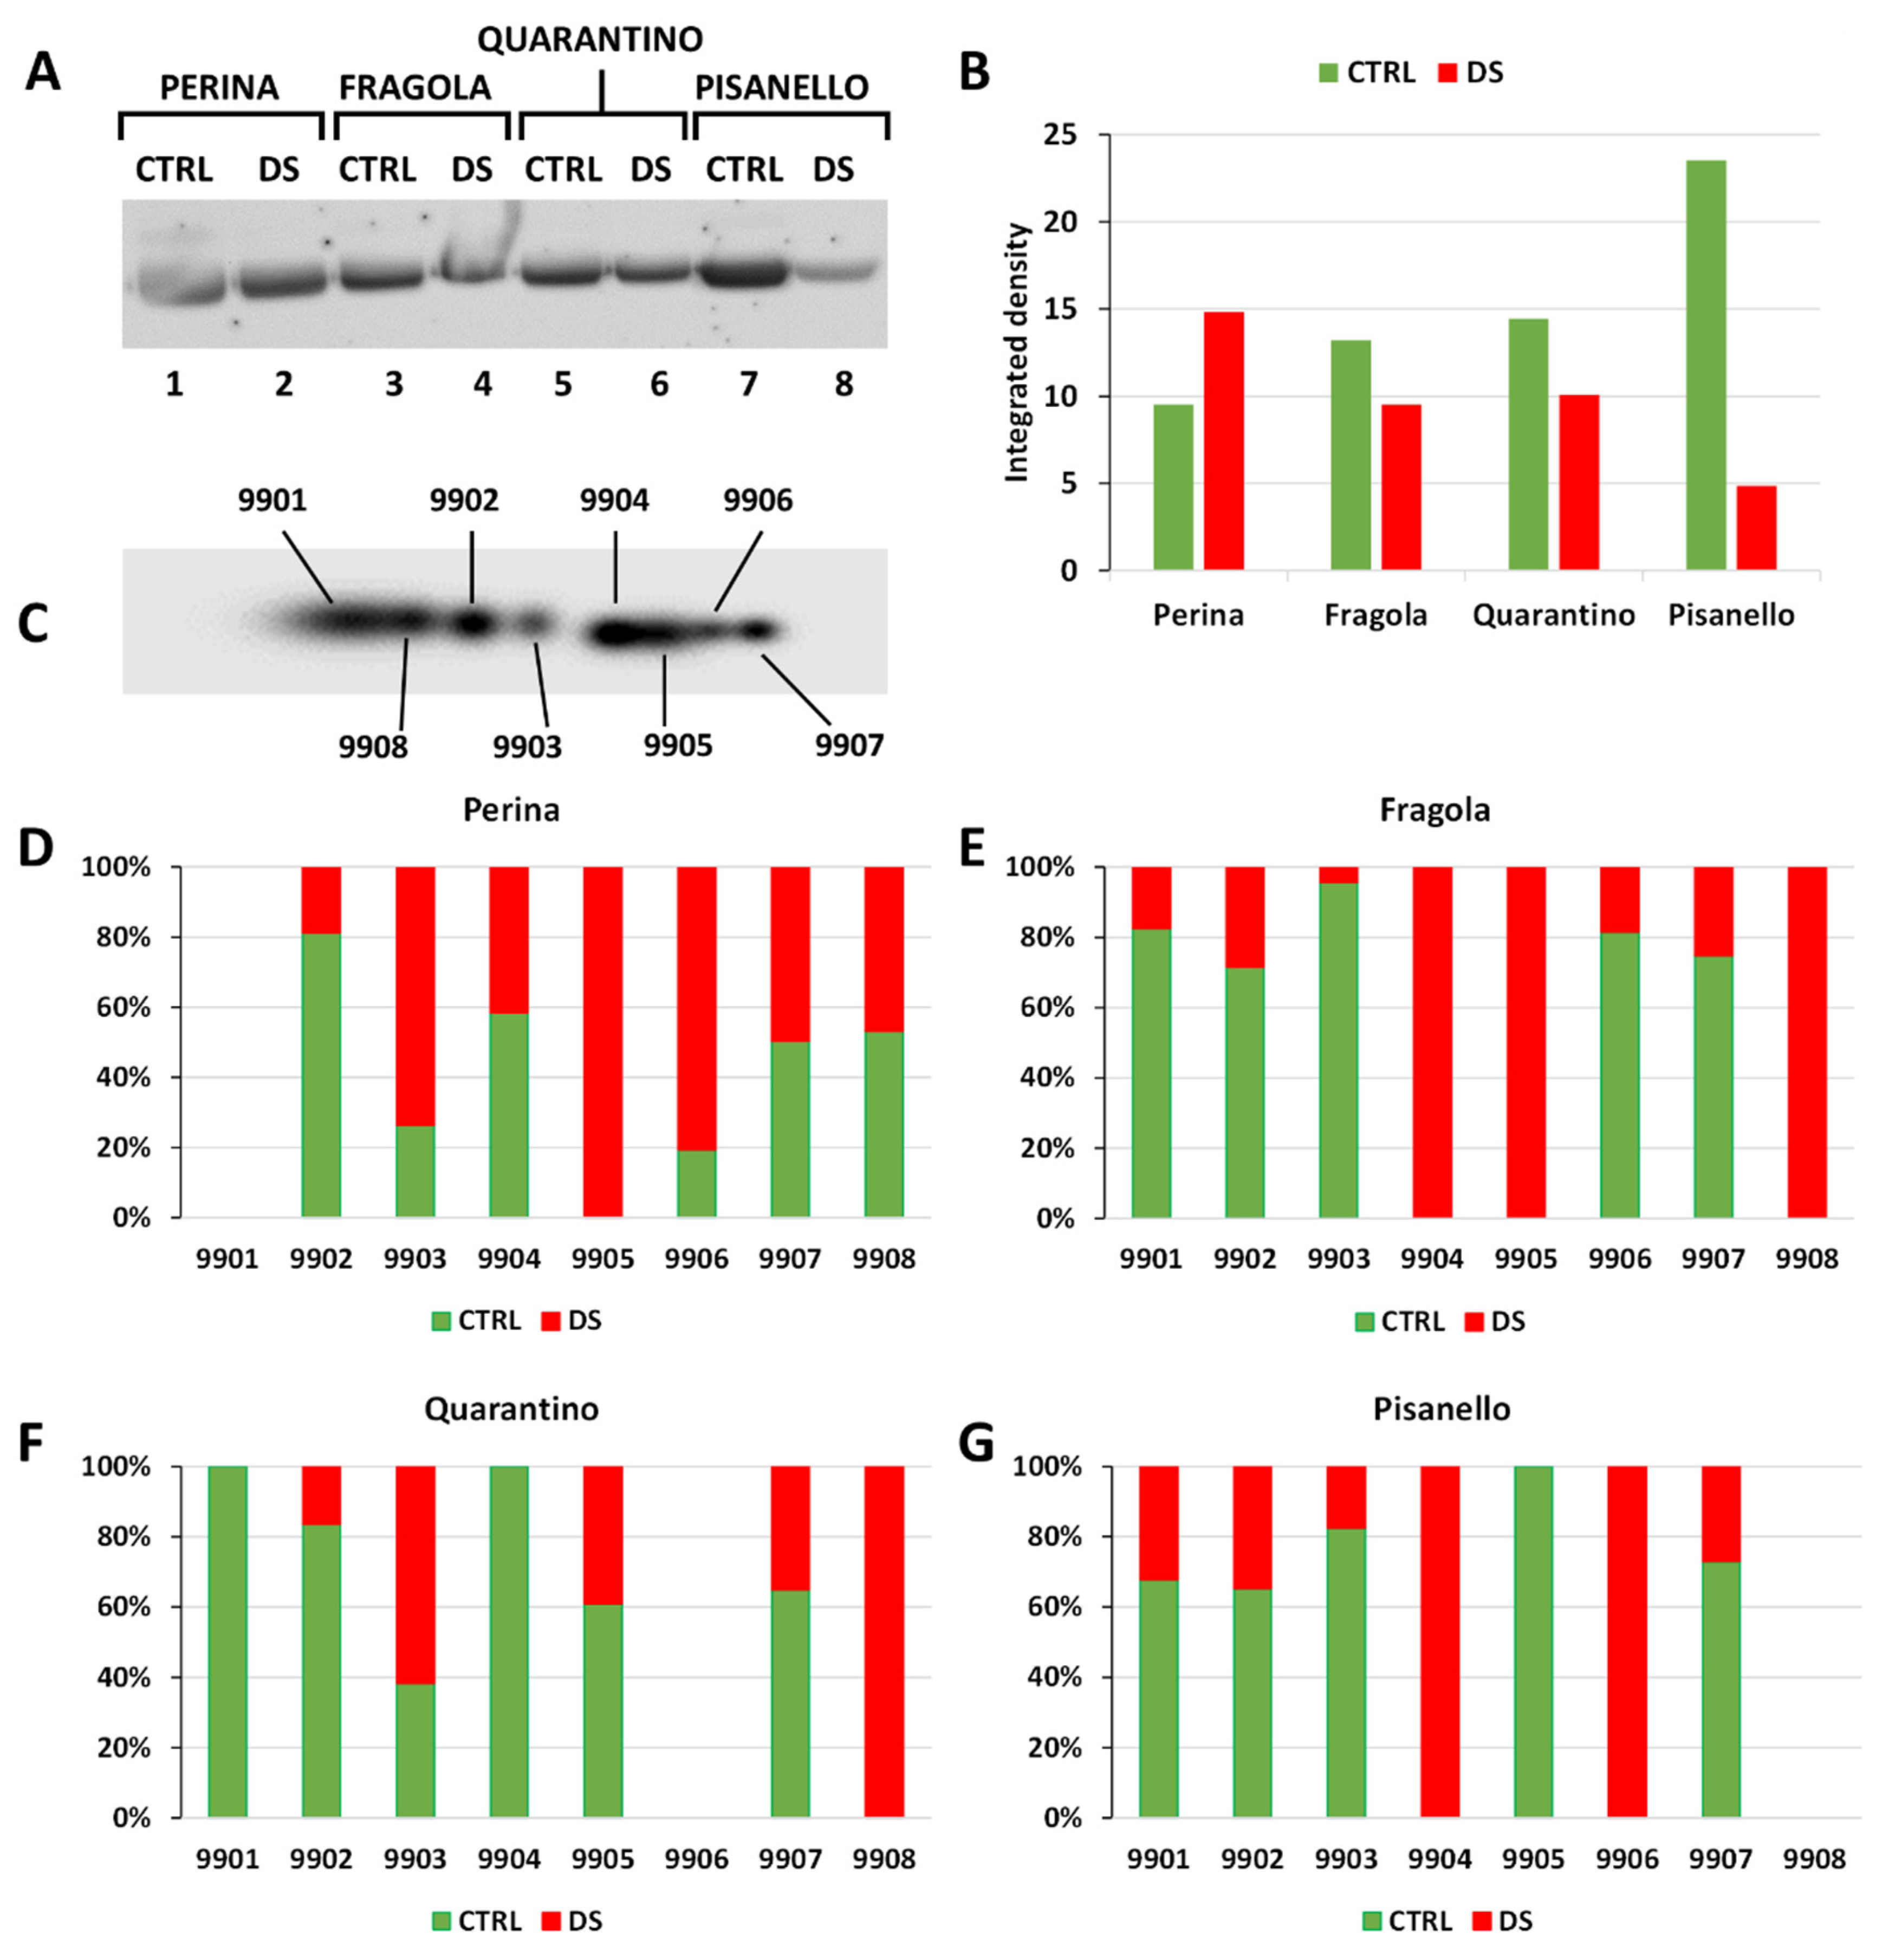
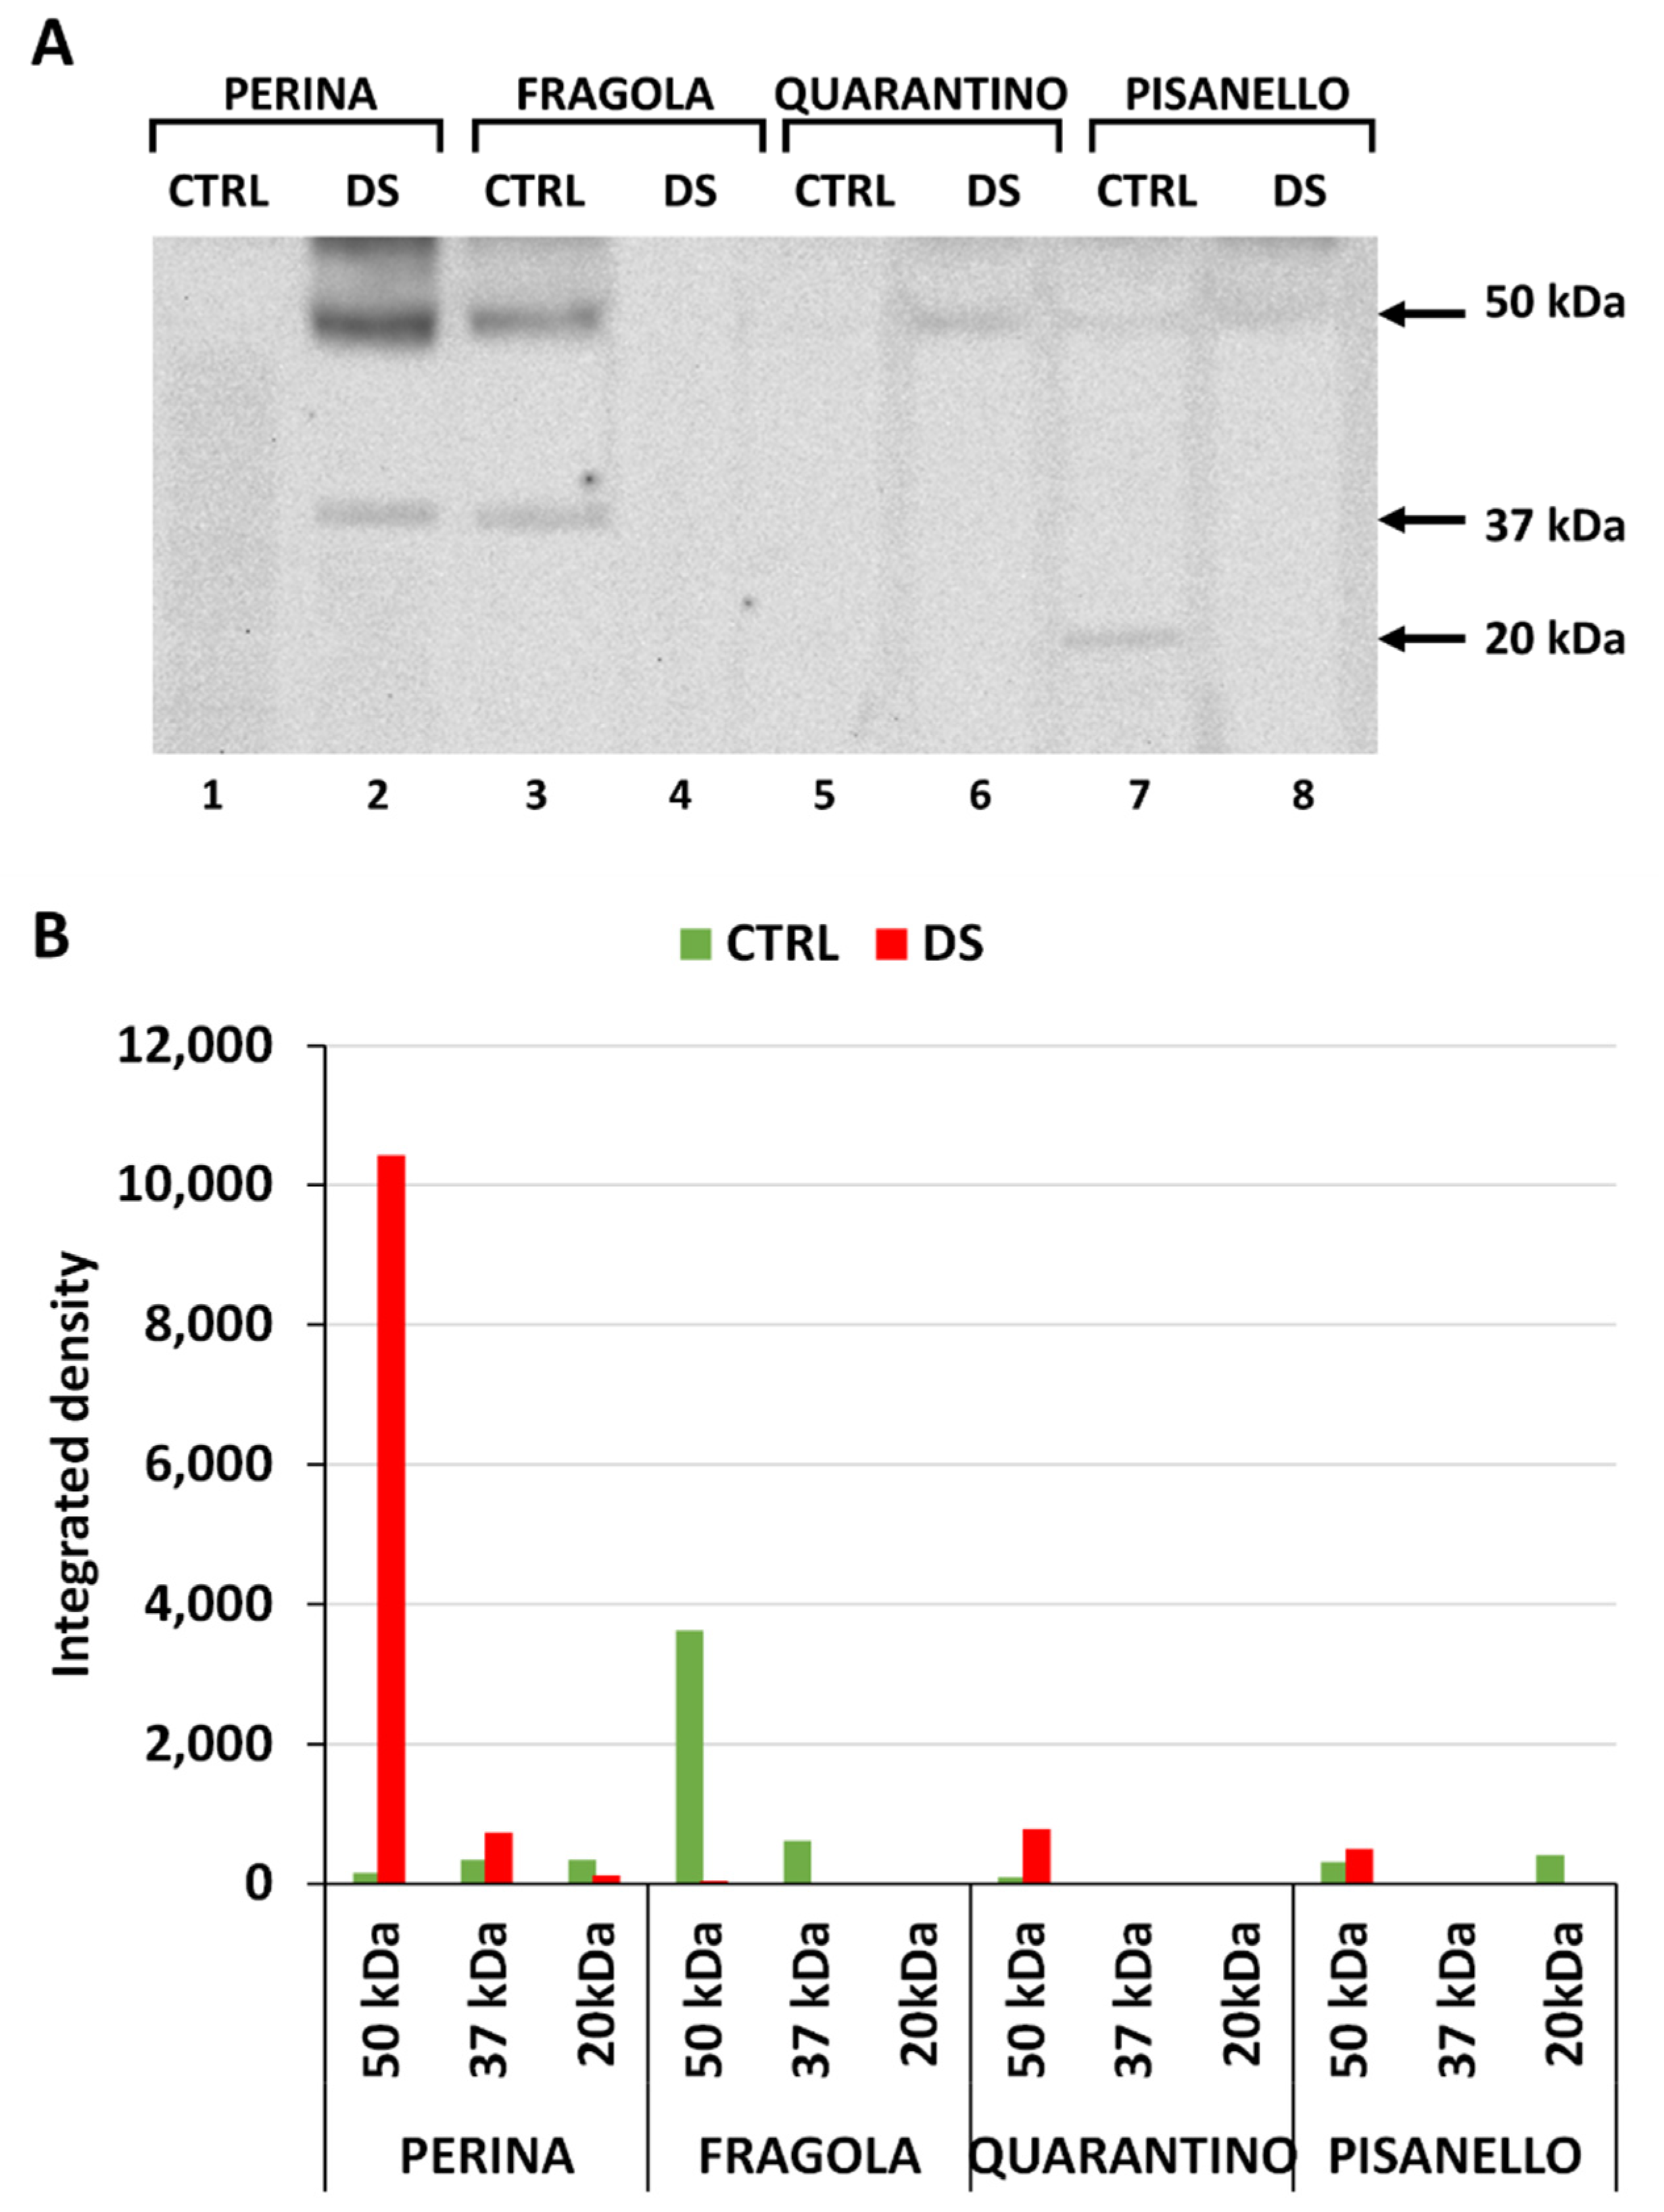
2.7. Pisanello Cultivar Exhibits the Most Consistent Increase in Sucrose Synthase
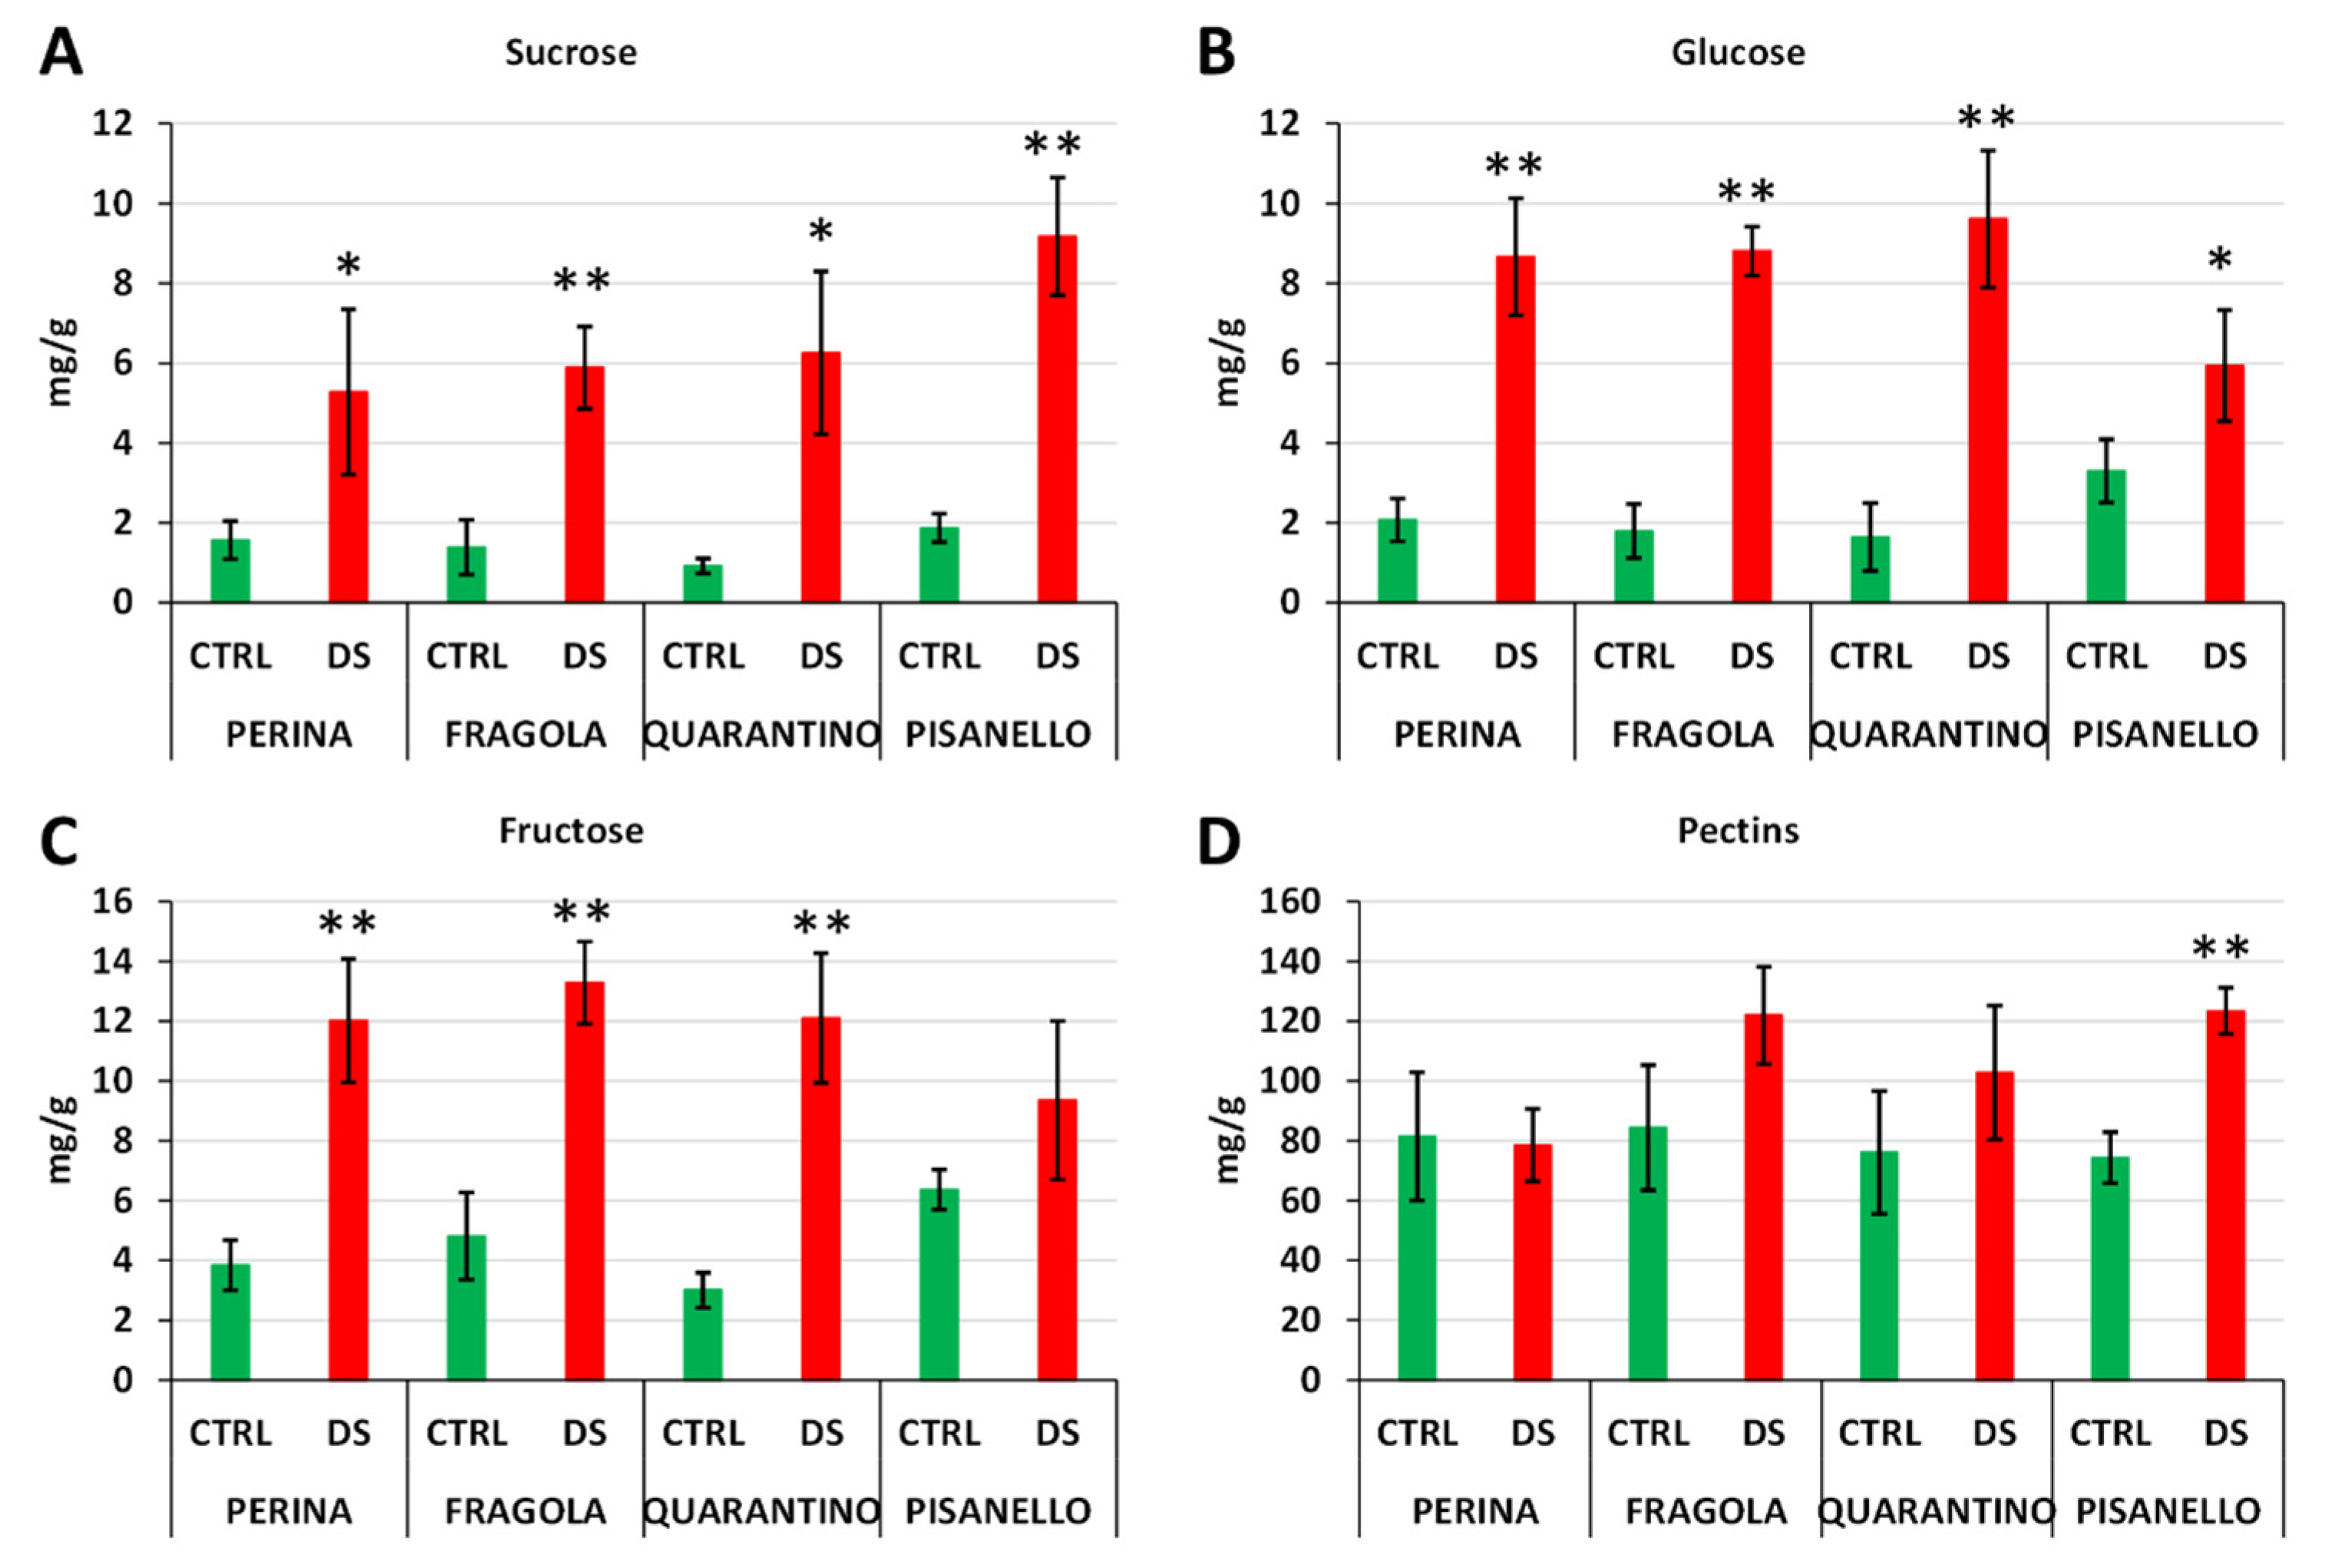
2.8. Sucrose, Glucose, and Fructose Increase Differentially in Drought-Stressed Cultivars
3. Materials and Methods
3.1. Growth Conditions of Tomato Plants and Stress Treatment
- Perina and Fragola, the most tolerant cultivars,
- Quarantino, the cultivar with medium tolerance,
- Pisanello, the most susceptible.
3.2. Protein Extraction
3.3. 1-D Electrophoresis and Immunoblotting
- The Anti-HSP70 (ADI-SPA-820-D) was a mouse monoclonal type antibody and was diluted 1:5000 (Enzo Life Sciences). This antibody was purified from human HeLa cells. It recognizes protein homologues in plants and its efficiency has been confirmed in Citrus L. and pepper plants [106] as well as in leaves of olive trees [84].
- The Anti-Dehydrin (AS07 206A) was a rabbit polyclonal antibody and was diluted 1:1000 (Agrisera). This antibody binds to the dehydrin family, which are proteins involved in protective reactions against dehydration. Specifically, the antibody binds to the k-segment peptide sequence (TGEKKGIMDKIKEKLPGQH) conserved in a wide range of different plant species. The reactivity of this antibody has also been confirmed in Solanum licopersicom L., as well as in other species such as Pistacia vera L. and Cucumis sativus L. [109,110,111].
- The Anti-Osmotin (AS19 4336) was a rabbit polyclonal antibody and was diluted 1:1000 (Agrisera). This antibody was derived from the Nicotiana tabacum L. protein sequence, ranging from amino acid 22 to 246. The predicted reactivity is also on Solanum lycopersicum L.
- The Anti-Aquaporins (AS09 489) was a rabbit polyclonal antibody and was diluted 1:1000 (Agrisera). The immunogen for aquaporin antibody is a KLH-conjugated synthetic peptide derived from N terminus of Raphanus sativus L. The peptide is conserved in PIP1;1, PIP1;2, PIP1;3 N-terminus of Raphanus sativus L. and in all 5 isoforms (PIP1;1, PIP1;2, PIP1;3, PIP1;4, PIP1;5) of Arabidopsis thaliana L. The reactivity in Solanum lycopersicum L. is not confirmed but predicted.
- The Anti-RuBisCO was a rabbit polyclonal antibody and was diluted 1:10,000 (Agrisera). The immunogen for the RuBisCO antibody was a synthetic KLH-conjugated peptide preserved in all known plant, algal and cyanobacterial protein sequences. Reactivity was confirmed and predicted on several plant species but not on Solanum lycopersicum L. However, the reactivity against tomato was evaluated in a previous work on the Micro-Tom cultivar [85].
3.4. 2-D Electrophoresis and Immunoblotting of RuBisCO
3.5. Analysis of Soluble Sugars
3.6. Phosphoprotein Profiling
4. Conclusions
Supplementary Materials
Author Contributions
Funding
Institutional Review Board Statement
Informed Consent Statement
Data Availability Statement
Acknowledgments
Conflicts of Interest
References
- Lionello, P.; Scarascia, L. The relation between climate change in the Mediterranean region and global warming. Reg. Environ. Chang. 2018, 18, 1481–1493. [Google Scholar] [CrossRef]
- Food and Agriculture Organization (FAO). Rome Statement on Water Scarcity in Agriculture. Available online: http://www.fao.org/3/cb2397en/cb2397en.pdf (accessed on 8 June 2021).
- Zhu, J.K. Abiotic Stress Signaling and Responses in Plants. Cell 2016, 167, 313–324. [Google Scholar] [CrossRef] [PubMed] [Green Version]
- Pirasteh-Anosheh, H.; Saed-Moucheshi, A.; Pakniyat, H.; Pessarakli, M. Stomatal responses to drought stress. In Water Stress and Crop Plants: A Sustainable Approach; Wiley: Hoboken, NJ, USA, 2016; Volume 1–2, pp. 24–40. ISBN 9781119054450. [Google Scholar]
- Liu, F.; Jensen, C.R.; Shahanzari, A.; Andersen, M.N.; Jacobsen, S.E. ABA regulated stomatal control and photosynthetic water use efficiency of potato (Solanum tuberosum L.) during progressive soil drying. Plant Sci. 2005, 168, 831–836. [Google Scholar] [CrossRef]
- Singh, M.; Kumar, J.; Singh, S.; Singh, V.P.; Prasad, S.M. Roles of osmoprotectants in improving salinity and drought tolerance in plants: A review. Rev. Environ. Sci. Biotechnol. 2015, 14, 407–426. [Google Scholar] [CrossRef]
- Singh, R.; Singh, S.; Parihar, P.; Mishra, R.K.; Tripathi, D.K.; Singh, V.P.; Chauhan, D.K.; Prasad, S.M. Reactive oxygen species (ROS): Beneficial companions of plants’ developmental processes. Front. Plant Sci. 2016, 7, 1299. [Google Scholar] [CrossRef] [Green Version]
- Ali, F.; Bano, A.; Fazal, A. Recent methods of drought stress tolerance in plants. Plant Growth Regul. 2017, 82, 363–375. [Google Scholar] [CrossRef]
- Cho, E.K.; Hong, C.B. Over-expression of tobacco NtHSP70-1 contributes to drought-stress tolerance in plants. Plant Cell Rep. 2006, 25, 349–358. [Google Scholar] [CrossRef]
- Cho, E.K.; Choi, Y.J. A nuclear-localized HSP70 confers thermoprotective activity and drought-stress tolerance on plants. Biotechnol. Lett. 2009, 31, 597–606. [Google Scholar] [CrossRef]
- Alamillo, J.; Almoguera, C.; Bartels, D.; Jordano, J. Constitutive expression of small heat shock proteins in vegetative tissues of the resurrection plant Craterostigma plantagineum. Plant Mol. Biol. 1995, 29, 1093–1099. [Google Scholar] [CrossRef] [Green Version]
- Campalans, A.; Messeguer, R.; Goday, A.; Pagès, M. Plant responses to drought, from ABA signal transduction events to the action of the induced proteins. Plant Physiol. Biochem. 1999, 37, 327–340. [Google Scholar] [CrossRef]
- Swindell, W.R.; Huebner, M.; Weber, A.P. Transcriptional profiling of Arabidopsis heat shock proteins and transcription factors reveals extensive overlap between heat and non-heat stress response pathways. BMC Genom. 2007, 8, 1–15. [Google Scholar] [CrossRef] [PubMed] [Green Version]
- Augustine, S.M.; Narayan, J.A.; Syamaladevi, D.P.; Appunu, C.; Chakravarthi, M.; Ravichandran, V.; Subramonian, N. Erianthus arundinaceus HSP70 (EaHSP70) overexpression increases drought and salinity tolerance in sugarcane (Saccharum spp. hybrid). Plant Sci. 2015, 232, 23–34. [Google Scholar] [CrossRef] [PubMed]
- Trivedi, D.K.; Yadav, S.; Vaid, N.; Tuteja, N. Genome wide analysis of Cyclophilin gene family from rice and Arabidopsis and its comparison with yeast. Plant Signal. Behav. 2012, 7, 1653–1666. [Google Scholar] [CrossRef] [PubMed] [Green Version]
- Galat, A. Peptidylprolyl cis/trans isomerases (immunophilins): Biological diversity--targets--functions. Curr. Top. Med. Chem. 2003, 3, 1315–1347. [Google Scholar] [CrossRef]
- Thai, V.; Renesto, P.; Fowler, C.A.; Brown, D.J.; Davis, T.; Gu, W.; Pollock, D.D.; Kern, D.; Raoult, D.; Eisenmesser, E.Z. Structural, biochemical, and in vivo characterization of the first virally encoded cyclophilin from the Mimivirus. J. Mol. Biol. 2008, 378, 71–86. [Google Scholar] [CrossRef]
- Berardini, T.Z.; Bollman, K.; Sun, H.; Scott Poethig, R. Regulation of vegetative phase change in Arabidopsis thaliana by cyclophilin 40. Science 2001, 291, 2405–2407. [Google Scholar] [CrossRef]
- Marivet, J.; Margis-Pinheiro, M.; Frendo, P.; Burkard, G. Bean cyclophilin gene expression during plant development and stress conditions. Plant Mol. Biol. 1994, 26, 1181–1189. [Google Scholar] [CrossRef]
- Barik, S. Dual-Family Peptidylprolyl Isomerases (Immunophilins) of Select Monocellular Organisms. Biomolecules 2018, 8, 148. [Google Scholar] [CrossRef] [Green Version]
- Hong-Bo, S.; Zong-Suo, L.; Ming-An, S. LEA proteins in higher plants: Structure, function, gene expression and regulation. Colloids Surf. B. Biointerfaces 2005, 45, 131–135. [Google Scholar] [CrossRef]
- Close, T.J. Dehydrins: Emergence of a biochemical role of a family of plant dehydration proteins. Physiol. Plant. 1996, 97, 795–803. [Google Scholar] [CrossRef]
- Riley, A.C.; Ashlock, D.A.; Graether, S.P. Evolution of the modular, disordered stress proteins known as dehydrins. PLoS ONE 2019, 14, e0211813. [Google Scholar] [CrossRef] [PubMed] [Green Version]
- Liu, Y.; Song, Q.; Li, D.; Yang, X.; Li, D. Multifunctional Roles of Plant Dehydrins in Response to Environmental Stresses. Front. Plant Sci. 2017, 8, 1018. [Google Scholar] [CrossRef] [PubMed] [Green Version]
- Katagiri, T.; Ishiyama, K.; Kato, T.; Tabata, S.; Kobayashi, M.; Shinozaki, K. An important role of phosphatidic acid in ABA signaling during germination in Arabidopsis thaliana. Plant J. 2005, 43, 107–117. [Google Scholar] [CrossRef] [PubMed]
- Hara, M.; Shinoda, Y.; Tanaka, Y.; Kuboi, T. DNA binding of citrus dehydrin promoted by zinc ion. Plant. Cell Environ. 2009, 32, 532–541. [Google Scholar] [CrossRef]
- Veronese, P.; Ruiz, M.T.; Coca, M.A.; Hernandez-Lopez, A.; Lee, H.; Ibeas, J.I.; Damsz, B.; Pardo, J.M.; Hasegawa, P.M.; Bressan, R.A.; et al. In defense against pathogens. Both plant sentinels and foot soldiers need to know the enemy. Plant Physiol. 2003, 131, 1580–1590. [Google Scholar] [CrossRef] [Green Version]
- Goel, D.; Singh, A.K.; Yadav, V.; Babbar, S.B.; Bansal, K.C. Overexpression of osmotin gene confers tolerance to salt and drought stresses in transgenic tomato (Solanum lycopersicum L.). Protoplasma 2010, 245, 133–141. [Google Scholar] [CrossRef]
- Sokhansanj, A.; Sadat Noori, S.A.; Niknam, V. Comparison of bacterial and plant genes participating in proline biosynthesis with Osmotin gene, with respect to enhancing salinity tolerance of transgenic tobacco plants. Russ. J. Plant Physiol. 2006, 53, 110–115. [Google Scholar] [CrossRef]
- Lutts, S.; Kinet, J.M.; Bouharmont, J. Effects of salt stress on growth, mineral nutrition and proline accumulation in relation to osmotic adjustment in rice (Oryza sativa L.) cultivars differing in salinity resistance. Plant Growth Regul. 1996, 19, 207–218. [Google Scholar] [CrossRef]
- Hong, Z.; Lakkineni, K.; Zhang, Z.; Verma, D.P. Removal of feedback inhibition of delta(1)-pyrroline-5-carboxylate synthetase results in increased proline accumulation and protection of plants from osmotic stress. Plant Physiol. 2000, 122, 1129–1136. [Google Scholar] [CrossRef] [Green Version]
- Vinocur, B.; Altman, A. Recent advances in engineering plant tolerance to abiotic stress: Achievements and limitations. Curr. Opin. Biotechnol. 2005, 16, 123–132. [Google Scholar] [CrossRef]
- Barthakur, S.; Babu, V.; Bansa, K. Over-expression of osmotin induces proline accumulation and confers tolerance to osmotic stress in transgenic tobacco. J. Plant Biochem. Biotechnol. 2001, 10, 31–37. [Google Scholar] [CrossRef]
- Patel, J.; Mishra, A. Plant aquaporins alleviate drought tolerance in plants by modulating cellular biochemistry, root-architecture, and photosynthesis. Physiol. Plant. 2021, 172, 1030–1044. [Google Scholar] [CrossRef] [PubMed]
- Uehlein, N.; Lovisolo, C.; Siefritz, F.; Kaldenhoff, R. The tobacco aquaporin NtAQP1 is a membrane CO2 pore with physiological functions. Nature 2003, 425, 734–737. [Google Scholar] [CrossRef] [PubMed]
- Hanba, Y.T.; Shibasaka, M.; Hayashi, Y.; Hayakawa, T.; Kasamo, K.; Terashima, I.; Katsuhara, M. Overexpression of the Barley Aquaporin HvPIP2;1 Increases Internal CO2 Conductance and CO2 Assimilation in the Leaves of Transgenic Rice Plants. Plant Cell Physiol. 2004, 45, 521–529. [Google Scholar] [CrossRef] [PubMed] [Green Version]
- Flexas, J.; Ribas-Carbó, M.; Hanson, D.T.; Bota, J.; Otto, B.; Cifre, J.; McDowell, N.; Medrano, H.; Kaldenhoff, R. Tobacco aquaporin NtAQP1 is involved in mesophyll conductance to CO2 in vivo. Plant J. 2006, 48, 427–439. [Google Scholar] [CrossRef]
- Singh, R.K.; Deshmukh, R.; Muthamilarasan, M.; Rani, R.; Prasad, M. Versatile roles of aquaporin in physiological processes and stress tolerance in plants. Plant Physiol. Biochem. PPB 2020, 149, 178–189. [Google Scholar] [CrossRef]
- Sreedharan, S.; Shekhawat, U.K.S.; Ganapathi, T.R. Transgenic banana plants overexpressing a native plasma membrane aquaporin MusaPIP1;2 display high tolerance levels to different abiotic stresses. Plant Biotechnol. J. 2013, 11, 942–952. [Google Scholar] [CrossRef]
- Li, R.; Wang, J.; Li, S.; Zhang, L.; Qi, C.; Weeda, S.; Zhao, B.; Ren, S.; Guo, Y.-D. Plasma Membrane Intrinsic Proteins SlPIP2;1, SlPIP2;7 and SlPIP2;5 Conferring Enhanced Drought Stress Tolerance in Tomato. Sci. Rep. 2016, 6, 31814. [Google Scholar] [CrossRef] [Green Version]
- Wang, L.; Li, Q.-T.; Lei, Q.; Feng, C.; Zheng, X.; Zhou, F.; Li, L.; Liu, X.; Wang, Z.; Kong, J. Ectopically expressing MdPIP1;3, an aquaporin gene, increased fruit size and enhanced drought tolerance of transgenic tomatoes. BMC Plant Biol. 2017, 17, 246. [Google Scholar] [CrossRef] [Green Version]
- Parry, M.A.J.; Andralojc, P.J.; Khan, S.; Lea, P.J.; Keys, A.J. Rubisco Activity: Effects of Drought Stress. Ann. Bot. 2002, 89, 833–839. [Google Scholar] [CrossRef] [Green Version]
- Feller, U.; Anders, I.; Mae, T. Rubiscolytics: Fate of Rubisco after its enzymatic function in a cell is terminated. J. Exp. Bot. 2008, 59, 1615–1624. [Google Scholar] [CrossRef] [PubMed] [Green Version]
- Demirevska, K.; Zasheva, D.; Dimitrov, R.; Simova-Stoilova, L.; Stamenova, M.; Feller, U. Drought stress effects on Rubisco in wheat: Changes in the Rubisco large subunit. Acta Physiol. Plant. 2009, 31, 1129–1138. [Google Scholar] [CrossRef]
- Stein, O.; Granot, D. An Overview of Sucrose Synthases in Plants. Front. Plant Sci. 2019, 10, 95. [Google Scholar] [CrossRef] [PubMed] [Green Version]
- Baroja-Fernández, E.; Muñoz, F.J.; Li, J.; Bahaji, A.; Almagro, G.; Montero, M.; Etxeberria, E.; Hidalgo, M.; Sesma, M.T.; Pozueta-Romero, J. Sucrose synthase activity in the sus1/sus2/sus3/sus4 Arabidopsis mutant is sufficient to support normal cellulose and starch production. Proc. Natl. Acad. Sci. USA 2012, 109, 321–326. [Google Scholar] [CrossRef] [Green Version]
- Ruan, Y.-L. Sucrose Metabolism: Gateway to Diverse Carbon Use and Sugar Signaling. Annu. Rev. Plant Biol. 2014, 65, 33–67. [Google Scholar] [CrossRef]
- Ruan, Y.-L.; Jin, Y.; Yang, Y.-J.; Li, G.-J.; Boyer, J.S. Sugar input, metabolism, and signaling mediated by invertase: Roles in development, yield potential, and response to drought and heat. Mol. Plant 2010, 3, 942–955. [Google Scholar] [CrossRef]
- Nuruddin, M.M.; Madramootoo, C.A.; Dodds, G.T. Effects of Water Stress at Different Growth Stages on Greenhouse Tomato Yield and Quality. Hort. Sci. 2003, 38, 1389–1393. [Google Scholar] [CrossRef] [Green Version]
- Akbudak, M.A.; Yildiz, S.; Filiz, E. Pathogenesis related protein-1 (PR-1) genes in tomato (Solanum lycopersicum L.): Bioinformatics analyses and expression profiles in response to drought stress. Genomics 2020, 112, 4089–4099. [Google Scholar] [CrossRef]
- Solankey, S.S.; Singh, R.K.; Baranwal, D.K.; Singh, D.K. Genetic Expression of Tomato for Heat and Drought Stress Tolerance: An Overview. Int. J. Veg. Sci. 2015, 21, 496–515. [Google Scholar] [CrossRef]
- Muñoz-Mayor, A.; Pineda, B.; Garcia-Abellán, J.O.; Antón, T.; Garcia-Sogo, B.; Sanchez-Bel, P.; Flores, F.B.; Atarés, A.; Angosto, T.; Pintor-Toro, J.A.; et al. Overexpression of dehydrin tas14 gene improves the osmotic stress imposed by drought and salinity in tomato. J. Plant Physiol. 2012, 169, 459–468. [Google Scholar] [CrossRef]
- Conti, V.; Mareri, L.; Faleri, C.; Nepi, M.; Romi, M.; Cai, G.; Cantini, C. Drought stress affects the response of italian local tomato (Solanum lycopersicum L.) varieties in a genotype-dependent manner. Plants 2019, 8, 336. [Google Scholar] [CrossRef] [PubMed] [Green Version]
- Conti, V.; Romi, M.; Parri, S.; Aloisi, I.; Marino, G.; Cai, G.; Cantini, C. Morpho-Physiological Classification of Italian Tomato Cultivars (Solanum lycopersicum L.) According to Drought Tolerance during Vegetative and Reproductive Growth. Plants 2021, 10, 1826. [Google Scholar] [CrossRef] [PubMed]
- Conti, V.; Romi, M.; Guarnieri, M.; Cantini, C.; Cai, G. Italian Tomato Cultivars under Drought Stress Show Different Content of Bioactives in Pulp and Peel of Fruits. Foods 2022, 11, 270. [Google Scholar] [CrossRef] [PubMed]
- Polenta, G.; Budde, C.; Sivakumar, D.; Nanni, M.; Guidi, S. Evaluation of biochemical and quality attributes to monitor the application of heat and cold treatments in tomato fruit (Lycopersicon esculentum Mill.). J. Food Qual. 2015, 38, 153–163. [Google Scholar] [CrossRef] [Green Version]
- Liu, H.; Shen, J.; Yuan, C.; Lu, D.; Acharya, B.R.; Wang, M.; Chen, D.; Zhang, W. The Cyclophilin ROC3 Regulates ABA-Induced Stomatal Closure and the Drought Stress Response of Arabidopsis thaliana. Front. Plant Sci. 2021, 12, 965. [Google Scholar] [CrossRef] [PubMed]
- Sharma, A.D.; Kaur, P. Combined effect of drought stress and heat shock on cyclophilin protein expression in Triticum aestivum. Gen. Appl. Plant Physiol. 2009, 35, 88–92. [Google Scholar]
- Sekhar, K.; Priyanka, B.; Reddy, V.D.; Rao, K.V. Isolation and characterization of a pigeonpea cyclophilin (CcCYP) gene, and its over-expression in Arabidopsis confers multiple abiotic stress tolerance. Plant. Cell Environ. 2010, 33, 1324–1338. [Google Scholar] [CrossRef]
- Sharma, A.D.; Singh, P. Effect of Water Stress on Expression of a 20 kD Cyclophilin-like Protein in Drought Susceptible and Tolerant Cultivars of Sorghum. J. Plant Biochem. Biotechnol. 2003, 12, 77–80. [Google Scholar] [CrossRef]
- Lee, S.S.; Park, H.J.; Yoon, D.H.; Kim, B.-G.; Ahn, J.C.; Luan, S.; Cho, H.S. Rice cyclophilin OsCYP18-2 is translocated to the nucleus by an interaction with SKIP and enhances drought tolerance in rice and Arabidopsis. Plant. Cell Environ. 2015, 38, 2071–2087. [Google Scholar] [CrossRef]
- Garay-Arroyo, A.; Colmenero-Flores, J.M.; Garciarrubio, A.; Covarrubias, A.A. Highly Hydrophilic Proteins in Prokaryotes and Eukaryotes Are Common during Conditions of Water Deficit. J. Biol. Chem. 2000, 275, 5668–5674. [Google Scholar] [CrossRef] [Green Version]
- Borovskii, G.B.; Stupnikova, I.V.; Antipina, A.I.; Vladimirova, S.V.; Voinikov, V.K. Accumulation of dehydrin-like proteins in the mitochondria of cereals in response to cold, freezing, drought and ABA treatment. BMC Plant Biol. 2002, 2, 5. [Google Scholar] [CrossRef] [PubMed]
- Velasco-Conde, T.; Yakovlev, I.; Majada, J.P.; Aranda, I.; Johnsen, Ø. Dehydrins in maritime pine (Pinus pinaster) and their expression related to drought stress response. Tree Genet. Genomes 2012, 8, 957–973. [Google Scholar] [CrossRef] [Green Version]
- Riyazuddin, R.; Nisha, N.; Singh, K.; Verma, R.; Gupta, R. Involvement of dehydrin proteins in mitigating the negative effects of drought stress in plants. Plant Cell Rep. 2021, 41, 519–533. [Google Scholar] [CrossRef] [PubMed]
- Samarah, N.H.; Mullen, R.E.; Cianzio, S.R.; Scott, P. Dehydrin-Like Proteins in Soybean Seeds in Response to Drought Stress during Seed Filling. Crop Sci. 2006, 46, 2141–2150. [Google Scholar] [CrossRef] [Green Version]
- Lopez, C.G.; Banowetz, G.M.; Peterson, C.J.; Kronstad, W.E. Dehydrin Expression and Drought Tolerance in Seven Wheat Cultivars. Crop Sci. 2003, 43, 577–582. [Google Scholar] [CrossRef]
- Arumingtyas, E.L.; Savitri, E.S.; Purwoningrahayu, R.D. Protein Profiles and Dehydrin Accumulation in Some Soybean Varieties (Glycine max L. Merr) in Drought Stress Conditions. Am. J. Plant Sci. 2013, 2013, 134–141. [Google Scholar] [CrossRef] [Green Version]
- Hakim; Ullah, A.; Hussain, A.; Shaban, M.; Khan, A.H.; Alariqi, M.; Gul, S.; Jun, Z.; Lin, S.; Li, J.; et al. Osmotin: A plant defense tool against biotic and abiotic stresses. Plant Physiol. Biochem. PPB 2018, 123, 149–159. [Google Scholar] [CrossRef]
- Grillo, S.; Leone, A.; Xu, Y.; Tucci, M.; Francione, R.; Hasegawa, P.M.; Monti, L.; Bressan, R.A. Control of osmotin gene expression by ABA and osmotic stress in vegetative tissues of wild-type and ABA-deficient mutants of tomato. Physiol. Plant. 1995, 93, 498–504. [Google Scholar] [CrossRef]
- Abdin, M.Z.; Kiran, U.; Alam, A. Analysis of osmotin, a PR protein as metabolic modulator in plants. Bioinformation 2011, 5, 336–340. [Google Scholar] [CrossRef] [Green Version]
- Patade, V.Y.; Khatri, D.; Kumari, M.; Grover, A.; Mohan Gupta, S.; Ahmed, Z. Cold tolerance in Osmotin transgenic tomato (Solanum lycopersicum L.) is associated with modulation in transcript abundance of stress responsive genes. Springerplus 2013, 2, 117. [Google Scholar] [CrossRef] [Green Version]
- Jia, J.; Liang, Y.; Gou, T.; Hu, Y.; Zhu, Y.; Huo, H.; Guo, J.; Gong, H. The expression response of plasma membrane aquaporins to salt stress in tomato plants. Environ. Exp. Bot. 2020, 178, 104190. [Google Scholar] [CrossRef]
- Ouziad, F.; Wilde, P.; Schmelzer, E.; Hildebrandt, U.; Bothe, H. Analysis of expression of aquaporins and Na+ /H+ transporters in tomato colonized by arbuscular mycorrhizal fungi and affected by salt stress. Environ. Exp. Bot. 2006, 57, 177–186. [Google Scholar] [CrossRef] [Green Version]
- Balarynova, J.; Fellner, M. Expression of genes encoding PIP aquaporins in tomato seeds exposed to blue radiation and mercury. Biol. Plant. 2019, 63, 1–10. [Google Scholar] [CrossRef]
- Fang, L.; Abdelhakim, L.O.A.; Hegelund, J.N.; Li, S.; Liu, J.; Peng, X.; Li, X.; Wei, Z.; Liu, F. ABA-mediated regulation of leaf and root hydraulic conductance in tomato grown at elevated CO2 is associated with altered gene expression of aquaporins. Hortic. Res. 2019, 6, 104. [Google Scholar] [CrossRef] [Green Version]
- Aroca, R.; Del Mar Alguacil, M.; Vernieri, P.; Ruiz-Lozano, J.M. Plant responses to drought stress and exogenous ABA application are modulated differently by mycorrhization in tomato and an ABA-deficient mutant (sitiens). Microb. Ecol. 2008, 56, 704–719. [Google Scholar] [CrossRef]
- Ricardi, M.M.; González, R.M.; Zhong, S.; Domínguez, P.G.; Duffy, T.; Turjanski, P.G.; Salgado Salter, J.D.; Alleva, K.; Carrari, F.; Giovannoni, J.J.; et al. Genome-wide data (ChIP-seq) enabled identification of cell wall-related and aquaporin genes as targets of tomato ASR1, a drought stress-responsive transcription factor. BMC Plant Biol. 2014, 14, 29. [Google Scholar] [CrossRef] [Green Version]
- Reuscher, S.; Akiyama, M.; Mori, C.; Aoki, K.; Shibata, D.; Shiratake, K. Genome-Wide Identification and Expression Analysis of Aquaporins in Tomato. PLoS ONE 2013, 8, e79052. [Google Scholar] [CrossRef] [Green Version]
- Hasanagić, D.; Koleška, I.; Kojić, D.; Vlaisavljević, S.; Janjić, N.; Kukavica, B. Long term drought effects on tomato leaves: Anatomical, gas exchange and antioxidant modifications. Acta Physiol. Plant. 2020, 42, 121. [Google Scholar] [CrossRef]
- Chaves, M.M.; Flexas, J.; Pinheiro, C. Photosynthesis under drought and salt stress: Regulation mechanisms from whole plant to cell. Ann. Bot. 2009, 103, 551–560. [Google Scholar] [CrossRef] [Green Version]
- Castillejo, M.A.; Maldonado, A.M.; Ogueta, S.; Jorrin, J.V. Proteomic Analysis of Responses to Drought Stress in Sunflower (Helianthus annuus) Leaves by 2DE Gel Electrophoresis and Mass Spectrometry. Open Proteomics J. 2008, 1, 59–71. [Google Scholar] [CrossRef] [Green Version]
- Houtz, R.L.; Magnani, R.; Nayak, N.R.; Dirk, L.M.A. Co- and post-translational modifications in Rubisco: Unanswered questions. J. Exp. Bot. 2008, 59, 1635–1645. [Google Scholar] [CrossRef] [PubMed] [Green Version]
- Piccini, C.; Cai, G.; Dias, M.C.; Araújo, M.; Parri, S.; Romi, M.; Faleri, C.; Cantini, C. Olive Varieties under UV-B Stress Show Distinct Responses in Terms of Antioxidant Machinery and Isoform/Activity of RubisCO. Int. J. Mol. Sci. 2021, 22, 11214. [Google Scholar] [CrossRef] [PubMed]
- Parrotta, L.; Aloisi, I.; Faleri, C.; Romi, M.; Del Duca, S.; Cai, G. Chronic heat stress affects the photosynthetic apparatus of Solanum lycopersicum L. cv Micro-Tom. Plant Physiol. Biochem. PPB 2020, 154, 463–475. [Google Scholar] [CrossRef] [PubMed]
- Kleczkowski, L.A.; Kunz, S.; Wilczynska, M. Mechanisms of UDP-Glucose Synthesis in Plants. CRC Crit. Rev. Plant Sci. 2010, 29, 191–203. [Google Scholar] [CrossRef]
- Pelah, D.; Wang, W.; Altman, A.; Shoseyov, O.; Bartels, D. Differential accumulation of water stress-related proteins, sucrose synthase and soluble sugars in Populus species that differ in their water stress response. Physiol. Plant. 1997, 99, 153–159. [Google Scholar] [CrossRef]
- Xue, G.-P.; McIntyre, C.L.; Glassop, D.; Shorter, R. Use of expression analysis to dissect alterations in carbohydrate metabolism in wheat leaves during drought stress. Plant Mol. Biol. 2008, 67, 197–214. [Google Scholar] [CrossRef]
- Nemati, F.; Ghanati, F.; Ahmadi Gavlighi, H.; Sharifi, M. Comparison of sucrose metabolism in wheat seedlings during drought stress and subsequent recovery. Biol. Plant. 2018, 62, 595–599. [Google Scholar] [CrossRef]
- Du, Y.; Zhao, Q.; Chen, L.; Yao, X.; Zhang, H.; Wu, J.; Xie, F. Effect of Drought Stress during Soybean R2–R6 Growth Stages on Sucrose Metabolism in Leaf and Seed. Int. J. Mol. Sci. 2020, 21, 618. [Google Scholar] [CrossRef] [Green Version]
- Shi, K.; Fu, L.-J.; Dong, D.-K.; Zhou, Y.-H.; Yu, J.-Q. Decreased energy synthesis is partially compensated by a switch to sucrose synthase pathway of sucrose degradation in restricted root of tomato plants. Plant Physiol. Biochem. PPB 2008, 46, 1040–1044. [Google Scholar] [CrossRef]
- Ponnu, J.; Wahl, V.; Schmid, M. Trehalose-6-Phosphate: Connecting Plant Metabolism and Development. Front. Plant Sci. 2011, 2, 70. [Google Scholar] [CrossRef] [Green Version]
- Ramon, M.; Rolland, F. Plant development: Introducing trehalose metabolism. Trends Plant Sci. 2007, 12, 185–188. [Google Scholar] [CrossRef] [PubMed]
- Duncan, K.A.; Hardin, S.C.; Huber, S.C. The Three Maize Sucrose Synthase Isoforms Differ in Distribution, Localization, and Phosphorylation. Plant Cell Physiol. 2006, 47, 959–971. [Google Scholar] [CrossRef] [PubMed] [Green Version]
- Raghavendra, A.S.; Gonugunta, V.K.; Christmann, A.; Grill, E. ABA perception and signalling. Trends Plant Sci. 2010, 15, 395–401. [Google Scholar] [CrossRef] [PubMed]
- Yang, J.; Zhang, J.; Li, C.; Zhang, Z.; Ma, F.; Li, M. Response of sugar metabolism in apple leaves subjected to short-term drought stress. Plant Physiol. Biochem. PPB 2019, 141, 164–171. [Google Scholar] [CrossRef] [PubMed]
- Parvaiz, A.; Satyawati, S. Salt stress and phyto-biochemical responses of plants—A review. Plant Soil Environ. 2008, 54, 89–99. [Google Scholar] [CrossRef]
- Le Gall, H.; Philippe, F.; Domon, J.-M.; Gillet, F.; Pelloux, J.; Rayon, C. Cell Wall Metabolism in Response to Abiotic Stress. Plants 2015, 4, 112–166. [Google Scholar] [CrossRef]
- Kubo, Y.; Xue, Y.; Nakatsuka, A.; Mathooko, F.M.; Inaba, A.; Nakamura, R. Expression of a Water Stress-induced Polygalacturonase Gene in Harvested Cucumber Fruit. J. Jpn. Soc. Hortic. Sci. 2000, 69, 273–279. [Google Scholar] [CrossRef] [Green Version]
- Tenhaken, R. Cell wall remodeling under abiotic stress. Front. Plant Sci. 2015, 5, 771. [Google Scholar] [CrossRef] [Green Version]
- Novaković, L.; Guo, T.; Bacic, A.; Sampathkumar, A.; Johnson, K.L. Hitting the Wall-Sensing and Signaling Pathways Involved in Plant Cell Wall Remodeling in Response to Abiotic Stress. Plants 2018, 7, 89. [Google Scholar] [CrossRef] [Green Version]
- Landi, S.; Nurcato, R.; De Lillo, A.; Lentini, M.; Grillo, S.; Esposito, S. Glucose-6-phosphate dehydrogenase plays a central role in the response of tomato (Solanum lycopersicum) plants to short and long-term drought. Plant Physiol. Biochem. 2016, 105, 79–89. [Google Scholar] [CrossRef] [Green Version]
- Sánchez-Rodríguez, E.; Rubio-Wilhelmi, M.; Cervilla, L.M.; Blasco, B.; Rios, J.J.; Rosales, M.A.; Romero, L.; Ruiz, J.M. Genotypic differences in some physiological parameters symptomatic for oxidative stress under moderate drought in tomato plants. Plant Sci. 2010, 178, 30–40. [Google Scholar] [CrossRef]
- Faurobert, M.; Pelpoir, E.; Chaïb, J. Phenol extraction of proteins for proteomic studies of recalcitrant plant tissues. Methods Mol. Biol. 2007, 355, 9–14. [Google Scholar] [CrossRef] [PubMed]
- Hachmann, J.P.; Amshey, J.W. Models of protein modification in Tris-glycine and neutral pH Bis-Tris gels during electrophoresis: Effect of gel pH. Anal. Biochem. 2005, 342, 237–245. [Google Scholar] [CrossRef] [PubMed]
- Garavaglia, B.S.; Garofalo, C.G.; Orellano, E.G.; Ottado, J. Hsp70 and Hsp90 expression in citrus and pepper plants in response to Xanthomonas axonopodis pv. citri. Eur. J. Plant Pathol. 2009, 123, 91–97. [Google Scholar] [CrossRef]
- Parrotta, L.; Aloisi, I.; Suanno, C.; Faleri, C.; Kiełbowicz-Matuk, A.; Bini, L.; Cai, G.; Del Duca, S. A low molecular-weight cyclophilin localizes in different cell compartments of Pyrus communis pollen and is released in vitro under Ca2+ depletion. Plant Physiol. Biochem. PPB 2019, 144, 197–206. [Google Scholar] [CrossRef] [PubMed]
- Kiełbowicz-Matuk, A.; Rey, P.; Rorat, T. The abundance of a single domain cyclophilin in Solanaceae is regulated as a function of organ type and high temperature and not by other environmental constraints. Physiol. Plant. 2007, 131, 387–398. [Google Scholar] [CrossRef]
- Goñi, O.; Quille, P.; O’Connell, S. Ascophyllum nodosum extract biostimulants and their role in enhancing tolerance to drought stress in tomato plants. Plant Physiol. Biochem. PPB 2018, 126, 63–73. [Google Scholar] [CrossRef]
- ZamaniBahramabadi, E.; Jonoubi, P.; Rezanejad, F. Dehydrin Content in Fresh and Desiccated Pistachio (Pistacia vera L.) Seeds. Iran. J. Sci. Technol. Trans. A Sci. 2019, 43, 2099–2105. [Google Scholar] [CrossRef]
- Szegő, A.; Badics, E.; Gubala, D.; Oszlányi, R.; Oyuntogtokh, B.E.; Kappel, N.; Papp, I.; Kiss-Bába, E. Diverse responsiveness of dehydrin genes to abscisic acid and water stress treatments in cucumber F1 cultivar hybrids. J. Hortic. Sci. Biotechnol. 2019, 94, 726–734. [Google Scholar] [CrossRef] [Green Version]
- Persia, D.; Cai, G.; Del Casino, C.; Faleri, C.; Willemse, M.T.M.; Cresti, M. Sucrose Synthase Is Associated with the Cell Wall of Tobacco Pollen Tubes. Plant Physiol. 2008, 147, 1603–1618. [Google Scholar] [CrossRef] [Green Version]
- Heinlein, M.; Starlinger, P. Tissue- and cell-specific expression of the two sucrose synthase isoenzymes in developing maize kernels. Mol. Gen. Genet. MGG 1989, 215, 441–446. [Google Scholar] [CrossRef]
- Piccini, C.; Cai, G.; Dias, M.C.; Romi, M.; Longo, R.; Cantini, C. UV-B radiation affects photosynthesis-related processes of two Italian olea Europaea (L.) varieties differently. Plants 2020, 9, 1712. [Google Scholar] [CrossRef] [PubMed]


Publisher’s Note: MDPI stays neutral with regard to jurisdictional claims in published maps and institutional affiliations. |
© 2022 by the authors. Licensee MDPI, Basel, Switzerland. This article is an open access article distributed under the terms and conditions of the Creative Commons Attribution (CC BY) license (https://creativecommons.org/licenses/by/4.0/).
Share and Cite
Conti, V.; Cantini, C.; Romi, M.; Cesare, M.M.; Parrotta, L.; Del Duca, S.; Cai, G. Distinct Tomato Cultivars Are Characterized by a Differential Pattern of Biochemical Responses to Drought Stress. Int. J. Mol. Sci. 2022, 23, 5412. https://doi.org/10.3390/ijms23105412
Conti V, Cantini C, Romi M, Cesare MM, Parrotta L, Del Duca S, Cai G. Distinct Tomato Cultivars Are Characterized by a Differential Pattern of Biochemical Responses to Drought Stress. International Journal of Molecular Sciences. 2022; 23(10):5412. https://doi.org/10.3390/ijms23105412
Chicago/Turabian StyleConti, Veronica, Claudio Cantini, Marco Romi, Maria Michela Cesare, Luigi Parrotta, Stefano Del Duca, and Giampiero Cai. 2022. "Distinct Tomato Cultivars Are Characterized by a Differential Pattern of Biochemical Responses to Drought Stress" International Journal of Molecular Sciences 23, no. 10: 5412. https://doi.org/10.3390/ijms23105412
APA StyleConti, V., Cantini, C., Romi, M., Cesare, M. M., Parrotta, L., Del Duca, S., & Cai, G. (2022). Distinct Tomato Cultivars Are Characterized by a Differential Pattern of Biochemical Responses to Drought Stress. International Journal of Molecular Sciences, 23(10), 5412. https://doi.org/10.3390/ijms23105412