Article

The Annual Cycle in Mid-Latitude Stratospheric and Mesospheric Ozone Associated with Quasi-Stationary Wave Structure by the MLS Data 2011–2020

1
International Center of Future Science, College of Physics, Jilin University, Changchun 130012, China
2
Physics Faculty, Taras Shevchenko National University of Kyiv, 01601 Kyiv, Ukraine
3
Department of Atmosphere Physics and Geospace, National Antarctic Scientific Center, 01601 Kyiv, Ukraine
4
Laboratoire d’Optique Atmosphérique, Département de Physique, Université de Lille, 59655 Villeneuve d’Ascq, France
5
Antarctic Climate Program, Australian Antarctic Division, Kingston 7050, Australia
6
Department of Physics, University of Adelaide, Adelaide 5005, Australia
7
Department of Millimeter Radio Astronomy, Institute of Radio Astronomy, National Academy of Sciences of Ukraine, 61002 Kharkiv, Ukraine
*
Author to whom correspondence should be addressed.
Remote Sens. 2022, 14(10), 2309; https://doi.org/10.3390/rs14102309
Submission received: 15 April 2022 / Revised: 7 May 2022 / Accepted: 8 May 2022 / Published: 10 May 2022

Abstract

:
The purpose of this work is to study quasi-stationary wave structure in the mid-latitude stratosphere and mesosphere (40–50°N) and its role in the formation of the annual ozone cycle. Geopotential height and ozone from Aura MLS data are used and winter climatology for January–February 2011–2020 is considered. The 10-degree longitude segment centered on Longfengshan Brewer station (44.73°N, 127.60°E), China, is examined in detail. The station is located in the region of the Aleutian Low associated with the quasi-stationary zonal maximum of total ozone. Annual and semi-annual oscillations in ozone using units of ozone volume mixing ratio and concentration, as well as changes in ozone peak altitude and in time series of ozone at individual pressure levels between 316 hPa (9 km) and 0.001 hPa (96 km) were compared. The ozone maximum in the vertical profile is higher in volume mixing ratio (VMR) values than in concentration by about 15 km (5 km) in the stratosphere (mesosphere), consistent with some previous studies. We found that the properties of the annual cycle are better resolved in the altitude range of the main ozone maximum: middle–upper stratosphere in VMR and lower stratosphere in concentration. Both approaches reveal annual and semi-annual changes in the ozone peak altitudes in a range of 4–6 km during the year. In the lower-stratospheric ozone of the Longfengshan domain, an earlier development of the annual cycle takes place with a maximum in February and a minimum in August compared to spring and autumn, respectively, in zonal means. This is presumably due to the higher rate of dynamical ozone accumulation in the region of the quasi-stationary zonal ozone maximum. The “no-annual-cycle” transition layers are found in the stratosphere and mesosphere. These layers with undisturbed ozone volume mixing ratio are of interest for more detailed future study.

1. Introduction

Quasi-stationary waves (QSW) in the atmosphere are known to be responsible for the formation of fairly stable planetary-scale anomalies in atmospheric variables and in the composition of the atmosphere (temperature, wind, sea level pressure, ozone, water vapor etc.) [1,2,3]. The QSWs originate in the troposphere from orographic and thermal sources [4] and penetrate upward into the stratosphere and mesosphere [1,2,5]. An important property of QSW is the westward phase tilt with altitude associated with the vertical propagation of stationary planetary waves [6,7]. The longest QSWs with zonal wave numbers m = 1 and m = 2 cause zonal asymmetry in the atmosphere and contribute to the appearance of regional weather anomalies in the troposphere with cold or warm air masses, with abundance or lack of precipitation [3,8].
In the stratosphere, the QSW influence leads to zonal asymmetry of mid-latitude and polar ozone, temperature and zonal wind in winter and spring [1,2,7]. Ozone, in turn, can affect surface ultraviolet radiation [9,10,11], and, due to downward propagation of stratospheric anomalies and their large zonal asymmetry, surface weather anomalies often appear in the midlatitudes [8]. Studying the effects of stationary waves on total ozone, ultraviolet radiation and weather is therefore very important [12,13]. In the mesosphere, QSWs contribute to changes in the circulation patterns, as well as to the variability and decadal trends in ozone and temperature [5,14,15]. Generally, the QSWs between the troposphere and mesosphere play a significant role in the longitudinal distribution of atmospheric parameters, establishing their regional distinctions.
Hood and Zaff [7] analyzed the QSW structure using early ozone data of 1979–1991 from TOMS Nimbus 7 satellite and geopotential height Z in 1979–1993 from reanalysis data. It has been shown that in the Northern Hemisphere (NH) in January ozone trends at 50°N are longitude-depended and inversely correlated with zonal anomalies in geopotential height Z. Due to the dominance of quasi-stationary wave 1 (QSW1), steady zonal asymmetry in the climatological ozone distributions over the NH exists [7,16,17,18]. As known, QSW1 can modulate the longitudinal distribution of total ozone column (TOC) (i) through the tropopause effect above the tropospheric pressure systems [7], (ii) by zonal asymmetry in the Brewer–Dobson circulation (BDC) in the stratosphere [2,19], and (iii) due to stratospheric polar vortex displacement relative to the pole [20,21]. Climatologically, the zonal TOC maximum and minimum are located in the North Pacific–East Asia and in the North Atlantic–Europe, in accordance with the locations of the main atmospheric centers of action with low and high surface pressure, respectively [7].
Since the anomalies of the tropospheric and stratospheric circulation are different in their seasonal changes, the climatological annual cycle (AC) in TOC can also be regionally different. In the zonal means, the annual TOC maximum (March–April) in the NH extratropics lags behind the tropospheric wave activity maximum (January) by about 3 months [22]. The time lag reflects the additional time for the tropical ozone-rich air involved in the BDC due to wave activity, to reach the extratropics. Taking into account the zonal asymmetry, AC has a maximum in February and a minimum in August in the region of the zonal TOC maximum [23] which is two to three months earlier than in the region of the zonal TOC minimum (April and October–November, respectively) [24].
As discussed in [23], the seasonal variation of total ozone amount consists of two components. One component corresponds to the photochemical equilibrium effect and the other is associated with the atmospheric circulation effect. Since the photochemical effect is defined as a function of latitude, total ozone amount at specific latitude varies seasonally according to the magnitude of the atmospheric circulation. The results [23] indicate that the atmospheric circulation effect in middle latitudes is most active in winter. Its hemispheric pattern is similar to that of ultra-long waves and it has correlation with the activity of the meridional transport of ozone and ozone dynamical accumulation in the lower stratosphere. The larger the contribution of the atmospheric circulation effect is, the amplitude of annual variation becomes larger and the annual maximum appears earlier (the more the date of the spring maximum is advanced from spring to winter).
Most previous works, where the ozone seasonality was determined, used zonal mean [22,25,26,27,28,29], local [24,30,31] or regional [23,24,32,33] ozone data. The month–longitude dependence of total ozone in zone 50–60°N has been presented by Zou et al. [34] (their Figure 1). Statistically, this dependence was analyzed using the monthly climatology of the annual TOC cycles along the zone 40–60°N with a 30°-step in longitude [35]. It has been shown that the AC development in East Asia (120–150°E, zonal TOC maximum) occurs two to three months earlier than in East Atlantic (0–30°W, zonal TOC minimum). This means that, similarly to zonal asymmetry in both the TOC distribution and the decadal TOC trends [7,16,18,34,36], the annual TOC cycle in the NH mid-latitudes is also longitudinally dependent and is modulated by the QSW structure.
Due to the importance of QSW activity in changes in regional temperature, ozone and climate [3,7,8,14], continuous monitoring of QSWs is required to detect their possible deviations in phase and amplitude relative to climatology. In this work, we present the QSW climatology 2011–2020 in its vertical changes between the troposphere and mesosphere in the NH mid-latitudes. Based on the Aura Microwave Limb Sounder (MLS) satellite data, the geopotential height Z and ozone volume mixing ratio and concentration are analyzed. Section 2 briefly describes the data and the analysis method. In Section 3, the QSW climatologies are presented. Annual cycles in stratospheric and mesospheric ozone are compared in Section 4. Discussion of the results is given in Section 5 followed by conclusions in Section 6.

2. Data and Analysis Method

To analyze quasi-stationary wave structure in the mid-latitude stratosphere and mesosphere, we used the data on ozone and geopotential heights (GPH) from the Microwave Limb Sounder onboard the Aura satellite (Aura MLS) [37,38,39,40]. For this work we obtained the MLS ozone and GPH data on 10 fixed pressure surfaces located in the troposphere, stratosphere and mesosphere: 825, 316, 100, 26, 10, 3.16, 1, 0.1, 0.01, and 0.001 hPa (2–96 km) with a vertical resolution of ~2 km in the stratosphere and ~6 km in the mesosphere. Analysis of the ozone data was restricted to the pressure range 261–0.02 hPa following data quality recommendations [37]. The scientifically useful pressure range for GPH is 261–0.001 hPa [37] but we use data in the lower two levels, noting that these are outside the recommended range. When selecting the Aura MLS ozone and geopotential heights data, unless otherwise specified, we use the longitude range ±10° for the local longitude coordinates and ±2.5° for the latitude coordinates.
We also compare the ozone annual cycle using volume mixing ratio (VMR) in parts per million by volume (ppmv) and concentrations in molecules·cm−3 on specified pressure levels. For analysis, the ozone VMR values in ppmv unit were converted to ozone concentrations. If VMR represents the relative volume content of ozone, then the concentration shows the actual mass of ozone per unit volume. Under conditions of decreasing atmospheric pressure with altitude, VMR and concentration may show different vertical ozone profiles. In this work, we explore for the first time how the annual ozone cycle in the stratosphere and mesosphere manifests itself in each of the two units.
The monthly means of January–February Aura MLS data on geopotential height Z and ozone volume mixing ratio [37,38,39,40] are averaged over the last decade of 2011–2020 and along the zone 40–50°N, covering North China and Ukraine and influenced by the main atmospheric centers of actions in the NH (Figure 1a).
Regional anomalies in total ozone, temperature and carbon monoxide over Eastern Europe and Ukraine have been analyzed previously [35,41,42], and we focus here on East Asia and North China. Particularly, the Longfengshan weather station segment of longitudes 122–132°E (light vertical strip in Figure 1a) is chosen. The Longfengshan station (ID 326, 44.73°N, 127.60°E), China, is equipped with Brewer spectrophotometer since 1993. The open access to the total ozone column data from the Longfengshan station is provided by the World Ozone and Ultraviolet Radiation Data Centre (WOUDC) [43]. Monthly mean total ozone with standard deviations (vertical lines) from observations at the Longfengshan station in 2011–2020 is shown in Figure 1b.
The two winter months, January–February, are at the annual maximum of planetary wave activity (December–February) with a peak in January [7,22]. On the other hand, total ozone maximum at Longfengshan is observed in February (Figure 1b) and, by Coldewey-Egbers et al. [29], total ozone maximum in zonal mean at 40–55°N occurs in February–March.
We follow the analysis method by Hood and Zaff [7] and first we present the QSW structures by creating the climatological longitudinal distributions of Z and ozone at 10 pressure levels (Section 3). Then, following the method [35], regional annual cycles in stratospheric and mesospheric ozone are compared (Section 4). In particular, we focus on the analysis of the annual cycles in ozone in the Longfengshan region, China (45°N; 128°E; black circle in Figure 1a), which is under influence of the Aleutian Low (AL). Quasi-stationary anomaly in the AL sea level pressure in winter is located in North Pacific around 180°E. Due to the QSW westward phase tilt with altitude, the related low Z anomaly in the lower stratosphere shifts to East Asia as shown in [7], and covers the study region in North China (AL and Longfengshan domain in Figure 1a). This can be seen from the deviation of the Z9000 isoline towards the subtropics around 120°E and from the intrusion of the low Z levels Z8600 into the zone 40–50°N (solid curves in Figure 1a).
The pressure level of 316 hPa, shown in Figure 1a, lies near the tropopause of the NH mid-latitudes in winter (8–9 km; see also in [44]). The AL is climatologically associated with a zonal minimum in the tropopause height and maximum in total ozone [7]. Note that the two pairs of lows and highs (AL–IL and NAH–AH) form zonal wave 2 in the mid-latitude QSW structure (Figure 1a). Azores High is a subtropical anticyclone (AH in Figure 1a), which is relatively weak in winter. However, it influences the mid-latitude stratosphere due to the systematical poleward shift with altitude relative to its lower-tropospheric counterpart [45,46].

3. QSW Longitudinal Distribution in Geopotential Height and Ozone

3.1. QSW Structure in Geopotential Heights

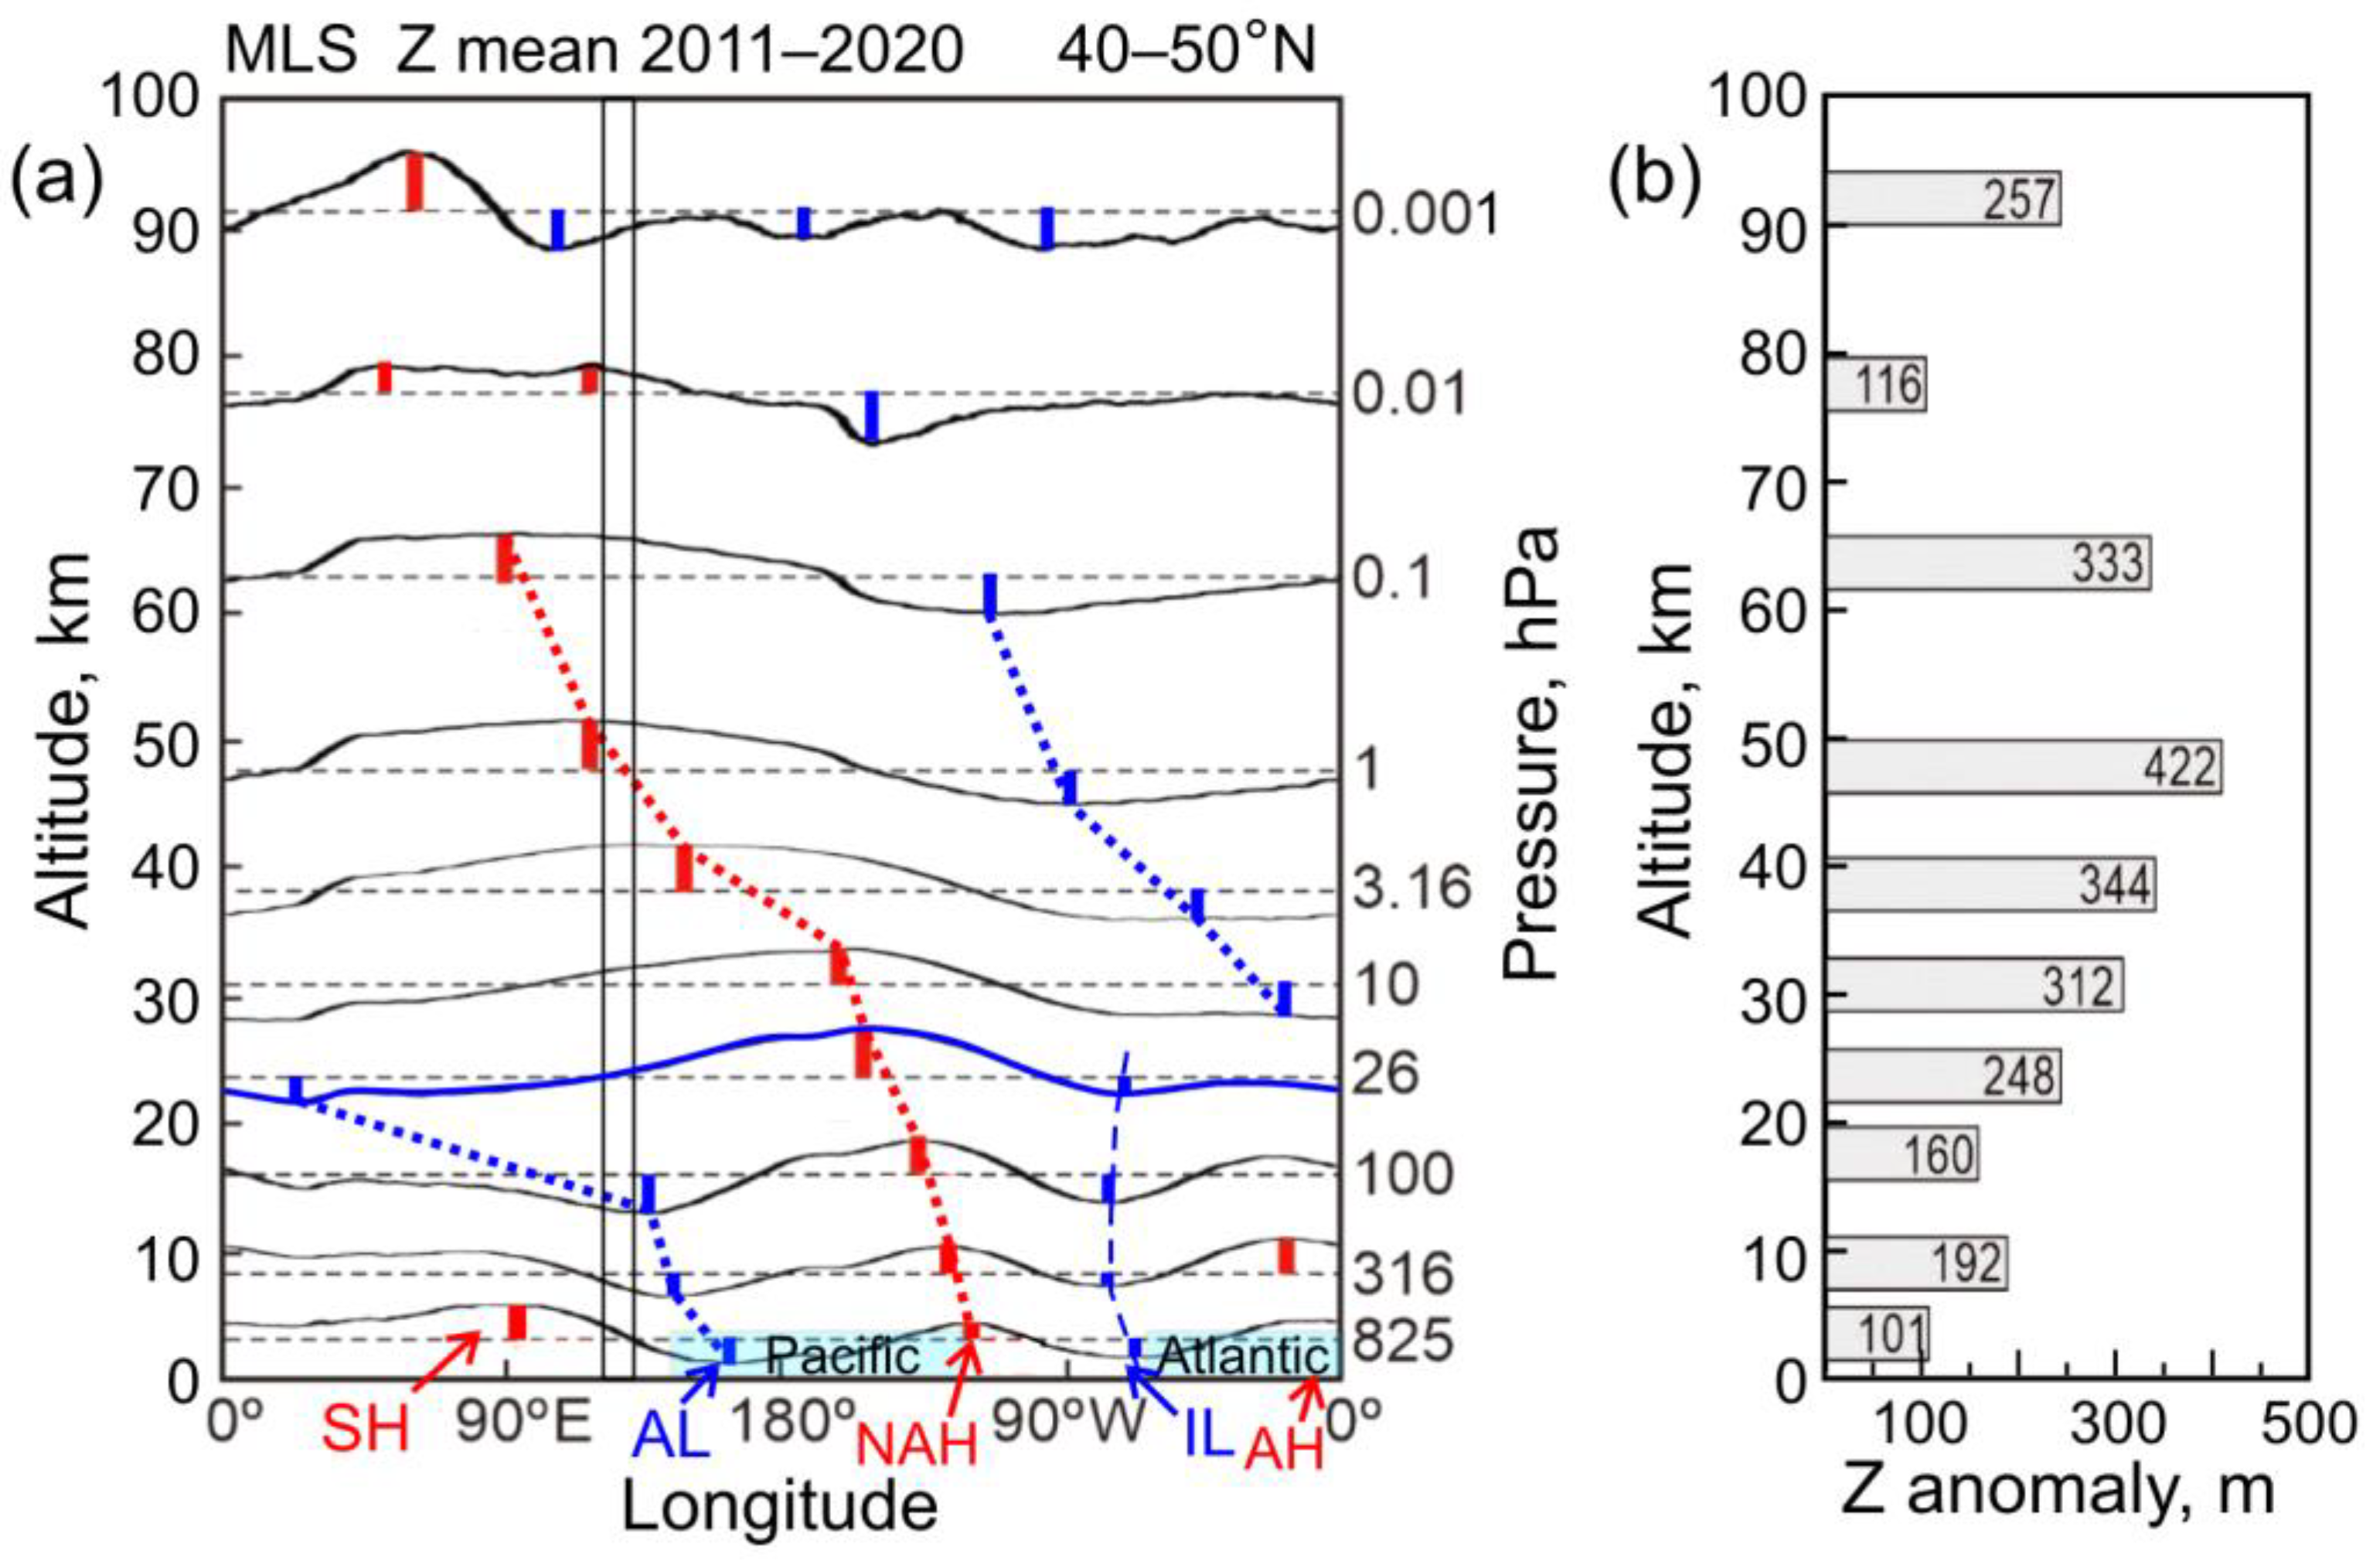
The vertical changes in the QSW structure in geopotential height between 825 hPa and 0.001 hPa are shown in Figure 2a. There is a successive vertical transition between the troposphere and the lower stratosphere from QSW with zonal wave number m = 2 (QSW2) to m = 1 (QSW1) (the four lower curves at pressure levels 825, 316, 100 hPa, and 26 hPa in Figure 2a). The positive (negative) deviations from zonal mean indicated at the QSW peaks by red (blue) bars show a vertical modification of QSW2 to QSW1. The QSW1 remains the dominant wave component also higher up to 0.1 hPa (64 km), and the Z anomaly exhibits peak at the stratopause altitude (422 m at 1 hPa (~50 km) in Figure 2b).
There is a clear westward phase tilt in the QSW structure between the lower troposphere (AL- and IL-related anomalies in the Pacific and Atlantic segments, respectively, marked with light-blue rectangles at the bottom of Figure 2a) and lower mesosphere (825 hPa and 0.1 hPa in Figure 2a). On the whole, westward shifts are about 150° for QSW maximum (120°W–180°E–90°E, red dotted line in Figure 2a) and about 270° for QSW minimum (160°E–0°E–110°W, blue dotted lines in Figure 2a).
Both properties of the vertical wave modification (QSW2 to QSW1 and westward phase tilt) are in correspondence with the QSW theory and observations: the longest waves are only able to penetrate from the troposphere into the stratosphere and their propagation in the westerly flow is accompanied be a westward phase tilt [4,6,7]. As shown by dotted lines in Figure 2a, climatology 2011–2020 suggests that the source regions for the upper-level QSW extremes are projected to ~160°E (minimum) and ~120°W (maximum) in the lower troposphere. These longitudes correspond to the Aleutian Low and North American High regions (AL and NAH, respectively, in Figure 2a). Due to westward phase tilt, the main stratospheric QSW ridge in Figure 2a turns out to be located above the AL tropospheric anomaly and therefore assigned to the Aleutian anticyclone [45,47,48]. However, it is clearly associated with the NAH anomaly in the troposphere (red dotted line and Z anomaly at 120°W, 825 hPa, in Figure 2a). Similar location of the main QSW ridge in the winter stratosphere follows from 10-year climatologies of 1985–1994 (135°W, 56°N, 10 hPa; ECMWF composite) in [45] and 2001–2010 (150°W, 60°N, 20 km; ERA Interim data) in [2]. Although the association between Aleutian anticyclone in the stratosphere and NAH in the troposphere can be traced, for example, from the results [2,45], it has not been specifically noted previously. In the stratopause–lower mesosphere region (1 hPa and 0.1 hPa in Figure 2a), the QSW ridge (trough) extends predominantly to the eastern (western) hemisphere.
The positive Z anomalies in the troposphere at ~90°E (Siberian High region) and ~70°W (Icelandic Low region) associated with QSW2 decay rapidly with height (SH and IL, respectively, in Figure 2a). They do not make a significant contribution to the dominant structure of the QSW1 type in the middle–upper stratosphere and lower mesosphere. However, it is possible, that IL is partially involved in the formation of the QSW minimum in the stratosphere (dashed blue line in Figure 2a). The IL center is located at high latitudes at about 60°N and it can spread up equatorward to latitudes of 40–50°N, but with reduced intensity [49]. This explains its small effect on the QSW structure analyzed in this work. The SH anomaly in Central Asia is quite strong in the troposphere (SH in Figure 2a), but has a limited vertical extent [50] and is not detected at the tropopause and above (316 hPa and higher in Figure 2a). Therefore, it is not noticeable and is not marked in Figure 1a, where 316 hPa is displayed. Longitudinal distribution of Z anomalies at 0.01 hPa and 0.001 hPa (upper mesosphere–mesopause region) consists of small-scale wave component and looks uncoupled with prevailing QSW1 structure between 10 hPa and 0.1 hPa (Figure 2a).
As seen in Figure 2b, the QSW amplitude increases through the stratosphere, and, as noted above, the maximum Z anomaly of 422 m is reached at the stratopause region (1 hPa, ~50 km). Similar vertical profiles of stationary waves in geopotential height in the extratropical winter can be found in [2,51,52]. There is secondary maximum in Z anomaly in Figure 2b at 0.001 hPa. It is in consistency with additional internal wave forcing in the mesosphere that is meant to represent the in situ planetary wave generation in winter [53].
The Z anomaly peak in Figure 2b (422 m at 1 hPa) is in general consistency with that found from ODIN satellite data (400–600 m, ~50 km, 60°N) [2]. Higher values of anomalies, described by Gabriel et al. [2], are associated with an increase in wave disturbances at the polar vortex edge near 60°N, where a strong zonal flow serves as a waveguide concentrating wave energy [6].

3.2. QSW Structure in Ozone

In contrast to Z anomalies (Figure 2a), the QSW structure in ozone does not show a regular phase shift with altitude (Figure 3a). Note that there is no westward phase tilt in the ozone VMR observed by ODIN satellite in 2001–2010 [2]. The relative contributions of the VMR anomalies to QSW2 are also the largest at the two lower levels (46% and 32% of zonal means, Figure 3b).
The two lower curves in Figure 3a (at 316 hPa, or 9 km, that is near the tropopause, and at 100 hPa, or 16 km, in the lowermost stratosphere) have QSW2 structure anti-correlated with Z anomalies in Figure 2a. The ozone maxima (minima) at 316 hPa and 100 hPa appear above tropospheric cyclones AL and IL (anticyclones SH, NAH and AH). The SH effect, as noted above, has a limited vertical extent and is observed no higher than the tropopause level (316 hPa, or 9 km in Figure 3a).
To determine the degree of relationship between longitudinal anomalies in Z and ozone, correlation coefficients were calculated at each pressure level (Table 1). Table 1 statistically confirms Z–ozone relation qualitatively presented in Figure 2a and Figure 3a. Anti-correlation at 100 hPa (r = −0.85) and 316 hPa (r = −0.47, both significant a 99% confidence level; Table 1) is replaced by strong positive correlation at 26 hPa (r = 0.92). The latter corresponds to almost identical QSW1 structure in Z and ozone (blue curves in Figure 2a and Figure 3a). Moderate anti-correlation (but significant at the 99% confidence level), is in the stratopause layer (1 hPa, r = −0.36 in Table 1). At other levels, the correlation is negligible (r = 0.03–0.17 to r = −0.19).
The results of Figure 2 and Figure 3 and Table 1 mean that, in northern midlatitudes in winter, (i) the QSW2 structure in total ozone is formed mainly by ozone in the lowermost stratosphere under influence of the tropospheric centers of action with an inverse correlation between geopotential height and ozone [7], and (ii) the QSW1 structure in total ozone is contributed also by positive coupling between Z and ozone in the lower stratosphere (see Section 5.1 for discussion).
The factors that determine the QSW structure in the higher layers above the stratopause need additional analysis with the creation of longitude–altitude sections using a higher vertical resolution than in Figure 3a.

4. Annual Variations in the Stratospheric and Mesospheric Ozone
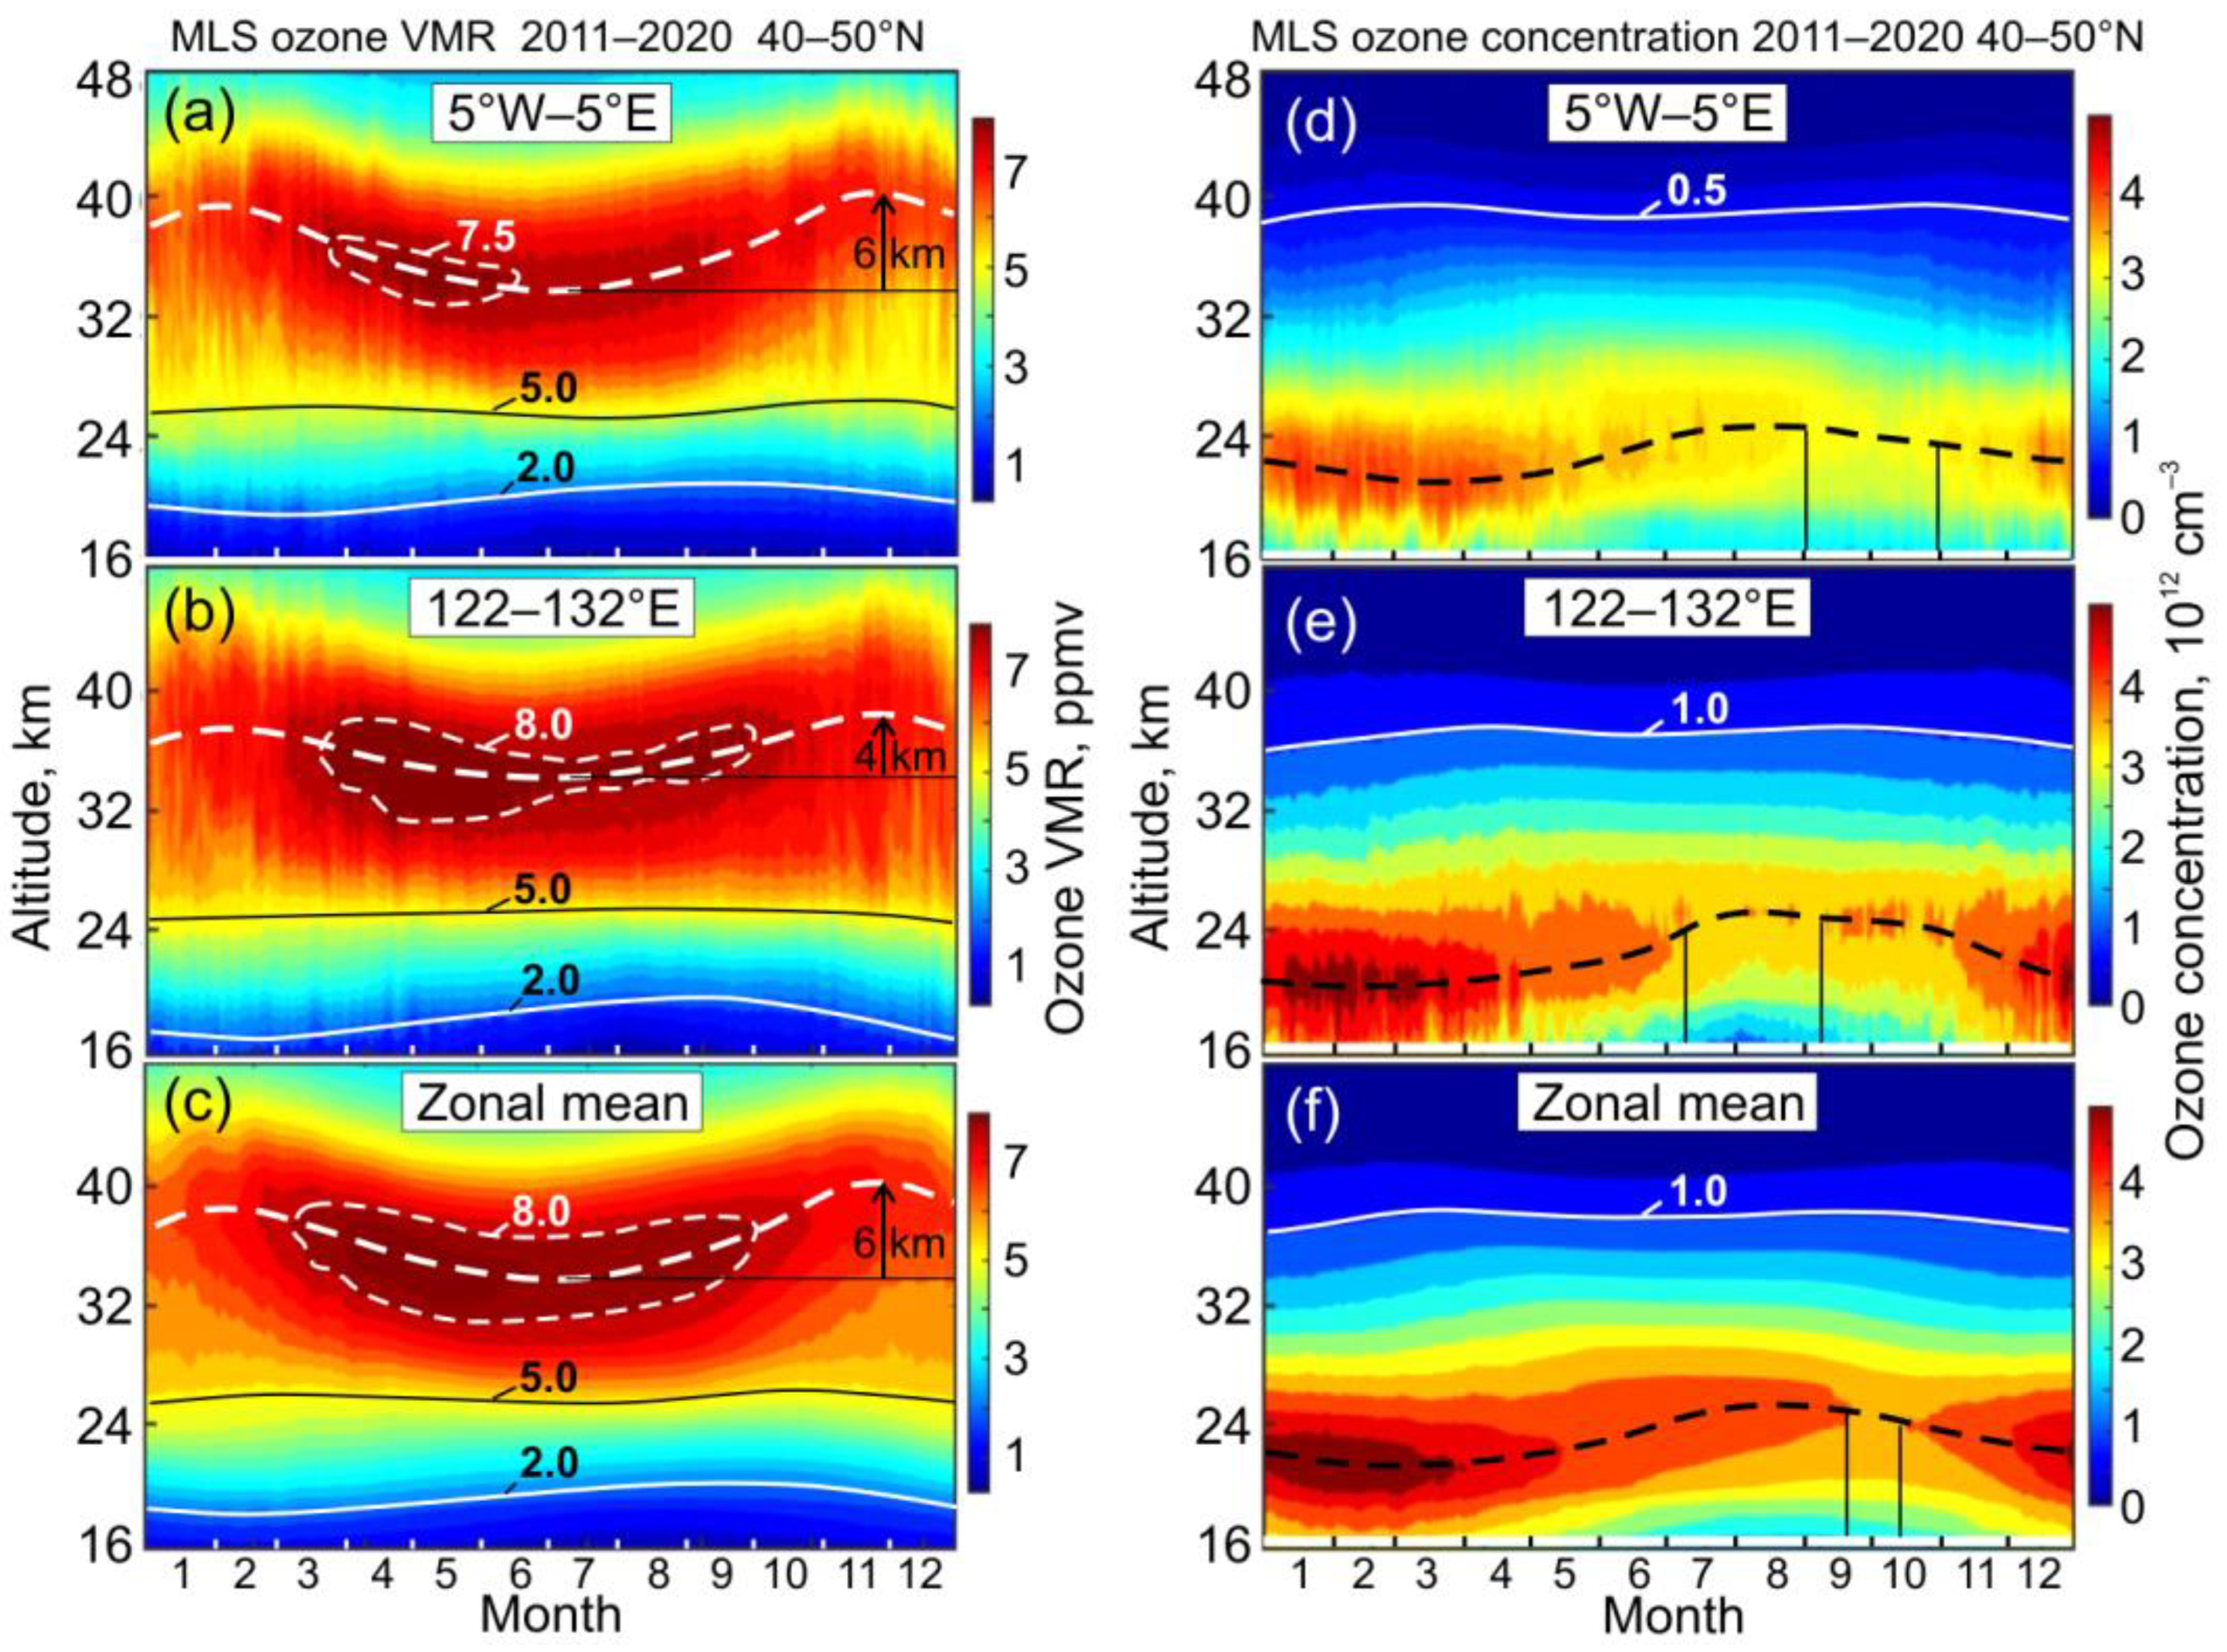
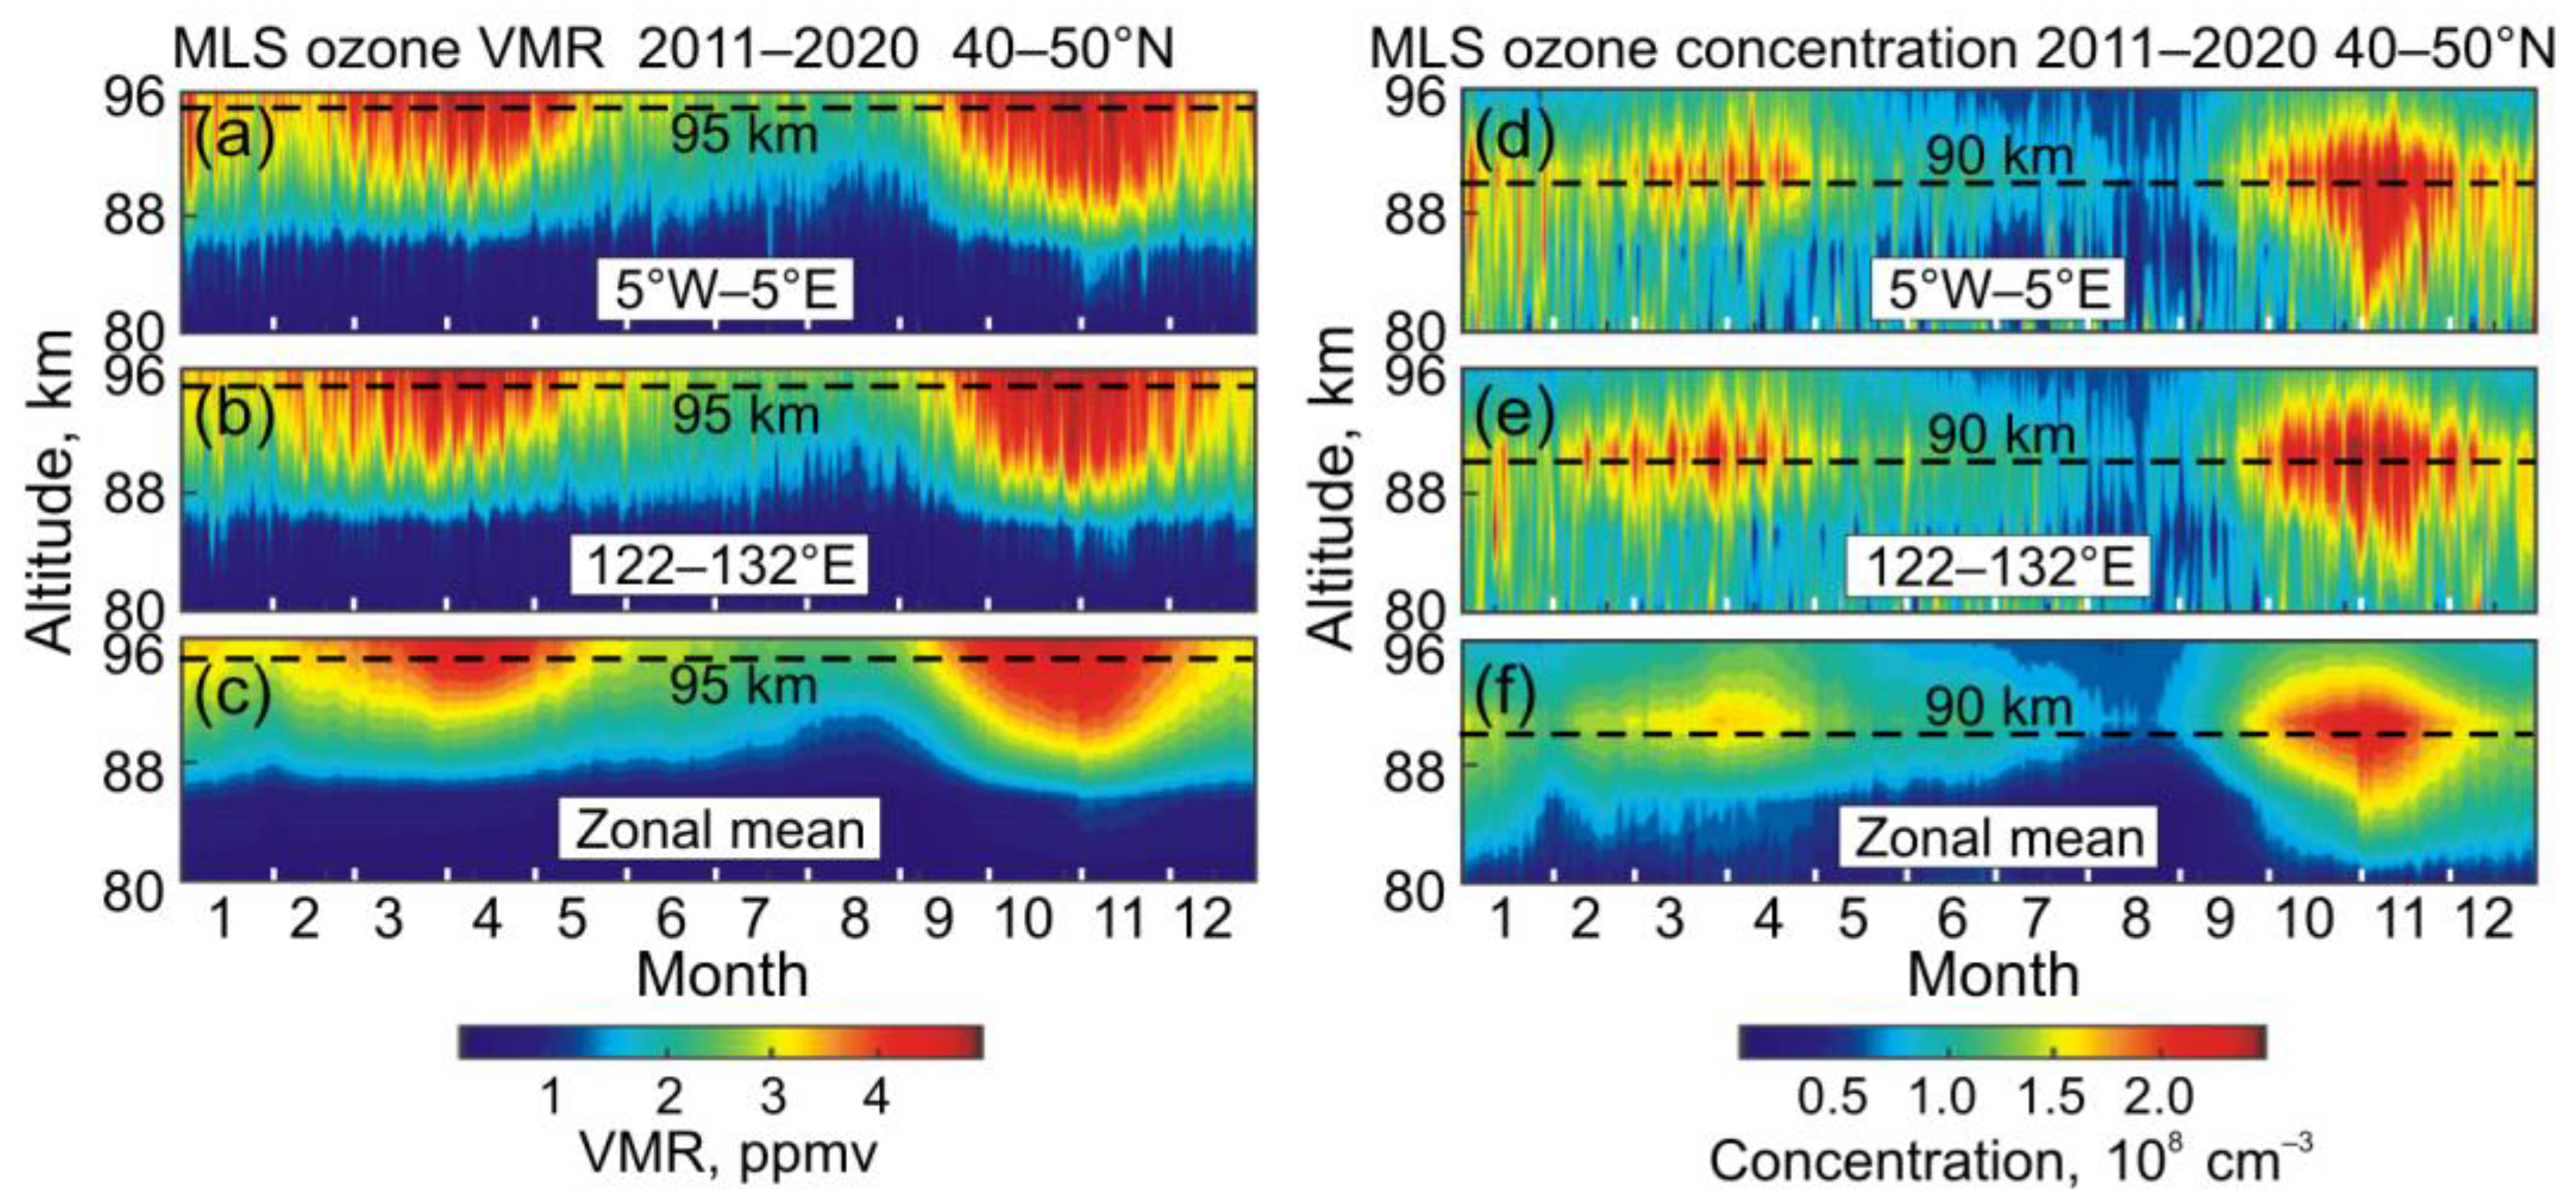
We compare the time–altitude variations of ozone in VMR and concentration in the stratosphere (Figure 4). Figure 5 presents the annual VMR variation at nine selected pressure levels between 100 hPa and 0.001 hPa (16 km to 96 km) in the Longfengshan region and in the zonal means. The time–altitude variations of ozone in VMR and concentration in the mesosphere are shown in Figure 6.
Figure 4. Annual variations in the stratospheric ozone between 16 km and 48 km (100–1 hPa) in (ac) volume mixing ratio and (df) concentration. Solid white (dashed black and white) curves show the difference in annual ozone changes at the altitudes of ozone minimum (maximum) in each of the two units. In (ac) dashed white contour outlines the maximum VMR and solid black curve shows “no-annual-cycle” level of about 5 ppmv at ~24–26 km separating the annual and semi-annual cycles.
Remotesensing 14 02309 g004
The regions of the zonal ozone minimum (5°W–5°E) and the zonal ozone maximum around Longfengshan (122–132°E) in the stratosphere (Figure 3a, curve at 100 hPa; see also [35]), as well as the zonal means of 40–50°N are shown in Figure 4 and Figure 6.
Figure 5. Annual cycle in the ozone VMR at nine pressure levels in the stratosphere and mesosphere according to the MLS measurements: (ai) Longfengshan longitude segment and (jr) zonal means.
Remotesensing 14 02309 g005
In the stratosphere, the VMR maximum is about 15 km higher than concentration maximum (dashed white and black curves in Figure 4a–f). The 15-km difference between the altitudes of ozone maximum in VMR and number density was observed also in the middle to high latitude stratosphere from the Improved Limb Atmospheric Spectrometer (ILAS)-II data in 2003 [54]. It follows from Figure 4 that the midlatitude ozone maximum in winter is in the middle–upper stratosphere at about 30–45 km using VMR (left column) and in the lower stratosphere at about 16–28 km using concentration (right column). Taking into account the latitudinal difference, this is generally consistent with results at ~35 and ~20 km, respectively, obtained by Sugita et al. [54].
It should be noted that the semi-annual cycle is clearly seen at the VMR maximum (dashed white curves in Figure 4a–c) and is barely visible at the same altitudes in concentration (solid white curves in Figure 4d–f). On the contrary, the annual cycle is clearly visible in concentration in the lower stratosphere (dashed black curves in Figure 4d–f), where it is weakly expressed in VMR (solid white curves in Figure 4a–c). These annual changes are commonly referred to as the annual oscillation (AO) and the semi-annual oscillation (SAO) (e.g., [55,56,57]). Note, we describe these annual changes by isolating and comparing altitude changes in peak or specific ozone VMR levels (curves in Figure 4) as distinct from annual changes in ozone VMR itself at specific pressure levels (time series in Figure 5).
Figure 6. Semi-annual cycle in ozone at the altitudes of the secondary ozone maximum in the mesosphere between 80 km and 96 km (0.01–0.001 hPa) in (ac) volume mixing ratio and (df) concentration.
Remotesensing 14 02309 g006
The use of the VMR unit reveals a “no-annual-cycle” boundary at about 25 km (solid black lines in Figure 4a–c) between the weak AO in the lower stratosphere and the strong SAO in the middle–upper stratosphere. This boundary is most stable during the year in the Longfengshan region (solid black curve in Figure 4b and time series at 26 hPa, or ~25 km, in Figure 5g). Dashed curves in Figure 4a–c indicate that strong SAO is formed due to large altitude oscillation of the VMR peak. The two highest (two lowest) altitudes occur in February and November (December–January and June–July) with oscillation range 4–6 km between of 34 km and 40 km (arrows in Figure 4a–c). Similar altitude difference is observed in AO in the lower-stratospheric concentration peaks (dashed black curves in Figure 4d–f).
The times and magnitudes of the VMR peaks are longitudinally dependent on the QSW structure in the stratosphere (Figure 4a–c). The VMR peak in the region of the zonal ozone minimum occurs in spring and is shorter and less intense (7.5 ppmv, dashed white contour in Figure 4a) compared to the region of the zonal ozone maximum and zonal means. In the two latter cases, it lasts during spring–early autumn and is 0.5 ppmv more intense (8.0 ppmv, dashed white contours in Figure 4b,c). Nevertheless, it is common for all three cases in Figure 4a–c that the VMR maximum occurs in summer, when the VMR peak decreases to the lowest altitudes of about 35 km.

5. Discussion

5.1. Correlation between Zonal Anomalies in Geopotential Height and Ozone

Table 1 shows the altitudinal change in the correlation between Z and ozone, determined by the vertical transformation of the QSW structure between the troposphere and mesosphere (Section 3, Figure 2a and Figure 3a). The strong anti-correlations in the lowermost stratosphere (100 hPa or 16 km) with r = −0.85 and at the tropopause (316 hPa or 9 km) with r = −0.47 explain 72% and 22%, respectively, of the appearance of zonal ozone anomalies due to Z anomalies along the 40–50°N zone. This is a clear QSW2 effect, associated with surface pressure anomalies (marked at the bottom of Figure 2a and Figure 3a; see also Figure 1a) and leading to a negative tropopause influence on ozone distribution [7].
A moderate anti-correlation with r = −0.36 (but significant at the 99% confidence level, Table 1) is observed at the stratopause level (1 hPa or about 50 km). The negative relationship in this case makes a 13% contribution to the longitudinal deviations of ozone anomalies. It may be related to the temperature effect of photochemistry on ozone in the upper stratosphere–stratopause layers (temperature enhancements lead to a reduction in upper stratospheric ozone) [55,56]. This indicates that here the distribution of geopotential height anomalies is formed in response to thermal anomalies, in contrast to the dominant response to pressure anomalies in the troposphere–lowermost stratosphere.
An extremely strong positive correlation with r = 0.92 exists in a single layer in the lower stratosphere (Table 1, 26 hPa or 25 km). Such a close coupling between Z and ozone at 26 hPa follows from their almost identical longitudinal distributions in Figure 2a and Figure 3a (blue curves). Note that this is (i) the ‘no-annual-cycle’ layer in VMR (curves for 5 ppmv in Figure 4a–c); where (ii) the influence of QSW2 transforms into dominance of QSW1 (blue curves in Figure 2a and Figure 3a); and (iii) the ozone concentration reaches maximum in its vertical distribution (Figure 4d–f).
Instead of a negative effect of the tropopause on the ozone in the lowermost stratosphere and a negative temperature effect of photochemistry on ozone at the stratopause, the positive ozone–temperature relationship in the lower-stratosphere [1] may play a role in the high Z–ozone correlation at 26 hPa. This pressure level is characterized by zonal ozone asymmetry by QSW1 type (blue curve in Figure 2a and Figure 3a) and is partially responsible for zonal asymmetry in total ozone with the TOC maximum and minimum in the North Pacific–East Asia and in the North Atlantic–Europe, respectively [7].
These results indicate that, if Z in the troposphere–tropopause–lowermost stratosphere layers (825 hPa, 316 hPa and 100 hPa) is mainly affected by the surface pressure anomalies, then Z becomes more dependent on thermal anomalies associated with temperature–ozone coupling in the lower stratosphere (strong positive Z–ozone correlation at 26 hPa) and at the stratopause level (moderate negative Z–ozone correlation at 1 hPa).

5.2. Annual Cycle in Stratospheric Ozone

The summer ozone maximum in the upper stratosphere layer is formed due to photochemistry [23,58]. Ozone lifetime is ~1 day at 40 km [59] and the higher flux of shortwave solar radiation in summer determines higher photochemical production of ozone and the summer ozone maximum at these altitudes. Climatologically, the VMR maximum reaches 6–8 ppmv (Figure 4a–c) which is consistent with 5–9 ppmv between 25 km and 45 km (50°N, 2002–2015) reported by Joshi et al. [57] from the Sounding of the Atmosphere using Broadband Emission Radiometry (SABER) satellite instrument data. The extended summer maximum with the barely perceptible semi-annual oscillation is seen in the middle stratosphere at 10 hPa (32 km; Figure 5f,o), in consistency with the stratospheric ozone profiles from the GROMOS (GROund-based Millimeter-wave Ozone Spectrometer) microwave radiometer at Bern, Switzerland (47°N, 8°E) described in [56]. In our interpretation, the 10-hPa level is at the transition altitude between “no-annual-cycle” level (solid black curves in Figure 4a–c) and the strong SAO altitudes (dashed white curves).
Upwards from the summer VMR maximum, the semi-annual oscillation becomes more distinct in the upper stratosphere (dashed curves in Figure 4a–c) up to the stratopause (time series at 3 hPa and 1 hPa in Figure 5d,e,m,n). An interesting vertical transition occurs between the middle (10 hPa) and upper (1–3 hPa) stratosphere: the summer VMR maximum (Figure 5f,o) is replaced by the summer VMR minimum (Figure 5e,n). Accordingly, prevailing photochemical production of ozone at 30–40 km [23,59] is replaced by catalytic ozone destruction, which peaks in the northern mid-latitude upper stratosphere (40–50 km) during the summer months [60]. The summer ozone minimum in the upper stratosphere–stratopause region is explained by the temperature-dependent photochemistry, with the anti-correlation of ozone and temperature and higher ozone depletion of in warmer air conditions in the summer [56]. The oscillated altitude of the VMR peak (dashed white curves in Figure 4a–c) shows the upper-stratospheric SAO with the two maxima appearing also in the VMR time series (curves for 3 hPa and 1 hPa in Figure 5d,e,m,n). They occur in spring and autumn at 3 hPa (Figure 5e,n) and approach to winter months at the beginning and at the end of the year at 1 hPa (Figure 5d,m).
Downwards, the summer maximum is replaced by late-summer–autumn minimum in the lower stratosphere (Figure 5h,i,q,r). The annual cycle in the regional VMR of the Longfengshan domain at 100 hPa (Figure 5i) is consistent with that in local total ozone climatology (Figure 1b), showing a clear annual maximum (minimum) in February (August). This consistency confirms dominant contribution of the lower stratospheric ozone to total ozone column.
On the other hand, earlier development of AO in Figure 5i compared to zonal mean in Figure 5r is evidence of the QSW structure influence. The specificity of AO here depends on the relationship between the rates of the processes of dynamical ozone accumulation (the larger effect of meridional circulation in autumn–winter) and photochemical relaxation (spring–summer) in the region of the quasi-stationary maximum of total ozone [2,23,32,35]. As a result, the AO extrema in the Longfengshan domain appear 2–3 months earlier than in the region of the zonal TOC minimum: April and October–November, respectively [24]. The zonal mean VMR in Figure 5r has also the AO extrema, prolonged for the spring (maximum) and autumn (minimum) months.
In contrast to the timing of the VMR peak in the upper stratosphere (dashed white contours in Figure 4a–c), concentration better reflects regional difference in the time of annual concentration minimum in the lower stratosphere (vertical lines in Figure 4d–f). It can be seen that the earliest occurrence of annual minimum (summer months July–August) occurs in the region of the zonal ozone maximum (Longfengshan segment in Figure 4e). This AO evolution in the NH mid-latitude lower stratosphere is determined by the QSW structure in Figure 3a (see also [23,32,35]). The two months later (September–October), annual minimum is observed in the region of zonal minimum and in zonal mean (Figure 4d,f). Generally, this difference can be explained by the relationship between a rate of the process of photochemical ozone relaxation during late spring–summer following by dynamical ozone accumulation since late autumn and during winter–spring [22,28,32].

5.3. Annual Cycle in Mesospheric Ozone

Annual changes in the mesospheric ozone are presented in Figure 5a–c,j–l and Figure 6. We found that “no-annual-cycle” conditions in the mesosphere prevail at 0.1 hPa and 0.01 hPa (64 km and 80 km; Figure 5b,c,k,l). This is a layer with VMR of 0.2–0.9 ppmv. Note, that Joshi et al. [57] have found a four-month oscillation in the VMR anomalies integrated between 60 km and 80 km. This oscillation is not visible in our analysis of the separate pressure levels. The strong SAO appears in the mesopause region (Figure 5a,j and Figure 6), where the secondary ozone maximum is located [57,61]. As in the stratosphere, concentration peaks are at lower altitudes than VMR peaks. However, the altitude difference is 3 times less: 5 km (between 90 km and 95 km; dashed lines in Figure 6d–f and Figure 6a–c, respectively) compared to 15 km in Figure 4d–f and Figure 4a–c. The altitude difference in the simulated secondary ozone maximum is also relatively small and on global average, the ozone maximum in the mesopause region is higher in VMR than in number density by 2–4 km [61].
Figure 6 shows that no significant regional difference in timing and intensity of the SAO maxima (top and middle panels) in both VMR (left) and concentration (right). SAO in zonal mean (lower panel in Figure 6) is practically indistinguishable from the regional ones (top and middle panels).
The geopotential height and ozone in the mesosphere have more frequent longitudinal oscillation compared to the QSW1 pattern in the stratosphere (Figure 2a and Figure 3a). Besides, the SAO shape in the ozone VMR at 0.001 hPa (the mesopause region) only slightly similar to that at 1 hPa and 3 hPa (upper stratosphere–stratopause region) and differs in the time and clarity of the maxima (Figure 5). The difference in the SAO peaks at altitudes 30–60 km and 80–100 km was noted in [57]. The differences in the QSW structure and SAO evolution suggest uncoupling between the stratosphere and mesosphere in wave sources and ozone photochemistry. This suggestion is in agreement with the results [62] that the SAO components of ozone and temperature are consistently in phase above about 80 km and are mostly out of phase with each other between about 35 and 80 km. Therefore, the ozone production–loss chains above and below ~80 km may be different in their spatio–temporal patterns. A noted in [61], the very low temperatures at the mesopause accelerate the formation of ozone and inhibit the loss.
About the waves in the mesosphere, breaking gravity waves that have been filtered by planetary-scale wind variations below, act to generate planetary waves in the middle and upper mesosphere [63]. The QSW can be generated in situ in the mesosphere by longitudinally variable gravity wave drag and by flow instabilities at mid-latitudes [15]. Hence, the mesospheric wave sources, as being independent on the stratospheric ones, can contribute to the observed differences in the QSW patterns in geopotential height and ozone (Figure 2 and Figure 3).
The SAO differences in the upper stratosphere and mesopause region could be preliminary attributed to distinctions in temperature-dependent ozone photochemistry [56,61,62]. However, this aspect of annual ozone variation needs additional analysis.

6. Conclusions

Based on the Aura MLS data, we have analyzed the altitudinal changes in the QSW structure and ozone annual cycle in the NH mid-latitudes 40–50°N. The altitude range between the tropopause (316 hPa, 8 km) and mesopause (0.001 hPa, 96 km), winter months January–February and decade 2011–2020 are covered in this study. The analysis is focused on the region of the zonal maximum in total ozone over Aleutian Low. The longitude segment 122–132°E, centered on Longfengshan, China, is examined more carefully.
The QSW westward phase tilt with altitude is clearly represented in the structure of geopotential height along the zone 40–50°N. Wave 2 (QSW2) in the lowermost stratosphere transforms into wave 1 (QSW1) in the lower stratosphere–stratopause region, where the QSW1 ridge (trough) tends to extend to the eastern (western) longitudes. We point out that due to the westward phase tilt there is an association of the North American High in the troposphere (at ~120°W) with the QSW1 ridge in the stratosphere, known as the Aleutian anticyclone. This association is broadly consistent with other works, but has not been specifically noted previously. The tropospheric Aleutian low itself (at ~180°E) is projected onto the QSW1 trough in the western hemisphere stratosphere.
Zonal anomalies in ozone are associated with the tropospheric centers of action only in the lowermost stratosphere (QSW2-type structure), but do not show regular westward tilt towards the upper levels. The correlations in Table 1 between the Z and ozone anomalies shown in Figure 2a and Figure 3a indicate that Z anomalies in the troposphere–tropopause–lowermost stratosphere layers are mainly affected by the surface pressure anomalies. In contrast, Z anomalies seem to be more dependent on thermal anomalies associated with positive temperature–ozone coupling in the lower stratosphere (Z–ozone correlation r = 0.92) and negative one at the stratopause level (anti-correlation r = −0.36).
Using two units, volume mixing ratio and concentration, changes of the annual ozone cycle with altitude between the stratosphere and mesosphere were carefully compared for the first time. The ozone maximum in the vertical profile lies higher in VMR than in concentration by about 15 km (5 km) in the stratosphere (mesosphere), in consistency with earlier studies. We found that the properties of the annual cycle are better resolved just in the altitude range of the main ozone maximum: middle–upper stratosphere in VMR and lower stratosphere in concentration. Both approaches reveal SAO/AO-related changes in the of ozone peak altitudes in a range of 4–6 km during the year.
The VMR time–altitude section shows the transition from the summer ozone maximum in the middle stratosphere (10 hPa) to semi-annual oscillation in the upper stratosphere–stratopause region (3 hPa and 1 hPa). SAO maxima appear in spring and autumn at 3 hPa and shift to the winter months above, at 1 hPa, whereas summer minimum replaces the 10-hPa summer maximum. The altitudinal transition from summer maximum to summer minimum of ozone likely displays dominance of photochemical ozone production at 30–40 km and ozone depletion due to the temperature-dependent photochemistry at 40–50 km [23,56,59,60]. However, the conditions of the formation of both SAO and summer maximum-to-minimum transition in closely adjacent layers of the stratosphere in the zone 40–50°N require clarification in future studies involving theory, models and independent observations.
The time–altitude section and time series of ozone in the lower stratosphere show the well-known winter–spring maximum and late-summer–autumn minimum. In the Longfengshan domain, the earliest development of the annual cycle among the mid-latitude regions with maximum ozone in February and minimum ozone in August displays the influence of the QSW structure and is in general agreement with other works. The specificity of AO here depends on the relationship between the rates of the processes of dynamical ozone accumulation (autumn–winter) and photochemical relaxation (spring–summer) in the region of the quasi-stationary maximum of total ozone. Unlike VMR, SAO is barely noticeable in the upper-stratospheric concentration.
The “no-annual-cycle” boundary between the dynamically controlled lower stratosphere and the chemically controlled middle–upper stratosphere was found. It is at a VMR level of 5 ppmv at an altitude of about 25 km. A similar absence of a noticeable annual ozone cycle exists in the mesospheric layer with a VMR of 0.2–0.9 ppmv between the SAOs in the upper stratosphere and in the mesopause region. These atmospheric layers with undisturbed ozone VMR throughout the year are of interest for future research.
The differences in the QSW structure and SAO evolution between the stratosphere and mesosphere–mesopause region found in this work suggest uncoupling in wave sources and changes in ozone. The QSW can be generated in situ in the mid-latitude mesosphere [15,63] independently on the stratospheric ones formed due to propagation from the troposphere. The SAO differences in the upper stratosphere and mesopause region could be preliminary attributed to distinctions in temperature-dependent ozone photochemistry [55,61,62]. However, these comparisons need to be made on a larger observational base and with the use of chemistry–climate modeling.

Author Contributions

Conceptualization, O.E. and G.M.; methodology, O.E. and Y.S.; data acquisition, C.Z. and O.E.; software, Y.A., C.Z. and O.E.; validation, O.E., Y.S., A.K. and G.M.; investigation, O.E., W.H., G.M., Y.A. and C.Z.; writing—original draft preparation, O.E., A.K. and G.M.; writing—review and editing, O.E., A.K., C.Z., Y.S., G.M., Y.A. and V.S.; visualization, O.E. and C.Z.; supervision, G.M.; project administration, G.M., V.S. and W.H. Each author contributed to the interpretation and discussion of the results and edited the manuscript. All authors have read and agreed to the published version of the manuscript.

Funding

This research received no external funding.

Acknowledgments

This work was partially supported by the College of Physics, International Center of Future Science, Jilin University, China, and by the Ministry of Education and Science of Ukraine with the grant BN-06 for prospective development of a scientific direction “Mathematical sciences and natural sciences” and the project 20BF051-02 at Taras Shevchenko National University of Kyiv. This work contributed to Project 4293 of the Australian Antarctic Program, and to the National Antarctic Scientific Center of Ukraine research objectives. We thank observers at the Longfengshan Brewer station and the WOUDC for total ozone data. The Aura Microwave Limb Sounder (MLS) data were obtained from the Goddard Earth Sciences Data and Information Services Center.

Conflicts of Interest

The authors declare no conflict of interest.

References

  1. Wirth, V. Quasi-stationary planetary waves in total ozone and their correlation with lower stratospheric temperature. J. Geophys. Res. 1998, 98, 8873–8882. [Google Scholar] [CrossRef]
  2. Gabriel, A.; Körnich, H.; Lossow, S.; Peters, D.H.W.; Urban, J.; Murtagh, D. Zonal asymmetries in middle atmospheric ozone and water vapour derived from Odin satellite data 2001–2010. Atmos. Chem. Phys. 2011, 11, 9865–9885. [Google Scholar] [CrossRef] [Green Version]
  3. Wills, R.C.J.; White, R.H.; Levine, X.J. Northern Hemisphere stationary waves in a changing climate. Curr. Clim. Chang. Rep. 2019, 5, 372–389. [Google Scholar] [CrossRef] [Green Version]
  4. Charney, J.G.; Drazin, P.G. Propagation of planetary-scale disturbances from the lower into the upper atmosphere. J. Geophys. Res. 1961, 66, 83–109. [Google Scholar] [CrossRef]
  5. Stray, N.H.; Orsolini, Y.J.; Espy, P.J.; Limpasuvan, V.; Hibbins, R.E. Observations of planetary waves in the mesosphere–lower thermosphere during stratospheric warming events. Atmos. Chem. Phys. 2015, 15, 4997–5005. [Google Scholar] [CrossRef] [Green Version]
  6. Matsuno, T. Vertical propagation of stationary planetary waves in the winter Northern Hemisphere. J. Atmos. Sci. 1970, 27, 871–883. [Google Scholar] [CrossRef] [Green Version]
  7. Hood, L.L.; Zaff, D.A. Lower stratospheric stationary waves and the longitude dependence of ozone trends in winter. J. Geophys. Res. 1995, 100, 25791–25800. [Google Scholar] [CrossRef]
  8. Wolf, G.; Brayshaw, D.J.; Klingaman, N.P.; Czaja, A. Quasi-stationary waves and their impact on European weather and extreme events. Q. J. R. Meteorol. Soc. 2018, 144, 2431–2448. [Google Scholar] [CrossRef] [Green Version]
  9. Eck, T.F.; Bhartia, P.K.; Kerr, J.B. Satellite estimation of spectral UVB irradiance using TOMS derived total ozone and UV reflectivity. Geophys. Res. Lett. 1995, 22, 611–614. [Google Scholar] [CrossRef]
  10. Kazantzidis, A.; Bais, A.F.; Gröbner, J.; Herman, J.R.; Kazadzis, S.; Krotkov, N.; Kyrö, E.; den Outer, P.N.; Garane, K.; Görts, P.; et al. Comparison of satellite-derived UV irradiances with ground-based measurements at four European stations. J. Geophys. Res. 2006, 111, D13207. [Google Scholar] [CrossRef] [Green Version]
  11. Kim, J.; Cho, H.-K.; Mok, J.; Yoo, H.D.; Cho, N.S. Effects of ozone and aerosol on surface UV radiation variability. J. Photochem. Photobiol. B Biol. 2013, 119, 46–51. [Google Scholar] [CrossRef] [PubMed]
  12. Garfinkel, C.I.; White, I.; Gerber, E.P.; Son, S.-W.; Jucker, M. Stationary wave and surface radiative effects weaken and delay the near-surface response to stratospheric ozone depletion. Earth Space Sci. Open Arch. 2021, 40. [Google Scholar] [CrossRef]
  13. Fountoulakis, I.; Diémoz, H.; Siani, A.M.; di Sarra, A.; Meloni, D.; Sferlazzo, D.M. Variability and trends in surface solar spectral ultraviolet irradiance in Italy: On the influence of geopotential height and lower-stratospheric ozone. Atmos. Chem. Phys. 2021, 21, 18689–18705. [Google Scholar] [CrossRef]
  14. Huang, F.T.; Mayr, H.G.; Russell, J.M., III; Mlynczak, M.G. Ozone and temperature decadal trends in the stratosphere, mesosphere and lower thermosphere, based on measurements from SABER on TIMED. Ann. Geophys. 2014, 32, 935–949. [Google Scholar] [CrossRef] [Green Version]
  15. Matthias, V.; Ern, M. On the origin of the mesospheric quasi-stationary planetary waves in the unusual Arctic winter 2015/2016. Atmos. Chem. Phys. 2018, 18, 4803–4815. [Google Scholar] [CrossRef] [Green Version]
  16. Efstathiou, M.N.; Varotsos, C.A.; Singh, R.P.; Cracknell, A.P.; Tzanis, C. On the longitude dependence of total ozone trends over middle-latitudes. Int. J. Remote Sens. 2003, 24, 1361–1367. [Google Scholar] [CrossRef]
  17. Nikulin, G.; Karpechko, A. The mean meridional circulation and midlatitude ozone buildup. Atmos. Chem. Phys. 2005, 5, 3159–3172. [Google Scholar] [CrossRef] [Green Version]
  18. Peters, D.H.W.; Gabriel, A.; Entzian, G. Longitude-dependent decadal ozone changes and ozone trends in boreal winter months during 1960–2000. Ann. Geophys. 2008, 26, 1275–1286. [Google Scholar] [CrossRef]
  19. Demirhan Bari, D.; Gabriel, A.; Körnich, H.; Peters, D.W.H. The effect of zonal asymmetries in the Brewer-Dobson circulation on ozone and water vapor distributions in the northern middle atmosphere. J. Geophys. Res. Atmos. 2013, 118, 3447–3466. [Google Scholar] [CrossRef]
  20. Waugh, D.W.; Randel, W.J. Climatology of Arctic and Antarctic polar vortices using elliptical diagnostics. J. Atmos. Sci. 1999, 56, 1594–1613. [Google Scholar] [CrossRef]
  21. Grytsai, A.V.; Evtushevsky, O.M.; Agapitov, O.V.; Klekociuk, A.R.; Milinevsky, G.P. Structure and long-term change in the zonal asymmetry in Antarctic total ozone during spring. Ann. Geophys. 2007, 25, 361–374. [Google Scholar] [CrossRef] [Green Version]
  22. Salby, M.L.; Callaghan, P.F. Interannual changes of the stratospheric circulation: Relationship to ozone and tropospheric structure. J. Clim. 2002, 15, 3673–3685. [Google Scholar] [CrossRef]
  23. Sekiguchi, Y.; Kida, H. The seasonal variation of total ozone amount in middle latitudes. J. Meteorol. Soc. Jpn. 1971, 49, 95–110. [Google Scholar] [CrossRef] [Green Version]
  24. Rieder, H.E.; Jancso, L.M.; Di Rocco, S.; Staehelin, J.; Maeder, J.A.; Peter, T.; Ribatet, M.; Davison, A.C.; De Backer, H.; Koehler, U.; et al. Extreme events in total ozone over the Northern mid-latitudes: An analysis based on long-term data sets from five European ground-based stations. Tellus B 2011, 63, 860–874. [Google Scholar] [CrossRef]
  25. Bowman, K.P.; Krueger, A.J. A global climatology of total ozone from the Nimbus 7 total ozone mapping spectrometer. J. Geophys. Res. 1985, 90, 7967–7976. [Google Scholar] [CrossRef]
  26. Fioletov, V.E.; Shepherd, T.G. Seasonal persistence of midlatitude total ozone anomalies. Geophys. Res. Lett. 2003, 30, 1417. [Google Scholar] [CrossRef] [Green Version]
  27. Miyazaki, K.; Iwasaki, T.; Shibata, K.; Deushi, M. Roles of transport in the seasonal variation of the total ozone amount. J. Geophys. Res. 2005, 110, D18309. [Google Scholar] [CrossRef]
  28. Tegtmeier, S.; Fioletov, V.E.; Shepherd, T.G. A global picture of the seasonal persistence of stratospheric ozone anomalies. J. Geophys. Res. 2010, 115, D18119. [Google Scholar] [CrossRef]
  29. Coldewey-Egbers, M.; Loyola, D.G.; Labow, G.; Frith, S.M. Comparison of GTO-ECV and adjusted MERRA-2 total ozone columns from the last 2 decades and assessment of interannual variability. Atmos. Meas. Tech. 2020, 13, 1633–1654. [Google Scholar] [CrossRef] [Green Version]
  30. Krzyścin, J.W.; Rajewska-Więch, B.; Jarosławski, J. The long-term variability of atmospheric ozone from the 50-yr observations carried out at Belsk (51.84°N, 20.78°E), Poland. Tellus B 2013, 65, 21779. [Google Scholar] [CrossRef] [Green Version]
  31. Eleftheratos, K.; Kouklaki, D.; Zerefos, C. Sixteen years of measurements of ozone over Athens, Greece with a Brewer spectrophotometer. Oxygen 2021, 1, 32–45. [Google Scholar] [CrossRef]
  32. Iwasaki, T.; Kaneto, S. Photochemical and dynamical contributions to the seasonal variation of total ozone amount over Japan. J. Meteorol. Soc. Jpn. 1984, 62, 343–356. [Google Scholar] [CrossRef] [Green Version]
  33. Antón, M.; Bortoli, D.; Costa, M.J.; Kulkarni, P.S.; Domingues, A.F.; Barriopedro, D.; Serrano, A.; Silva, A.M. Temporal and spatial variabilities of total ozone column over Portugal. Remote Sens. Environ. 2011, 115, 855–863. [Google Scholar] [CrossRef]
  34. Zou, H.; Zhou, L.; Gao, Y.; Chen, X.; Li, P.; Ji, C.; Ma, S.; Gao, D. Total ozone variation between 50° and 60°N. Geophys. Res. Lett. 2005, 32, L23812. [Google Scholar] [CrossRef] [Green Version]
  35. Evtushevsky, O.; Grytsai, A.; Milinevsky, G. On the regional distinctions in annual cycle of total ozone in the northern midlatitudes. Remote Sens. Lett. 2014, 5, 205–212. [Google Scholar] [CrossRef]
  36. Zhang, J.; Tian, W.; Xie, F.; Sang, W.; Guo, D.; Chipperfield, M.; Feng, W.; Hu, D. Zonally asymmetric trends of winter total column ozone in the northern middle latitudes. Clim. Dyn. 2019, 52, 4483–4500. [Google Scholar] [CrossRef] [Green Version]
  37. Livesey, N.J.; Read, W.G.; Wagner, P.A.; Froidevaux, L.; Lambert, A.; Manney, G.L.; Millán Valle, L.F.; Pumphrey, H.C.; Santee, M.L.; Schwartz, M.J.; et al. Version 4.2x Level 2 and 3 Data Quality and Description Document; Jet Propulsion Laboratory: Pasadena, CA, USA, 2020; 174p. Available online: https://mls.jpl.nasa.gov/data/v4-2_data_quality_document.pdf (accessed on 20 January 2022).
  38. Xu, X.; Manson, A.H.; Meek, C.E.; Chshyolkova, T.; Drummond, J.R.; Hall, C.M.; Riggin, D.M.; Hibbins, R.E. Vertical and interhemispheric links in the stratosphere-mesosphere as revealed by the day-to-day variability of Aura-MLS temperature data. Ann. Geophys. 2009, 27, 3387–3409. [Google Scholar] [CrossRef] [Green Version]
  39. Schwartz, M.; Livesey, N.; Read, W. MLS/Aura Level 2 Geopotential Height V004, Greenbelt, MD, USA, Goddard Earth Sciences Data and Information Services Center (GES DISC). 2015. Available online: https://disc.gsfc.nasa.gov/datasets/ML2GPH_004/summary/ (accessed on 9 February 2022).
  40. Schwartz, M.; Froidevaux, L.; Livesey, N.; Read, W. MLS/Aura Level 2 Ozone (O3) Mixing Ratio V004, Greenbelt, MD, USA, Goddard Earth Sciences Data and Information Services Center (GES DISC). 2015. Available online: https://disc.gsfc.nasa.gov/datasets/ML2O3_004/summary/ (accessed on 15 December 2021).
  41. Wang, Y.; Shulga, V.; Milinevsky, G.; Patoka, A.; Evtushevsky, O.; Klekociuk, A.; Han, W.; Grytsai, A.; Shulga, D.; Myshenko, V.; et al. Winter 2018 major sudden stratospheric warming impact on midlatitude mesosphere from microwave radiometer measurements. Atmos. Chem. Phys. 2019, 19, 10303–10317. [Google Scholar] [CrossRef] [Green Version]
  42. Shi, Y.; Shulga, V.; Ivaniha, O.; Wang, Y.; Evtushevsky, O.; Milinevsky, G.; Klekociuk, A.; Patoka, A.; Han, W.; Shulga, D. Comparison of major sudden stratospheric warming impacts on the mid-latitude mesosphere based on local microwave radiometer CO observations in 2018 and 2019. Remote Sens. 2020, 12, 3950. [Google Scholar] [CrossRef]
  43. WOUDC: The World Ozone and Ultraviolet Radiation Data Centre, Longfengshan Station, ID 326, Brewer Spectrophotometer, China. Available online: https://woudc.org/data/explore.php# (accessed on 9 February 2022).
  44. Hoinka, K.P. Statistics of the global tropopause pressure. Mon. Weather Rev. 1998, 126, 3303–3325. [Google Scholar] [CrossRef]
  45. Harvey, V.L.; Hitchman, M.H. A climatology of the Aleutian High. J. Atmos. Sci. 1996, 53, 2088–2102. [Google Scholar] [CrossRef] [Green Version]
  46. Kosaka, Y.; Nakamura, H. Mechanisms of meridional teleconnection observed between a summer monsoon system and a subtropical anticyclone. Part I: The Pacific–Japan pattern. J. Clim. 2010, 23, 5085–5108. [Google Scholar] [CrossRef]
  47. Boville, B.W. The Aleutian stratospheric anticyclone. J. Atmos. Sci. 1960, 17, 329–336. [Google Scholar] [CrossRef] [Green Version]
  48. France, J.A.; Harvey, V.L.; Randall, C.E.; Hitchman, M.H.; Schwartz, M.J. A climatology of stratopause temperature and height in the polar vortex and anticyclones. J. Geophys. Res. 2012, 117, D06116. [Google Scholar] [CrossRef] [Green Version]
  49. Serreze, M.C.; Carse, F.; Barry, R.G.; Rogers, J.C. Icelandic Low cyclone activity: Climatological features, linkages with the NAO, and relationships with recent changes in the Northern Hemisphere circulation. J. Clim. 1997, 10, 453–464. [Google Scholar] [CrossRef]
  50. Nigam, S.; DeWeaver, E. Stationary waves (orographic and thermally forced). In Encyclopedia of Atmospheric Sciences; James, R.H., Pyle, J., Judith, A.C., Eds.; Academic Press: Cambridge, MA, USA; Elsevier Science: London, UK, 2003; pp. 2121–2137. [Google Scholar] [CrossRef]
  51. Volodin, E.M.; Schmitz, G. A troposphere–stratosphere–mesosphere general circulation model with parameterization of gravity waves: Climatology and sensitivity studies. Tellus A Dyn. Meteorol. Oceanogr. 2001, 53, 300–316. [Google Scholar] [CrossRef] [Green Version]
  52. France, J.A.; Harvey, V.L.; Randall, C.E.; Collins, R.L.; Smith, A.K.; Peck, E.D.; Fang, X. A climatology of planetary wave-driven mesospheric inversion layers in the extratropical winter. J. Geophys. Res. Atmos. 2015, 120, 399–413. [Google Scholar] [CrossRef]
  53. Smith, A.K. Stationary planetary waves in upper mesospheric winds. J. Atmos. Sci. 1997, 54, 2129–2145. [Google Scholar] [CrossRef]
  54. Sugita, T.; Nakajima, H.; Yokota, T.; Kanzawa, H.; Gernandt, H.; Herber, A.; von der Gathen, P.; König-Langlo, G.; Sato, K.; Dorokhov, V.; et al. Ozone profiles in the high-latitude stratosphere and lower mesosphere measured by the Improved Limb Atmospheric Spectrometer (ILAS)-II: Comparison with other satellite sensors and ozonesondes. J. Geophys. Res. 2006, 111, D11S02. [Google Scholar] [CrossRef] [Green Version]
  55. Maeda, K. Annual and semiannual oscillations of stratospheric ozone. Pure Appl. Geophys. 1987, 125, 147–165. [Google Scholar] [CrossRef]
  56. Moreira, L.; Hocke, K.; Navas-Guzmán, F.; Eckert, E.; von Clarmann, T.; Kämpfer, N. The natural oscillations in stratospheric ozone observed by the GROMOS microwave radiometer at the NDACC station Bern. Atmos. Chem. Phys. 2016, 16, 10455–10467. [Google Scholar] [CrossRef] [Green Version]
  57. Joshi, V.; Sharma, S.; Kumar, K.N.; Patel, N.; Kumar, P.; Bencherif, H.; Ghosh, P.; Jethva, C.; Vaishnav, R. Analysis of the middle atmospheric ozone using SABER observations: A study over mid-latitudes in the northern and southern hemispheres. Clim. Dyn. 2020, 54, 2481–2492. [Google Scholar] [CrossRef]
  58. Dütsch, H.U. The ozone distribution in the atmosphere. Can. J. Chem. 1974, 52, 1491–1504. [Google Scholar] [CrossRef]
  59. Prather, M.J. Ozone in the upper stratosphere and mesosphere. J. Geophys. Res. 1981, 86, 5325–5338. [Google Scholar] [CrossRef]
  60. Tummon, F.; Hassler, B.; Harris, N.R.P.; Staehelin, J.; Steinbrecht, W.; Anderson, J.; Bodeker, G.E.; Bourassa, A.; Davis, S.M.; Degenstein, D.; et al. Intercomparison of vertically resolved merged satellite ozone data sets: Interannual variability and long-term trends. Atmos. Chem. Phys. 2015, 15, 3021–3043. [Google Scholar] [CrossRef] [Green Version]
  61. Smith, A.K.; Marsh, D.R. Processes that account for the ozone maximum at the mesopause. J. Geophys. Res. 2005, 110, D23305. [Google Scholar] [CrossRef] [Green Version]
  62. Huang, F.T.; Mayr, H.G.; Reber, C.A.; Russell, J.M., III; Mlynczak, M.G.; Mengel, J.G. Ozone quasi-biennial oscillations (QBO), semiannual oscillations (SAO), and correlations with temperature in the mesosphere, lower thermosphere, and stratosphere, based on measurements from SABER on TIMED and MLS on UARS. J. Geophys. Res. 2008, 113, A01316. [Google Scholar] [CrossRef] [Green Version]
  63. Smith, A.K. The origin of stationary planetary waves in the upper mesosphere. J. Atmos. Sci. 2003, 60, 3033–3041. [Google Scholar] [CrossRef]
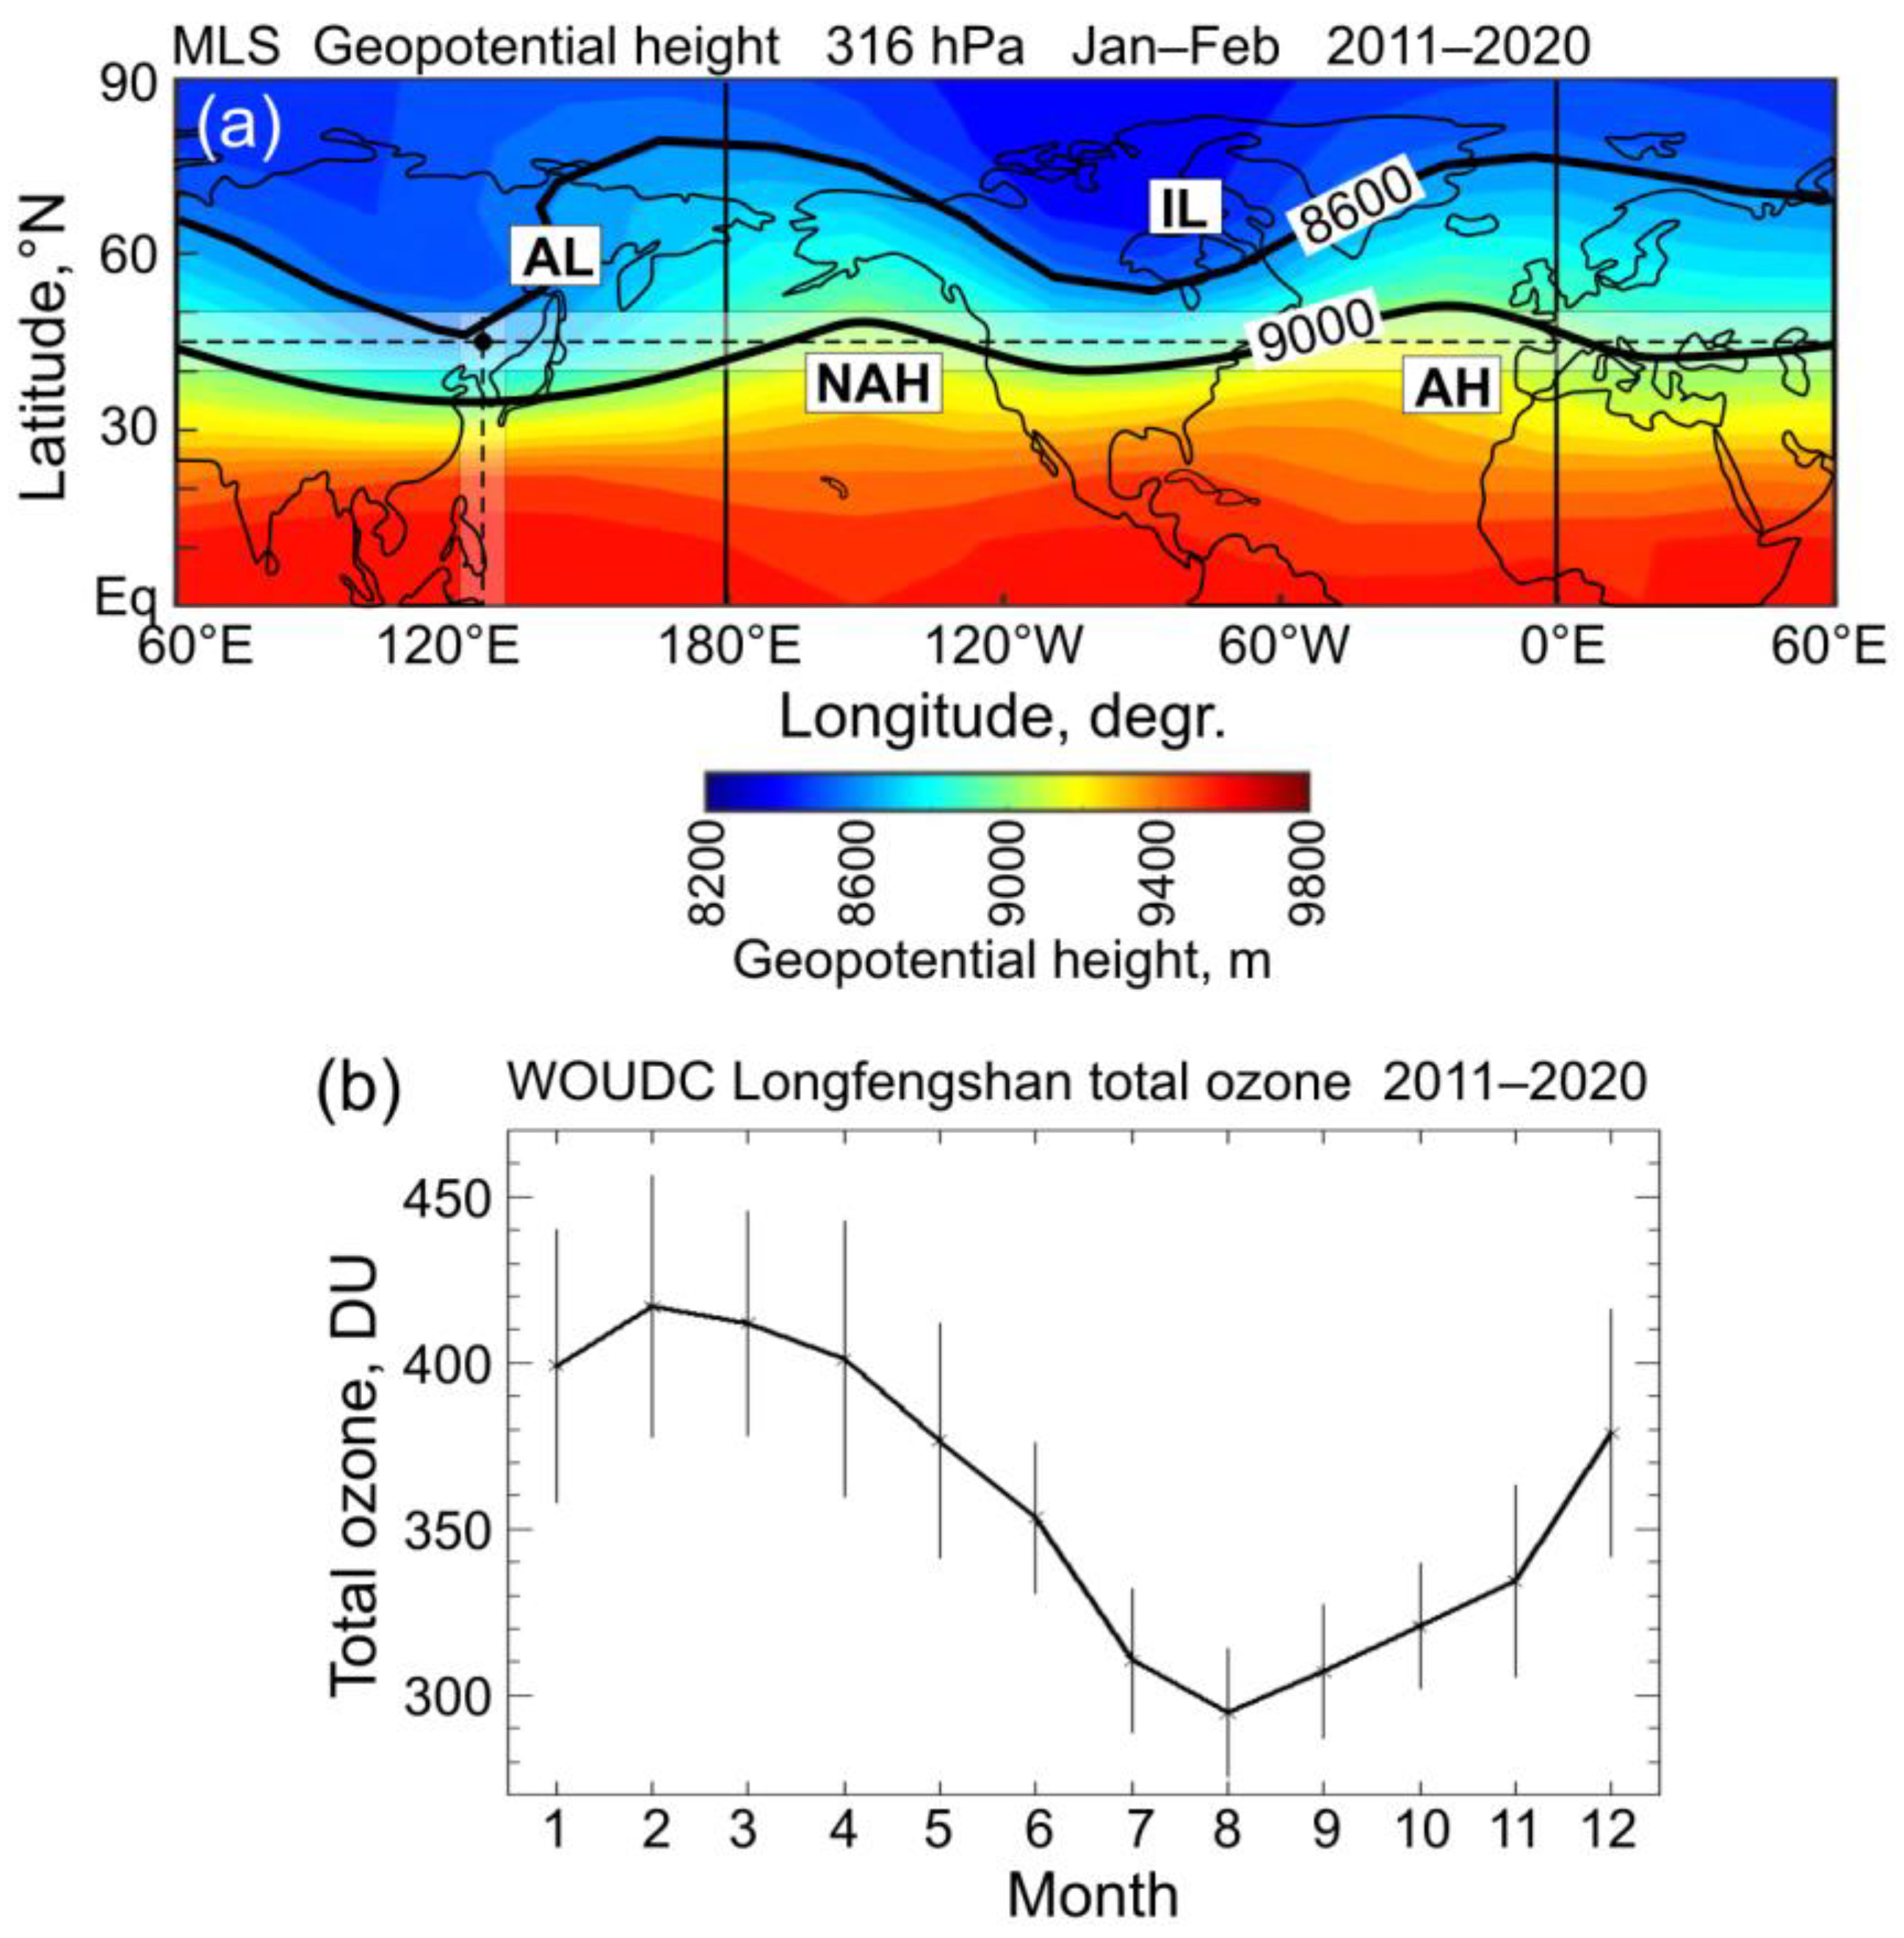
Figure 1. (a) Climatological geopotential height in the northern Hemisphere at 316 hPa from the Aura MLS data averaged over January–February 2011–2020. Light stripes indicate zone (40–50°N) and longitude segment (122–132°E), which are centered at Longfengshan station, China (44.73°N, 127.60°E; dashed lines and black circle) and analyzed with respect to the QSW structure and ozone annual cycle. Solid curves Z8600 and Z9000 display zonal wave 2 in the QSW structure. The main atmospheric centers of action are indicated: AL is Aleutian Low, IL is Icelandic Low, NAH is North American High, and AH is Azores High. (b) Monthly mean total ozone with standard deviations (shown by vertical lines) as observed at the Longfengshan station in 2011–2020 (except for 2014–2015 due to the lack of observations during this period); from the WOUDC data [43].
Remotesensing 14 02309 g001
Figure 2. (a) Longitudinal distribution of geopotential height at 10 pressure levels between 2 and 96 km. Averaging was made for January–February 2011–2020 in the zone 40–50°N. Vertical red (blue) bars indicate maximum positive (minimum negative) Z anomalies relative to the zonal mean level. Vertical lines at 122–132°E show the Longfengshan region, China, being analyzed for the annual ozone cycle. AL and IL are Aleutian and Icelandic Lows, AH, NAH and SH are Azores, North American and Siberian Highs. At the bottom of (a), the Pacific and Atlantic longitude segments in the 40–50°N zone are marked with light-blue rectangles. (b) Dependence of the maximum positive Z anomalies on the altitude.
Remotesensing 14 02309 g002
Figure 3. (a) Longitudinal distribution of ozone volume mixing ratio at nine pressure levels between 9 and 96 km in the stratosphere and mesosphere. Averaging was made for January–February 2011–2020 in zone 40–50°N. Vertical red (blue) bars indicate maximum positive (minimum negative) VMR anomalies relative to the zonal mean. Red arrows show ozone maxima over AL and IL. Vertical lines at 122–132°E show the Longfengshan region, China, being analyzed for the annual ozone cycle. At the bottom of (a), the Pacific and Atlantic longitude segments in the 40–50°N zone are marked with light-blue rectangles. (b) Dependence of the maximum positive VMR anomalies on the altitude. Percentages relative to the zonal mean are indicated on the right.
Remotesensing 14 02309 g003
Table 1. Correlation coefficients r between anomalies of geopotential height (Figure 2a) and ozone (Figure 3a); r-values significant at the 99% confidence level are in bold.
Pressure Level, hPaCorrelation Coefficient, r
0.0010.16
0.01−0.19
0.10.17
1−0.36
3.160.07
100.03
260.92
100−0.85
316−0.47
Publisher’s Note: MDPI stays neutral with regard to jurisdictional claims in published maps and institutional affiliations.