Review

A Comprehensive Survey of Alkaline Electrolyzer Modeling: Electrical Domain and Specific Electrolyte Conductivity

1
Group of Research in Electrical Engineering of Nancy (GREEN), Université de Lorraine, F-54000 Nancy, France
2
Research Center for Automatic Control of Nancy (CRAN), UMR CNRS 7039, Université de Lorraine, F-54000 Nancy, France
*
Author to whom correspondence should be addressed.
Energies 2022, 15(9), 3452; https://doi.org/10.3390/en15093452
Submission received: 4 April 2022 / Revised: 3 May 2022 / Accepted: 6 May 2022 / Published: 9 May 2022
(This article belongs to the Special Issue Fuel Cell Renewable Hybrid Power Systems 2021)

Abstract

:
Alkaline electrolyzers are the most widespread technology due to their maturity, low cost, and large capacity in generating hydrogen. However, compared to proton exchange membrane (PEM) electrolyzers, they request the use of potassium hydroxide (KOH) or sodium hydroxide (NaOH) since the electrolyte relies on a liquid solution. For this reason, the performances of alkaline electrolyzers are governed by the electrolyte concentration and operating temperature. Due to the growing development of the water electrolysis process based on alkaline electrolyzers to generate green hydrogen from renewable energy sources, the main purpose of this paper is to carry out a comprehensive survey on alkaline electrolyzers, and more specifically about their electrical domain and specific electrolytic conductivity. Besides, this survey will allow emphasizing the remaining key issues from the modeling point of view.

1. Introduction

The recent report “Climate Change 2022” established by the intergovernmental panel on climate change (IPCC) has concluded that climate change has been happening faster than expected, mainly due to human activities [1]. Besides, the report has highlighted the harmful effects of climate change such as temperature and water level increasing, health issues, and reduction in the availability of water and food resources. To minimize the effects of the climate change, the experts of IPCC have recommended replacing fossil fuels with low-carbon energy sources such as nuclear, renewable energy sources (RES) (e.g., hydroelectricity, wind, photovoltaic), and developing further carbon dioxide reduction solutions (e.g., tree planting, carbon capture, storage, and use (CCSU)).
In this context to face climate change, hydrogen seems to be the best and most suitable alternative for fossil-based energy sources since its consumption does not emit methane and carbon dioxide, but produces only water [2,3]. This makes hydrogen one of the cleanest fuels in the world and essential for achieving a pollution-free by 2050 according to the European Union’s (EU) commitment. Unfortunately, its production is still largely dominated by fossil fuels (specifically natural gas) [4,5,6,7]. Only a small amount is produced through the water electrolysis process, which uses electricity to split water into hydrogen and oxygen. To contribute to climate neutrality, hydrogen production must require electricity coming from RES or nuclear [8]. As hydrogen is applied in various energy-intensive sectors such as transport, industry, electricity, and buildings, it offers enormous solutions in the reduction of greenhouse gas emissions [6,9]. For clean and efficient power generation, fuel cells can be employed supplied by hydrogen and oxygen for which the reaction releases only heat and water. There are several fuel cell technologies currently under development, each of which presents its own benefits, limitations, and prospective applications. One of them, the proton exchange membrane (PEM) fuel cell proposes a high-power density, a solid polymer as an electrolyte, and low-temperature operation (around 80 °C), enabling it to start quickly and contributing to less deterioration of systems components (leading to better durability) [10].
For this reason, the hydrogen strategy set by the EU is to install in Europe at least 6 GW of renewable hydrogen electrolyzers by 2024, and 40 GW by 2030 [7]. Hence, the goal is to decrease greenhouse gas emissions by at least 55% by 2030.
Electrolyzers are electrochemical devices used to produce hydrogen through water electrolysis. At the present moment, there are four electrolyzer technologies: alkaline electrolyzer, PEM electrolyzer, solid oxide (SO) electrolyzer, and anion exchange membrane (AEM) electrolyzer recently introduced in the literature to eliminate the weaknesses of alkaline and PEM electrolyzers [8,11,12]. Only the two first technologies are commercially available in the market and widely used; while the two remaining are still under investigation since they are not enough mature to be accepted and employed in research projects [12].
The alkaline electrolyzer technology has been used for over a century. Its principle is based on the use of two electrodes immersed in an electrolyte solution of potassium hydroxide (KOH) or sodium hydroxide (NaOH). A membrane called the diaphragm separates the two electrodes and allows the hydroxide ions (OH) to move from the cathode to the anode [13,14]. In the literature, alkaline technology relying on an acidic electrolyte has been introduced, highlighting the hydrogen evolution reaction (HER) performance to make efficient, stable, and hydrogen evolution catalysts [15,16]. The advantage of this technology is that the electrodes are made of cheaper catalysts such as cobalt, nickel, or iron. Moreover, it has high durability and gas purity [11]. Unfortunately, it operates at a low current density lying between 0.2 and 0.7 A·cm2, making it less compact than PEM electrolyzers. Furthermore, the production capacity dynamic range is set between 15 and 100%, which prevents alkaline electrolyzers from being fully exploited in RES operations. Finally, the aqueous solution of the electrolyte (KOH or NaOH) leads up to regular checks and maintenance to guarantee safe operations and the performance of the system [11].
The PEM electrolyzers were first developed in the 1960s to overcome some of the disadvantages of the alkaline electrolyzer. They are composed of a solid polymer electrolyte (SPE) separating the anode from the cathode and allowing protons (H+) to be diffused from the anode to the cathode. The catalyst material on the anode and the cathode side are, respectively, iridium and platinum, which are noble and expensive materials [3]. On one hand, the main advantages of this technology over alkaline technology are high current densities, low maintenance, and large production capacity dynamic range (0–100%) [17]. On the other hand, the output hydrogen pressure is quite limited (around 30 bar); whereas for alkaline electrolyzers, the pressure can go up to 200 bar at the same rated power. Given that this technology has not yet reached a certain level of maturity, its performances (e.g., specific energy consumption, hydrogen production rate, lifespan) are below those met by alkaline electrolyzers. For this reason, this technology is currently being investigated by researchers to compete from the performance point of view with alkaline electrolyzers [18].
Recently, several review works have been reported for PEM electrolyzers. These reviews deal with modeling aspects, novel components, cell failure mechanisms, and technology [2,3,19,20,21]. On the other side, a few reviews can be found for alkaline electrolyzers. In [11], the authors have focused their investigation on the technology while providing research perspectives to enhance its performance and dissemination. In comparison, in [22], the authors have reviewed and analyzed the coupling between alkaline electrolyzers and RES (wind, solar); whereas in [23], the authors have analyzed the influence of the parameters (e.g., geometry, electrolyte composition, electrocatalysts) on the efficiency of alkaline electrolyzers. Relying on the current literature, the main goal of this paper is to review alkaline electrolyzer modeling from the electrical domain point of view. Besides, given that the alkaline electrolyzer performances are strongly linked with the specific electrolyte conductivity of the aqueous solution, their modeling according to the temperature and mass fraction of KOH or NaOH is considered in this review work. Hence, it allows bringing out the remaining key issues from the modeling point of view.
It is important to point out that electrolyzer modeling is crucial to predict their behaviors in static and dynamic conditions for simulation purposes when connecting with wind turbines, photovoltaic panels, and power grids. Besides, electrolyzers are coupled with power conditioning systems such as AC-DC and DC-DC converters to manage their operation. The knowledge of their modeling allows designing fit, robust, efficient controllers to optimize the operation of the electrolyzers from the energy efficiency point of view. Finally, the modeling has also the purpose to optimally design alkaline electrolyzers by considering the parameters affecting their energy efficiency [23].
The paper is divided into four sections. After reviewing alkaline and PEM technologies while highlighting the reported review works on both technologies, Section 2 summarizes the principle of operation, features, and static and dynamic operations of alkaline electrolyzers and a comparison is provided with PEM electrolyzer technology. Then, in the third section, a detailed synthesis of alkaline electrolyzer modeling including electrical domain and specific electrolyte conductivity is provided. Finally, in Section 4, a conclusion is provided enabling giving the remaining key issues for alkaline electrolyzer modeling.

2. Alkaline Electrolyser Technology

2.1. Operation and Characteristics

As pointed out in the introduction, among the four existing water technologies, only two are available in the market such as alkaline, PEM; whereas SO and AEM are still being investigated before widespread acceptance and dissemination [24,25]. In this review work, alkaline water electrolysis technology is considered since it is currently being employed in many research projects such as the development of carbon-free hydrogen production facilities supplied by renewable sources [26,27]. Similar to fuel cells, electrolyzers performing the water electrolysis process are composed of an anode and a cathode separated by an electrolyte. In the case of the alkaline electrolyzer, the electrolyte is based on a liquid solution that may be potassium hydroxide (KOH) or sodium hydroxide (NaOH) [11]. Generally, alkaline electrolyzer manufacturers prefer to use KOH instead of NaOH since an aqueous solution with 25–30 wt.% KOH features a higher specific electrolyte conductivity at a standard temperature range from 50 to 80 °C [22]. The principle of operation of the alkaline water electrolysis is provided in Figure 1; while the equations of the chemical reactions are given in Equations (1)–(3) below:
Anode : 2 O H 1 2 O 2 + H 2 O + 2 e
Cathode :   2 H 2 O + 2 e H 2 + 2 O H
Global :   2 H 2 O 2 H 2 + O 2
Based on Figure 1 and the chemical reactions, pure water mixed with KOH is supplied at the cathode side. The water reacts with electrons generating hydroxide ions (OH) and hydrogen (H2) at the cathode side. Then, hydroxide ions are transported to the anode side through the liquid electrolyte, whereas electrons migrate to the anode side via the gas diffusion layer (GDL). On the anode side, oxygen is produced.
To highlight the strengths, weaknesses, opportunities, and threats of alkaline technology, a SWOT analysis has been carried out and reported in Table 1. Despite that alkaline technology features several advantages, it presents several weaknesses such as limited current density, frequent maintenance (liquid electrolyte), and limited production capacity dynamic range [6]. However, some opportunities might enhance the performance and hydrogen production of the technology by using new materials and designing stacks differently [23,24].
Moreover, the growing interest from industry and researchers in PEM electrolyzers might threaten the widespread dissemination of alkaline electrolyzers. Indeed, PEM electrolyzers have been introduced in the 1960s to compete with alkaline electrolyzers to eliminate some of their disadvantages cited above. The SWOT analysis of PEM technology is provided in Table 2. They present several benefits over alkaline electrolyzers from the current density, maintenance, hydrogen production capacity, and production capacity dynamic range point of view [3]. On the other side, this technology suffers from having a high cost due to the use of platinum group metals (PGM) such as iridium on the anode side for the oxygen evolution reaction, and platinum on the cathode side for the hydrogen evolution reaction [28]. Besides, the operating pressure is lower compared to the alkaline electrolyzer (50 bar against 200 bar), and the specific energy consumption is higher (more than 20%) [8]. Furthermore, the challenges are the drastic decrease of PGM-based catalyst loading [29,30], the dissemination of effective recycling facilities for PGM-based catalysts [28], enhancement of long-term stability, lifetime, and scaling up single cells (>1000 cm2) [31].
Finally, relying on the current state-of-the-art (research papers, alkaline and PEM electrolyzer manufacturers) [9,22,32], Table 3 summarizes the main features of alkaline and PEM technologies. From Table 3, it can be noted that alkaline electrolyzers can generate hydrogen at very high pressure (up to 200 bar against 30 bar for PEM electrolyzers at the same rated power of 2 MW from NEL company). High-pressure hydrogen production is an important issue since hydrogen is stored under gaseous form at 700 bar in storage tanks embedded in commercial fuel cell electric vehicles (FCEVs) [33]. In any case, compressors are requested to meet the high-pressure requirements of FCEVs. Furthermore, since the technology is mature over PEM electrolyzers, the best performance can be obtained such as low specific energy consumption, high hydrogen volume rate, and lifetime. The main drawbacks reported concern the low current density (up to 0.7 A·cm−2 making the electrolyzer bulky) and set production capacity dynamic range (limiting operating conditions to generate hydrogen). The system efficiency is assessed by considering the stack efficiency range and the losses from power electronics (around 5%) with the use of AC-DC converters such as thyristors or transistors-based rectifiers [34,35].

2.2. Static and Dynamic Operation

Before reviewing the electrical domain modeling of alkaline electrolyzers in the next section, it is crucial to show their static and dynamic characterization. Hence, an experimental test bench has been realized at the GREEN laboratory, IUT de Longwy (Cosnes-et-Romain, France), to perform static and dynamic tests on a single cell alkaline electrolyzer as shown in Figure 2. The technical specifications of the electrolyzer are summarized in Table 4.
The realized experimental test bench includes the following devices: (1) a single-cell alkaline electrolyzer, (2) a 4-channel oscilloscope, (3) a DC power supply, (4) a laptop enabling the control of the DC power supply for static and dynamic tests purposes, (5) a voltage probe to acquire the cell voltage of the electrolyzer, (6) a current probe to measure the cell current of the electrolyzer, and (7) an isolated transformer to eliminate the interference and noise from the power grid. To enable the good operation of the single-cell alkaline electrolyzer, 1000 mL of distilled water has been mixed with 32% weight KOH as requested by the electrolyzer manufacturer. When the lye liquid has been fully melted, it has been put in a tank to supply the alkaline electrolyzer. Besides, the KOH purity is 85%. Once the hydrogen is generated, it is stored in metal hydride storage tanks (not shown in Figure 2), enabling meeting safety recommendations for hydrogen storage.
First of all, the static characterization of the single-cell alkaline electrolyzer is depicted in Figure 3. This characterization allows emphasizing the two main overvoltage regions, the first from 0 to 2 A (activation region), and the second from 2 to 45 A (ohmic region). The reversible voltage at zero-current is roughly equal to 1.6 V. The ohmic overvoltage is influenced by different parameters such as the electrical conductivity of both electrodes (i.e., anode and cathode), the specific electrolyte conductivity, distances between the electrodes, and hydrogen and oxygen bubbles that cover some parts of the surface of the electrodes.
After performing a static characterization of the alkaline electrolyzer, dynamic tests have been carried out. Rise and falling current steps (from 20 to 40 A, and inversely) have been applied to the single-cell alkaline electrolyzer. The results are shown in Figure 4. It can be noted that the single-cell alkaline electrolyzer responds quickly when changing operating conditions. Indeed, in both cases, the steady-state cell voltage operation is reached in 0.24 ms. Both tests demonstrate that the specific electrolyte conductivity is suitable to meet dynamic performance, as required when connecting alkaline electrolyzers to intermittent green energy sources such as RES [36].
Finally, a test with dynamic solicitations has been performed to highlight the performance of the studied alkaline electrolyzer. This test includes a rise current step (from 20 to 45 A) at 9 s, then a falling current step (from 45 to 10 A) at 32 s, and finally a rise current step (from 10 to 30 A) at 70 s as illustrated in Figure 5. In conclusion, dynamic performances are met when the alkaline electrolyzer is solicited by sudden operating conditions change.

3. Electrical Domain Modeling

Over the last decades, the modeling of alkaline electrolyzers has attracted a lot of investigation from researchers to develop the use of this technology at a large scale powered by RES. However, as mentioned in the introduction, alkaline electrolyzers have received less modeling investigation than PEM electrolyzers. This difference may be explained by the benefits of using PEM electrolyzers over alkaline electrolyzers from the high current density, low maintenance, and large partial load range point of view. Besides, compared to PEM electrolyzers, no review works have been reported in the literature regarding alkaline electrolyzers modeling. Only three reviews can be found, dealing with the technology, its coupling with RES, and the effects of the parameters on the energy efficiency. Given that this review work is focused on electrical domain modeling, this section has been split into three main parts: semi-empirical, empirical, and dynamic modeling. This section aims at providing valuable information and guidelines to industrials, researchers, and students to model alkaline electrolyzers from the electrical domain point of view.

3.1. Static Modeling

3.1.1. Introduction

First of all, the performance of the alkaline electrolyzer is linked to its polarization curve as shown in Figure 3. From Figure 3, the higher the current, the higher the cell voltage due to the overvoltages. At zero-current, the cell voltage is equal to the reversible voltage Vrev. At very low currents (up to 2 A), the activation overvoltages (anode and cathode) are preponderant, while from 2 A and above, the ohmic region is predominant. The reversible voltage, the activation, and the ohmic overvoltages depend strongly on the temperature, gas pressures, and the electrical conductivity of both electrodes (i.e., anode and cathode), the specific electrolyte conductivity, distances between the electrodes, and hydrogen and oxygen bubbles that envelops some areas of the surface of the electrodes. Hence, the cell voltage Vcell of the alkaline electrolyzer can be expressed by the general expression in Equation (4) below:
V c e l l = V r e v + η o h m + η a c t , a + η a c t , c
where Vrev (V) is the reversible voltage, ηohm (V) is the ohmic overvoltage, ηact,a (V) and ηact,c (V) are, respectively, the activation overvoltage at the anode and the cathode.
In the next subsections, the semi-empirical, empirical, and dynamic modeling is detailed and analyzed.

3.1.2. Semi-Empirical Modeling

Several semi-empirical equations for alkaline electrolyzers have been used to model the current-voltage curve. One of the most used semi-empirical models was first described by Ulleberg [37]. The model combines thermodynamics, kinetics, and resistive effects of the electrolyzer. The basic form of the current-voltage curve is given in Equation (5) [22,37]:
V c e l l = V r e v + r · ( i e l A e l e c ) + s · log [ t · ( i e l A e l e c ) + 1 ]
where Vrev (V) is the reversible voltage, the second term is the ohmic overvoltage defined by its parameter r (Ω m2) and the last term represents the activation overvoltage defined by the parameters s (V) and t (m2 A−1). The current absorbed by the electrolyzer is represented by iel (A), while Aelec (m2) stands for the cell electrode area. The term iel/Aelec (A m−2) is the current density that can be replaced by j (A m−2).
Based on the article Ref. [38], the performance of the alkaline electrolyzer highly depends on its operating temperature. Therefore, to improve the above semi-empirical model, the temperature effect must be considered. As reported in Ref. [39], only the two parameters r and t depend on the temperature while the parameter s is usually assumed to be constant. Considering the electrolyzer operating temperature, Ulleberg’s model in Equation (5) can be modified as expressed in the following Equation (6):
V c e l l = V r e v + ( r 1 + r 2 · θ ) · j + s · log [ ( t 1 + t 2 θ + t 3 θ 2 ) · j + 1 ]
where θ (°C) is the operating temperature, r1 (Ω m2) and r2 (Ω m2 °C−1) reflect ohmic losses, t1 (m2 A−1), t2 (m2 A−1 °C) and t3 (m2 A−1 °C2) are related to the activation overvoltages and j (A m−2) is the current density [22].
Gas pressure also influences the performance of the alkaline electrolyzer [22,38]. Considering also the gas pressure P (bar), the above Ulleberg’s equation can be expressed in Equation (7) as:
V c e l l = V r e v + [ ( r 1 + δ 1 ) + r 2 · θ + δ 2 · P ] · j + s · log [ ( t 1 + t 2 θ + t 3 θ 2 ) · j + 1 ]
Equation (7) introduces new empirical parameters δ1 (Ω m2) and δ2 (Ω m2 bar−1), which are related to the linear change in the ohmic overvoltage.
Many authors have demonstrated that the distance electrode-diaphragm d (mm) [40] and the electrolyte molarity concentration M (mol L−1) have a significant influence on the alkaline electrolyzer performances. The ohmic losses depend on the electrode-diaphragm distance d and the electrolyte molarity concentration M. To obtain an accurate equation for the current-voltage curve, these two new parameters must be examined. Thus, the resulting semi-empirical model is given by Equation (8) below:
V c e l l = V r e v + [ ( r 1 + p 1 + q 1 ) + r 2 · θ + p 2 M + p 3 M 2 + q 2 · d ] · j + s · log [ ( t 1 + t 2 θ + t 3 θ 2 ) · j + 1 ]
where p1 (Ω m2), p2 (Ω m2 mol−1 L), and p3 (Ω m2 mol−2 L2) represent the ohmic drops due to the electrolyte concentration, q1 (Ω m2) and q2 (Ω m2 mm−1) represent the ohmic losses due to the electrode-diaphragm distance.
To determine the different parameters in Equations (6)–(8), experimental data are compared to the model through the use of a numerical regression method mainly based on least square algorithms [41,42,43]. Relying on previous works carried out to determine the parameters of the models (6)–(8), Table 5 has been made to summarize the values of the different parameters.
In [22,37,38,40], the authors have shown curves on which the experimental results and the results predicted by the models are very close, but, except for [40] where the average error obtained using Equation (8) is less than 0.8%, there is no numerical values associated with the analysis on these errors. Considering the experimental results and the predicted behavior of the electrolyzer, one can conjecture that the proposed classes of models are valid in different operating modes, especially when coupling with intermittent sources such as wind turbines and photovoltaic panels to investigate hydrogen production systems.
Finally, considering that all the cells in the alkaline electrolyzer have the same physical performance and behavior, then the electrolyzer total voltage (Vel) is equal to the cell voltage (Vcell) multiplied by the number of cells of the stack Ncell as reported in Equation (9) below:
V e l = N c e l l · V c e l l
In the next subsection, empirical models are reported and detailed.

3.1.3. Empirical Modeling

As reported in the literature, the main electrical expression of the cell voltage Vcell including the different voltages is given by Equation (10) [22,44]:
V c e l l = V r e v + ( R a + R c + R e l e + R m e m ) · i e l + η a c t , a + η a c t , c
where Vrev (V) is the reversible voltage, Ra (Ω) and Rc (Ω) are ohmic resistances, respectively, related to the conductivity of the electrodes (anode and cathode), Rele (Ω) represents the ohmic loss due to the electrolyte conductivity, Rmem (Ω) stands for the membrane ohmic resistance, ηact,a (V) and ηact,c (V) are, respectively, the activation overvoltage at the anode and the cathode.
In this subsection, the expressions of the reversible voltage and the different overvoltages (activation and ohmic) are provided and studied.

Reversible Potential

The reversible potential is defined as a required voltage that is just needed to start the electrolysis reaction. Its value is directly related to the Gibbs energy ΔG (J mol−1) defined in Equation (11) below [19,22,37]:
Δ G = Δ H T · Δ S
where ΔH (J mol−1) is the change in enthalpy, ΔS (J mol−1 °K−1) the change in entropy, and T (°K) the temperature.
The reversible potential Vrev is the ratio of the Gibbs energy ΔG to the product of Faraday’s constant F and the number of exchanged electrons n, as given in Equation (12) below:
V r e v = Δ G n · F = Δ H T · Δ S n · F
The change in enthalpy ΔH is also related to the thermoneutral cell voltage Vth by the following Equation (13):
V t h = Δ H n · F = Δ G + T · Δ S n · F
Given that the number of electrons n = 2 (see chemical reactions, Equations (1)–(3)) and the Faraday’s constant F = 96,485 C mol−1, at standard conditions (T = 298.15 °K, pressure of 1 bar), the values of the enthalpy ΔH and the entropy ΔS are given as: ΔH = 285.84 kJ mol−1, ΔS = 0.1631 kJ mol−1 °K−1. At these conditions, the reversible potential and the thermoneutral cell voltage are, respectively, given by: Vrev,0 = 1.23 V and Vth,0 = 1.48 V.
At other operating conditions, the reversible potential Vrev (V) is determined using Nernst’s equation in Equation (14) as reported in articles [40,45,46]:
V r e v = V r e v , 0 , T + R · T n · F · ln ( ( P P v , K O H ) 3 2 α H 2 O )
where Vrev,0,T (V) is the reversible potential at a given condition (i.e., temperature and pressure), R = 8.315 J K−1 mol−1 the universal gas constant, T (°K) the temperature, n the number of electrons, F (C mol−1) the Faraday’s constant, P (bar) the gas pressure, Pv,KOH (bar) the vapor pressures, and α H 2 O is the water activity of the electrolyte solution based on KOH.
The reversible potential Vrev,0,T (V) can be assessed as a function of temperature T (°K) in Equation (15) as reported in articles [45,46,47,48]:
V r e v , 0 , T = 1.5184 1.5421 · 10 3 · T + 9.523 · 10 5 · T · ln ( T ) + 9.84 · 10 8 · T 2
The vapor pressures of the KOH solution Pv,KOH (bar) is calculated using the following Equation (16) as reported in [45]:
P v , K O H = exp ( 2.302 · a + b · ln ( P v , H 2 O ) )
where a and b are coefficients that depend on the KOH molality m (mol kg−1) as given in Equations (17) and (18) below, and Pv,H2O (bar) is the vapor pressure of pure water, which is expressed as a function of the temperature T (°K) in Equation (19) as reported in [45]:
a = 0.0151 · m 1.6788 · 10 3 · m 2 + 2.2588 · 10 5 · m 3
b = 1 1.2062 · 10 3 · m + 5.6024 · 10 4 · m 2 7.8228 · 10 6 · m 3
P v , H 2 O = exp ( 81.6179 7699.68 T 10.9 · ln T + 9.5891 · 10 3 · T )
In Equation (20), the water activity αH2O of the electrolyte solution based on KOH is expressed as a function of the temperature T (°K) and the molality concentration m (mol kg−1) as reported in [45]:
α H 2 O = exp ( 0.05192 · m + 0.003302 · m 2 + ( 3.177 · m 2.131 · m 2 ) T )
Equations (15)–(20) are valid for pressure ranging from 1 to 200 bar, temperature between 273.15 to 523.15 °K, and the molality concentration ranging from 2 to 18 mol kg−1.

Activation Overpotential

The activation overvoltages starting the water electrolysis process at the anode ηact,a and at the cathode ηact,c can be evaluated using the Butler–Volmer equations (or Tafel’s approximations) in Equations (21) and (22) as reported in articles [44,47].
η a c t , a = 2.3 · R · T α a · F · log ( j a j 0 , a )
η a c t , c = 2.3 · R · T α c · F · log ( j c j 0 , c )
where αa and αc are, respectively, the charge transfer coefficients at the anode and the cathode, ja (mA cm−2) and jc (mA cm−2) are the current densities of the electrodes, j0,a (mA cm−2) and j0,c (mA cm−2) are the exchange current densities of the electrodes.
Based on the physical and electrical behavior of the Hydrogen Research Institute (HRI) alkaline electrolyzer reported in [44], the physical models of the current densities (j0,a and j0,c) as a function of temperature T (°K) are given in Equations (23) and (24):
j 0 , a = 30.4 0.206 · T + 0.00035 · T 2
j 0 , c = 13.72491 0.09055 · T + 0.09055 · T 2
The charge transfer coefficients (αa and αc) of the HRI electrolyzer as a function of temperature T (°K) are given in Equations (25) and (26) as reported in [44]:
α a = 0.0675 + 0.00095 · T
α c = 0.1175 + 0.00095 · T

Ohmic Overpotential

Alkaline electrolyzers are made of different elements. Each element is modeled as electrical resistance. The total ohmic resistance of the electrolyzer can be expressed in Equation (27) as reported in articles [44,49]:
R t o t a l = R a + R c + R e l e + R m e m
where Ra (Ω) and Rc (Ω) are the anode and the cathode resistances, Rele (Ω) the resistance of the electrolyte (KOH or NaOH), and Rmem (Ω) the resistance of the membrane.
a. 
Electrodes
Electrodes in alkaline electrolyzer can either be cobalt, nickel, or iron. Most of the electrodes are made of nickel because of their stability [11]. Electrodes resistances depend on their conductivity and their geometry as reported in the article [44]. Therefore, the resistances at the anode Ra and the cathode Rc of electrodes made of nickel (Ni) are given in Equations (28) and (29) as reported in [44]:
R a = 1 σ N i ( L a S a )
R c = 1 σ N i ( L c S c )
where La (cm) and Lc (cm) are, respectively, the anode and the cathode thickness, Sa (cm2) and Sc (cm2) are the electrode cross-sections, and σNi (S cm−1) is the conductivity of an electrode made of nickel.
As reported in the article [44], the conductivity σNi can be calculated as a function of temperature T (°K) using the following Equation (30):
σ N i = 6000000 279650 · T + 532 · T 2 0.38057 · T 3
b. 
Electrolytes
The alkaline electrolysis reaction generates bubbles from hydrogen and oxygen gases, thus the electrolyte resistance Rele in Equation (31) is the sum of the bubble-free electrolyte resistance Rele,bf and the resistance due to bubbles Rele,b as reported in articles [44,50]:
R e l e = R e l e , b f + R e l e , b
In articles [44,50], the formula used to calculate the bubble-free electrolyte resistance Rele,bf is given in Equation (32) below:
R e l e , b f = 1 σ b f ( d a , m S a + d c , m S c )
where da,m (cm) and dc,m (cm) are, respectively, the anode-membrane and the cathode-membrane distances, Sa (cm2) and Sc (cm2) are the anode and cathode cross-sections and σbf (S m−1) is the bubble-free electrolyte conductivity.
The bubble-free conductivity σbf can be determined as a function of the electrolyte molarity concentration M (mol L−1) and the temperature T (°K) as reported in [44,47,51] according to Equation (33) below:
σ b f = 204.1 · M 0.28 · M 2 + 0.5332 · ( M · T ) + 20720 · M T + 0.1043 · M 3 0.00003 · ( M 2 · T 2 )
The Equation (33) can also be expressed according to the temperature and KOH mass fractions. Since it is an important issue in this review paper, it is analyzed and detailed in the next subsection.
The resistance Rele,b due to bubbles in the electrolyte is given in Equation (34) as reported in the article [44]:
R e l e , b = R e l e , b f · ( 1 ( 1 ε ) 3 2 1 )
where ε is a coefficient that depends on the effective electrode surface Seff (cm2) and the nominal electrode surface S (cm2) as given in Equation (35):
ε = 1 ( S e f f S )
c. 
Membrane
As reported in [44], the HRI electrolyzer membrane resistance made of Zirfon material of 0.5 mm thickness is given in Equation (36) as:
R m e m = 0.060 + 80 · exp ( T 50 ) 10000 · S m e m
where Smem (cm2) is the membrane surface, T (°K) is the temperature.
After analyzing the semi-empirical and empirical models, the next subsection allows introducing the dynamic modeling of alkaline electrolyzers that has to be considered when coupling them with intermittent energy sources.

3.2. Dynamic Modeling

Compared to static modeling, dynamic modeling of alkaline electrolyzers has received fewer investigations from researchers. Indeed, over the last decade, only two papers have considered dynamic issues when modeling alkaline electrolyzers [45,52]. First of all, in [45], the authors have proposed an equivalent electrical circuit to model both static and dynamic behaviors of this electrolyzer. This equivalent electrical circuit for one cell is shown in Figure 6. It is composed of the following components linked to the previous analysis reported in this section:
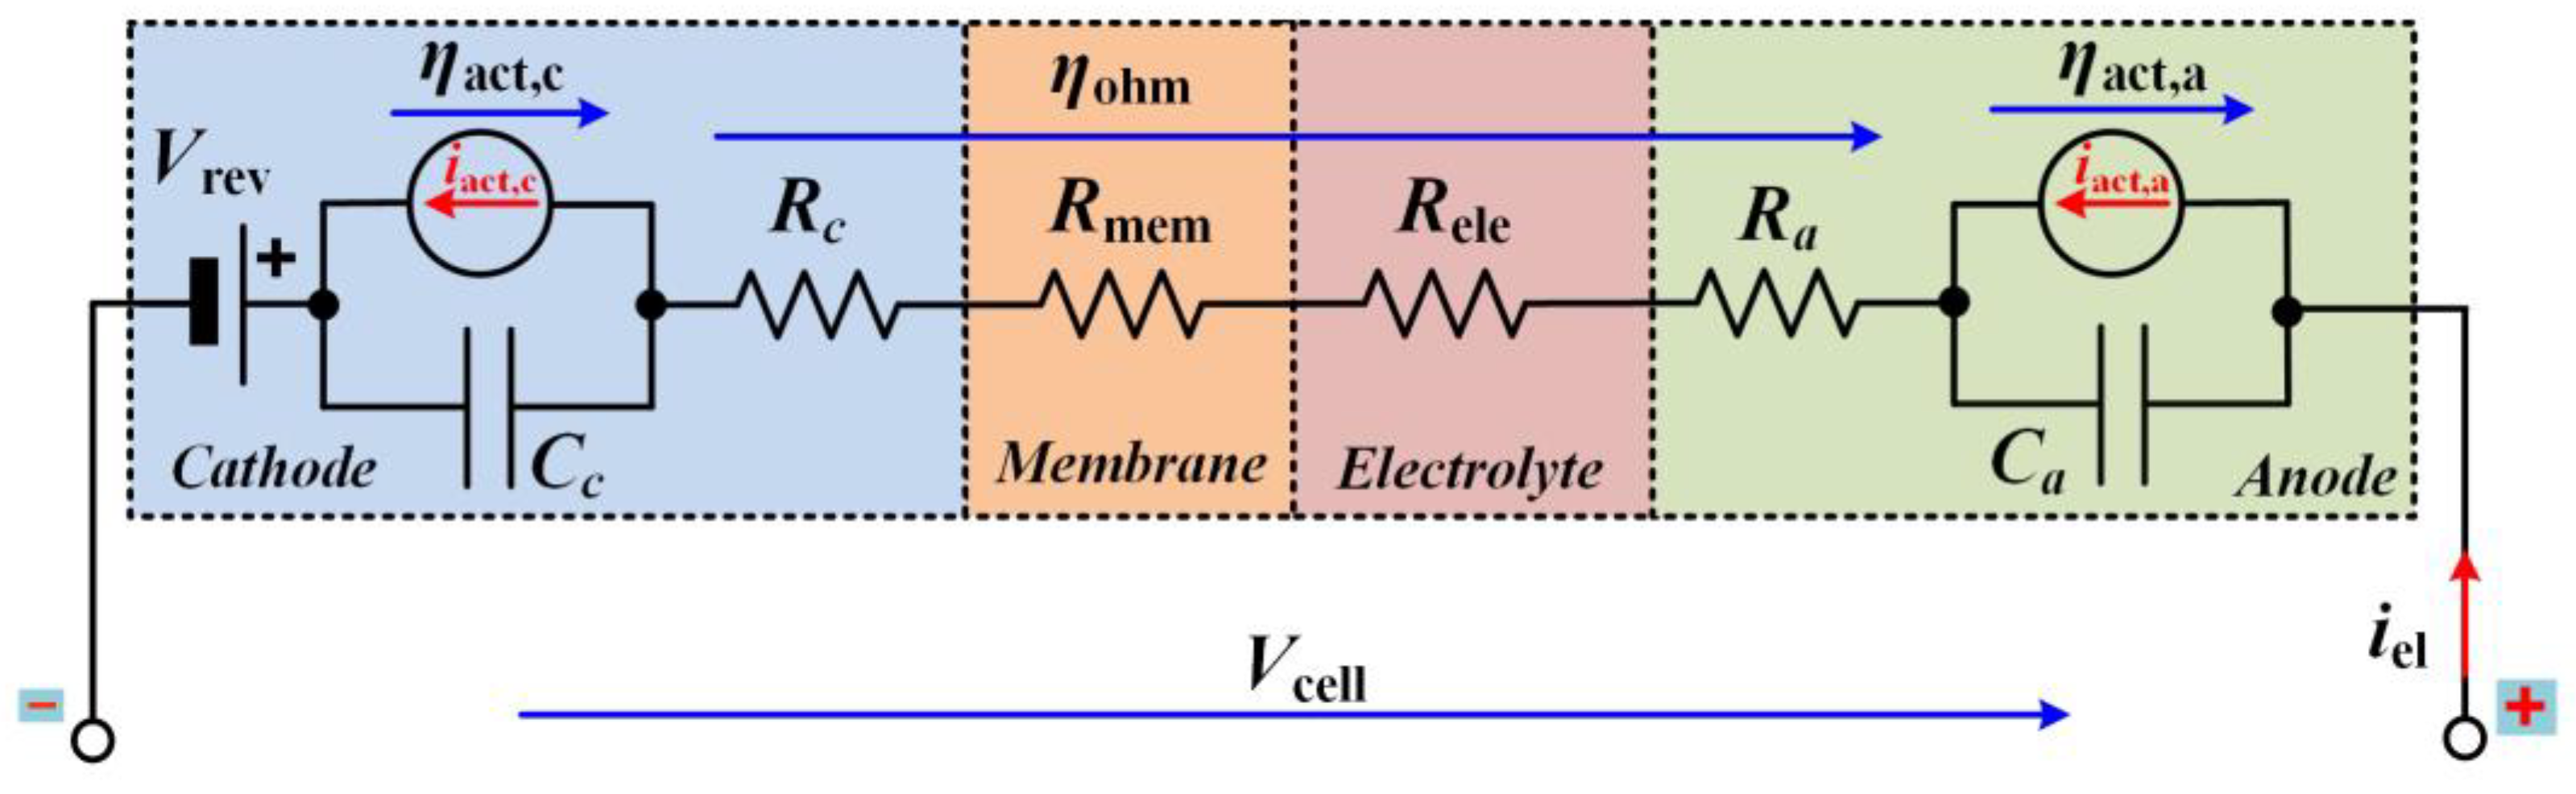
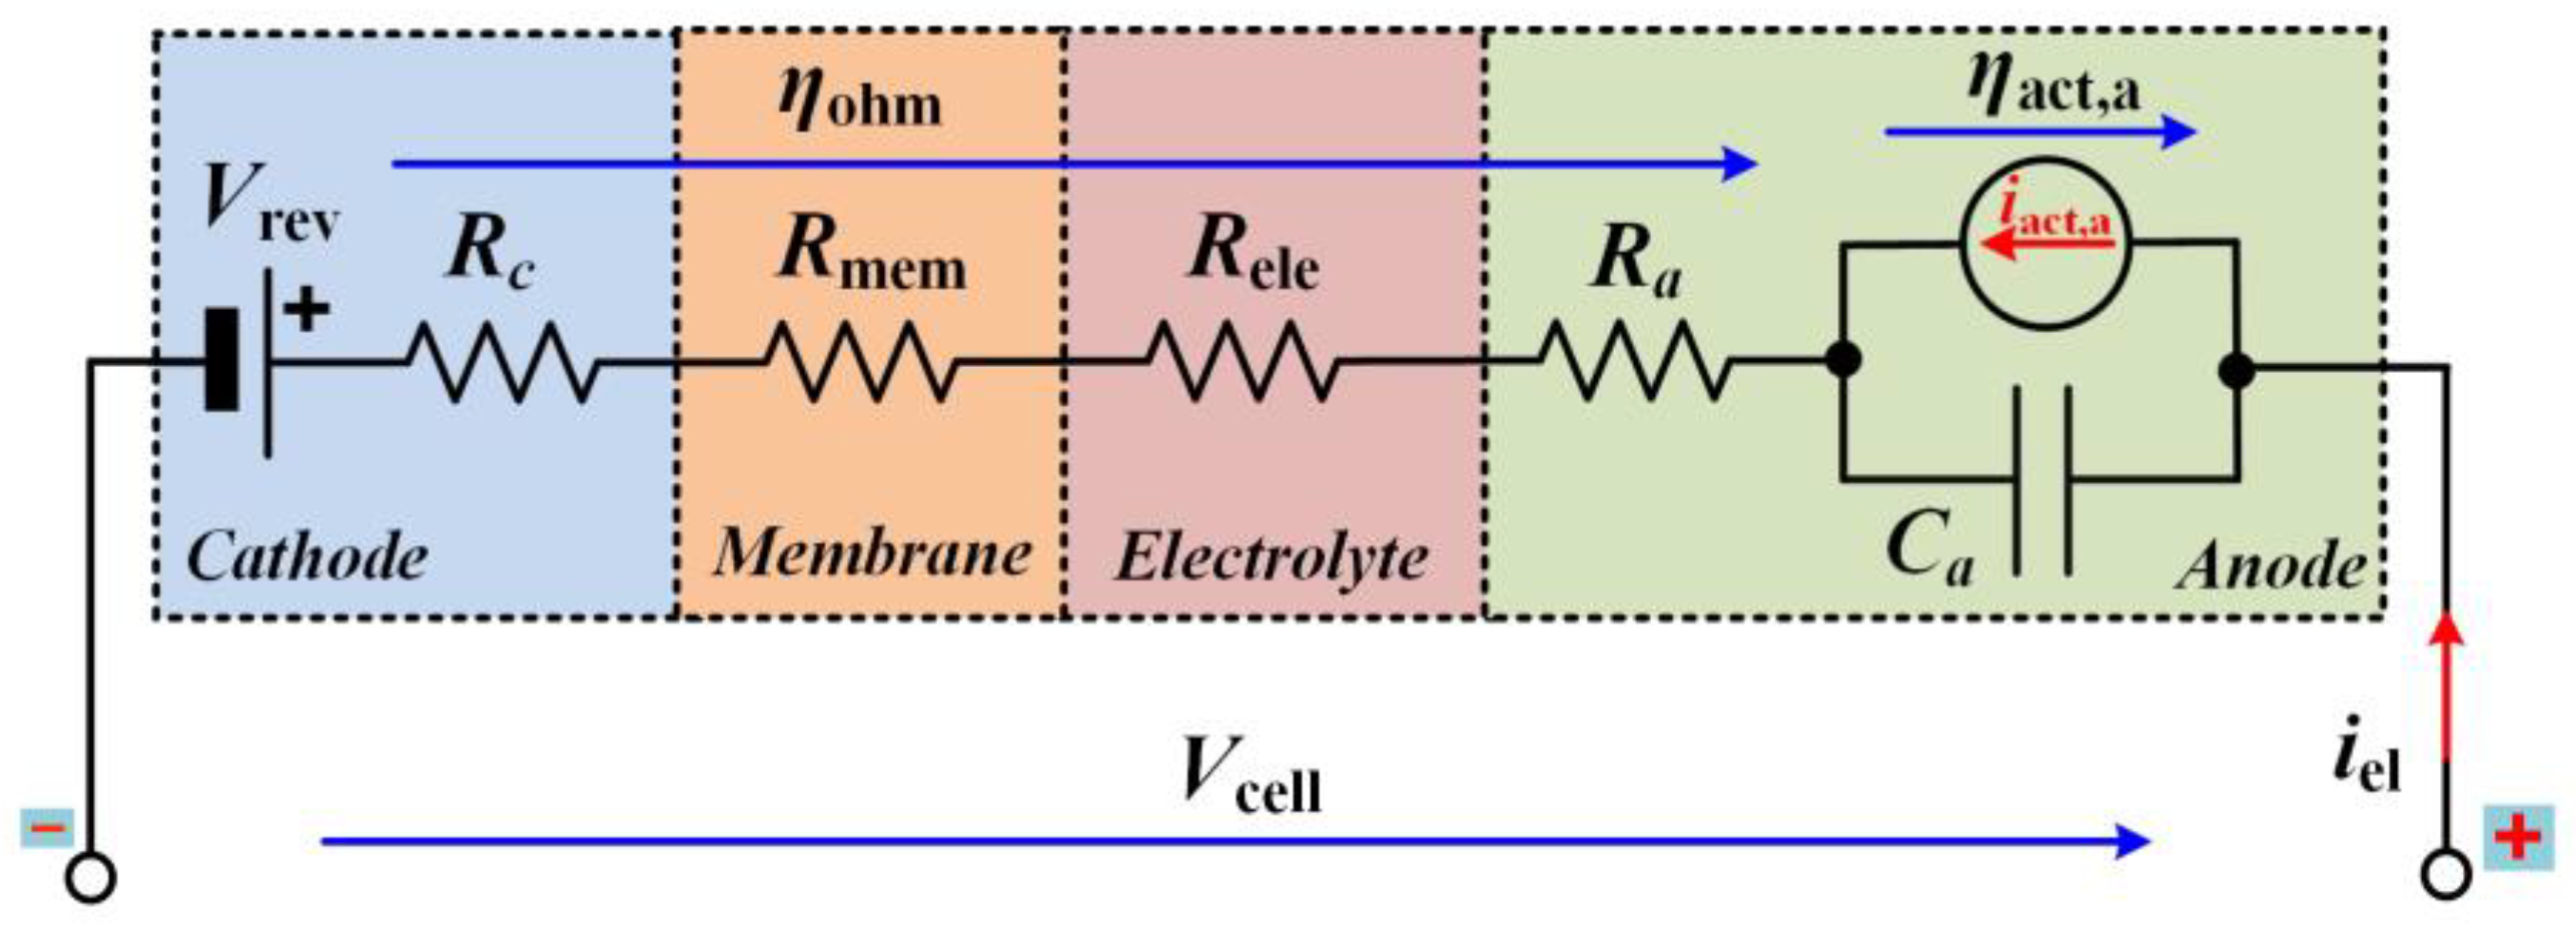
  • A DC source, Vrev, represents the reversible voltage (located on the cathode side where the hydrogen is generated).
  • A current source (iact,a or iact,c) connected in parallel with a capacitor Ca or CC modeling the activation overvoltage and especially the well-known double-layer effect between the electrode (anode or cathode) and the electrolyte.
  • Four resistors Ra, Rc, Rmem, and Rele model, respectively, the anode, cathode, membrane, and electrolyte.
Both current sources (iact,a and iact,c) of the electrical circuit enable replicating the activation phenomena for the anode and the cathode. These sources can be modeled as a function of their activation overvoltages (ηact,a and ηact,c), relying on a fit Tafel expression provided below valid for the whole stack of the electrolyzer [45]:
η a c t , a , e l = N c e l l · η a c t , a = s a · log [ t a · ( i a c t , a A e l e c , a ) + 1 ] i a c t , a = A e l e c , a t a · [ 10 ( η a c t , a , e l s a · N c e l l ) 1 ]
η a c t , c , e l = N c e l l · η a c t , c = s c · log [ t c · ( i a c t , c A e l e c , c ) + 1 ] i a c t , c = A e l e c , c t c · [ 10 ( η a c t , c , e l s c · N c e l l ) 1 ]
where ta and tc are the temperature-dependent overvoltage coefficients given below:
t a = t a 1 + t a 2 θ + t a 3 θ 2
t c = t c 1 + t c 2 θ + t c 3 θ 2
where θ (°C) is the operating temperature, ta1 (m2 A−1), ta2 (m2 A−1 °C), ta3 (m2 A−1 °C2) and tc1 (m2 A−1), tc2 (m2 A−1 °C), tc3 (m2 A−1 °C2) are parameters related, respectively, to the activation overvoltage at the anode and the cathode side.
The equivalent electrical circuit (Figure 6) can be simplified as depicted in Figure 7 [52]. In this circuit, the activation branch at the cathode side (iact,c and CC) has been neglected since its overpotential is lower than the overpotential at the anode side [19]. Besides, in [52], a first value of the capacitance has been provided, equal to 15 mF. This value is much lower than those reported for PEM electrolyzers [53]. Indeed, for PEM electrolyzers, capacitance values from 3 to 69 F have been reported according to the operating conditions. Based on the dynamic tests provided in Figure 4 and Figure 5, alkaline electrolyzers can respond quickly to sudden operating conditions changes. This analysis can explain the small value of the capacitance for this electrolyzer technology, whereas, for PEM electrolyzers, the dynamics met are more meaningful. Hence, the values of capacitance are higher than alkaline electrolyzers.
Like static modeling, dynamic modeling requests experimental data to determine the parameters of the equivalent electrical circuit shown in Figure 6 and Figure 7. It is important to point out that this type of modeling is strongly influenced by the operating variables such as the current, the temperature, and gas pressure. Indeed, as highlighted in previous work [54], the electrolyzer behavior strongly differs according to the operating conditions. For this reason, the parameters of the model cannot be supposed constant, but variables to ensure the reliability of the model in recreating the behavior of the electrolyzer in agreement with the operating conditions. Relying on the electrical equations retrieved from the equivalent electrical circuit and the experimental data, different modeling approaches can be adopted such as regression analysis to assess the parameters of the model [55,56]. Such an approach enables obtaining good fitting but other methods that are also attractive can be employed, such as genetic or Levenberg–Marquardt algorithm.
Finally, on one hand, the main advantage of dynamic modeling over static modeling is the reliability in reproducing the dynamic behavior of alkaline electrolyzer when it is supplied by dynamic sources such as wind turbines or solar panels [54]. Besides, high modeling reliability can be obtained by taking into account different operating parameters (current, temperature, and gas pressure). This modeling is a powerful tool to develop efficient, robust, and suitable controllers considering dynamic operating conditions, which is not possible considering only static modeling [57]. On the other hand, the main drawback compared to static modeling is the determination of the parameters of the model since they are considered variable to enhance the reliability of the model. In other words, this modeling requests a lot of experimental data and the use of different approaches to determine the parameters of the model. Moreover, the design of controllers is more complex due to the use of an equivalent electrical circuit [55].

3.3. Specific Electrolyte Conductivity

The specific electrolyte conductivity for KOH and NaOH is given in Equations (41) and (42). Equation (41) is valid for temperature T (°K) ranging from 258.15 to 373.15 °K and KOH mass fraction wKOH between 0.15 and 0.45, while Equation (42) is suitable for temperatures θ (°C) between 25 and 50 °C and NaOH mass fraction wNaOH from 0.08 to 0.25 as reported in the article [22]. The parameters needed to calculate these conductivities are listed in Table 6.
σ K O H = K 1 · ( 100 · w K O H ) + K 2 · T + K 3 · T 2 + K 4 · T · ( 100 · w K O H ) + K 5 · T 2 · ( 100 · w K O H ) K 6 + K 7 · T ( 100 · w K O H ) + K 8 · ( 100 · w K O H ) T
σ N a O H = K 1 + K 2 · θ + K 3 · w N a O H 3 + K 4 · w N a O H 2 + K 5 · w N a O H
Relying on the Equations (41) and (42) and the parameters of both equations reported in Table 6, the specific electrolyte conductivity of KOH and NaOH has been plotted according to the mass fraction w as shown in Figure 8. Besides, two temperatures have been considered, 25 and 50 °C.
Based on Figure 8, one can note that for alkaline electrolyzers with KOH liquid solution, the specific electrolyte conductivity is higher compared to alkaline electrolyzers with NaOH solution. Indeed, as it has been demonstrated in previous papers [18,42], the specific electrolyte conductivity of KOH is optimal for mass fractions between 25 and 35 wt.% and a temperature range from 50 to 80 °C. The use of a liquid solution based on NaOH offers a cheaper option than KOH but features a lower specific electrolyte conductivity. For example, at 50 °C, the maximum specific electrolyte conductivity of KOH is equal to 95 S·m−1, whereas for NaOH the conductivity is equal to 65 S·m−1. By comparison, at 25 °C, both specific electrolyte conductivities have decreased, 63 S·m−1 for KOH and 42 S·m−1 for NaOH. Furthermore, it is important to point out that the specific electrolyte conductivity of NaOH is optimal for lower mass fractions between 15 and 25 wt.% and temperatures between 50 and 80 °C. In summary, KOH liquid solution features a specific electrolyte conductivity between 46 and 50% higher than NaOH liquid solution at their optimal mass fractions.

4. Conclusions

The purpose of this paper was to review alkaline electrolyzer technology and its modeling from the electrical domain and specific electrolyte conductivity points of view. It has been emphasized that modeling of this electrolyzer technology has received less interest from researchers compared to PEM electrolyzers. However, alkaline electrolyzers feature several benefits in terms of cost due to cheaper catalysts, high lifespan, gas purity, hydrogen production capacity, and low specific energy consumption. However, this technology still suffers from having limited current density and production capacity range and requesting frequent maintenance due to the use of an aqueous electrolyte solution.
Since this technology is quite mature, several perspectives are considered such as the increase in the use of non-precious metals combined with nickel material to enhance the performance, the design in spacing electrodes to optimize hydrogen production, and the dissemination of low carbon footprint hydrogen production plants supplied by renewable and nuclear resources.
Besides, as demonstrated in this paper, alkaline electrolyzers can respond quickly to dynamic solicitations and are consequently suitable to be coupled with renewable energy sources such as wind turbine conversion systems. The literature review focused on the electrical domain modeling has enabled to bring out the lacks. Indeed, static modeling has been widely investigated, but dynamic modeling has not been thoroughly analyzed considering that only two papers have been published on this issue. Over static modeling, dynamic modeling enables enhancing the reliability in reproducing the dynamic behavior of alkaline electrolyzer when it is supplied by dynamic energy sources. Furthermore, high modeling efficiency can be reached by taking into consideration different operating parameters (current, temperature, and gas pressure). This modeling is a powerful tool to design efficient and fit controllers considering dynamic operating conditions, which is not possible considering only static modeling. On the other side, compared to static modeling, the determination of the parameters of the model can be complex since they are considered variable to increase the reliability of the model.
Hence, further research investigations are requested to bring new knowledge of alkaline electrolyzer behaviors supplied by dynamic sources and to model these behaviors according to the operating conditions by the development of equivalent electrical circuits and the use of different approaches to determine their parameters.

Author Contributions

Conceptualization, F.G., D.G., M.Z. and H.R.; methodology, F.G. and D.G.; validation, F.G. and D.G.; investigation, F.G. and D.G.; writing—original draft preparation, F.G. and D.G.; writing—review and editing, F.G. and D.G. All authors have read and agreed to the published version of the manuscript.

Funding

The experimental hydrogen platform presented in this paper has been realized thanks to the financial support of the IUT of Longwy, CRAN, and GREEN research laboratories.

Institutional Review Board Statement

Not applicable.

Informed Consent Statement

Not applicable.

Data Availability Statement

The data presented in this study are available on request from the corresponding author. The data are not publicly available due to their current utilization for future works involving the authors of this paper.

Acknowledgments

The authors would like to express their gratitude to the executive team of IUT of Longwy, CRAN, and GREEN research laboratories for their constant support in developing fruitful cooperation between CRAN and GREEN research teams from the IUT of Longwy campus.

Conflicts of Interest

The authors declare no conflict of interest.

References

  1. Climate Change 2022: Impacts, Adaptation and Vulnerability. Available online: https://www.ipcc.ch/report/ar6/wg2/ (accessed on 29 April 2022).
  2. Carmo, M.; Fritz, D.L.; Mergel, J.; Stolten, D. A Comprehensive Review on PEM Water Electrolysis. Int. J. Hydrogen Energy 2013, 38, 4901–4934. [Google Scholar] [CrossRef]
  3. Falcão, D.S.; Pinto, A.M.F.R. A Review on PEM Electrolyzer Modelling: Guidelines for Beginners. J. Clean. Prod. 2020, 261, 121184. [Google Scholar] [CrossRef]
  4. Buttler, A.; Spliethoff, H. Current Status of Water Electrolysis for Energy Storage, Grid Balancing and Sector Coupling via Power-to-Gas and Power-to-Liquids: A Review. Renew. Sustain. Energy Rev. 2018, 82, 2440–2454. [Google Scholar] [CrossRef]
  5. Apostolou, D. Optimisation of a Hydrogen Production-Storage-Re-Powering System Participating in Electricity and Transportation Markets. A Case Study for Denmark. Appl. Energy 2020, 265, 114800. [Google Scholar] [CrossRef]
  6. Guilbert, D.; Vitale, G. Hydrogen as a Clean and Sustainable Energy Vector for Global Transition from Fossil-Based to Zero-Carbon. Clean Technol. 2021, 3, 881–909. [Google Scholar] [CrossRef]
  7. Available online: Https://Ec.Europa.Eu/Growth/Industry/Strategy/Hydrogen_en (accessed on 3 April 2022).
  8. Shiva Kumar, S.; Himabindu, V. Hydrogen Production by PEM Water Electrolysis—A Review. Mater. Sci. Energy Technol. 2019, 2, 442–454. [Google Scholar] [CrossRef]
  9. Yodwong, B.; Guilbert, D.; Phattanasak, M.; Kaewmanee, W.; Hinaje, M.; Vitale, G. AC-DC Converters for Electrolyzer Applications: State of the Art and Future Challenges. Electronics 2020, 9, 912. [Google Scholar] [CrossRef]
  10. Liaqat, K.; Fazil, S.; Rehman, W.; Saeed, S.; Menaa, F.; Shah, S.A.H.; Nawaz, M.; Alharbi, W.N.; Menaa, B.; Farooq, M. Sulfonated Polyimide Membranes Derived from a Novel Sulfonated Diamine with Pendant Benzenesulfonic Acid for Fuel Cells. Energies 2021, 14, 6050. [Google Scholar] [CrossRef]
  11. David, M.; Ocampo-Martínez, C.; Sánchez-Peña, R. Advances in Alkaline Water Electrolyzers: A Review. J. Energy Storage 2019, 23, 392–403. [Google Scholar] [CrossRef] [Green Version]
  12. Li, C.; Baek, J.-B. The Promise of Hydrogen Production from Alkaline Anion Exchange Membrane Electrolyzers. Nano Energy 2021, 87, 106162. [Google Scholar] [CrossRef]
  13. Carmo, M.; Stolten, D. Chapter 4—Energy Storage Using Hydrogen Produced from Excess Renewable Electricity: Power to Hydrogen. In Science and Engineering of Hydrogen-Based Energy Technologies; de Miranda, P.E.V., Ed.; Academic Press: Cambridge, MA, USA, 2019; pp. 165–199. ISBN 978-0-12-814251-6. [Google Scholar]
  14. Wulf, C.; Linssen, J.; Zapp, P. Chapter 9—Power-to-Gas—Concepts, Demonstration, and Prospects. In Hydrogen Supply Chains; Azzaro-Pantel, C., Ed.; Academic Press: Cambridge, MA, USA, 2018; pp. 309–345. ISBN 978-0-12-811197-0. [Google Scholar]
  15. Cao, Q.; Hao, S.; Wu, Y.; Pei, K.; You, W.; Che, R. Interfacial Charge Redistribution in Interconnected Network of Ni2P–Co2P Boosting Electrocatalytic Hydrogen Evolution in Both Acidic and Alkaline Conditions. Chem. Eng. J. 2021, 424, 130444. [Google Scholar] [CrossRef]
  16. Tang, J.; Wang, B.; Zhang, Y.; Zhang, X.; Shen, Q.; Qin, J.; Xue, S.; Guo, X.; Du, C.; Chen, J. One-Step Integration of Amorphous RuBx and Crystalline Ru Nanoparticles into B/N-Doped Porous Carbon Polyhedra for Robust Electrocatalytic Activity towards the HER in Both Acidic and Basic Media. J. Mater. Chem. A 2022, 10, 4181–4190. [Google Scholar] [CrossRef]
  17. Bessarabov, D.; Wang, H.; Li, H.; Zhao, N. (Eds.) PEM Electrolysis for Hydrogen Production: Principles and Applications; CRC Press: Boca Raton, FL, USA, 2015; ISBN 978-0-429-18360-7. [Google Scholar]
  18. Schalenbach, M.; Carmo, M.; Fritz, D.L.; Mergel, J.; Stolten, D. Pressurized PEM Water Electrolysis: Efficiency and Gas Crossover. Int. J. Hydrogen Energy 2013, 38, 14921–14933. [Google Scholar] [CrossRef]
  19. Hernández-Gómez, Á.; Ramirez, V.; Guilbert, D. Investigation of PEM Electrolyzer Modeling: Electrical Domain, Efficiency, and Specific Energy Consumption. Int. J. Hydrogen Energy 2020, 45, 14625–14639. [Google Scholar] [CrossRef]
  20. Yodwong, B.; Guilbert, D.; Phattanasak, M.; Kaewmanee, W.; Hinaje, M.; Vitale, G. Proton Exchange Membrane Electrolyzer Modeling for Power Electronics Control: A Short Review. C J. Carbon Res. 2020, 6, 29. [Google Scholar] [CrossRef]
  21. Millet, P.; Ranjbari, A.; de Guglielmo, F.; Grigoriev, S.A.; Auprêtre, F. Cell Failure Mechanisms in PEM Water Electrolyzers. Int. J. Hydrogen Energy 2012, 37, 17478–17487. [Google Scholar] [CrossRef]
  22. Brauns, J.; Turek, T. Alkaline Water Electrolysis Powered by Renewable Energy: A Review. Processes 2020, 8, 248. [Google Scholar] [CrossRef] [Green Version]
  23. Santos, A.L.; Cebola, M.-J.; Santos, D.M.F. Towards the Hydrogen Economy—A Review of the Parameters That Influence the Efficiency of Alkaline Water Electrolyzers. Energies 2021, 14, 3193. [Google Scholar] [CrossRef]
  24. Shirvanian, P.; Loh, A.; Sluijter, S.; Li, X. Novel Components in Anion Exchange Membrane Water Electrolyzers (AEMWE’s): Status, Challenges and Future Needs. A Mini Review. Electrochem. Commun. 2021, 132, 107140. [Google Scholar] [CrossRef]
  25. Wang, L.; Chen, M.; Küngas, R.; Lin, T.-E.; Diethelm, S.; Maréchal, F.; Van herle, J. Power-to-Fuels via Solid-Oxide Electrolyzer: Operating Window and Techno-Economics. Renew. Sustain. Energy Rev. 2019, 110, 174–187. [Google Scholar] [CrossRef]
  26. Demo4Grid Project. Available online: https://Www.Demo4grid.Eu/ (accessed on 11 January 2022).
  27. CEOG Project|McPhy. Available online: Https://Mcphy.Com/En/Press-Releases/Ceog-Project/?Cn-Reloaded=1 (accessed on 11 January 2022).
  28. Minke, C.; Suermann, M.; Bensmann, B.; Hanke-Rauschenbach, R. Is Iridium Demand a Potential Bottleneck in the Realization of Large-Scale PEM Water Electrolysis? Int. J. Hydrogen Energy 2021, 46, 23581–23590. [Google Scholar] [CrossRef]
  29. Doan, T.L.; Lee, H.E.; Kim, M.; Cho, W.C.; Cho, H.S.; Kim, T. Influence of IrO2/TiO2 Coated Titanium Porous Transport Layer on the Performance of PEM Water Electrolysis. J. Power Sources 2022, 533, 231370. [Google Scholar] [CrossRef]
  30. Laube, A.; Hofer, A.; Ressel, S.; Chica, A.; Bachmann, J.; Struckmann, T. PEM Water Electrolysis Cells with Catalyst Coating by Atomic Layer Deposition. Int. J. Hydrogen Energy 2021, 46, 38972–38982. [Google Scholar] [CrossRef]
  31. Scheepers, F.; Stähler, M.; Stähler, A.; Rauls, E.; Müller, M.; Carmo, M.; Lehnert, W. Improving the Efficiency of PEM Electrolyzers through Membrane-Specific Pressure Optimization. Energies 2020, 13, 612. [Google Scholar] [CrossRef] [Green Version]
  32. El-Shafie, M.; Kambara, S.; Hayakawa, Y. Hydrogen Production Technologies Overview. J. Power Energy Eng. 2019, 7, 107–154. [Google Scholar] [CrossRef] [Green Version]
  33. Yue, M.; Lambert, H.; Pahon, E.; Roche, R.; Jemei, S.; Hissel, D. Hydrogen Energy Systems: A Critical Review of Technologies, Applications, Trends and Challenges. Renew. Sustain. Energy Rev. 2021, 146, 111180. [Google Scholar] [CrossRef]
  34. Keddar, M.; Zhang, Z.; Periasamy, C.; Doumbia, M.L. Comparative Analysis of Thyristor-Based and Transistor-Based Rectifiers for PEM Water Electrolysis. In Proceedings of the 2021 12th International Renewable Energy Congress (IREC), Hammamet, Tunisia, 26–28 October 2021; pp. 1–5. [Google Scholar]
  35. Koponen, J.; Poluektov, A.; Ruuskanen, V.; Kosonen, A.; Niemelä, M.; Ahola, J. Comparison of Thyristor and Insulated-Gate Bipolar Transistor -Based Power Supply Topologies in Industrial Water Electrolysis Applications. J. Power Sources 2021, 491, 229443. [Google Scholar] [CrossRef]
  36. Brauns, J.; Turek, T. Experimental Evaluation of Dynamic Operating Concepts for Alkaline Water Electrolyzers Powered by Renewable Energy. Electrochim. Acta 2022, 404, 139715. [Google Scholar] [CrossRef]
  37. Ulleberg, Ø. Modeling of Advanced Alkaline Electrolyzers: A System Simulation Approach. Int. J. Hydrogen Energy 2003, 28, 21–33. [Google Scholar] [CrossRef]
  38. Sánchez, M.; Amores, E.; Rodríguez, L.; Clemente-Jul, C. Semi-Empirical Model and Experimental Validation for the Performance Evaluation of a 15 KW Alkaline Water Electrolyzer. Int. J. Hydrogen Energy 2018, 43, 20332–20345. [Google Scholar] [CrossRef]
  39. Ursúa, A.; San Martín, I.; Barrios, E.L.; Sanchis, P. Stand-Alone Operation of an Alkaline Water Electrolyser Fed by Wind and Photovoltaic Systems. Int. J. Hydrogen Energy 2013, 38, 14952–14967. [Google Scholar] [CrossRef]
  40. Amores, E.; Rodríguez, J.; Carreras, C. Influence of Operation Parameters in the Modeling of Alkaline Water Electrolyzers for Hydrogen Production. Int. J. Hydrogen Energy 2014, 39, 13063–13078. [Google Scholar] [CrossRef]
  41. Ma, Z.; Witteman, L.; Wrubel, J.A.; Bender, G. A Comprehensive Modeling Method for Proton Exchange Membrane Electrolyzer Development. Int. J. Hydrogen Energy 2021, 46, 17627–17643. [Google Scholar] [CrossRef]
  42. David, M.; Alvarez, H.; Ocampo-Martinez, C.; Sánchez-Peña, R. Dynamic Modelling of Alkaline Self-Pressurized Electrolyzers: A Phenomenological-Based Semiphysical Approach. Int. J. Hydrogen Energy 2020, 45, 22394–22407. [Google Scholar] [CrossRef]
  43. Ruuskanen, V.; Koponen, J.; Huoman, K.; Kosonen, A.; Niemelä, M.; Ahola, J. PEM Water Electrolyzer Model for a Power-Hardware-in-Loop Simulator. Int. J. Hydrogen Energy 2017, 42, 10775–10784. [Google Scholar] [CrossRef]
  44. Henao, C.; Agbossou, K.; Hammoudi, M.; Dubé, Y.; Cardenas, A. Simulation Tool Based on a Physics Model and an Electrical Analogy for an Alkaline Electrolyser. J. Power Sources 2014, 250, 58–67. [Google Scholar] [CrossRef]
  45. Ursúa, A.; Sanchis, P. Static–Dynamic Modelling of the Electrical Behaviour of a Commercial Advanced Alkaline Water Electrolyser. Int. J. Hydrogen Energy 2012, 37, 18598–18614. [Google Scholar] [CrossRef]
  46. Adibi, T.; Sojoudi, A.; Saha, S.C. Modeling of Thermal Performance of a Commercial Alkaline Electrolyzer Supplied with Various Electrical Currents. Int. J. 2022, 13, 100126. [Google Scholar] [CrossRef]
  47. Rodríguez, J.; Amores, E. CFD Modeling and Experimental Validation of an Alkaline Water Electrolysis Cell for Hydrogen Production. Processes 2020, 8, 1634. [Google Scholar] [CrossRef]
  48. Janjua, M.B.I.; Le Roy, R.L. Electrocatalyst Performance in Industrial Water Electrolysers. Int. J. Hydrogen Energy 1985, 10, 11–19. [Google Scholar] [CrossRef]
  49. Lavorante, M.J.; Franco, J. Performance of Stainless Steel 316L Electrodes with Modified Surface to Be Use in Alkaline Water Electrolyzers. Int. J. Hydrogen Energy 2016, 23, 9731–9737. [Google Scholar] [CrossRef]
  50. Brauns, J.; Schönebeck, J.; Kraglund, M.R.; Aili, D.; Hnát, J.; Žitka, J.; Mues, W.; Jensen, J.O.; Bouzek, K.; Turek, T. Evaluation of Diaphragms and Membranes as Separators for Alkaline Water Electrolysis. J. Electrochem. Soc. 2021, 168, 014510. [Google Scholar] [CrossRef]
  51. Gilliam, R.J.; Graydon, J.W.; Kirk, D.W.; Thorpe, S.J. A Review of Specific Conductivities of Potassium Hydroxide Solutions for Various Concentrations and Temperatures. Int. J. Hydrogen Energy 2007, 32, 359–364. [Google Scholar] [CrossRef]
  52. Speckmann, F.-W.; Bintz, S.; Birke, K.P. Influence of Rectifiers on the Energy Demand and Gas Quality of Alkaline Electrolysis Systems in Dynamic Operation. Appl. Energy 2019, 250, 855–863. [Google Scholar] [CrossRef]
  53. Hernández-Gómez, Á.; Ramirez, V.; Guilbert, D.; Saldivar, B. Self-Discharge of a Proton Exchange Membrane Electrolyzer: Investigation for Modeling Purposes. Membranes 2021, 11, 379. [Google Scholar] [CrossRef]
  54. Hernández-Gómez, Á.; Ramirez, V.; Guilbert, D.; Saldivar, B. Cell Voltage Static-Dynamic Modeling of a PEM Electrolyzer Based on Adaptive Parameters: Development and Experimental Validation. Renew. Energy 2021, 163, 1508–1522. [Google Scholar] [CrossRef]
  55. Maamouri, R.; Guilbert, D.; Zasadzinski, M.; Rafaralahy, H. Proton Exchange Membrane Water Electrolysis: Modeling for Hydrogen Flow Rate Control. Int. J. Hydrogen Energy 2021, 46, 7676–7700. [Google Scholar] [CrossRef]
  56. Guilbert, D.; Vitale, G. Variable Parameters Model of a PEM Electrolyzer Based Model Reference Adaptive System Approach. In Proceedings of the 2020 IEEE International Conference on Environment and Electrical Engineering and 2020 IEEE Industrial and Commercial Power Systems Europe (EEEIC/I CPS Europe), Madrid, Spain, 9–12 June 2020; pp. 1–6. [Google Scholar]
  57. Guilbert, D.; Sorbera, D.; Vitale, G. A Stacked Interleaved DC-DC Buck Converter for Proton Exchange Membrane Electrolyzer Applications: Design and Experimental Validation. Int. J. Hydrogen Energy 2020, 45, 64–79. [Google Scholar] [CrossRef]
Figure 1. Principle of operation of alkaline electrolyzers.
Energies 15 03452 g001
Figure 2. Experimental test bench for static and dynamic tests.
Energies 15 03452 g002
Figure 3. Static characterization of the studied alkaline electrolyzer.
Energies 15 03452 g003
Figure 4. Dynamic test with a rise current step from 20 to 40 A (Ch1 and Ch3) and a falling current step from 40 to 20 A (Ch2 and Ch4).
Energies 15 03452 g004
Figure 5. Tests with dynamic solicitations.
Energies 15 03452 g005
Figure 6. Equivalent electrical circuit modeling both static and dynamic behaviors for one cell.
Energies 15 03452 g006
Figure 7. Simplified equivalent electrical circuit modeling both static and dynamic behaviors for one cell.
Energies 15 03452 g007
Figure 8. Specific electrolyte conductivity for liquid solutions based on either KOH or NaOH according to the mass fraction of the solution.
Energies 15 03452 g008
Table 1. SWOT analysis with strengths, weaknesses, opportunities, and threats of alkaline water electrolysis technology.
StrengthsWeaknesses
Low cost (due to cheaper catalyst materials such as Nickel (Ni))
High lifetime and gas purity
High hydrogen production capacity (up to 3880 Nm3·h−1)
Low specific energy consumption (around 3.8 kWh·Nm−3)
Limited current density (0.2–0.7 A·cm−2)
Frequent maintenance requested (due to the use of a liquid electrolyte solution)
Limited production capacity dynamic range (15–100%)
OpportunitiesThreats
Increase in the use of non-precious metals (Co, Fe, Mn, Cr, Cu, and Zn) combined with Ni to enhance the performance
Design in spacing electrodes to optimize hydrogen production
Dissemination of low carbon footprint hydrogen production plants supplied by renewable and nuclear resources
Growing development of PEM water electrolysis technology due to its benefits (high current density and efficiency, large production capacity dynamic range, low maintenance)
Lack of hydrogen refueling stations close to the hydrogen production units
Table 2. SWOT analysis with strengths, weaknesses, opportunities, and threats of PEM electrolysis technology.
StrengthsWeaknesses
High current density (0.6–2 A·cm−2)
High energy efficiency and gas purity
High hydrogen production capacity (up to 5000 Nm3·h−1)
Large production capacity dynamic range (0–100%)
Low maintenance requested
High cost (due to the use of noble catalyst materials such as iridium and platinum)
Low operating pressure (up to 50 bar)
High specific energy consumption (between 4.53 and 7.3 kWh·Nm−3)
OpportunitiesThreats
Drastic decrease of PGM-based catalyst loading by employing porous transport electrodes-based catalyst coating by atomic layer deposition, and IrO2/TiO2 catalyst coated porous transport layer
Development of suitable and efficient recycling facilities for PGM-based catalysts assuming an end-of-life recycling rate of at least 90%
Enhancement of long-term stability, lifetime, and scaling up single cells (>1000 cm2)
Dissemination of low carbon footprint hydrogen production plants supplied by renewable and nuclear resources
Increase of PGM demands (leading up to a higher cost) due to the current market dissemination of PEM electrolyzers supplied by low-carbon energy sources
Lack of hydrogen refueling stations close to the hydrogen production units
Table 3. Summary of features for alkaline and PEM water electrolysis technologies.
SpecificationAlkaline ElectrolyzerPEM Electrolyzer
Electrolyte25–30% KOH aqueous solutionSolid polymer
Cell temperature60–80 °C50–80 °C
Gas purity99.999%99.999%
Pressure1–200 bar1–50 bar
Current density0.2–0.7 A·cm²0.6–2.0 A·cm−²
Cell voltage1.5–2.6 V1.4–2.3 V
Cell voltage efficiency (LHV 1, HHV 2)58–77%57–83%
Stack voltage18–522 V4–125 V
Stack Current60–5250 A9–75 A
System efficiency55–73%55–75%
Specific energy consumption at stack3.8–4.4 kWh·Nm−34.53–7.3 kWh·Nm−3
Production capacity dynamic range15–100%0–100%
Cell area≤4 m²≤300 m²
Hydrogen production rate1.5–3880 Nm3·h−10.22–5000 Nm3·h−1
Hydrogen volume rateUp to 8374 kg/24 hUp to 10786 kg/24 h
Lifetime stack<90,000 h (more than 10 years)<60,000 h
Lifetime system incl. maintenance20 + years35,000–80,000 h
(around 9 years)
1 Lower heating value (around 120 MJ·kg−1), 2 Higher heating value (around 142 MJ·kg−1).
Table 4. Technical specification of the studied alkaline electrolyzer.
ParametersValueUnit
Rated electrical power150W
Operating voltage range1.6–2.6V
Current range0–45A
Delivery output hydrogen pressure0.1–10.5Bar
Hydrogen purity99.999%
Cells number1-
Hydrogen volume range0–310mL·min−1
Electrolyte32% weight KOH-
Table 5. Parameters for the calculation of the cell voltage for Equations (6)–(8).
ParameterEquation (6) [22,37]Equation (7) [22,38]Equation (8) [40]Unit
r18.05 × 10−54.45153 × 10−53.53855 × 10−4Ω m²
r2−2.5 × 10−76.88874 × 10−9−3.02150 × 10⁻⁶Ω m2 °C−1
s0.1850.338242.2396 × 10−1V
t11.002−0.015395.13093m2 A−1
t28.4242.00181−2.40447 × 10²m2 °C A−1
t3247.315.241785.99576 × 103m2 °C2 A−1
δ1-−3.12996 × 10⁻⁶-Ω m²
δ2-4.47137 × 10⁻⁷-Ω m2 bar−1
p1--3.410251 × 10⁻⁴Ω m2
p2--−7.489577 × 10⁻⁵Ω m2 mol−1 L
p3--3.916035 × 10⁻⁶Ω m2 mol−2 L2
q1--−1.576117 × 10⁻⁴Ω m²
q2--1.576117 × 10⁻⁵Ω m2 mm−1
Table 6. Parameters for the calculation of the specific electrolyte conductivities of KOH and NaOH solutions by Equations (41) and (42) [22].
ParameterEquation (41)UnitEquation (42)Unit
K127.9844803S m−1−45.7S m−1
K2−0.924129482S m−1 K−11.02S m−1 °C−1
K3−0.0149660371S m−1 K−23200S m−1
K4−0.0905209551S m−1 K−1−2990S m−1
K50.0114933252S m−1 K−2784S m−1
K60.1765---
K76.96648518S m−1 K−1--
K8−2898.15658S m−1 K--
Publisher’s Note: MDPI stays neutral with regard to jurisdictional claims in published maps and institutional affiliations.

