Article

Does Green Finance Contribute to Corporate Technological Innovation? The Moderating Role of Corporate Social Responsibility

1
School of Economics, Shandong Normal University, Jinan 250014, China
2
School of Management Engineering, Shandong Jianzhu University, Jinan 250101, China
*
Author to whom correspondence should be addressed.
Sustainability 2022, 14(9), 5648; https://doi.org/10.3390/su14095648
Submission received: 8 April 2022 / Revised: 2 May 2022 / Accepted: 5 May 2022 / Published: 7 May 2022

Abstract

:
Technological innovation fundamentally drives sustainable economic development, and green finance provides an institutional guarantee for technological innovation. In this study, we obtained the data from 31 provinces of China during 2010–2019 to set up a green finance indicator system following the entropy method. The focal points in this paper are investigating the relationship regarding green finance and corporate technological innovation, and whether corporate social responsibility (CSR) strengthens such relationship. To do so, we matched the data of non-financial listed companies. The results are as follows: (1) Green finance can significantly enhance corporate technological innovation, and CSR has a positive moderating effect on this relationship between green finance and corporate technological innovation. (2) Based on the results of heterogeneity analysis, the positive impacts regarding green finance over technological innovation are more significant in larger companies, and companies in more economically developed eastern regions. More notably, green finance played a more significant role before 2016 than after. This study offers insights to future references for analyzing the green finance over economic sustainable development characterized by technological innovation.

1. Introduction

Sustainable economic and environmental development is gradually becoming a trend with the arrival of the stage of high-quality development. Green finance is any financial activity or decision-making procedure that connects the economy with the environment. Attention is often given to cost–revenue and risk factors related to the environment in the capital configuration decision process, promoting the coordinated development between economy and environment [1]. Over the past decades, green finance has attracted a wide span of attention. The United States published the Comprehensive Environmental Response Compensation and Liability Act in 1980, followed by increasing lending support provided to companies in green industries. It gradually built a green finance system, formulated green finance laws, and established national environmental finance centers, environmental advisory committees, and environmental finance center networks. In June 2019, the EU released the EU Classification Scheme for Sustainable Finance and EU Green Bonds Standard. The former has laid the groundwork for the sustainable finance development in the EU. The UK government announced the Green Finance Strategy in 2019. It proposed three core elements—greening finance, greening financing, and grasping opportunities—highlighting how the UK government should actively promote the green financial system. China also realized the critical role of green finance, by issuing of the Guidance on Building a Green Financial System in 2016. This marks China becoming the first country to formulate the highest-level policy design of the green finance development. Furthermore, green finance was listed in the agenda of the G20 summit under the initiative of China in 2016, which accelerated the progress regarding green finance globally. China’s 14th Five-Year Plan (2021) clearly stated the aim to “build a green development policy system and vigorously develop green finance”. At the end of 2021, the green loans balance of China has achieved about 15.9 trillion RMB, which was the largest stock globally, indicating a rapid green finance development.
If green finance was regarded as an effective institutional means, then technological innovation has always been considered as the fundamental method achieving green development in a sustainable manner [2,3]. At the national policy level, the Chinese government has also strongly supported technological innovation within enterprises. For example, in 2021, the Chinese government proposed to “transfer towards innovation-driven development and enhance enterprises’ technological innovation capabilities” in its 14th Five-Year Plan. Meanwhile, the Central Economic Work Conference also pointed out the need to “strengthen the key position of enterprise innovation, and increase support for the real economy, the scientific and technological innovation, along with the green development” in same year. The important role that technological innovation plays in enterprises in sustainable economic development has also been confirmed at the academic level. Companies will bear a certain trade-off cost between technological innovation and environmental protection activities. Once a company reaches a sufficient innovation level, it will reduce the trade-off cost and focus more on environmental issues, forming a virtuous circle [4]. At present, various environmental regulations, preferential subsidy policies, and continuous development of digital technologies have promoted corporate technological innovation [5,6,7,8].
Innovative technology requires elaborate research and development (R&D) and high preliminary costs [9]. From a business perspective, technological innovation is characterized by a long cycle and unpredictable investment return [10]. Funding the development of new technologies faces large inherent risks, which pose an enormous obstacle to the commercialization of new technologies [11]. Financing has become the key factor restricting corporate technological innovation. In particular, the capital market in China is not mature. Its market effectiveness is insufficient, and the development level of finance is still backward [12]. Constrained by financing cost and technological development, traditional finance cannot offer strong support to technological innovation. Financing difficulty is still a prominent problem for corporate technological innovation in China [13].
Financial reform has become key to promoting corporate technological innovation [14]. Being a new type of financial system, green finance promotes high-qualified development by adhering to the basic principles of green environmental protection and the low-carbon levels. It greatly facilitates the effective resources allocation, as well as encourages financial resources to invest in green and low-carbon projects, which can inspire companies to innovate and adopt a green and low carbon approach [15]. The Fifth Plenary Session of the 19th CPC Central Committee, which was held in 2020, emphasized the “support for the green finance development and the green technological innovation”. By definition, green finance refers to credit distributions according to environmental regulations [16]. Credits are generally allocated to innovative companies, especially those with strong green innovation capability, providing the possibility of innovation to companies with financing constraints [17]. Research has shown that the interacting of environmental information disclosure and green innovation plays a role in alleviating financing constraints [18]. Therefore, green finance injects “blood” into corporate technological innovation [19]. Hence, it is profoundly needed for a further investigation on how practically important the green finance is over the corporate technological innovation.
Recently, some papers have emphasized the impacts of green finance over the macro economy (such as economic growth [20], sustainable economic development [21,22], and high-quality development [23]), industrial structure upgrading at the middle level [24,25], and enterprise development at the micro level (such as enterprise performance [26] and enterprise innovation [27,28,29,30,31,32]). As far as we know, existing studies regarding green finance and enterprise innovation either focused on green credit, a sub-factor of green finance, and its effects over enterprises’ green innovation [27,28,29,30], or emphasized the association between green finance and green innovation [31,32]. Consequently, the focal study makes contribution to the extant literature by analyzing the impacts of green finance over corporate technological innovation.
In order to study whether and how green finance development provides incentives for corporate technological innovation, this focal study constructed a green finance indicator system by using the entropy method. We obtained data from 31 provinces in China, and the sample covers a period of 2010 to 2019. We matched non-financial listed firm data to examine the relationship regarding green finance and corporate technological innovation, and identified whether CSR reinforces their relationship. Our research led to two main findings: First, green finance can significantly improve an enterprise’s technological innovation level, and corporate social responsibility has a positive regulatory effect on this role. Second, heterogeneity analysis suggests that the positive effects regarding green finance over technological innovation is stronger in larger enterprises and in more economically developed eastern regions. More notably, green finance played a more prominent role before 2016.
The main contributions of this paper include three aspects: (1) We construct a green finance indicator system including green credits by using provincial level data. We discuss the influences of green finance development over corporate technological innovation. (2) Regarding heterogeneity analysis, this focal study examines the influences of green finance on corporate technological innovation from distinct perspectives, including company size, regions, and the time node of policy making. (3) We innovatively match the macro-level green finance development data with the micro-level corporate technological innovation and CSR data, which appropriately alleviates the endogeneity concern.
The rest of paper is organized as follows. In Section 2, we provide a literature review and propose research hypotheses; we present the data collection, variable construction, and model specification in Section 3; we provide an empirical analysis in Section 4; then in Section 5, we present the results of the robustness tests; and in Section 6, we draw on our conclusions, and discuss the limitations of this paper as well as the future research.

2. Literature Review and Hypotheses

2.1. Green Finance and Corporate Technological Innovation

Historically, green finance derives from the world’s first environmental bank, called the “Ecological Bank”, established in Germany in 1974. This presented a new beginning for connecting resource configuration and environmental protection. Globally, the green financial system needs to be developed and improved further [33]; therefore, there is currently no unified definition of it. Based on our research objectives as well as the definition of Jeucken and Bouma [34], green finance means that the financial sector includes environmental governance and protection in investment and financing activities. It can not only increase financing for clean projects but also reduce capital for pollution-heavy projects, thus achieving the green configuration of capital. Generally, green finance can be categorized into financial services and financial products. The former refers to financial services supporting the investments, financing, operations, and risk management of green projects, and the latter refers to financial products, such as green credits, green bonds, and stock indexes. The level of green finance development varies significantly per country [35,36]; additionally, there are critical variations between regions in each country [37,38]. However, we cannot ignore the critical role of green finance in alleviating waste and exhaust emissions [39] and mitigating climate change [40,41].
Green finance can not only improve corporate financial performance, environmental performance, and promote the internalization of pollution costs for companies with high pollution to a certain extent [42], but also solve the financing problems of eco-friendly companies. Indirect financing is dominant in China, whereby companies mainly conduct investment and financing through financial institutions. Thus, their financial decisions directly determine whether the financing of a company is smooth. A long-lasting cycle, high risks, and unpredictable investor returns are typical features of corporate technological innovation. If companies want to carry out innovation activities, they will face strict financing constraints in China. Green finance is an innovative financial system based on environmental protection principles [43]. Therefore, green finance provides financing convenience for technological innovation for companies facing financing difficulties. Owen et al. [44] examined the role of the public sector in grants, equities, debts, and new forms of crowdfunding. They suggested that a financial ecosystem should be built to ensure low-carbon investment at different levels—local, national, and international—to facilitate corporate innovation.
With social supervision and environmental regulations becoming more and more strict, green innovative projects, which have often difficulty in obtaining credit and funding support under the traditional financial system, can quickly obtain financing support through green finance [45]. In the traditional financial system, the financial sector mostly focuses on risk–revenue and profit maximization while ignoring the negative effects of environmental damage. However, in essence, green finance is a tool for adjusting credit ratios in consideration of environmental constraints, and it is inclined to allocate credit funds to innovative companies, especially those with strong green innovation [30]. Therefore, green finance can keep financial institutions from paying too much attention to economic benefits while ignoring the environment and provide investment and financing support for corporate green innovation. Sinha et al. [46] showed that if companies can actively disclose environmental information and engage in green innovation activities, their financing status can be improved. Owing to the phenomenon of “greenwashing”, Xing et al. [47] suggested that green innovation companies with higher environmental information disclosure will obtain more loans. Meanwhile, the development of green finance will guide financial institutions to fully consider environmental laws and regulations when making investment decisions [48]. As the environmental supervision and regulation become more and more strict, the influence of green finance driving technological innovation is increasing.
From what has been discussed above, green finance has greatly made up for the shortcomings of traditional finance, which does not consider environmental effects. And it is committed to serving companies with innovative requirements. Therefore, we hypothesize the following:
Hypothesis H1.
Green finance promotes corporate technological innovation.

2.2. Role of CSR in Corporate Technological Innovation and Green Finance

The concept of CSR originates from the charitable donation behavior of enterprise [49]. CSR now usually includes shareholder responsibility, supplier responsibility, employee responsibility, the rights and interests of consumer responsibility, and environmental responsibility. On the one hand, CSR can help companies build reputations in society and gain support from local governments and consumers, which will be converted into intangible and scarce assets, thus improving their market competitiveness [50,51]. On the other hand, to a certain extent, by fulfilling social responsibility, companies can gain attention and trust from financial institutions to obtain financing support [52].
In particular, good CSR performance has become a competitive advantage in corporate technological innovation. The greater the employee-related social responsibility, the stronger the company’s innovation ability [53], which in turn affects their value creation and financial performance [54]. Forcadell et al. [55] further showed that CSR improves the innovation ability of innovative companies and strengthens the innovation concept of noninnovative companies. Kraus et al. [56] found that environmental strategy and green innovation play a significant mediating role between CSR and environmental performance. Tsang et al. [57] showed that CSR contracts can coordinate stakeholders’ high requirements for CSR, thus promoting corporate technological innovation. Javeed et al. [58] suggested that environmental regulation, CSR, and corporate innovation are positively associated. Therefore, we hypothesize the following:
Hypothesis H2.
CSR promotes corporate technological innovation.
“Environmental responsibility” is a critical aspect of CSR. It breaks the traditional concept of “economic benefits only” [59]. From this dimension, the fulfillment of CSR can help green finance play a greater role in corporate performance. Chuang and Huang [60] found that CSR positively impacts green information technology (IT) and improves companies’ environmental performance and competitiveness.
Corporate technological innovation is a type of behavior with high investment, high risk, and strong periodicity. Financing constraint is the key hindrance to corporate technological innovation. The fulfillment of social responsibility can alleviate the financing constraints to a certain extent and promote corporate technological innovation. Examining the food industry, Deng and Lu [61] found that CSR and environmental performance are promoted mutually, and green finance can effectively improve the environmental performance. In addition, the more companies fulfill their social responsibility, the higher the “responsibility scores” they will obtain, which can further enhance their financing ability and in turn promote corporate technological innovation and the enhancement of CSR. Li et al. [62] investigated the effect of green bonds’ credit rating, CSR, and green certification on companies’ interest rates. They found that the interest rates are lower in the companies whose green bonds have green certificates. Moreover, according to stakeholder theory, the fulfillment of CSR can build a strong sense of trust and bonds between the government, financial institutions, companies, and consumers, and help companies obtain relevant information and knowledge from stakeholders, reduce company risk, and encourage companies to achieve innovation as soon as possible [63,64]. Therefore, we hypothesize the following:
Hypothesis H3.
CSR positively moderates the association between green finance and corporate technological innovation.

3. Research Design

3.1. Sample Selection and Data Sources

We chose all of the A-share nonfinancial listed companies in the Shanghai and Shenzhen Stock markets during 2010 and 2019 as our sample. We obtained data of green financial development from the China Statistical Yearbook, China Insurance Yearbook, and Statistical Yearbooks of provinces. We verified the positive influences regarding green financial development over corporate technological innovation by matching the green financial development level at the macro level with corporate technological innovation at the micro level. The indicator data measuring CSR were taken from the Chinese financial website HeXun (https://www.hexun.com/ (accessed on 20 January 2022)). Patent data measuring corporate technological innovation come from CSMAR, and data on property rights come from the CCER database. Referring to the industry and category codes are from the Guidelines for Industry Classification of Listed Companies (2012 revision), which was enacted by the China Securities Regulatory Commission (CSRC); we obtained the industry type that a company belongs to. Some endogeneity problems can be partially alleviated by integrating the data for listed companies and development of green finance both at the micro and macro levels.
The original samples were processed as follows: (1) Companies in the finance and insurance sectors were excluded owing to the great differences between those industries and other industries in terms of their corporate regulatory systems and reporting structures. (2) Companies that are marked *ST or ST were excluded owing to abnormal financial situations and trading mechanisms. (3) Companies missing key variables such as corporate technological innovation, green finance, or CSR were excluded. (4) Companies with an asset–liability ratio greater than 100% (i.e., insolvent companies) were excluded. (5) To exclude the impacts of abnormal values in the regression model, all continuous variables were winsorized at the 1% level. Therefore, our regression analysis was carried out based on 8852 companies using Stata15.

3.2. Variable Selection

3.2.1. Explained Variable: Corporate Technological Innovation

There are mainly two methods used in the existing literature to measure corporate technological innovation: input [65,66] and output [67,68]. With reference to the output perspective, this paper measures the technological innovation level with the patent applications numbers [10,69]. We collected the lists and annual reports of listed firms, and obtained the numbers of their invention, utility model, and design patents applied per year from the patent query system. The variable Apply was measured by the natural logarithm of patent applications number plus 1, and the variable RD was proxied by the natural logarithm of the number of R&D investments plus 1. These two variables were taken as proxies of the technological innovation.

3.2.2. Explanatory Variable: Green Finance

The explanatory variable of our research is green financial development, and is recorded as Green. The key to calculating the green financial development index lies in the weight setting of the indicators. Currently, the main methods involving the weight setting for measuring the green financial development level include entropy assessment, expert consultation, analytic hierarchy process, etc. It is believed that the objective weighting methods are superior to the subjective ones. Hence, this focal study abandoned the subjective weighting evaluation methods, and instead adopted entropy weighting evaluation, which is an objective method [70]. Based on Shao et al. [70], we established an index system that includes green credits, green insurance, green investment, and government support for green financial development at the provincial level. Table 1 presents the descriptions, measurements, and the properties of these indicators.
Figure 1 shows three geographical regions (east, central, and west) and their average green financial development trends from 2010 to 2019. The figure demonstrates a rapid expansion of green finance during the past decade. Specifically, the average level of green finance increased from 0.131 in 2010 to 0.227 in 2019. The average growth rate for each year was 7.328%. Growth rates were also high in all three regions. The eastern regions ranked the highest average growth rate per year of 2%, the central regions ranked the second with 1%, and the western regions ranked the third with 0.9%. The green finance development rate in these three regions varied unevenly. We could observe the highest and lowest increase in the east and west regions, respectively. Whilst there was little difference between the central and the western regions, they did not show signs of narrowing trends.

3.2.3. Moderating Variable

In this study, the moderator is CSR and it is recorded as CSR. In existing literature, CSR is mainly measured on the dimensions of stakeholders, social responsibility performance, social responsibility content, and the amount of corporate charitable donations. Listed companies are scored on HeXun according to the rights and interests of shareholders, suppliers, employees, consumers, and the environment. Professional evaluation results are published in the form of social responsibility reports. Additionally, we assumed that companies with higher scores have greater social responsibility. Therefore, with reference to Pan et al. [71], we measured CSR with the natural logarithm of the total score of the CSR rating published by HeXun.

3.2.4. Control Variables

Following Jiang et al. [72], we selected focal control variables that influence technological innovation in the regression analysis in the following: (1) The variable Age represents the operating years of the company, reflecting the company characteristics. We measured it by using the natural logarithm form of the company’s operating years. (2) We measured the variable Growth with the growth rate of business revenue. The variable Tobin represents Tobin’s Q value. These two variables reflect the debt-paying ability of the company. (3) The variable Own_con represents ownership concentration. We measured it with the shares ratio holding by the biggest majority shareholder, reflecting company’s governance situation. (4) The binary variable Gov_con reflects corporate nature. If the company is state owned, Gov_con = 1; otherwise, Gov_con = 0. (5) The variable Pergdp represents the level of regional development and is measured by the natural logarithm form of GDP per capita. In reference to Weike et al. [45], not limited to including the year and industry fixed effect, we also added the enterprise fixed effects. We summarize the variable definitions, including descriptions, measurements, and attributes, in Table 2.

3.3. Model Specification

First, we examined the relationship of green financial development and corporate technological innovation with the following benchmark model:
I n n o v i t = α 0 + α 1 G r e e n i t + α j C o n t r o l i t + y e a r + i n d + f i r m + ε i t
Second, we empirically tested the moderation effects of CSR over the relationship of green finance and corporate technological innovation with the following moderation model:
I n n o v i t = β 0 + β 1 C S R i t + β 2 G r e e n i t + β 3 G r e e n i t × C S R i t + γ j C o n t r o l i t + y e a r + i n d + f i r m + ε i t
where i is the ordering number of the company, and t refers to the ordering number of the year. The explained variable Innov represents the corporate technological innovation level. Green financial development (Green) presents the core explanatory variable, and CSR is the moderator. Control integrates the control variables, including operating years of the company (Age), growth rate of company business revenue (Growth), ownership concentration (Own_con), Tobin’s Q value (Tobin), company nature (Gov_con), and regional development level (Pergdp). The variables ind, year, and firm indicate the industry, year, and enterprise fixed effects, respectively. α0 and β0 are the intercept terms. ε presents the stochastic disturbance term.

4. Empirical Results

4.1. Descriptive Statistics

We present our descriptive statistics of the key variables in Table 3. On average, the average innovation level (Apply) of Chinese nonfinancial listed firms was 3.7188, and the median was 4.0604. Simultaneously, the standard deviation of enterprise innovation was 2.1374, and the maximum number was 8.4167 while the minimum number was 0, which indicates that the enterprise innovation (Apply) differed among different enterprises. On average, the green financial development level (Green) was 0.2503, the minimized number was 0.0890, and the maximized number was 0.6272, which shows that the green financial development level varies between regions. Regarding the average level of CSR, the standard deviation was 2.6722, the minimized number was 0.4000, and the maximized number was 15.0000, reflecting that the fulfillment of social responsibility between companies was also different. Statistical results for other related variables in this article are detailed in the following table.

4.2. Benchmark Test

We present the benchmark regression results for green financial development and corporate technological innovation in Table 4. The first column only controls the variable Green. The regression coefficient of Green (green financial development) is 0.7474, which is positively significant at the 1% level, with other variables not controlled, indicating that an improved green financial development level can greatly increase the likelihood of companies participating in technical innovation. In other words, green financial development incentivizes technological innovation. These findings support Hypothesis H1. After we controlled for company property nature, year, enterprise, and industry fixed effect, we obtained the regression coefficient of green financial development (Green) of 0.7080 in Model (2), which remains positively significant at the 1% level, indicating that green financial development still significantly promotes corporate technological innovation. Green financial development helps companies with good environmental effects but insufficient economic benefits under traditional finance to obtain financial support, thus promoting corporate technological innovation. To obtain more robust results, we conducted regression tests by adding control variables step by step. The results suggest that the regression coefficient of green financial development (Green) remains positive and significant after the sequential addition of operating years of the company (Age), growth rate of business revenue (Growth), Tobin’s Q value (Tobin), ownership concentration (Own_con), corporate nature (Gov_con), and regional development level (Pergdp). Models (3)–(7) of Table 4 present the results.

4.3. Moderating Effect Test

The previous section discussed the promoting role of green financial development on corporate technological innovation. We now explore two important questions: First, will the subjective behavior of companies (e.g., social responsibility) affect the role of influence of green finance over corporate technological innovation? Second, if CSR does play a moderating role, will the impacts of green financial development over corporate technological innovation increase with the improvement of CSR?
We show the regression results regarding the moderating effects of CSR in Table 5. Column (1) shows that when it is separately added to Model (1), CSR has a positive and significant influence over corporate technological innovation, indicating that the fulfillment of CSR significantly promotes corporate technological innovation. Therefore, improving CSR can effectively promote the level of technological innovation within companies. This finding supports Hypothesis H2. According to Model (2), the cross term of Green and CSR is significantly positive, demonstrating that overall, CSR strengthens the positive impacts of green finance over corporate technological innovation. A higher level of CSR strengthens the positive impacts of green finance over technological innovation. This finding supports Hypothesis H3.

5. Robustness Tests

5.1. Replacement of Explained Variable

In the benchmark regression models, we used the “number of applied patents” to proxy corporate technological innovation. In the robustness test, we replace the focal explained variable using the measurement of the natural logarithm form of R&D investment plus 1. Table 6 presents the re-estimated regression analysis results. Column (1) only controls the variable green financial development (Green), and its regression coefficient is positively significant at the 1% level, indicating that green financial development does significantly improve corporate technological innovation. After controlling for company nature, regional effect, and year effect, the regression results in Model (2) show that green financial development still significantly promotes corporate technological innovation. In order to obtain more robust results, regression is carried out by sequentially adding control variables. It is found that after gradually controlling the variables of company characteristics (Age), company governance (Own_con), and regional development level (Pergdp), the coefficient of green finance development (Green) is always positively significant at the 1% level, which supports the above-mentioned conclusions again.

5.2. Heterogeneity Analysis

5.2.1. Subsample Regression on Companies of Different Sizes

The advantage of green finance over traditional finance is that its financial services are no longer simply measured by economic benefit but also by environmental performance. In traditional financial markets, small companies are often in an inferior position in terms of information acquisition owing to their size and attribute restrictions, and the imperfect information disclosure systems. This results in the “difficult and expensive financing” problem in their investment and financing behaviors. Green finance is a policy design based on environmental protection at high-quality development levels. At the current stage, there is still a long way to go regarding the innovation demands of small companies. By contrast, large companies face fewer financing restrictions because of sound systems and mechanisms, and they can seize the “golden opportunity” of green financial development to achieve technological innovation. According to the asset scale, listed nonfinancial companies are divided into four levels based on 1/4, 2/4, 3/4, and 1 quantile. Listed companies before the 1/4 quartile and those after the 3/4 quartile were selected as samples for regression. Table 7 presents the analysis results. We could notice that green financial development can significantly enhance innovation in large companies rather than small ones by comparing numbers of both Models (1) and (2). The focal regression coefficient is positively significant at the 1% level. Therefore, future green finance policies should gradually tilt towards smaller companies.

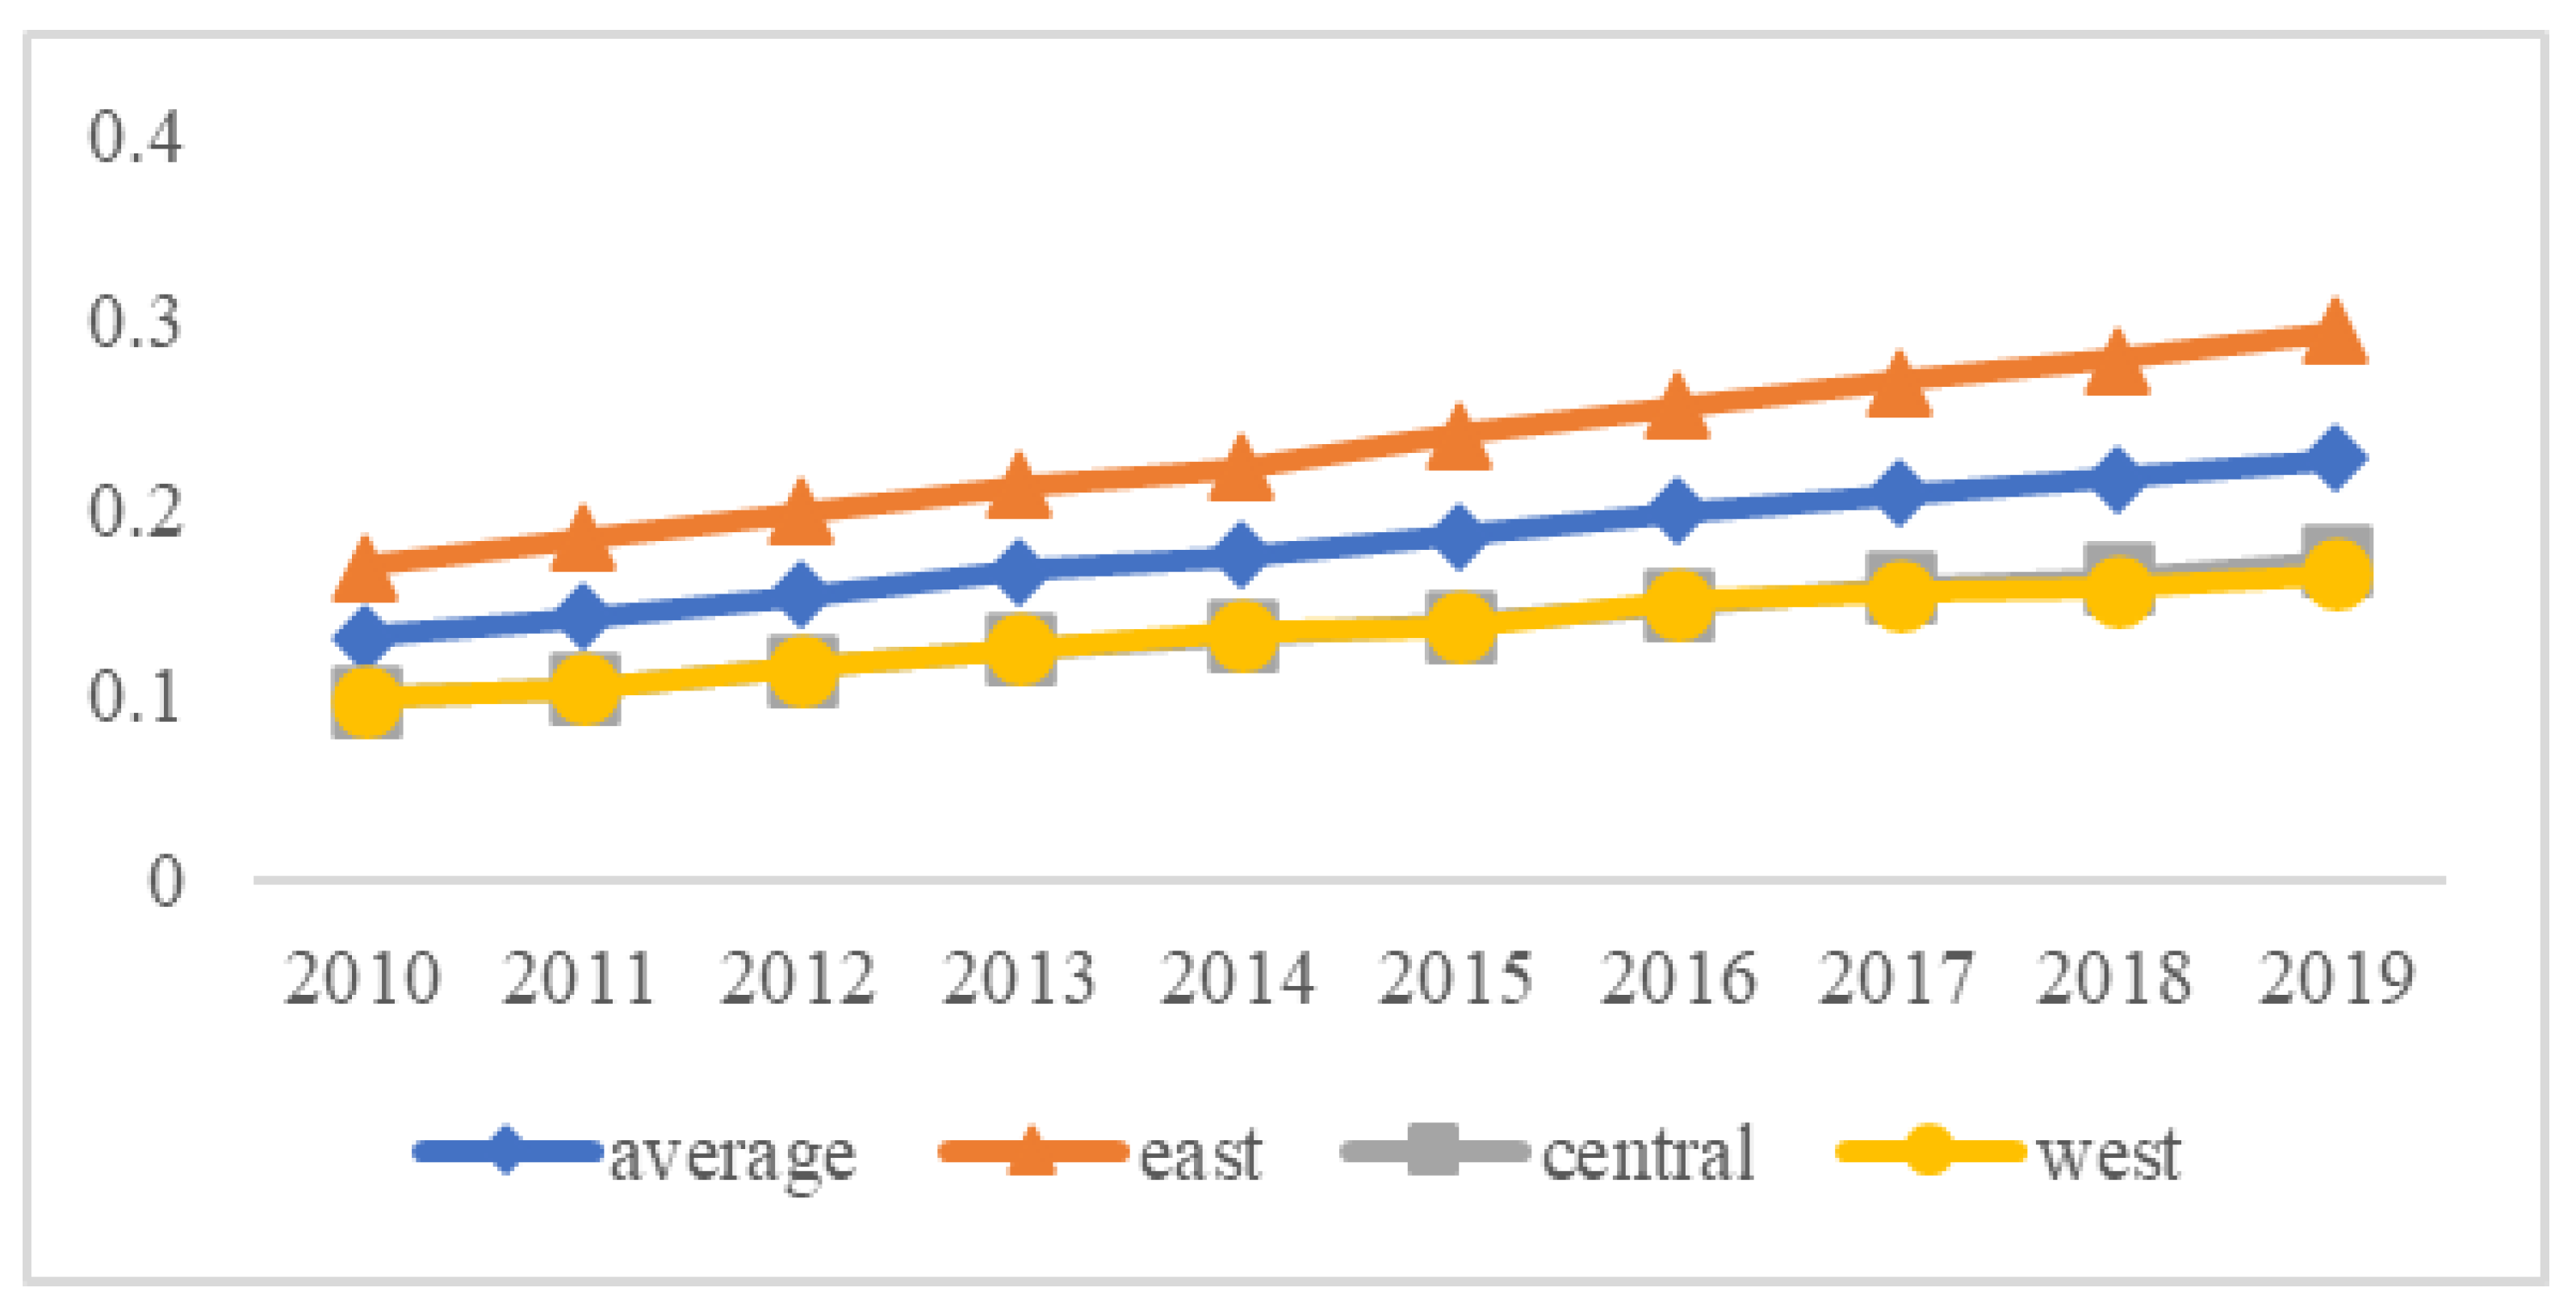
5.2.2. Subsample Regression of Companies in the Eastern, Western, and Central Regions

To further verify our regression results’ robustness, this focal research further examined whether the impacts regarding green financial development over corporate technological innovation are heterogeneous between different regions. All samples were separated into western, eastern, and central subsamples. Table 8′s Models (1) to (3) present the regression results showing that the effect regarding green finance over enterprise technological innovation is positively significant at the 1% level in the eastern region, whilst such effects are insignificant for both the central and western regions. The results imply that green financial development (Green) has significant heterogeneity between different regions. This is because the economic development level and competitive environment in the western region is low, and companies face stronger financing constraints. This may partly explain why the impact of green finance over corporate technological innovation is insignificant in the western regions. Therefore, differences in regions where the enterprises are located will directly affect the effect of green finance.

5.2.3. Subsample Regression with 2016 as the Cutoff Point

As aforementioned, China promulgated the 13th Five-Year Plan outline in March 2016, which clearly emphasizes the need to vigorously implement green finance tools such as green bonds, funds and credits, and also points out the need to construct green finance systems for facilitating the improvement of green finance. Furthermore, 2016 was the year in which green financial development started to be actively promoted at the strategic and practical levels in China. Seven ministries enhanced the Guidance on Building a Green Financial System jointly, proposing specific countermeasures, and precisely detailing how to construct green finance systems. Therefore, we chose the year of 2016 as a cutoff point to conduct subsample regression on companies. In columns (1) and (2) of Table 9, the results indicate that there still is a positive and significant influence of green financial development over corporate technological innovation. The coefficient was higher prior to 2016, which implies a stronger role of green financial development before 2016.

6. Conclusions, Limitations, and Future Research

6.1. Conclusions

Using all the A-share listed non-financial companies in Shanghai and Shenzhen Stocks from 2010 to 2019, this focal study theoretically analyzed and empirically tested the promoting effect of green financial development on corporate technological innovation, as well as CSR as a moderator. There are four principal findings: First, green financial development critically promotes corporate technological innovation. Second, such a positive association of green finance and corporate technological innovation will be strengthened with more fulfillment of CSR. Third, the robustness tests further indicate that green financial development has played a greater role in large-scale companies and eastern companies compared to small-scale companies and those in the western and central regions. Fourth, green financial development played a more important role prior to 2016. This indicates that the current green finance index system still needs to be improved by introducing corporate resources and region factors with a moderate tilt toward small-scale companies and those in underdeveloped regions. In this way, green finance can benefit all regions and fulfill the role of promoting common prosperity and mass innovation.
The following implications can be drawn from the study conclusions: (1) We should vigorously develop green finance, since under information disclosure and environmental regulation constraints, it can significantly promote corporate technological innovation. Through the credit-screening mechanisms of financial institutions, we should dredge credit financing channels to relieve financing constraints and accelerate corporate technological innovation and transformation. (2) When providing financial services for companies, green financial institutions should select targeted groups and give full support to small-scale companies in underdeveloped areas to achieve accurate connection and services. They should also accomplish the search and collection of related information to ensure information accuracy and authenticity, and avoid financial risks. (3) Companies should take the initiative to disclose related information and seek services in the face of financing difficulties. They should also take a forward-looking view of technological innovation, and realize transformation and upgrading as soon as possible, striving to achieve technological innovation in step with high-quality development.

6.2. Limitations and Future Research

In the future, researchers may require to further investigate the association between green financial development and corporate technological innovation for three main reasons: (1) As it is difficult to clearly define and observe the inputs and outputs of a company’s green R&D, it is necessary to conduct case studies to test possible causal relationships. (2) This focal research only included the A-share listed nonfinancial companies in China as sample firms. Although generally, our sample data fit the requirements of this focal paper, since the impacts of green finance over heavy-polluting companies may be more significant, further research is necessary. (3) Green credit and green bond are two important components of the green finance system. The relationship between green credit or green bond and technological innovation is also worth exploring in the future.

Author Contributions

Conceptualization, X.L.; methodology, X.L.; software, X.L.; validation, X.L. and Y.Y.; formal analysis, X.L.; investigation, X.L.; data curation, X.L.; writing—original draft preparation, X.L.; writing—review and editing, Y.Y.; visualization, Y.Y.; supervision, Y.Y.; funding acquisition, Y.Y. All authors have read and agreed to the published version of the manuscript.

Funding

This research was funded by Shandong Provincial Social Science Planning Project of China, grant number 21DGLJ23.

Institutional Review Board Statement

Not applicable.

Informed Consent Statement

Not applicable.

Data Availability Statement

Data are available from the corresponding authors upon reasonable request.

Conflicts of Interest

The authors declare no conflict of interest.

References

  1. Lee, J.W. Green finance and sustainable development goals: The case of China. J. Asian. Financ. Econ. Bus. 2020, 7, 577–586. [Google Scholar] [CrossRef]
  2. Li, D.; Zheng, M.; Cao, C.; Chen, X.; Ren, S.; Huang, M. The impact of legitimacy pressure and corporate profitability on green innovation: Evidence from China top 100. J. Clean. Prod. 2017, 141, 41–49. [Google Scholar] [CrossRef] [Green Version]
  3. Hazarika, N.; Zhang, X. Evolving theories of eco-innovation: A systematic review. Sustain. Prod. Consum. 2019, 19, 64–78. [Google Scholar] [CrossRef]
  4. Lee, J.; Kim, S.-J. Curvilinear relationship between corporate innovation and environmental sustainability. Sustainability 2017, 9, 1267. [Google Scholar] [CrossRef] [Green Version]
  5. Fang, Z.; Kong, X.; Sensoy, A.; Cui, X.; Cheng, F. Government’s awareness of environmental protection and corporate green innovation: A natural experiment from the new environmental protection law in China. Econ. Anal. Pol. 2021, 70, 294–312. [Google Scholar] [CrossRef]
  6. Lv, M.; Bai, M. Evaluation of China’s carbon emission trading policy from corporate innovation. Financ. Res. Lett. 2021, 39, 101565. [Google Scholar] [CrossRef]
  7. Xia, L.; Gao, S.; Wei, J.; Ding, Q. Government subsidy and corporate green innovation—Does board governance play a role? Energy Policy 2021, 161, 112720. [Google Scholar] [CrossRef]
  8. Blichfeldt, H.; Faullant, R. Performance effects of digital technology adoption and product & service innovation—A process-industry perspective. Technovation 2021, 105, 102275. [Google Scholar] [CrossRef]
  9. Lam, P.T.I.; Law, A.O.K. Crowdfunding for renewable and sustainable energy projects: An exploratory case study approach. Renew. Sust. Energy Rev. 2016, 60, 11–20. [Google Scholar] [CrossRef] [Green Version]
  10. Liu, S.; Du, J.; Zhang, W.; Tian, X. Opening the box of subsidies: Which is more effective for innovation? Eurasian Bus. Rev. 2021, 11, 421–449. [Google Scholar] [CrossRef]
  11. Cao, S.; Nie, L.; Sun, H.; Sun, W.; Taghizadeh-Hesary, F. Digital finance, green technological innovation and energy-environmental performance: Evidence from China’s regional economies. J. Clean. Prod. 2021, 327, 129458. [Google Scholar] [CrossRef]
  12. He, Y.; Ding, X.; Yang, C. Do environmental regulations and financial constraints stimulate corporate technological innovation? Evidence from China. J. Asian Econ. 2021, 72, 101265. [Google Scholar] [CrossRef]
  13. Ang, J.S.; Cheng, Y.; Wu, C. Does enforcement of intellectual property rights matter in China? Evidence from financing and investment choices in the high-tech industry. Rev. Econ. Stat. 2014, 96, 332–348. [Google Scholar] [CrossRef]
  14. Yuan, G.; Ye, Q.; Sun, Y. Financial innovation, information screening and industries’ green innovation—Industry-level evidence from the OECD. Technol. Forecast. Soc. Chang. 2021, 171, 120998. [Google Scholar] [CrossRef]
  15. Meo, M.S.; Karim, M.Z.A. The role of green finance in reducing CO2 emissions: An empirical analysis. Borsa Istanbul Rev. 2022, 22, 169–178. [Google Scholar] [CrossRef]
  16. Zhang, Y.; Li, X.; Xing, C. How does China’s green credit policy affect the green innovation of high polluting enterprises? The perspective of radical and incremental innovations. J. Clean. Prod. 2022, 336, 130387. [Google Scholar] [CrossRef]
  17. Wang, Y.; Li, M. Credit policy and its heterogeneous effects on green innovations. J. Financ. Stab. 2022, 58, 100961. [Google Scholar] [CrossRef]
  18. Zhang, Y.; Xing, C.; Wang, Y. Does green innovation mitigate financing constraints? Evidence from China’s private enterprises. J. Clean. Prod. 2020, 264, 121698. [Google Scholar] [CrossRef]
  19. Tolliver, C.; Fujii, H.; Keeley, A.R.; Managi, S. Green innovation and finance in Asia. Asian Econ. Pol. Rev. 2021, 16, 67–87. [Google Scholar] [CrossRef]
  20. Yin, X.; Xu, Z. An empirical analysis of the coupling and coordinative development of China’s green finance and economic growth. Res. Pol. 2022, 75, 102476. [Google Scholar] [CrossRef]
  21. Liu, N.; Liu, C.; Xia, Y.; Ren, Y.; Liang, J. Examining the coordination between green finance and green economy aiming for sustainable development: A case study of China. Sustainability 2020, 12, 3717. [Google Scholar] [CrossRef]
  22. Long, J.; Zhong, C.; Bilal, A.; Muhammad, I.; Rabia, N. How do green financing and green logistics affect the circular economy in the pandemic situation: Key mediating role of sustainable production. Econ. Res. Istraz. 2021. [Google Scholar] [CrossRef]
  23. Wang, F.; Wang, R.; He, Z. The impact of environmental pollution and green finance on the high-quality development of energy based on spatial Dubin model. Resour. Pol. 2021, 74, 102451. [Google Scholar] [CrossRef]
  24. Qi, R.; Qi, L. Can synergy effect exist between green finance and industrial structure upgrade in China? Open J. Soc. Sci. 2020, 8, 215–226. [Google Scholar] [CrossRef]
  25. Wang, X.; Wang, Q. Research on the impact of green finance on the upgrading of China’s regional industrial structure from the perspective of sustainable development. Resour. Pol. 2021, 74, 102436. [Google Scholar] [CrossRef]
  26. Xu, H.; Mei, Q.; Shahzad, F.; Liu, S.; Long, X.; Zhang, J. Untangling the impact of green finance on the enterprise green performance: A meta-analytic approach. Sustainability 2020, 12, 9085. [Google Scholar] [CrossRef]
  27. Yu, C.-H.; Wu, X.; Zhang, D.; Chen, S.; Zhao, J. Demand for green finance: Resolving financing constraints on green innovation in China. Energy Policy 2021, 153, 112255. [Google Scholar] [CrossRef]
  28. Tan, X.; Yan, Y.; Dong, Y. Peer effect in green credit induced green innovation: An empirical study from China’s Green Credit Guidelines. Resour. Pol. 2022, 76, 102619. [Google Scholar] [CrossRef]
  29. Wang, H.; Qi, S.; Zhou, C.; Zhou, J.; Huang, X. Green credit policy, government behavior and green innovation quality of enterprises. J. Clean. Prod. 2022, 331, 129834. [Google Scholar] [CrossRef]
  30. Hong, M.; Li, Z.; Drakeford, B. Do the green credit guidelines affect corporate green technology innovation? Eempirical research from China. Int. J. Environ. Res. Public Health 2021, 18, 1682. [Google Scholar] [CrossRef]
  31. Zhao, T.; Zhou, H.; Jiang, J.; Yan, W. Impact of green finance and environmental regulations on the green innovation efficiency in China. Sustainability 2022, 14, 3206. [Google Scholar] [CrossRef]
  32. Fang, Y.; Shao, Z. Whether green finance can effectively moderate the green technology innovation effect of heterogeneous environmental regulation. Int. J. Environ. Res. Public Health 2022, 19, 3646. [Google Scholar] [CrossRef] [PubMed]
  33. Taghizadeh-Hesary, F.; Yoshino, N. The way to induce private participation in green finance and investment. Financ. Res. Lett. 2019, 31, 98–103. [Google Scholar] [CrossRef]
  34. Jeucken, M.H.A.; Bouma, J.J. The changing environment of banks. Greener Manag. Int. 1999, 27, 20–35. [Google Scholar] [CrossRef]
  35. Peng, H.; Feng, T.; Zhou, C. International experiences in the development of green finance. Am. J. Ind. Bus. Manag. 2018, 8, 385–392. [Google Scholar] [CrossRef] [Green Version]
  36. Falcone, P.M.; Sica, E. Assessing the opportunities and challenges of green finance in Italy: An analysis of the biomass production sector. Sustainability 2019, 11, 517. [Google Scholar] [CrossRef] [Green Version]
  37. Zhou, H.; Xu, G. Research on the impact of green finance on China’s regional ecological development based on system GMM model. Resour. Pol. 2022, 75, 102454. [Google Scholar] [CrossRef]
  38. Lv, C.; Bian, B.; Lee, C.-C.; He, Z. Regional gap and the trend of green finance development in China. Energy Econ. 2021, 102, 105476. [Google Scholar] [CrossRef]
  39. Zhang, S.; Wu, Z.; Wang, Y.; Hao, Y. Fostering green development with green finance: An empirical study on the environmental effect of green credit policy in China. J. Environ. Manag. 2021, 296, 113159. [Google Scholar] [CrossRef]
  40. Ren, X.; Shao, Q.; Zhong, R. Nexus between green finance, non-fossil energy use, and carbon intensity: Empirical evidence from China based on a vector error correction model. J. Clean. Prod. 2020, 277, 122844. [Google Scholar] [CrossRef]
  41. Muganyi, T.; Yan, L.; Sun, H.-P. Green finance, fintech and environmental protection: Evidence from China. Environ. Sci. Ecotechnol. 2021, 7, 100107. [Google Scholar] [CrossRef]
  42. Zhang, A.; Wang, S.; Liu, B. How to control air pollution with economic means? Exploration of China’s green finance policy. J. Clean. Prod. 2022, 353, 131664. [Google Scholar] [CrossRef]
  43. Khalil, M.A.; Nimmanunta, K. Conventional versus green investments: Advancing innovation for better financial and environmental prospects. J. Sustain. Financ. Investig. 2022. [Google Scholar] [CrossRef]
  44. Owen, R.; Brennan, G.; Lyon, F. Enabling investment for the transition to a low carbon economy: Government policy to finance early stage green innovation. Curr. Opin. Environ. Sustain. 2018, 31, 137–145. [Google Scholar] [CrossRef]
  45. Zhang, W.K.; Luo, Q.; Liu, S. Is government regulation a push for corporate environmental performance? Evidence from China. Econ. Anal. Policy 2022, 74, 105–121. [Google Scholar] [CrossRef]
  46. Sinha, A.; Mishra, S.; Sharif, A.; Yarovaya, L. Does green financing help to improve environmental & social responsibility? Designing SDG framework through advanced quantile modelling. J. Environ. Manag. 2021, 292, 112751. [Google Scholar] [CrossRef]
  47. Xing, C.; Zhang, Y.; Tripe, D. Green credit policy and corporate access to bank loans in China: The role of environmental dis-closure and green innovation. Int. Rev. Financ. Anal. 2021, 77, 101838. [Google Scholar] [CrossRef]
  48. Zhou, X.; Du, J. Does environmental regulation induce improved financial development for green technological innovation in China? J. Environ. Manag. 2021, 300, 113685. [Google Scholar] [CrossRef]
  49. Dahlsrud, A. How corporate social responsibility is defined: An analysis of 37 definitions. Corp. Soc. Responsib. Environ. Manag. 2008, 15, 1–13. [Google Scholar] [CrossRef]
  50. Russo, M.V.; Fouts, P.A. A resource-based perspective on corporate environmental performance and profitability. Acad. Manag. J. 1997, 40, 534–559. [Google Scholar] [CrossRef] [Green Version]
  51. Ye, N.; Kueh, T.-B.; Hou, L.; Liu, Y.; Yu, H. A bibliometric analysis of corporate social responsibility in sustainable development. J. Clean. Prod. 2020, 272, 122679. [Google Scholar] [CrossRef]
  52. Cheng, B.; Ioannou, I.; Serafeim, G. Corporate social responsibility and access to finance. Strategic Manag. J. 2014, 35, 1–23. [Google Scholar] [CrossRef]
  53. Liu, B.; Sun, P.-Y.; Zeng, Y. Employee-related corporate social responsibilities and enterprise technological innovation: Evidence from China. Int. Rev. Econ. Financ. 2020, 70, 357–372. [Google Scholar] [CrossRef]
  54. Broadstock, D.C.; Matousek, R.; Meyer, M.; Tzeremes, N.G. Does corporate social responsibility impact firms’ innovation capacity? The indirect link between environmental & social governance implementation and innovation performance. J. Bus. Res. 2020, 119, 99–110. [Google Scholar] [CrossRef]
  55. Forcadell, F.J.; Úbeda, F.; Aracil, E. Effects of environmental corporate social responsibility on innovativeness of Spanish industrial SMEs. Technol. Forecast. Soc. Chang. 2021, 162, 120355. [Google Scholar] [CrossRef]
  56. Kraus, S.; Rehman, S.U.; García, F.J.S. Corporate social responsibility and environmental performance: The mediating role of environmental strategy and green innovation. Technol. Forecast. Soc. Chang. 2020, 160, 120262. [Google Scholar] [CrossRef]
  57. Tsang, A.; Wang, K.T.; Liu, S.; Yu, L. Integrating corporate social responsibility criteria into executive compensation and firm innovation: International evidence. J. Corp. Financ. 2021, 70, 102070. [Google Scholar] [CrossRef]
  58. Javeed, S.A.; Latief, R.; Jiang, T.; Ong, T.S.; Tang, Y. How environmental regulations and corporate social responsibility affect the firm innovation with the moderating role of chief executive officer (CEO) power and ownership concentration? J. Clean. Prod. 2021, 308, 127212. [Google Scholar] [CrossRef]
  59. Abbas, J. Impact of total quality management on corporate sustainability through the mediating effect of knowledge management. J. Clean. Prod. 2020, 244, 118806. [Google Scholar] [CrossRef]
  60. Chuang, S.P.; Huang, S.J. The effect of environmental corporate social responsibility on environmental performance and business competitiveness: The mediation of green information technology capital. J. Bus. Ethics. 2018, 150, 991–1009. [Google Scholar] [CrossRef]
  61. Deng, X.; Lu, J. The environmental performance, corporate social responsibility, and food safety of food companies from the perspective of green finance. Revista Cercetare Soc. 2017, 58, 178–200. [Google Scholar]
  62. Li, Z.; Tang, Y.; Wu, J.; Zhang, J.; Lv, Q. The interest costs of green bonds: Credit ratings, corporate social responsibility, and certification. Emerg. Mark. Financ. Trade 2019, 56, 2679–2692. [Google Scholar] [CrossRef]
  63. Wartick, S.L.; Cochran, P.L. The evolution of the corporate social performance model. Acad. Manag. Rev. 1985, 10, 758–769. [Google Scholar] [CrossRef]
  64. Ji, H.; Miao, Z. Corporate social responsibility and collaborative innovation: The role of government support. J. Clean. Prod. 2020, 260, 121028. [Google Scholar] [CrossRef]
  65. Hamamoto, M. Environmental regulation and the productivity of Japanese manufacturing industries. Resour. Energy Econ. 2006, 28, 299–312. [Google Scholar] [CrossRef]
  66. Yang, C.-H.; Tseng, Y.-H.; Chen, C.-P. Environmental regulations, induced R&D, and productivity: Evidence from Taiwan’s manufacturing industries. Resour. Energy Econ. 2012, 34, 514–532. [Google Scholar] [CrossRef]
  67. Hall, B.H.; Harhoff, D. Recent research on the economics of patents. Annu. Rev. Econ. 2012, 4, 541–565. [Google Scholar] [CrossRef] [Green Version]
  68. Rubashkina, Y.; Galeotti, M.; Verdolini, E. Environmental regulation and competitiveness: Empirical evidence on the Porter Hypothesis from European manufacturing sectors. Energy Pol. 2015, 83, 288–300. [Google Scholar] [CrossRef] [Green Version]
  69. Zhang, W.; Tian, X.; Yu, A. Is high-speed rail a catalyst for the fourth industrial revolution in China? Story of enhanced technology spillovers from venture capital. Technol. Forecast. Soc. Chang. 2020, 161, 120286. [Google Scholar] [CrossRef]
  70. Shao, Q.; Li, J.; Zhao, L. A four-dimensional evaluation of the urban comprehensive carrying capacity of the Yangtze River Delta, China. Sustainability 2019, 11, 6816. [Google Scholar] [CrossRef] [Green Version]
  71. Pan, X.; Sinha, P.; Chen, X. Corporate social responsibility and eco-innovation: The triple bottom line perspective. Corp. Soc. Responsib. Environ. Manag. 2021, 28, 214–228. [Google Scholar] [CrossRef]
  72. Jiang, Z.; Wang, Z.; Lan, X. How environmental regulations affect corporate innovation? The coupling mechanism of man-datory rules and voluntary management. Technol. Soc. 2021, 65, 101575. [Google Scholar] [CrossRef]
Figure 1. Green finance development trends in China.
Sustainability 14 05648 g001
Table 1. Indicator system for green financial development.
IndicatorsDescriptionsMeasurementsProperties
Green creditPercentages of interest
expenses in
energy-intensive
industries
Interest expenses of six
energy-intensive industries divided by the total
industrial interest expenses
Green investmentPercentages of
environmental pollution control investment in GDP
Environmental pollution
control investment
divided by the GDP
+
Green insuranceAgricultural insurance
penetration
Income from agricultural insurance divided by the
total value of agricultural output
+
Government supportPercentages of expenditure regarding financial
environmental protection
Financial environmental protection
expenditure divided
by the general financial
budget expenditure
Table 2. Variable definitions.
VariablesDescriptionsMeasurementsAttributes
ApplyThe number of
patent applications
Natural logarithm form
of the number
of patent applications + 1
Explained variables
RDThe number of
R&D investment
Natural logarithm form of
R&D investment + 1
GreenGreen financial
development
Indicator for green financial
development at the provincial level
Explanatory variable
CSRCorporate social
responsibility
Natural logarithm form of
the total score of CSR rating
published on HeXun
Moderating variable
AgeOperating years
of the company
Natural logarithm form of the
company’s operating years
Control variables
GrowthBusiness revenue
growth rate
Annual growth rate of
business revenue
TobinThe value of Tobin’s QThe value of Tobin’s Q
Own_conOwnership concentrationShareholding ratio of the
first majority shareholder
Gov_conCompany natureIf the company is state owned,
Gov_con = 1; otherwise, Gov_con = 0
PergdpRegional development levelNatural logarithm form
of GDP per capita
Table 3. Descriptive statistical results for the key variables.
VariablesMeanStdMinMedianMax
Apply3.71882.13740.00004.06048.4167
RD17.88481.237014.985917.780721.6423
Green0.25030.13280.08900.22890.6272
CSR4.46612.67220.40003.730015.0000
Age1.62340.93700.00001.60943.1781
Growth0.32600.47510.00370.16132.8523
Own_con0.34650.14260.08780.33260.7306
Tobin2.03471.10010.90901.67956.9076
Gov_con0.09230.28940.00000.00001.0000
Pergdp11.13370.452810.035611.158612.0110
Table 4. Regression results for green financial development and corporate technological innovation.
(1)(2)(3)(4)(5)(6)(7)
Green0.7474 ***0.7080 ***0.8381 ***0.8338 ***0.8462 ***0.8308 ***1.3483 ***
(2.5986)(2.5818)(3.0494)(3.0337)(3.0576)(3.0029)(3.5225)
Gov_con 0.3075 ***0.2721 ***0.2724 ***0.2728 ***0.2663 ***0.2594 ***
(4.2915)(3.8001)(3.8053)(3.7406)(3.6453)(3.5471)
Age 0.2588 ***0.2808 ***0.2900 ***0.2985 ***0.2913 ***
(8.5422)(8.8290)(8.9988)(9.1591)(8.8856)
Growth 0.0841 **0.0750 **0.0797 **0.0786 **
(2.2799)(1.9873)(2.1039)(2.0754)
Tobin −0.0469 **−0.0461 **−0.0452 **
(−2.2883)(−2.2518)(−2.2054)
Own_con 0.3638 *0.3697 *
(1.6873)(1.7151)
Pergdp −0.2501 *
(−1.9552)
Constant3.4126 ***0.80320.60070.49650.59210.45042.9584 **
(42.0722)(1.4153)(1.0523)(0.8670)(1.0293)(0.7754)(2.1011)
Year fixed effectNOYESYESYESYESYESYES
Enterprise fixed effectNOYESYESYESYESYESYES
Industry fixed effectNOYESYESYESYESYESYES
Obs.8852885288528852885288528852
Adj. R20.00000.09420.09310.09360.09440.09400.0936
Note: *, **, and ***, represent significance at the 10%, 5%, and 1% levels, respectively.
Table 5. Regression results regarding the moderating effects of CSR.
(1)(2)
Green1.3501 ***0.7708 *
(3.2518)(1.5096)
CSR0.0043 **0.0349 *
(0.4329)(1.8520)
Green * CSR 0.1147 **
(2.0960)
Gov_con0.2595 ***0.2577 ***
(3.2617)(3.2460)
Age0.2927 ***0.2926 ***
(8.6478)(8.6391)
Growth0.0785 **0.0779 **
(2.1263)(2.1079)
Tobin−0.0457 **−0.0458 **
(−2.0969)(−2.1018)
Own_con0.37120.3736
(1.4365)(1.4464)
Pergdp−0.2495 **−0.2426 *
(−1.9932)(−1.9353)
Constant2.9720 **3.0503 **
(2.2106)(2.2690)
Year fixed effectYESYES
Enterprise fixed effectYESYES
Industry fixed effectYESYES
Obs.88528852
Adj. R20.09360.0943
Note: *, **, and ***, represent significance at the 10%, 5%, and 1% levels, respectively.
Table 6. Regression results with explained variables replaced.
(1)(2)(3)(4)(5)(6)(7)
Green1.2264 ***1.0287 ***1.1779 ***1.1770 ***1.2364 ***1.2258 ***1.0993 ***
(6.8631)(5.9385)(7.1046)(7.1000)(7.5615)(7.5210)(5.0658)
Gov_con 0.2089 ***0.2030 ***0.2031 ***0.1808 ***0.1793 ***0.1800 ***
(7.8598)(7.7122)(7.7174)(6.7593)(6.7003)(6.7223)
Age 0.2896 ***0.2975 ***0.3168 ***0.3239 ***0.3252 ***
(20.4930)(19.9598)(21.0253)(21.3013)(21.3009)
Growth 0.0214 *0.00570.00910.0093
(1.6581)(0.4306)(0.6898)(0.7058)
Tobin −0.0553 ***−0.0550 ***−0.0552 ***
(−7.4835)(−7.4338)(−7.4557)
Own_con 0.2865 ***0.2860 ***
(2.9540)(2.9484)
Pergdp 0.0619
(0.8837)
Constant17.4994 ***16.0786 ***15.7922 ***15.7629 ***15.8720 ***15.7516 ***15.1294 ***
(347.1124)(50.2322)(50.3617)(50.1930)(51.2347)(50.5546)(19.6573)
Year fixed effectNOYESYESYESYESYESYES
Enterprise fixed effectNOYESYESYESYESYESYES
Industry fixed effectNOYESYESYESYESYESYES
Obs.8852885288528852885288528852
Adj. R20.00020.51410.51090.51090.51330.51270.5127
Note: * and *** represent significance at the 10% and 1% levels, respectively.
Table 7. Regression results for company size heterogeneity.
(1)(2)
Small CompaniesLarge Companies
Green0.15482.6459 ***
(0.2875)(4.2557)
Gov_con0.30160.2105 *
(1.2993)(1.9584)
Age0.1279 **0.1855 **
(2.1286)(2.4373)
Growth0.0322−0.2287 **
(0.5988)(−2.3201)
Tobin0.01080.0591
(0.3101)(1.0651)
Own_con−0.36910.8847 **
(−0.9967)(2.1801)
Pergdp−0.1454−0.3241 *
(−0.7965)(−1.6579)
Constant1.46113.2363
(0.8211)(1.5485)
Year fixed effectYESYES
Enterprise fixed effectYESYES
Industry fixed effectYESYES
Obs.22542407
Adj. R20.06460.0770
Note: *, **, and ***, represent significance at the 10%, 5%, and 1% levels, respectively.
Table 8. Regression results for companies in eastern, central, and western regions.
(1)(2)(3)
EasternCentralWestern
Green1.1969 ***−4.02852.9369
(2.7334)(−1.1811)(0.9704)
Gov_con0.2501 **0.3686 **0.0737
(2.4175)(2.2670)(0.3603)
Age0.3147 ***0.2500 ***0.1494
(7.9170)(2.9448)(1.5705)
Growth0.0819 **0.01830.0910
(1.9726)(0.1971)(0.5788)
Tobin−0.0169−0.2068 ***−0.0275
(−0.6988)(−3.5081)(−0.3820)
Own_con0.18971.6214 **0.1525
(0.6369)(2.2374)(0.2056)
Pergdp−0.17421.5134 **−0.5825
(−0.8979)(2.1576)(−0.9806)
Constant3.0077−15.0589 **5.7087
(1.4496)(−2.2285)(0.9512)
Year fixed effectYESYESYES
Enterprise fixed effectYESYESYES
Industry fixed effectYESYESYES
Obs.66771299876
Adj. R20.09780.11490.1370
Note: ** and *** represent significance at the 5% and 1% levels, respectively.
Table 9. Subsample regression results with 2016 as the cutoff point.
(1)(2)
Before 2016After 2016
Green1.7121 ***1.4667 ***
(5.6835)(3.8839)
Gov_con0.2405 **0.5073 ***
(2.5209)(3.8104)
Age0.3579 ***0.4449 ***
(9.9537)(11.0026)
Growth0.08650.0468
(1.4751)(0.4835)
Tobin−0.1143 ***−0.0140
(−4.3082)(−0.3543)
Own_con0.7483 ***0.7887 ***
(3.7872)(3.0868)
Pergdp−0.5503 ***−0.1498
(−5.2844)(−1.1866)
Constant6.4014 ***2.1847
Year fixed effectYESYES
Enterprise fixed effectYESYES
Industry fixed effectYESYES
Obs.50263826
Note: ** and ***, represent significance at the 5% and 1% levels, respectively.
Publisher’s Note: MDPI stays neutral with regard to jurisdictional claims in published maps and institutional affiliations.

