Article

Changes in Soil Bacterial Community Structure in Bermudagrass Turf under Short-Term Traffic Stress

1
College of Forestry and Landscape Architecture, South China Agricultural University, Guangzhou 510642, China
2
Guangdong Engineering Research Center for Grassland Science, South China Agricultural University, Guangzhou 510642, China
*
Author to whom correspondence should be addressed.
Agriculture 2022, 12(5), 668; https://doi.org/10.3390/agriculture12050668
Submission received: 11 April 2022 / Revised: 1 May 2022 / Accepted: 3 May 2022 / Published: 6 May 2022
(This article belongs to the Special Issue Plant–Soil–Microorganism Interaction in Grassland Agroecosystem)

Abstract

:
Bermudagrass (Cynodon dactylon (L.) Pers.) is an extensively utilized turf grass for football fields and golf courses. Traffic stress is one of the most important stresses affecting the life of turf, which leads to a decrease in turf quality and changes in the soil microbial community structure. The structural change in soil bacterial community is an important reference for turf growth, maintenance, and restoration. Tifgreen bermudagrass turf and Common bermudagrass turf were applied with traffic treatment by a traffic simulator with moderate intensity to explore soil bacterial community structural changes in turf under traffic stress. The environmental factors including turf quality indicators and soil properties were measured, and the association of the soil bacterial community diversity with the environment factors was analyzed. As a result, traffic treatments significantly changed the soil properties and bacterial community composition in two bermudagrass species at the phylum and genus level. Actinobacteria, Chloroflexi, and Verrucomicrobia showed significantly high abundance in turf soils under traffic stress. The soil bacterial ACE, Chaol, and Shannon indexes of two bermudagrass species under traffic stress were significantly lower than non-traffic stress. The bacterial community structure was highly correlated with some turf quality indicators and soil properties under traffic stress. Our results illustrate that compared to Common bermudagrass, Tifgreen bermudagrass had better turf quality under traffic stress and less changes in its bacterial community structure, perhaps Tifgreen bermudagrass is a better choice of grass for sports turf as opposed to Common bermudagrass.

1. Introduction

Traffic is frequently seen as a harmful stress to turfs [1]. The traffic directly causes turf wear and reduces the photosynthesis of turf leaves, resulting in the slow growth of turf plants [2]. In addition, it changes the soil properties, causing soil compaction [3], reducing water, nutrients, and oxygen in the soil, affecting the growth of turf roots [4]. It indirectly affects turfgrass development and thus reduces the turf’s quality [5]. In general, Traffic can affect the physicochemical characters of grassland soils [6], and it generally affects the soil physical properties more than the chemical properties [7]. It acts directly on the soil’s surface, changing its water content, capacity, firmness, and permeability [8]. Moreover, grassland soils’ physicochemical characters interact and influence each other [9]. Traffic intensities have different functions in grassland physicochemical properties, which are essential drivers of change in the nutrient content of grassland. Currently, there is no consensus on the effect of traffic on soil chemistry, and limited specific research has been conducted.
Soil lays the foundation for terrestrial ecosystems, which contains plant roots, soil animals, and microorganisms, of which soil microorganisms are the most active, having critical functions in the maintenance of ecosystem functions and the regulation of biogeochemical cycles [10,11]. Soil bacteria are one of the most abundant and diverse organisms on earth [12,13]. The dynamics of soil bacterial communities determine a variety of ecological processes, for instance, litter decomposition and nitrogen (N) fixation [14]. Therefore, understanding the drivers of soil bacterial diversity and composition is essential to maintain ecosystem function. Abiotic conditions are highly correlated with the dynamics and activity of soil microbes [15]. Soil physicochemical characteristics are important factors affecting soil bacteria community composition. For example, the soil pH is a key driver for microbial catabolic activities and nutrient utilization [16]. In addition, other factors such as the soil organic matter (SOM) [17], soil moisture [18], and nitrogen and phosphorus content, which are indispensable sources of nutrients and energy for soil bacteria development and metabolism [19,20], may affect soil bacteria community spatial structures directly or indirectly. Moreover, the vegetation type is the critical driving factor for soil microbial distribution patterns [21].
Some scholars believe that traffic directly leads to decreased vegetation cover, increased water capacity, and reduced air content and water transfer capacity of the soil, with a consequent reduction in nitrogen mineralization rates, thus affecting microbial activity [22]. In addition, some articles indicated that soil bacteria communities typically play a vital function in plant development [23,24]. As the sensitive indicator of grassland ecosystems, soil bacteria community structural alterations may be an early indicator of grassland ecosystem function and health. Moreover, soil bacteria community alteration influences the soil nutrient effectiveness and cycling, affecting the grassland plant productivity [25]. Currently, there is limited information on how traffic affects soil microorganisms in grassland, and most of them focus on natural grassland ecosystems with spatial and temporal limitations. Fewer studies on how human traffic affects sports or recreational turfgrass and little research on how traffic alone affects the soil bacteria community in grassland are available. Most recreational and sports turf are often over-trampled, and soil bacteria community structural alterations are the key reference for turf growth maintenance and recovery.
Bermudagrass (Cynodon dactylon (L.) Pers.) has the advantages of quick establishment and high recovery capacity. It is an extensively utilized turf grass for football fields and golf courses in tropical and subtropical regions [26]. Bermudagrass is used as a cover crop in vineyards to improve physical and chemical soil properties, enhance biodiversity and help control weeds and pests [27]. The present work focused on investigating how the soil bacteria community and soil respiration responded to Bermudagrass turf under traffic stress to clarify how traffic affected the soil properties and subsurface microorganisms in turf ecosystems. In addition, it offers a theoretical foundation for the healthy management of urban recreation and sports turfs.

2. Materials and Methods

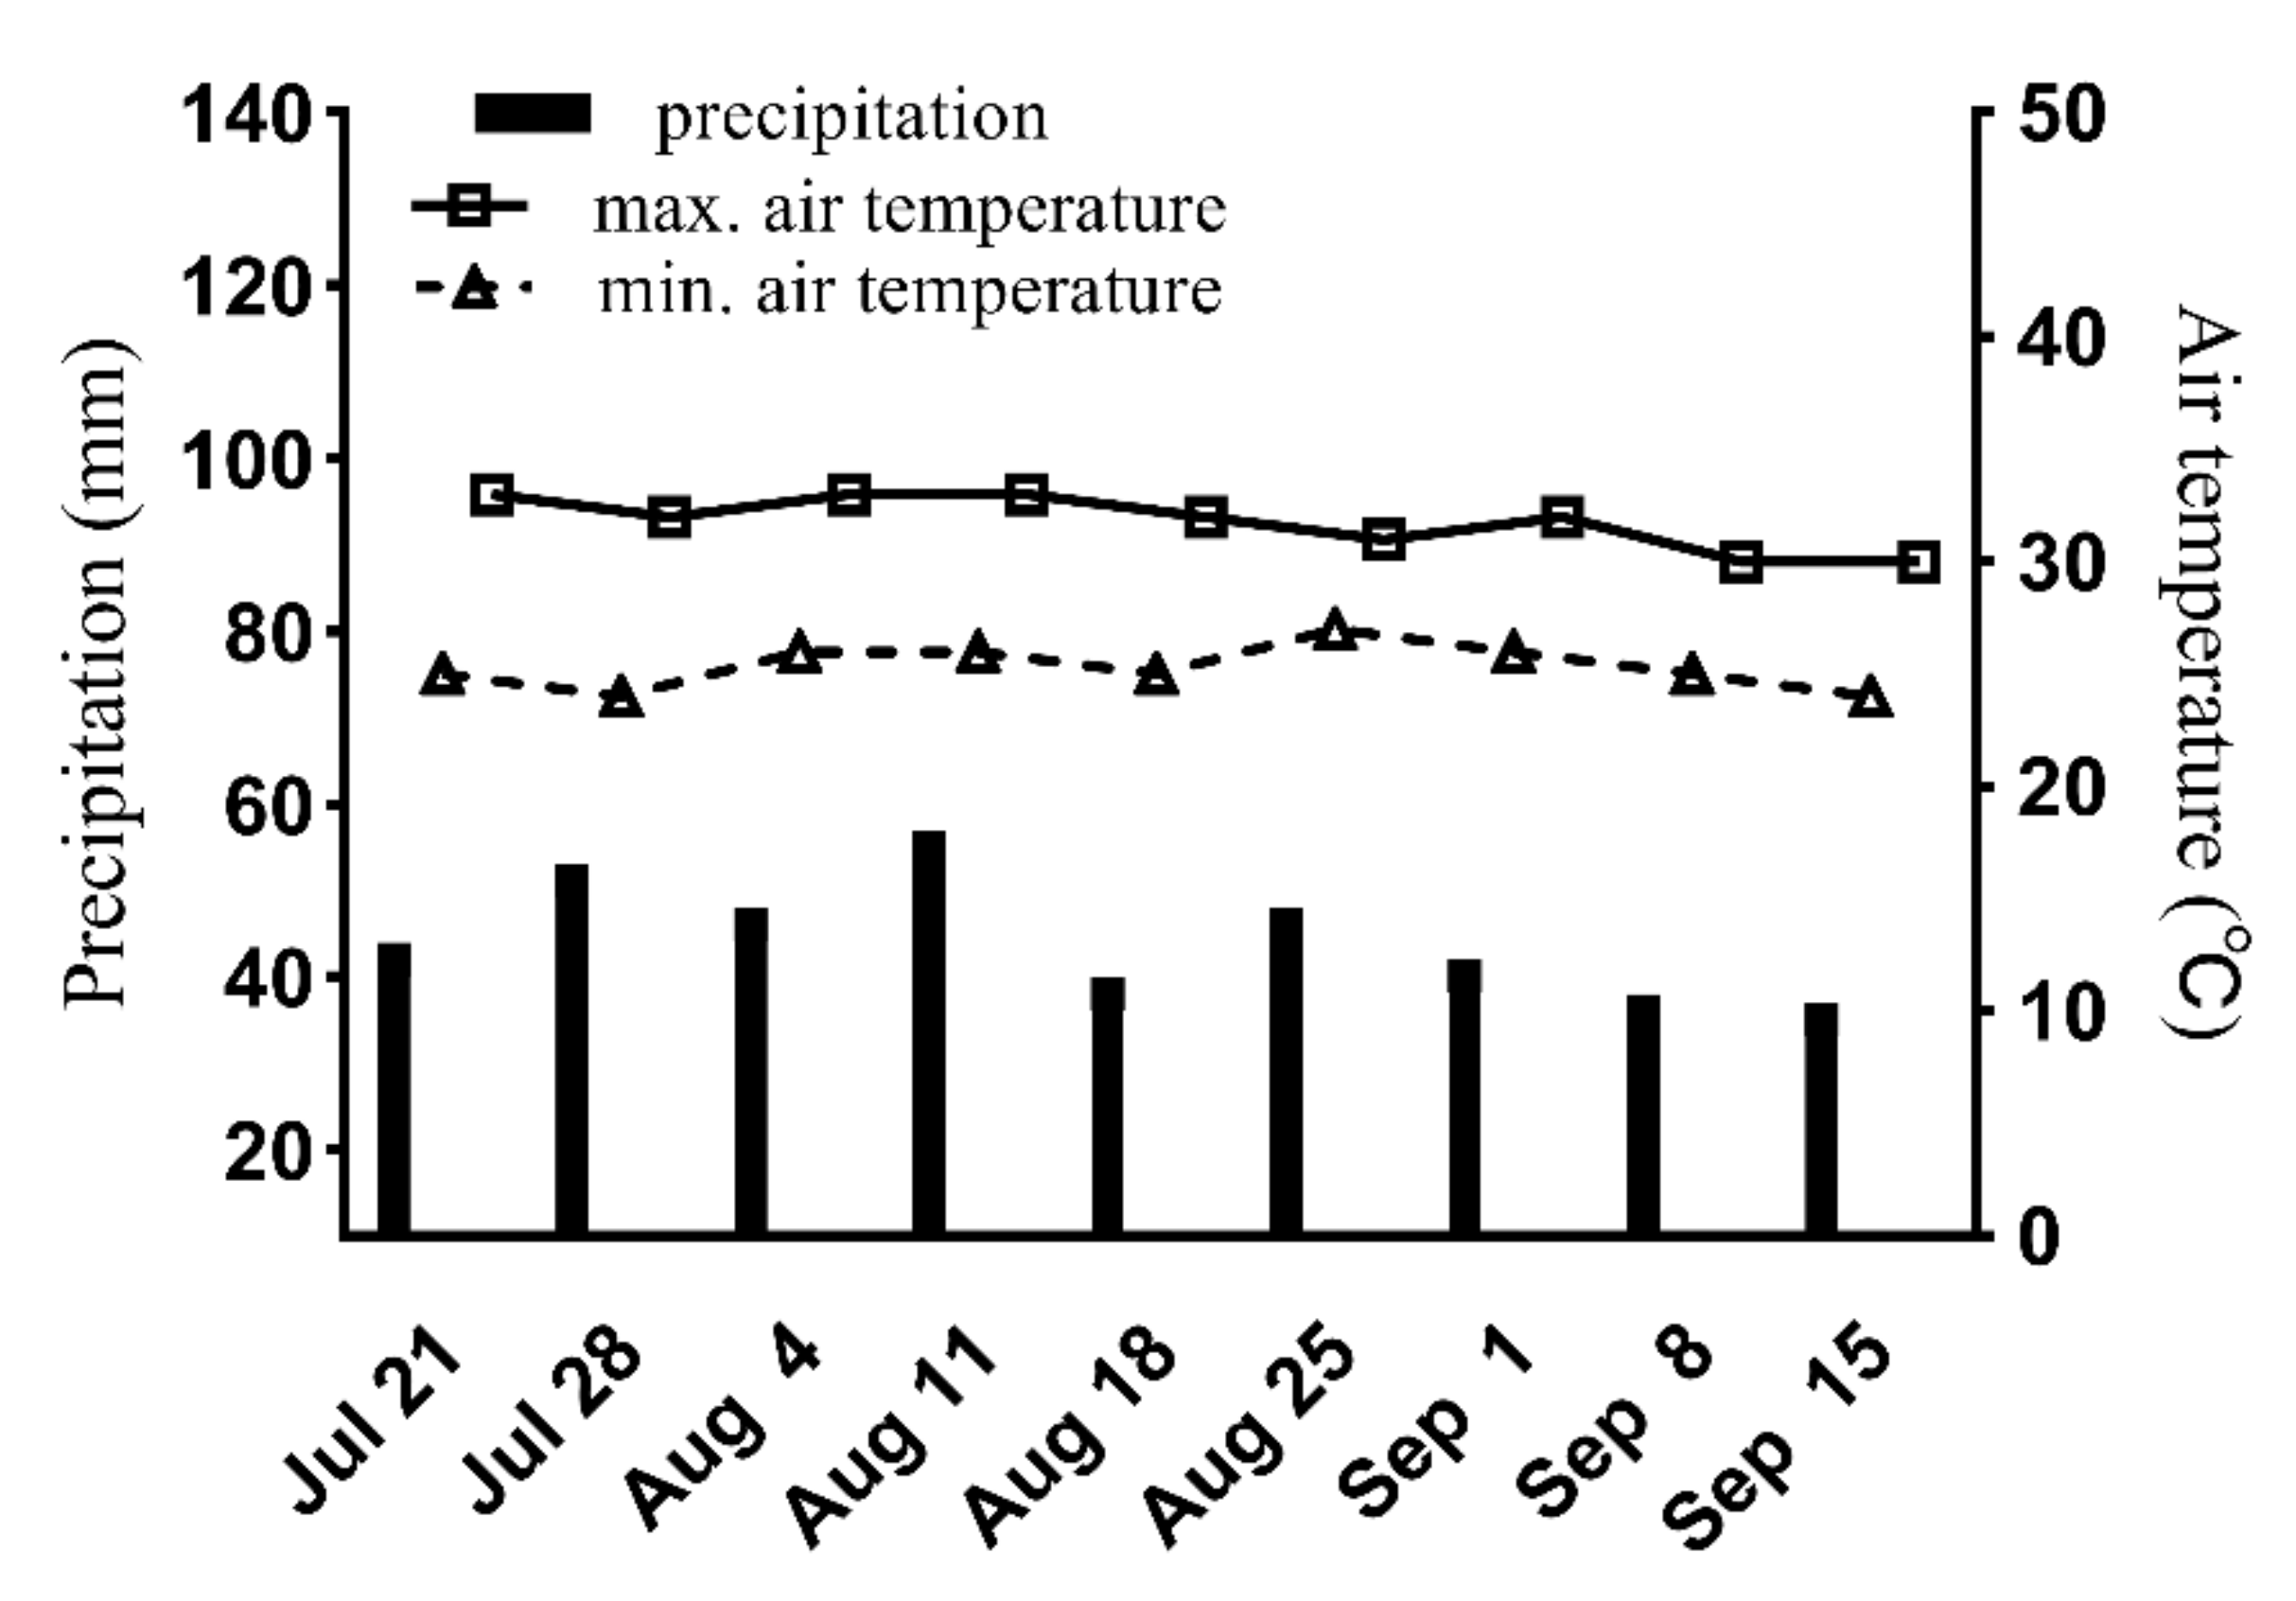
2.1. Site of Experiments

This work was performed in the Teaching and Research Base in South China Agricultural University, Guangzhou, China (lat.23.30° N, long.113°81 E). The native soil type of Guangzhou was Lateritic red clay soil, with an organic matter of 14.5 g·kg−1 and an average pH of 6.3. The sand used for this research varied in particle size, ranging from very coarse (9.6%), coarse (19.5%), medium (34.9%), and fine (19.7%) sand sizes. The region experiences a subtropical monsoon climate, and the annual mean evaporation, temperature, and precipitation were 1450.5 mm, 23.4 °C, and 1786.8 mm, respectively, with snowfall and frost-free periods of 365 days. Weekly average minimum and maximum air temperatures and weekly rainfall during the experimental periods of year 2020 are reported in Figure 1.

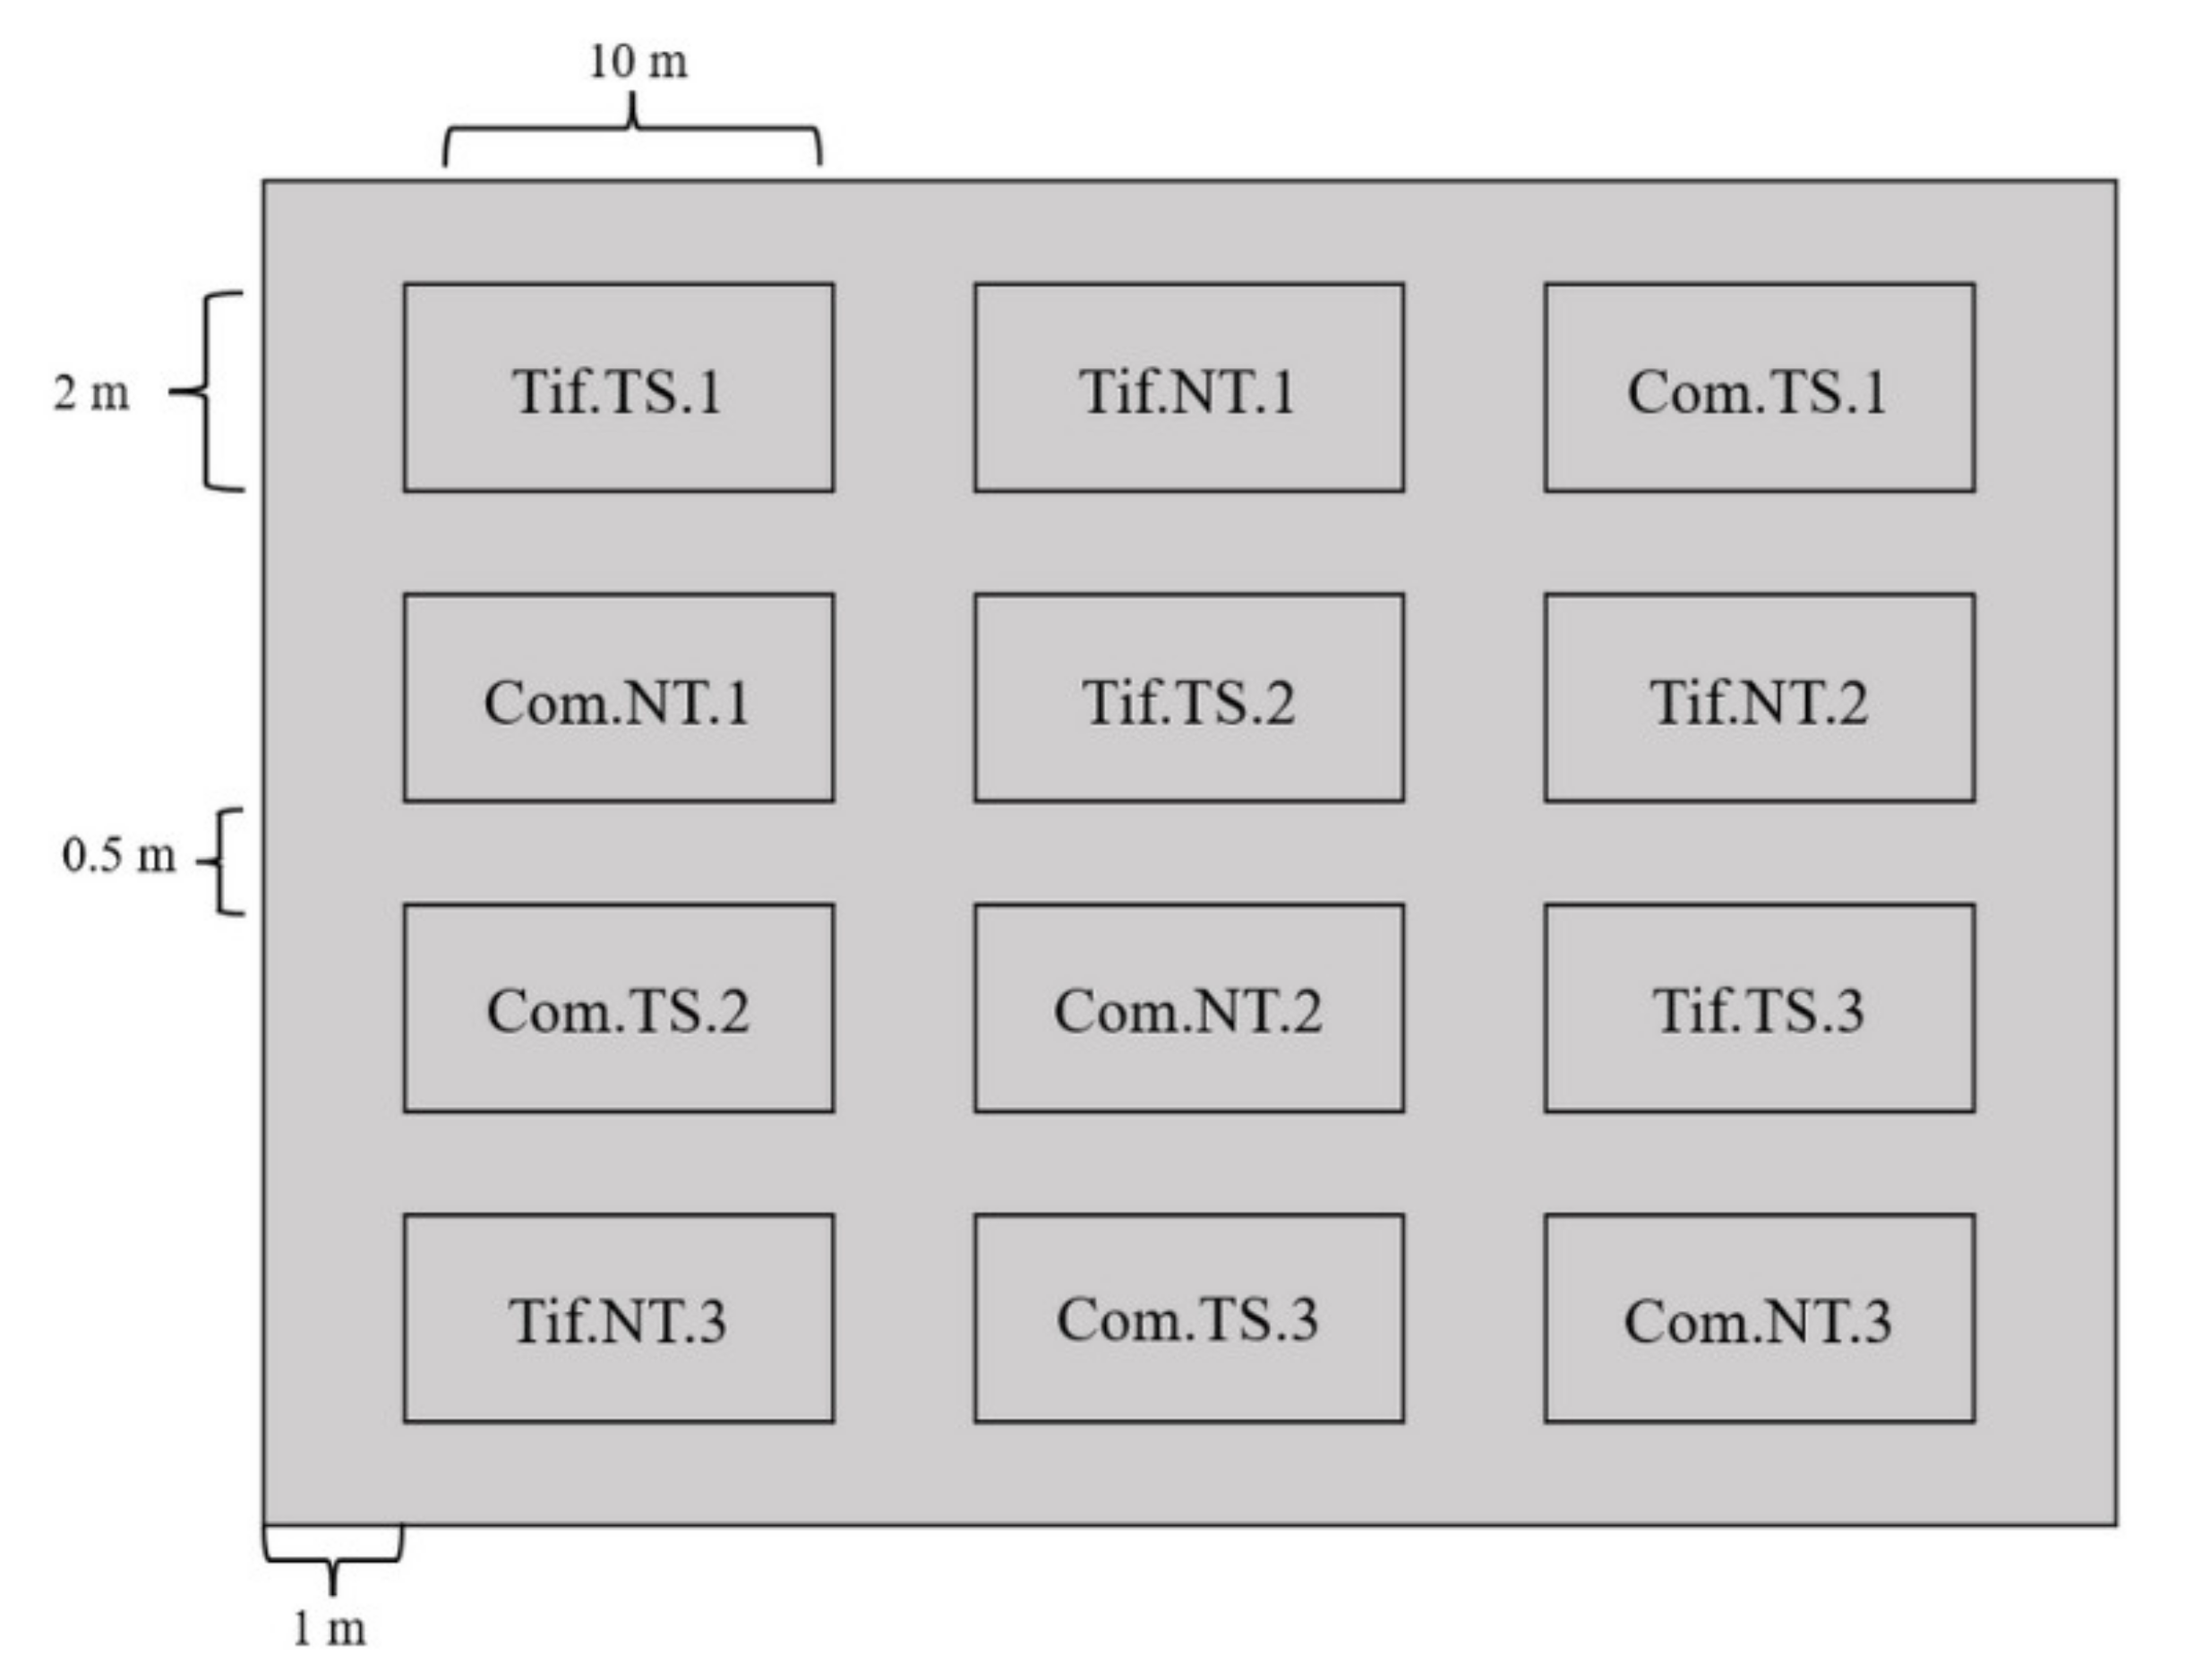
2.2. Experimental Design

Common Bermudagrass (Cynodon dactylon sp.) and Tifgreen Bermudagrass (C. dactylon × C. transvaalensis cv. Tifgreen) were used. The main regional factor in this experiment was traffic stress divided into traffic and non-traffic treatment, while different species were used as secondary factors. There were four treatments: Tifgreen Bermudagrass with traffic treatment (Tif.TS), Tifgreen Bermudagrass with non-traffic treatment (Tif.NT); Common Bermudagrass with traffic treatment (Com.TS) and Common Bermudagrass with non-traffic treatment (Com.NT). All treatments were carried out with three replicates. Traffic treatments were employed as a strip in replicates with the Selfmake Traffic Simulator (STS). STS has 5 parts: roller, steel plate, spike, bearing, and frame, all of which are steel. The steel plate and spikes are removable and easy to replace. The dimension of the drum is 21 cm diameter, 100 cm length, 1.2 cm thickness, and 80 kg weight, with a bearing in the middle of the drum of 5 cm diameter and 104 cm length, and the frame outside the drum is connected to an SR1Z-80 microtiller (Xinyuan Inc., Guangzhou, China) to drive the traffic simulator for the traffic, with a maximum engine power of 4.2 kW. The unit pressure of STS was 1.91 MPa. There were three respective replicates for all treatments, resulting in 12 plots (2 m × 10 m each), with 0.5 m protection rows between plots and 1 m open space around the experimental plots (Figure 2). The self-made traffic simulator was used for traffic treatment, with six rounds each time. The experiment began on 21 July 2020 and ended on Sep 15. The traffic treatment was carried out on Monday and Thursday every week. The experiment lasted for eight weeks.

2.3. Measurement of Turf Quality Indicators, Soli Physical Properties and Soil Respiration Rate

Cover degree (CD): a 50 × 50 cm sample frame composed of 100 small grids was placed randomly on the community’s turf. The turf proportion in each grid was measured visually. After statistics, the cover degree of the turfgrass was calculated and expressed as a percentage.
Biomass: a self-made cylindrical soil drill sampler (diameter, 5 cm) was used to take a straw column with a 15 cm depth, placed in a sampling bag, and brought back to the laboratory. The aboveground biomass (AB) and the under-ground biomass (UB) were separated, washed with water, and then dried in an oven under 80 °C until the dry weight of the sample no longer decreased. The sample dry weight was calculated and recorded.
Turf density (TD): The number of branches of turf plants in 10 cm × 10 cm quadrat was measured and repeated thrice in each plot.
After the test, the soil impact instrument measured the surface hardness (Clegg 083, SD instrument, London, UK). A measuring hammer with a 5 cm diameter and a 2.25 kg mass fell freely from the pipe with a 30 cm diameter, and the values were recorded in the GM unit [28]. Three test points were randomized in every test plot during the measurement, and the average test results were recorded. The soil respiration (SR) rate was measured using an open-circuit soil carbon flux measurement system LI-8100A (Li-Cor, Inc., Lincoln, NE, USA). Three selected points from every plot were randomized; later, one soil respiration ring (inner diameter 22 cm, height 3.5 cm) was placed at each point. During the soil respiration measuring process, the soil respiration leaf chamber was placed onto the PVC tube base to achieve a closed state to reduce the soil surface’s interference. To eliminate the plant autotrophic respiration’s influence on the soil respiration, turfgrass on the soil surface of the ring was mowed before measurement.

2.4. Soil Sample Collection and Analysis

Fresh soils were collected in the 15 cm soil layer using a 5 cm auger; five soil cores (15 cm deep, 5 cm diameter) were randomly collected from each plot and combined into one composite sample in October 2020, resulting in a total of 12 samples. Alcohol (75% v/v) was utilized for auger sterilization before collecting another soil sample to avoid cross-contamination of microorganisms. Later, those collected soil samples were pooled, and one part was subjected to air-drying and manual removal of rocks and roots. Soil samples were filtered using the 2 or 5 mm sieve to conduct different measurements. One part of the sample was preserved at 4 °C to determine the soil physicochemical properties, while the remaining fresh soil was preserved at −80 °C to extract the genomic DNA (gDNA).
A pH meter (PHS-2F, jingke Inc., Shanghai, China) was utilized to measure the pH of the suspension of soil: distilled water (1:5). Later, soils were heated for 48 h in the oven at 105 °C (101-0, jinpin instrument Inc., Shanghai, China) to determine the soil water content (SWC). The soil total phosphorus (TP) was analyzed by HClO4-H2SO4 digestion and measured using the molybdate-blue colorimetric method. NaHCO3 (0.5 M) was adopted to extract the available phosphorus (AP) and measured using spectrophotometry (UV-5200, Metash Inc., Shanghai, China) at 700 nm [29]. Meanwhile, the Kjeldahl digestion method was utilized to analyze the total nitrogen (TN). The KCl extraction–indophenol blue colorimetry was adopted for determining AN [30]. In addition, 1 M NH4OAc was utilized to extract the available potassium (AK), followed by quantification by flame atomic absorption spectroscopy (FP6432, jingke Inc., Shanghai, China), and K2Cr2O7 + H2SO4 digestion was applied to determine the soil organic carbon (SOC), with the addition of HgSO4 to prevent Cl interference [31].

2.5. gDNA Collection and PCR Amplification

First, 1 g rhizospheric soil was collected to extract gDNA for high-throughput sequencing (HTS) using the E.Z.N.A.® Soil DNA Kit (Omega Bio-Tek, Norcross, GA, USA) in line with specific instructions. AGE (1%) was performed to qualitatively detect soil gDNA, whereas the Nanodrop 2000 spectrophotometer (Thermo Scientific, Wilmington, DE, USA) was employed to detect the DNA content and purity. The bacterial primer sequences of the v3–v4 region were utilized to carry out PCR amplification, (5′-ACTCCTACGGGAGG CAGCA-3′) and (5′-GGACTACHVGGGTWTCTAAT-3′). After recovery and purification of the amplified products, a sequencing library was prepared following fluorescence measurement. The Illumina MiSeq platform was employed for sequencing in Magigene Technology Co., Ltd. (Guangzhou, China).

2.6. Bioinformatics and Statistical Analysis

This study adopted the Quantitative Insights into Microbial Ecology package (QIIME 2 v.2010.10) [32] to analyze bacterial community patterns. For Illumina amplicon sequences, sequence variants and chimeras were removed using deblur plugin. In contrast, the remaining sequences were adopted to determine the heterogeneities of bacterial communities between symptomatic and asymptomatic samples. Later, sequences were clustered into operational taxonomic units (OTUs) by the 97% similarity threshold. Then, the obtained OTUs were compared with the bacterial taxonomic classes in the full-length SILVA 138 database. Bioconductor v.3.0 and R v.3.5.1 [33] were utilized for exploratory analysis.
After collating the data in Microsoft Excel 2019, Statistical Product and Service Solutions 22.0 (SPSS Inc., Chicago, IL, USA) was used to statistically analyze the environmental factors (turf quality indicators and soil indexes) of Tifgreen Bermudagrass and Common Bermudagrass with traffic and non-traffic treatments. One-way ANOVA was used to test the significance of differences in environmental factors under traffic and non-traffic treatment (Fisher’s LSD test, p < 0.05). Relative abundance maps of bacterial phyla and order with average relative abundances greater than 1% were plotted in the Magigene Technology online analysis platform (http://www.magichand.online/h5-BioCloud-site/ accessed on 20 February 2021). In brief, Shannon and Simpson’s indexes were calculated to represent richness and evenness through plot_anova_diversity function in the microbiome Seq package [34]. Principal coordinate analysis (PCoA) was produced using the Bray–Curtis distance metric by adopting ggplot2 package in R (v4.1.3), and phyloseq packages were used to visualize β-diversity [35]. DESeq2 R package [36] was employed to obtain differential abundance analyses of two groups, and ggplot2 package was employed to normalize taxonomical counts and visualize taxa with significantly differential abundances using the adjusted p < 0.05 threshold using MOTHUR software [37]. Using the Galaxy online analysis platform (http://huttenhower.sph.harvard.edu/galaxy/ accessed on 24 February 2021), the relative abundance matrix at the phyla to order level was submitted for LEfSe analysis. The vegan and ggplot2 packages in R were used to take the environmental factors as explanatory variables and the bacteria with significant differences between treatments as species variables to perform a redundancy analysis (RDA) and draw RDA diagrams. The autocorrelation between environmental factors and bacterial phyla and order level was calculated by Pearson’s test (two-tailed) at two significance levels, p < 0.05 and p < 0.01, and shown in the form of a correlation heat map by using the Hiplot online platform (https://hiplot.com.cn/ accessed on 25 February 2021).

3. Results

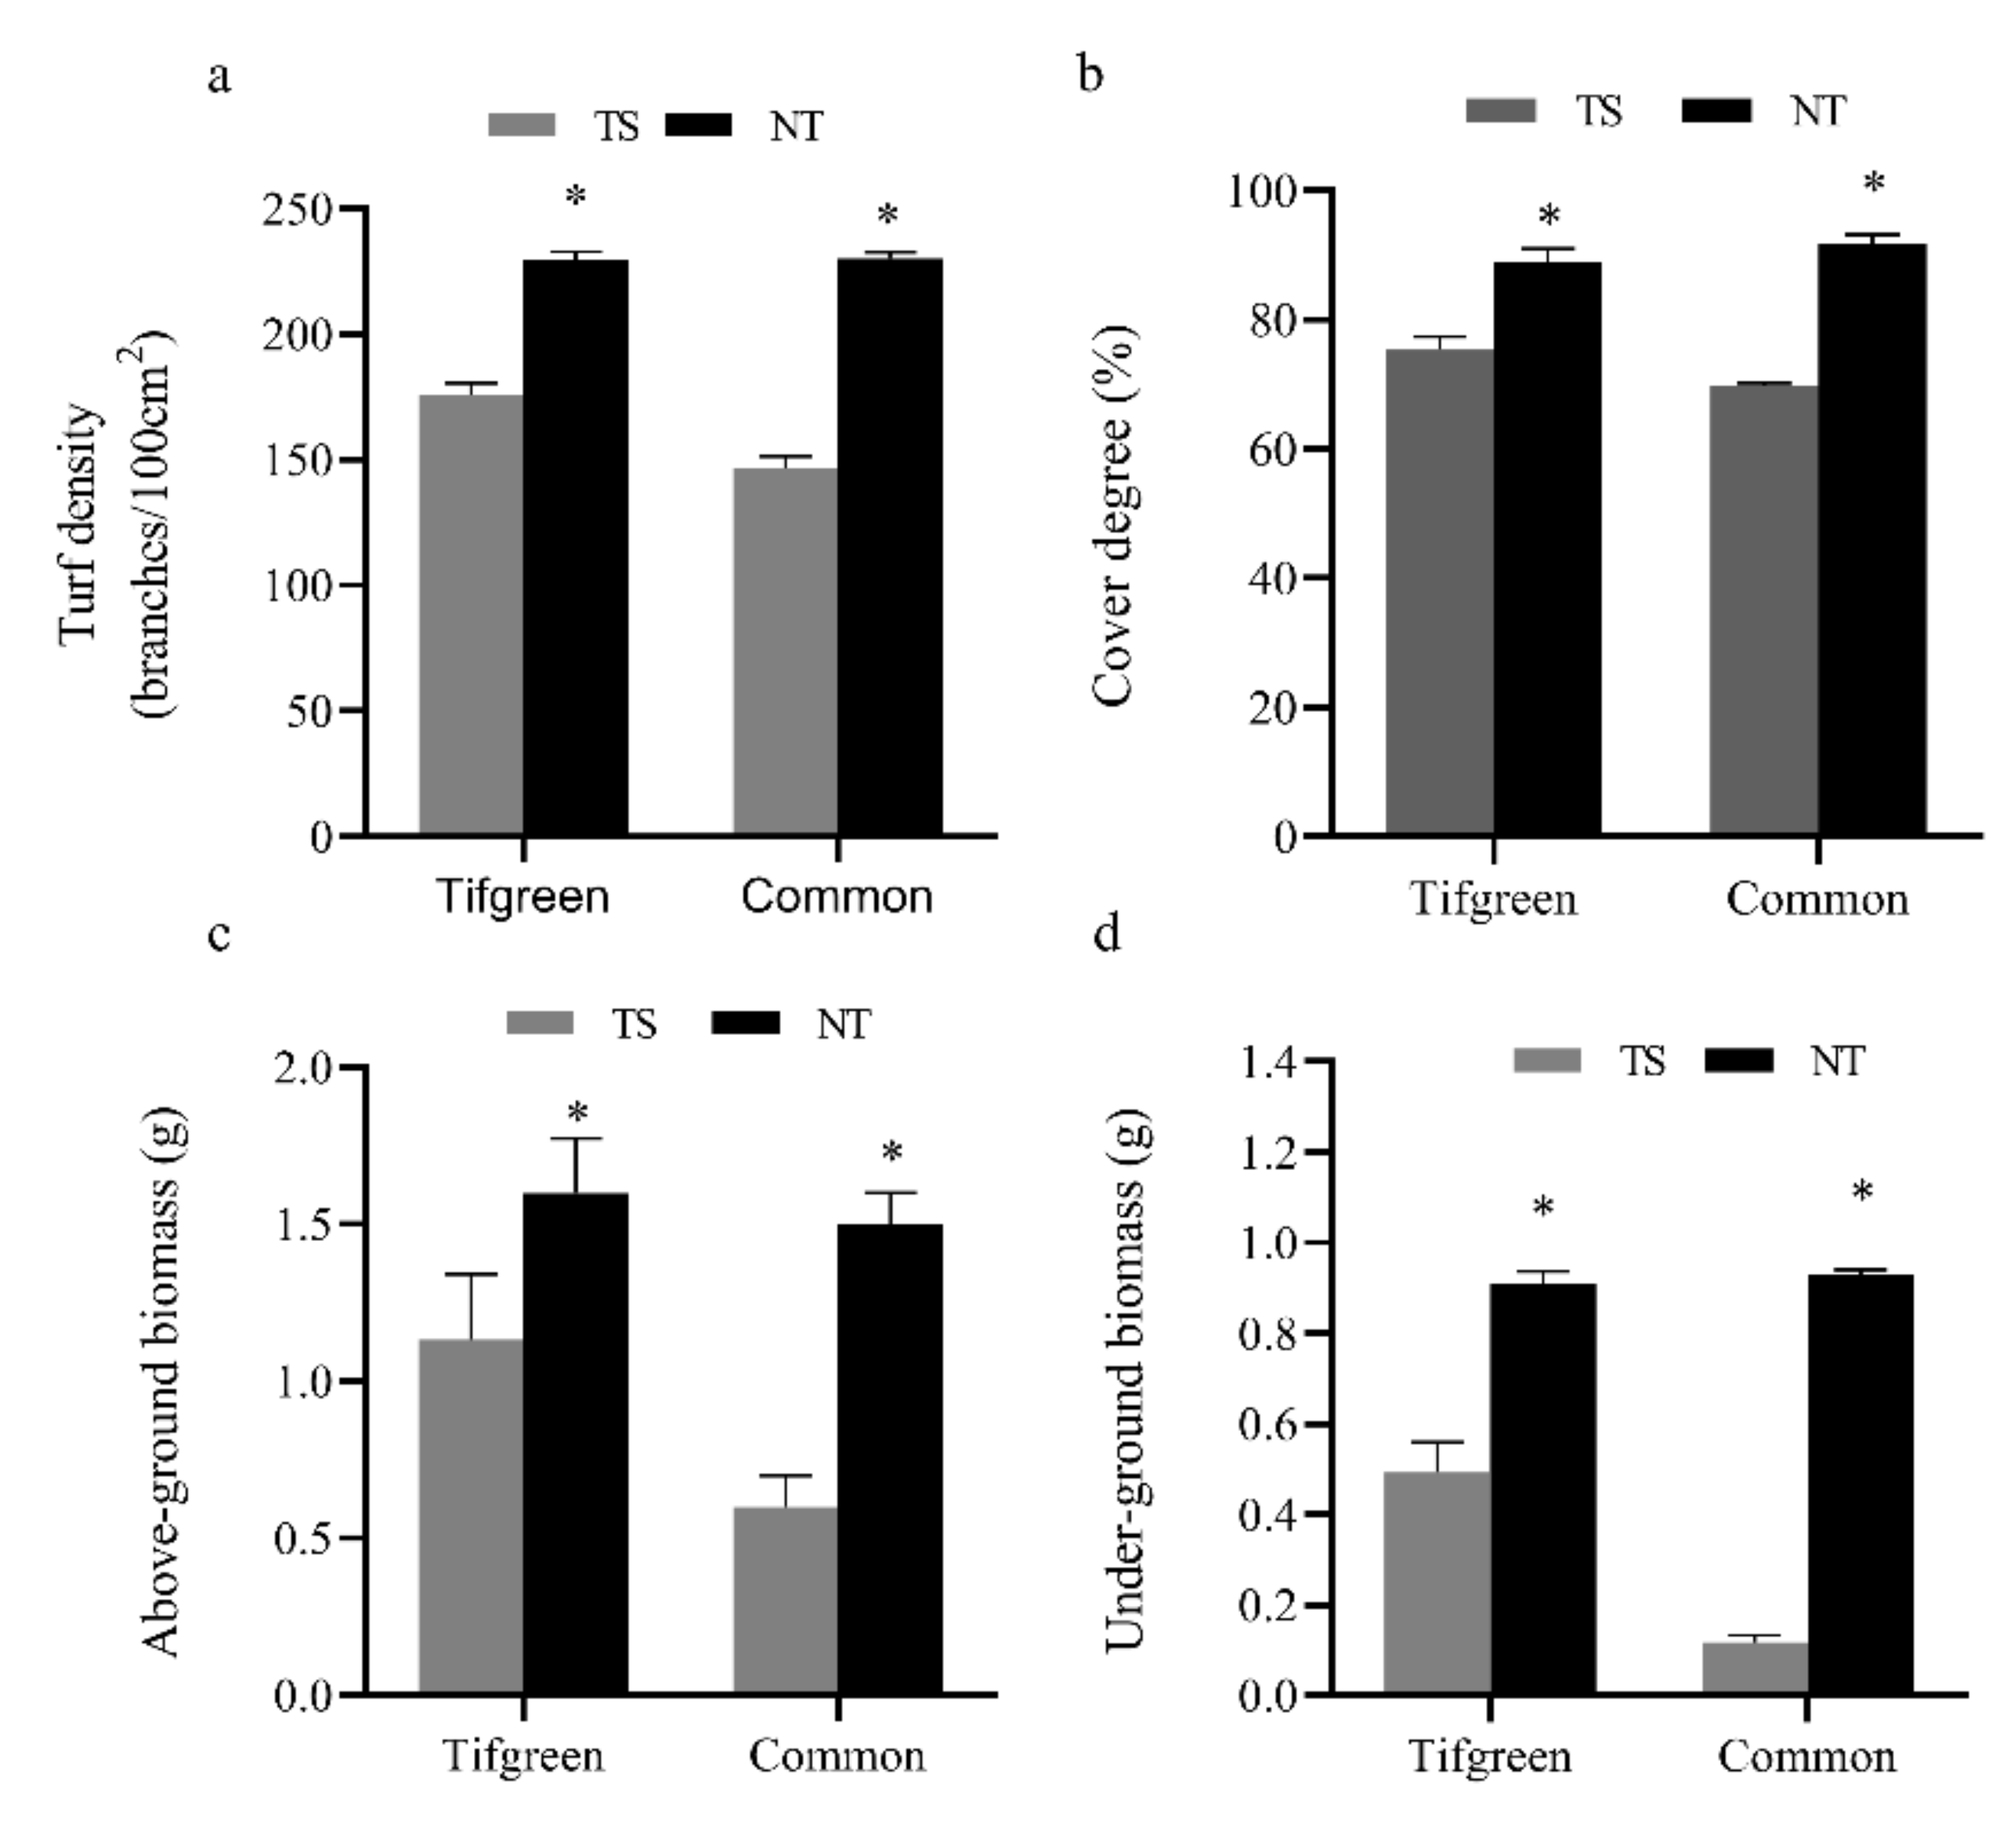
3.1. Effects of Traffic Stress on Turf Quality Indicators

Figure 3 presents the turf quality changes. According to Student’s t-test, diverse treatments of two bermudagrass species showed significant differences. The turf density (TD) of Tifgreen bermudagrass under traffic treatment increased remarkably relative to common bermudagrass (p < 0.05) (Figure 3a). The aboveground biomass in Tifgreen bermudagrass and common bermudagrass decreased by 36.53% and 39.54%, respectively. The CD under non-traffic treatment of two bermudagrass species was more than 85.00%, while under traffic treatment, Tifgreen and common bermudagrass decreased to 74.33% and 70.67%, respectively (Figure 3b), which were significantly lower than the non-traffic treatment (p < 0.05). The aboveground and underground biomass of two bermudagrass species decreased remarkably after traffic (p < 0.05): aboveground biomass in Tifgreen bermudagrass and common bermudagrass under traffic treatment decreased by 31.25% and 60.00%, respectively, compared with non-traffic treatment (Figure 3c). In contrast, the underground biomass of Tifgreen and common bermudagrass decreased by 44.44% and 77.78%, respectively (Figure 3d). Compared with non-traffic treatment, TD, CD, AB, and UB of traffic treatment in the two bermudagrass species significantly decreased (p < 0.05).

3.2. Effects of Traffic Stress on Soil Physicochemical Properties

Traffic and non-traffic treatment on two bermudagrasses altered the soil physicochemical (Table 1). The soil surface hardness (SSH) of Tifgreen and common bermudagrass increased by 45.75% and 80.93%, while the soil bulk density (SBD) increased by 26.49% and 27.90%, respectively. The soil water content (SWC) of Tifgreen and common bermudagrass decreased by 15.39% and 25.26%. The TN, TP, SOC, and available nutrients (such as AK, AN, AP) increased in Tif.NT and Com.NT compared with Tif.TS and Com.TS. The two bermudagrass species differed significantly (p < 0.05) in SR under non-traffic (CK) conditions. The soil respiration (SR) rate of Tifgreen and common bermudagrass decreased by 33.13% and 41.80%, respectively.

3.3. The Composition of Bacterial Communities

Sequences were affiliated with the highest abundances of phyla Acidobacteria (29.45%–35.89% of the overall relative abundance) as well as Proteobacteria (19.22%–23.97%) in the four treatments (Figure 4a). The relative abundances of phyla Acidobacteria, Proteobacteria, Patescibacteria, Chlamydiae, Spirochaetes and Elusimicrobia in Tif.TS decreased remarkably (p < 0.05) relative to Tif.NT, while phyla Chloroflexi, Actinobacteria, Nitrospirae, Planctomycetes, Bacteroidetes, Gemmatimonadetes and Firmicutes in Tif.TS were significantly higher than Tif.NT (p < 0.05). Furthermore, in common bermudagrass, the relative abundances of phyla Acidobacteria, Patescibacteria, Chlamydiae, Spirochaetes and Elusimicrobia in Com.TS decreased dramatically (p < 0.05) compared with Com.NT, while the relative abundances of phyla Actinobacteria, Nitrospirae, Verrucomicrobia, Bacteroidetes, Gemmatimonadetes and Firmicutes in Com.TS increased remarkably (p < 0.05) relative to Com.NT (Table S1).
Order Acidobacteriales with the highest abundances in the four treatments (Figure 4b). Relative abundances of order Acidobacteriales, Betaproteobacteriales, Xanthomonadales, Chlamydiales and Elsterales in Tif.TS were significantly lower than Tif.NT at the bacterial order level (p < 0.05), while the relative abundances of the order Ktedonobacterales, Pedosphaerales, Rhizobiales, Anaerolineales, Gemmatales and Frankiales in Tif.TS increased remarkably (p < 0.05) than Tif.NT. Furthermore, in common bermudagrass, the relative abundances of the order Acidobacteriales, Ktedonobacterales, Betaproteobacteriales, Chlamydiales, Gemmatales and Elsterales in Com.TS decreased remarkably more than Com.NT (p < 0.05), while those of the order Pedosphaerales, Rhizobiales, Anaerolineales, Xanthomonadales and Frankiales in Com.TS increased significantly more than Com.NT (p < 0.05) (Table S2).

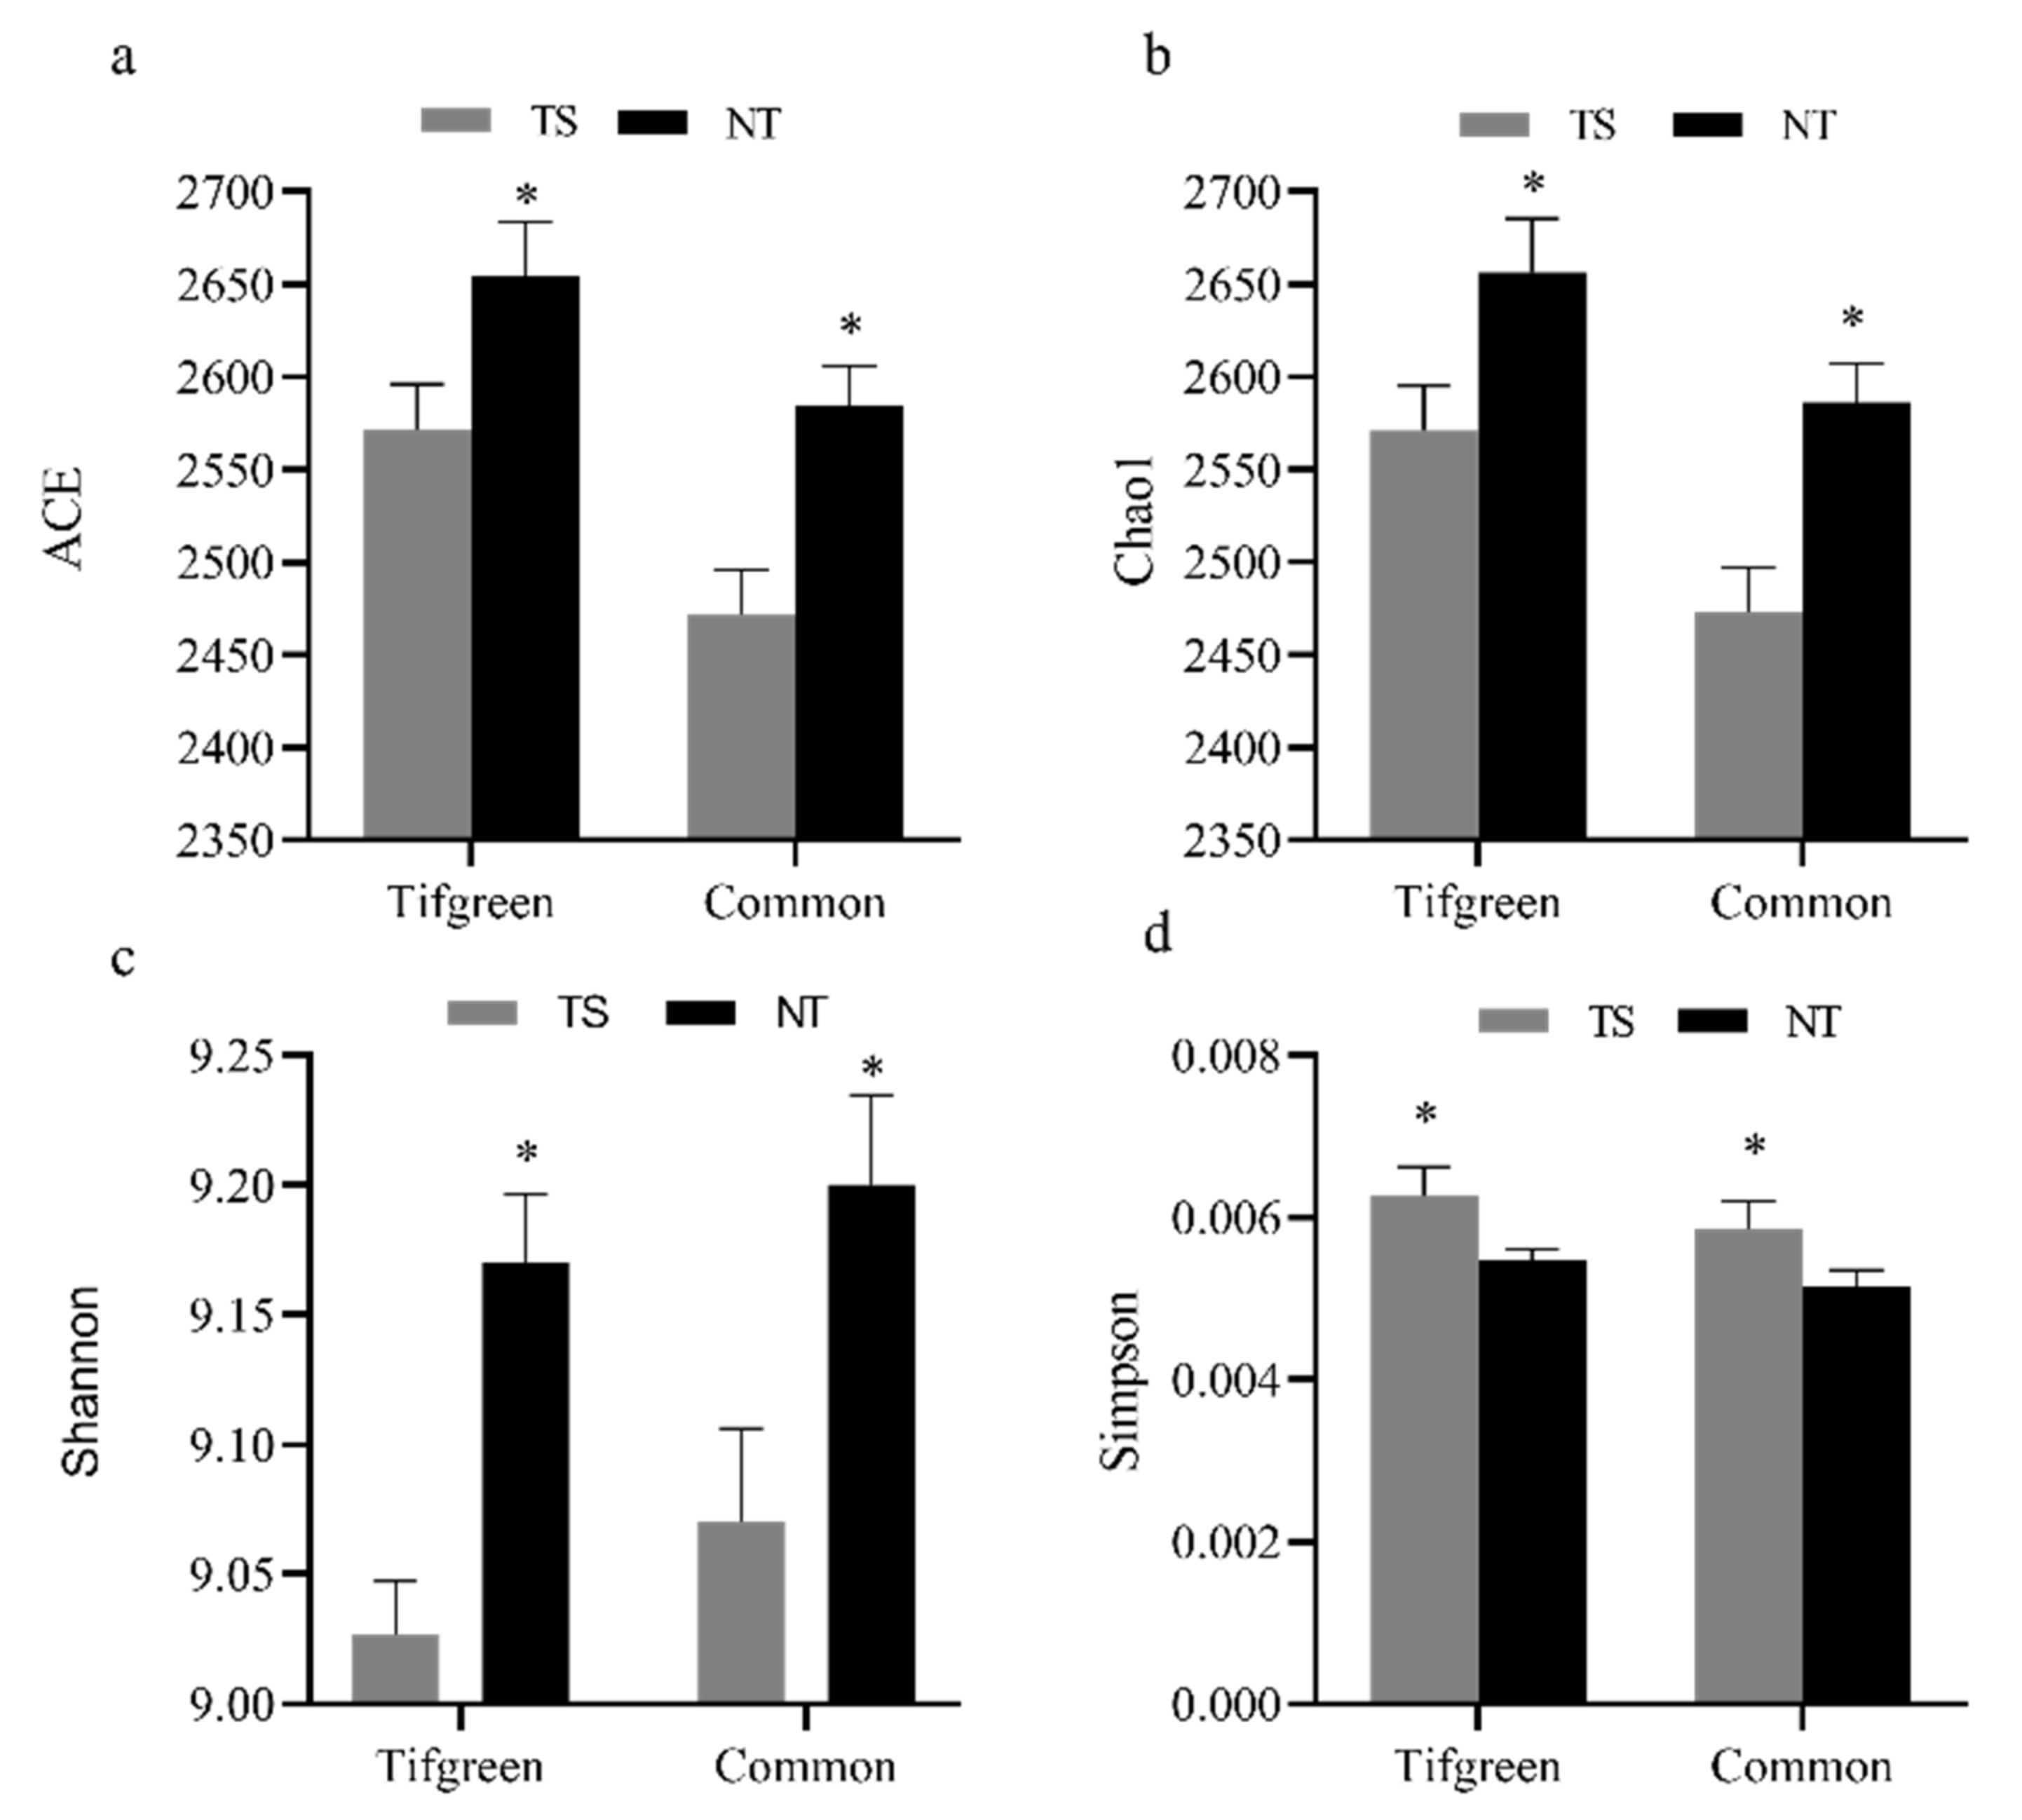
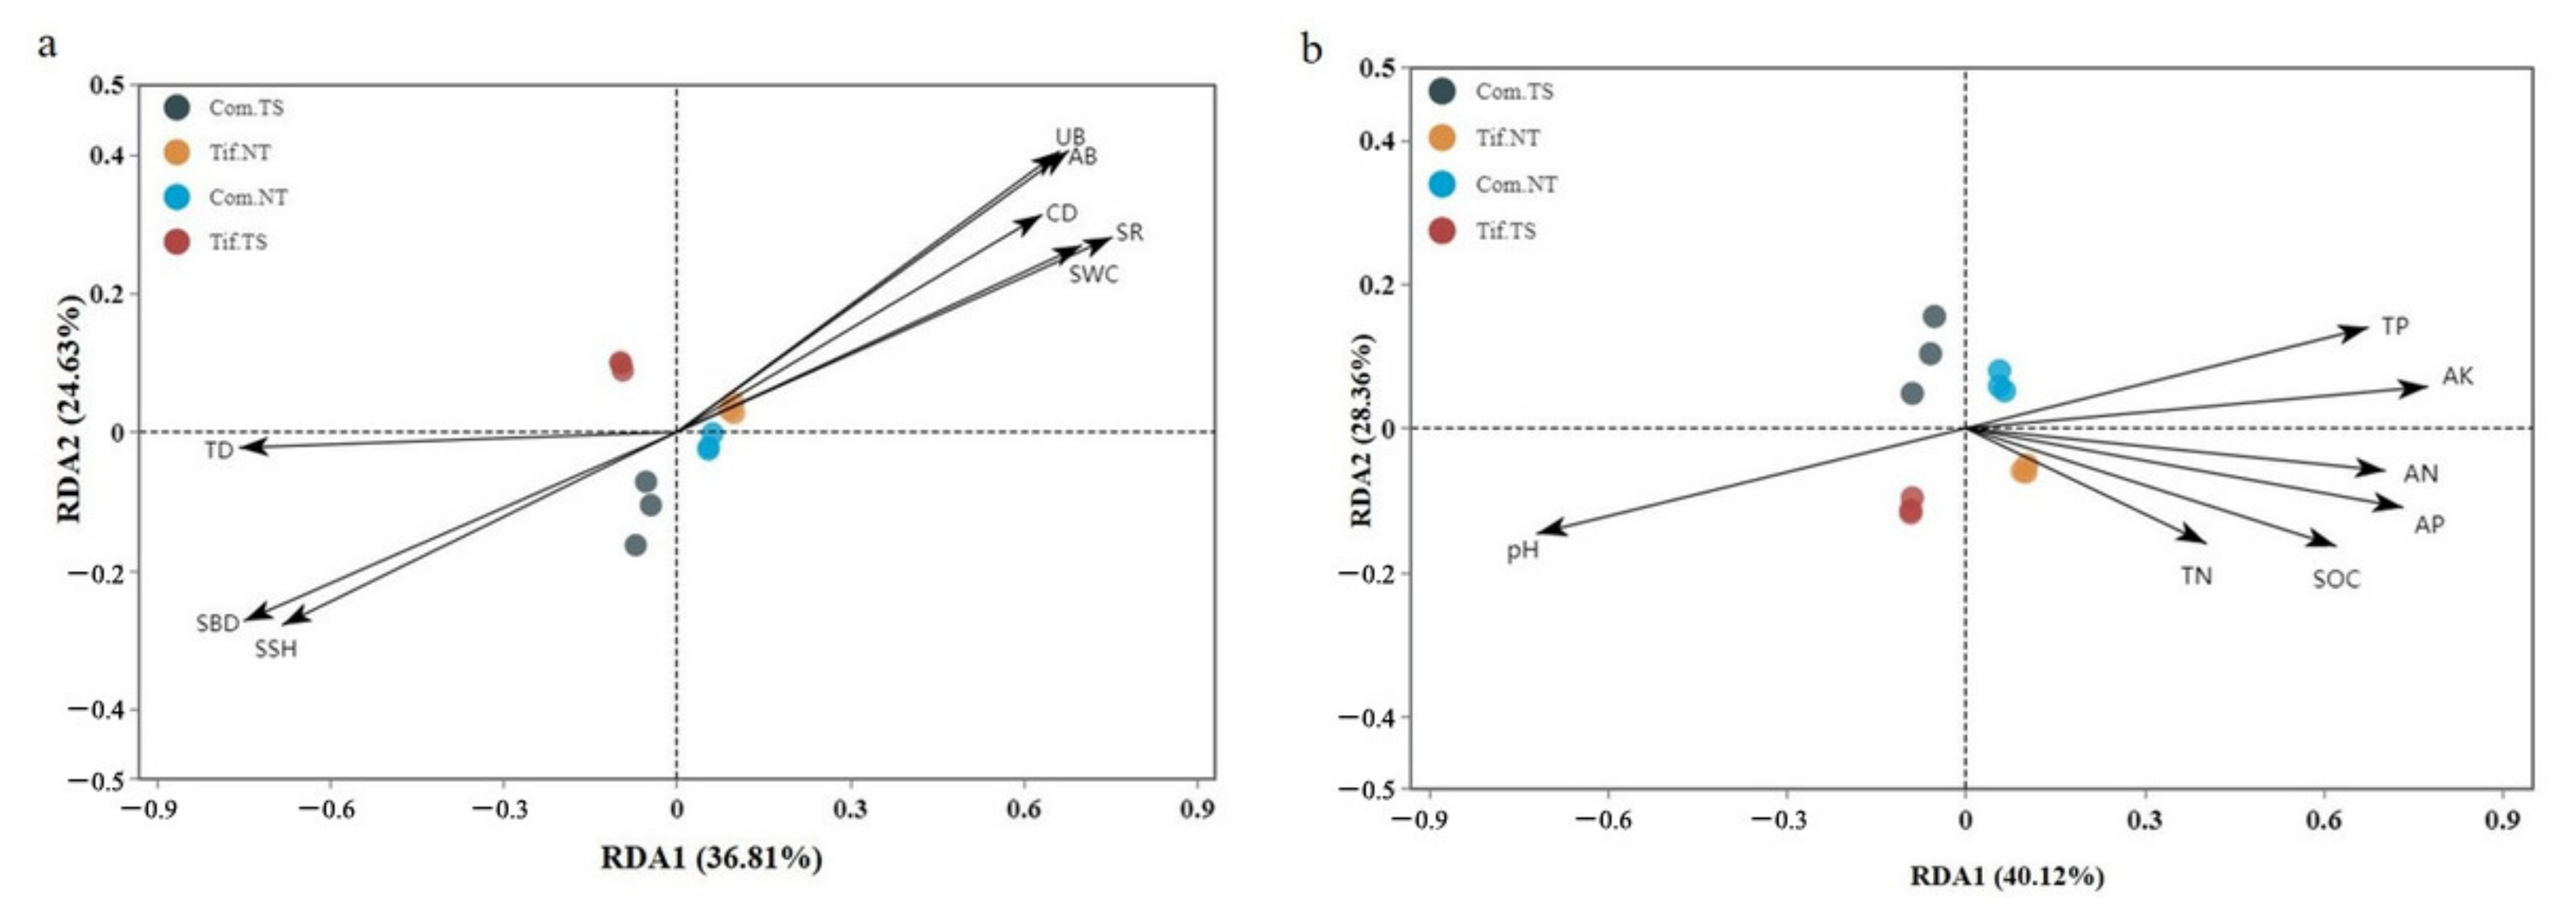
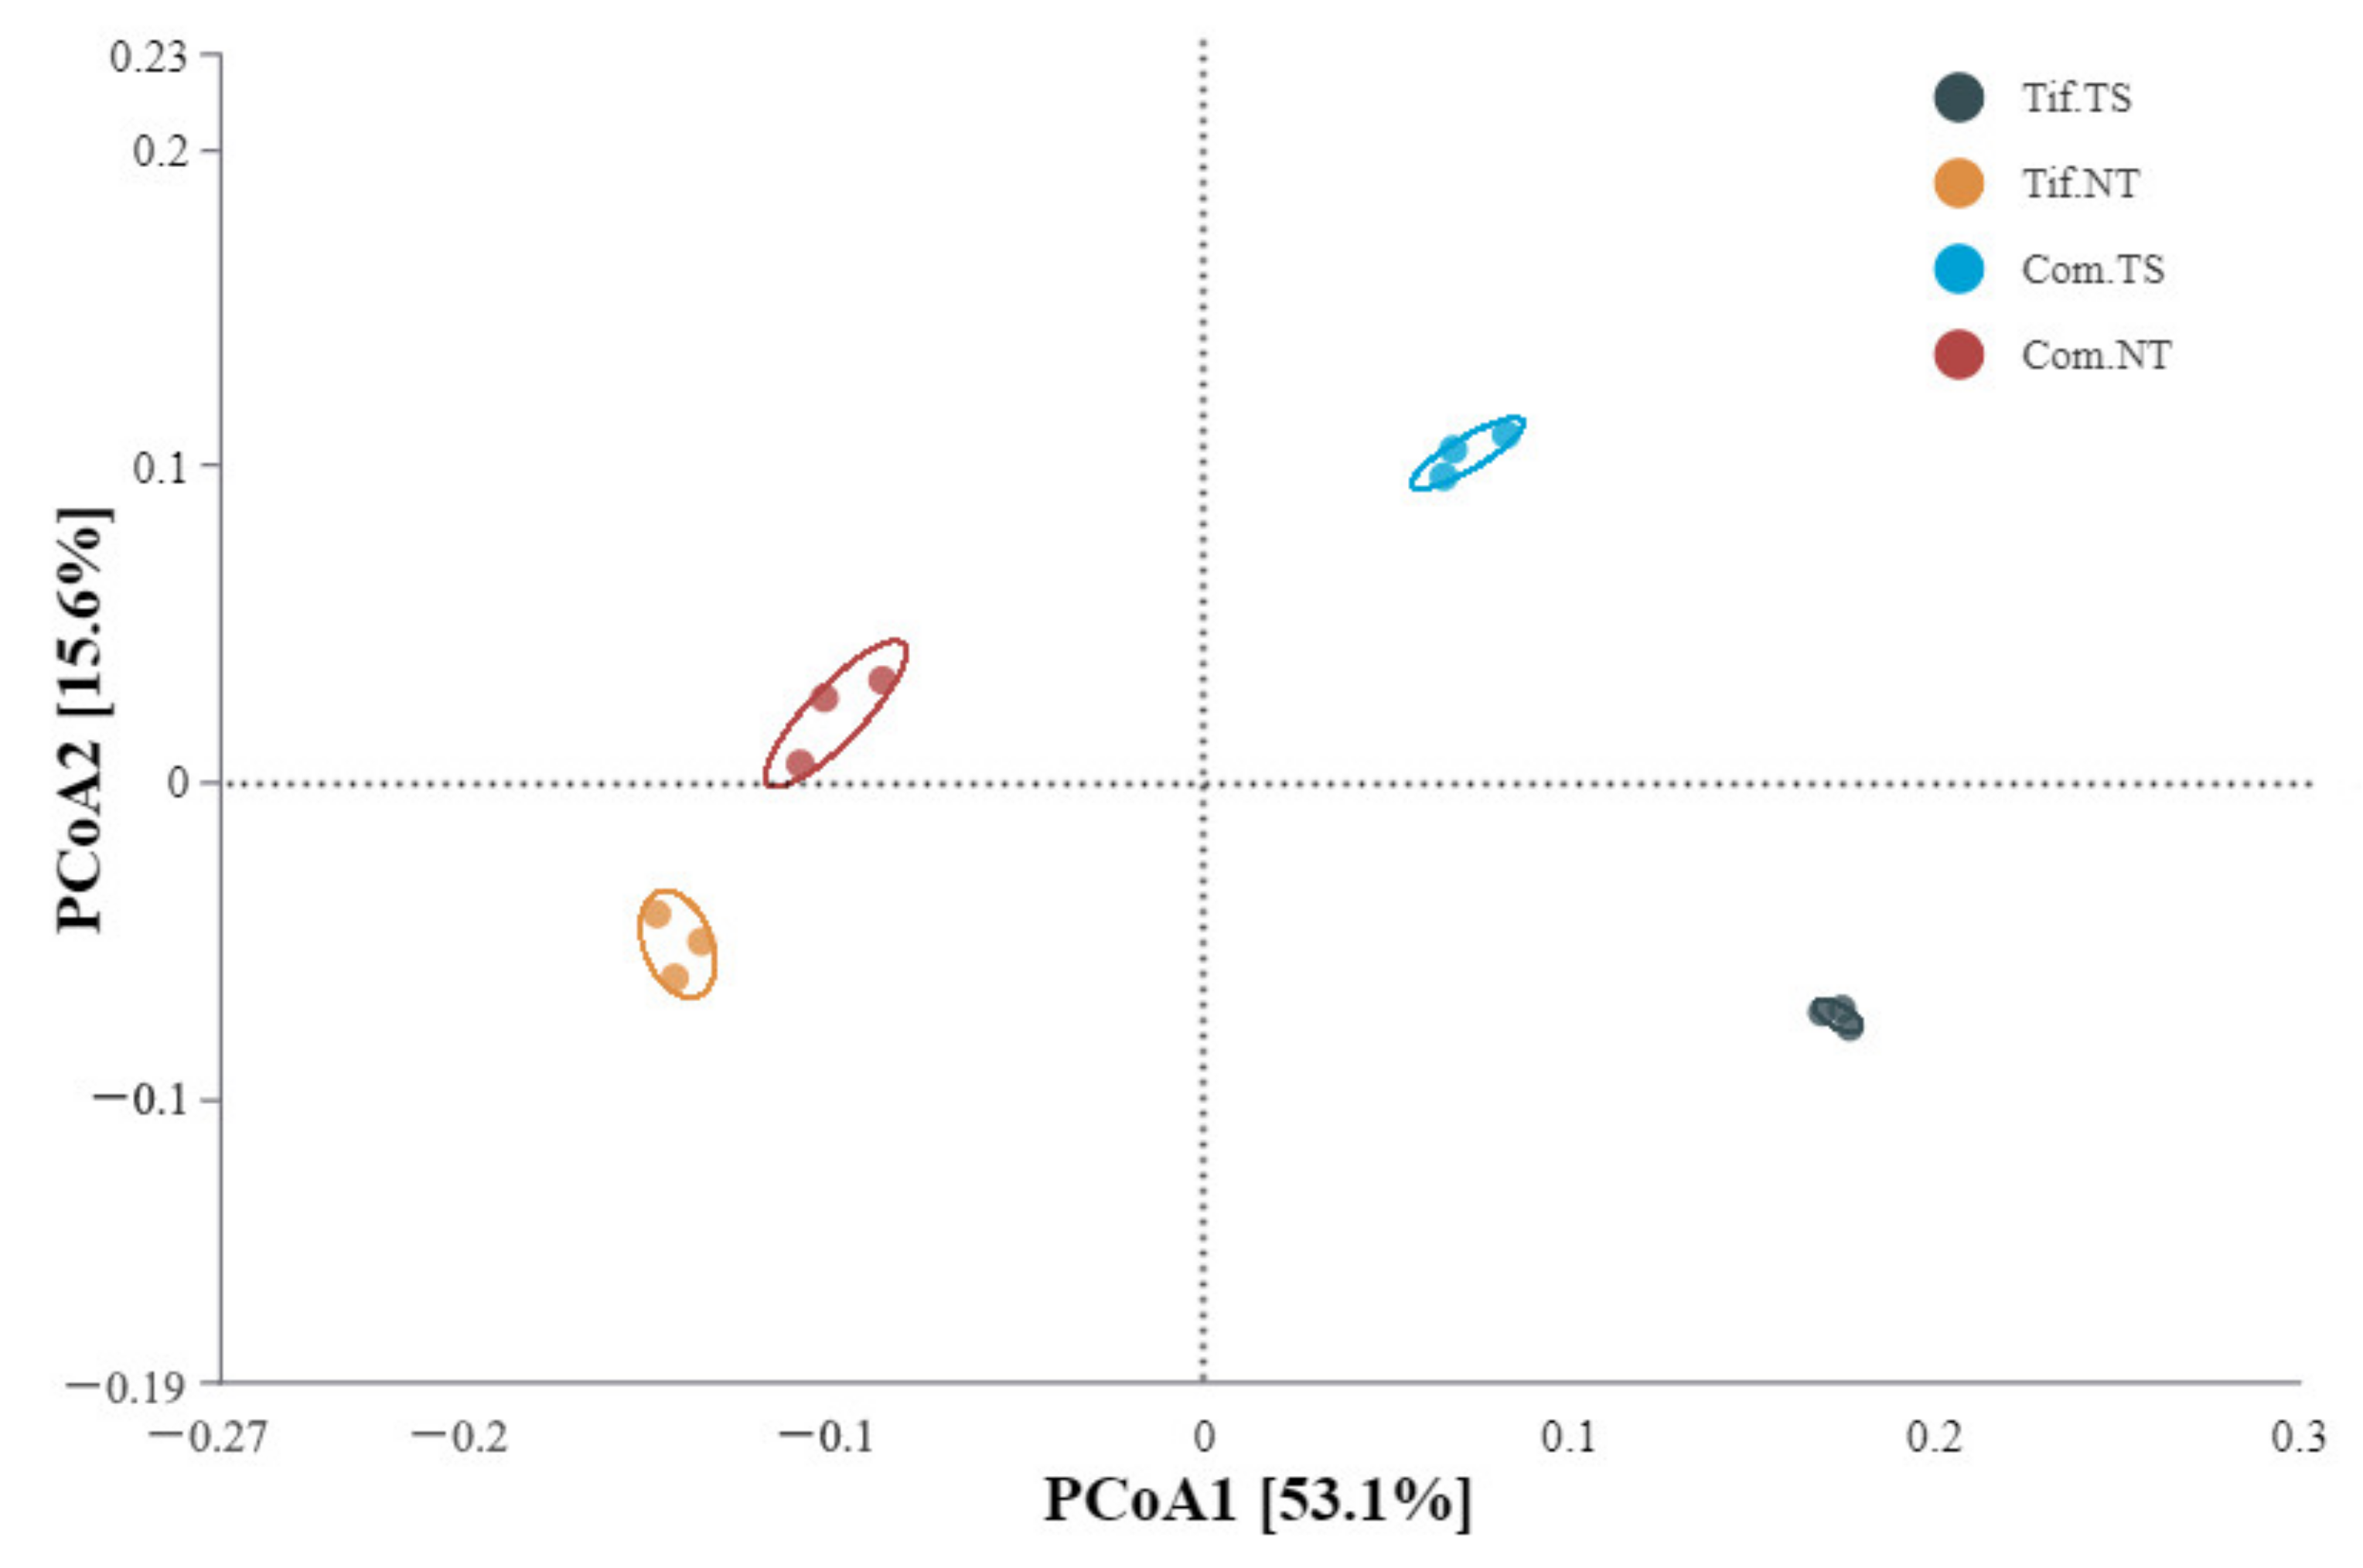
3.4. Analysis of Bacterial Alpha- and Beta-Diversities and Their Relations with Environmental Factors

The alpha diversity index results (Figure 5) showed that the order of ACE and Chaol indexes of the four samples was Tif.NT > Com.NT > Tif.TS > Com.TS (Figure 5a,b). In conclusion, the soil bacterial community species richness was highest in Tif.NT and lowest in Com.TS. The Shannon index of soil bacteria under traffic stress was significantly lower than non-traffic stress (Figure 5c), but the Simpson index exhibited a different result, and its descending order was Com.NT < Tif.NT < Tif.TS < Com.TS (Figure 5d). The high Simpson index indicated a low soil bacterial community species diversity. Based on these four indexes, the ACE index, Chaol index and Shannon index in two species of bermudagrass under traffic stress were significantly lower than non-traffic stress (p < 0.05). The Simpson index increased to different degrees, indicating that traffic stress significantly reduced the richness of soil bacterial species in bermudagrass and its diversity. From the perspective of different turfgrass varieties, the ACE and Chao1 indexes of Tifgreen bermudagrass increased remarkably relative to common bermudagrass under normal growth conditions and traffic stress (p < 0.05) (Table S3) and the difference between Shannon and Simpson indexes was insignificant, which indicated an increased soil bacterial diversity in Tifgreen bermudagrass compared with common bermudagrass under normal growth conditions and traffic stress.
PCoA ordination was adopted to reveal distinct changes between various treatments for bacterial communities, PCoA1, and PCoA2 (the first and second principal components made 53.1% and 15.6% contributions, respectively) (Figure 6). Traffic stress significantly affected soil microbial communities according to Bray–Curtis distances.

3.5. LefSe

LEfSe analysis was conducted to examine the effects of traffic treatment on Tifgreen bermudagrass (Figure 7a) and Common bermudagrass (Figure 7b) (from phylum to order); the LDA scores of them were greater than 3.8. The longer the length of the column, the more apparent the differences between the species. Deltaproteobacteria, Gammaproteobącteria, Chlamyliae, Chlamydiales, Chlamydiae, Acidobacteria, Proteobacteria, Acidobacteriales, and Acidobacteriia of Tif.NT and Chloroflexi, Actinobacteria, Ktedonobacteria, Ktedonobacterales, Actinobacteria, Anaerolineae, Anaerolineales, Thermoleophilia, Rhizobiales, and Planctomycetes of Tif.TS; Actinobacteria Bacteroidetes, Xanthomonadale, Bacteroidia, Verrucomicrobiae, Sphingobacteriale, Actinobacteria, Verrucomicrobia, and Pedosphaerale of Com.NT, and Acidobacteriia, Acidobacteria, and Acidobacteriales of Com.TS.
As revealed by redundancy analysis (RDA), alterations in the turf quality and soil physicochemical properties play a crucial function in forming the microbial community structure and composition. Changes in TD, UB, AB, CD, SR, SBD, SSH, SWC, and pH significantly affected the bacterial structural and compositional changes in diverse turf soil samples, but alterations of TN, TP, AK, AN, AP, and SOC showed less influence (Figure 8). The RDA diagram in Figure 8a showed that 61.44% of the total bacterial community variation could be explained by turf quality indicators and soil physical factors; RDA1 explained 36.81% of the total variation, and RDA2 explained 24.63% of the total variation. The RDA diagram in Figure 8b showed that 68.48% of the bacterial community variation could be explained by the soil chemical factors; RDA1 explained 40.12% of the total bacterial community variation, and RDA2 explained 28.63% of the total bacterial community variation.

3.6. Spearman Correlation Analysis

At the bacterial phylum level, based on Spearman correlation analysis (Figure 9a), Gemmatimonadetes, Nitrospirae and Actinobacteria were strongly positively correlated to pH and TD (p < 0.01), while Elusimicrobia, Acidobacteria and Patescibacteria were strongly negatively associated. Additionally, Gemmatimonadetes, Nitrospirae and Actinobacteria revealed a strong negative association with AK (p < 0.01), while Elusimicrobia, Acidobacteria, Patescibacteria and Chloroflexi were strongly positively associated (p < 0.01). Elusimicrobia, Acidobacteria and Patescibacteria showed a strong direct correlation to AK, SOC, TP, SWC, AP, SR, CD, AB (p < 0.01).
At the bacterial order level, Frankiales showed a strong direct proportion to SSH, SBD, TD, and pH (p < 0.01), while in strong indirect proportion to TP, AK, SOC, CD, UB, AB, AP, SR, SWC, and AN (p < 0.01) (Figure 9b). Elsterales and Acidobacteriales were in strong direct proportion to SSH, SBD, TD, and pH (p < 0.01) and revealed a strong positive association with TP, AK, AP, SR, SWC, and AN (p < 0.01). Betaproteobacteriales and Elsterales revealed a strong negative association with UB, AB, AP, SR (p < 0.01).

4. Discussion

4.1. Changes in Turf Quality, Bacterial Community Diversity, and Soil Physicochemical Characters under Traffic Stress

Traffic stress causes narrowing and curving of leaves, smaller plant size, and in severe cases, direct tearing damage or death of stem tissue in some plants [38,39], resulting in a decrease in TD, CD, AB, and UB (Figure 3). Plants can affect the soil bacterial community around the root systems via rhizosphere resources (e.g., root exudates, allelochemicals and soil nutrients) [40]. Traffic changes the soil nutrient composition and physical structure. It increased SSH, and SBD while decreasing SWC, TN, TP, AN, AP, AK, and SOC (Table 1). Traffic causes soil compaction, which destroys the soil particle distribution, and increases SSH and SBD (Table 1), which means the mechanical resistance of soil increases [41]. Thus, it compresses the space for turfgrass roots to grow, limits the range of root activity, and reduces the roots’ vigor and resistance, resulting in reduced turf quality. In this environment of low soil oxygen and high mechanical resistance, the plant root system exudes a large amount of root fluid specifically designed to alter the soil bacteria composition, which is supported by Jaqueth et al. [42]. Aboveground vegetation species may restrict specific soil microbial community growth [43]. Alpha diversity revealed that the Tif-NT soil sample had the highest bacterial community abundance, and its diversity was better than Com-NT. The bacterial community structure was different between common and Tifgreen bermudagrass (Figure 5). The PCoA results showed (Figure 6) that both species and traffic had a specific effect on soil bacterial community structures, while traffic had a stronger impact. Similarly, their soil bacterial communities changed differently due to the difference in the degree of damage and impact of traffic stress on the two bermudagrass turfs. LefSe revealed that the abundance of soil bacterial types in bermudagrass turfs traffic compared to non-traffic treatments was significantly different, mainly by Chloroflexi, Actinobacteria, and Ktedonobacteria in Tif.TS, and Proteobacteria, Acidobacteriales, and Acidobacteria in Tif.NT. Bermudagrass turf traffic compared to non-traffic treatments was significantly different, mainly by Actinobacteria, Bacteroidetes, and Xanthomonadale in Com.TS, and Acidobacteriia, Acidobacteria, and Acidobacteriales in Com.NT (Figure 7). Plant species showed great differences concerning little decomposition ability [44], which impacts their soil microbial structure [45]. Traffic directly causes damage to turfgrass stems and leaves, and some leaves fall off and become litter [46]. The material composition and structure of the stem and leaf parts of the two species of bermudagrass differ, and traffic on the aboveground part of the bermudagrass causes part of its contents to exude and flow into the soil, which we speculate may cause the change in soil bacterial communities in the two species of bermudagrass under different treatments.
The aboveground biota can provide resources such as organic carbon necessary for organic matter decomposition by belowground biota. Afterward, the products obtained from organic decomposition are adopted by aboveground biota as nutrients, particularly plants [47]. The soil bacterial ACE and Chaol indexes in both bermudagrass turf under traffic conditions remarkably decreased compared with non-traffic treatment. At the same time, the Shannon index also showed different degrees of reduction (Figure 5), indicating that traffic stress significantly reduced the number of soil bacterial species in bermudagrass and its diversity. Turf abrasion in traffic stress directly damages the rhizome part of the turfgrass on the surface, reducing the quality of the turf [48]. It also reduces the photosynthesis of turf leaves, leading to slow growth of turf plants, resulting in a decrease in the aboveground biomass of the turf [49]. The aboveground part of bermudagrass turf under traffic stress was damaged, and the aboveground biomass was significantly reduced, resulting in a decrease in the supply of organic carbon and nutrients from the aboveground to the belowground part, which to some extent affected the activity of the soil bacterial community while reducing the bacterial diversity. Alterations to the soil physicochemical properties greatly affect microbial composition and structure [50]. Under the traffic conditions of the self-made traffic simulator, with increased soil compaction, there was a corresponding increase in SBD, decrease in SWC, and decrease in respiration (Table 1).
Traffic reduced, to varying degrees, the N, P, K, and SOC contents of bermudagrass turf soils (Table 1.). On the one hand, it may be due to traffic stress reducing the cover degree of bermudagrass turf, increasing the exposed surface area and decomposition of SOC, combined with wind and water erosion, resulting in the loss of soil nutrients and decrease in soil pH. On the other hand, traffic stress increases the compaction of soil, reducing its aeration and permeability, leading to increased competition between underground parts of plants and accelerating the absorption and utilization of nutrients [51]. These factors affect the soil microbial living conditions, decreasing the soil bacterial diversity and richness. The carbon commission by soil respiration (SR) includes soil hetero-trophic respiration and root respiration, and soil heterotrophic respiration is closely related to the content of soil organic carbon (SOC). Traffic stress causes abrasion and compression of the aboveground portion of Bermudagrass turf, which affects root growth and leads to a decrease in the belowground biomass of the grass (Figure 3) and the respiration intensity of the root system. The soil heterotrophic respiration is positively correlated with the soil organic carbon content [52]. The decrease in SR accompanied by a decrease in SOC reflected a decrease in the activity of soil microorganisms [53]. Our work demonstrated that under moderate traffic conditions, the TD, CD and AB, UB of Tifgreen bermudagrass decreased less than common bermudagrass. Traffic stress directly damaged some of the stem and leaf tissues on turfgrass, causing a 36% to 39% decrease in the aboveground biomass magnitude of the two turfgrasses due to leaf damage, decreased turfgrass photosynthetic capacity, decreased organic carbon content flowing from the aboveground part to the underground part, and a lack of nutrient content, respiratory substrate and energy supply, leading to a decrease in the soil respiration rate [54]. The belowground biomass of Tifgreen was significantly higher than common bermudagrass, resulting in a much lower respiration intensity of the root system of common bermudagrass, which was primarily related to lower soil bacterial diversity and abundance in common bermudagrass turf than Tifgreen bermudagrass under traffic stress.

4.2. Bacterial Community Structure Correlation with Soil Properties under Traffic Stress

Several species of soil bacteria exist at low levels, whereas a low portion of species exists at high levels [55]. Proteobacteria and Acidobacteria are the predominant soil bacteria at the phylum level globally [56]. We found that Acidobacteria and Proteobacteria were the predominant bacterial species at phylum levels in soil samples from all four treatments (Figure 4). Their pooled relative abundance was 50% of the overall bacterial species in the entire sample soil specimens. Proteobacteria participate in recycling nutrients and increase plant development and soil fertility [57]. Acidobacteria are ubiquitous, and among the most abundant bacterial phyla in acidic soil [58]. The pH of all treatments in our research was less than 7, belonging to an acidic environment (Table 1). The experiment site is located in a subtropical area, with high temperatures and rain in summer, an average temperature over 30 degrees, and monthly precipitation of more than 200 mm (Figure 1). Therefore, the soil weathering and soil formation were strong, the plant material cycle was rapid, and the salt base was highly unsaturated, leading to acidic soil [59]. At the same time, the plant growth is vigorous in summer, the root secretion is more than that in other seasons, and the soil organic carbon content is higher [60]. Therefore, Proteobacteria and Acidobacteria were the predominant soil bacteria at the phylum level during this experiment. Dai et al. considered that soil organic C availability is likely to preferentially support the growth of copiotrophic bacteria (e.g., some Proteobacteria) due to their preference for living in nutrient-sufficient or nutrient-limited environments [61]. We found that traffic decreased the SOC content (Table 1), which resulted in less support for the growth of Proteobacteria. The pH has been identified as the key factor distinguishing the overall bacterial species [62]. However, Proteobacteria were not significantly related to pH in a previous study [63]. Proteobacteria were significantly associated with TD, AK, and TP (p < 0.05). In contrast, 10 of the 15 bacterial species, such as Acidobacteria, were related to pH (Figure 9), concordant with molecular-study-derived data that Acidobacteria accounts for the main part of the soil microbial community, the greatest abundance in acidic soil [64]. At present, Acidobacteria are suggested to a play role in particular biopolymer decomposition as well as global carbon, hydrogen, and iron cycles in the natural ecosystem [65]. Moreover, Acidobacteria possessed a strong positive association with AK, SOC, TP, SWC, AP, SR, CD, and AB (p < 0.01). We observed that the phylum Chloroflexi, Verrucomicrobia, and Actinobacteria showed higher abundances in turf soils under traffic stress, conforming with the copiotroph/oligotroph hypothesis by Fierer et al. that bacterial phyla with oligotrophic properties are more abundant in a nutrient-poor environment [66]. In addition, it conforms with recent results that oligotrophic taxa have reduced abundances (such as Planctomycetes and Verrucomicrobia) in cultured fertilized soils [67]. In addition, Actinomycetes may exhibit remarkable desiccation resistance and survive in resource-depleting soils for a long time [68]. Under traffic stress, SOC, SWC, and the content of nutrients such as N, P, K of bermudagrass turf soil showed different degrees of decrease (Table 1). Thus, bacterial phyla with oligotrophic properties such as actinomycetes and Chloroflexi were more suitable to grow in this soil environment. According to RDA, the SOC level showed a positive correlation with bacterial diversities (Figure 8) since SOC offered energy for bacteria [69]. Acidobacteriia is ecologically well adapted in dry, sandy soil characterized by a lack of organic matter [70]. Therefore, the difference in the content of Acidobacteriia was greater in common bermudagrass soils, where the decrease in turf quality and soil organic carbon content was higher under traffic conditions.
Microbial communities adapt to altering environmental conditions [71]. Such alterations in functional bacteria detected in the present work might be due to traffic-stress-induced adaptation of turfgrass. Further studies are warranted to elucidate the biological adaptation mechanism, allowing us to select the best turf management options.

5. Conclusions

Under traffic stress, both the common bermudagrass and Tifgreen bermudagrass lawn turf quality decreased, the soil physicochemical properties changed, the SSH and SBD increased, and the pH, SR, SOC, and nutrient content decreased. Traffic was the main factor affecting the soil microbial structure. Both the soil bacterial abundance and diversity decreased under trampling stress. The RDA showed that changes in the TD, UB, AB, CD, SR, SBD, SSH, SWC, and pH significantly affected the bacterial structural and compositional changes in diverse turf soils. Acidobacteria showed a significant positive association with AK, SOC, TP, SWC, AP, SR, CD, and AB. Proteobacteria were significantly associated with TD, AK, and TP. Chloroflexi, Verrucomicrobia, and Actinobacteria showed significantly increased abundances in turf soils under traffic stress. Thus, this will lay a certain theoretical foundation for the healthy treatment of urban recreation and sports turfs.

Supplementary Materials

The following supporting information can be downloaded at: https://www.mdpi.com/article/10.3390/agriculture12050668/s1, Table S1. Difference in bacterial community relative abundances at phylum level (%). Table S2. Difference in bacterial community relative abundances at order level (%). Table S3. Alpha diversity (ACE, Chaol, Shannon and Simpson indexes) index of soil bacterial community structure under traffic stress.

Author Contributions

All authors contributed to the study conception and design. J.Z. and T.L. conceived and initiated the project. All the experiments were performed by H.W. and Y.W. The material preparation and data collection were performed by Y.W. The bioinformatic analysis was conducted by L.G. The first draft of the manuscript was written by H.W. and all authors commented on previous versions of the manuscript. All authors have read and agreed to the published version of the manuscript.

Funding

This study was supported by the Natural Science Foundation of Guangdong Province (Grant No. 2020A1515011261) and Key Research and Development Program of Guangzhou (No. 202103000066).

Institutional Review Board Statement

Not applicable.

Informed Consent Statement

Not applicable.

Data Availability Statement

The data will be provided individually by contacting the corresponding author.

Conflicts of Interest

The authors declare that they have no known competing financial interests.

References

  1. Gląb, T.; Szewczyk, W.; Dubas, E.; Kowalik, K.; Jezierski, T. Anatomical and Morphological Factors Affecting Wear Tolerance of Turfgrass. Sci. Horticul. 2015, 185, 1–13. [Google Scholar] [CrossRef]
  2. Martiniello, P. Effect of Traffic Stress on Cool-Season Turfgrass under A Mediterranean Climate. Agron. Sust. Dev. 2007, 27, 293–301. [Google Scholar] [CrossRef]
  3. Wei, H.; Yang, W.; Wang, Y.; Ding, J.; Ge, L.; Richardson, M.; Liu, T.; Zhang, J. Correlations among Soil, Leaf Morphology, and Physiological Factors with Wear Tolerance of Four Warm-season Turfgrass Species. HortScience 2022, 57, 571–580. [Google Scholar] [CrossRef]
  4. Głąb, T.; Szewczyk, W. The Effect of Traffic on Turfgrass Root Morphological Features. Sci. Horticul. 2015, 197, 542–554. [Google Scholar] [CrossRef]
  5. Antille, D.L.; Peets, S.; Galambošová, J.; Botta, G.F.; Rataj, V.; Macák, M.; Tullberg, J.N.; Chamen, W.C.; White, D.R.; Misiewicz, P.A.; et al. Soil Compaction and Controlled Traffic Farming in Arable and Grass Cropping Systems. Agron. Res. 2019, 17, 653–682. [Google Scholar] [CrossRef]
  6. Hiernaux, P.; Bielders, C.L.; Valentin, C.; Bationo, A.; Fernandez-Rivera, S. Effects of Livestock Grazing on Physical and Chemical Properties of Sandy Soils in Sahelian Rangelands. J. Arid Environ. 1999, 41, 231–245. [Google Scholar] [CrossRef] [Green Version]
  7. Liu, T.; Wang, X.; Zhang, J. Development of A Novel Traffic Simulator and Evaluation of Warm-Season Turfgrass Traffic Tolerance in Field Experiments. Acta Pratacul. Sin. 2019, 28, 41–52. [Google Scholar] [CrossRef]
  8. Carman, K. Compaction Characteristics of Towed Wheels on Clay Loam in a Soil Bin. Soil Till. Res. 2002, 65, 37–43. [Google Scholar] [CrossRef]
  9. Franzluebbers, A.; Stuedemann, J.; Schomberg, H. Spatial Distribution of Soil Carbon and Nitrogen Pools under Grazed Tall Fescue. Soil Sci. Soc. Am. J. 2000, 64, 635–639. [Google Scholar] [CrossRef] [Green Version]
  10. Chen, Y.L.; Deng, Y.; Ding, J.Z.; Hu, H.W.; Xu, T.L.; Li, F.; Yang, G.B.; Yang, Y.H. Distinct Microbial Communities in The Active and Permafrost Layers on The Tibetan Plateau. Mol. Ecol. 2017, 26, 6608–6620. [Google Scholar] [CrossRef]
  11. Singh, J.S.; Raghubanshi, A.S.; Singh, R.S.; Srivastava, S. Microbial Biomass Acts as A Source of Plant Nutrients in Dry Tropical Forest and Savanna. Nature 1989, 338, 499–500. [Google Scholar] [CrossRef]
  12. Bardgett, R.D.; Van Der Putten, W.H. Belowground Biodiversity and Ecosystem Functioning. Nature 2014, 515, 505–511. [Google Scholar] [CrossRef] [PubMed]
  13. Delgado-Baquerizo, M.; Oliverio, A.M.; Brewer, T.E.; Benavent-González, A.; Eldridge, D.J.; Bardgett, R.D.; Maestre, F.T.; Singh, B.K.; Fierer, N. A Global Atlas of the Dominant Bacteria Found in Soil. Science 2018, 359, 320–325. [Google Scholar] [CrossRef] [PubMed] [Green Version]
  14. Wu, S.H.; Huang, B.H.; Huang, C.L.; Li, G.; Liao, P.C. The Aboveground Vegetation Type and Underground Soil Property Mediate the Divergence of Soil Microbiomes and The Biological Interactions. Microb. Ecol. 2018, 75, 434–446. [Google Scholar] [CrossRef] [PubMed]
  15. Bissett, A.; Brown, M.V.; Siciliano, S.D.; Thrall, P.H. Microbial Community Responses to Anthropogenically Induced Environmental Change: Towards A Systems Approach. Ecol. Lett. 2013, 16, 128–139. [Google Scholar] [CrossRef] [PubMed]
  16. Klimek, B.; Niklińska, M.; Jaźwa, M.; Tarasek, A.; Tekielak, I.; Musielok, Ł. Covariation of Soil Bacteria Functional Diversity and Vegetation Diversity Along an Altitudinal Climatic Gradient in The Western Carpathians. Pedobiologia 2015, 58, 105–112. [Google Scholar] [CrossRef]
  17. Bukar, M.; Sodipo, O.; Dawkins, K.; Ramirez, R.; Kaldapa, J.T.; Tarfa, M.; Esiobu, M. Microbiomes of Top and Sub-Layers of Semi-Arid Soils in North-Eastern Nigeria Are Rich in Firmicutes and Proteobacteria with Surprisingly High Diversity of Rare Species. Adv. Microbiol. 2019, 9, 102–118. [Google Scholar] [CrossRef] [Green Version]
  18. Brockett, B.F.; Prescott, C.E.; Grayston, S.J. Soil Moisture is the Major Factor Influencing Microbial Community Structure and Enzyme Activities across Seven Biogeoclimatic Zones in Western Canada. Soil Biol. Biochem. 2012, 44, 9–20. [Google Scholar] [CrossRef]
  19. Cederlund, H.; Wessén, E.; Enwall, K.; Jones, C.M.; Juhanson, J.; Pell, M.; Philippot, L.; Hallin, S. Soil Carbon Quality and Nitrogen Fertilization Structure Bacterial Communities with Predictable Responses of Major Bacterial Phyla. Appl. Soil Ecol. 2014, 84, 62–68. [Google Scholar] [CrossRef]
  20. He, W.; Zhang, M.; Jin, G.; Sui, X.; Zhang, T.; Song, F. Effects of Nitrogen Deposition on Nitrogen-Mineralizing Enzyme Activity and Soil Microbial Community Structure in A Korean Pine Plantation. Microb. Ecol. 2021, 81, 410–424. [Google Scholar] [CrossRef]
  21. Li, J.; Shen, Z.; Li, C.; Kou, Y.; Wang, Y.; Tu, B.; Zhang, S.; Li, X. Stair-Step Pattern of Soil Bacterial Diversity Mainly Driven by pH and Vegetation Types Along the Elevational Gradients of Gongga Mountain, China. Front. Microbiol. 2018, 9, 569. [Google Scholar] [CrossRef] [PubMed] [Green Version]
  22. Martınez, L.; Zinck, J. Temporal Variation of Soil Compaction and Deterioration of Soil Quality in Pasture Areas of Colombian Amazonia. Soil Till. Res. 2004, 75, 3–18. [Google Scholar] [CrossRef]
  23. Patkowska, E. Biostimulants Managed Fungal Phytopathogens and Enhanced Activity of Beneficial Microorganisms in Rhizosphere of Scorzonera (Scorzonera hispanica L.). Agriculture 2021, 11, 347. [Google Scholar] [CrossRef]
  24. Van Wyk, D.A.; Adeleke, R.; Rhode, O.H.; Bezuidenhout, C.C.; Mienie, C. Ecological Guild and Enzyme Activities of Rhizosphere Soil Microbial Communities Associated with Bt-Maize Cultivation Under Field Conditions in North West Province of South Africa. J. Basic Microbiol. 2017, 57, 781–792. [Google Scholar] [CrossRef]
  25. Cheng, H.; Wu, B.; Wei, M.; Wang, S.; Rong, X.; Du, D.; Wang, C. Changes in Community Structure and Metabolic Function of Soil Bacteria Depending on The Type Restoration Processing in The Degraded Alpine Grassland Ecosystems in Northern Tibet. Sci. Total Environ. 2020, 755, 142619. [Google Scholar] [CrossRef]
  26. Zhang, J.; Richardson, M.; Karcher, D.; McCalla, J.; Mai, J.; Luo, H. Dormant Sprigging of Bermudagrass and Zoysiagrass. HortTechnology 2021, 31, 395–404. [Google Scholar] [CrossRef]
  27. Magni, S.; Sportelli, M.; Grossi, N.; Volterrani, M.; Minelli, A.; Pirchio, M.; Fontanelli, M.; Frasconi, C.; Gaetani, M.; Martelloni, L.; et al. Autonomous Mowing and Turf-Type Bermudagrass as Innovations for an Environment-Friendly Floor Management of a Vineyard in Coastal Tuscany. Agriculture 2020, 10, 189. [Google Scholar] [CrossRef]
  28. Wei, H.; Ding, J.; Zhang, J.; Yang, W.; Wang, Y.; Liu, T. Changes in Soil Fungal Community Structure Under Bermudagrass Turf in Response to Traffic Stress. Acta Pratacul. Sin. 2022, 31, 102–112. [Google Scholar] [CrossRef]
  29. Olsen, S.R. Estimation of Available Phosphorus in Soils by Extraction with Sodium Bicarbonate; US Department of Agriculture: Washington, DC, USA, 1954.
  30. Wu, W.; Tang, X.P.; Yang, C.; Liu, H.B.; Guo, N.J. Investigation of Ecological Factors Controlling Quality of Flue-Cured Tobacco (Nicotiana tabacum L.) Using Classification Methods. Ecol. Inform. 2013, 16, 53–61. [Google Scholar] [CrossRef]
  31. Walkley, A. An Examination of Methods for Determining Organic Carbon and Nitrogen in Soils. (With One Text-figure.). J. Agric. Sci. 1935, 25, 598–609. [Google Scholar] [CrossRef]
  32. Caporaso, J.G.; Kuczynski, J.; Stombaugh, J.; Bittinger, K.; Bushman, F.D.; Costello, E.K.; Fierer, N.; Peña, A.G.; Goodrich, J.K.; Gordon, J.I.; et al. QIIME Allows Analysis of High-Throughput Community Sequencing Data. Nat. Methods 2010, 7, 335–336. [Google Scholar] [CrossRef] [PubMed] [Green Version]
  33. Yilmaz, P.; Parfrey, L.W.; Yarza, P.; Gerken, J.; Pruesse, E.; Quast, C.; Schweer, T.; Peplies, J.; Ludwig, W.; Glöckner, F.O. The SILVA and “All-Species Living Tree Project (LTP)” Taxonomic Frameworks. Nucl. Acids Res. 2014, 42, D643–D648. [Google Scholar] [CrossRef] [PubMed] [Green Version]
  34. Heruth, D.; Xiong, M.; Jiang, X. Microbiome-seq data analysis. In Big Data Analysis for Bioinformatics and Biomedical Discoveries; CRC Press: Boca Raton, FL, USA, 2016; Volume 97, p. 114. [Google Scholar]
  35. Oksanen, J.; Kindt, R.; Legendre, P.; O’Hara, B.; Stevens, M.H.H.; Oksanen, M.J.; Simpson, G.L.; Solymos, P.; Wagner, H. The vegan package. Comm. Ecol. Pack. 2007, 10, 719. Available online: http://www.R-project.org (accessed on 24 February 2021).
  36. Love, M.I.; Huber, W.; Anders, S. Moderated Estimation of Fold Change and Dispersion for RNA-seq Data with DESeq2. Genome Biol. 2014, 15, 550. [Google Scholar] [CrossRef] [Green Version]
  37. White, J.R.; Nagarajan, N.; Pop, M. Statistical Methods for Detecting Differentially Abundant Features in Clinical Metagenomic Samples. PLoS Comput. Biol. 2009, 5, e1000352. [Google Scholar] [CrossRef]
  38. Menneer, J.; Ledgard, S.; McLay, C.; Silvester, W. The Effects of Treading by Dairy Cows during Wet Soil Conditions on White Clover Productivity, Growth and Morphology in a White Clover–Perennial Ryegrass Pasture. Grass Forage Sci. 2005, 60, 46–58. [Google Scholar] [CrossRef]
  39. Malleshaiah, S.; Govindaswamy, V.; Murugaiah, J.; Ganga, M.; Surakshitha, N. Influence of Traffic Stress on Warm Season Turfgrass Species under Simulated Traffic. Indian J. Agric. Sci. 2017, 87, 62–68. [Google Scholar]
  40. Eilers, K.G.; Lauber, C.L.; Knight, R.; Fierer, N. Shifts in Bacterial Community Structure Associated with Inputs of Low Molecular Weight Carbon Compounds to Soil. Soil Biol. Biochem. 2010, 42, 896–903. [Google Scholar] [CrossRef]
  41. Hamza, M.; Anderson, W. Soil Compaction in Cropping Systems: A Review of The Nature, Causes and Possible Solutions. Soil Till. Res. 2005, 82, 121–145. [Google Scholar] [CrossRef]
  42. Jaqueth, A.L.; Turner, T.R.; Iwaniuk, M.E.; McIntosh, B.J.; Burk, A.O. Relative Traffic Tolerance of Warm-Season Grasses and Suitability for Grazing by Equine. J. Equine Vet. Sci. 2019, 103, 103244. [Google Scholar] [CrossRef]
  43. Zhang, Y.; Cao, C.; Peng, M.; Xu, X.; Zhang, P.; Yu, Q.; Sun, T. Diversity of Nitrogen-Fixing, Ammonia-Oxidizing, And Denitrifying Bacteria in Biological Soil Crusts of A Revegetation Area In Horqin Sandy Land, Northeast China. Ecol. Eng. 2014, 71, 71–79. [Google Scholar] [CrossRef]
  44. Cornwell, W.K.; Cornelissen, J.H.; Amatangelo, K.; Dorrepaal, E.; Eviner, V.T.; Godoy, O.; Hobbie, S.E.; Hoorens, B.; Kurokawa, H.; Pérez-Harguindeguy, N.; et al. Plant Species Traits Are the Predominant Control on Litter Decomposition Rates within Biomes Worldwide. Ecol. Lett. 2008, 11, 1065–1071. [Google Scholar] [CrossRef] [PubMed]
  45. Hossain, M.Z.; Okubo, A.; Sugiyama, S.I. Effects of Grassland Species on Decomposition of Litter and Soil Microbial Communities. Ecol. Res. 2010, 25, 255–261. [Google Scholar] [CrossRef]
  46. Pornaro, C.; Barolo, E.; Rimi, F.; Macolino, S.; Richardson, M. Performance of Various Cool-Season Turfgrasses as Influenced by Simulated Traffic in Northeastern Italy. Eur. J. Hortic. Sci. 2016, 81, 27–36. [Google Scholar] [CrossRef]
  47. Wardle, D.A.; Bardgett, R.D.; Klironomos, J.N.; Setälä, H.; Van Der Putten, W.H.; Wall, D.H. Ecological Linkages between Aboveground and Belowground Biota. Science 2004, 304, 1629–1633. [Google Scholar] [CrossRef] [PubMed]
  48. Trenholm, L.; Carrow, R.; Duncan, R. Mechanisms of Wear Tolerance in Seashore Paspalum and Bermudagrass. Crop Sci. 2000, 40, 1350–1357. [Google Scholar] [CrossRef]
  49. Frank, D.A.; McNaughton, S. The Ecology of Plants, Large Mammalian Herbivores, and Drought in Yellowstone National Park. Ecology 1992, 73, 2043–2058. [Google Scholar] [CrossRef]
  50. Ezeokoli, O.T.; Mashigo, S.K.; Paterson, D.G.; Bezuidenhout, C.C.; Adeleke, R.A. Microbial Community Structure and Relationship with Physicochemical Properties of Soil Stockpiles in Selected South African Opencast Coal Mines. Soil Sci. Plant Nutr. 2019, 65, 332–341. [Google Scholar] [CrossRef]
  51. Cao, J.; Gong, Y.; Yeh, E.T.; Holden, N.M.; Adamowski, J.F.; Deo, R.C.; Liu, M.; Zhou, J.; Zhang, J.; Zhang, W.; et al. Impact of grassland contract policy on soil organic carbon losses from alpine grassland on the Qinghai-Tibetan Plateau. Soil Use Manag. 2017, 33, 663–671. [Google Scholar] [CrossRef]
  52. Papp, M.; Fóti, S.; Nagy, Z.; Pintér, K.; Posta, K.; Fekete, S.; Csintalan, Z.; Balogh, J. Rhizospheric, Mycorrhizal and Heterotrophic Respiration in Dry Grasslands. Eur. J. Soil Biol. 2018, 85, 43–52. [Google Scholar] [CrossRef]
  53. Wang, Y.; Wang, D.; Shi, B.; Sun, W. Differential Effects of Grazing, Water, And Nitrogen Addition on Soil Respiration and Its Components in a Meadow Steppe. Plant Soil. 2020, 447, 581–598. [Google Scholar] [CrossRef]
  54. Gong, J.; Ge, Z.; An, R.; Duan, Q.; You, X.; Huang, Y. Soil Respiration in Poplar Plantations in Northern China at Different Forest Ages. Plant Soil 2012, 360, 109–122. [Google Scholar] [CrossRef]
  55. Sogin, M.L.; Morrison, H.G.; Huber, J.A.; Welch, D.M.; Huse, S.M.; Neal, P.R.; Arrieta, J.M.; Herndl, G.J. Microbial diversity in the deep sea and the underexplored “rare biosphere”. Proc. Natl. Acad. Sci. USA 2006, 103, 12115–12120. [Google Scholar] [CrossRef] [PubMed] [Green Version]
  56. Tripathi, B.M.; Kim, M.; Singh, D.; Lee-Cruz, L.; Lai-Hoe, A.; Ainuddin, A.; Raha Abdul Rahim, R.; Husni, M.H.A.; Chun, J.; Adams, J.M. Tropical Soil Bacterial Communities in Malaysia: pH Dominates in The Equatorial Tropics Too. Microb. Ecol. 2012, 64, 474–484. [Google Scholar] [CrossRef] [PubMed]
  57. Bulgarelli, D.; Schlaeppi, K.; Spaepen, S.; Van, T.; Emiel, V.L.; Schulze-Lefert, P. Structure and Functions of the Bacterial Microbiota of Plants. Annu. Rev. Plant. Biol. 2013, 64, 807–838. [Google Scholar] [CrossRef] [PubMed] [Green Version]
  58. Eichorst, S.A.; Trojan, D.; Roux, S.; Herbold, C.; Rattei, T.; Woebken, D. Genomic Insights into The Acidobacteria Reveal Strategies for Their Success in Terrestrial Environments. Environ. Microbiol. 2018, 20, 1041–1063. [Google Scholar] [CrossRef] [Green Version]
  59. Da, W.; Rd, B.; Jn, K. Ecological linkages between above ground and below ground biota. Science 2004, 304, 1629–1633. [Google Scholar] [CrossRef]
  60. Neina, D. The Role of Soil pH in Plant Nutrition and Soil Remediation. Appl. Environ. Soil Sci. 2019, 2019, 1–9. [Google Scholar] [CrossRef]
  61. Dai, Z.; Su, W.; Chen, H.; Barberán, A.; Zhao, H.; Yu, M.; Yu, L.; Brookes, P.C.; Schadt, C.W.; Chang, X.S.; et al. Long-term Nitrogen Fertilization Decreases Bacterial Diversity and Favors the Growth of Actinobacteria and Proteobacteria in Agro-Ecosystems Across the Globe. Glob. Change Biol. 2018, 24, 3452–3461. [Google Scholar] [CrossRef]
  62. Jiao, S.; Lu, Y. Soil pH and Temperature Regulate Assembly Processes of Abundant and Rare Bacterial Communities in Agricultural Ecosystems. Environ. Microbiol. 2020, 22, 1052–1065. [Google Scholar] [CrossRef]
  63. Lauber, C.L.; Mady, M.; Knight, R.; Fierer, N. Pyrosequencing-Based Assessment of Soil pH as A Predictor of Soil Bacterial Community Structure at The Continental Scale. Appl. Environ. Microbiol. 2009, 75, 5111–5120. [Google Scholar] [CrossRef] [PubMed] [Green Version]
  64. Foesel, B.U.; Nägele, V.; Naether, A.; Wüst, P.K.; Weinert, J.; Bonkowski, M.; Lohaus, G.; Polle, A.; Alt, F.; Oelmann, Y.; et al. Determinants of Acidobacteria Activity Inferred from The Relative Abundances of 16S RRNA Transcripts in German Grassland and Forest Soils. Environ. Microbiol. 2014, 16, 658–675. [Google Scholar] [CrossRef] [PubMed]
  65. Jones, R.T.; Robeson, M.S.; Lauber, C.L.; Hamady, M.; Knight, R.; Fierer, N. A Comprehensive Survey of Soil Acidobacterial Diversity Using Pyrosequencing and Clone Library Analyses. ISME J. 2009, 3, 442–453. [Google Scholar] [CrossRef]
  66. Fierer, N.; Bradford, M.A.; Jackson, R.B. Toward an Ecological Classification of Soil Bacteria. Ecology 2007, 88, 1354–1364. [Google Scholar] [CrossRef]
  67. Bledsoe, R.B.; Goodwillie, C.; Peralta, A.L. Long-term Nutrient Enrichment of an Oligotroph-Dominated Wetland Increases Bacterial Diversity in Bulk Soils and Plant Rhizospheres. Msphere 2020, 5, e00035-20. [Google Scholar] [CrossRef]
  68. Radajewski, S.; Duxbury, T. Motility Responses and Desiccation Survival of Zoospores from the Actinomycete Kineosporia sp. Strain SR11. Microb. Ecol. 2001, 41, 233–244. [Google Scholar] [CrossRef] [PubMed]
  69. Wang, Y.; Hu, N.; Ge, T.; Kuzyakov, Y.; Wang, Z.L.; Li, Z.; Tang, Z.; Chen, Y.; Wu, C.; Lou, Y. Soil Aggregation Regulates Distributions of Carbon, Microbial Community and Enzyme Activities after 23-Year Manure Amendment. Appl. Soil Ecol. 2017, 111, 65–72. [Google Scholar] [CrossRef]
  70. Ivanova, A.A.; Zhelezova, A.D.; Chernov, T.I.; Dedysh, S.N. Linking Ecology and Systematics of Acidobacteria: Distinct Habitat Preferences of the Acidobacteriia and Blastocatellia in Tundra Soils. PLoS ONE 2020, 15, e0230157. [Google Scholar] [CrossRef] [Green Version]
  71. Goldford, J.E.; Lu, N.; Bajic, D.; Estrela, S.; Tikhonov, M.; Sanchez-Gorostiaga, A.; Segrè, D.; Mehta, P.; Sanchez, A. Emergent Simplicity in Microbial Community Assembly. Science 2018, 361, 469–474. [Google Scholar] [CrossRef] [Green Version]
Figure 1. Weekly average minimum and maximum air temperatures and weekly rainfall during experiment: year 2020.
Agriculture 12 00668 g001
Figure 2. Sketch map of treatments. Tif.TS, Tifgreen bermudagrass with traffic treatment; Tif.NT, Tifgreen bermudagrass with non-traffic treatment; Com.TS, Common bermudagrass with traffic treatment; Com.NT, Common bermudagrass with non-traffic treatment.
Agriculture 12 00668 g002
Figure 3. Turf quality indicators under traffic stress. (a) turf density, (b) cover degree, (c) above-ground biomass, (d) under-ground biomass. Note: * p < 0.05 under diverse treatments. TS: traffic stress; NT: non-traffic stress.
Agriculture 12 00668 g003
Figure 4. Difference in bacterial community relative abundances at phylum (a) and order (b) levels. Note: Tif.TS, Tifgreen bermudagrass with traffic treatment; Tif.NT, Tifgreen bermudagrass with non-traffic treatment; Com.TS, Common bermudagrass with traffic treatment; Com.NT, Common bermudagrass with non-traffic treatment.
Agriculture 12 00668 g004
Figure 5. Alpha diversity index of soil bacterial community structure under traffic stress. (a) ACE index, (b) Chaol index, (c) Shannon index, (d) Simpson index. Note: * p < 0.05 under diverse treatments. TS: traffic stress; NT: non-traffic stress.
Agriculture 12 00668 g005
Figure 6. PCoA on structures of soil bacterial communities under traffic stress. Note: Tif.TS, Tifgreen bermudagrass with traffic treatment; Tif.NT, Tifgreen bermudagrass with non-traffic treatment; Com.TS, Common bermudagrass with traffic treatment; Com.NT, Common bermudagrass with non-traffic treatment.
Agriculture 12 00668 g006
Figure 7. LDA effect size (LEfSe) analysis on soil bacteria under traffic stress in Tifgreen Bermudagrass (a) and Common bermudagrass (b). Note: Tif.TS, Tifgreen bermudagrass with traffic treatment; Tif.NT, Tifgreen bermudagrass with non-traffic treatment; Com.TS, Common bermudagrass with traffic treatment; Com.NT, Common bermudagrass with non-traffic treatment.
Agriculture 12 00668 g007
Figure 8. RDA of bacterial communities and environmental factors (a) RDA of turf quality indicators (TD, CD, AB, UB), soil physical properties (SBD, SSH, SWC, SR) and bacterial communities. (b) The RDA of soil chemical properties (TP, AP, TN, AN, AK, SOC, pH) and bacterial communities. Tif.TS, Tifgreen bermudagrass with traffic treatment; Tif.NT, Tifgreen bermudagrass with non-traffic treatment; Com.TS, Common bermudagrass with traffic treatment; Com.NT, Common bermudagrass with non-traffic treatment.
Agriculture 12 00668 g008
Figure 9. Spearman correlation analysis of phylum (a) and order (b) levels and environmental factors. Note: * p < 0.05 under diverse treatments. ** p < 0.01 under diverse treatments.
Agriculture 12 00668 g009
Table 1. Soil physicochemical properties under traffic stress.
Soil PropertiesTif.TSTif.NTCom.TSCom.NT
SSH (g)120.67 ± 1.45 b87.67 ± 1.45 c142.33 ± 2.33 a78.67 ± 2.62 d
SBD (g/cm3)1.62 ± 0.26 a1.28 ± 0.23 b1.73 ± 0.18 a1.35 ± 0.14 b
SWC (%)55.93 ± 1.36 b66.10 ± 1.11 a50.76 ± 1.52 c67.92 ± 1.18 a
pH6.83 ± 0.17 a6.35 ± 0.21 b6.79 ± 0.14 a6.07 ± 0.12 c
TN (g·kg−1)1.50 ± 0.06 a1.53 ± 0.13 a1.48 ± 0.03 a1.57 ± 0.14 a
TP (g·kg−1)0.82 ± 0.03 b0.87 ± 0.01 a0.83 ± 0.02 b0.88 ± 0.05 a
AN (mg·kg−1)11.28 ± 0.20 b12.14 ± 0.16 a11.12 ± 0.13 b12.05 ± 0.22 a
AP (mg·kg−1)45.39 ± 0.58 b49.08 ± 0.31 a44.28 ± 0.57 b49.15 ± 0.58 a
AK (mg·kg−1)240.33 ± 0.95 b250.47 ± 1.25 a240.48 ± 1.72 b249.12 ± 0.90 a
SOC (g·kg−1)15.76 ± 0.06 b16.21 ± 0.16 a15.61 ± 0.15 b16.23 ± 0.08 a
SR (μmol·m−2·s−1)4.58 ± 0.83 c6.85 ± 0.82 a3.78 ± 0.48 d6.50 ± 0.73 b
Note: The data are expressed as mean ± SD. In each row of the above table, diverse letters suggest significant differences across diverse treatments (p < 0.05). SBD, soil bulk density; SSH, soil surface hardness; SWC, soil water content; TP, total phosphorus; TN, total nitrogen; AK, available potassium; AP, available phosphorus; AN, available nitrogen; SOC, soil organic carbon; SR, soil respiration; Tif.TS, Tifgreen bermudagrass with traffic treatment; Tif.NT, Tifgreen bermudagrass with non-traffic treatment; Com.TS, Common bermudagrass with traffic treatment; Com.NT, Common bermudagrass with non-traffic treatment.
Publisher’s Note: MDPI stays neutral with regard to jurisdictional claims in published maps and institutional affiliations.

