Article

Energy and Exergy Analysis of an Ammonia Fuel Cell Integrated System for Marine Vessels

1
Department of Marine System Engineering, Korea Maritime and Ocean University, 727 Taejong-ro, Yeongdo-gu, Busan 49112, Korea
2
System Safety Research Team, Korean Register, 36 Myeongji Ocean City 9-ro, Gangseo-gu, Busan 46762, Korea
3
Division of Coast Guard Studies, Korea Maritime and Ocean University, 727 Taejong-ro, Yeongdo-gu, Busan 49112, Korea
*
Author to whom correspondence should be addressed.
Energies 2022, 15(9), 3331; https://doi.org/10.3390/en15093331
Submission received: 15 April 2022 / Revised: 28 April 2022 / Accepted: 28 April 2022 / Published: 3 May 2022
(This article belongs to the Topic Energy Storage and Conversion Systems)

Abstract

:
In this paper, a new integrated system of solid oxide fuel cell (SOFC)–gas turbine (GT)–steam Rankine cycle (SRC)–exhaust gas boiler (EGB) is presented, in which ammonia is introduced as a promising fuel source to meet shipping decarbonization targets. For this purpose, an SOFC is presented as the main power-generation source for a specific marine propulsion plant; the GT and SRC provide auxiliary power for machinery and accommodation lighting, and steam from the waste heat boiler is used for heating seafarer accommodation. The combined system minimizes waste heat and converts it into useful work and power. Energy and exergy analyses are performed based on the first and second laws of thermodynamics. A parametric study of the effects of the variation in the SOFC current density, fuel utilization factor, superheat temperature, and SRC evaporation pressure is conducted to define the optimal operating parameters for the proposed system. In the present study, the energy and exergy efficiencies of the integrated system are 64.49% and 61.10%, respectively. These results serve as strong motivation for employing an EGB and SRC for waste heat recovery and increasing the overall energy-conversion efficiency of the system. The SRC energy and exergy efficiencies are 25.58% and 41.21%, respectively.

1. Introduction

Maritime transportation makes a significant contribution to global CO2 emissions [1]. From 2012 to 2020, CO2 emissions due to shipping activities increased from 962 million tons to 1056 million tons, which is equivalent to an increase of 2.76% to 2.89% [2]. To combat climate change and contribute to sustainable development, the International Maritime Organization (IMO) has adopted an initial strategy and related regulations to reduce CO2 emissions per transportation work (carbon intensity) by 40% by 2030, and the total yearly GHG emissions by 50% by 2050 [3]. As a result, several technical and operational measures have been implemented to improve energy efficiency and reduce CO2 emissions, including the use of alternative fuels, using renewable energy, increasing engine efficiency, implementing waste heat recovery systems, improving hull form, implementing speed reduction, and using alternative sea routes [4].
Hydrogen is a cost-effective and “clean and green” fuel option. However, its limitation is its low volumetric energy density (9.9 MJ/m3 lower heating value) compared with that of fossil fuels; hence, larger vessels are required for storage and transportation [5]. Both physical and material-based technologies have been explored for the dense storage of hydrogen.
Ammonia, with the chemical formula NH3, is a fuel with a hydrogen concentration of 17.6% by weight and has no carbon. It decomposes easily into a gas combination of 75% H2 and 25% N2, resulting in a high output of pure hydrogen with minimal carbon emissions [6]. Ammonia has emerged as an energy vector because of its ability to efficiently be stored and produced from renewable energy. It is a potential fuel for fuel cells because it is inexpensive, easy to store and carry, less combustible than other fuels, and relatively safe due to observable odor leaks [7]. With this important potential of ammonia as marine fuel, the IMO and international societies have adopted safety guidelines and operational regulations to minimize risks for ammonia utilization. In addition, fuel cells are considered possible alternatives to the aforementioned approaches, which have strong benefits over conventional combustion-based technologies [8]. Ammonia can be directly supplied and converted to electricity using technologies such as SOFCs [9] and internal combustion engines [10], or indirectly used through decomposition in polymer electrolyte membrane fuel cells (PEMFCs) [11]. In contrast to methanol, the ammonia fuel used in SOFCs undergoes thermal cracking at the anode, producing hydrogen and nitrogen; therefore, no steam is required, avoiding carbon formation. In addition, the technological infrastructure for ammonia use is well-established. As a result, there is growing interest in employing ammonia-fueled fuel cells, particularly SOFCs [6].
SOFCs are gaining more attention as a cutting-edge power-generation technology with high energy-conversion efficiency, low environmental impact, and flexibility of fuel supply [12]. Because of the high cost and poor volumetric energy density of hydrogen, portable SOFC applications seem unlikely, even though hydrogen has been widely used as a fuel for SOFCs. However, since SOFCs operate at a high temperature (approximately 600–1000 °C), their efficiency can be increased by combining them with thermodynamics cycles [13,14] to improve the energy-conversion efficiency.
Wojcik et al. [15] experimented with SOFCs using ammonia as the fuel and showed that ammonia can be directly used as fuel in a SOFC system. System performance is dependent on the current density and the catalysts used for the SOFC. The two recommended catalysts for ammonia SOFCs are nickel-and iron-based catalysts. Qianli et al. [16] tested ammonia with an SOFC cell, Ni-BCGO/BCGO/LSCO–BCGO, compared the performance results with hydrogen as the fuel, and proved the feasibility of using ammonia as a fuel for SOFCs. The decomposition of ammonia is efficient in the anode chamber, with a maximum open circuit voltage (OCV) and power density of 0.985 V and 355 mWcm−2 at 700 °C, respectively. Baniasadi and Dincer [7] designed an SOFC system for vehicular applications employing ammonia as the fuel and showed that the energy and exergy efficiencies vary from 60% to 90% and 60% to 40%, respectively, depending on the current density of the SOFC. Ammonia can achieve 100% conversion to N2 and H2 at temperatures above 873 K. The largest exergy destruction rate was found in the SOFC stack, turbine, and heat exchanger. Al-Hamed and Dincer [17] proposed an integrated ammonia SOFC and hydrogen production system for locomotive applications and showed that hydrogen can be produced during the operation of a passenger locomotive. The energy and exergy efficiencies of the system are 61.2% and 66.3%, respectively. When more hydrogen is generated, the energy and exergy efficiencies are marginally improved by 0.28% and 0.24%, respectively. Ishak et al. [18] performed a thermodynamic analysis with the SOFC–ammonia system, and stated that 100% of ammonia conversion to N2 and H2 is achieved at a temperature of 700 K and atmospheric pressure. In a comparison between SOFC-H and SOFC-O, the peak power density of SOFC–H using ammonia is 20–30% higher than that of SOFC–O using ammonia. Ishak et al. [19] presented the energy and exergy analysis for a combined system of an SOFC-GT using ammonia as fuel and found that the highest energy and exergy efficiencies obtained were 81.1% and 74.3%, respectively. The configuration and layout of the system components, among other factors, impacted the total system performance. The highest exergy destruction rate was observed in the fuel cell and heat exchanger. Siddiqui et al. [20] designed and analyzed an integrated SOFC combined cycle system with ammonia as the fuel. The proposed system produces electricity, hot and cold water, and hydrogen for multiple purposes. The overall energy and exergy efficiencies of the system are 39.1% and 38.7%, respectively. Compared with a single-generation system, the multi-generation system provides a higher exergy efficiency of 18.7%. Thus, the developed multi-generation system is more efficient than a single system. The highest exergy destruction rate is found in the organic Rankine cycle (ORC) turbine.
In the present paper, a novel plant configuration is proposed to adapt to both the energy demands of the propulsion plant of the vessel and sustainable development in an environmentally friendly manner. The main objective is to use ammonia as a direct fuel for the SOFC integrated system for marine vessels. Additionally, the integration of an SRC and EGB is introduced to use the exhaust gas from the SOFC-GT subsystem. This combination has not been investigated previously. The novelty of this system is the inclusion of a steam boiler to provide steam for the heating of lubricating oil and seafarer accommodation in the system, and the enhancement of energy efficiency and waste heat recovery. In addition, the hot water generated during the cooling process of the SRC is used in seafarer accommodation. In summary:
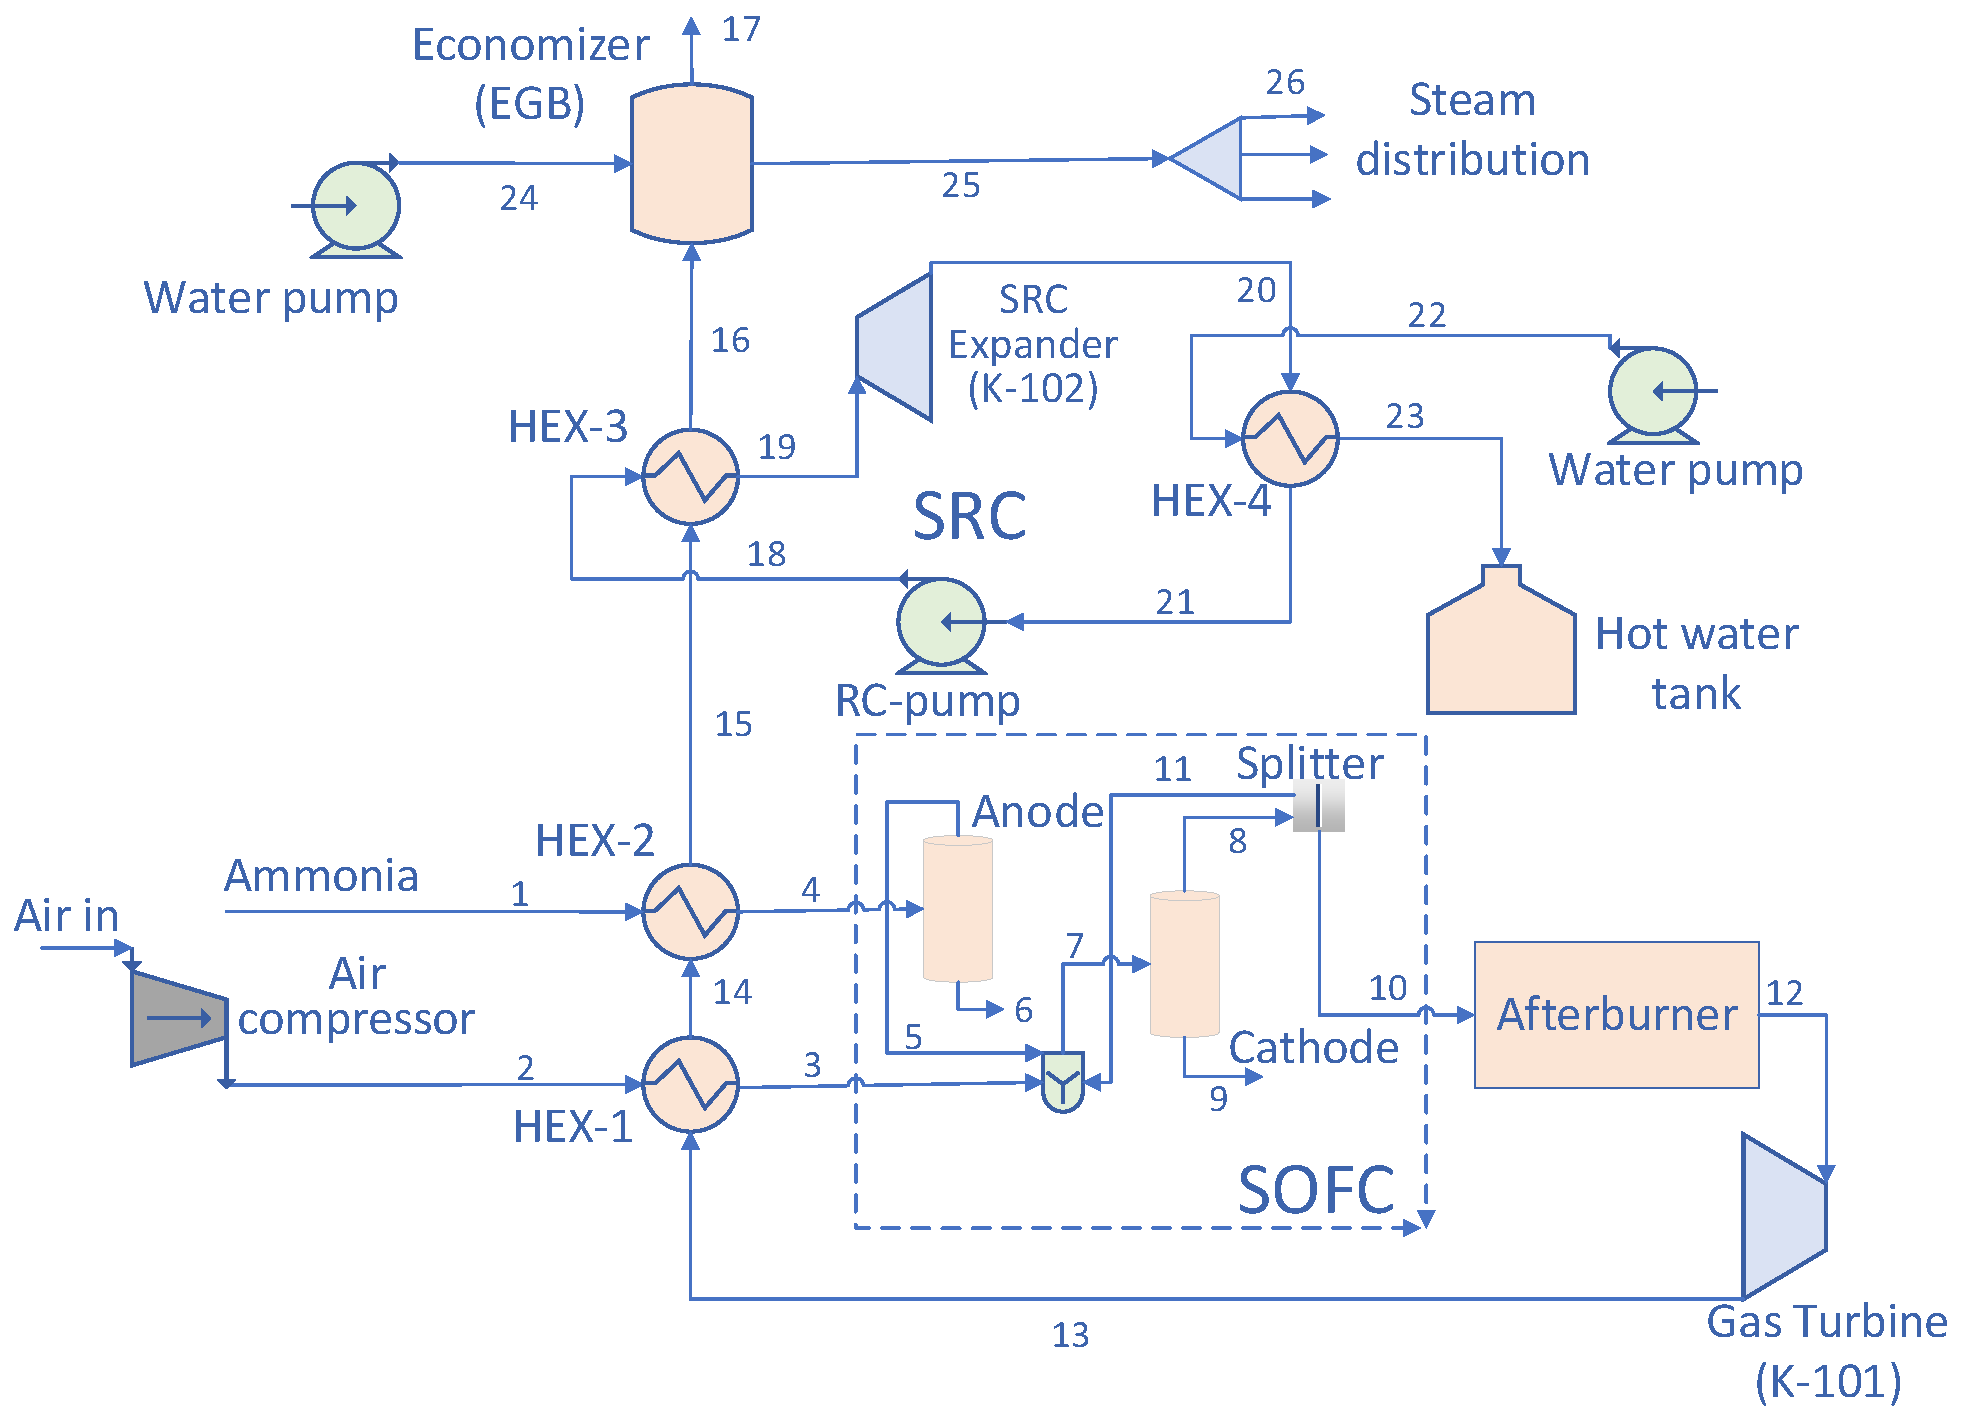
A novel integrated system with ammonia as the fuel in an SOFC for significantly improving the energy-conversion efficiency and green energy target for marine vessels is proposed. The SRC and EGB are integrated to serially recover the waste heat from the exhaust gas from the SOFC using an energy-cascade method.
A thermodynamic model of the components, sub-system, and total system is built to estimate the working performance of the proposed system.
A parametric study is carried out to investigate the impact of the main parameters on system performance.
The remainder of this paper is organized as follows. The novel integrated system and its operation are described in Section 2. The thermodynamic models developed to investigate the system energetically and exegetically are presented in Section 3. This is followed by a verification using the thermodynamic models in Section 4. The parametric study on the effect of key parameters on system performance is presented in Section 5. Lastly, the conclusions of the thermodynamic investigation are presented in Section 6.

2. Process Modelling of the Power Generation Plant for the Vessel

The proposed system is designed for an existing general cargo vessel (3000 DWT), which uses a type of electric propulsion unit (3800 kW) [21] powered by ammonia. SOFCs provide power for the main propulsion plant, while a GT and SRC supply power for the auxiliary machinery, lighting, and seafarer accommodation.
Figure 1 shows the flowsheet of the integrated SOFC-GT-SRC-EGB system for marine vessels using ammonia as fuel.

2.1. Design

The proposed multi-generation plant includes four main subsystems: (i) main power production based on SOFC technology, (ii) direct waste-heat utilization in a GT, (iii) energy harvested by the SRC, and (iv) steam generation by an EGB (economizer).
Ammonia is first preheated in the fuel regenerator (HEX-2) before being directly supplied to the SOFC anode and decomposed to H2 and N2 at high temperatures with the use of catalysts. Ni/YSZ is employed as the catalyst in this simulation study [9,13,22]. The decomposition of ammonia occurs by the dehydrogenation reactions [6], whereby (i) ammonia is absorbed by the catalyst’s active area, (ii) N-H bond cleavage occurs to release hydrogen atoms, and (iii) N and H atoms are recombined to form nitrogen and hydrogen molecules. HEX-2 is needed for the fuel cell to attain its operational temperature. The temperature range for this SOFC is 700–900 °C.
After being compressed by an air compressor to attain the required pressure (stream 2), air is preheated by waste heat from the gas turbine in the heat exchanger (HEX-1). Then, the cathode side of the fuel cells is supplied with air at the required temperature and pressure, providing oxygen for the electrochemical reaction. After reacting in fuel cells, there are two exhaust streams generated. The main exhaust stream (stream 10) is supplied to the afterburner. Otherwise, the exhaust of a nitrogen-rich stream from the cathode (stream 9) and a mixed water and nitrogen stream (stream 6) from the anode, are discharged.
The afterburner burns the remaining (unused) ammonia fuel (stream 10) from the anode and cathode to produce a high-pressure, high-temperature exhaust gas. The exhaust gas (stream 12) then powers the turbine, which generates more electricity.
The integrated waste-heat recovery system includes a gas turbine (K-101), three recuperates (HEX-1, HEX-2, and HEX-3) that recover waste heat after the afterburner (stream 12) and expansion in the gas turbine (K-101) (stream 13). The recuperates pre-heat the feed air (via HEX-1), ammonia (via HEX-2), and the SRC working fluid (via HEX-3), after which heat is transferred to the water in the EGB.
In the SRC, the heat exchanger (HEX-3) is primarily responsible for recovering waste heat. The working fluid is water, which is initially pumped to a high pressure by a pump (RC-Pump) and then passed through a heat exchanger (HEX-3) to form superheated vapor. The high-pressure steam is then expanded and depressurized in the SRC expander (K-102) before being used to drive the reversible pump (RC-pump) and generate further electric power. The saturated vapor condensed in the heat exchanger (HEX-4) is transferred to cold water, releasing heat. The resulting hot water is supplied to seafarer accommodation.
Finally, the EGB uses waste heat, transferring it to fresh water and generating steam for multiple uses, such as the heating of lubricating oil and accommodation air conditioning.
The working performance of the integrated SOFC-GT-SRC-EGB hybrid system is strongly influenced by the SOFC efficiency, exhaust heat temperature, gas turbine cycle pressure, and GT pressure ratio. The SOFC power output/efficiency impacts the exergy of the exhaust gas, and the ORC turbine inlet pressure also affects the integrated system. For an increase in the power output of the SOFC, the mass flow of exhaust gas (stream 12) and heat provided to the gas turbine cycle increases, reducing the GT fuel requirement and improving the SOFC-GT efficiency.

2.2. Operating Data Performances and Assumptions

The proposed integrated SOFC with directly supplied ammonia is simulated with support from ASPEN-HYSYS V12.1 (AspenTech, Massachusetts, USA) [23,24,25]. Ammonia is defined as the conventional component of Aspen HYSYS; therefore, the Peng–Robinson (PR) equations of state are employed to estimate the thermodynamic properties and operating parameters of all components.
To simplify models and analysis, the below general assumptions are adopted:
  • The supplied air is composed of 79% N2 and 21% O2 at 29.85 °C, 101.3 kPa;
  • This simulation is accomplished in a steady state and thermodynamic equilibrium;
  • The mass and pressure losses in all pipe components are negligible;
  • The pressure losses on the tube side and shell side of the heat exchanger (HEX) are assumed to be 6.895 and 3.447 kPa, respectively;
  • The flow temperatures of the air and fuel at the inlet and outlet of the SOFC are constant and equal to the working temperature of the SOFC.
  • The boundary conditions of the simulation study are listed in Table 1 [17,26].

3. Material and Methodology

Ammonia is unstable at high temperatures and decomposes into H2 and N2 [19], as per Equation (1), at a temperature of 200 °C or greater [27]. At 425 °C, approximately 98–99% ammonia is decomposed, and if the temperature is above 600 °C (873 K), ammonia is entirely transformed [28]. However, the conversion rate is affected by the presence of catalysts.
2 NH 3   N 2 + 3 H 2
2 H 2   4 H + + 4 e
The generated H2 is used for the electrochemical generation of energy following the first cracking of NH3 into N2 and H2 over the Ni/YSZ catalyst. Subsequently, oxide ions oxidize the hydrogen to H2O and generate electricity [28].
O 2 + 4 e + 4 H +   2 H 2 O  
O 2 + 2 H 2   2 H 2 O
Water (vapor state) and the remaining oxygen exit the fuel cell from the cathode side, while NH3, N2, and H2 exit from the anode side. SOFCs rely primarily on an oxygen ion-conducting electrolyte to allow oxygen ions to move from the cathode to the anode, resulting in the production of nitrogen oxide (NO).
N 2 + 2 O 2   2 NO   + 4 e
2 NH 3 + 5 O 2   2 NO + 3 H 2 O   + 10 e
By completely covering the YSZ electrolyte with a proton conductor and ammonia cracks, the production of NO may be avoided [15,16]. Ma et al. [29] showed that the partial pressure of NO increases with increasing of NH3 conversion rate. However, the partial pressure of NO is only 10−12 atm when the ammonia conversion rate of ammonia is 0.99 and the working temperature of SOFC is 800 °C.
Reaction Equation (1) is endothermic and is influenced by pressure and temperature, in addition to other conditions. As the temperature rises, the reaction shifts to the right, producing more hydrogen, and as the pressure rises, it shifts to the left, producing less hydrogen. The overall Gibbs energy of the process can be decreased to attain thermodynamic equilibrium with ammonia [5,18,19]:
( G s y s t e m ) T , P = 0
The sum of the product of the number of moles of chemical species i multiplied by the appropriate standard Gibbs free energy at constant temperature and pressure is the Gibbs energy of the system:
G s y s t e m = n i g ¯ i
The Gibbs energy of one mole of the substance for a gas can be expressed in terms of this activity as per the following equation:
g ¯ i = g ¯ f i 0 + R T   l n f i f i 0
The total Gibbs energy is equal to:
G s y s t e m = ( n i [ g ¯ f i 0 + R T ln y i P ] ) g a s + ( n i g ¯ f i 0 ) c o n d e n s e d

3.1. Model of the SOFC

SOFCs [30] transform the chemical energy of the fuel into electrical power through electrochemical reactions at high temperatures (from 500 °C to 1100 °C). In the SOFC, ammonia participates in the reforming reaction according to Equation (1) under YSZ electrolytes [31].

3.1.1. Fuel and Oxidant Utilization

The utilization of fuel (ammonia) can be defined as follows [13,19,21,32,33]
U f = ( a m m o n i a ) r e a c t ( a m m o n i a ) i n = ( H 2 ) r e a c t ( H 2 ) i n
where ( H 2 ) r e a c t   and ( H 2 ) i n denote the molar flow of the reacting hydrogen and the molar flow of hydrogen supplied to the fuel cells, respectively.
Similarly, the air utilization can be determined as the ratio of oxygen supply and usage because air is assumed to consist of a constant ratio of 21% oxygen and 79% nitrogen:
U a i r = ( A i r ) c o n s u m e d   ( A i r ) i n = ( O 2 ) c o n s u m e d ( O 2 ) i n  
A i r i n represents molar flow of inlet air.
With reference to Equation (4):
n O 2 = 0.5   U f n H 2    
n O 2   and n H 2 represent the molar flow rate of oxygen and hydrogen required for the fuel cells, respectively.
The net power output of an SOFC system can be determined using the component stack, as follows [34,35,36]:
W s t a c k = i · a · V c
where i   and V c represent the current density (A/m2) and the actual voltage of the stack (V), respectively, and a is the surface area (m2) [26,30,35,37,38]
i = n F U f q N H 3 N c e l l A c e l l
q N H 3 = i   N c e l l A c e l l U f n F
where n denotes the number of electrons transported by every oxygen atom of the electrochemical reaction (in this case, its value is 3); F denotes the Faraday constant, 96,485 C/mol; q N H 3 is the ammonia molar flow rate, mol/s; and N c e l l and A c e l l represent the number of cells and cell area (m2), respectively.
V c = V R V l o s s
V R is defined as the cell’s ideal reversible voltage and V l o s s is the voltage loss in the system. Based on the Nernst equation:
V R = V o + R u T n e F ln P H 2 P O 2 1 2 P H 2 O
V l o s s = V o h m + V a c t + V c o n
where V o h m denotes the ohmic losses (V), V a c t denotes the activation losses (V), V c o n denotes the concentration losses (V), and V o denotes the electro-motoric force.
V o h m = V o h m , a + V o h m , c + V o h m , e + V o h m , i n t
Furthermore, the I-V curve can be used to determine the actual voltage of the stack [17,29,32,39,40,41]
The generated power of the SOFC:
W S O F C = W s t a c k N c e l l · η D A
η D A  is the inverter efficiency.
Thermodynamically, the energy efficiency of the fuel cell [26,35,42,43,44]:
η e n , S O F C = W ˙ S O F C     m ˙ N H 3 L H V N H 3
where m ˙ N H 3 and L H V N H 3 represent the mass flow rate of NH3 (kg/h) and the low heating value of N H 3 (KJ/kg), respectively.

3.1.2. Afterburner

The unreacted hydrogen and ammonia in the SOFC are combusted in the afterburner. A strong exothermic oxidation reaction occurs, increasing the temperature and pressure of the exhaust gas. The reactants are assumed to burn completely adiabatically [45].

3.2. Model of the GT

GT

The hot gaseous mixture expands and produces useful mechanical power as it exits the combustion chamber and enters the gas turbine. The outlet temperature of the gas turbine is
T o u t = T i n   ( P R ) k 1 k
where PR = P in P out and k = i y i     C ¯ ˙ p , i i y i C ¯ v , i
The isentropic efficiency can be calculated as
η s , T = i ( n ˙ i h ¯ i ) i n     i ( n ˙ i h ¯ i ) o u t       i ( n ˙ i h ¯ i ) i n     i ( n ˙ i h ¯ i ) s ,   o u t      
For the SOFC-GT subsystem:
Energy efficiency can be determined as:
η e n , S O F C , G T = W ˙ S O F C + W ˙ G T W ˙ A i r   c o m p   m ˙ N H 3 L H V N H 3
Exergy efficiency can be determined as:
η e x , S O F C , G T = W ˙ S O F C + W ˙ G T W ˙ A i r   c o m p m ˙ N H 3 e x 1
Heat exchangers:
The following formulae are used to compute the hot (exhaust gas) and cold (fuel or air supply) streams through the heat exchanger:
Q ˙ = i ( n ˙ i c ¯ p , i ) h   ( T h ( c ) , i n T h ( c ) , o u t )

3.3. Model of the SRC

The equation for the energy balance of the SRC turbines is (the subscript numbers in the equation represent the stream in the flow diagram):
m ˙ w f , S R C h 20 = W ˙ S R C , T + m ˙ w f , S R C h 19
The waste heat absorbed by HEX-3 of the SRC:
Q ˙ H E X 3 = m ˙ w f , S R C ( h 19 h 18 ) = m ˙ e x h g a s ( h 15 h 16 )
The net power output of the SRC:
W ˙ n e t , S R C = W ˙ S R C , T u r b i n e   W ˙ P R C P u m p
The energy and exergy efficiency of the SRC:
η e n , S R C = W ˙ n e t , S R C m ˙ 15   ( h 15 h 16 )
η e x , S R C = W ˙ n e t , S R C m ˙ 15   ( e x 15 e x 16 )

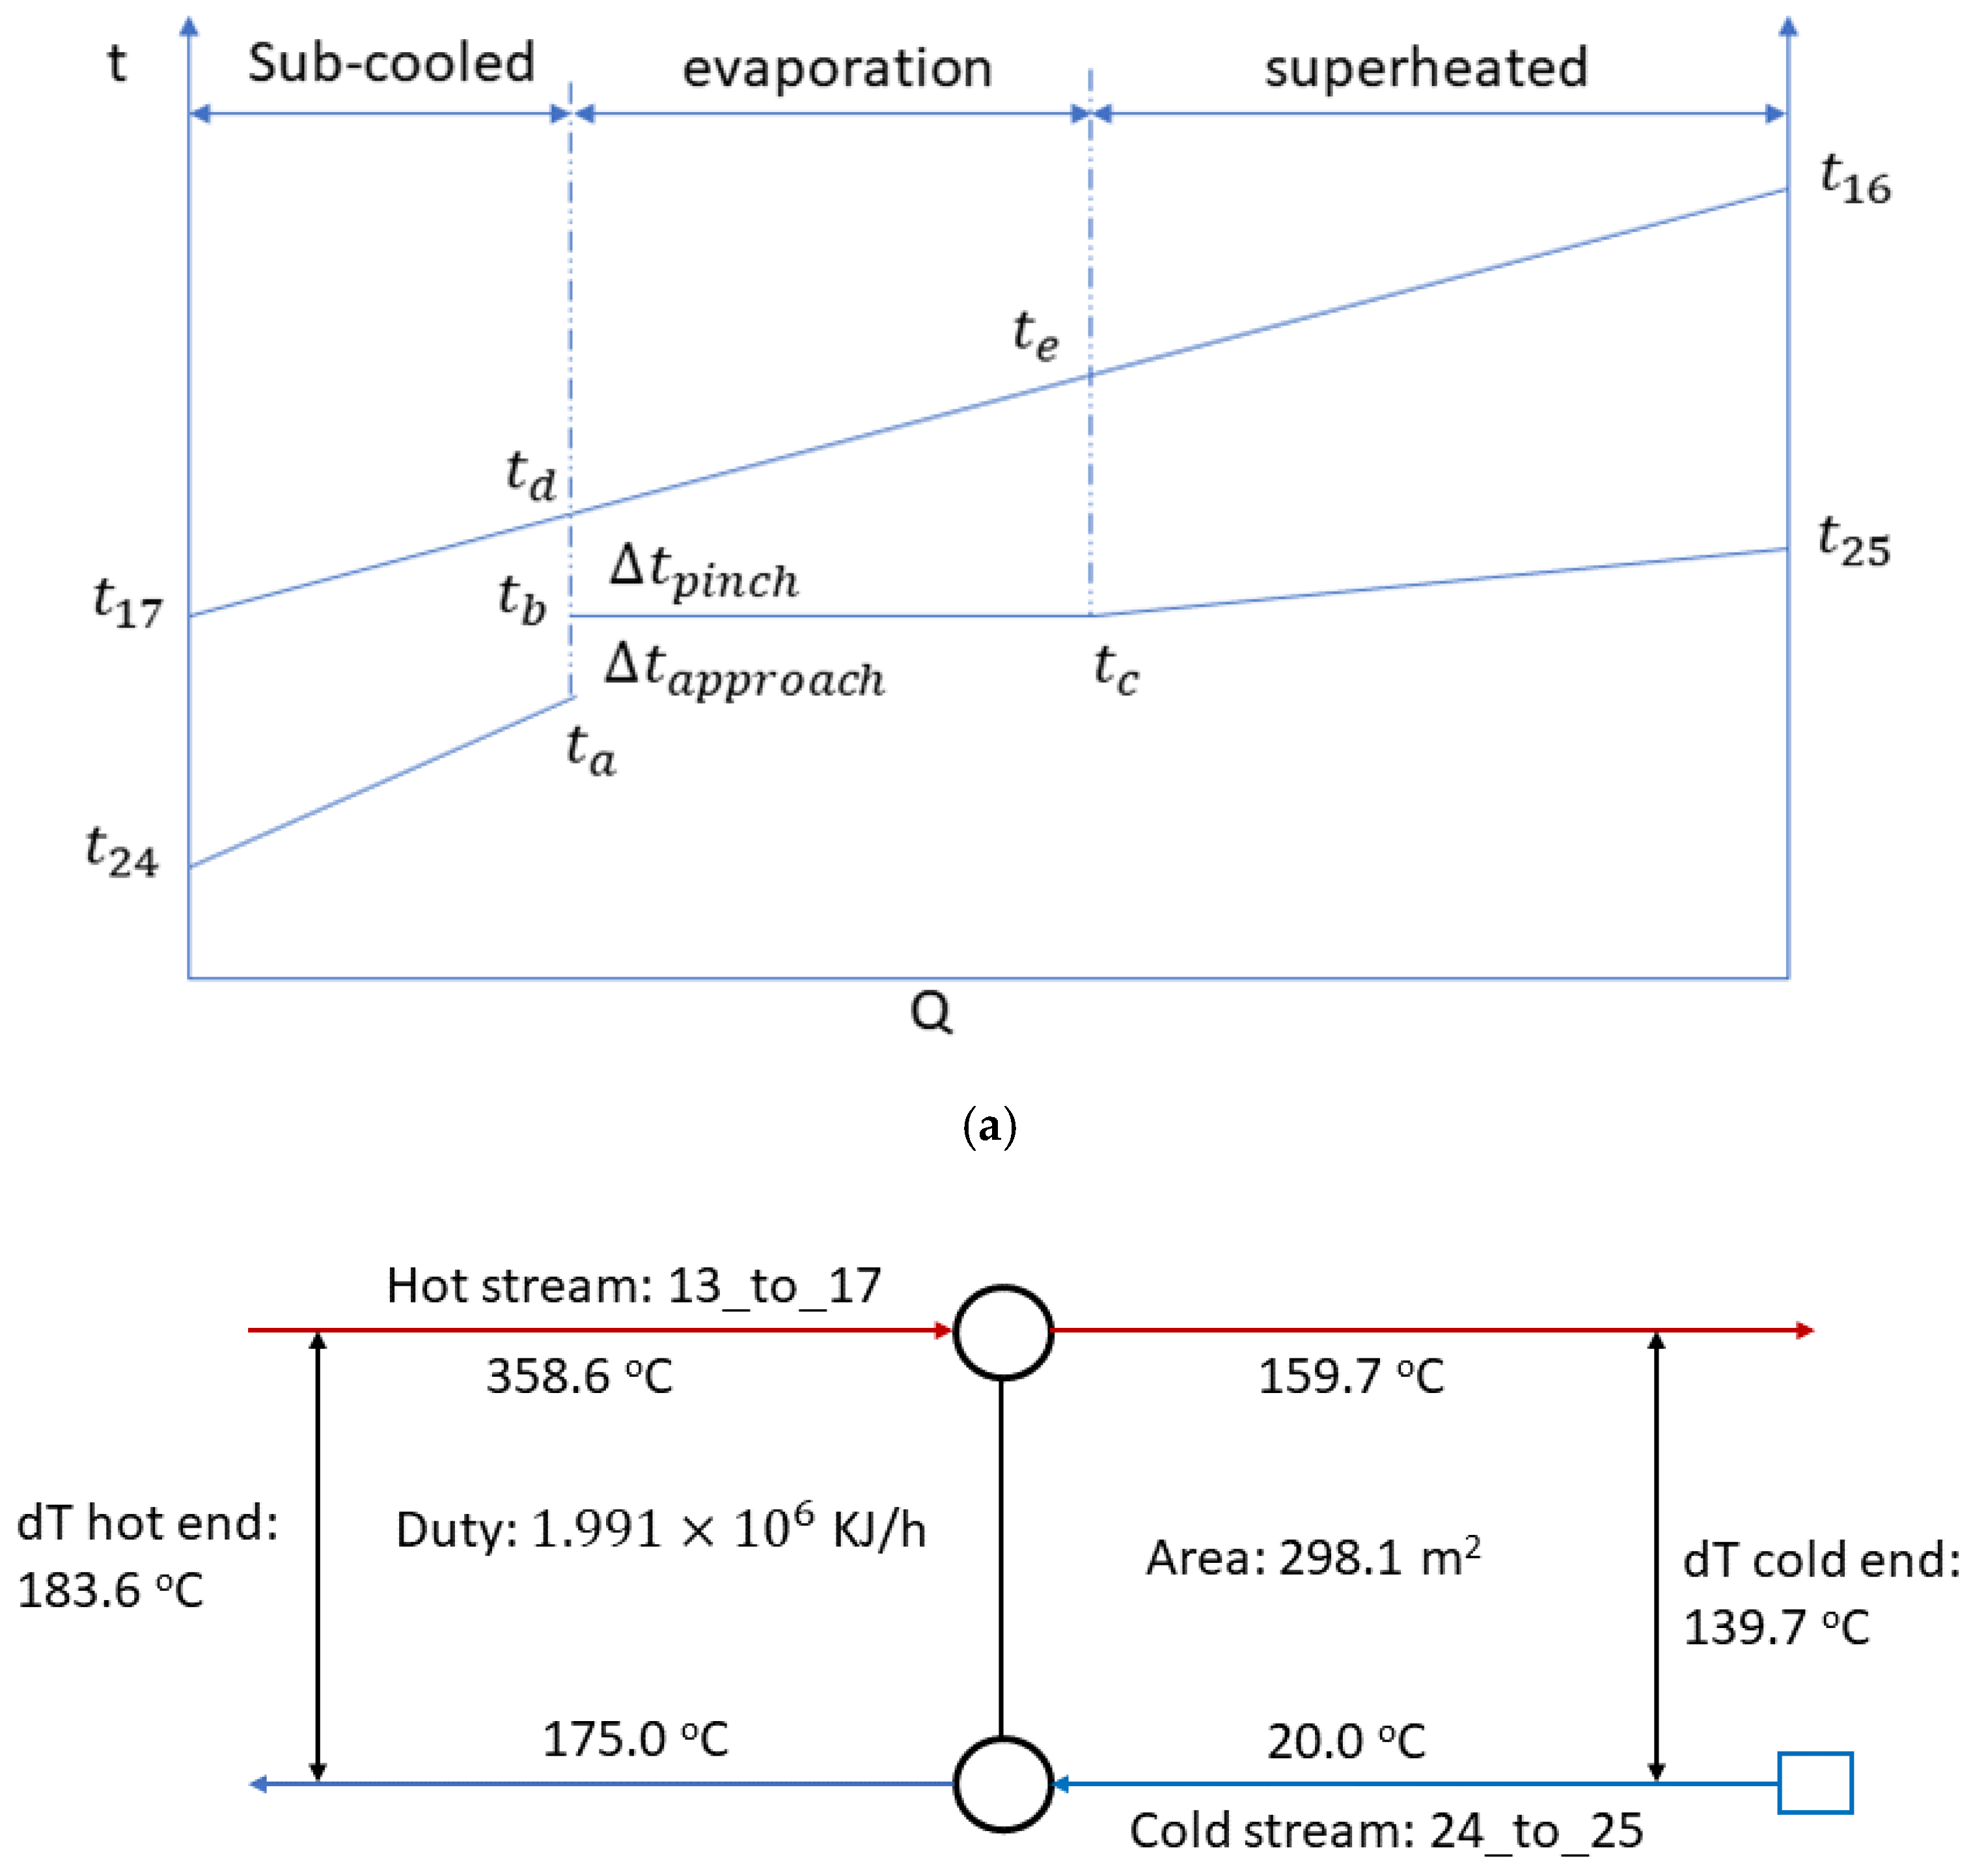
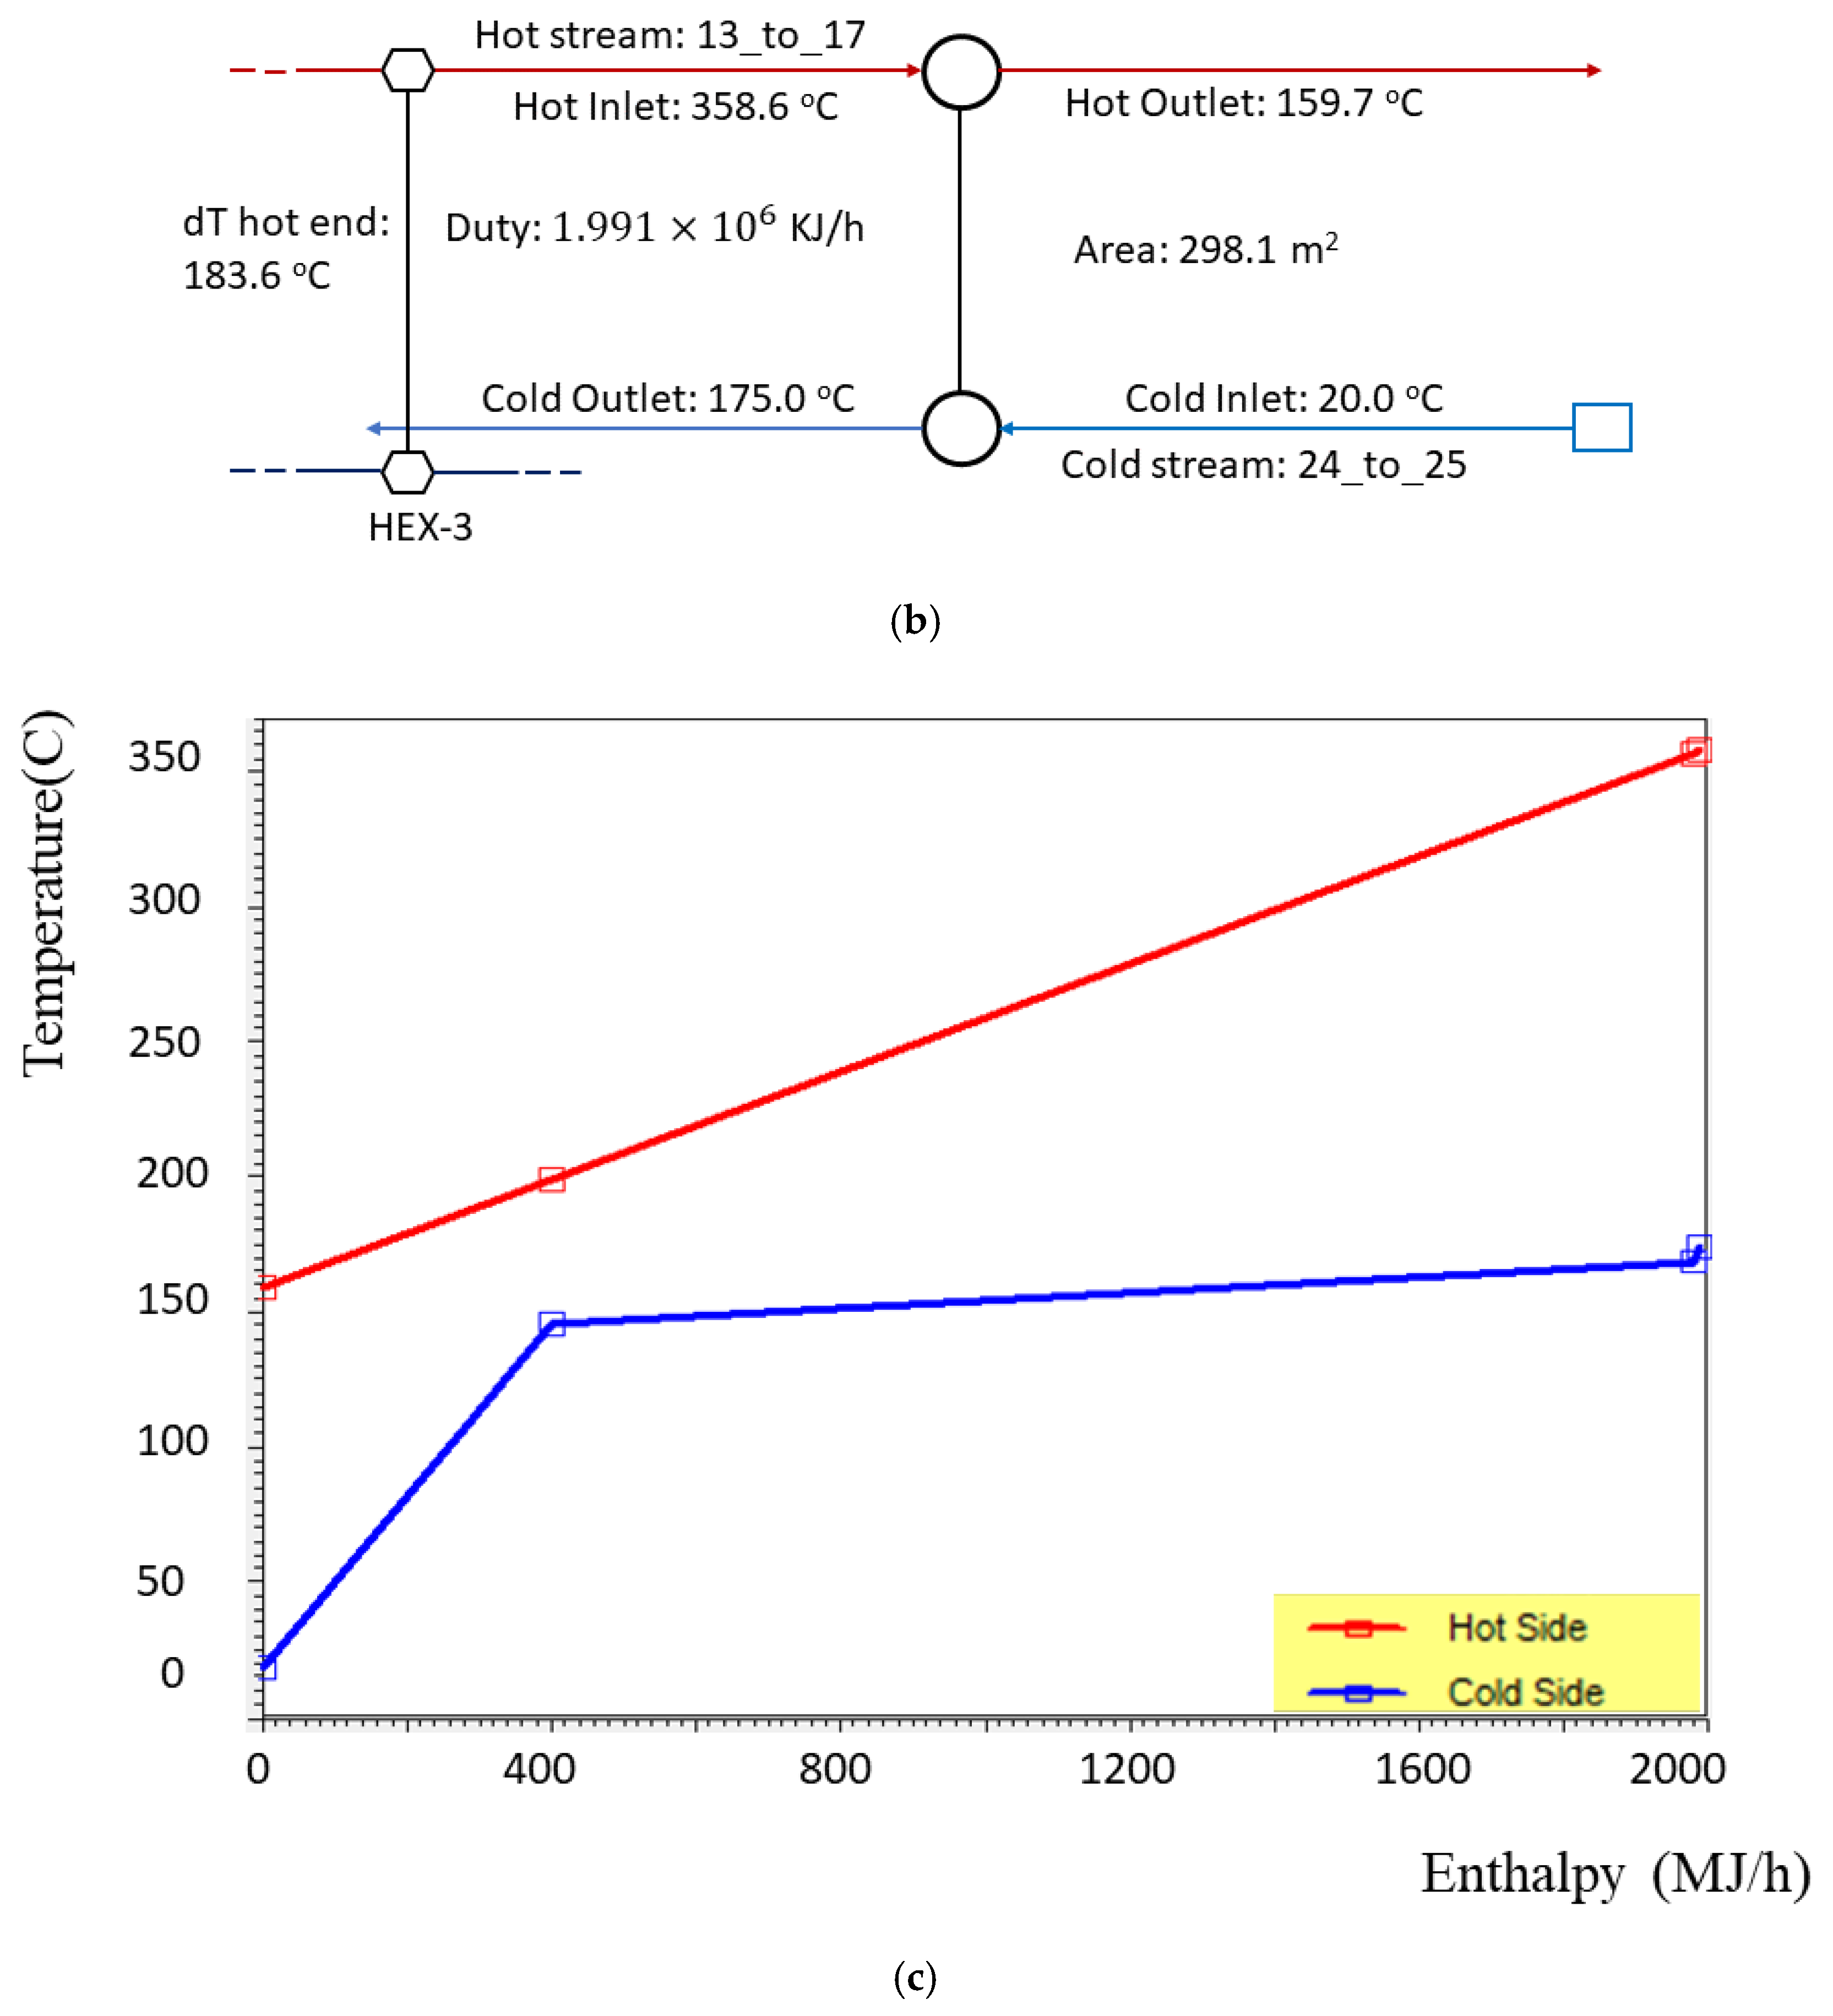
3.4. Model of the EGB

In this system, the EGB serves as a heat exchanger, and heat is transferred between the water and flue gas inside and outside the tube, resulting in the generation of steam in the boiler drum. The flue gas flow rate is 321 kgmole/h, at 359.4 °C. At the calculated steam production rate corresponding to the heat exchange facilitated in the boiler, steam is produced at 175 °C, 781.1 kPa, and 725 kg/h.
In this study, the EGB is divided into three working areas, as shown in Figure 2: a single-phase subcooled area, a two-phase evaporation area, and a single-phase superheated area. The heat balance equations between the hot and cold sides of each area are:
Superheated area:
m ˙ 16 ( h 16 h e ) = m ˙ 24 ( h 25 h c )
Evaporation area:
m ˙ 16 ( h e h d ) = m ˙ 24 ( h c h a )
Sub-cooled area:
m ˙ 16 ( h d h 17 ) = m ˙ 24 ( h a h 24 )
The total heat transfer by the waste heat boiler [46] can be calculated as:
Q = U · A · L M T D
where LMTD represents the log mean temperature difference, U is the heat exchange coefficient fixed at 30 Wm−2K−1, and A is the heat exchange area (m2).
L M T D = T 2 , e n d T 1 , e n d ln T 2 , e n d T 1 , e n d  
where T 2 , e n d and T 1 , e n d are the temperature differences between the hot and cold streams at the two ends of the heat exchanger, respectively.

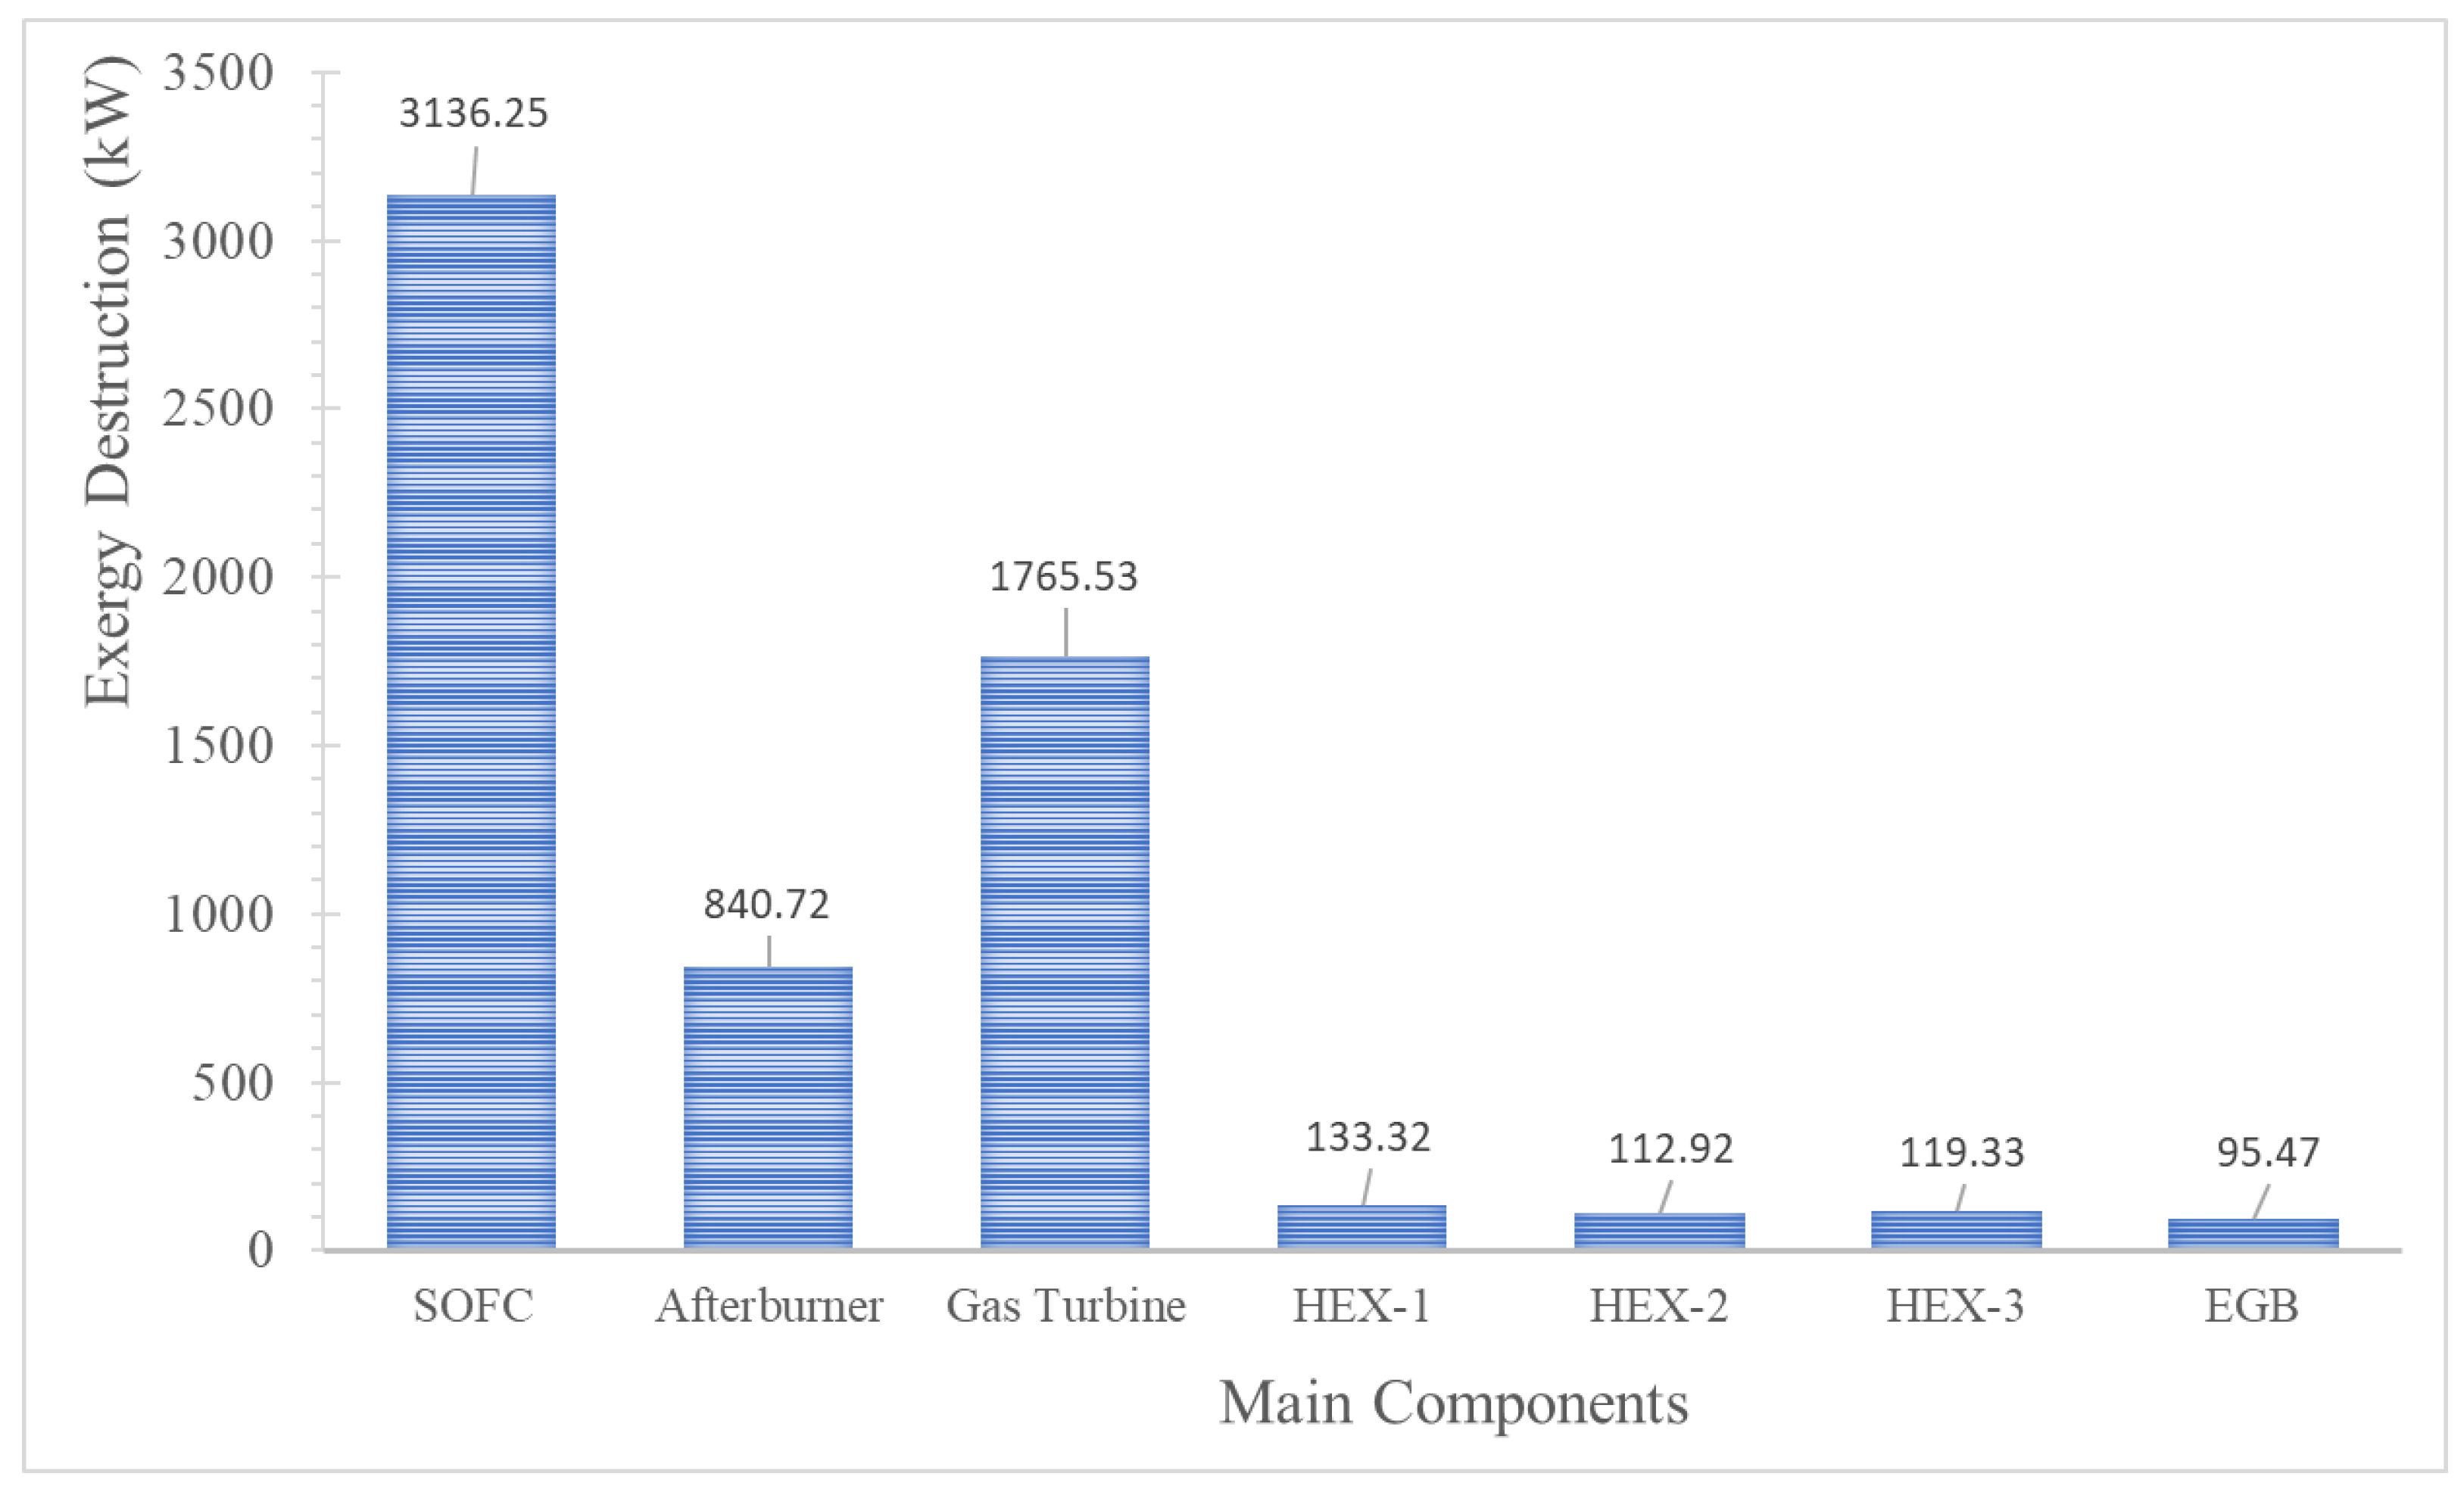
3.5. Exergy Efficiency of the Main Components

In the system, the exergy represents the maximum working capacity dissipated in the process. The exergy efficiencies of the main components of the system calculations are based on the second law of thermodynamics. Table 2 demonstrates the equilibrium relationship of the exergy destruction of the main components [38,47,48,49,50].
The overall energy and exergy efficiencies for the entire integrated system are written as [17,19,51]:
Energy balance equation at steady state:
Q ˙ W ˙ + i n m ˙ i n h i n + V i n 2 2 + g Z i n o u t m ˙ o u t h o u t + V o u t 2 2 + g Z o u t = 0
η e n , o v e r a l l = W ˙ e l e c , o v e r a l l   m ˙ N H 3   L H V N H 3
where W ˙ e l e c , o v e r a l l represents the net value of power production and consumption of the system:
W ˙ e l e c , o v e r a l l = W ˙ e l e c , S O F C + W ˙ G T + W ˙ S R C ,   t u r b i n e W ˙ A i r   c o m p W ˙ S R C ,   p u m p
L H V N H 3   is the lower heating value of ammonia (kJ/kg).
According to the second law of thermodynamics, the physical, chemical, potential, and kinetic exergy all contribute to the total exergy value. In this analysis, the potential and kinetic exergy are negligible.
e x j = e x j p h + e x j c h = h j h 0 T 0 s j s 0 + k x k   ( e x j c h R T 0 x k ln x k )
η e x , o v e r a l l = W ˙ e l e c , o v e r a l l m ˙ N H 3   e x N H 3

4. Model Verification

The values calculated using the integrated model employing ammonia as fuel and the corresponding values listed in the literature are shown in Table 3. The estimated values agree well with the data in the literature, and the discrepancy between the current data and the literature is within an acceptable range.
The proposed system ideally simultaneously supplies power for the propulsion plant and auxiliary equipment and hot water for seafarer accommodation.
Verification of the GT-SRC subsystem is necessary, as it is responsible for 26.87% of the integrated system’s total power production. Chitgar et al. [36] used a multi-generation SOFC-GT system providing a total power generation of 4910.4 kW (1.8% difference), with energy and exergy efficiencies of 64.3% and 49.0%, respectively. The present model improves upon that energy efficiency by 0.19% and the exergy efficiency by 12.1%, demonstrating that the proposed model produces reasonable results.

5. Results and Discussion

Table 4 lists the thermodynamic parameters and state points of each node of the proposed integrated power system. The minimization of Equation (10) was performed using the optimization function in Aspen HYSYS V12.1.
The performance of the main components of the system are listed in Table 5. The results demonstrate an increase in the overall electrical efficiency of the proposed system to approximately 64.49% due to the recovery of the SOFC-GT exhaust gas via the SRC. Further improvements can be achieved via parameter optimization.

5.1. Energy and Exergy Efficiency of System

The target vessel requires 3800 kW of electric power for the main propulsion system, and additional power to run auxiliary machines, lighting, and seafarer accommodation requirements. The fuel cell should be operated at the best possible fuel utilization factor, while maintaining an acceptable reactant concentration and fuel cell efficiency. For a utilization factor of 0.85, the SOFC energy efficiency is 53.9%. With reference to the thermodynamic models built in Section 3, the total output power of the integrated system is 4820.6 kW, which is sufficient to drive the vessel and its auxiliary systems. The 1020.6 kW surplus over the power demand of the ship results almost exclusively from the waste heat recovery components, accounting for 21.17% of the total electrical output, which demonstrates that the subsystem was necessary for the running of auxiliary systems. The overall energy and exergy efficiencies of the proposed system are 64.49% and 61.10%, respectively. The energy and exergy efficiencies of the entire system and each subsystem are listed in Table 6.
Figure 3 displays the exergy destruction of the key components of the proposed system as a result of the thermal processes within them. It is apparent that the system with the largest exergy destruction is the SOFC, with a value of 3136.25 kW, equivalent to 50.56% of the entire integrated system. The presence of electrochemical and chemical processes in this component are the primary sources of irreversibility.
The second largest sources of exergy destruction are the gas turbine and afterburner, at 28.46% and 13.55% of the whole system, respectively. The gas turbine has a comparatively high rate of exergy destruction, implying that there is a significant margin for development. The smallest exergies belong to the regenerators, HEX-1, HEX-2, and HEX-3, with values of 133.32 kW, 112.92 kW, and 119.33 kW, equivalent to 2.15%, 1.82%, 1.92% and 1.54% of the entire system, respectively. The phase transition process is the source of most of the thermal irreversibility, including internal and external irreversibility. The EGB had the lowest exergy destruction value of 95.47 kW due to the lower temperature of the flue gas provided to the boiler.

5.2. Influence of the Key Parameters on the System’s Performance

A parametric investigation based on the first and second laws of thermodynamics was conducted to estimate the overall performance of the combined system.
Several variables affect the performance of the integrated SOFC-GT-SRC system. However, the main objective of the current study is to estimate the waste-heat recovery of the SOFC-GT system employing SRC and EGB to provide electric power to the propulsion plants of target vessels and other auxiliary electric equipment. Secondary system outputs include steam and hot water for machinery requirements and seafarer accommodation.
The parametric study examined how modifying the current density, fuel utilization factor, and turbine inlet temperature and pressure of the SRC affected the energy and exergy efficiency of the overall system.

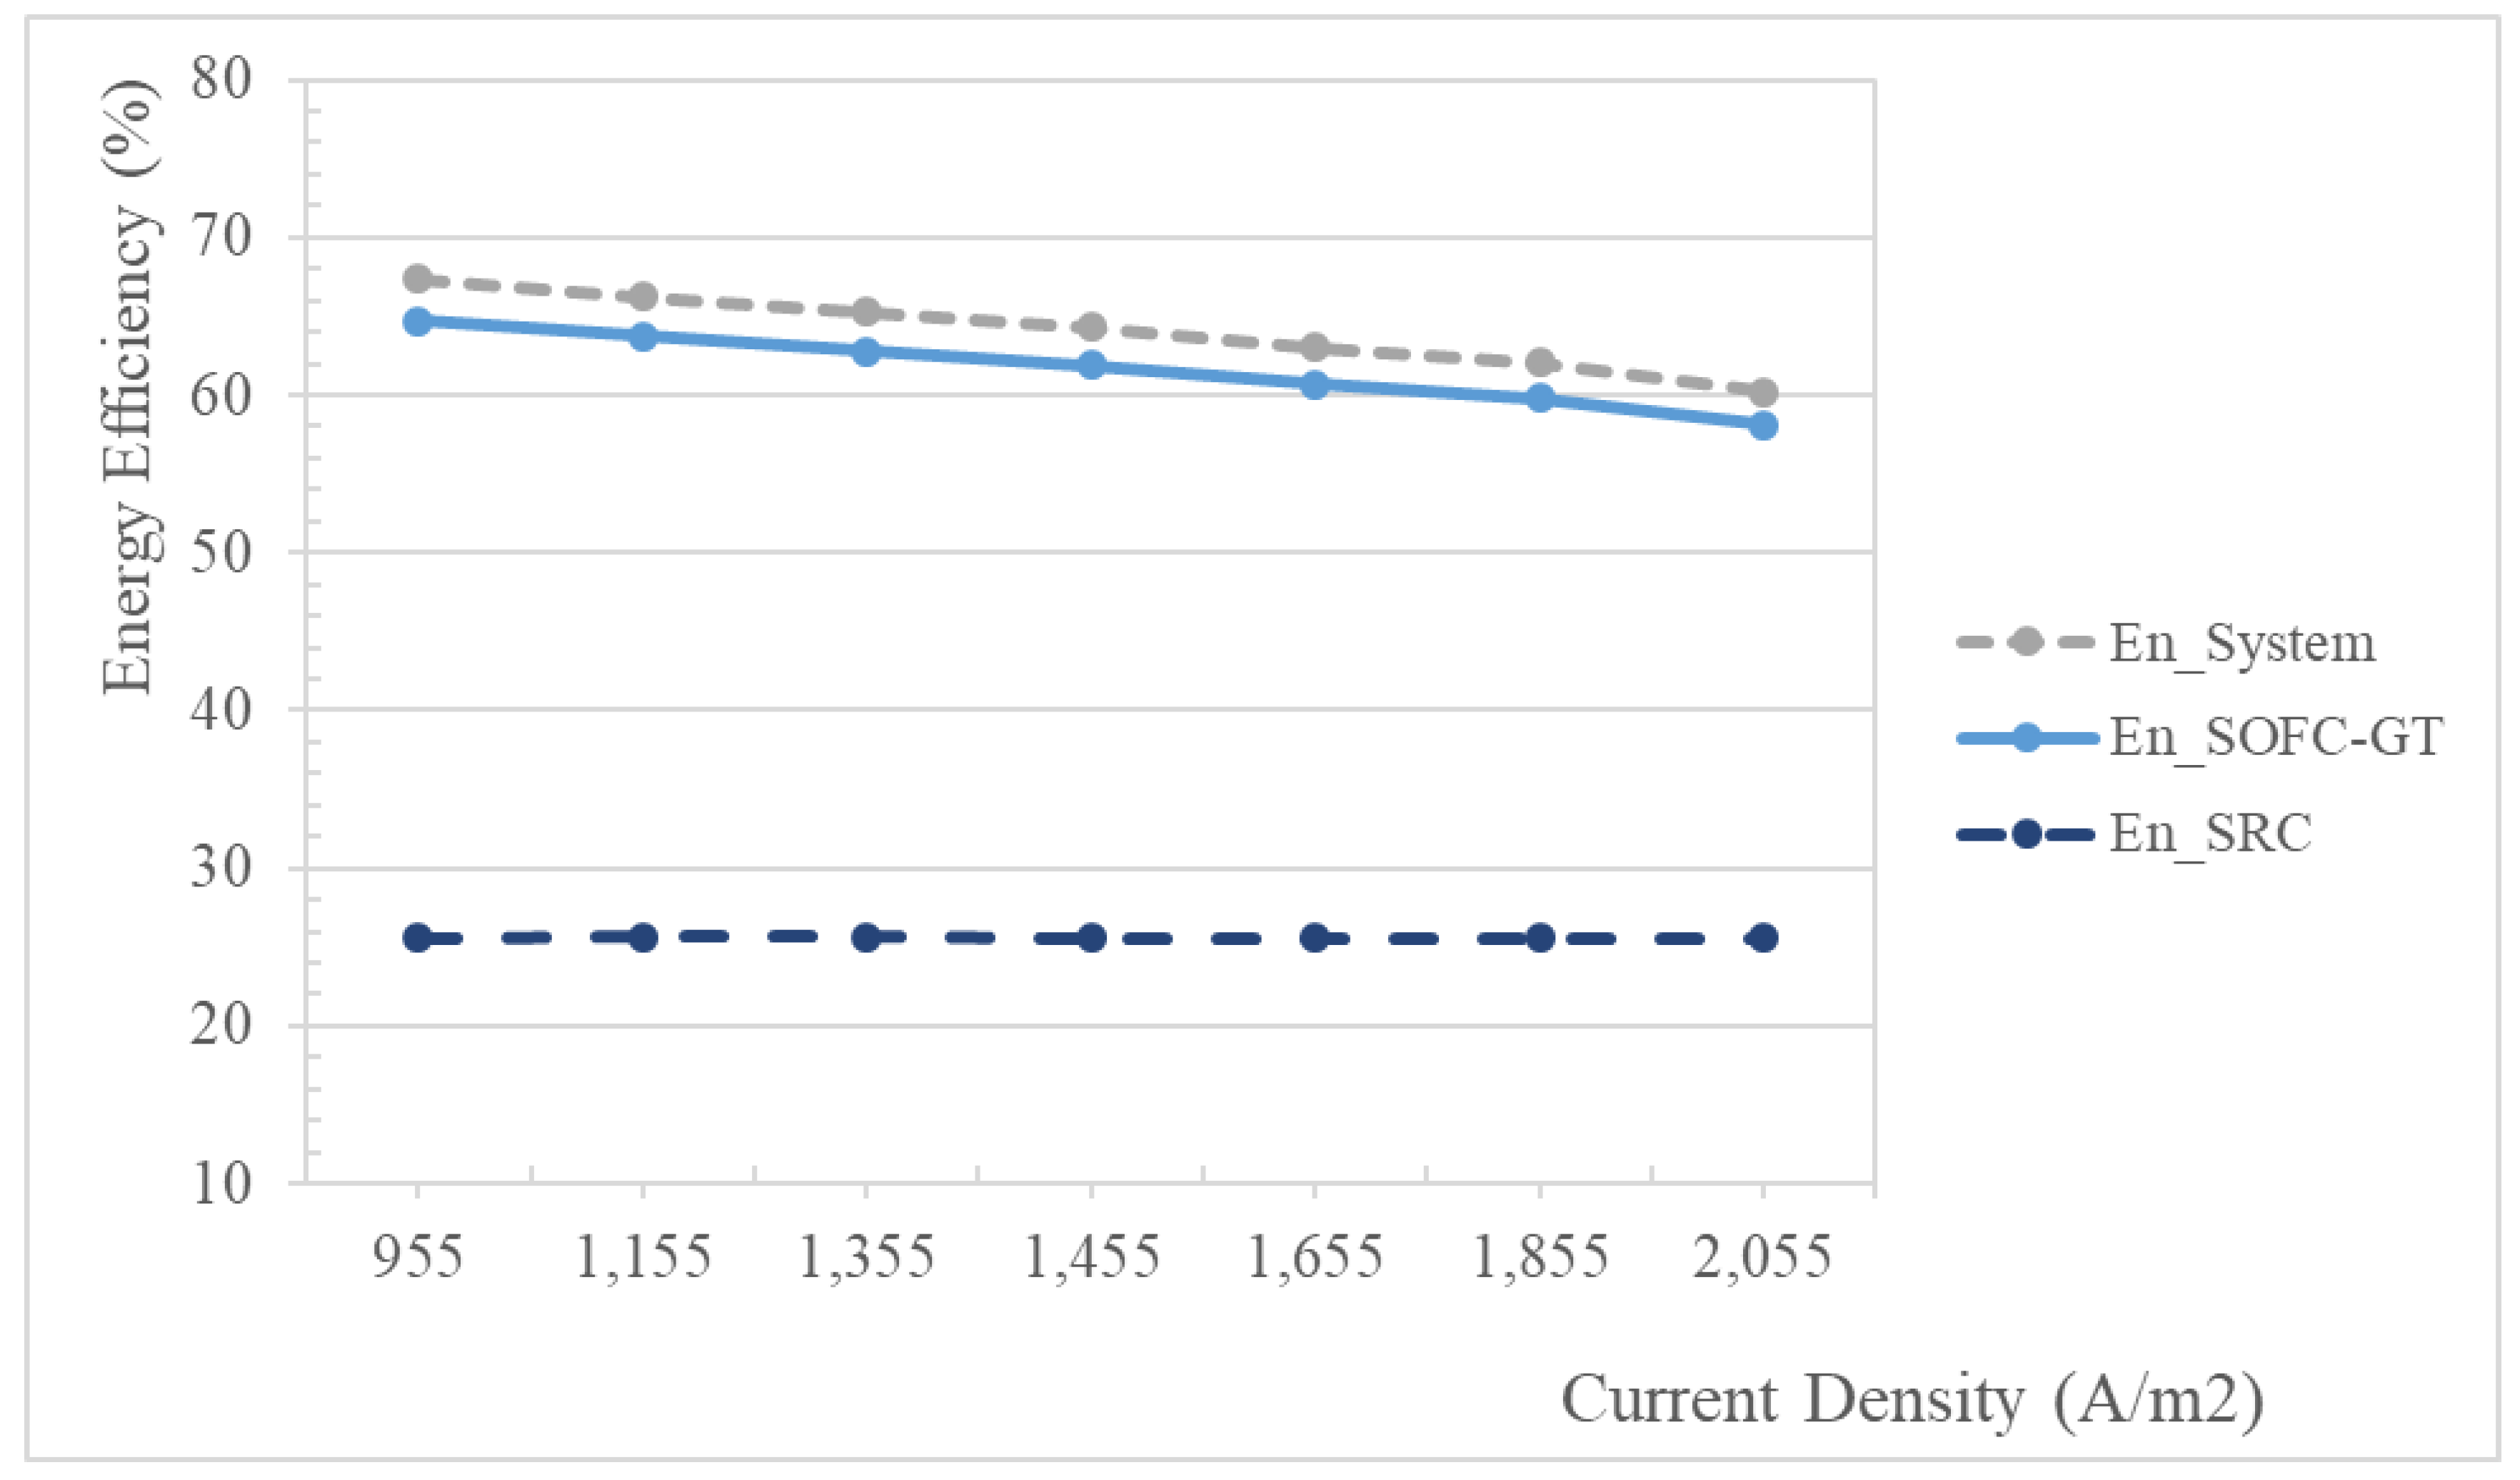
5.2.1. Effect of Current Density

Current density is one of the key performance measures for the fuel cells and the entire system. Figure 4 demonstrates the effect of the current density on the energy efficiency of the system and other essential components. The current densities range from 955 A/m2 to 2055 A/m2. The cell operating pressure is 4 bar and the operating temperature is 800.8 °C. It can be seen that the efficiency of the SOFC-GT subsystem and the entire system decreases with increasing current density, whereas the energy efficiency of the SRC is independent of current density.
The highest net electrical cycle efficiency is 67.33% at 955 A/m2, and the lowest is 60.24% at 2055 A/m2. The energy efficiency of the SOFC-GT system decreases with an increase in current density. Increased current density necessitates an increase in air flow to provide more oxygen ions. Furthermore, decreased efficiency results in an increase in unconverted chemical energy, which is converted into heat; thus, heat dissipation at the air inlet must increase to maintain the operating temperature of the cells. Low-current-density operation results in greater efficiency. Additional capital (more cells) is required during low-current-density operation to generate the same amount of power as that generated during high-current-density operation.
To maintain the power output of the system at predetermined levels, the mass flow rate was increased from 1247 kg/h to 1526 kg/h, and the current density was decreased from 2055 A/m2 to 955 A/m2. For a constant power scenario, it can be seen that lower current density requires more fuel for the SOFC. With reference to Equation (14), increasing current density also results in a decrease in cell voltage. As the current density increases, the Nernst potential and voltage losses decrease. Increases in the energy and exergy efficiency with a lowering in the current density were also reported in the literature [53] due to a large reduction in voltage losses. Based on these opposing requirements, an optimal value of current density was selected to maximize cell voltage. This maximum cell voltage was determined to be 0.85 V, corresponding to a current density of 1455 A/m2.
The effect of the current density on the exergy efficiency is shown in Figure 5. With increasing current density, the net electrical exergy efficiency decreases, owing to a decrease in cell voltage, and as a result, a decrease in power production from the SOFC. In contrast, the exergy efficiency of the SRC tends to increase with increasing current density. This is because an increase in the flue gas temperature and mass exergy corresponds with an increase in the mass flow rate.
For the range of current densities investigated, the net electrical exergy efficiency of the entire system and SOFC-GT subsystem decreases with increasing current density from 63.79% to 57.8% and 61.32% to 55.05%, respectively.

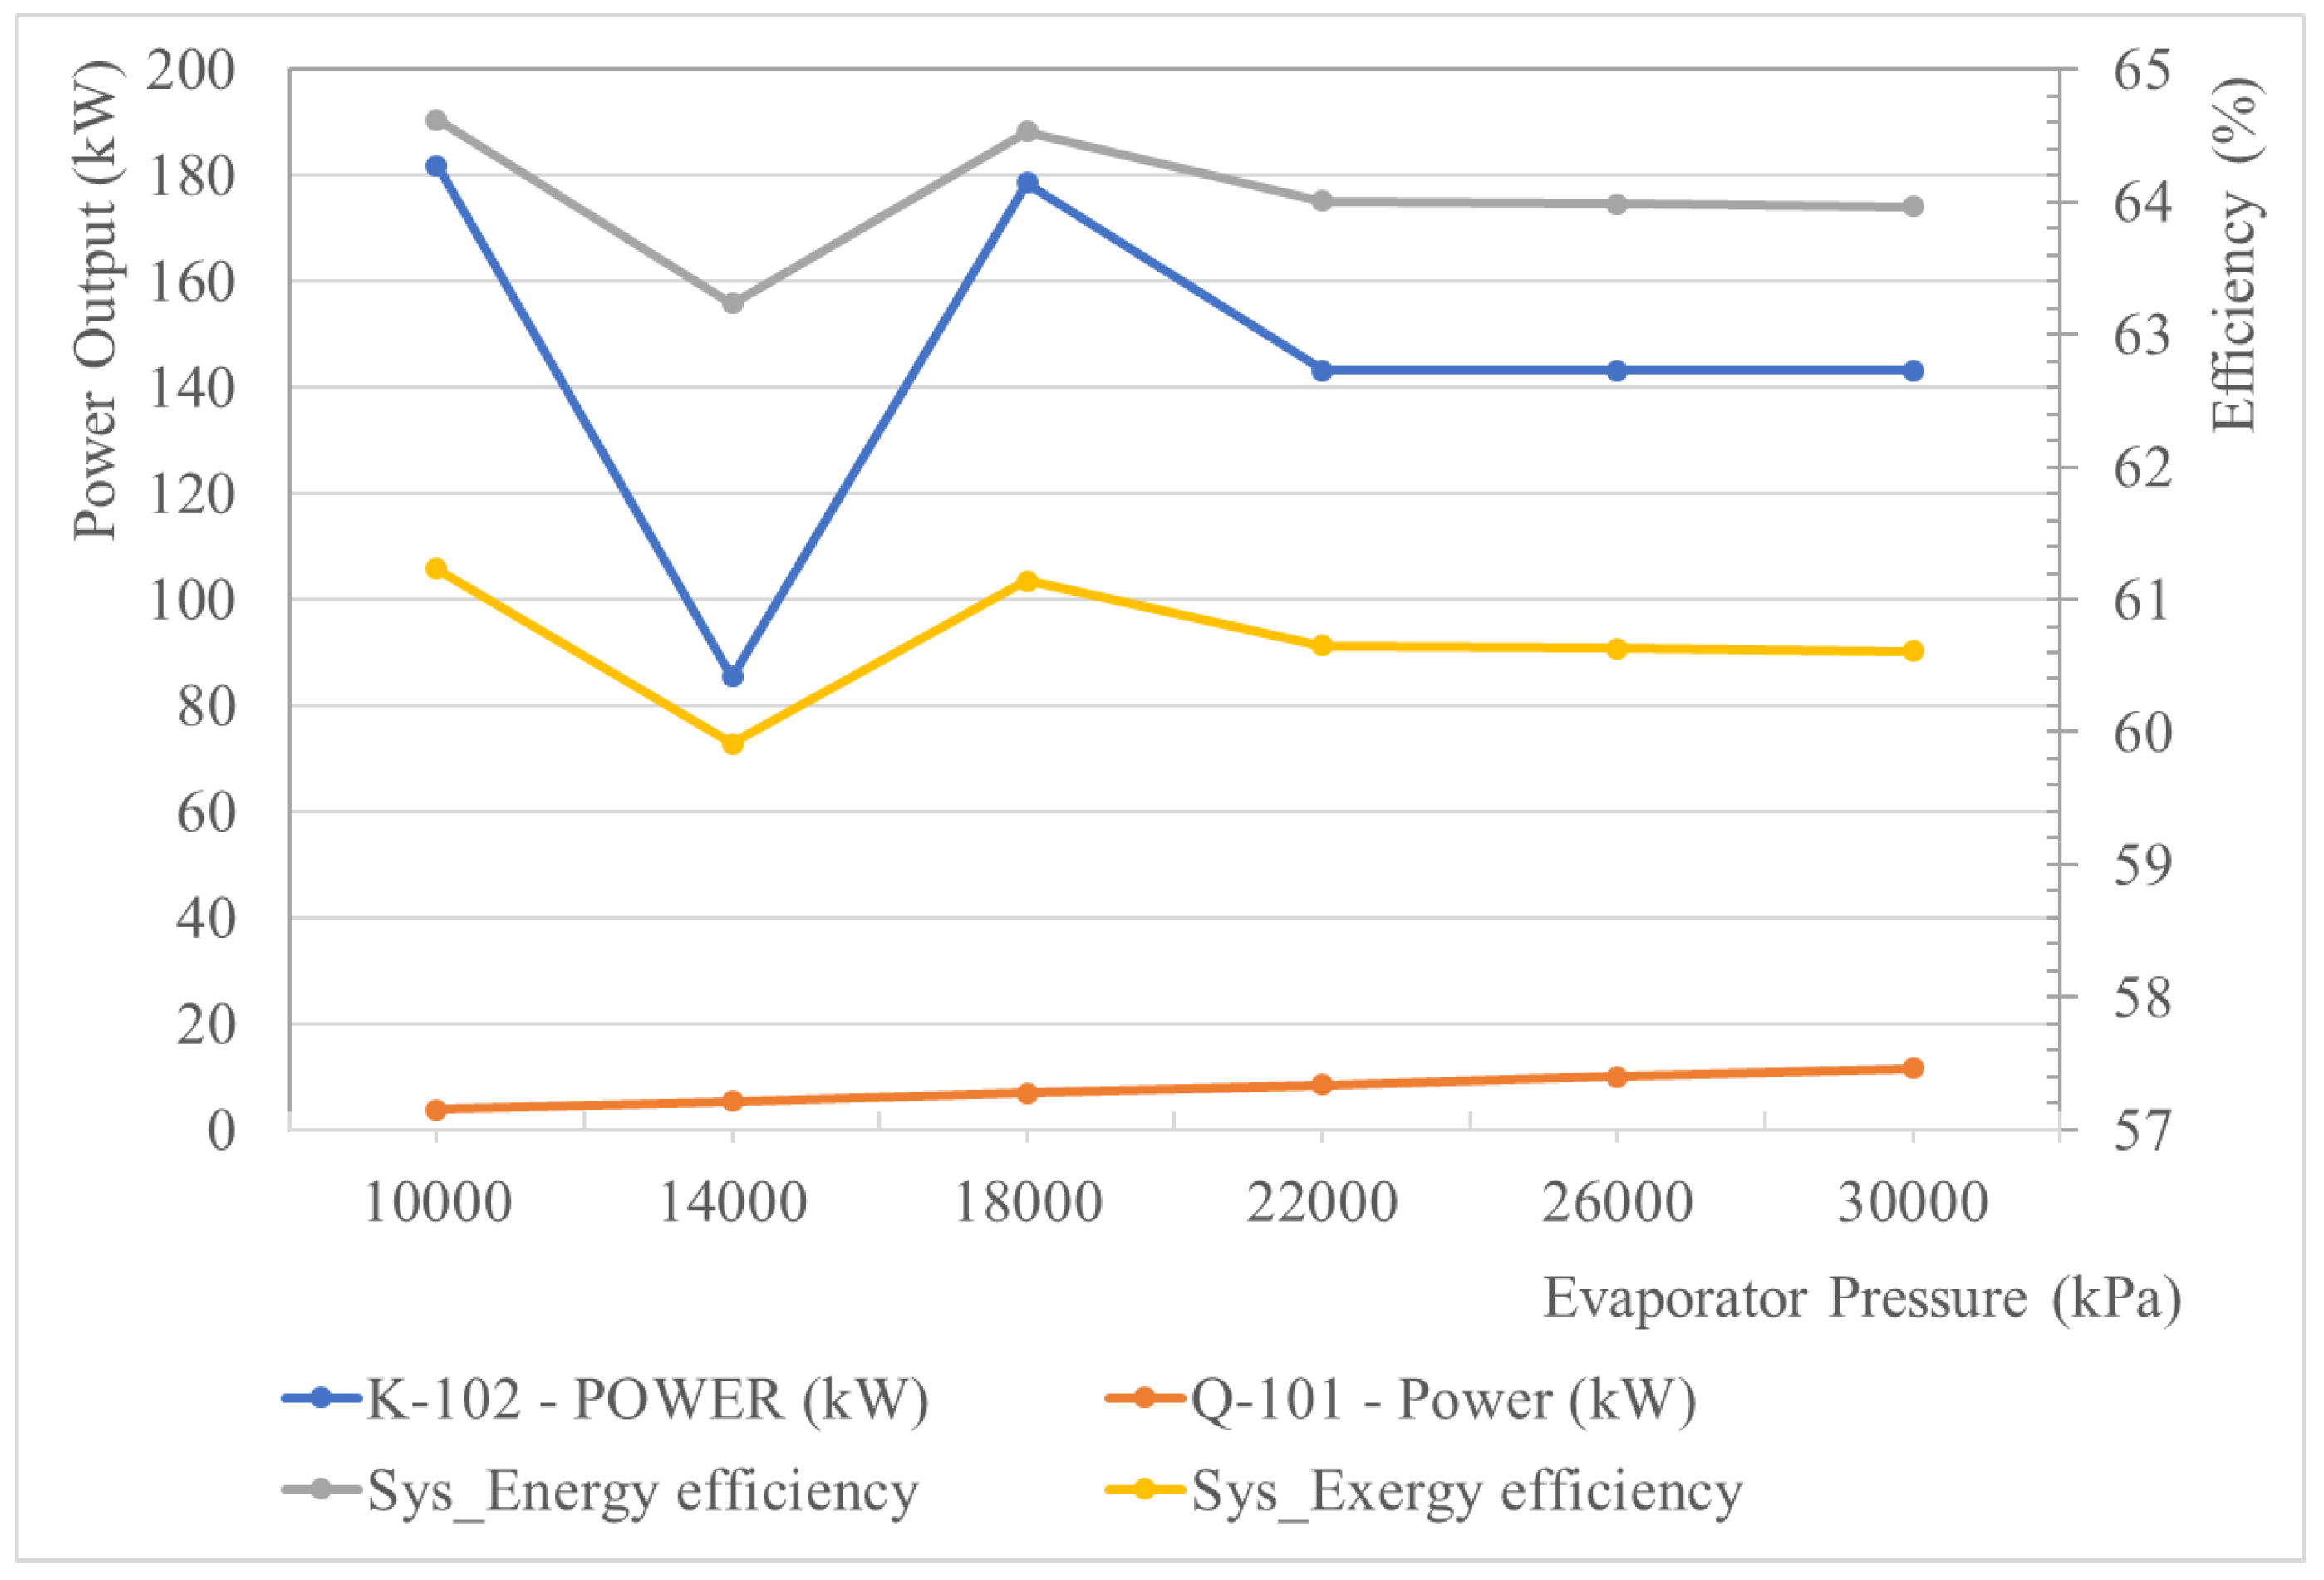
5.2.2. Effect of the Turbine Inlet Pressure of the SRC

The parameters based on the first and second laws of thermodynamics are clear indicators of a system’s performance, providing conclusive information about the current state of the system. Both exergy and thermal analyses are required to accurately represent the system’s behavior as a function of the working pressure and temperature. In this section, the parametric optimization of the SRC is carried out in depth based on the turbine inlet pressure and temperature.
The turbine inlet pressure is a critical factor affecting the SRC performance. Figure 6 demonstrates the variation in the energy and exergy efficiency and power output of the SRC as a function of the turbine inlet pressure. The figure shows that the power output of the expander and the energy and exergy efficiency of the system fluctuate with the increasing evaporation pressure in the SRC in the range of 10,000 kPa to 30,000 kPa, whereas the power required form the SRC pump increases with an increase in evaporation pressure. In the observed range of evaporation pressures, the change in power output of SRC expander, energy, and exergy efficiency varies from 85.5 kW to 181.9 kW, 63.23% to 64.62%, and 59.91% to 61.23%, respectively.
It is noteworthy that the power output, energy efficiency, and exergy efficiency of the SRC decrease to a minimum at a turbine inlet pressure of 14,000 kPa; however, they reach a maximum at a turbine inlet pressure of 18,000 kPa. At a constant turbine inlet temperature, when the turbine inlet pressure is 14,000 kPa, liquid is formed at the inlet of the expander, influencing the results negatively. As the SRC uses two heat exchangers, it is important to consider the effects of turbine inlet pressure on the LMTD of the heat exchanger, as shown in Equations (36) and (37). Taking this into account, an evaporation pressure of 19,000 kPa was selected for this simulation.

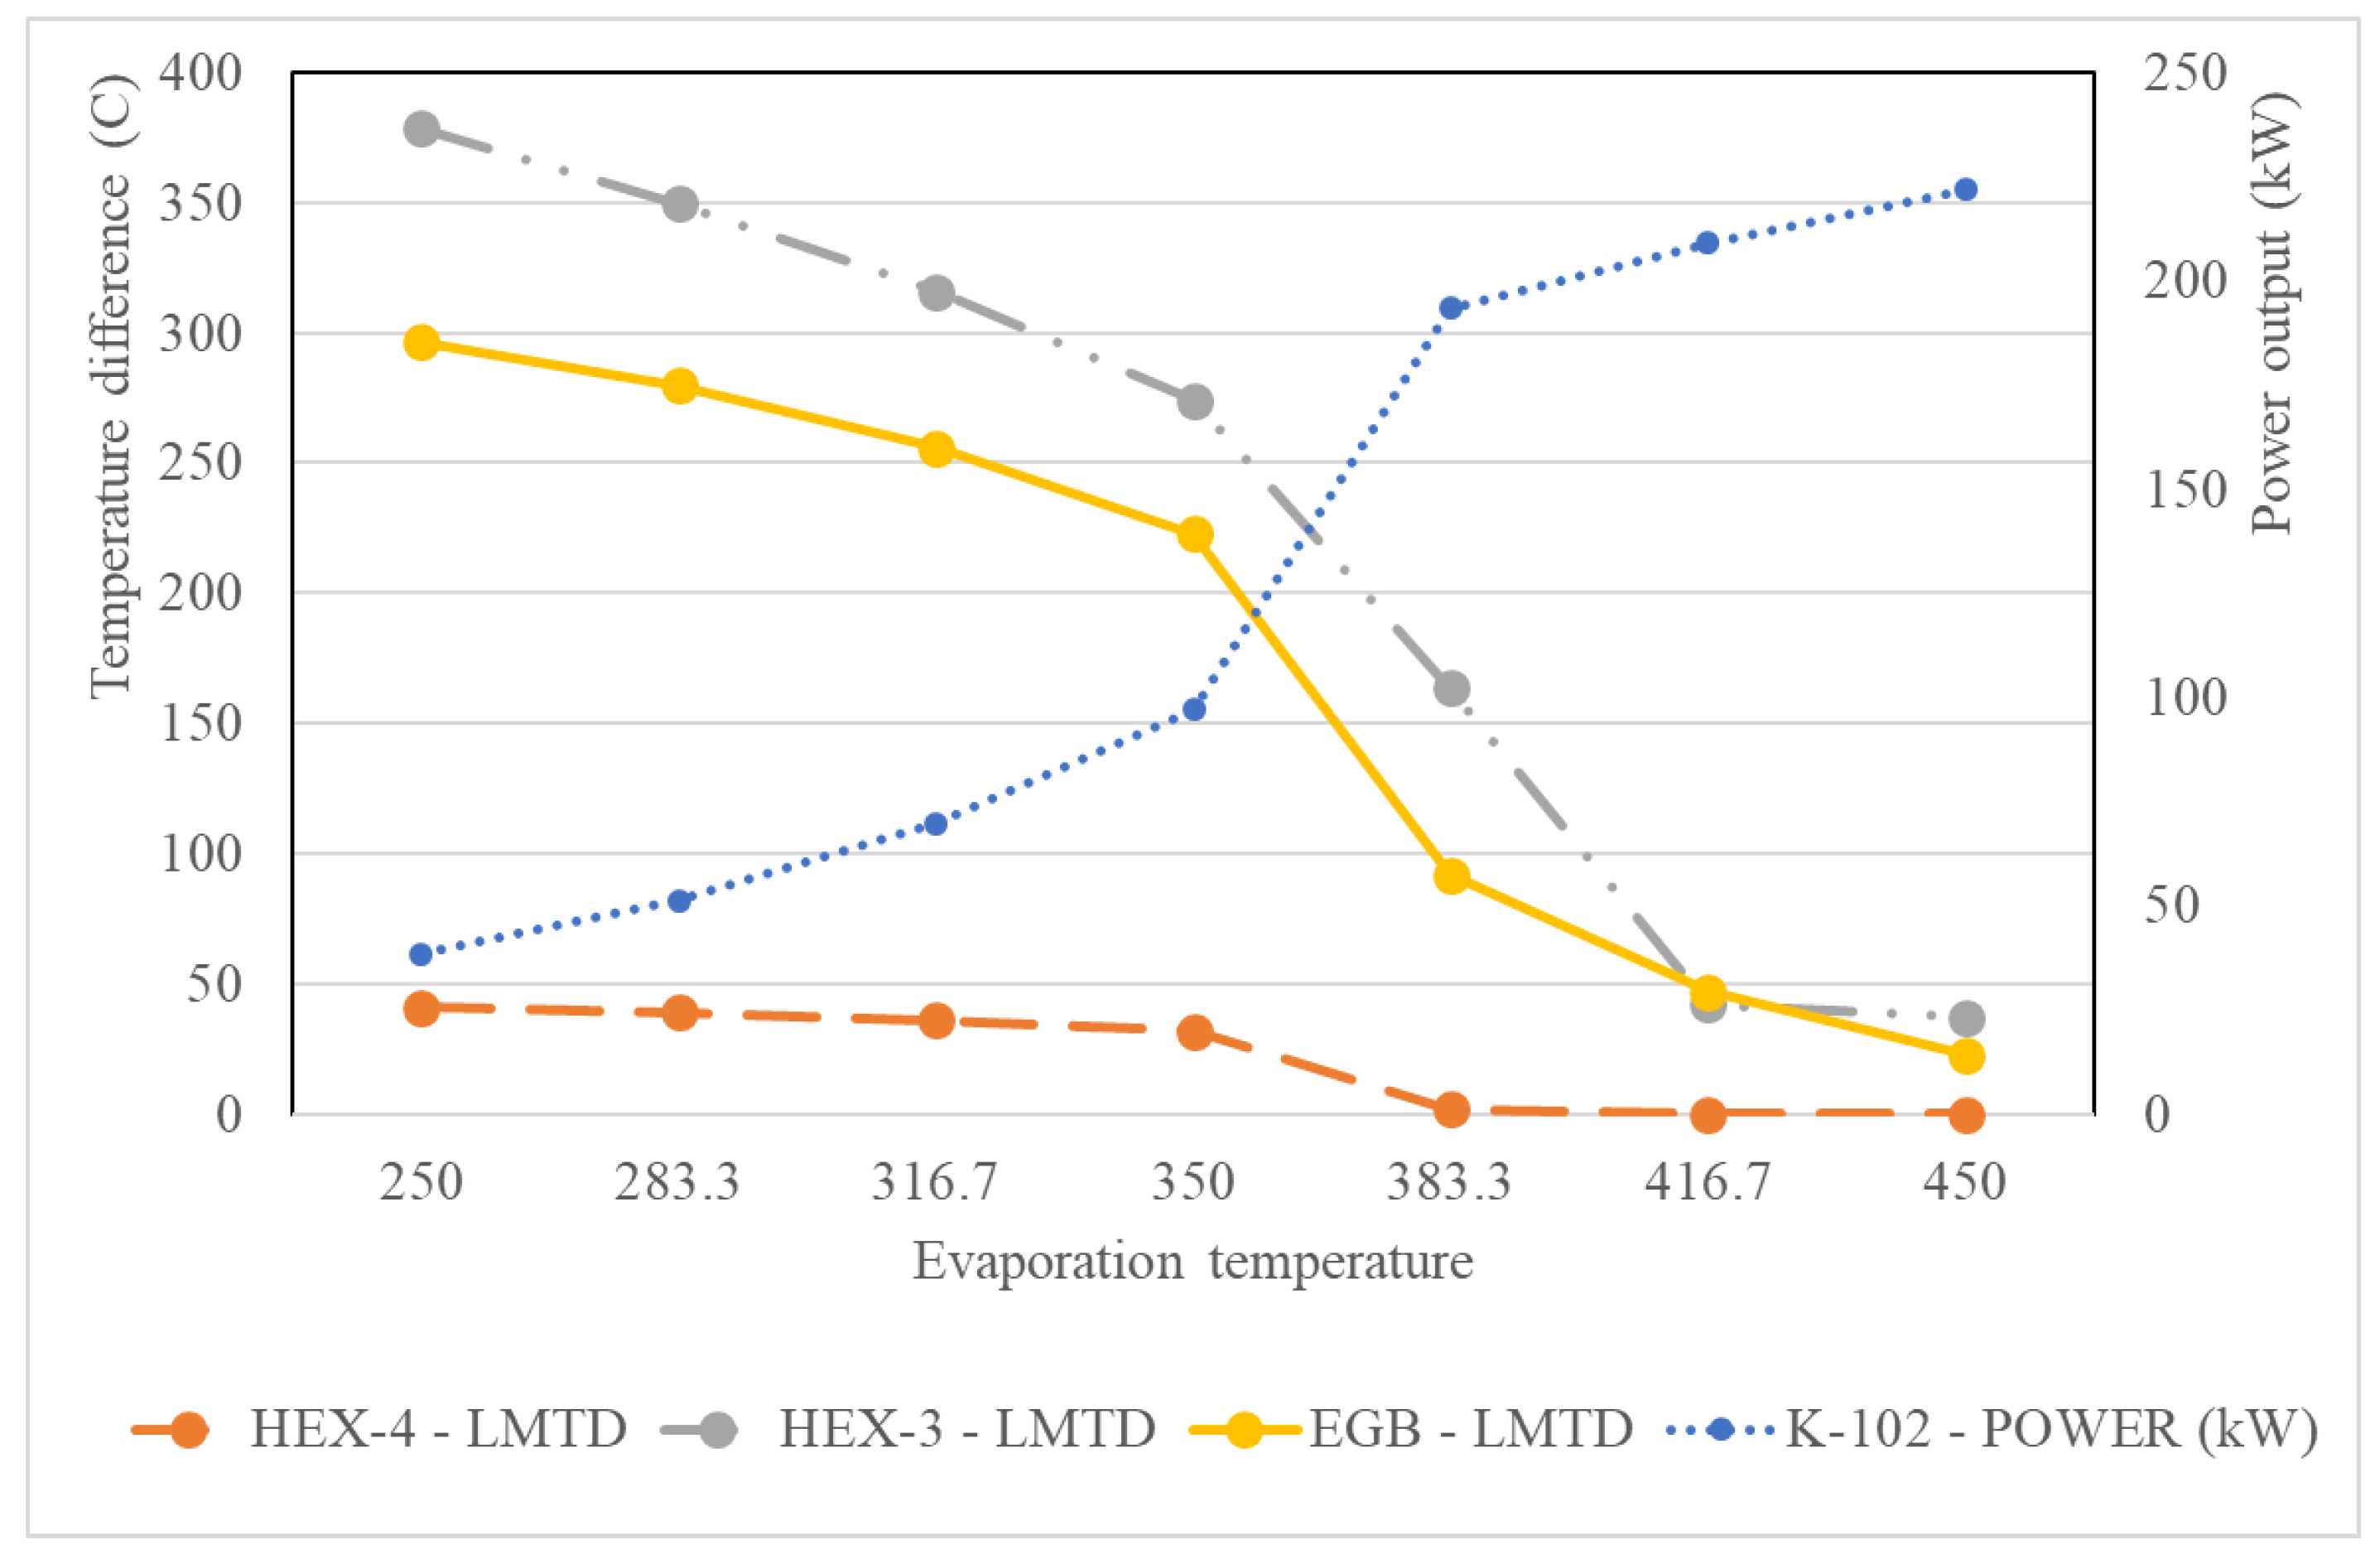
5.2.3. Effect of the Evaporation Temperature of the SRC

The evaporation temperature of the SRC varies with the mass flow rate of the flue gas of the SOFC, the current density of the SOFC, and the compressor ratio of the exhaust gas turbine. Different superheat temperatures of the SRC working fluid were simulated, and the results are presented in Figure 7.
Figure 7 shows the effect of the superheat temperature, in the range 250 °C to 450 °C, on the SRC performance indicators and the temperature difference in the heat exchangers. With an increase in the superheat temperature, the power output of the SRC significantly increases, and the energy and exergy efficiency of the SRC are improved. The power output of the SRC changes from 38.46 kW to 221.9 kW with a superheat temperature increase from 250 °C to 450 °C. However, the temperature difference (LMTD) of the heat exchangers tends to decrease with an increase in the superheat temperature. As shown in Equations (36) and (37), with a decrease in LMTD, the temperature difference between the hot and cold sources of the heat exchangers decreases. This necessitates an increase in the heat-contacting area (A), which increases the cost of the design and operation. In contrast, a high value of LMTD necessitates a smaller heat exchange area with inherent manufacturing inefficiency. Therefore, the LMTD value selected must balance the heat exchange efficiency and cost of manufacturing.
The above analysis demonstrates the significant effect of the SRC superheat temperature on the SRC performance as well as the performance of heat exchangers (HEX-3, HEX-4, and EGB). Therefore, the selection of the stack cooling passage needs to be optimized to ensure that the SRC fluid can fully exchange heat and reach the desired superheat temperature.

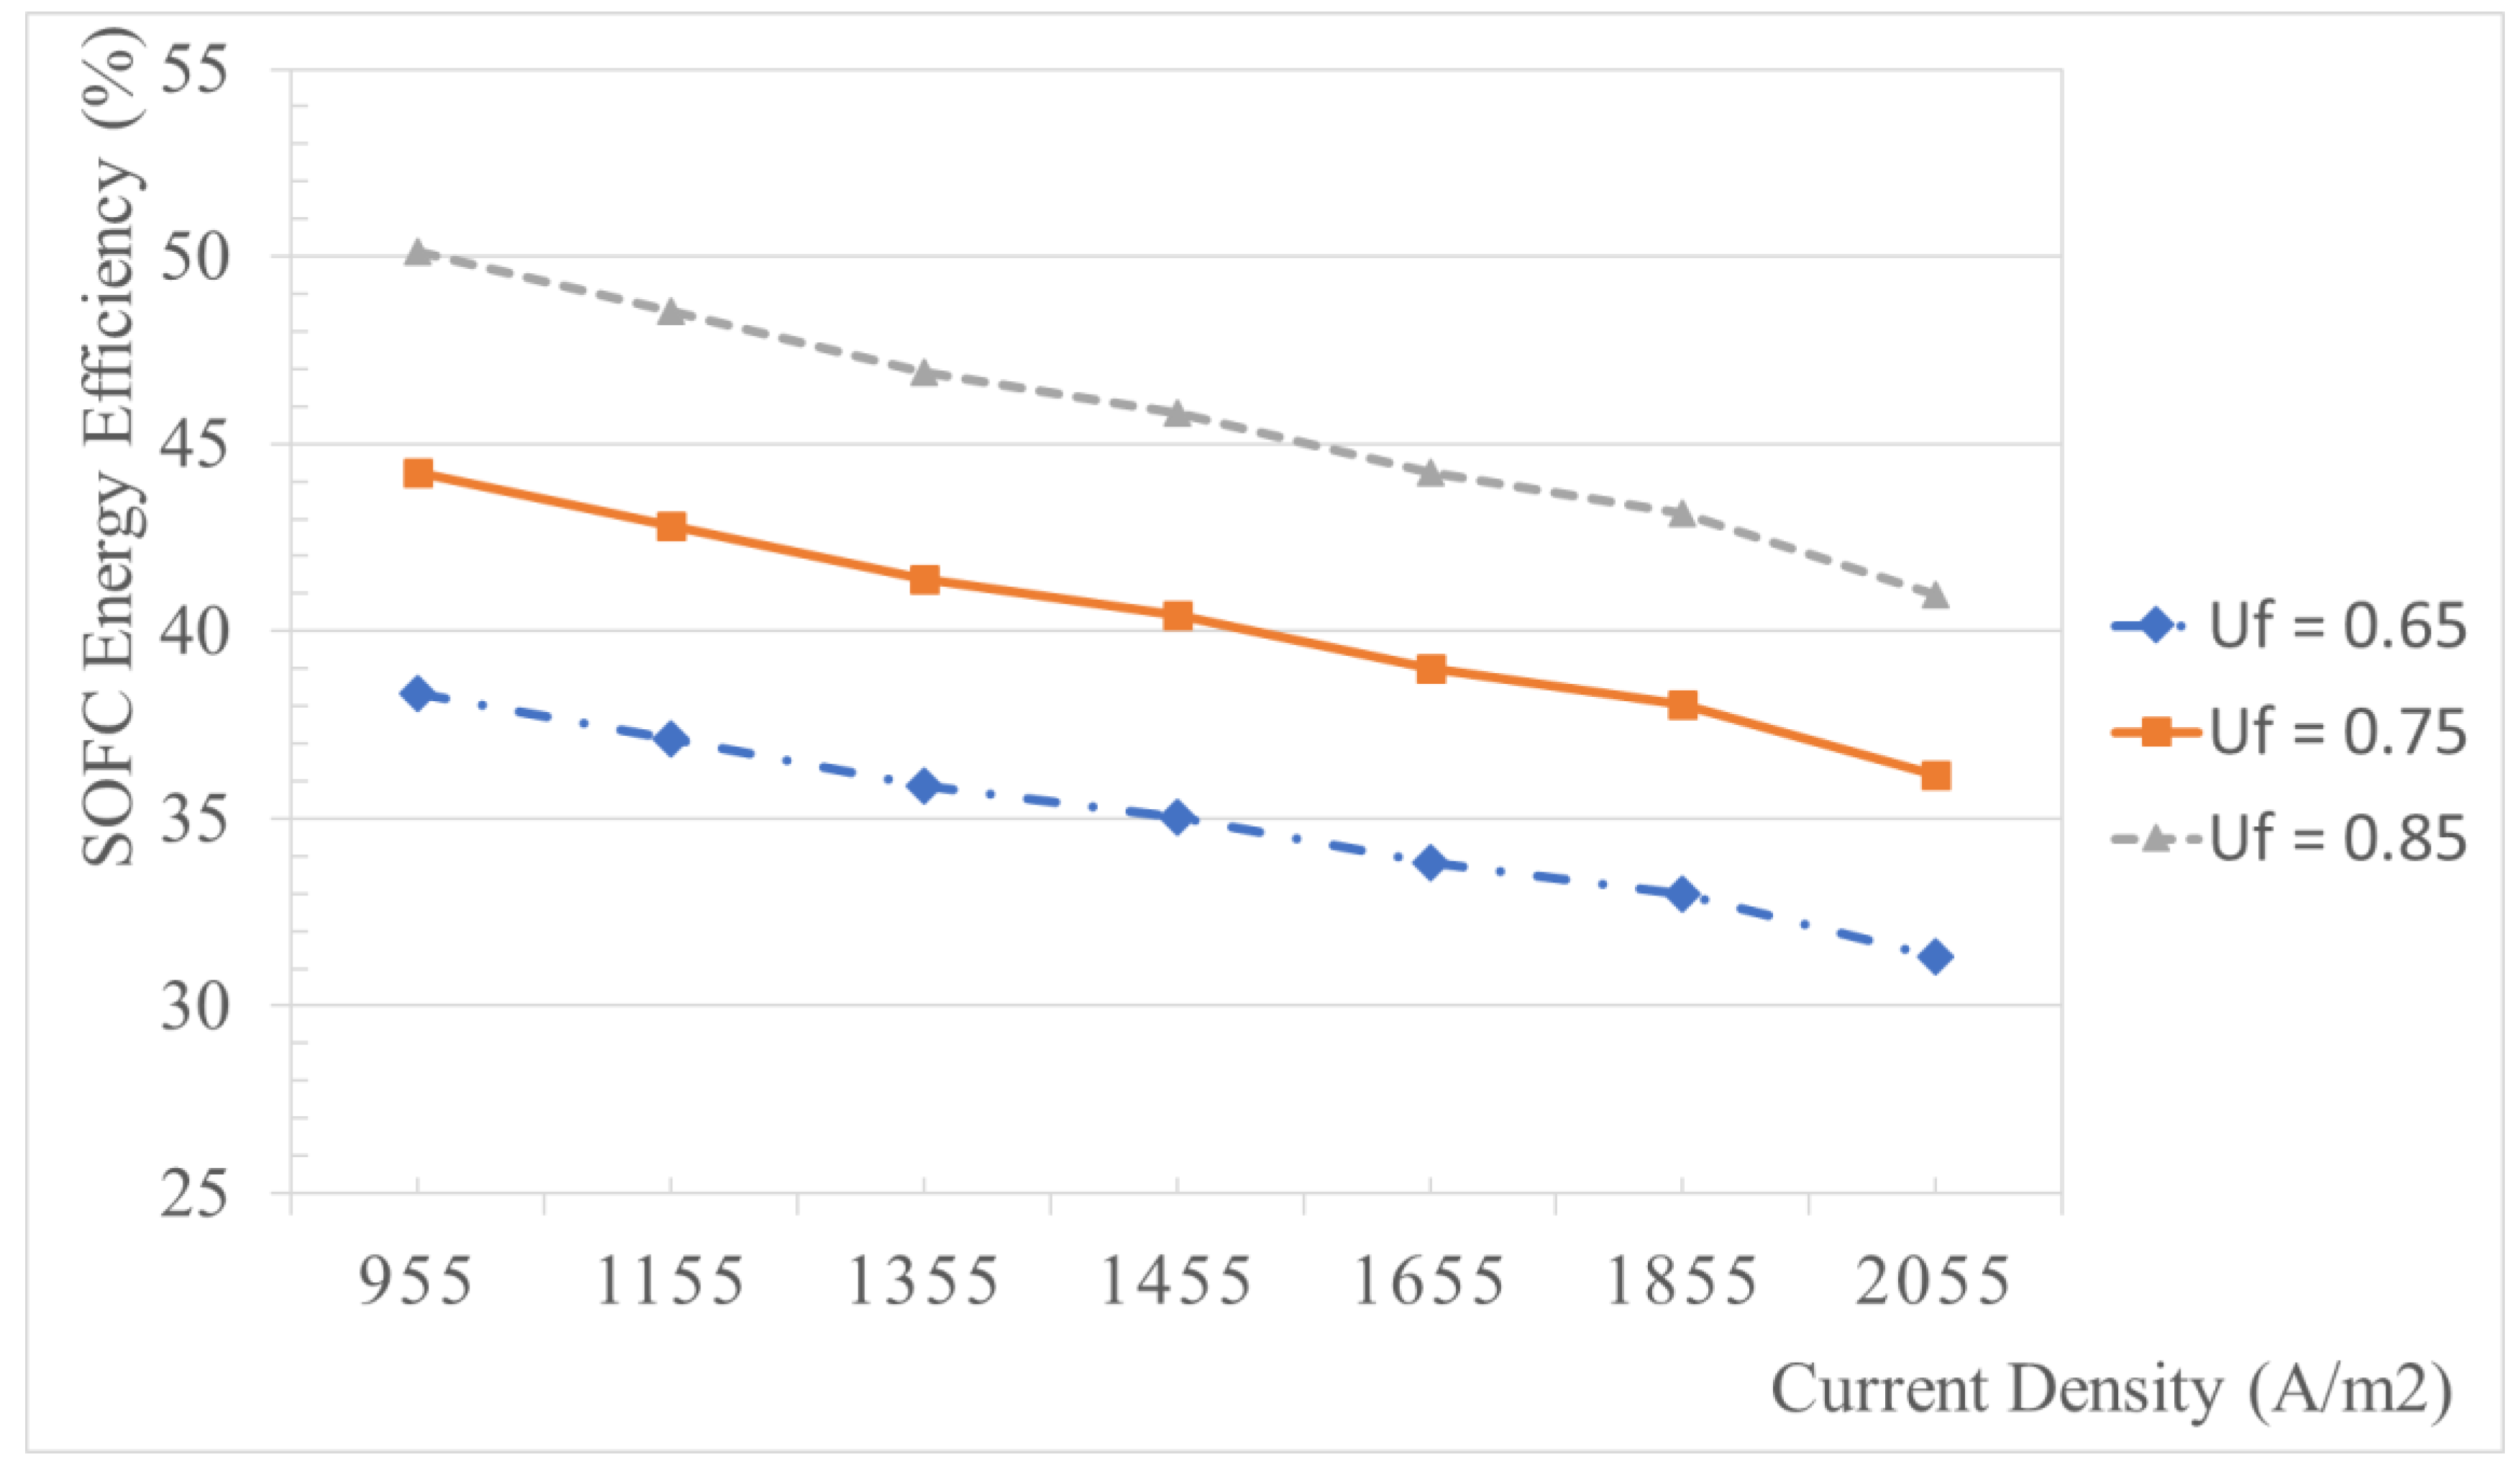
5.2.4. Effect of the Fuel Utilization Factor

The performance of the SOFC system has been studied for fuel utilization factors (Uf) of 65%, 75%, and 85%, respectively. Figure 8 and Figure 9 demonstrate the influence of Uf on the efficiency of the SOFC and the integrated system. It is observed that system efficiency increases with the fuel utilization ratio, if the concentration polarization is not significantly higher than that of other polarizations. When cells operate at a low current density, the influence of the fuel usage ratio becomes increasingly significant. When the SOFC-GT operates at lower current densities, the energy efficiency of the combined cycle improves. This is because the incoming fuel mass flow rate decreases faster than the output power. The calculated values for the energy efficiency of SOFC-GT are in agreement with the thermodynamic modeling results presented in References [7,54].
When the Uf value is 0.85, the energy efficiency of the system reaches a maximum value. This is because increasing the Uf further results in the consumption of more hydrogen in the SOFC stack, which simultaneously increases the current density and reduces the voltage due to internal irreversibility. In addition, the outlet temperature of the SOFC and afterburner is reduced, which further results in a decrease in the inlet temperature and power output of the GT.

6. Conclusions

The energy and exergy performances of the system were assessed using the first and second laws of thermodynamics. The first law evaluates power, power density, current density, voltage, and electrical efficiency; the second law evaluates exergy efficiency and exergy losses.
In the present study, an SRC and EGB are employed to recover waste heat from an SOFC/GT system. A thermodynamic analysis predicted an increase of 175.8 kW of power due to the SRC, with energy and exergy efficiencies of 25.58% and 41.21%, respectively. Hot water and steam are generated for use in machinery and seafarer accommodation.
In addition, a parametric study showed the current density, fuel utilization factor, and turbine inlet pressures of the SRC to be the key variables affecting the system performance. Additional findings include:
As the current density increases, the exergy efficiency of the cycle decreases due to increased fuel consumption by the SOFC. As efficiency decreases, a greater amount of unconverted chemical energy is converted into heat, increasing the requirement for inlet air cooling to maintain the operating temperature of the cells.
For SRC, optimal turbine inlet pressures exist at which the net output power and exergy efficiency of the combined cycles can be maximized. The SRC is maximized for a power output of 178.5 kW, and the energy and exergy efficiencies of the entire system are 64.53%, and 61.14%, respectively. However, this results in a reduction in steam production and EGB efficiency due to the increase in the heat dissipation requirement in HEX-3.
The system efficiency increases with increasing fuel utilization factor. Within the testing range, at a Uf value of 0.85, the exergy efficiency of the hybrid system and combined cycles is maximized. On the other hand, the net output power of the cycles decreases as the fuel utilization factor increases.
Compared with the SOFC/GT system, combined cycles offer better exergy efficiency and provide an incentive to use the suggested combined cycles.
Utilizing the EGB, steam is produced at 175 °C, 781.1 kPa, and 725 kg/h. It is supplied to machinery and provides heating for seafarer accommodation.

Author Contributions

Formal analysis, P.A.D.; Investigation, B.R., C.K. and J.L.; Methodology, P.A.D.; Supervision, H.K.; Writing—original draft, P.A.D.; Writing—review and editing, H.K. All authors have read and agreed to the published version of the manuscript.

Funding

This work was supported by the project “Development of guidance for prevention of leaks and mitigation of consequences in hydrogen ships” (Grant No. 20200520), and the project “Test evaluation for LNG bunkering equipment and development of test technology (Grant No. 20180048)” funded by the Ministry of Oceans and Fisheries (Korea). This research was supported by BB21plus, funded by Busan Metropolitan City and Busan Institute for Talent and Lifelong Education (BIT).

Institutional Review Board Statement

Not applicable.

Informed Consent Statement

Not applicable.

Conflicts of Interest

The authors declare no conflict of interest.

References

  1. Minutillo, M.; Perna, A.; Di Trolio, P.; Di Micco, S.; Jannelli, E. Techno-economics of novel refueling stations based on ammonia-to-hydrogen route and SOFC technology. Int. J. Hydrogen Energy 2021, 46, 10059–10071. [Google Scholar] [CrossRef]
  2. IMO. MEPC Fourth IMO Greenhouse Gas Study. Int. Marit. Organ. 2021, 11, 951–952. [Google Scholar]
  3. Hu, Q.; Zhou, W.; Diao, F. Interpretation of Initial IMO Strategy on Reduction of GHG Emissions from Ships. Sh. Build. China 2019, 60, 195–201. [Google Scholar]
  4. Zhu, M.; Yuen, K.F.; Ge, J.W.; Li, K.X. Impact of maritime emissions trading system on fleet deployment and mitigation of CO2 emission. Transp. Res. Part D Transp. Environ. 2018, 62, 474–488. [Google Scholar] [CrossRef]
  5. Rathore, S.S.; Biswas, S.; Fini, D.; Kulkarni, A.P.; Giddey, S. Direct ammonia solid-oxide fuel cells: A review of progress and prospects. Int. J. Hydrogen Energy 2021, 46, 35365–35384. [Google Scholar] [CrossRef]
  6. Wan, Z.; Tao, Y.; Shao, J.; Zhang, Y.; You, H. Ammonia as an effective hydrogen carrier and a clean fuel for solid oxide fuel cells. Energy Convers. Manag. 2021, 228, 113729. [Google Scholar] [CrossRef]
  7. Baniasadi, E.; Dincer, I. Energy and exergy analyses of a combined ammonia-fed solid oxide fuel cell system for vehicular applications. Int. J. Hydrogen Energy 2011, 36, 11128–11136. [Google Scholar] [CrossRef]
  8. van Biert, L.; Godjevac, M.; Visser, K.; Aravind, P.V. A review of fuel cell systems for maritime applications. J. Power Sources 2016, 327, 345–364. [Google Scholar] [CrossRef] [Green Version]
  9. Jeerh, G.; Zhang, M.; Tao, S. Recent progress in ammonia fuel cells and their potential applications. J. Mater. Chem. A 2020, 9, 727–752. [Google Scholar] [CrossRef]
  10. Chiong, M.C.; Chong, C.T.; Ng, J.H.; Mashruk, S.; Chong, W.W.F.; Samiran, N.A.; Mong, G.R.; Valera-Medina, A. Advancements of combustion technologies in the ammonia-fuelled engines. Energy Convers. Manag. 2021, 244, 114460. [Google Scholar] [CrossRef]
  11. Miyaoka, H.; Miyaoka, H.; Ichikawa, T.; Ichikawa, T.; Kojima, Y. Highly purified hydrogen production from ammonia for PEM fuel cell. Int. J. Hydrogen Energy 2018, 43, 14486–14492. [Google Scholar] [CrossRef]
  12. Laval, A.; Haldor, T.; Siemens, G. Ammonfuel-an industrial view of ammonia as a marine fuel. Hafnia 2020, 7, 32–59. [Google Scholar]
  13. Cinti, G.; Barelli, L.; Bidini, G. The use of ammonia as a fuel for transport: Integration with solid oxide fuel cells. AIP Conf. Proc. 2019, 2191, 020048. [Google Scholar] [CrossRef]
  14. Parikhani, T.; Azariyan, H.; Behrad, R.; Ghaebi, H.; Jannatkhah, J. Thermodynamic and thermoeconomic analysis of a novel ammonia-water mixture combined cooling, heating, and power (CCHP) cycle. Renew. Energy 2020, 145, 1158–1175. [Google Scholar] [CrossRef]
  15. Wojcik, A.; Middleton, H.; Damopoulos, I.; Van Herle, J. Ammonia as a fuel in solid oxide fuel cells. J. Power Sources 2003, 118, 342–348. [Google Scholar] [CrossRef]
  16. Ma, Q.; Peng, R.; Lin, Y.; Gao, J.; Meng, G. A high-performance ammonia-fueled solid oxide fuel cell. J. Power Sources 2006, 161, 95–98. [Google Scholar] [CrossRef]
  17. Al-Hamed, K.H.M.; Dincer, I. A novel ammonia solid oxide fuel cell-based powering system with on-board hydrogen production for clean locomotives. Energy 2021, 220, 119771. [Google Scholar] [CrossRef]
  18. Ishak, F.; Dincer, I.; Zamfirescu, C. Thermodynamic analysis of ammonia-fed solid oxide fuel cells. J. Power Sources 2012, 202, 157–165. [Google Scholar] [CrossRef]
  19. Ishak, F.; Dincer, I.; Zamfirescu, C. Energy and exergy analyses of direct ammonia solid oxide fuel cell integrated with gas turbine power cycle. J. Power Sources 2012, 212, 73–85. [Google Scholar] [CrossRef]
  20. Siddiqui, O.; Dincer, I. Analysis and performance assessment of a new solar-based multigeneration system integrated with ammonia fuel cell and solid oxide fuel cell-gas turbine combined cycle. J. Power Sources 2017, 370, 138–154. [Google Scholar] [CrossRef]
  21. Lee, H.; Jung, I.; Roh, G.; Na, Y.; Kang, H. Comparative analysis of on-board methane and methanol reforming systems combined with HT-PEM fuel cell and CO2 capture/liquefaction system for hydrogen fueled ship application. Energies 2020, 13, 224. [Google Scholar] [CrossRef] [Green Version]
  22. Nafees, A.; Rasid, R.A. Study of natural gas powered solid oxide fuel cell simulation and modeling. IOP Conf. Ser. Mater. Sci. Eng. 2019, 702, 012017. [Google Scholar] [CrossRef]
  23. Yoon-Ho, L. Thermo-economic analysis of a novel regasification system with liquefied-natural-gas cold-energy. Int. J. Refrig. 2019, 101, 218–229. [Google Scholar] [CrossRef]
  24. Song, J.; Gu, C. wei Performance analysis of a dual-loop organic Rankine cycle (ORC) system with wet steam expansion for engine waste heat recovery. Appl. Energy 2015, 156, 280–289. [Google Scholar] [CrossRef]
  25. Razmi, A.R.; Janbaz, M. Exergoeconomic assessment with reliability consideration of a green cogeneration system based on compressed air energy storage (CAES). Energy Convers. Manag. 2020, 204, 112320. [Google Scholar] [CrossRef]
  26. Ezzat, M.F.; Dincer, I. Energy and exergy analyses of a novel ammonia combined power plant operating with gas turbine and solid oxide fuel cell systems. Energy 2020, 194, 116750. [Google Scholar] [CrossRef]
  27. Lan, R.; Tao, S. Ammonia as a suitable fuel for fuel cells. Front. Energy Res. 2014, 2, 3–6. [Google Scholar] [CrossRef] [Green Version]
  28. Larminie, J.; Dicks, A.; McDonald, M.S. Fuel Cell Systems Explained, 2nd ed.; John Wiley & Sons Ltd.: Hoboken, NJ, USA, 2003; ISBN 047084857X. [Google Scholar]
  29. Ma, Q.; Peng, R.R.; Tian, L.; Meng, G. Direct utilization of ammonia in intermediate-temperature solid oxide fuel cells. Electrochem. Commun. 2006, 8, 1791–1795. [Google Scholar] [CrossRef]
  30. Cui, Z.; Wang, J.; Lior, N. Thermodynamic Analysis of a Solid Oxide Fuel Cell Based Combined Cooling, Heating, and Power System Integrated with Biomass Gasification. Entropy 2021, 23, 1029. [Google Scholar] [CrossRef] [PubMed]
  31. Siddiqui, O.; Dincer, I. A review and comparative assessment of direct ammonia fuel cells. Therm. Sci. Eng. Prog. 2018, 5, 568–578. [Google Scholar] [CrossRef]
  32. Perna, A.; Minutillo, M.; Jannelli, E.; Cigolotti, V.; Nam, S.W.; Han, J. Design and performance assessment of a combined heat, hydrogen and power (CHHP) system based on ammonia-fueled SOFC. Appl. Energy 2018, 231, 1216–1229. [Google Scholar] [CrossRef]
  33. Eveloy, V.; Karunkeyoon, W.; Rodgers, P.; Al Alili, A. Energy, exergy and economic analysis of an integrated solid oxide fuel cell—gas turbine—organic Rankine power generation system. Int. J. Hydrogen Energy 2016, 41, 13843–13858. [Google Scholar] [CrossRef]
  34. Song, M.; Zhuang, Y.; Zhang, L.; Li, W.; Du, J.; Shen, S. Thermodynamic performance assessment of SOFC-RC-KC system for multiple waste heat recovery. Energy Convers. Manag. 2021, 245, 114579. [Google Scholar] [CrossRef]
  35. Liu, Y.; Han, J.; You, H. Performance analysis of a CCHP system based on SOFC/GT/CO2 cycle and ORC with LNG cold energy utilization. Int. J. Hydrogen Energy 2019, 44, 29700–29710. [Google Scholar] [CrossRef]
  36. Chitgar, N.; Moghimi, M. Design and evaluation of a novel multi-generation system based on SOFC-GT for electricity, fresh water and hydrogen production. Energy 2020, 197, 117162. [Google Scholar] [CrossRef]
  37. Ghorbani, S.; Khoshgoftar-Manesh, M.H.; Nourpour, M.; Blanco-Marigorta, A.M. Exergoeconomic and exergoenvironmental analyses of an integrated SOFC-GT-ORC hybrid system. Energy 2020, 206, 118151. [Google Scholar] [CrossRef]
  38. Zhao, H.; Hou, X.; Yang, Q. Thermodynamic Study and Exergetic Analysis of the Integrated SOFC-GT-Kalina Power Cycle. Energy Power Eng. 2018, 10, 43–64. [Google Scholar] [CrossRef] [Green Version]
  39. Fuerte, A.; Valenzuela, R.X.; Escudero, M.J.; Daza, L. Ammonia as efficient fuel for SOFC. J. Power Sources 2009, 192, 170–174. [Google Scholar] [CrossRef]
  40. Amiri, T.; Singh, K.; Sandhu, N.K.; Hanifi, A.R.; Etsell, T.H.; Luo, J.-L.; Thangadurai, V.; Sarkar, P. High Performance Tubular Solid Oxide Fuel Cell Based on Ba 0.5 Sr 0.5 Ce 0.6 Zr 0.2 Gd 0.1 Y 0.1 O 3-δ Proton Conducting Electrolyte. J. Electrochem. Soc. 2018, 165, F764–F769. [Google Scholar] [CrossRef] [Green Version]
  41. Milewski, J.; Szczęśniak, A.; Szabłowski, Ł. A proton conducting solid oxide fuel cell—implementation of the reduced order model in available software and verification based on experimental data. J. Power Sources 2021, 502, 229948. [Google Scholar] [CrossRef]
  42. Mehrpooya, M.; Dehghani, H.; Ali Moosavian, S.M. Optimal design of solid oxide fuel cell, ammonia-water single effect absorption cycle and Rankine steam cycle hybrid system. J. Power Sources 2016, 306, 107–123. [Google Scholar] [CrossRef]
  43. Peters, R.; Deja, R.; Engelbracht, M.; Frank, M.; Nguyen, V.N.; Blum, L.; Stolten, D. Efficiency analysis of a hydrogen-fueled solid oxide fuel cell system with anode off-gas recirculation. J. Power Sources 2016, 328, 105–113. [Google Scholar] [CrossRef]
  44. Ebrahimi, M.; Moradpoor, I. Combined solid oxide fuel cell, micro-gas turbine and organic Rankine cycle for power generation (SOFC-MGT-ORC). Energy Convers. Manag. 2016, 116, 120–133. [Google Scholar] [CrossRef]
  45. Al-Hamed, K.H.M.; Dincer, I. A new direct ammonia solid oxide fuel cell and gas turbine based integrated system for electric rail transportation. eTransportation 2019, 2, 100027. [Google Scholar] [CrossRef]
  46. Barelli, L.; Bidini, G.; Cinti, G. Operation of a solid oxide fuel cell based power system with ammonia as a fuel: Experimental test and system design. Energies 2020, 13, 6173. [Google Scholar] [CrossRef]
  47. Aminyavari, M.; Mamaghani, A.H.; Shirazi, A.; Najafi, B.; Rinaldi, F. Exergetic, economic, and environmental evaluations and multi-objective optimization of an internal-reforming SOFC-gas turbine cycle coupled with a Rankine cycle. Appl. Therm. Eng. 2016, 108, 833–846. [Google Scholar] [CrossRef]
  48. Chen, Y.; Wang, M.; Liso, V.; Samsatli, S.; Samsatli, N.J.; Jing, R.; Chen, J.; Li, N.; Zhao, Y. Parametric analysis and optimization for exergoeconomic performance of a combined system based on solid oxide fuel cell-gas turbine and supercritical carbon dioxide Brayton cycle. Energy Convers. Manag. 2019, 186, 66–81. [Google Scholar] [CrossRef]
  49. Venkitesh, K.; Daniel, J.; Sreekanth, M. Thermodynamic Assessment of a Gas Turbine System Combined with A Solid Oxide Fuel Cell Powered by Synthetic Gas from Municipal Solid Waste. IOP Conf. Ser. Mater. Sci. Eng. 2021, 1128, 012036. [Google Scholar] [CrossRef]
  50. Rangel-Hernández, V.H.; Niño-Avendaño, A.M.; Ramírez-Minguela, J.J.; Belman-Flores, J.M.; Elizalde-Blancas, F. Advanced Exergy Analysis of an Integrated SOFC-Adsorption Refrigeration Power System. Appl. Energy 2018. [Google Scholar] [CrossRef] [Green Version]
  51. Gholamian, E.; Zare, V. A comparative thermodynamic investigation with environmental analysis of SOFC waste heat to power conversion employing Kalina and Organic Rankine Cycles. Energy Convers. Manag. 2016, 117, 150–161. [Google Scholar] [CrossRef]
  52. Saadabadi, S.A.; Patel, H.; Woudstra, T.; Aravind, P.V. Thermodynamic Analysis of Solid Oxide Fuel Cell Integrated System Fuelled by Ammonia from Struvite Precipitation Process. Fuel Cells 2020, 20, 143–157. [Google Scholar] [CrossRef]
  53. Ranjbar, F.; Chitsaz, A.; Mahmoudi, S.M.S.; Khalilarya, S.; Rosen, M.A. Energy and exergy assessments of a novel trigeneration system based on a solid oxide fuel cell. Energy Convers. Manag. 2014, 87, 318–327. [Google Scholar] [CrossRef]
  54. Ni, M.; Leung, D.Y.C.; Leung, M.K.H. Thermodynamic analysis of ammonia fed solid oxide fuel cells: Comparison between proton-conducting electrolyte and oxygen ion-conducting electrolyte. J. Power Sources 2008, 183, 682–686. [Google Scholar] [CrossRef]
Figure 1. Schematic diagram of the SOFC-GT-SRC-EGB employing ammonia as fuel.
Energies 15 03331 g001
Figure 2. The temperature distribution of the EGB. (a) Temperature regions in the EGB. (b) Connectivity. (c) Temperature–enthalpy plot.
Energies 15 03331 g002aEnergies 15 03331 g002b
Figure 3. Exergy destruction of the main components of the proposed system.
Energies 15 03331 g003
Figure 4. Effect of current density on the energy efficiency of system.
Energies 15 03331 g004
Figure 5. Effect of current density on the exergy efficiency of system.
Energies 15 03331 g005
Figure 6. Effect of evaporator pressure on the SRC power output and efficiency.
Energies 15 03331 g006
Figure 7. Effect of superheat temperature on SRC performance and heat exchanger efficiencies.
Energies 15 03331 g007
Figure 8. Effect of fuel utilization factor on the SOFC energy efficiency.
Energies 15 03331 g008
Figure 9. Effect of fuel utilization factor on the integrated system efficiency.
Energies 15 03331 g009
Table 1. Boundary conditions of the proposed system.
ComponentParameterValue
SOFCOperating pressure (bar)4
Operating temperature (°C)814.1
Number of single cells14,202
Fuel cell current density (A/m2)1455
Active surface area (m2)0.22
Anode thickness (cm)0.002
Cathode thickness (cm)0.002
Electrolyte thickness (cm)0.004
Stoichiometric rate of hydrogen1.2
Stoichiometric rate of oxygen2
Fuel utilization factor in SOFC (%)85
CompressorIsentropic efficiency (%)82
PumpsIsentropic efficiency (%)82
ExpandersIsentropic efficiency (%)80
Heat exchangersMinimum temperature approach (°C)7
ConverterDC-AC converter efficiency (%)98
Table 2. Exergy destruction equations of the main components.
ComponentsExergy Destruction Rate
SOFC E x ˙ 3 + E x ˙ 4 + E x ˙ 11 E x ˙ 10 + W ˙ s = E x ˙ d e s (38)
Afterburner E x ˙ 10 E x ˙ 12 = E x ˙ d e s (39)
Gas Turbine E x ˙ 12 E x ˙ 13 + W ˙ G a s   t u r b i n e = E x ˙ d e s (40)
Air heat exchanger (HEX-1) E x ˙ 2 + E x ˙ 13 E x ˙ 3 E x ˙ 14 = E x ˙ d e s (41)
Fuel heat exchanger (HEX-2) E x ˙ 1 + E x ˙ 14 E x ˙ 15 E x ˙ 4 = E x ˙ d e s (42)
SRC heat exchanger (HEX-3) E x ˙ 15 + E x ˙ 18 E x ˙ 19 E ˙ x 16 = E x ˙ d e s (43)
Exhaust gas boiler E x ˙ 16 + E x ˙ 24 E x ˙ 17 E ˙ x 25 = E x ˙ d e s (44)
Table 3. Comparison of simulation results of the proposed integrated model with the corresponding values listed in the literature.
ParameterModel ResultsReported [52]Difference (%)
SOFC temperature (°C)808.88001
Cell voltage (V)0.850.6721
Fuel utilization factor (%)85805
Current Density (A/m2) 145514500.3
SOFC efficiency 43.8394.8
Table 4. Simulation results of integrated system.
NodeVapor FractionTemperaturePressureMolar FlowMass Enthalpy
Unit CkPakgmole/hkJ/kg
Air in 1.0029.85101.30187.624.63
1 1.0029.85400.0080.10−2687.22
2 1.00203.36400.00187.62183.31
3 1.00492.60396.55187.62495.48
4 1.00492.60396.5580.10−1518.26
5 1.00152.64396.55105.22−1518.21
6 0.00152.64396.550.00−1518.21
7 1.00383.66396.55309.5890.18
8 1.00814.11396.55334.6690.18
9 0.00814.11396.550.0090.18
10 1.00814.11396.55317.9390.18
11 1.00814.11396.5516.7390.18
12 1.001158.61396.55320.9990.18
13 1.00890.01117.00320.99−358.61
14 1.00736.20110.11320.99−607.95
15 1.00587.58103.21320.99−843.23
16 1.00359.3996.32320.99−1192.75
17 1.00159.7189.42320.99−1486.54
18 0.0072.1219,000.0056.62−15,667.37
19 1.00360.9018,996.5556.62−13,345.07
20 0.7374.6938.0056.62−13,965.52
21 0.0070.0031.1156.62−15,693.37
22 0.0020.00100.00444.07−15,909.39
23 0.0070.9896.55444.07−15,689.09
24 0.0020.00784.5340.24−15,908.74
25 1.00175.00781.0840.24−13,162.57
26 1.00814.10396.5516.7390.21
Table 5. Performance of integrated system.
TermValue
SOFC power output (kW) 3800
Gas Turbine power (kW)844.8
SRC Turbine power (kW) 175.8
SRC pump power (kW) 7.369
Air compressor power (kW) 268.7
SOFC electrical efficiency (%) 53.92
Electrical efficiency of entire system (%) 64.49
EGB mass flow rate (kg/h) 725
EGB superheated temperature (°C)175
Table 6. Energy and exergy efficiency of the proposed system.
SubsystemEnergy EfficiencyExergy Efficiency
SOFC-GT 62.1058.84
SRC 25.5841.21
Total System 64.4961.10
Publisher’s Note: MDPI stays neutral with regard to jurisdictional claims in published maps and institutional affiliations.

