Article

Application of Infrared Imaging for Early Detection of Downy Mildew (Plasmopara viticola) in Grapevine

1
Institute of Agricultural Engineering, Tropics and Subtropics Group (440e), University of Hohenheim, Garbenstrasse 9, 70599 Stuttgart, Germany
2
Institute of Crop Science, Department of Quality of Plant Products, Viticulture (340e), University of Hohenheim, Emil-Wolff-Strasse 35, 70599 Stuttgart, Germany
*
Author to whom correspondence should be addressed.
Agriculture 2022, 12(5), 617; https://doi.org/10.3390/agriculture12050617
Submission received: 24 March 2022 / Revised: 25 April 2022 / Accepted: 25 April 2022 / Published: 27 April 2022
(This article belongs to the Section Digital Agriculture)

Abstract

:
Late detection of fungal infection is the main cause of inadequate disease control, affecting fruit quality and reducing yield of grapevine. Therefore, infrared imagery as a remote sensing technique was investigated in this study as a potential tool for early disease detection. Experiments were conducted under field conditions, and the effects of temporal and spatial variability in the leaf temperature of grapevine infected by Plasmopara viticola were studied. Evidence of the grapevine’s thermal response is a 3.2 °C increase in leaf temperature that occurred long before visible symptoms appeared. In our study, a correlation of R2 = 0.76 at high significance level (p ≤ 0.001) was found between disease severity and MTD. Since the pathogen attack alters plant metabolic activities and stomatal conductance, the sensitivity of leaf temperature to leaf transpiration is high and can be used to monitor irregularities in temperature at an early stage of pathogen development.

1. Introduction

When plants are attacked by pathogens, several changes occur that alter the interaction between the environment and vegetation, and, consequently, leaf reflection and surface temperature, leading to suboptimal growth [1]. Most of the widely planted grapevine (Vitis vinifera L.) cultivars are susceptible to downy mildew caused by Plasmopara viticola. It is one of the most serious grapevine diseases affecting both the yield and the quality of wine produced from infected grapes [2]. The infection process by P. viticola can be divided into three distinct phases: germination, penetration, and colonization. In spring, when the topsoil is moist and warm enough, the oospores will form macrosporangia, which can release up to 200 zoospores into free water. The zoospores are carried by the wind in water droplets onto the leaves and clusters. They have two flagella and they move on a film of water on the underside of the leaves or the clusters and young berries to find a stoma to penetrate the plant tissue [3]. The penetration of this pathogen occurs via stomata and results in changes in the metabolic processes of plant tissues, including shifts in respiration, photosynthesis, and transpiration [4]. The minimum temperature for pathogen growth is 9–10 °C, while temperatures higher than 34–35 °C inhibit their growth [5].
Leaf wetness duration (LWD) can be defined as the presence of free water on the plant surface [6]. Under field conditions, LWD may be caused by rain, dew, fog, and irrigation. Though LWD is strongly related with the development and outbreak of downy mildew, it is a difficult variable to measure in weather stations [7]. It varies not only with weather conditions but also with the type of crops, leaves angle, development stage, and position of the sensor [8].
Remote sensing has been used to monitor crop growth, to identify suitable crop cultivation locations [9], and to detect a range of diseases in different crops. Precise evaluation of plant disease incidence and severity is important for the crop production and precision agriculture. In previous studies, high spatial and spectral resolution techniques such as multi-spectral and thermal imaging in the visible and near infrared regions have shown promising results [10,11]. Thermal imaging monitors temperature distribution at the plant level. It has been applied to many different agricultural activities such as site-specific crop management and precision farming [12]. The energy budget of a plant and thus its temperature is dependent on environmental factors, and sunlight and water are the main factors. Plants limit transpiration by regulating the stomatal aperture in leaves, optimizing the assimilation of CO2 while limiting the loss of water. Applications of infrared imaging to assess water stress in the field has been well studied [13]. Similarly, infrared imaging can be used for rapid visualization of physiological changes in stomata following infection with pathogens. It has been reported that certain pathogens can modify the stomatal behavior of the host plants [14]. For example, Yang et al. [15] used infrared imaging to detect leaf blight in tea plants and developed a fast disease detection algorithm. Similarly, Oerke et al. [16] detected downy mildew on cucumber leaves using infrared imaging. Since the pathogen changes the metabolic processes within the cucumber leaves including transpiration rate, leaf temperature differences between infected and healthy leaves can be identified. Xu et al. [17] found that the temperature of leaves infected with tobacco mosaic virus strain-TMV-U1 was about 0.5–1.3 °C lower than that of healthy leaves in different tomato cultivars using digital infrared thermal imaging combined with microscopic observations. In addition, Stoll et al. [18] applied thermography to detect P. viticola before visible symptoms occur under different water status regimes. The analysis of thermal images showed differing effects of temperature on well-irrigated and water-stressed plants. In irrigated vines, pathogen development caused an increase in leaf temperature at the point of infection. In contrast, under severe water stress, the inoculated plants showed a lower temperature at the sites of inoculation compared to the rest of the leaf. Therefore, different pathogens affect plant transpiration in different ways, causing stomata either to close or to open in relation to the weather conditions. Little work has been done to evaluate the effect of measurement side, i.e., sunlit and shaded canopy, and to determine its effect on leaf transpiration and leaf temperature.
The economic cost of controlling downy mildew is significant when considering both fungicide and distribution costs. In addition, there is a need to understand host–pathogen interactions, in order to evaluate appropriate disease management strategies at present and under future climate change. Since viticulture is an important agricultural activity in Germany, there is a scope to develop an innovative method for quantitative and qualitative analyses of the symptoms using sensors and optical imagery method. Therefore, the main objective of this research was to evaluate the use of high-resolution thermal imagery and physiological indices as an indicator of P. viticola infection in grapevine. Though LWD is extremely significant for pest management, environmental protection and use in weather-based disease forecasting models, little work has been carried out under field conditions to investigate its relevance to disease severity. The present study was undertaken to understand the effect of leaf wetness duration and temperature on the development of downy mildew in grapevine.

2. Materials and Methods

2.1. Site Description

The experiment took place at the experimental vineyard of the University of Hohenheim (48°42′37.1″ N 9°12′45.6″ E), Germany. The examined vines were 33-year-old Pinot Meunier grafted on SO4. The experimental plot was 250 m2 and consisted of 4 rows with 25 plants per row in north–south direction. Figure 1 shows the experimental plot and in addition, exemplarily the placements of the sensors. Sensors were hung at 4 different locations in the experimental plot.
Infrared images were taken of each row such that 1 m2 of area could be captured with the camera. This area was marked with tape and the infrared images were taken within this frame. It was noted every time infrared images of the marked area were taken. In addition, ten leaves each on the sunlit and shaded side of the canopy were marked with red tape and infrared images of single leaves were taken. No irrigation was applied throughout the experimental period, as precipitation was sufficient to meet the crop water requirements.

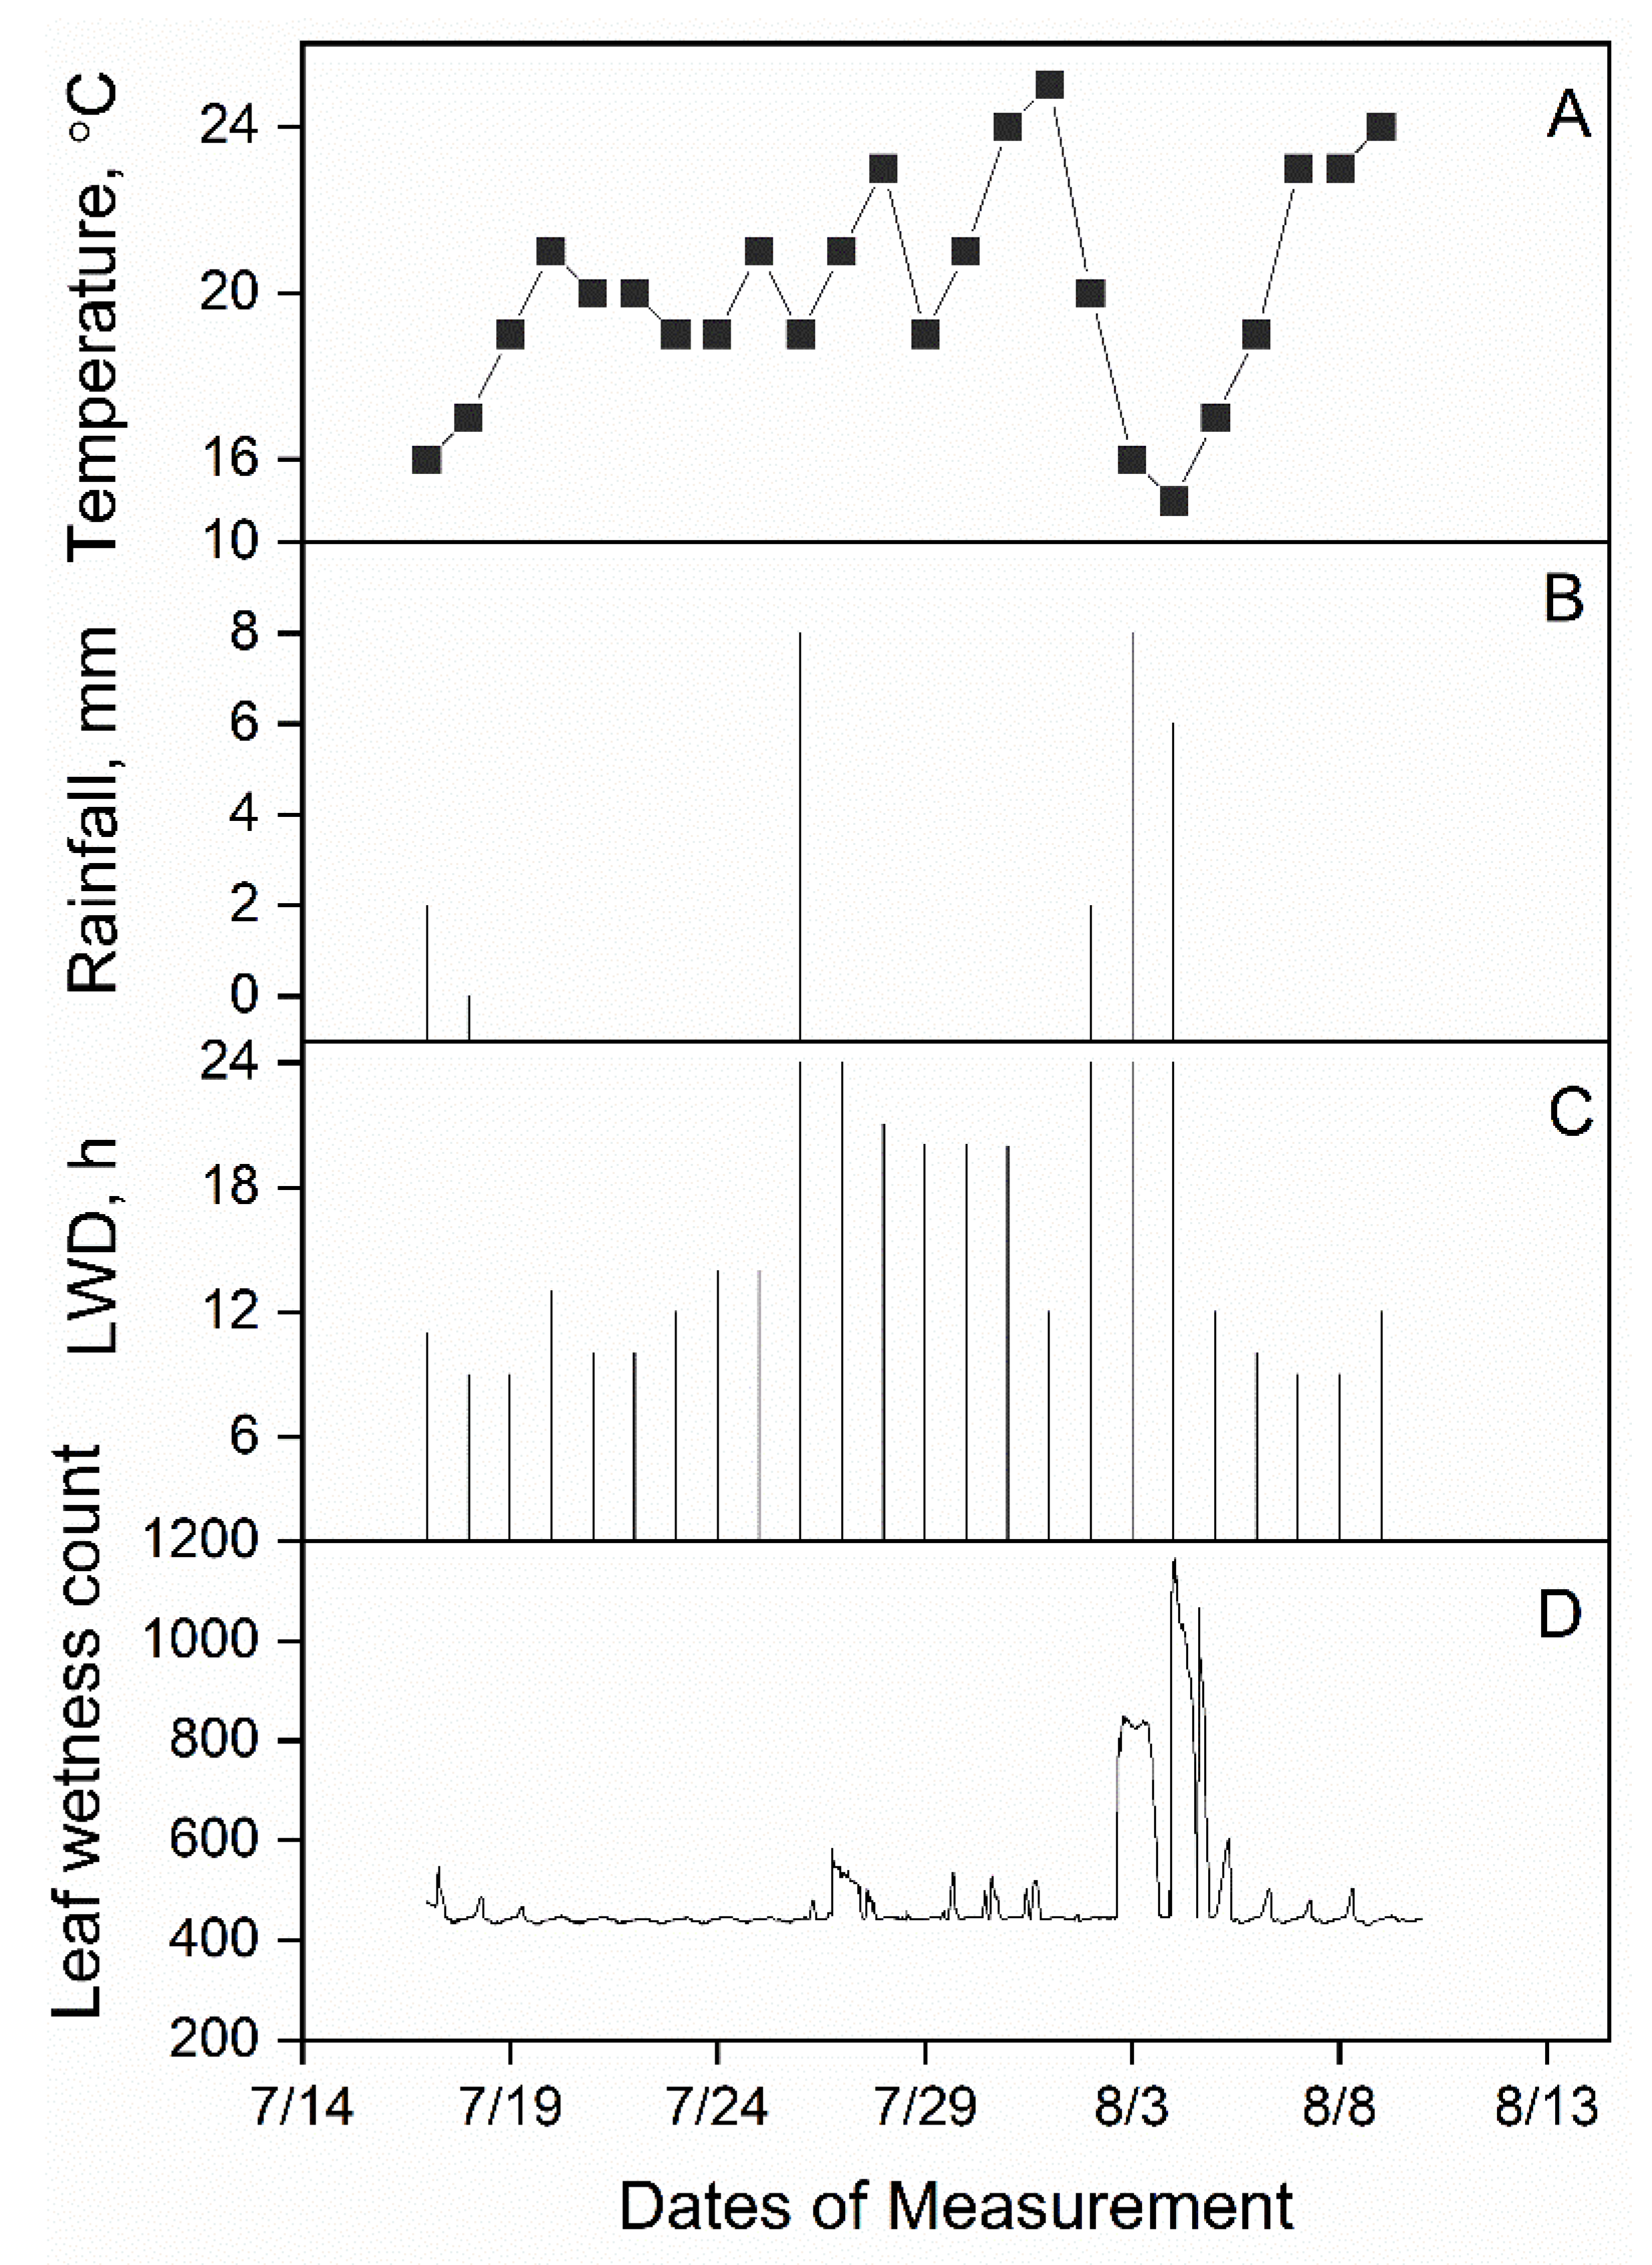
2.2. Meteorological Measurements

Micro-climate data in the canopy such as air temperature and relative humidity were measured and recorded by micro data loggers (Testo 174H, Testo, Titisee-Neustadt, Germany). Leaf wetness was measured by a resistance grid sensor (PHYTOS 31, Meter Group, Munich, Germany). When dry, the sensor gave approximately 435 leaf wetness counts, whereas when the sensor was totally wet, as in rain, the signal increased to around 1100 counts. Therefore, counts above 435 were converted to leaf wetness duration (LWD) by data processing. All the sensors were placed at a height of 1.3 m from the ground and data was logged at 10 min intervals. If there was a conflict in leaf wetness sensor output, a period was considered wet if the mean relative humidity measured by probes was above the threshold of 85% [19]. Weather data were taken from the weather station installed 75 m away from the experimental field.

2.3. Visual Disease Monitoring

To compare the measured disease level, the plots were manually monitored every third day of the experiment (DOE) from the beginning until the end. The canopy was monitored by visually inspecting every vine from the east and west directions based on the individual leaves at different heights. The percentage of the infested leaf area was recorded as disease level in %.

2.4. Thermographic Measurements

An infrared camera (VarioCAM®, InfraTec GmbH, Dresden, Germany) was used for thermal imagining. Images were acquired from July 22 until September 8, 2020. Images were taken only on sunny days when the transpiration rate of the crop was high. Each thermal image comprised an area of about 1 m2 as shown exemplarily in Figure 2A,B. The thermal images were analyzed using thermography software IRBIS (InfraTec GmbH, Dresden, Germany), and the chosen value for emissivity was 0.95. To differentiate between canopy and soil surface, an upper temperature threshold was defined and pixels with higher temperature were excluded by image processing. In Figure 2B, three polygons (R1, R2, and R3) were manually drawn along the canopy area and their temperature profiles were presented in Figure 2C,D, which shows the temperature histogram.
The average canopy temperature ACT was calculated as [20]:
ACT =   T P i x e l n P i x e l
where Tpixel is the temperature of a pixel in the infrared image and n is the number of pixels in the chosen polygon.
The maximum temperature difference (MTD) within the canopy polygon was calculated as:
MTD = T P i x e l ,   m a x T P i x e l ,   m i n
The canopy temperature difference (CTD) was defined as:
CTD = T a i r ACT
where air temperature Tair was measured by the weather station.

2.5. Data Analysis

All analysis was conducted using Origin version 2019 to evaluate the effect of downy mildew on ACT, MTD, and CTD. Data were analyzed by standard analysis of variance (ANOVA) to evaluate the effect of P. viticola on ACT, MTD, and CTD at a least significant level of 0.05. A Pearson regression analysis was performed between disease level and ACT, MTD, and CTD.

3. Results

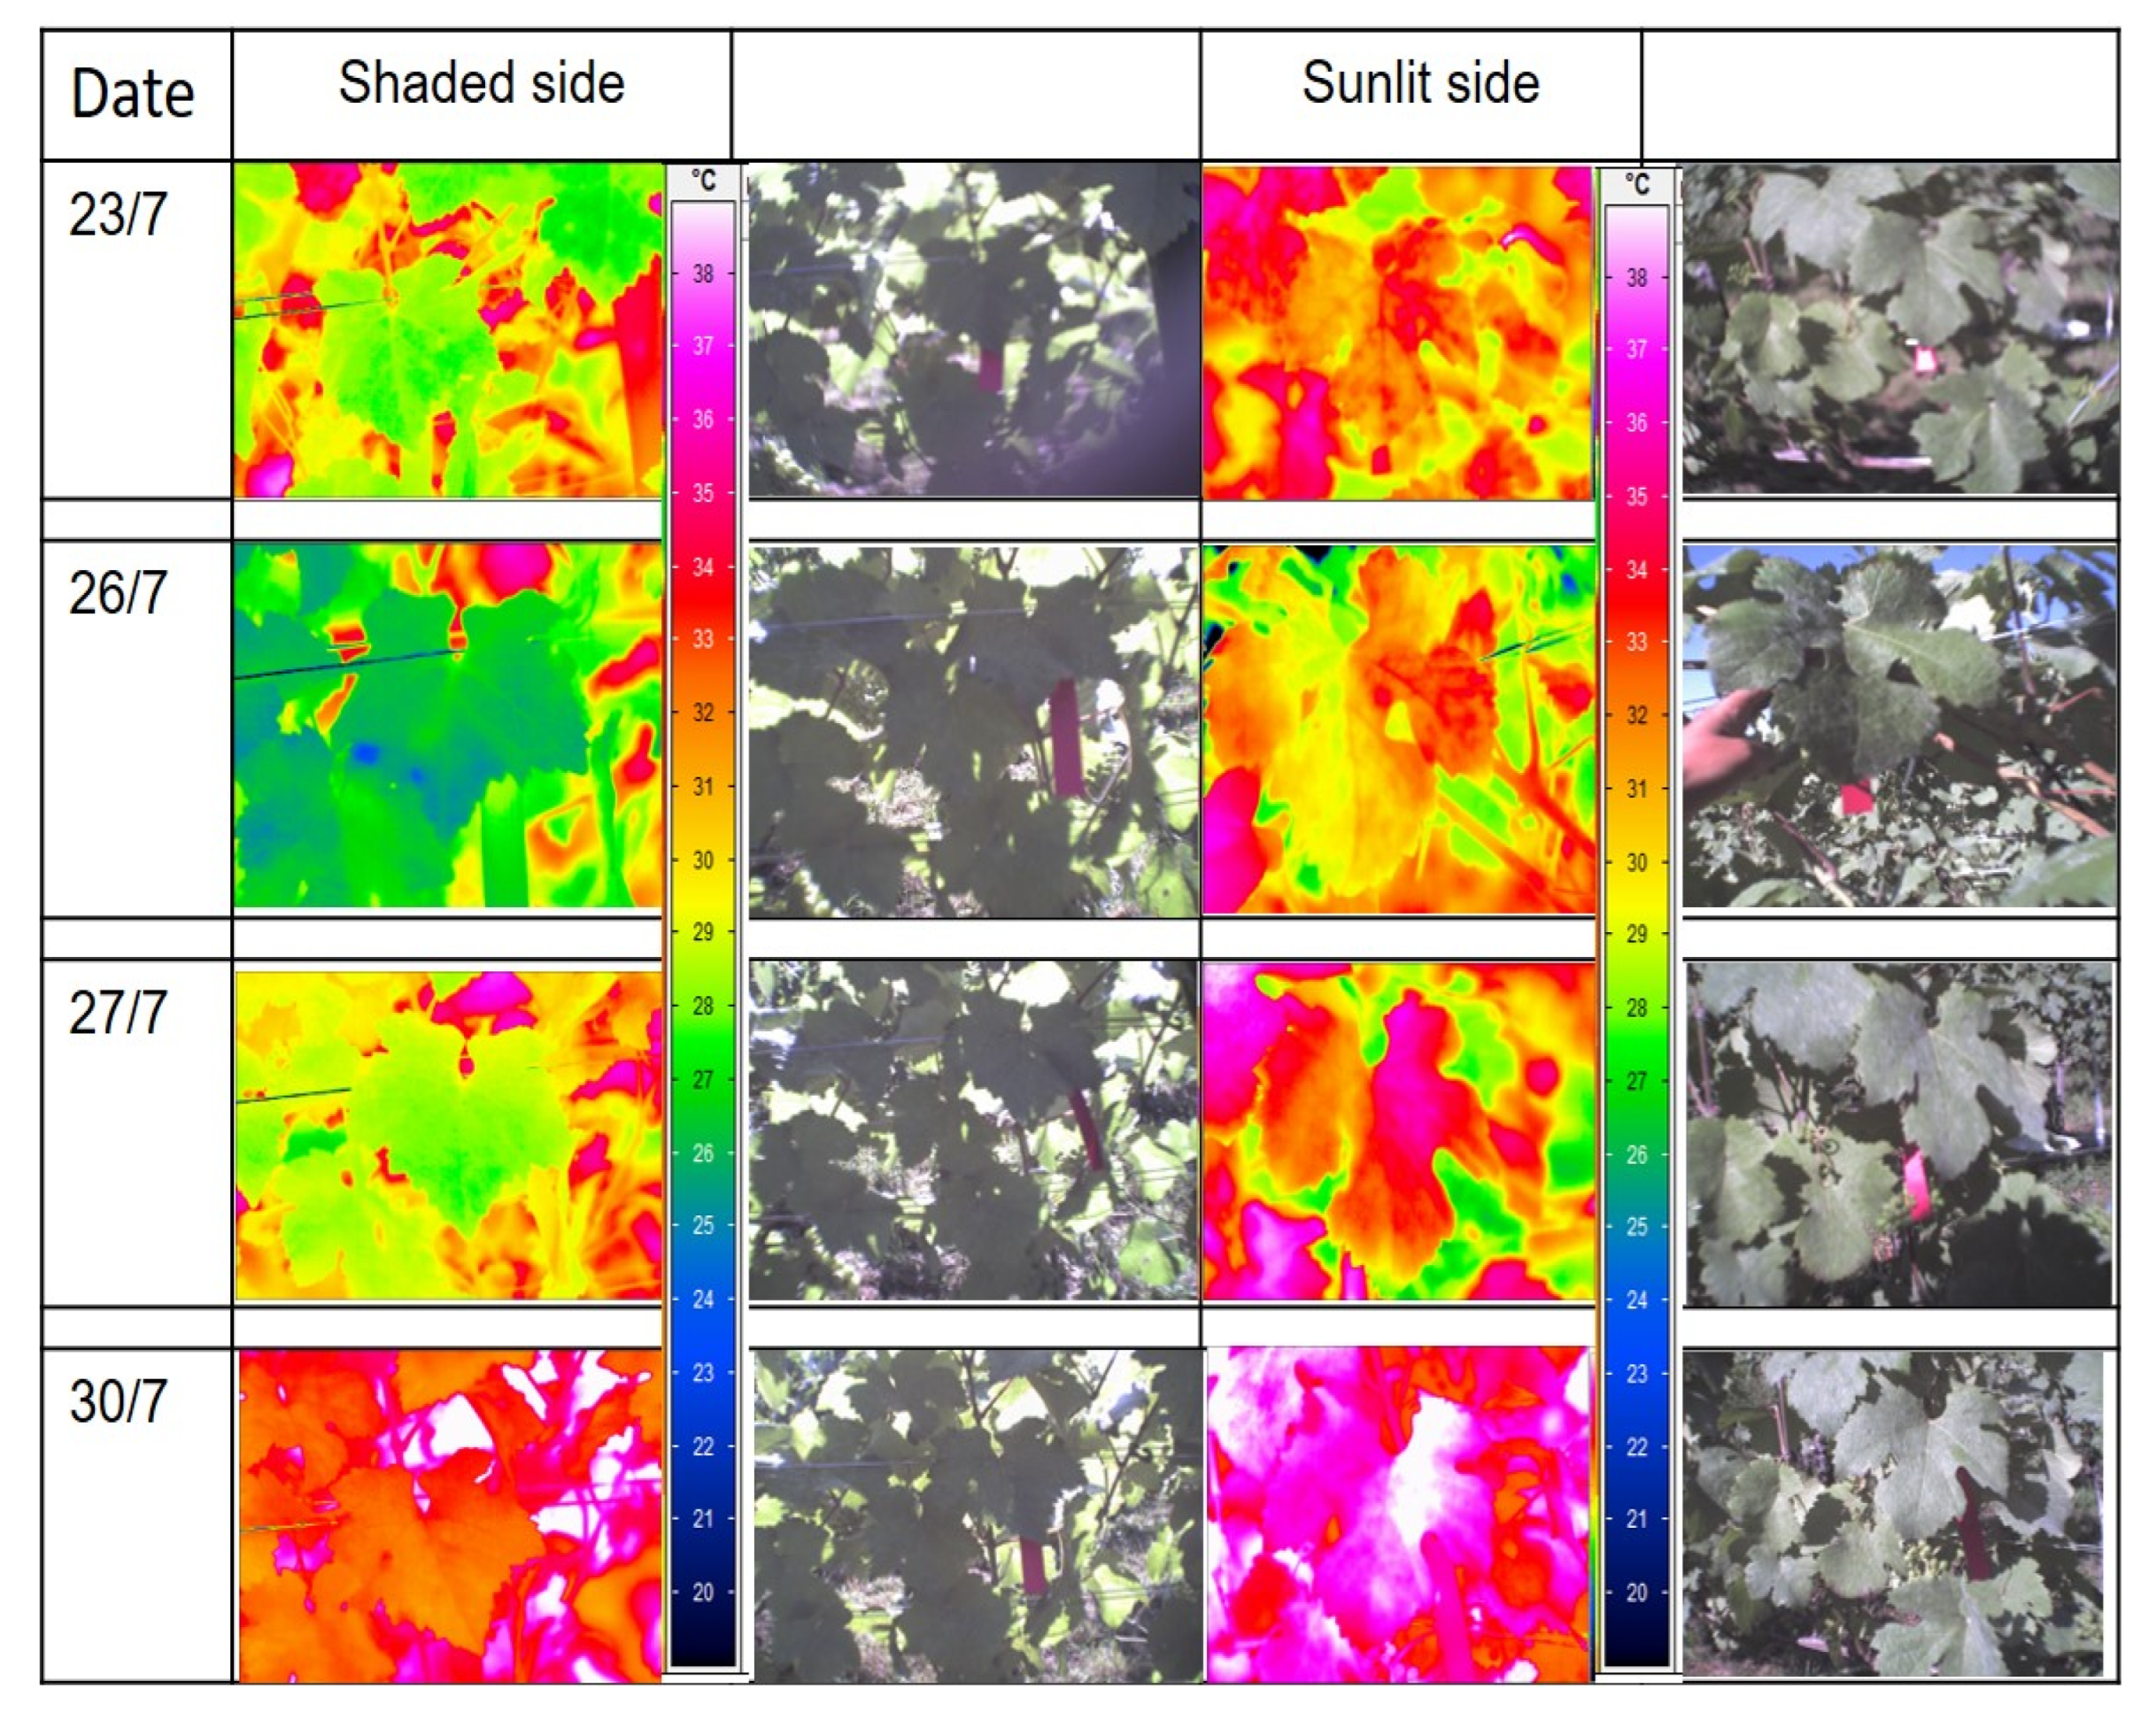
3.1. Sunlit Versus Shaded Leaves

We distinguished between sunlit and shaded sides of the canopy because within the canopy there is a still the possibility of shaded leaves existing on the sunlit side of the vines, and vice versa. The MTD and CTD of the shaded and sunlit leaves are shown in Figure 3. MTD of the sunlit leaves was higher than the shaded leaves throughout the experimental days, which was highly significant (p ≤ 0.001). It can be noted that considering only the shaded side can be misleading as it does not vary much and it only responded when the disease severity was high. The difference between shaded and sunlit leaves in CTD was significant (p ≤ 0.001). CTD of the sun-shaded side was always above zero; it decreased in both sunlit and sun-shaded leaves during the last days of the measurements.
The difference between minimum and maximum temperature variations in the shaded leaves was smaller when compared to the sunlit leaves, which was already shown in an earlier study [21]. Our results support the findings of Fuchs [22] that there is an increase in temperature variation as stomata closes; indeed, there is a clear trend of temperature greater in the sunlit leaves than in the shaded. A decrease in CTD and an increase in MTD were observed by the end of the experiment or as the disease level increased, irrespective of the canopy sides, caused due to reduction in the photosynthetic activity. Figure 4 shows the thermal and real images taken for the sunlit and shaded sides of the leaves. The minimum temperature of 20 °C (blue color) was observed in the shaded side, whereas the maximum temperature of 38 °C (white) was monitored in the sunlit side of the canopy at the end of the experiment.

3.2. Downy Mildew Development

In the experimental plot, the first symptoms of downy mildew appeared in the grapevines at the end of July (Figure 5B), reaching a disease incidence of 30–40% after a month without spraying fungicide. Affected plants showed typical downy mildew symptoms indicative of systemic infection by oospores. At the beginning of August, small chlorotic to light-yellow leaf lesions with sporulation on the abaxial surface were observed as shown in Figure 5C. Once the downy mildew symptoms became clear to the naked eye, all the measurements were stopped. Although the measurements were stopped, chlorosis, curling, and deformation of the leaves as well as small, hard, and purple fruit was observed on the standing crop in September. It is important to note that the air temperature during the measurement period was between 20 and 24 °C except on rainy days, and the relative humidity was in the range of 50–85%.
LWD during the entire measurement period was between 9 and 24 h, i.e., on the rainy day, LWD was 24 h. There was longer wetness duration at the night-time than during the day, which is due to the presence of dew. During the first nine days of measurement, LWD was between 9 and 14 h and afterwards, for almost ten days, it remained very wet with LWD values of 24 h. However, at the end of the experiment, LWD decreased again to 9–12 h. Additionally, it can be seen that the air temperature in the beginning was below 20 °C, and toward the end of the experiment it rose to 25 °C, though in between, there were 3 days where the temperature dropped (less than 20 °C) due to the rainfall event. Alternative wetting and drying periods, together with the optimal infestation air temperature range of 20–25 °C, resulted in the outbreak of the disease during the last days of the experiment.
Similar results were reported by Pande et al. [23], who found that all groundnut genotypes studied followed a similar trend with maximum disease development at a leaf wetness duration of 16 h, air temperature in the range of 20 °C to 25 °C, and high RH. There were six rainfall events that took place, increasing the leaf wetness counts to over 900 as shown in Figure 6. In the present study, no irrigation took place during the measurement. Therefore, we assumed that rainfall and/or long wet periods of 3 consecutive days in the beginning of August with optimal air temperature range of 16–25 °C are the major factors for infection. Additionally, Jhorar et al. [24] also reported that LWD of 18 h to 24 h would increase the disease severity on chickpea. However, Morales et al. [25] concluded that the air temperature had a greater effect than LWD on the disease severity. He further mentioned that LWD longer than 10 h at temperatures close to 20 °C was necessary to cause high disease severity.

3.3. Disease Level and Temperature Effects

Figure 7 shows the crop parameters throughout the experiment. ACT had the increasing trend except on August 4 which was due to a sudden steep drop in air temperature; however, later it continued rising until the end of the experiment.
A temperature rise of 3.2 °C was observed on the last day of measurement when compared with the canopy temperature at the start of the experiment. The increase in canopy temperature is assumed to be due to the penetration of P. viticola which has occurred via stomata, thereby affecting photosynthesis and transpiration changes [26]. There are different research findings in terms of stomatal conductance. For example, Chaerle et al. [27] concluded that some plant–pathogen interactions resulted in a reduction in transpiration because of stomatal closure. In other cases, infection results in an increase in transpiration, which might be due to the increase in the permeability of plasma membranes or opening of stomata [28]. Additionally, Wang et al. [20] reported a decrease in the transpiration rate upon pathogen attack on wheat, whereas Lindenthal et al. [14] reported an increase in transpiration rate at the early stage of pathogenesis. At the start of the experiment, CTD showed a increasing trend, but after two weeks of observations it decreased and reached its minimum value on the last day of the measurement. MTD shows a decreasing trend throughout the experiment. It was interesting to observe a significant difference in CTD and MTD within the week of experiment. Similar results were reported by Robert et al. [29], where the chlorotic symptoms of Zymoseptoria tritici on the flag leaves of what were found from 10 days after inoculation and 15 days after inoculation on the second leaves. A decrease in CTD followed as the disease level increased during the last days of the measurement, which was caused by the reduction in the photosynthetic activity. A similar result was also reported by Rosyara et al. [30] who stated that spot blotch caused by Cochliobolus sativus on wheat would result in a decrease in CTD, which is due to the reduction in photosynthetic activity in infected plants whose green area is smaller than that of healthy leaves.
In our study, a correlation of R2 = 0.76 at high significance level (p ≤ 0.001) as shown in Figure 8 was found between disease severity and MTD. However, a poor and not significant correlation was observed between disease severity, ACT, and CTD. Oerke et al. [16] also found a strong correlation of R2 = 0.8 between MTD and disease level in cucumber. Apart from MTD, where the correlation between disease severity was R2 = 0.6, Wang et al. [20] found that CTD parameter can also be used to evaluate the disease level in wheat.

4. Conclusions

Based on the results obtained under the field experimental conditions, two main conclusion can be drawn. First, the causal agent of downy mildew of grapevine requires mild temperature below 20 °C to develop, and an alternative pattern of long periods of leaf wetness duration and drying together with the optimal temperature in the range of 20–25 °C will increase the disease severity. Second, since pathogen infestation alters plant metabolic activities, especially leaf transpiration rate, infrared imaging technique can be used to monitor the early onset of the pathogen. In this study, a 3.2 °C increase in canopy temperature was evident well before visible symptoms appeared. However, only MTD parameter was significantly related (R2 = 0.76) to the disease level, and therefore, it can be used to forecast the commencement of fungal disease in grapevine. Therefore, infrared imagery, if and when applied, can accelerate the plant disease screening process. However, further study is required to investigate the influence of the sun direction on the disease development with reference to the micro-climatic conditions.
The project “Prognose und Detektion von Pilzerkrankungen im Weinbau durch feinmaschige Messung des Mikroklimas und Einsatz bildgebender Messverfahren (FungiSens)” (FKZ 281B200516) is supported by funds of the Federal Ministry of Food and Agriculture (BMEL) based on a decision of the Parliament of the Federal Republic of Germany via the Federal Office for Agriculture and Food (BLE) under the innovation support program.

Author Contributions

Conceptualization, S.Z.-K. and M.K. methodology, S.Z.-K.; software, S.Z.-K.; investigation, S.Z.-K., M.K. and N.M.; resources, J.M. and S.S.; data curation, S.Z.-K. and M.K.; writing—original draft preparation, S.Z.-K. and M.K.; writing—review and editing, J.M. and N.M.; supervision, J.M.; project administration, S.S.; funding acquisition, J.M. and S.S. All authors have read and agreed to the published version of the manuscript.

Funding

The project “Prognose und Detektion von Pilzerkrankungen im Weinbau durch feinmaschige Messung des Mikroklimas und Einsatz bildgebender Messverfahren (FungiSens)” (FKZ 281B200516) is supported by funds of the Federal Ministry of Food and Agriculture (BMEL) based on a decision of the Parliament of the Federal Republic of Germany via the Federal Office for Agriculture and Food (BLE) under the innovation support program.

Institutional Review Board Statement

Not applicable.

Informed Consent Statement

Not applicable.

Data Availability Statement

Not applicable.

Conflicts of Interest

The authors declare no conflict of interest.

References

  1. Junges, A.H.; Ducati, J.R.; Lampugnani, C.S.; Kurtz, M.A.A. Detection of grapevine leaf stripe disease symptoms by hyperspectral sensor. Phytopathol. Mediterr. 2018, 57, 399–406. [Google Scholar]
  2. Boso, S.; KAssemeyer, H.H. Different susuceptibility of European grapevine cultivars for downy mildew. Vitis 2008, 1, 39–49. [Google Scholar]
  3. Allègre, M.; Daire, X.; Héloir, M.-C.; Trouvelot, S.; Mercier, L.; Adrian, M.; Pugin, A. Stomatal deregulation in Plasmopara viticola-infected grapevine leaves. New Phytol. 2006, 173, 832–840. [Google Scholar] [CrossRef] [PubMed]
  4. Calderón, R.; Montes-Borrego, M.; Landa, B.B.; Navas-Corté, J.A.; Zarco-Tejada, P.J. Detection of downy mildew of opium poppy using high-resolution multi-spectral and thermal imagery acquired with an unmanned aerial vehicle. Precis. Agric. 2014, 15, 639–661. [Google Scholar] [CrossRef]
  5. Francesca, S.; Simona, G.; Nicola, T.F.; Andrea, R.; Vittorio, R.; Federico, S.; Cynthia, R.; Lodovica, G.M. Downy mildew (Plasmopara viticola) epidemics on grapevine under climate change. Glob. Change Biol. 2006, 12, 1299–1307. [Google Scholar] [CrossRef]
  6. Beruski, C.G.; Gleason, L.M.; Sentelahas, C.P.; Pereira, B.A. Leaf wetness duration estimation and its influence on a soybean rust warning system. Australas. Plant Pathol. 2019, 48, 395–408. [Google Scholar] [CrossRef]
  7. Gleason, M.L.; Duttweiler, K.B.; Batzer, J.C.; Taylor, S.E.; Sentelhas, P.C.; Monteiro, J.E.B.A.; Gillespie, T.J. Obtaining weather data for input to crop disease-warning systems: Leaf wetness duration as a case study. Sci. Agric. (Piracicaba Braz.) 2008, 65, 76–87. [Google Scholar] [CrossRef] [Green Version]
  8. Dalla Marta, A.; Di Stefano, B.; Cerovic, Z.G.; Agati, G.; Orlandini, S. Solar radiation affects grapevine susceptibility to Plasmopara Viticola. Sci. Agric. (Piracicaba Braz.) 2008, 65, 65–70. [Google Scholar] [CrossRef] [Green Version]
  9. Zamani, A.; Sharifi, A.; Felegari, S.; Tariq, A.; Zhao, N. AgroClimatic Zoning of Saffron Culture in Miyaneh City by Using WLC Method and Remote Sensing Data. Agriculture 2022, 12, 118. [Google Scholar] [CrossRef]
  10. Singh, V.; Sharma, N.; Singh, S. A review of imaging techniques for plant disease detection. Artif. Intell. Agric 2020, 4, 229–242. [Google Scholar] [CrossRef]
  11. Thomas, S.; Kuska, T.M.; Behnenkamp, D.; Brugger, A.; Alisaac, E.; Wahabzada, M.; Behmann, J.; Mahlein, A.-K. Benefits of hyperspectral imaging for plant disease detcetion and plant protection: Atechnical perspective. J. Plant Dis. 2018, 125, 5–20. [Google Scholar] [CrossRef]
  12. Ishimwe, R.; Abutaleb, K.; Ahmed, F. Application of thermal imaging in agriculture—A review. Adv. Remote Sens. 2014, 3, 128–140. [Google Scholar] [CrossRef] [Green Version]
  13. Jones, H.G.; Stoll, M.; Santos, T.; De Sousa, C.; Chaves, M.M.; Grant, O.M. Use of infrared thermography for monitoring stomatal closure in the field: Application to grapevine. J. Exp. Bot. 2002, 53, 2249–2260. [Google Scholar] [CrossRef] [PubMed]
  14. Lindenthal, M.; Steiner, U.; Dehne, H.W.; Oerke, E.C. Effect of downy mildew development on transpiration of cucumber leaves visualized by digital infrared thermography. Phytopathology 2005, 95, 233–240. [Google Scholar] [CrossRef] [Green Version]
  15. Yang, N.; Yuan, M.; Wang, P.; Zhang, R.; Sun, J.; Mao, H. Tea disease detection based on fast infrared thermal image processing technology. J. Sci. Food Agric. 2019, 99, 3459–3466. [Google Scholar] [CrossRef]
  16. Oerke, E.-C.; Herzog, K.; Toepfer, R. Hyperspectral phenotyping of the reaction of grapevine genotypes to Plasmopara viticola. J. Exp. Bot. 2016, 67, 5529–5543. [Google Scholar] [CrossRef] [Green Version]
  17. Xu, H.; Zhu, S.; Ying, Y.; Jiang, H. Early detection of plant disease using infrared thermal imaging. In Proceedings of the Optics for Natural Resources, Agriculture, and Foods, Boston, MA, USA, 23 October 2006. [Google Scholar]
  18. Stoll, M.; Schultz, H.R.; Berkelmann-Loehnertz, B. Exploring the sensitivity of thermal imaging for Plasmopara viticola pathogen detection in grapevines under different water status. Funct. Plant. Biol. 2008, 35, 281–288. [Google Scholar] [CrossRef]
  19. MacKenzie, J.S.; Peres, A.N. Use of leaf wetness and temperature to time fungicide applications to control anthracnose fruit rot of strawberry in Florida. Plant Dis. 2011, 96, 522–528. [Google Scholar] [CrossRef]
  20. Wang, Y.; Zia-Khan, S.; Owusu-Adu, S.; Miedaner, T.; Müller, J. Early detection of Zymoseptoria tritici in winter wheat by infrared thermography. Agriculture 2019, 9, 139. [Google Scholar] [CrossRef] [Green Version]
  21. Leinonen, I.; Jones, H.G. Combining thermal and visible imagery for estimating canopy temperature and identifying plant stress. J. Exp. Bot. 2004, 55, 1423–1431. [Google Scholar] [CrossRef] [Green Version]
  22. Fuchs, M. Infrared measurement of canopy temperature and detection of plant water stress. Theor. Appl. Climatol. 1990, 42, 253–261. [Google Scholar] [CrossRef]
  23. Pande, S.; Rajesh, T.R.; Rao, K.C.; Kishore, G.K. Effect of temperature and leaf wetness period on the component of resistance of late leaf spot disease in groundnut. Plant Pathol. J. 2004, 20, 67–74. [Google Scholar] [CrossRef]
  24. Jhorar, O.P.; Butler, D.R.; Mathauda, S.S. Effects of leaf wetness duration, relative humidity, light and dark on infection and sporulation by Didymella rabiei on chickpea. Plant Pathol. J. 1998, 47, 586–594. [Google Scholar] [CrossRef] [Green Version]
  25. Morales, G.; Moragrega, C.; Montesino, E.; Llorente, I. Effects of leaf wetness duration and temperature on infection of Prunus by Xanthomonas arboricola pv. Pruni. PLoS ONE 2018, 13, 1–15. [Google Scholar] [CrossRef] [PubMed]
  26. Shtienberg, D. Effect of folia diseases on gas exchange processes: A comparative study. Phytopathology 1992, 82, 760–765. [Google Scholar] [CrossRef]
  27. Chaerle, L.; de Boever, F.; van Montagu, M.; van der Straeten, D. Thermographic visualization of cell death in tobacco and Arabidopsis. Plant Cell Environ. 2001, 24, 15–25. [Google Scholar] [CrossRef]
  28. Smith, R.C.G.; Heritage, A.D.; Stapper, M.; Barrs, H.D. Effect of stripe rust (Puccinia striiformis West.) and irrigation on the yield and foliage temperature of wheat. Field Crops Res. 1986, 14, 39–51. [Google Scholar] [CrossRef]
  29. Robert, C.; Bancal, M.-O.; Lannou, C.; Ney, B. Quantification of the effects of Septoria tritici blotch on wheat leaf gas exchange with respect to lesion age, leaf number, and leaf nitrogen status. J. Exp. Bot. 2006, 57, 225–234. [Google Scholar] [CrossRef] [Green Version]
  30. Rosyara, R.U.; Subedi, S.; Duveiller, E.; Sharma, R.C. The effect of spot blotch and heat stress on variation of canopy temperature depression, chlorophyll fluorescence and chlorophyll content of hexaploid wheat genotypes. Euphytica 2010, 174, 377–390. [Google Scholar] [CrossRef]
Figure 1. Arial picture of an experimental plot (left) and exemplarily the positions of air temperature, relative humidity and leaf wetness sensors at one of the vines (right).
Agriculture 12 00617 g001
Figure 2. Canopy temperature measurement, RGB image (A), thermal image (B), temperature profile (C), and histogram (D).
Agriculture 12 00617 g002
Figure 3. Maximum temperature difference MTD and canopy temperature difference (CTD) of sunlit and shaded leaves on different dates of measurements.
Agriculture 12 00617 g003
Figure 4. Infrared and RGB images of sunlit and shaded leaves during different dates of experiment; evaluated leaves are marked with red tape.
Agriculture 12 00617 g004
Figure 5. Disease development stages from healthy (A) to visible spots (B,C) on the adaxial (left) and abaxial (right) sides of grapevine leaves cv. Pinot Meunier.
Agriculture 12 00617 g005
Figure 6. Average air temperature (A), daily rainfall (B), leaf wetness duration (C), and leaf wetness counts per day (D) during the measurement period.
Agriculture 12 00617 g006
Figure 7. Crop parameters during the experiment (A) average canopy temperature (ACT), (B) maximum temperature difference (MTD), (C) canopy temperature difference (CTD). Same letters i.e., a, b,c are not significantly different (P < 0.001).
Agriculture 12 00617 g007
Figure 8. Regression analyses between disease level and average canopy temperature (ACT), canopy temperature difference (CTD), and maximum temperature difference (MTD).
Agriculture 12 00617 g008
Publisher’s Note: MDPI stays neutral with regard to jurisdictional claims in published maps and institutional affiliations.

