Article

Economic Growth in Six ASEAN Countries: Are Energy, Human Capital and Financial Development Playing Major Roles?

by
Mohammad Mafizur Rahman
1,
Xuan-Binh (Benjamin) Vu
1,2,* and
Son Nghiem
3
1
School of Business, University of Southern Queensland, Darling Heights, QLD 4350, Australia
2
Department of Accounting, Finance and Economics, Griffith University, Brisbane, QLD 4111, Australia
3
Centre for Applied Health Economics, Griffith University, Brisbane, QLD 4111, Australia
*
Author to whom correspondence should be addressed.
Sustainability 2022, 14(8), 4540; https://doi.org/10.3390/su14084540
Submission received: 18 March 2022 / Revised: 4 April 2022 / Accepted: 7 April 2022 / Published: 11 April 2022
(This article belongs to the Special Issue Sustainable Development, Environment, and Health)

Abstract

:
This study aims to investigate whether energy consumption, human capital and financial development played an important role in economic growth using a panel dataset of six ASEAN countries over the period 1995–2017. Various econometric techniques—the cross-sectional dependence, panel unit root, panel cointegration, long-run panel estimates, and panel Granger causality tests—are applied. The results of panel data analyses show that all the selected variables positively contribute to the economic growth of the countries. However, all the six ASEAN countries still rely primarily on physical capital and labour for their economic growth. The findings of country-wise tests indicate that there exists a positive relationship between economic growth and financial development in Cambodia, while human capital positively contributes to the economic growth of Indonesia, Malaysia, the Philippines, Thailand and Vietnam. The causality test exhibits unidirectional causality from energy consumption to economic growth and from economic growth to financial development in both the short and long run. The findings suggest that inclusive development strategies that provide the opportunity for all sectors to grow will result in the desirable three e’s of sustainable economic development: equitable, effective and efficient.
JEL Codes:
C33; G20; J24; O40; O53; Q43

1. Introduction

Economic growth is considered to be one of the key macroeconomic objectives of any country as it helps to reduce unemployment and poverty by creating jobs and increasing income. In cross-country studies, Adams [1] noted that approximately 20–30% of the poverty rate in a country is reduced by a 10% increase in average income. Therefore, rapid and sustainable economic growth is very important, especially for developing countries where unemployment and poverty are high and socio-economic indicators are poor.
South-Eastern Asia is the home of 8.6% of the total world population [2]. Although poverty is not as severe in this region as in Sub-Saharan Africa and South Asia, an estimated 36 million people in the ASEAN (Association of South East Asian Nations) region are still living below the international poverty line. However, extreme poverty has been reduced in the region because of its remarkable economic growth during the era of the Millennium Development Goal from 2000 to 2015 [3]. Indeed, the economic growth rate of ASEAN-10 was approximately 5.1% during the period 2012–2016 [4], which was higher than that of advanced economies (3.2%), the European Union (1.1%), the Middle East (0.7%), North Africa (3.4%), and sub-Saharan Africa (4.7%) during the period 2008–2017.
In addition to the high growth, energy consumption in the ASEAN countries increased significantly compared to that of other regions. For example, during the period 1990–2017, the total and residential energy consumption of ASEAN countries increased by 112% and 52%, while these indicators of the Organization of Economic Co-operation and Development (OECD) countries increased by only 17% and 15%, respectively [5]. Moreover, during this time, the public health expenditure (% of Government expenditure) was almost double in South East Asia compared to that of South Asia [6]. For instance, in 2017, the public health expenditure was 10.4% in South East Asia compared to 5.2% in South Asia [6]. Moreover, financial sector development has been exceptional in the ASEAN region. Indeed, in 2013, the private sector credit (% of GDP) was 36%, 134%, 36%, 121%, 45% and 97% for Indonesia, Malaysia, Philippines, Thailand, Cambodia and Vietnam, respectively. Furthermore, in 2013, the credit growth was 20%, 10%, 16%, 10%, 27% and 13%, respectively, for these countries [7].
A number of previous studies have identified energy use, human capital and financial development as important factors for economic growth; however, no previous studies have investigated the relationship between those variables using a panel data set for ASEAN countries. Therefore, this current study will examine if and to what extent energy consumption, human capital, and financial development have contributed to the success of the economic growth of the ASEAN region.
The main contributions of this research are: (i) this is the first comprehensive study, to the best of our knowledge, that examines the effects of energy consumption, human capital, and financial sector development on the economic growth of six ASEAN countries; (ii) we conducted the necessary diagnostic tests for checking autocorrelation and heteroscedasticity problems as well as the robustness of the long run results using a dynamic ordinary least squares (DOLS) estimator; (iii) we also examined the cross-sectional dependence issue -- one of the main concerns of panel data that researchers usually ignore; (iv) based on our empirical findings, we affirmed the significant role of physical capital, labour inputs and energy consumption in the economic growth of the selected ASEAN countries. In addition, we have initiated discussions on human capital and financial development which should be promoted across each country’s region to have higher impacts on economic growth; (v) finally, inclusive development strategies, which achieve the desirable three e’s of sustainable economic development: equitable, effective and efficient, in the selected ASEAN countries, should be further implemented.
This study will provide crucial inputs for policy-makers to navigate the complex nexus between energy consumption, human capital, financial development, and economic growth, and formulate effective policies for economic development.
Following the introduction, the remaining sections of the paper are structured as follows. Section 2 presents a review of past literature. Section 3 describes the methodology and data. Section 4 reports and analyses the results. Section 5 concludes the paper.

2. Literature Review

The factors that cause economic growth have been explored both theoretically and empirically [8]. Most of the empirical growth studies have been based on neoclassical growth theory and endogenous growth theory [9]. The economic growth theory of Solow [10] stated that physical capital accumulation was the main factor contributing to economic growth in the short run, but technological development played a crucial role in long-run growth. Then, to complement physical capital, the stock of human capital was also considered another vital input for growth.
For determining the growth factors, researchers have used a number of variables in their empirical studies. The notable variables are energy use [11,12,13,14,15], financial development [16,17], international trade [18,19], population growth [13], foreign direct investment [19], government expenditure [20], and human capital [21,22]. In this paper, we will review past studies which are related to our variables of interest. In addition, the past studies will be discussed under the following three sub-sections: economic growth and energy consumption, economic growth and human capital, and economic growth and financial development.

2.1. Economic Growth and Energy Consumption

After the energy crisis in the 1970s, the energy-growth nexus became a prevalent research topic [23]. This nexus can be discussed under four theoretical hypotheses [24,25,26]. These are: (i) growth hypothesis which indicates that energy consumption directly contributes to economic growth; an increase in energy consumption boosts economic activities and outputs, and hence, energy is an important input for output [27,28,29,30,31]. For empirical investigation between energy consumption and economic growth nexus, Kraft and Kraft [32] were the pioneers where energy consumption is considered as an important factor of production, like capital and labour. Following this important study, many subsequent studies were conducted in the literature where energy has been considered as input [23,24,33,34,35,36] (ii) conservative hypothesis, which shows one-way causality from economic growth to energy consumption [37,38,39]; (iii) neutrality hypothesis which postulates that there is no causal link between these two variables [40,41]; and (iv) feedback hypothesis which suggests bidirectional causal links between economic growth and energy consumption [33,42,43,44]. The empirical results to prove these hypotheses are diverse. For example, referring to a recent literature survey of energy-growth nexus on 136 studies, Gozgor, Lau [25] noted that 41% of these studies found the existence of a feedback hypothesis, 21% revealed the validity of the conservative hypothesis, 25% validated the growth hypothesis and 13% concurred with neutrality hypothesis.
In relation to individual studies that used panel data, the positive effect of energy consumption on economic growth is noted by Rahman [13] for 11 populous Asian countries, Rahman, Rana [45] for South Asian countries, Jebli and Youssef [46] for 69 countries, Sadorsky [47] for G7 countries, Gozgor, Lau [25] for OECD countries, and Saidi, Rahman [14] for 53 countries. On the other hand, the existence of a reverse effect (conservative hypothesis) is revealed by the studies of Sadorsky [47] in 18 emerging countries, Lee and Chang [48] in 18 developing countries, and Huang, Hwang [40] in 82 low, middle and high-income countries. The feedback effect, a bidirectional causality, is revealed by Salim and Rafiq [49] in six emerging economies, Apergis and Payne [50] in 13 Eurasian countries, and Apergis and Payne [51] in six Central American countries. A bidirectional causality between non-renewable energy and economic growth is also found by Ohlan [52] in India. However, no significant link between economic growth and energy consumption has been observed by some studies such as those of Menegaki [53] in 27 European countries, Abanda [54] in African countries and Aïssa, Jebli [55] in 11 African countries.

2.2. Economic Growth and Human Capital

Human capital plays an important role in the endogenous growth model [56]. It has a positive externality effect on other factors of production [57]. For this reason, economists are actively using a human capital variable in the growth analysis along with other factors. Different indicators such as education spending per capita, enrolment rate, and health expenditure per capita are used in empirical research to represent human capital variables [22].
Using the literacy rate of 112 countries, Romer [58] conducted a study on economic growth where annual data were considered from 1960 to 1985. The study found a significant positive impact of the literacy rate on economic growth. Altiner and Toktas [21] conducted a study on 32 developing countries where primary, secondary and tertiary enrolment rates were used as indicators of a human capital variable along with capital and labour, and found that human capital had a positive impact on economic growth. A similar positive effect of the education enrolment rate on economic growth was also experienced by the study of Barro [59] for 98 countries, Keller [60] for Asian countries and Yakisik and Cetin [28] for Turkey. In addition, the positive effect of various educational indicators on economic growth was also revealed by the studies of Self and Grabowski [61], Park [62], Permani [63], and Çaliskan, Karabacak [64].
Like education, health is also considered to be an important element of human capital, and investment in health increases labour productivity and overall economic growth and wellbeing of the population [65]. In the literature, a number of researchers in both developed and developing countries have explored a link between health expenditure and economic growth, but the findings are not uniform. For example, the study conducted by Heshmati [66] in OECD countries for the period 1970–1992 found a positive link between economic growth and health expenditure. The positive effect of health expenditure on growth was also observed by the studies of Arısoy, Ünlükaplan [67] and Eryigit, Eryigit [68] in Turkey, Aurangzeb [69] in Pakistan, Bakare and Olubokun [70] in Nigeria, Halıcı-Tülüce, Doğan [71] in 44 high and low-income countries. In contrast, studies such as those of Kar and Taban [72] in Turkey, Ogundipe and Lawal [73] in Nigeria revealed the negative effect of health care expenditure on economic growth. Furthermore, the study of Çetin and Ecevit [74] on 15 OECD countries for the period 1990–2006 found no relationship between economic growth and health expenditure. In contrast, Abdouli and Omri [75] revealed a bidirectional causality between human capital and economic growth in the Mediterranean region, but Karambakuwa, Ncwadi [76] reported negative effects of human capital on economic growth in Sub-Saharan African countries.

2.3. Economic Growth and Financial Development

Two schools of thought have argued differently on the nexus of financial development and economic growth. The first one has argued that financial development is crucial for economic growth [77,78,79] as finance mobilizes savings and investments, allocates resources, diversifies risks and contributes to technological innovation [80,81]. Another school of thought has argued that finance should not be considered a primary source of growth [82].
Empirically, Goldsmith [83] first found a positive link between economic growth and financial development in his study of 35 countries [84]. Subsequently, De Gregorio and Guidotti [85], Levine [79], Darrat [86], Habibullah and Eng [87], Akinlo and Egbetunde [88], Hassan, Sanchez [89], Shahbaz and Rahman [90], Shahbaz and Rahman [91], Rahman, Shahbaz [92], Rahman and Vu [44], and Kumar and Paramanik [93] also found that financial development had a positive effect on economic growth. Anton and Nucu [94] found that financial development contributed to the implementation of green technologies, which in turn promoted economic growth. Zaidi [95] and Chen [96] found the bidirectional causality between economic growth and financial development in the 31 OECD countries and 16 Central and Eastern European countries, respectively. Kondoz, Kirikkaleli [97] and Kirikkaleli and Onyibor [98] found casual links between financial risk and economic risk in South American countries and Southern European countries, respectively. However, contradictory evidence (negative or insignificant effect) of financial development on economic growth also exists in the literature [99,100]. Kar, Nazlıoğlu [101] and Jayaratne and Strahan [102] found no evidence of causality between financial development and economic growth. Federici and Caprioli [103] emphasized that the variation of the relationship between these two variables depends on the level of financial development.
In summary, despite many past studies on the growth factors in the literature, no previous studies have explored the relationship between economic growth, energy consumption, human capital and financial development using a panel data set for ASEAN countries. Furthermore, the results of past studies are inconclusive due to different econometric approaches, variable and data period selections, and model specifications. Therefore, the current paper is carried out to fill up this gap.

3. Methodology

3.1. Empirical Model

The theoretical foundation of our empirical model is based on the neoclassical growth model [10,104], which is presented as follows:
Y i t = A i t F ( K i t , L i t )
where Y is output; K and L are capital and labour used in production, respectively. The term A represents technology. The subscripts i and t represent country and time.
Although energy consumption was not included in the neoclassical growth model/Cobb-Douglas production function, the role of energy consumption as a vital factor in production has gained greater attention in recent years (refer to Section 2.1). Various empirical studies found that energy consumption significantly contributed to economic growth [27,29,30,31]. Therefore, we have extended our above model by including energy consumption (EU) as a production factor as follows:
Y i t = A i t F ( K i t , L i t , E U i t )
Human capital, an endogenous growth factor, also plays an important role in economic growth ([56,105]; also refer to Section 2.2). A number of previous studies used either education spending per capita or enrolment rate, or health expenditure per capita as a proxy for the human capital variable to examine its impacts on economic growth [22]. In our current paper, we used health expenditure per capita as a proxy for human capital due to its data availability. In addition, based on Section 2.3, financial development is another key factor contributing to economic growth [106]. Schumpeter [77], McKinnon [78], and Levine [79] argued that financial development plays an important role in economic growth. Therefore, we included human capital (HC) and financial development (FD) as additional factors of production, and our extended empirical growth model is of the following form:
Y i t = A i t F ( K i t , L i t , E U i t , F D i t , H C i t )
The variables of equation three are transformed into logarithms to obtain direct elasticities, and to mitigate the impact of outliers and the presence of heteroscedasticity. Thus, Equation (3) is re-written as follows:
L n Y i t = α 0 + α i t L n K i t + α i t L n L i t + α i t L n E U i t + α i t L n F D i t + α i t L n H C i t + e i t
where Yit is proxied by real GDP per capita at constant 2010 US$; Kit is proxied by real gross fixed capital formation per capita at constant 2010 US$; Lit is the labour force (people); EUit is energy consumption per capita (kilogram of oil equivalent per capita); FDit is financial development proxied by real domestic credit to private sector per capita at constant 2010 US$; HCit is human capital proxied by real health expenditure per capita (public) at constant 2010 US$; eit is the error term; and i and t denote country and time.

3.2. Econometric Analyses

3.2.1. Cross-Sectional Dependence Test on Panel Data

Cross-sectional dependence can be a concerning issue in panel data, and ignoring it may lead to misleading interpretations [107]. Therefore, we examined cross-sectional dependence using the Pesaran cross-sectional dependence test [108] for the above equations, which is appropriate for our small panel data, before examining the stationarity of our selected variables. The null hypothesis assumes that eit is independent and identically distributed over periods and across cross-sectional units. Under the alternative hypothesis, eit may be correlated across cross-sections, but the assumption of no serial correlation remains.

3.2.2. Panel Unit Root Tests

As the cross-sectional dependence is not an issue in our panel data (see Section 4.1), we use the first-generation panel unit root tests, which do not allow cross-sectional dependence, including the common unit root tests by Levin, Lin [109] and Breitung [110] and individual unit root tests by Im, Pesaran [111] and Maddala and Wu [112]. Breitung [110] approach holds higher power and the smallest size of distortions amongst the panel unit root tests, while the techniques applied by Im, Pesaran [111] and Maddala and Wu [112] allow heterogeneity between panel members [113]. The second-generation panel unit root tests proposed by Pesaran [114], which eliminate the cross-sectional dependence, are not applied for our analysis due to the nature of our data.

3.2.3. Panel Cointegration Test

If the variables of interest are integrated into the same order, we use the first-generation cointegration tests developed by Pedroni [115] and Pedroni [116]. These cointegration tests are appropriate as our panel data do not have the issue of cross-sectional dependence. Pedroni [115] and Pedroni [116] suggested four tests using the within dimensions, and three tests using the between dimensions. The tests are asymptotically distributed due to standard normal and examine the null hypothesis of no cointegration. We also used the approach of Kao [117], which considers a homogeneous cointegration association by allowing heterogeneity in intercept and removing the trend, to test the null hypothesis of no cointegration. Westerlund [118] developed the second-generation panel cointegration test, which takes cross-sectional dependence into account; however, the approach of Westerlund [118] is not applied to our analyses because of the nature of our data.

3.2.4. Panel Long-Run Estimates

Pedroni [119] suggested that if the variables of interest are cointegrated, the Panel Ordinary Least Squares (POLS) approach is biased. Therefore, the Panel Fully Modified Ordinary Least Squares (PFMOLS) can be employed to estimate the long-run relationships between the variables of interest. The reason for the use of the panel FMOLS method is that it corrects for endogeneity and serial correlation issues [120], and the technique is most suited to the existence of cointegrated panels [121]. Kao and Chiang [122] indicated that the Panel Dynamic Ordinary Least Squares (PDOLS) is more relevant than POLS, and PFMOLS due to its smaller size distortions and more precise inferences. Pesaran [123] and Pesaran [124] developed the common correlation effect mean group (CCEMG) estimator, which allows the cross-sectional dependency to calculate the long-run relationships between variables. However, his techniques are not applied to our analyses because our data do not face the cross-sectional dependence issue.

3.2.5. Panel Causality Test
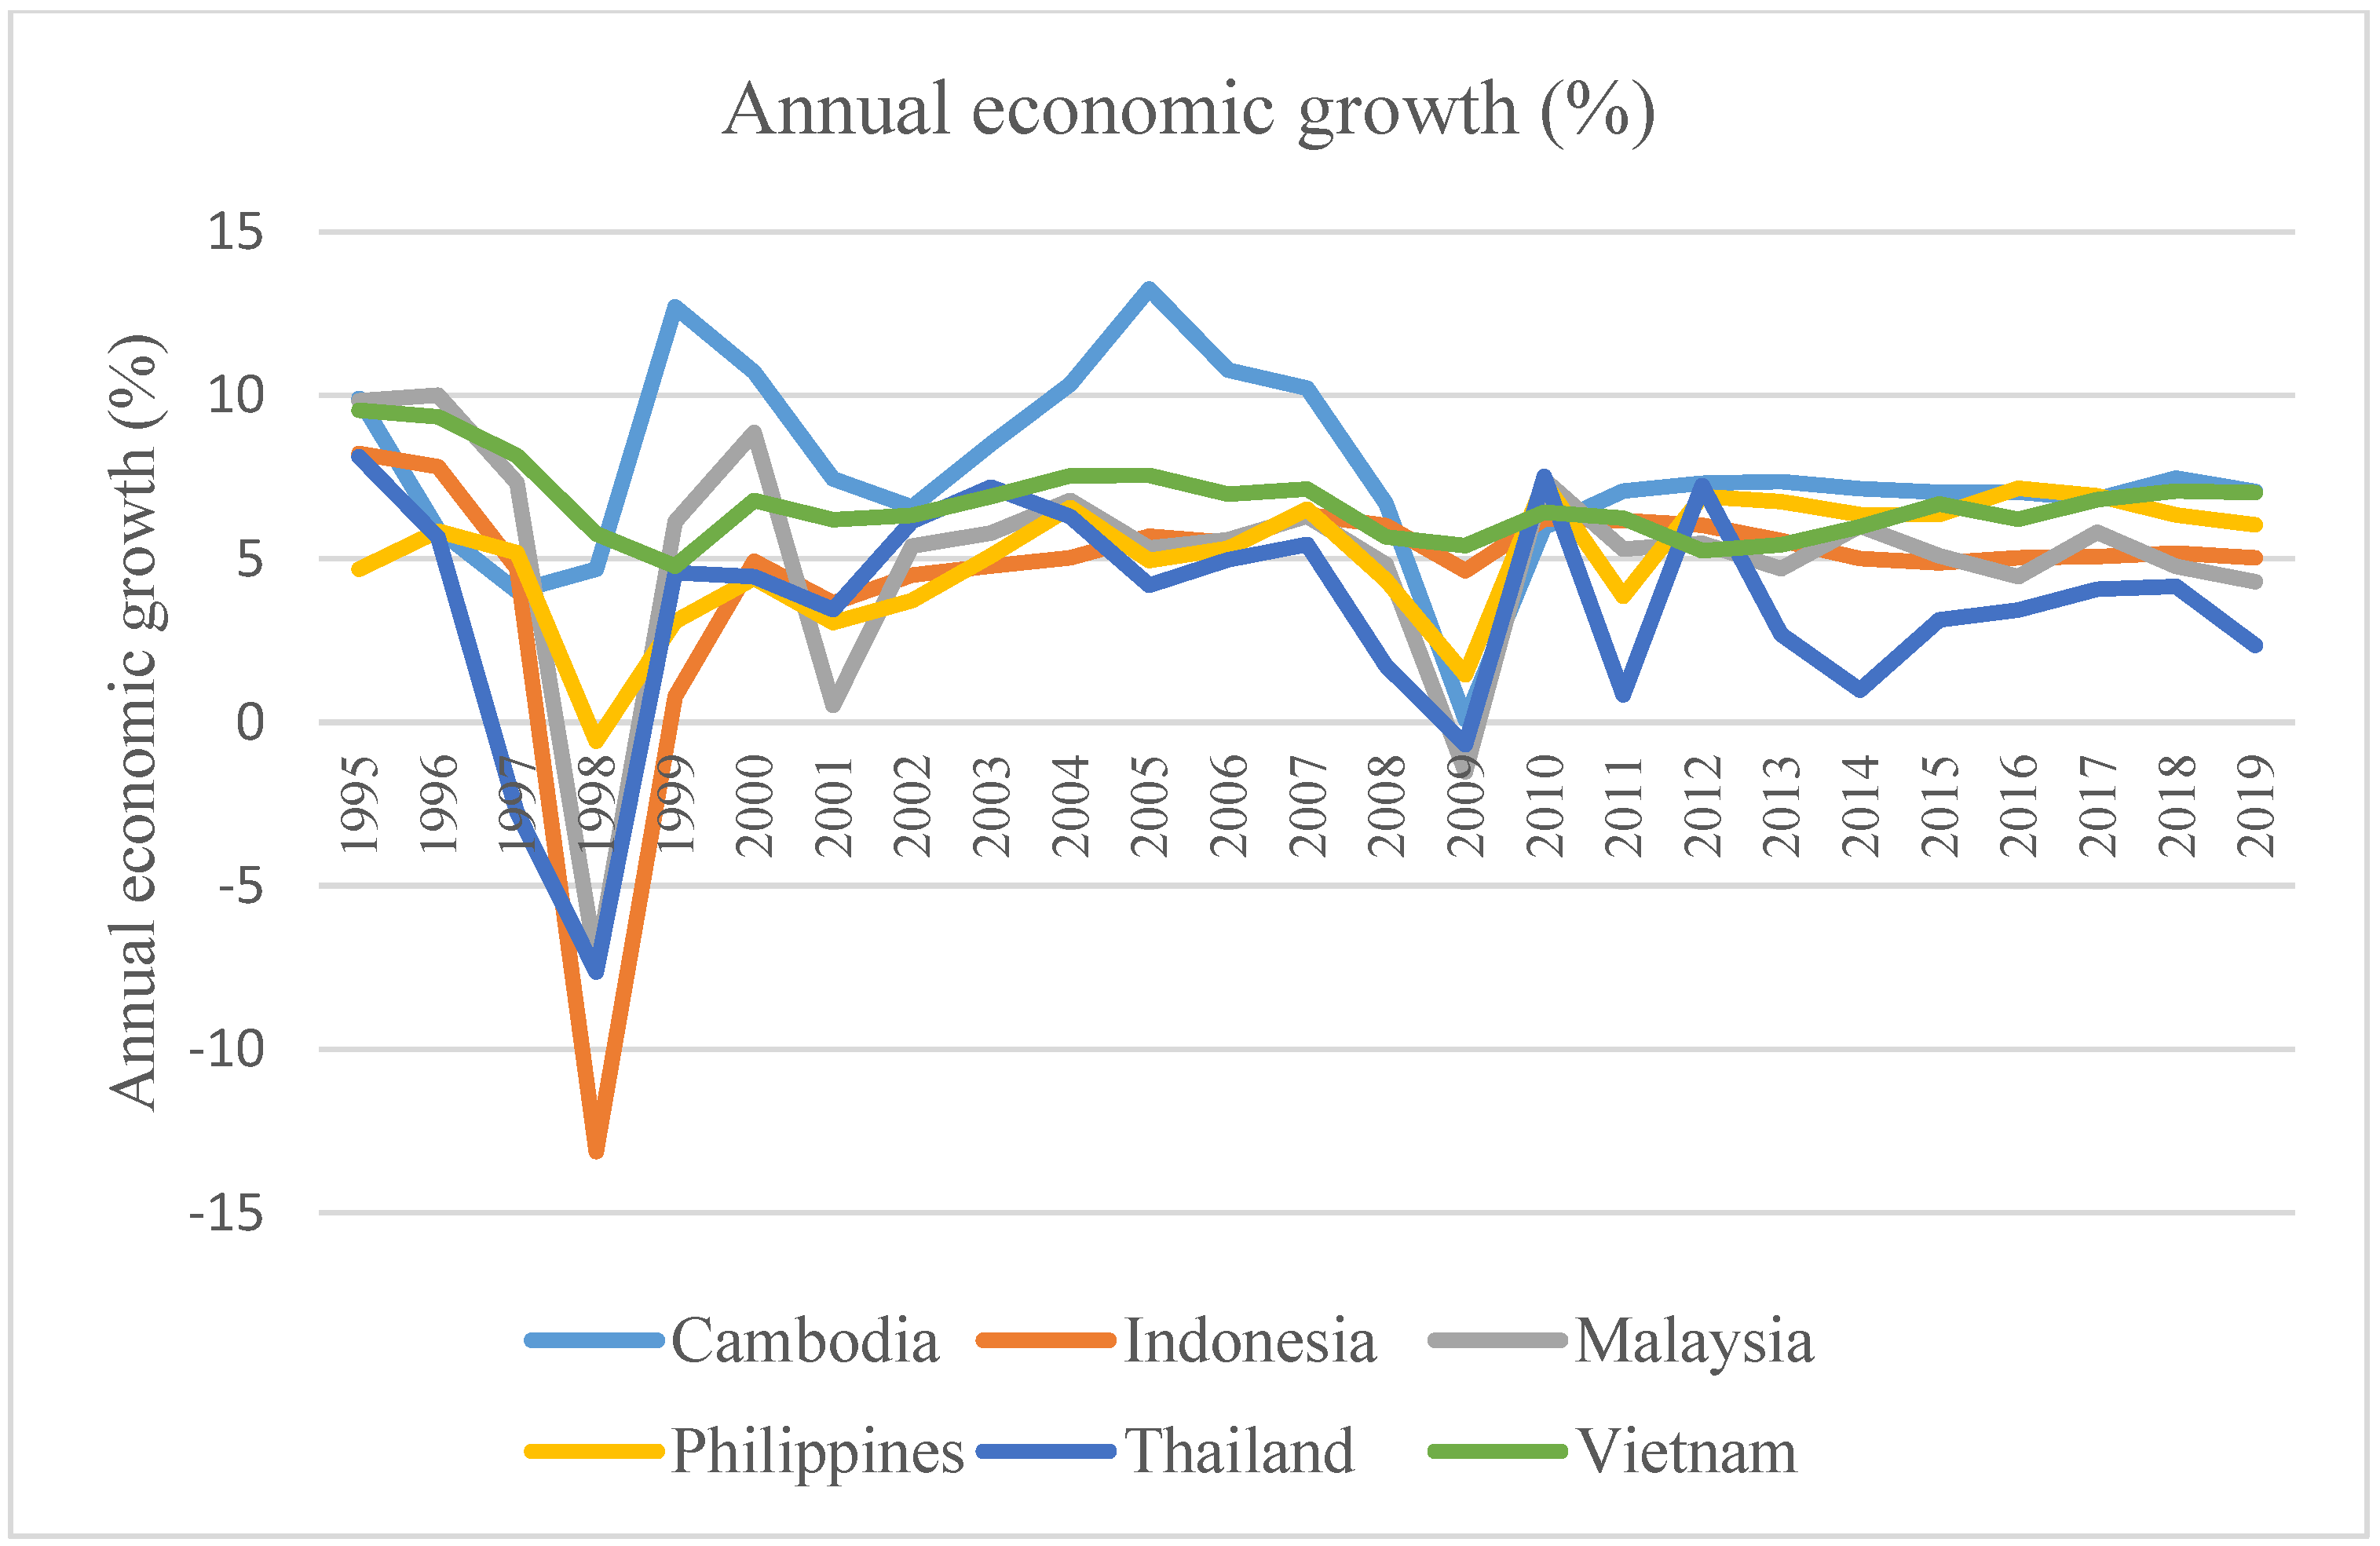
If the variables of interest are cointegrated, the Panel Vector Error Correction Model (VECM) proposed by Granger [125] and Engle and Granger [126] can be used to examine causal relationships between them. Based on Granger [125] and Engle and Granger [126], the VECM Granger causality tests are appropriate to explore the long-run and short-run causal relationships among economic growth, capital formation, labour force, and energy consumption, financial development, and human capital. The VECM model is represented as follows:
[ L n Y i , t L n K i , t L n L i , t L n E U i , t L n F D i , t L n H C i , t ] = [ β 1 . . . β 5 β 6 ] + [ a 1 a n . . . a 5 a n a 6 a n ] + [ L n Y i , t 1 L n Y i , t 2 L n Y i , t 3 L n Y i , t 4 L n Y i , t 5 L n Y i , t 6 ] + [ δ 1 δ n . . . δ 5 δ n δ 6 δ n ] + [ L n H C i , t 1 L n H C i , t 2 L n H C i , t 3 L n H C i , t 4 L n H C i , t 5 L n H C i , t 6 ] + [ γ t . . . γ t γ t ] E C M t 1 + [ ε t . . . ε t ε t ]
where LnYi,t is the logarithm of real GDP per capita; LnKi,t is the logarithm of real gross fixed capital formation per capita; LnLi,t is the logarithm of labour force; LnEUi,t is the logarithm of energy consumption per capita; LnFDi,t is the logarithm of real domestic credit to private sector per capita; LnHCi,t is the logarithm of real health expenditure per capita; β, a, δ, and γ are coefficients; ε is white noise; and i and t denote country and time.
The established long-run relationships among the selected variables of interest are further confirmed by the statistical significance of lagged error term (ECMt−1).
Dumitrescu and Hurlin [127] proposed the panel causality test, which accounts for cross-sectional dependence. However, we have not used this technique to investigate the causal relationships between our variables of interest as our panel data have no cross-sectional dependence problems.

3.3. Data

3.3.1. Data Sources

This study is based on the data of six ASEAN countries, namely Cambodia, Indonesia, Malaysia, Philippines, Thailand, and Vietnam. The yearly data period of the current study is 1995–2017. We excluded Laos, Myanmar, and Brunei because of their unavailability of data on variables of interest. We also excluded Singapore due to its advanced level of economic development, which makes it difficult to compare to those of Cambodia, Indonesia, Malaysia, Philippines, Thailand, and Vietnam.
The data on the economic growth (real GDP per capita at constant 2010 US$), energy consumption (kilogram of oil equivalent per capita), the labour force (people), real gross fixed capital formation per capita (at constant 2010 US$), financial development (domestic credit to private sector per capita at constant 2010 US$), and human capital (public health expenditure per capita at constant 2010 US$) are collected from the World Development Indicators [2]. We could not use other relevant indicators of human capital such as educational attainment or school enrolment due to a lack of data for all the countries for all the selected years.

3.3.2. Descriptive Statistics

The descriptive statistics of our variables shown in Table 1 are transformed into natural logarithms. Of the six selected ASEAN countries, Malaysia has the highest GDP per capita, while Cambodia’s GDP per capita is the lowest. Similarly, the capital formation, energy consumption, financial development and human capital indicators of Malaysia are higher than those of Cambodia, Indonesia, the Philippines, Thailand and Vietnam. However, the labour force indicator of Indonesia is higher than those of other ASEAN countries.
Figure 1 shows the annual economic growth rate of the six ASEAN countries from 1995 to 2019. In general, Cambodia and Vietnam achieved a higher average annual economic growth than Indonesia, Malaysia, the Philippines, and Thailand over the study period. However, all the countries were negatively affected by the Asian financial crisis of 1997–1998 and the global financial crisis of 2008–2009.

4. Findings and Discussions

4.1. Findings of the Cross-Sectional Dependence Test

The findings of the Pesaran cross-sectional dependent test [108] show that the hypothesis of no cross-sectional dependence could not be rejected by the Pesaran test (test statistics: 1.32; p-value: 0.19). It means that there is no cross-sectional dependence issue in our panel data.

4.2. Panel Unit Root Tests

The findings of panel unit root tests (Levin, Lin [109], Breitung [110], Im, Pesaran [111] and Maddala and Wu [112]) show that the economic growth (Y), real gross fixed capital formation (K), the labour force (L), energy consumption (EU), domestic credit to the private sector (FD), and public health expenditure (HC) are significantly stationary in the first difference (Table 2).

4.3. Panel Cointegration Tests

Table 3 shows the results of the cointegration tests of the panels. The findings of panel test statistics (within dimension) Pedroni [115] and Pedroni [116] show that three out of four-panel cointegration tests are statistically significant at 1% level. Additionally, the group mean panel test statistics (between-dimension) suggest that two out of three-panel cointegration tests are statistically significant at 1% level. In addition, the residual cointegration test [117] shows that the coefficient is significant at 1% level. As a result, the null hypothesis of no cointegration between the selected variables of interest is rejected, implying that they are cointegrated. In other words, the long-term relationship exists between economic growth, capital, labour force, energy consumption, financial development and human capital.

4.4. Panel Fully Modified Ordinary Least Squares (FMOLS) and Panel Dynamic Ordinary Least Squares (DOLS) Techniques

As the cointegration relationships are found in the panel data set, we estimate the long-run effects of physical capital, labour, energy use, financial development and human capital on economic growth.
Firstly, the panel FMOLS approach of Pedroni [119] is used for the cointegrated vectors. The reason for the use of the FMOLS method is that it corrects for endogeneity and serial correlation issues [120], and the technique is most suited to the existence of cointegrated panels [121].
The results of the panel FMOLS approach (Table 4) show that there are significant positive relationships between economic growth and explanatory variables. For example, a 1% increase in real gross fixed capital formation per capita is associated with an approximately 0.14% increase in the real GDP per capita. Moreover, a 1% rise in the labour force will result in higher economic growth (i.e., 0.8%). Economic growth increases by 0.11% if energy consumption rises by 1%. This result is consistent with the findings of Rahman [13], Rahman, Rana [45], Jebli and Youssef [46], Sadorsky [47], Gozgor, Lau [25], and Saidi, Rahman [14]. In addition, human capital and financial development contribute significantly to economic growth. For instance, a 1% increase in the real domestic credit to the private sector per capita and real public health expenditure per capita increases economic growth by 0.06% and 0.09%, respectively. This finding is in line with the results of Heshmati [66], Halıcı-Tülüce, Doğan [71], Shahbaz and Rahman [90], Shahbaz and Rahman [91], Rahman, Shahbaz [92], and Anton and Nucu [94].
Secondly, the panel DOLS techniques are employed to test the robustness of FMOLS results, and the results of panel DOLS techniques are found to be consistent with the FMOLS findings (Table 4).
Our discussions are that, despite the positive effects of human capital and financial development, the selected ASEAN countries still primarily rely on gross fixed capital formation, labour force and energy consumption for their economic growth. For instance, based on the Panel DOLS findings, the impact of the labour force is 19.2 and 12 times higher than that of financial development and human capital, respectively. In addition, the respective effect of capital is 3.6 and 2.3 times higher than that of financial development and human capital. We argue that these findings are plausible as the selected ASEAN countries are still at lower stages of development. However, we suggest that, in the future, they should further increase the impacts of human capital and the finance sector to improve their labour productivity as well as economic growth. This is because the labour productivity measured as the gross domestic product (GDP) per hour of work of the selected ASEAN countries is still very low compared with that of South Korea, Japan and the USA. For example, in 2017, the GDP per hour of work in $US at 2011 PPP (Purchasing power parity) prices was $2.24, $4.82, $9.64, $11.27, $12.85, and $21.68 in Cambodia, Vietnam, the Philippines, Indonesia, Thailand, and Malaysia, respectively, whereas it was $34.06 in South Korea, $43.35 in Japan, and $65.51 in the USA [128].

4.5. Fully Modified Ordinary Least Squares (FMOLS) Estimation (Country-Wise)

Ozcan [120] argued that one must define a different long-run equilibrium for each country in the presence of heterogeneity of long-run parameters. The findings of FMOLS tests for each selected country (Table 5) show that the labour force contributes significantly to the economic growth of all the six ASEAN countries. For example, a 1% rise in the labour force will lead to a 0.33%, 0.16%, 0.19%, 0.41%, 0.18%, and 0.14% increase in the economic growth of Cambodia, Indonesia, Malaysia, the Philippines, Thailand, and Vietnam, respectively. The physical capital also has a considerable effect on the economic growth of Cambodia, Indonesia, Malaysia, the Philippines, and Thailand. For instance, a 1% increase in the real gross fixed capital formation per capita will result in a 0.26%, 0.32%, 0.15%, 0.48%, and 0.09% rise in the economic growth of Cambodia, Indonesia, Malaysia, the Philippines, and Thailand, respectively.
The findings also show that energy consumption is one of the main drivers of economic growth of Malaysia, the Philippines, Thailand and Vietnam during the study period. In contrast, a negative relationship between energy consumption and economic growth is found in Cambodia. We argue that this may be due to the fact that the use of substantial non-renewable energy with relatively low technology innovation in the country causes its environmental degradation, which adversely affects its economic growth in the long run. Indeed, Cambodia is still in an early stage of transition to more energy-efficient sources [129]. In 2020, the innovation index of Cambodia was 21.5 points, which was far below the international average of 33.86 points [130].
In addition, a positive relationship between economic growth and financial development is found in Cambodia, while human capital positively contributes to the economic growth of Indonesia, Malaysia, the Philippines, Thailand and Vietnam. Further investigation into their financial development, human capital, and economic growth showed a gap in investment in the financial development and human capital among regions of each selected country, especially Vietnam [131,132,133]. Therefore, these countries should allocate adequate resources across every region to promote their regional and national economic growth.

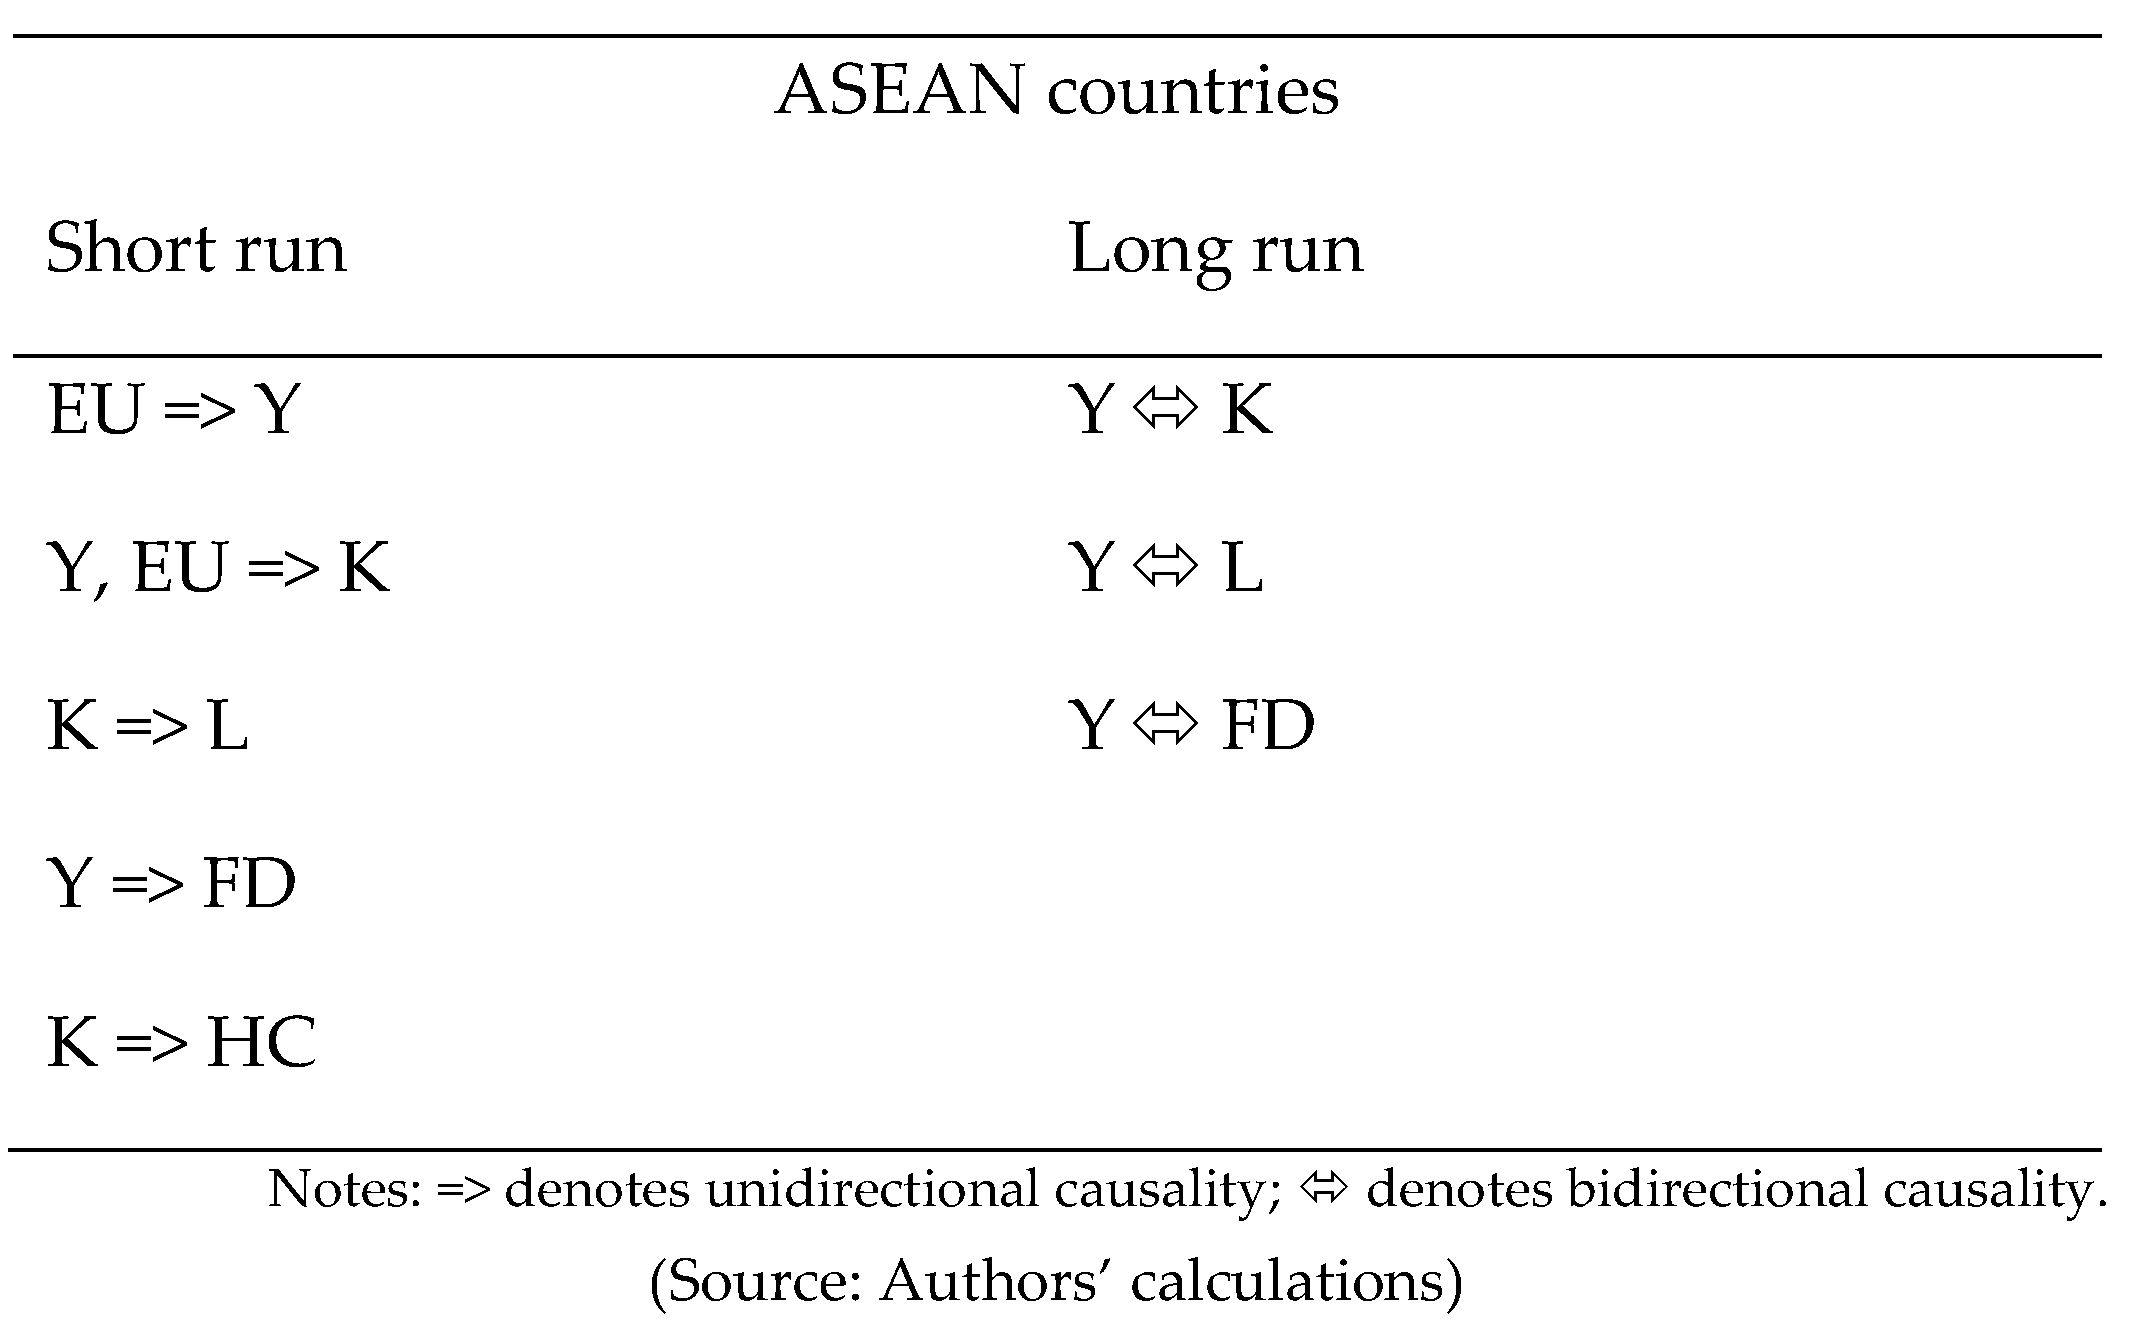
4.6. Panel Granger Causality Tests

The FMOLS and DOLS tests do not explore the direction of causal relationships between the selected variables. Granger [125] and Engle and Granger [126] suggested that in the case of the existence of cointegration, if variables are stationary at the unique order, the Vector Error Correction Model (VECM) Granger causality approach can be applied to investigate the short- and long-run causality between the variables of interest. Therefore, we employ the VECM Granger causality approach to analyze the direction of causality amongst the economic growth, capital formation, labour force, energy consumption, financial development, and human capital in the selected ASEAN countries. The findings show that in the short run, there is a unidirectional Granger causality running from energy consumption to economic growth; from economic growth and energy consumption to capital formation; from capital formation to the labor force; from economic growth to financial development; and from capital formation to human capital (Table 6). The findings are in line with the results of Jalil and Feridun [37] and Islam et al. [39].
In relation to the long-run causality between the selected variables, the estimated coefficients of ECTt−1 in economic growth, gross fixed capital formation, labour force, and financial development are statistically significant at 10%, 1%, 5% and 5%, respectively. These findings provide evidence of long-run bidirectional causal relationships amongst economic growth, gross fixed capital formation, labour force, and financial development.
The causal relationships amongst the selected variables in the ASEAN countries are also demonstrated in Figure 2.

5. Conclusions and Policy Implication

This study examined the relationships between physical capital, labour, energy consumption, human capital, financial development, and economic growth in the six ASEAN countries during the period 1995–2017. The findings suggest that all of the selected variables significantly contributed to the economic growth of the countries. However, physical capital, labour inputs, and energy consumption still play a more important role in the economic growth. The results also suggest that there is evidence of the short and long-run unidirectional causality from energy consumption to economic growth and from economic growth to financial development.
Based on our empirical findings, the following policy implications can be drawn. Firstly, although the economic growth of ASEAN countries primarily depends on physical capital, labour inputs and energy consumption, human capital development should be promoted to have its higher effects on economic growth. In particular, the positive impacts of human capital on the economic growth found in Indonesia, Malaysia, the Philippines, Thailand and Vietnam suggest that policymakers should prioritize more budgetary allocation for human resource development, especially in less developed regions of each country. Also, better quality schooling for all children and further improvement of health care systems across each country should be promoted.
Secondly, the use of energy-efficient technologies should be further encouraged in the six ASEAN countries in order to achieve the desirable three e’s of sustainable economic development: equitable, effective and efficient towards net-zero CO2 emissions by 2050. In Cambodia, despite the negative effect of energy consumption on its economic growth, increasing the use of energy-efficient technologies could be a correct policy option for its sustained economic growth. In addition, through various incentives such as investment subsidies, installation rebates and tax benefits, the governments of the six ASEAN countries should come forward to enhance the production and distribution system of energy with technological advancement to achieve higher positive impacts of energy use on economic growth.
Thirdly, the positive effect of financial development on economic growth found in Cambodia implies that the development of the domestic financial sector and financial stability in the region are absolutely essential. The efficiency of the financial system through correct policy reforms and regulations must be ensured to attain long term sustainable economic development in the six ASEAN countries.
Our paper is not without limitations. Firstly, due to the data unavailability of variable interests, the study could not investigate the roles of energy consumption, human capital and financial development in economic growth in all ten ASEAN countries. Secondly, the current paper focuses on analysing the impacts of energy consumption on economic growth instead of separating the effects of renewable and non-renewable consumption. Therefore, these shortcomings will be addressed in our future research as soon as all necessary data are available.

Author Contributions

Conceptualization, M.M.R. and X.-B.V.; methodology, X.-B.V.; software, X.-B.V.; validation, M.M.R., S.N. and X.-B.V.; formal analysis, X.-B.V.; investigation, M.M.R. and X.-B.V.; resources, M.M.R. and X.-B.V.; data curation, M.M.R., S.N. and X.-B.V.; writing—original draft preparation, M.M.R., S.N. and X.-B.V.; writing—review and editing, M.M.R., X.-B.V. and S.N.; project administration, X.-B.V. All authors have read and agreed to the published version of the manuscript.

Funding

This research received no external funding.

Institutional Review Board Statement

Not applicable.

Informed Consent Statement

Not applicable.

Data Availability Statement

Data supporting reported results can be found from World Development Indicators: https://databank.worldbank.org/source/world-development-indicators (accessed on 17 March 2022).

Conflicts of Interest

The authors declare no conflict of interest.

References

  1. Adams, R.H. Economic Growth, Inequality and Poverty: Findings from a New Data Set; World Bank Publications: Washington, DC, USA, 2003; Volume 2972. [Google Scholar]
  2. WDI. World Development Indicators; World Bank Data Base: Washington, DC, USA, 2020. [Google Scholar]
  3. Lian, B. Southeast Asia’s Poorest Mostly Filipinos, Indonesians—ASEAN Report. Rappler 2017, 12, 2018. [Google Scholar]
  4. OECD. Economic Outlook for Southeast Asia, China and India 2019; OECD Development Centre: Paris, France, 2019. [Google Scholar]
  5. IEA. International Energy Agency (IEA), Statistics. Available online: http://www.iea.org/statistics/ (accessed on 27 February 2021).
  6. Rahman, M.M.; Khanam, R.; Rahman, M. Health care expenditure and health outcome nexus: New evidence from the SAARC-ASEAN region. Glob. Health 2018, 14, 113. [Google Scholar] [CrossRef] [PubMed] [Green Version]
  7. IMF. ASEAN Financial Integration; IMF Working Papers 15/34; International Monetary Fund: Washington, DC, USA, 2015. [Google Scholar]
  8. Upreti, P. Factors affecting economic growth in developing countries. Major Themes Econ. 2015, 17, 37–54. [Google Scholar]
  9. Chirwa, T.G.; Odhiambo, N.M. Macroeconomic determinants of economic growth: A review of international literature. South East Eur. J. Econ. Bus. 2016, 11, 33–47. [Google Scholar] [CrossRef] [Green Version]
  10. Solow, R.M. A contribution to the theory of economic growth. Q. J. Econ. 1956, 70, 65–94. [Google Scholar] [CrossRef]
  11. Ozturk, I.; Acaravci, A. CO2 emissions, energy consumption and economic growth in Turkey. Renew. Sustain. Energy Rev. 2010, 14, 3220–3225. [Google Scholar] [CrossRef]
  12. Pao, H.-T.; Yu, H.-C.; Yang, Y.-H. Modeling the CO2 emissions, energy use, and economic growth in Russia. Energy 2011, 36, 5094–5100. [Google Scholar] [CrossRef]
  13. Rahman, M.M. Do population density, economic growth, energy use and exports adversely affect environmental quality in Asian populous countries? Renew. Sustain. Energy Rev. 2017, 77, 506–514. [Google Scholar] [CrossRef]
  14. Saidi, K.; Rahman, M.M.; Amamri, M. The causal nexus between economic growth and energy consumption: New evidence from global panel of 53 countries. Sustain. Cities Soc. 2017, 33, 45–56. [Google Scholar] [CrossRef]
  15. Mbarek, M.B.; Saidi, K.; Rahman, M.M. Renewable and non-renewable energy consumption, environmental degradation and economic growth in Tunisia. Qual. Quant. 2018, 52, 1105–1119. [Google Scholar] [CrossRef]
  16. Durusu-Ciftci, D.; Ispir, M.S.; Yetkiner, H. Financial development and economic growth: Some theory and more evidence. J. Policy Modeling 2017, 39, 290–306. [Google Scholar] [CrossRef]
  17. Siddique, H.M.A.; Usman, S.; Ishaq, J. Financial Development and Economic Growth: The Role of Energy Consumption. J. Quant. Methods 2018, 2, 43–55. [Google Scholar] [CrossRef]
  18. Rahman, M.M.; Saidi, K.; Mbarek, M.B. The effects of population growth, environmental quality and trade openness on economic growth: A panel data application. J. Econ. Stud. 2017, 44, 456–474. [Google Scholar] [CrossRef]
  19. Rahman, M.M.; Salahuddin, M. The Determinants of Economic Growth in Pakistan: Does Stock Market Development Play a Major Role? Econ. Issues 2010, 15, 681. [Google Scholar]
  20. Barro, R.J.; Sala-i-Martin, X. Public finance in models of economic growth. Rev. Econ. Stud. 1992, 59, 645–661. [Google Scholar] [CrossRef] [Green Version]
  21. Altiner, A.; Toktas, Y. Relationship between human capital and economic growth: An application to developing countries. Eurasian J. Econ. Financ. 2017, 5, 87–98. [Google Scholar] [CrossRef]
  22. Ecevit, E.; Kuloğlu, A. The Relationship between Human Capital and Economic Growth in Turkey. IOSR J. Econ. Financ. 2016, 7, 69–72. [Google Scholar]
  23. Shahbaz, M.; Zakaria, M.; Shahzad, S.J.H.; Mahalik, M.K. The energy consumption and economic growth nexus in top ten energy-consuming countries: Fresh evidence from using the quantile-on-quantile approach. Energy Econ. 2018, 71, 282–301. [Google Scholar] [CrossRef] [Green Version]
  24. Rahman, M.M.; Mamun, S.A.K. Energy use, international trade and economic growth nexus in Australia: New evidence from an extended growth model. Renew. Sustain. Energy Rev. 2016, 64, 806–816. [Google Scholar] [CrossRef]
  25. Gozgor, G.; Lau, C.K.M.; Lu, Z. Energy consumption and economic growth: New evidence from the OECD countries. Energy 2018, 153, 27–34. [Google Scholar] [CrossRef] [Green Version]
  26. Ouyang, Y.; Li, P. On the nexus of financial development, economic growth, and energy consumption in China: New perspective from a GMM panel VAR approach. Energy Econ. 2018, 71, 238–252. [Google Scholar] [CrossRef]
  27. Rahman, M.M.; Velayutham, E. Renewable and non-renewable energy consumption-economic growth nexus: New evidence from South Asia. Renew. Energy 2020, 147, 399–408. [Google Scholar] [CrossRef]
  28. Yakisik, H.; Cetin, A. The impacts of education, health and level of technology on economic growth: ARDL bound test approach. Socioeconomy 2014, 21, 169–186. [Google Scholar]
  29. Apergis, N.; Payne, J.E. Energy consumption and economic growth in Central America: Evidence from a panel cointegration and error correction model. Energy Econ. 2009, 31, 211–216. [Google Scholar] [CrossRef]
  30. Lee, C.-C.; Chang, C.-P. Energy consumption and economic growth in Asian economies: A more comprehensive analysis using panel data. Resour. Energy Econ. 2008, 30, 50–65. [Google Scholar] [CrossRef]
  31. Lin, B.; Wesseh, P.K., Jr. Energy consumption and economic growth in South Africa reexamined: A nonparametric testing apporach. Renew. Sustain. Energy Rev. 2014, 40, 840–850. [Google Scholar] [CrossRef]
  32. Kraft, J.; Kraft, A. On the relationship between energy and GNP. J. Energy Dev. 1978, 3, 401–403. [Google Scholar]
  33. Rahman, M.M.; Vu, X.-B.B. Are Energy Consumption, Population Density and Exports Causing Environmental Damage in China? Autoregressive Distributed Lag and Vector Error Correction Model Approaches. Sustainability 2021, 13, 3749. [Google Scholar] [CrossRef]
  34. Rahman, M.M. The dynamic nexus of energy consumption, international trade and economic growth in BRICS and ASEAN countries: A panel causality test. Energy 2021, 229, 120679. [Google Scholar] [CrossRef]
  35. Sharma, G.D.; Rahman, M.M.; Jain, M.; Chopra, R. Nexus between energy consumption, information and communications technology, and economic growth: An enquiry into emerging Asian countries. J. Public Aff. 2021, 21, e2172. [Google Scholar] [CrossRef]
  36. Tang, C.F.; Tan, B.W.; Ozturk, I. Energy consumption and economic growth in Vietnam. Renew. Sustain. Energy Rev. 2016, 54, 1506–1514. [Google Scholar] [CrossRef]
  37. Jalil, A.; Feridun, M. Energy-driven economic growth: Energy consumption—economic growth nexus revisited for China. Emerg. Mark. Financ. Trade 2014, 50, 159–168. [Google Scholar]
  38. Alam, M.M.; Murad, M.W. The impacts of economic growth, trade openness and technological progress on renewable energy use in organization for economic co-operation and development countries. Renew. Energy 2020, 145, 382–390. [Google Scholar] [CrossRef]
  39. Islam, F.; Shahbaz, M.; Ahmed, A.U.; Alam, M. Financial development and energy consumption nexus in Malaysia: A multivariate time series analysis. Econ. Model. 2013, 30, 435–441. [Google Scholar] [CrossRef] [Green Version]
  40. Huang, B.-N.; Hwang, M.J.; Yang, C.W. Causal relationship between energy consumption and GDP growth revisited: A dynamic panel data approach. Ecol. Econ. 2008, 67, 41–54. [Google Scholar] [CrossRef]
  41. Squalli, J. Electricity consumption and economic growth: Bounds and causality analyses of OPEC members. Energy Econ. 2007, 29, 1192–1205. [Google Scholar] [CrossRef]
  42. Ozturk, I. A literature survey on energy–growth nexus. Energy Policy 2010, 38, 340–349. [Google Scholar] [CrossRef]
  43. Fuinhas, J.A.; Marques, A.C. Energy consumption and economic growth nexus in Portugal, Italy, Greece, Spain and Turkey: An ARDL bounds test approach (1965–2009). Energy Econ. 2012, 34, 511–517. [Google Scholar] [CrossRef]
  44. Rahman, M.M.; Vu, X.-B. The nexus between renewable energy, economic growth, trade, urbanisation and environmental quality: A comparative study for Australia and Canada. Renew. Energy 2020, 155, 617–627. [Google Scholar] [CrossRef]
  45. Rahman, M.M.; Rana, R.H.; Barua, S. The Drivers of Economic Growth in South Asia: Evidence from a Dynamic System GMM approach. J. Econ. Stud. 2019, 46, 564–577. [Google Scholar] [CrossRef]
  46. Jebli, M.B.; Youssef, S.B. Output, renewable and non-renewable energy consumption and international trade: Evidence from a panel of 69 countries. Renew. Energy 2015, 83, 799–808. [Google Scholar] [CrossRef] [Green Version]
  47. Sadorsky, P. Renewable energy consumption and income in emerging economies. Energy Policy 2009, 37, 4021–4028. [Google Scholar] [CrossRef]
  48. Lee, C.-C.; Chang, C.-P. Energy consumption and GDP revisited: A panel analysis of developed and developing countries. Energy Econ. 2007, 29, 1206–1223. [Google Scholar] [CrossRef]
  49. Salim, R.A.; Rafiq, S. Why do some emerging economies proactively accelerate the adoption of renewable energy? Energy Econ. 2012, 34, 1051–1057. [Google Scholar] [CrossRef]
  50. Apergis, N.; Payne, J.E. Renewable energy consumption and growth in Eurasia. Energy Econ. 2010, 32, 1392–1397. [Google Scholar] [CrossRef]
  51. Apergis, N.; Payne, J.E. The renewable energy consumption–growth nexus in Central America. Appl. Energy 2011, 88, 343–347. [Google Scholar] [CrossRef]
  52. Ohlan, R. Renewable and nonrenewable energy consumption and economic growth in India. Energy Sources Part B Econ. Plan. Policy 2016, 11, 1050–1054. [Google Scholar] [CrossRef]
  53. Menegaki, A.N. Growth and renewable energy in Europe: A random effect model with evidence for neutrality hypothesis. Energy Econ. 2011, 33, 257–263. [Google Scholar] [CrossRef]
  54. Abanda, F.; Ng’Ombe, A.; Keivani, R.; Tah, J. The link between renewable energy production and gross domestic product in Africa: A comparative study between 1980 and 2008. Renew. Sustain. Energy Rev. 2012, 16, 2147–2153. [Google Scholar] [CrossRef]
  55. Aïssa, M.S.B.; Jebli, M.B.; Youssef, S.B. Output, renewable energy consumption and trade in Africa. Energy Policy 2014, 66, 11–18. [Google Scholar] [CrossRef] [Green Version]
  56. Romer, P.M. Human capital and growth: Theory and evidence. Ann. Econ. Financ. 2014, 15, 765–816. [Google Scholar]
  57. Hall, R.E.; Jones, C.I. Why do some countries produce so much more output per worker than others? Q. J. Econ. 1999, 114, 83–116. [Google Scholar] [CrossRef]
  58. Romer, P.M. Human Capital and Growth: Theory and Evidence; National Bureau of Economic Research: Cambridge, MA, USA, 1989. [Google Scholar]
  59. Barro, R.J. Economic growth in a cross section of countries. Q. J. Econ. 1991, 106, 407–443. [Google Scholar] [CrossRef] [Green Version]
  60. Keller, K.R. Education expansion, expenditures per student and the effects on growth in Asia. Glob. Econ. Rev. 2006, 35, 21–42. [Google Scholar] [CrossRef]
  61. Self, S.; Grabowski, R. Does education at all levels cause growth? India, a case study. Econ. Educ. Rev. 2004, 23, 47–55. [Google Scholar] [CrossRef]
  62. Park, J. Dispersion of human capital and economic growth. J. Macroecon. 2006, 28, 520–539. [Google Scholar] [CrossRef]
  63. Permani, R. Education as a Determinant of Economic Growth in East Asia: Historical Trends and Emphirical Evidences (1965–2000); University of Adelaide: Adelaide, SA, Australia, 2008. [Google Scholar]
  64. Çaliskan, S.; Karabacak, M.; Meçik, O. Relationship Between Education and Economic Growth in Turkey: 1923–2011 (A Quantitative Approach). Çanakkale Onsekiz Mart Üniversitesi Yönetim Bilimleri Derg. 2013, 11, 29. [Google Scholar]
  65. Piabuo, S.M.; Tieguhong, J.C. Health expenditure and economic growth-a review of the literature and an analysis between the economic community for central African states (CEMAC) and selected African countries. Health Econ. Rev. 2017, 7, 23. [Google Scholar] [CrossRef]
  66. Heshmati, A. On the Causality between GDP and Health Care Eexpenditure in Augmented Solow Growth Model; SSE/EFI Working Paper Series in Economics and Finance; The Economic Research Institute (EFI): Stockholm, Sweden, 2001. [Google Scholar]
  67. Arısoy, İ.; Ünlükaplan, İ.; Ergen, Z. The relationship between social expenditures and economic growth: A dynamic analysis intended for 1960–2005 period of the Turkish economy. MaliyeDergisi 2010, 158, 398–421. [Google Scholar]
  68. Eryigit, S.B.; Eryigit, K.Y.; Selen, U. The long-run linkages between education, health and defence expenditures and economic growth: Evidence from Turkey. Def. Peace Econ. 2012, 23, 559–574. [Google Scholar] [CrossRef]
  69. Aurangzeb, A.Z. Relationship between health expenditure and GDP in an augmented Solow growth model for Pakistan: An application of co-integration and error-correction modeling. Lahore J. Econ. 2003, 8, 1–16. [Google Scholar] [CrossRef]
  70. Bakare, A.a.; Olubokun, S. Health care expenditure and economic growth in Nigeria: An empirical study. J. Emerg. Trends Econ. Manag. Sci. 2011, 2, 83–87. [Google Scholar]
  71. Halıcı-Tülüce, N.S.; Doğan, İ.; Dumrul, C. Is income relevant for health expenditure and economic growth nexus? Int. J. Health Econ. Manag. 2016, 16, 23–49. [Google Scholar] [CrossRef] [PubMed]
  72. Kar, M.; Taban, S. The Impacts of the Disaggregated Public Expenditure on Economic Growth; Ankara University Faculty of Political Science: Ankara, Turkey, 2003; Volume 53, pp. 145–169. [Google Scholar]
  73. Ogundipe, M.A.; Lawal, N.A. Health expenditure and Nigerian economic growth. Eur. J. Econ. Financ. Adm. Sci. 2011, 30, 125–129. [Google Scholar]
  74. Çetin, M.; Ecevit, E. The effect of health expenditures on economic growth: A panel regression analysis on OECD countries. Doğuş Univ. J. 2010, 1, 166–182. [Google Scholar]
  75. Abdouli, M.; Omri, A. Exploring the nexus among FDI inflows, environmental quality, human capital, and economic growth in the Mediterranean region. J. Knowl. Econ. 2021, 12, 788–810. [Google Scholar] [CrossRef]
  76. Karambakuwa, R.T.; Ncwadi, R.; Phiri, A. The human capital–economic growth nexus in SSA countries: What can strengthen the relationship? Int. J. Soc. Econ. 2020, 47, 1143–1159. [Google Scholar] [CrossRef]
  77. Schumpeter, J. The Theory of Economic Development/Schumpeter J. 2014; Harvard University Press: Cambridge, MA, USA, 1911; Revised Editions in 1961. [Google Scholar]
  78. McKinnon, R.I. Money and Capital in Economic Development; Brookings Institution Press: Washington, DC, USA, 1973. [Google Scholar]
  79. Levine, R. Financial Development and Economic Growth: Views and Agenda; The World Bank: Washington, DC, USA, 1999. [Google Scholar]
  80. Jbili, M.A. Financial Sector Reforms in Algeria, Morocco, and Tunisia: A Preliminary Assessment; International Monetary Fund: Washington, DC, USA, 1997. [Google Scholar]
  81. Beck, T.; Demirguc-Kunt, A. Small and medium-size enterprises: Access to finance as a growth constraint. J. Bank. Financ. 2006, 30, 2931–2943. [Google Scholar] [CrossRef]
  82. Lucas, R.E., Jr. On the mechanics of economic development. J. Monet. Econ. 1988, 22, 3–42. [Google Scholar] [CrossRef]
  83. Goldsmith, R. Financial Structure and Development; Yale University Press: New Haven, CT, USA, 1969. [Google Scholar]
  84. Bist, J.P. Financial development and economic growth: Evidence from a panel of 16 African and non-African low-income countries. Cogent Econ. Financ. 2018, 6, 1449780. [Google Scholar] [CrossRef] [Green Version]
  85. De Gregorio, J.; Guidotti, P.E. Financial development and economic growth. World Dev. 1995, 23, 433–448. [Google Scholar] [CrossRef]
  86. Darrat, A.F. Are financial deepening and economic growth causally related? Another look at the evidence. Int. Econ. J. 1999, 13, 19–35. [Google Scholar] [CrossRef]
  87. Habibullah, M.S.; Eng, Y.-K. Does financial development cause economic growth? A panel data dynamic analysis for the Asian developing countries. J. Asia Pac. Econ. 2006, 11, 377–393. [Google Scholar] [CrossRef]
  88. Akinlo, A.E.; Egbetunde, T. Financial development and economic growth: The experience of 10 sub-Saharan African countries revisited. Rev. Financ. Bank. 2010, 2, 17–28. [Google Scholar]
  89. Hassan, M.K.; Sanchez, B.; Yu, J.-S. Financial development and economic growth: New evidence from panel data. Q. Rev. Econ. Financ. 2011, 51, 88–104. [Google Scholar] [CrossRef] [Green Version]
  90. Shahbaz, M.; Rahman, M.M. The dynamic of financial development, imports, foreign direct investment and economic growth: Cointegration and causality analysis in Pakistan. Glob. Bus. Rev. 2012, 13, 201–219. [Google Scholar] [CrossRef] [Green Version]
  91. Shahbaz, M.; Rahman, M.M. Exports, financial development and economic growth in Pakistan. Int. J. Dev. Issues 2014, 13, 155–170. [Google Scholar] [CrossRef]
  92. Rahman, M.M.; Shahbaz, M.; Farooq, A. Financial development, international trade, and economic growth in Australia: New evidence from multivariate framework analysis. J. Asia-Pac. Bus. 2015, 16, 21–43. [Google Scholar] [CrossRef]
  93. Kumar, K.; Paramanik, R.N. Nexus between Indian economic growth and financial development: A non-linear ARDL approach. J. Asian Financ. Econ. Bus. 2020, 7, 109–116. [Google Scholar] [CrossRef]
  94. Anton, S.G.; Nucu, A.E.A. The effect of financial development on renewable energy consumption. A panel data approach. Renew. Energy 2020, 147, 330–338. [Google Scholar] [CrossRef]
  95. Zaidi, S.A.H.; Wei, Z.; Gedikli, A.; Zafar, M.W.; Hou, F.; Iftikhar, Y. The impact of globalization, natural resources abundance, and human capital on financial development: Evidence from thirty-one OECD countries. Resour. Policy 2019, 64, 101476. [Google Scholar] [CrossRef]
  96. Chen, S.; Saud, S.; Saleem, N.; Bari, M.W. Nexus between financial development, energy consumption, income level, and ecological footprint in CEE countries: Do human capital and biocapacity matter? Environ. Sci. Pollut. Res. 2019, 26, 31856–31872. [Google Scholar]
  97. Kondoz, M.; Kirikkaleli, D.; Athari, S.A. Time-frequency dependencies of financial and economic risks in South American countries. Q. Rev. Econ. Financ. 2021, 79, 170–181. [Google Scholar] [CrossRef]
  98. Kirikkaleli, D.; Onyibor, K. The effects of financial and political risks on economic risk in Southern European countries: A dynamic panel analysis. Int. J. Financ. Res. 2020, 11, 1–13. [Google Scholar] [CrossRef]
  99. Narayan, P.K.; Narayan, S. The short-run relationship between the financial system and economic growth: New evidence from regional panels. Int. Rev. Financ. Anal. 2013, 29, 70–78. [Google Scholar] [CrossRef]
  100. Nili, M.; Rastad, M. Addressing the growth failure of the oil economies: The role of financial development. Q. Rev. Econ. Financ. 2007, 46, 726–740. [Google Scholar] [CrossRef]
  101. Kar, M.; Nazlıoğlu, Ş.; Ağır, H. Financial development and economic growth nexus in the MENA countries: Bootstrap panel granger causality analysis. Econ. Model. 2011, 28, 685–693. [Google Scholar] [CrossRef]
  102. Jayaratne, J.; Strahan, P.E. The finance-growth nexus: Evidence from bank branch deregulation. Q. J. Econ. 1996, 111, 639–670. [Google Scholar] [CrossRef] [Green Version]
  103. Federici, D.; Caprioli, F. Financial development and growth: An empirical analysis. Econ. Model. 2009, 26, 285–294. [Google Scholar] [CrossRef]
  104. Cobb, C.W.; Douglas, P.H. A theory of production. Am. Econ. Rev. 1928, 18, 139–165. [Google Scholar]
  105. Wang, Y.; Liu, S. Education, human capital and economic growth: Empirical research on 55 countries and regions (1960–2009). Theor. Econ. Lett. 2016, 6, 347–355. [Google Scholar] [CrossRef] [Green Version]
  106. Calderón, C.; Liu, L. The direction of causality between financial development and economic growth. J. Dev. Econ. 2003, 72, 321–334. [Google Scholar] [CrossRef] [Green Version]
  107. Grossman, G.M.; Krueger, A.B. Economic growth and the environment. Q. J. Econ. 1995, 110, 353–377. [Google Scholar] [CrossRef] [Green Version]
  108. Pesaran, M.H. General diagnostic tests for cross section dependence in panels. Empir. Econ. 2021, 60, 13–50. [Google Scholar] [CrossRef]
  109. Levin, A.; Lin, C.-F.; Chu, C.-S.J. Unit root tests in panel data: Asymptotic and finite-sample properties. J. Econom. 2002, 108, 1–24. [Google Scholar] [CrossRef]
  110. Breitung, J. The Local Power of Some Unit Root Tests for Panel Data. In Nonstationary Panels, Panel Cointegration, and Dynamic Panels; Emerald Group Publishing Limited: Bingley, UK, 2001; pp. 161–177. [Google Scholar]
  111. Im, K.S.; Pesaran, M.H.; Shin, Y. Testing for unit roots in heterogeneous panels. J. Econom. 2003, 115, 53–74. [Google Scholar] [CrossRef]
  112. Maddala, G.S.; Wu, S. A comparative study of unit root tests with panel data and a new simple test. Oxf. Bull. Econ. Stat. 1999, 61 (Suppl. S1), 631–652. [Google Scholar] [CrossRef]
  113. Hasanov, F.J.; Liddle, B.; Mikayilov, J.I. The impact of international trade on CO2 emissions in oil exporting countries: Territory vs consumption emissions accounting. Energy Econ. 2018, 74, 343–350. [Google Scholar] [CrossRef]
  114. Pesaran, M.H. A simple panel unit root test in the presence of cross-section dependence. J. Appl. Econom. 2007, 22, 265–312. [Google Scholar] [CrossRef] [Green Version]
  115. Pedroni, P. Critical values for cointegration tests in heterogeneous panels with multiple regressors. Oxf. Bull. Econ. Stat. 1999, 61 (Suppl. S1), 653–670. [Google Scholar] [CrossRef]
  116. Pedroni, P. Panel cointegration: Asymptotic and finite sample properties of pooled time series tests with an application to the PPP hypothesis. Econom. Theory 2004, 20, 597–625. [Google Scholar] [CrossRef] [Green Version]
  117. Kao, C. Spurious regression and residual-based tests for cointegration in panel data. J. Econom. 1999, 90, 1–44. [Google Scholar] [CrossRef]
  118. Westerlund, J. New simple tests for panel cointegration. Econom. Rev. 2005, 24, 297–316. [Google Scholar] [CrossRef]
  119. Pedroni, P. Fully Modified OLS for Heterogeneous Cointegrated Panels. In Nonstationary Panels, Panel Cointegration, and Dynamic Panels; Emerald Group Publishing Limited: Bingley, UK, 2001; pp. 93–130. [Google Scholar]
  120. Ozcan, B. The nexus between carbon emissions, energy consumption and economic growth in Middle East countries: A panel data analysis. Energy Policy 2013, 62, 1138–1147. [Google Scholar] [CrossRef]
  121. Hamit-Haggar, M. Greenhouse gas emissions, energy consumption and economic growth: A panel cointegration analysis from Canadian industrial sector perspective. Energy Econ. 2012, 34, 358–364. [Google Scholar] [CrossRef]
  122. Kao, C.; Chiang, M.-H. On the Estimation and Inference of a Cointegrated Regression in Panel Data. In Nonstationary Panels, Panel Cointegration, and Dynamic Panels; Emerald Group Publishing Limited: Bingley, UK, 2001; pp. 179–222. [Google Scholar]
  123. Pesaran, M.H. Estimation and inference in large heterogeneous panels with a multifactor error structure. Econometrica 2006, 74, 967–1012. [Google Scholar] [CrossRef] [Green Version]
  124. Pesaran, M.H. Testing weak cross-sectional dependence in large panels. Econom. Rev. 2015, 34, 1089–1117. [Google Scholar] [CrossRef] [Green Version]
  125. Granger, C.W. Investigating causal relations by econometric models and cross-spectral methods. Econom. J. Econom. Soc. 1969, 37, 424–438. [Google Scholar] [CrossRef]
  126. Engle, R.F.; Granger, C.W. Co-integration and error correction: Representation, estimation, and testing. Econom. J. Econom. Soc. 1987, 55, 251–276. [Google Scholar] [CrossRef]
  127. Dumitrescu, E.-I.; Hurlin, C. Testing for Granger non-causality in heterogeneous panels. Econ. Model. 2012, 29, 1450–1460. [Google Scholar] [CrossRef] [Green Version]
  128. Our-World-in-Data, Productivity per Hour Worked. 2022. Available online: https://ourworldindata.org/grapher/labor-productivity-per-hour-pennworldtable?time=1970..latest&country=MYS~KHM~VNM~THA~IDN~PHL~USA~JPN~KOR (accessed on 2 April 2022).
  129. Liu, Y.; Noor, R. Energy Efficiency in ASEAN: Trends and Financing Schemes; ADBI Working Paper 1196; Asian Development Bank Institute: Tokyo, Japan, 2020. [Google Scholar]
  130. GlobalEconomy, Innovation Index—Country Rankings. 2020. Available online: https://www.theglobaleconomy.com/rankings/gii_index/ (accessed on 2 April 2022).
  131. Vu, B.X.; Nghiem, S. Analysis of GDP trends and inequalities in Vietnam’s provinces and groups of provinces. Asian J. Empir. Res. 2016, 6, 167–186. [Google Scholar] [CrossRef]
  132. Vu, X.-B.; Nguyen, D.T.; Smith, C.; Nghiem, H.S. Vietnam’s responses to provincial economic disparities through central-provincial government financial relations. Australas. J. Reg. Stud. 2015, 21, 103–137. [Google Scholar]
  133. Vu, B.X.; Hoang, V.N.V.; Nghiem, S. Provincial divergence and sub-group convergence in Vietnam’s GDP per capita. J. Econ. Res. 2018, 23, 81–107. [Google Scholar]
Figure 1. The annual economic growth of six ASEAN countries. (Source: Authors’ calculations).
Sustainability 14 04540 g001
Figure 2. Findings of causality tests in the ASEAN countries.
Sustainability 14 04540 g002
Table 1. Descriptive Statistics.
MeanCambodiaIndonesiaMalaysiaPhilippinesThailandVietnamASEAN Countries
LnY6.387.878.977.528.356.917.66
LnK4.466.667.585.957.035.526.20
LnL15.7018.4816.1917.3717.4217.6317.13
LnEU5.716.657.766.147.276.176.62
LnFD4.236.689.166.488.526.236.88
LnHC2.143.175.043.264.633.023.54
(Source: Authors’ calculations).
Table 2. Panel unit root tests.
Tests LnYLnKLnLLnEULnFDLnHC
Levin, Lin & ChuLevel−34.19 ***−12.54 ***1.07−1.82 **5.28−3.32 ***
First difference−8.62 ***−8.32 ***−3.37 ***−7.42 ***−8.66 ***−8.09 ***
BreitungLevel0.574.311.86−1.31 *5.91−0.75
First difference−3.13 ***−4.60 ***−1.42 *−5.88 ***−3.16 ***−4.44 ***
Im, Pesaran and ShinLevel−13.28 ***−6.27 ***1.83−1.80 **4.58−1.86**
First difference−7.32 ***−7.00 ***−4.92 ***−6.81 ***−7.54 ***−7.22 ***
ADF-FisherLevel30.52 ***56.60 ***12.6227.47 **1.2525.70 **
First difference65.35 ***63.35 ***47.27 ***63.29 ***64.59 ***67.62 ***
PP-FisherLevel8.547.024.0215.011.7618.72
First difference74.39 ***97.78 ***61.43 ***91.79 ***77.53 ***110.78 ***
Notes: ***, ** and * indicate 1%, 5%, and 10% significant levels, respectively. (Source: Authors’ calculations).
Table 3. Panel cointegration tests.
Pedroni Residual Cointegration Test
Panel test statistics (within-dimension)Group mean panel test statistics (between-dimension)
Panel v-Statistic3.07 ***Group rho-Statistic3.27
Panel rho-Statistic2.40Group PP-Statistic−6.09 ***
Panel PP-Statistic−2.89 ***Group ADF-Statistic−4.47 ***
Panel ADF-Statistic−3.43 ***
Kao Residual Cointegration Test
ADFt-Statistic
−3.82 ***
Notes: *** indicates 1% significant level. (Source: Authors’ calculations).
Table 4. Panel FMOLS and DOLS estimates (dependent variable is lnY).
MethodPanel FMOLSPanel DOLS
LnK0.14 ***
(3.27)
0.17 ***
(3.69)
LnL0.80 ***
(11.98)
0.91 ***
(14.67)
LnEU0.11 **
(2.33)
0.09 *
(1.69)
LnFD0.06 ***
(3.28)
0.04 *
(1.91)
LnHC0.09 ***
(3.30)
0.07 **
(2.31)
Notes: ***, ** and * indicate 1%, 5% and 10% significant levels, respectively. Figures in the parentheses are t-statistics. (Source: Authors’ calculations).
Table 5. Results of FMOLS estimation (country-wise).
CountryLnKLnLLnEULnFDLnHC
Cambodia0.26 ***
(9.56)
0.33 ***
(25.57)
−0.12 ***
(−4.45)
0.13 ***
(10.54)
0.01
(1.08)
Indonesia0.32 ***
(4.09)
0.16 **
(2.69)
0.26
(1.34)
0.02
(0.65)
0.20 ***
(5.93)
Malaysia0.15 ***
(4.34)
0.19 ***
(3.23)
0.52 ***
(5.66)
0.01
(0.05)
0.10 ***
(3.12)
Philippines0.48 **
(2.76)
0.41 ***
(7.52)
0.47 ***
(4.17)
−0.03
(−0.41)
0.16 **
(2.47)
Thailand0.09 ***
(4.10)
0.18 ***
(5.83)
0.51 ***
(4.93)
0.01
(0.34)
0.13 **
(2.53)
Vietnam−0.05
(−0.41)
0.14 ***
(3.15)
0.63 ***
(3.49)
0.08
(1.48)
0.08 ***
(3.11)
Notes: *** and ** indicate 1% and 5% significant levels, respectively. The figures in the parentheses are t-statistics. (Source: Authors’ calculations).
Table 6. Results of panel Granger causality test based on Vector-Error Correction Model (VECM).
Dependent VariablesShort-Run CausalityLong-Run
Independent Variables
D(LnY)D(LnK)D(LnL)D(LnEU)D(LnFD)D(LnHC)ECTt−1
D(LnY) −0.02
(−0.62)
−0.05
(−0.22)
−0.09 *
(−1.97)
−0.01
(−0.14)
0.01
(0.61)
0.08 *
(−1.70)
D(LnK)1.14 ***
(3.09)
0.73
(1.08)
−0.26 **
(−2.07)
0.01
(0.16)
0.07
(1.15)
−0.33 ***
(−5.30)
D(LnL)−0.06
(−1.21)
0.03 *
(1.72)
−0.01
(−0.65)
−0.01
(−0.73)
−0.01
(−0.92)
−0.01 **
(−2.20)
D(LnEU)0.15
(0.54)
0.03
(0.41)
−0.38
(−0.73)
−0.02
(−0.34)
0.01
(0.39)
−0.02
(−0.56)
D(LnFD)1.93 ***
(4.26)
−0.09
(−0.61)
0.73
(0.87)
0.04
(0.26)
0.08
(1.13)
−0.06 **
(−2.06)
D(LnHC)−0.47
(−0.88)
0.29 **
(1.71)
0.20
(0.21)
0.15
(0.82)
−0.12
(−1.13)
−0.09
(−1.64)
Notes: ***, ** and * indicate 1%, 5% and 10% significant levels, respectively. Figures in the parentheses are t-statistics. (Source: Authors’ calculations).
Publisher’s Note: MDPI stays neutral with regard to jurisdictional claims in published maps and institutional affiliations.

