Abstract
Since the Paris Agreement in 2016, the goals of limiting climate change and moving toward climate resilience stand. With a share of about 80% of global CO2 emissions, the energy sector is an essential driver for these goals. A shift to low-carbon energy production and a decentralized system for more efficient energy transmission distribution is necessary. In this paper, we present our work on Modelling of Power Exchanges, Algorithms for Local Energy Market (LEM), Competitiveness of Combined Heat and Power Plant (CHP) and Energy Feedback Devices. The study was conducted considering technical, economic, social and regulatory framework. For easy integration into energy simulations or a district energy management system (DEMS), a model for power exchanges was created that allows flexible input or deterministic price patterns. The algorithm handles the clearing of an LEM by a district aggregator using limit orders with the goal of increasing the share of locally consumed electricity using economic incentives. An investigation was conducted into the operation of flexible CHPs in low-carbon power systems to balance the volatility of renewable energy. An Energy Signal Light (ESL) was developed as an energy feedback device, which is integrated into the DEMS in a living lab and allows individual configuration. In summary, the results presented should be compared with those of other research approaches in the future and require qualitative and quantitative evaluation.
1. Introduction
Energy related emissions account for almost 80% of the EU’s total greenhouse gas emissions [1]. As one measure to reduce the greenhouse gas emissions the European Commission has therefore decided to foster LEMs [1], because enabling Citizen Energy Communities (CEC) to operate LEMs can result in decarbonising the low-voltage distribution networks [2,3]. Natural persons, local authorities, including municipalities, or small enterprises shall establish CECs which ”may engage in generation, including from renewable sources, distribution, supply, consumption, aggregation, energy storage, energy efficiency services or charging services for electric vehicles or provide other energy services to its members or shareholders” [4]. Trivedi et al. [2] have reviewed the concept of community-based microgrids (C-MGs) and how LEM can be decarbonised. They also summarize how CECs can utilize C-MG solutions in order to set up LEMs. There, functional architectural layers, system integration topologies, interoperability issues, strategies for consumer-centric energy trading under LEM mechanism and socio-economic aspects are considered. Following the concept of the Smart Grid Architecture Model (SGAM) [5], Trivedi et al. [2] have have developed a generalised C-MG structure, which is based on social aspects, network zones and interoperable layers. However, C-MGs and LEMs somehow need to be implemented in order to allow CECs the participation at the energy market. Abrishambaf et al. [6] figured out, that most approaches miss the transfer from model to real world application. This is, where the Energetic Neighborhood Quarter (German: Energetisches Nachbarschafts Quartier) (ENaQ) project aims to contribute to by demonstrating, how energy can be traded amongst inhabitants within a residential district close to Oldenburg, Germany, called Helleheide. Details on the ENaQ project were described by Wehkamp et al. [7], Schmeling et al. [8], Brandt et al. [9].
This paper is part of a series of papers describing details of the implementation of the ENaQ project. Following the generalised C-MG structure [2] (cf. Figure 1), this paper explains:
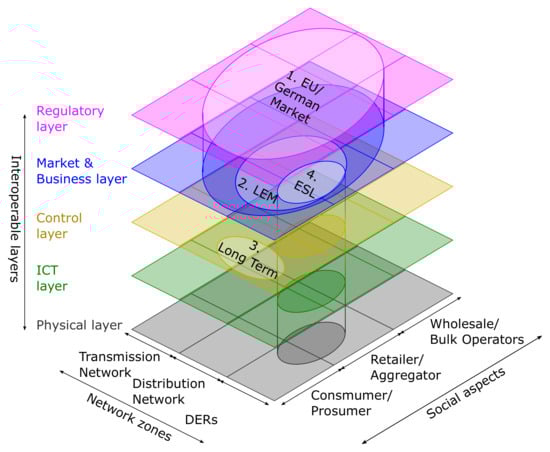
Figure 1.
Overview of concept and chapters in accordance with Santodomingo et al. [5]. 1. A model for EU or German market simulation is presented in Section 2. 2. An implementation of a LEM is described in Section 3. 3. A concept for long term operation is given in Section 4. 4. The concept for Energy Signal Light (ESL) is presented in Section 5.
- How energy markets are organised all over Europe (cf. Section 2) and why a LEM shall be implemented;
- How a LEM will be implemented in Helleheide during the ENaQ project (cf. Section 3);
- How the energy system can be operated in order to perform the transition to a completely sustainable supply via dynamic system operation (cf. Section 4);
- How the users in this case become informed regarding local availability of renewable energy via ESL (cf. Section 5). Other applications as prices or CO2 emissions would be possible.
The Sections are consistent within themselves so that the interested reader can focus on particular topics.
2. Power Exchange Markets in Energy Simulations
In energy system analyses, the economic efficiency factor of energetic plants is often an important object of investigation. Thus, business decisions are made on the basis of detailed design and operation optimizations of energy-saving plants. These optimizations are backed by an objective function that maximizes the economic efficiency [8,10,11]. In addition to the technical, regulatory and legal framework conditions, modelling of the external economic environment, the power exchange markets, is required. The aim of this chapter is to explain the power markets and to present an open-source market model that can be used in simulations. The market model is based on the respective market mechanisms with respect to the temporal resolution of the products and is backed by price patterns. The creation of the deterministic price patterns used here was presented by Wehkamp et al. [12]. The energy markets are divided into the derivatives market (future market), spot market and balancing market (frequency market). Beside the regulated energy exchange, there is also the possibility to trade directly. This is called Over-The-Counter (OTC) trading. The focus in this chapter is on the European Derivatives and Spot Markets for electricity (European Energy Exchange (EEX)) [13,14]. The balancing markets are not yet part of this work. The information source for the mechanisms and products of the exchanges are the websites of the respective exchanges and freely available information material. In the following, the individual markets are presented in Section 2.1 and Section 2.2, the available data of the markets in Section 2.4, and the new market model oemof.marketlib in Section 2.5.
2.1. Future Market
On the derivates market, traders, producers and buyers trade electricity and often also fossil fuels and CO2 certificates for corresponding power plants. On the one hand, derivatives markets serve to ensure that sufficient electrical power will be available or will be demanded in the future. It functions similar to a capacity market. This is achieved because there are up to several years between purchase and delivery. On the other hand, the derivatives market serves to hedge prices by allowing energy traders to adjust long and short positions to market developments. Behind very few trading volumes is an actual physical delivery [13,14] (cf. Table 1). This is well illustrated by the fact that the volumes of the national markets are often significantly higher than the actual consumption of the countries. For example, the gross electricity consumption of Germany in 2020 was TWh and the trading volume was TWh [15,16].

Table 1.
Historical trading volumes on European Electricity Exchange EEX and EPEX in TWh [17,18,19,20,21].
For continuous trading, the pay-as-bid principle applies. This means that the prices specified in the offer (bid price) are paid by the demanding parties. This market can be understood as purchasing the holding of a power/reservation, not the actual amount of energy produced. Physical delivery takes place only if the positions remain open until the last possible trading day. The products on the derivatives market have a lower resolution than on the spot markets. Here, mainly annual bands for baseload (0–24 h) and peakload (8–20 h) are traded.
2.2. Spot Market
The spot market is used for short-term trading of electricity. It is divided into the day-ahead market with minimal hourly and the intraday market with minimal quarter-hourly resolution. On the day-ahead market, the forecast electricity generation is matched with the forecast electricity consumption. On the day of actual physical delivery, differences arise between the forecasts. This can be balanced on the intraday market by the originating traders up to 5 min before. The energy system is balanced for the market participants (traders, suppliers, grid operators, last consumers) in quarter-hourly resolution [13,14]. In addition to the usual hourly and quarter-hourly contracts, there are further products over several hours, such as: Middle-Night (1–4 h), Early Afternoon (13–16 h) and Evening (19–24 h). The Market-Clearing-Price (MCP) is determined by the intersection of the supply and demand curves on the exchanges. At the European Power Exchange (EPEX), the uniform-pricing-principle (or merit-order-principle) applies to auction trading [22]. This means that all parties offering electricity receive the same price and all parties demanding electricity pay the same price. The spot market consists of day-ahead and intraday trading. Day-Ahead auction bids (Ask and Bid) can be submitted until the close of the exchange for delivery on the following day. The time of the market close depends on the national markets. On the intraday market it is possible to participate in the auctions and trade on the continuous market. On the continuous market, there are only very short intervals between trading and physical fulfillment, also called lead time. The lead time depends on the national market. The lead time is 0 min for Finland. The lead time is 5 min for Austria, Belgium, Germany and the Netherlands. The lead time is 15 min for Great Britain. Lead time is 30 min for France and Czech Republic. Lead time is 60 min for international Single Intraday Coupling (SIDC) markets. Intraday auction bids (Ask and Bid) can be submitted from the day before until the day of delivery. The respective traders are informed about the transactions that have been concluded.
2.3. Balancing Markets
The balancing power markets are not exchanges. They are used for frequency maintenance in real time. This means that deviations from the traded electricity quantities are balanced in real time and up to a duration of one hour. Currently, the mass of turbines of thermal power plants is used for frequency maintenance. The decline of these large turbines due to the focus on renewable energies, creates a technical need for alternative frequency maintenance measures. This includes, for example, the monitoring and planning of electrical flows as well as the availability of flexibility [13,14]. Electrically flexible consumers and producers are needed for this purpose. Depending on the speed at which the power is activated, they are differentiated.
2.4. Indices Data
The EPEX provides additional data on market activity. These are provided to enable traders to better plan market activity and thus provide an information basis for decision-making. This data can be used to model the markets. It is possible to precisely determine the respective supply and demand curves over the entire transaction logs. This is associated with an increased effort. Alternatively, it is possible to use processed data directly from the stock exchange. These include various indices: Index Price, ID1-Price, ID3-Price and WAP. These are explained in the following sections. The indices are often created for each of the markets (day-ahead, intraday), individual trading types (auction, continuous), national markets and products (e.g., 60 min, 15 min).
2.4.1. Day-Ahead
The Day-Ahead market consists of an auction-based market. Consequently, there are only indices for the auctions.
Auction Index
The Physical Electricity Index (PHELIX) is available for each market (German/Austrian, German, Swiss, etc.). The calculations for the indices may differ between the markets. The results are published around 13 h every day. The index values are given with a precision of two decimals and with the unit (EUR/MWh). The PHELIX is calculated using the volume weighted average of the hourly prices:
The prices are multiplied by their volumes to weight the prices for this index. n the number of time steps to be considered. This index is also available for block products: base (0–24 h) and peak (8–20 h). They are calculated using the arithmetic mean of the market clearing prices [23].
2.4.2. Intraday
The Intraday market consists of an an auction-based and a continuous market. Consequently, there are indices for each market.
Auction Index
The Auction index is available for several markets (e.g., Germany, Great Britain, Switzerland). The index has several time resolutions for the given products: 60, 30 and 15 min. The index price for the baseload is the arithmetic mean of the intraday indices between 0 and 24 h. The index price for the peakload is the arithmetic mean of the intraday indices between 8 h and 20 h.
Continuous Index
Some indices are updated close to real-time and some are updated one day after trading [23].
- IDFull index. The IDFull index has several time resolutions for the given products: 60, 30 and 15 min. All trades with the same time resolution are included in the calculation of the index. Block products are not taken into account. The IDFull index is calculated using the volume weighted average price Equation (see Equation (1)). This index is also available for block products: base (0–24 h) and peak (8–20 h) as separate indexes. If the trading capacity is less than 10 MW, a substitute value calculation is performed [23].
- ID1-Price. The ID1 index has several time resolutions for the given products: 60, 30 and 15 min. All trades within a 1 h timeframe before delivery are included in the calculation of the index. The ID1 index is calculated using the volume weighted average price equation. If the trading capacity is less then 10 MW, a substitute value calculation is performed [23].
- ID3-Price. The ID3 index has several time resolutions for the given products: 60, 30 and 15 min. All trades within a 3 h timeframe before delivery are included in the calculation of the index. The ID3 index is calculated using the volume weighted average price equation. If the trading capacity is less then 10 MW, a substitute value calculation is performed [23,24].
- WAP. The Weighted-Average-Price (WAP) is given with a precision of 5 decimals. The calculation and update of the WAP is given in real time (15 min update frequency). This frequent publishing of this index is to enables market traders to react to sudden market developments. At the end of the day, the WAP value is equal to the index price [23,25] (cf. Equation (1)).
2.5. Modeling of Energy Exchanges
The main objective of the following modelling is investigating which mixture of markets represents optimal income for power plants. Thus, a model representing one or several power plants and different simultaneous markets is required. The described section is implemented upon the model of Schmeling et al. [8], but is generic in its application. Both models are created within the framework of the open source framework Open Energy Modelling Framework (oemof) [26]. oemof is a framework for modelling energy systems. Within this framework there are repositories for various areas of modelling. E.g., oemof.solph for modelling energy systems or tespy for detailed thermal modelling [27,28]. The result of our work is the repository oemof.marketlib within oemof [29].
2.5.1. Data Sources and Data Preparation
The basis of the modelling is the price information available for the Future Base, Future Peak, Day Ahead, and Intraday Markets. Since the highest resolution of 15 min is for the Intraday Markets, time-series with this resolution are build for the four above mentioned markets. Historical data from power exchanges can be used for simulation, if available. Alternatively, this open-source model includes the price patterns created by Wehkamp et al. [12], which are based on historical data of electricity markets for Germany. The information on Future Base and Future Peak was obtained as one price value for each specific year. For Future Base Market, this value remains constant through the year, and thus needs no further modification. For Future Peak, a time-series with the price pattern needs to be build, which fixes the value of electricity at the given value if the time is inside 8 h (included) and 21 h (excluded), and is fixated at EUR/MWh if it falls outside this boundaries. For Day Ahead markets, the hourly values are resampled in 15 min resolution. For intraday values, these are compiled with their original resolution. These are latter build in a data structure with quarterly-hour price information for all the considered markets. The data build starts at 0 h on 1 January of the given year, and is built for a complete year.
2.5.2. Model Building
The modelling of a power plant that delivers electricity to one or several of these markets is built based on an optimization framework which allows estimating which is the optimal allocation of the produced electricity to maximize income. While this calculation can be simplified for power plants with constant output, volatile production plants require a much more sophisticated calculation. The optimization software oemof.solph allows modelling different kinds of power sources and optimize the total income. It provides a set of classes that allow building energy system models, such as Sinks, Sources, Buses and Flows. Power plants need to be modelled as Sources, where the production profile can be given as a fixed value or as a time series (with the required quarterly hour resolution). For volatile plants, a time-series with the production is required, which, similar to the market data, needs to start at 0 h on 1 January of the given year. Each of the markets can be modelled as a Sink, with the price information as a fixed value (as in the Future Base Market) or as a time series (as the case with the other markets). These Sources (representing a power production plant) and the different Sinks (representing each one a different electricity market) are connected to a Bus via unidirectional Flows to constrain any reverse power flow. This allows connecting one or many power plants to one or many electricity markets. Figure 2 illustrates the structure of the model.
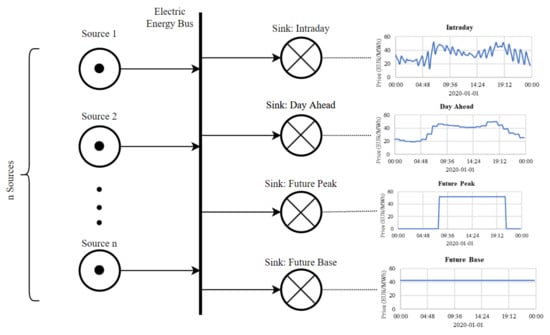
Figure 2.
Overview of the model structure representing one or several power plants and different simultaneous markets.
2.5.3. Market Constraints
Since there are contractual obligations related to each market, it is necessary that these obligations are reflected in the mathematical formulation of the model. These constraints were aggregated using the pyomo package, which is the basis for the optimization of oemof.solph. For Future Base Market, the same value has to be delivered during the whole year. This means that all the energy flow values have to be equal during the year, and thus equal to the first output of the year, which is left unconstrained and can be modified by the solver. For Future Peak Market, if the value is outside of the 8 h to 21 h (excluded) boundaries, it is constrained to 0. If the time stamp is within the boundaries, the price value must be the same for the whole year, and thus equal to the first non-zero output of the year. This first non-zero output is unconstrained and can be modified by the solver. For Day Ahead Market, the condition is that all the values within the same hour (i.e., from 9:00 to 9:45) have to be the same. This was reached by stating that every hour, the first value is unconstrained, and the remaining three are equal to the first one. The Intraday values are unconstrained.
2.6. Conclusions
In this chapter, the model of electricity markets oemof.marketlib used in simulations was presented [29]. oemof.marketlib can be used in simulations of power systems on different levels. For the simulation of international or national power systems, the market mechanisms of the respective nations have to be compared with those of the model and, if necessary, adjusted. Since the model data is based on EPEX, the need for adaptation is presumably small for countries where EPEX is the market regulator. These include: Austria, Belgium, Denmark, Germany, Finland, France, Luxembourg, the Netherlands, Norway, Poland, Sweden, the United Kingdom and Switzerland. Furthermore, with this model it is possible to equip smaller optimization models, such as the LEM presented in the following Section 3, with external markets. The advantage of oemof.marketlib is the low computational overhead, since the price models are preconfigured and computed as inputs independently of the rest of the model. The disadvantage is the need for data on the markets to be modelled as well as the verification of market mechanisms for countries other than the EPEX countries. Furthermore, the modelling of future developments is strongly dependent on the quality of the input parameters for the price pattern generation. In this respect, it must be critically emphasized that the price patterns used by Wehkamp et al. [12] have not yet been subjected to any further qualitative or quantitative evaluation. A comparison of the often used agent-based market models with the one presented here can give beneficial insight into the quality of oemof.marketlib.
3. Local Energy Market
Motivated by climate protection and the phasing out of fossil fuels, the use of Distributed Energy Resources (DERs) is increasing more and more, especially at the local level, e.g., by installing photovoltaics (PV) on the roofs of private households. These households are increasingly acting as prosumers, i.e., they generate electricity in this manner and usually consume a large part of it themselves [30]. However, from a technical point of view, complete self-consumption and self-sufficiency are hardly achievable, so the existing electricity grid is used to compensate by supplying missing electricity and receiving surplus electricity. Of course, it would be possible to trade missing and surplus electricity through the national markets presented in Section 2. However, as should become clear during this chapter, these markets are highly complex, difficult and expensive to access, especially given the idea that individual households should participate in them. Therefore, there are approaches to bundle DERs in virtual power plants and to trade the capacity portfolio of such plants on national markets [31]. However, these markets’ assumption that energy can flow in any direction on copper plates is difficult to realize. In reality, the market results and thus the schedules of the power plants are compared with the limits of the grid, and congestion management has to take place. In order to avoid grid bottlenecks, the use of more expensive power plants is necessary. From this point of view, it makes sense to combine consumption with generation as locally as possible and thus avoid grid bottlenecks from the outset. To efficiently accomplish this, creating small-scale markets that offer the possibility and incentive of local energy use is a must.
For districts, as in our case study, this means building a Local Energy Market (LEM), where prosumers are enabled to trade their energy within the neighbourhood. National markets should only be used as a backup when the district cannot supply itself or produce too much electricity. By bundling neighbourhood energy consumers, it would also be possible to achieve greater market power on national markets and lower prices for residents overall. In addition, the involvement of residents in the local energy supply would be conducive to acceptance and participation. Nevertheless, allowing local energy trading within a district raises regulatory, participatory, organizational, and technical questions. In this chapter, we present a broad overview of the local energy trading efforts at ENaQ.
3.1. Related Work
As a definition for LEMs, we follow Weinhardt et al. [32]: “market platforms for trading locally generated (renewable) energy among residential agents within a geographic and social community. Supply security is ensured through connections to a superimposed electricity system (e.g., superimposed grid or adjacent LEMs)”. Two parts of this definition shall be emphasized: firstly, the local market is for a geographically very limited area, here the Helleheide district, and secondly, the market does not aim for an autonomous island system, but for a market that is also grid-connected.
In the literature, one can find extensive studies on the topic of LEMs, and there are many publications on different market mechanisms. An overview of LEMs is given in [33]. The authors distinguish between market-clearing method categories, mainly describing distributed methods without a central clearing entity, auction-based methods and multi-level optimizations.
Another overview of current LEMs can be found in Zang and Kim [34]. Here, there is a particular focus on battery storage usage in local markets to help flexibility in trading. Zia et al. [35] discuss and categorize the operation of microgrids in many different dimensions, including the design of LEMs.
Many of these publications fail to mention the actual feasibility of the approaches, particularly in the social, legal, and economic dimensions. The algorithms are essential to the problem, but such approaches will not be established without a sustainable and feasible business model. The approach we have chosen is therefore explicitly holistic and attempts to create an LEM for ENaQ while taking into account real-world conditions.
3.2. Starting Point in the Helleheide District
The establishment of LEMs in residential districts ultimately requires the acceptance of the residents, who should actively include such systems in their everyday lives. For this reason, development initially started with citizen participation.
The first question is whether the residents of a district such as Helleheide have a general interest in energy and how much they want to become involved in processes and decisions. For this reason, we conducted a general online survey in 2019, the results of which are published in detail in [9]. It turned out that over 90% of those surveyed are generally prepared to no longer obtain electricity exclusively from conventional energy suppliers but would be willing to buy electricity from their immediate neighbourhood. For many, however, the essential prerequisite would be an associated reduction in either costs or emissions or both. 80% of respondents also said they were interested in innovative electricity tariffs such as dynamic pricing. In summary, citizens show a high interest in local energy systems and the courage to try new things.
Based on these initial results, the project partners devised an idea for a modified LEM for the district under study. The proposed LEM would allow residents to buy electricity (proportionally) directly from the neighbourhood and, through this option, reduce both costs by eliminating grid fees and emissions by optimally integrating renewable energy. We began by evaluating the approaches found in the scientific literature (cf. Section 3.1) for their feasibility in real projects. We had to modify them to the extent that they could be implemented in the current German regulatory framework, which is discussed in more detail in Section 3.3. As a result, there are two implementable clearing algorithms published in [36,37]. However, on the one hand, these two proposals still contain much freedom of design and are only prototypes and general feasibility studies. At this point, it is crucial to come back to the citizens and to consult with them whether the concept developed behind closed doors (inward participation process [9]) meets their expectations and where there is a need for improvement and optimization. On the other hand, these proposals only prove the applicability in the current legal framework, but not the possibility of IT-technical implementation. The general methodology, as well as the necessary modifications of the algorithms to a technically feasible solution, will be discussed in more detail in Section 3.5. In the end, however, all four aspects (participation, technology, business model and legal framework) must always be seen together. It is essential to constantly mirror the intermediate results, especially to the future users, as will be discussed in Section 3.4.
3.3. Regulatory Framework and Business Models
A challenge for LEMs is the regulatory framework, as described in [32]. The legal framework often differs massively between different nations. For the time being, we have used the German law as the base for the proposed LEM. This should be similar to many other EU countries, but it should a detailed comparison before applying it in other countries is necessary. The proposed approach to allow local energy trading is a novel business model, the so-called district aggregator. The district aggregator performs four core tasks in this context [9]:
- Buying surplus energy from the producers in the district;
- Selling unneeded energy on external markets;
- Buying missing energy quantities from external markets;
- Selling the resulting energy mix to consumers in the district.
As external markets, it primarily uses the national energy markets described in Section 2. This is possible because it achieves the necessary market power by bundling the actors in the district. In addition, the bureaucratic effort of the neighbourhood actors is reduced by this bundling, and regulatory processes can be carried out with the necessary professionalism. In order to be able to offer consumers attractive prices on the market, the district aggregator must set up a so-called “Kundenanlage” (customer system) operating the electricity grid only within the district itself. This solution eliminates a large part of the grid charges, taxes and levies that would otherwise be incurred based on the current (early 2022) legal frame. However, this also entails higher costs and risks. The district aggregator can finance and secure itself either through a margin on the market algorithm described later or through a fixed contribution rate from each actor. The regulatory framework for ENaQ as well as the required business model of the district aggregator has been described in detail in [9,37].
3.4. Involving Citizens in Local Energy Market Design
The social approval and acceptance of the decisions associated with the structural change in the German energy system is a crucial factor [38]. Human behaviour is not primarily determined by objective scientific facts but by the subjective perception of individuals [39]. Voluntariness, controllability, a balanced distribution of risks and benefits, as well as trust in risk management are decisive factors influencing how a technology is perceived and accepted [38]. As explained above, the LEMs works only if the residents actively use it. Therefore, it is necessary to consult with them to determine if the proposal meets their expectations. Surveys are a well-known form of consulting with citizens. However, a key aspect of a survey’s output being useful lies in its design. If the questions are unclear or misunderstood, the results may lead to incorrect information. Therefore testing the questions and questionnaire is also an essential part of the design. The testing may help reduce technical problems, misunderstanding of questions, or even improve the order of the questions to motivate participants to finish the survey. There are different methods for the testing phase that can use [40,41]. Seeing the complexity of the topic, including new technology and a complex legal framework, and seeing the work of [38], we decided on focus groups as a method for the pretesting. A focus group would make it possible to understand people’s perceptions and understandings regarding the local energy trading scheme, which were the central questions in the survey. Therefore two focus groups took place as a pretest, followed by the quantitative online survey.
3.4.1. Focus Groups
Focus groups are a suitable and relatively resource-saving qualitative survey instrument to involve a limited number of citizens in a discourse process [42]. As Morgan [43] expressed, “the hallmark of focus groups is their explicit use of group interaction to produce data and insights that would be less accessible without the interaction found in a group”. In this case, the focus groups served to pretest, more concretely improve, the online survey. Due to the COVID-19 pandemic, physical participatory events were impossible, so the focus groups were held online.
In the ENaQ participation process, we understand there are different participation forms, from inward (only project partners) to outward (only external stakeholders) and hybrid (participants from both), for more details on participation process design in ENaQ see [9]. For the two focus groups we conducted, one was within the inward participation format, and one was outward participation. It is essential to mention that ENaQ has a varied group of partners, as its consortium is multi-sectoral. Therefore inward participation still allows for a multi-perspective approach. Furthermore, both focus groups were moderated and accompanied by three further researchers who took part in taking notes and looking into the non-verbal communication of the group. The focus groups were also video recorded. The groups’ size was decided based on research that stipulates that smaller groups are more productive and allow for an equal participation [44].
The first group with only project partners (inward participation) took place with seven participants, all but two from different institutions and professional backgrounds (for example, IT, construction company, research institution) and a balanced number of women and men. After the first focus group, we analyzed all the input and feedback recollected and improved the survey based on this information.
At this point, a second focus group with people not directly related to the project (outward participation) took place. In this group, we had five participants with a mixture of age, sex, qualifications and professional backgrounds. The goal was for the focus group to be as varied as the survey respondents group we wanted to reach.
In both focus groups, we first introduced the goal of the focus group: survey testing and improvement. For focus group two, we briefly introduced the project. Then we gave the participants time to answer the survey live and took notes on the time it took for each of them to respond. We asked them to take notes on each item, when necessary, for example, something that was not clear, that was too personal, technical issues, or any other comment they thought to be necessary. After each participant finished, they shared the comments they wrote down; this allowed for equal participation. Finally, we had time for an open discussion about the items commented on, as this was the goal of the focus group, to use the group interaction.
The focus groups offered a participation form from an early stage, improving the survey’s design as explained in Section 3.4.2.
3.4.2. Survey
The intense interaction and constructive feedback in the focus group were very relevant to the design and improvement of the survey. Through the focus groups, we were able to:
- Timely clarify questions;
- To eliminate redundancies;
- To include clarification of concepts or definitions where necessary;
- To make it more user-friendly;
- To reorganize questions to make it easier for the respondents to follow.
The group interaction was a relevant aspect of this process since it opened conversations and discussions, allowing for feedback from different perspectives, especially concepts and definitions. It was essential to consider how one word might be understood differently and how to clarify it in the survey. Another main discussion point was the questions regarding values used to determine the respondents’ social milieu. In the discussion, it was clear that these questions made some participants feel uncomfortable. Therefore, we included a more clear text explaining the relevance and use of the questions and the option to opt out of this section. Furthermore, relevant feedback came in terms of technical issues, such as the tools to respond to the selected question.
The result was a survey with six sections and a total of 40 items, with an approximately response time of 15 min. The survey included questions regarding LEMs, a proposal for an online App (cf. [36]), and questions to evaluate such. Finally, we included questions about demographics and values to determine the respondents’ social milieu. The survey was conducted online from 29 March 2021 to 31 August 2021. The survey results will be analyzed and be part of a future paper.
3.5. Local Market Setup
The design of the local market depends on the local situation regarding the number of participants, the participant structure and the anticipated goals. In ENaQ, we have around 140 possibly participating households and a very limited number of energy generating participants of probably below five. Due to regulatory requirements (cf. Section 3.3), a district aggregator is part of the local market as a clearinghouse.
3.5.1. Clearing Algorithm
As the basic mechanism for the local market, an auction-based clearing method with limit orders both from the sellers and buyers was chosen. This basic mechanism allows both the buyers and sellers to actively participate in the market and express their value for a feature of the energy such as local generation and low carbon emissions. The limit orders also allow the participants to limit the prices they pay for the electricity, even though this constraint has been softened a bit, as described in the following.
The mechanism is depicted in Figure 3 and consists of four parts. The user can see the sellers’ table with the limit orders on the left, and the buyers’ table is on the right. The matching is depicted by the connecting lines between the orders in the tables. The pricing algorithm calculates the price of each sale. The calculation is next to the respective matching line.
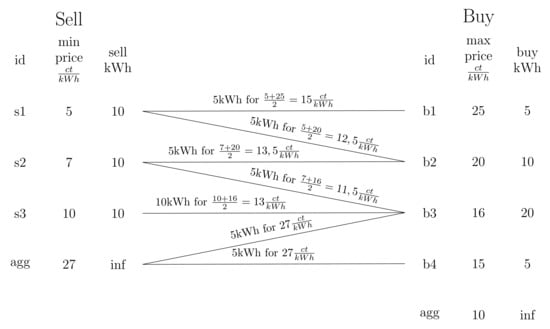
Figure 3.
Clearing mechanism for limit orders. The matching is performed from top to bottom. Starting with the first buyer b1, the demand of 5 is met by the first seller s1, which then has 5 left to sell. This one is used for the demand of the second buyer b2 and so on.
In our market framework, parts of the clearing algorithm are interchangeable. The matching algorithm can be changed, for example, by changing the sorting of the bid-tables. The pricing algorithm can be changed so that the price calculation and the incentives for the buyers and sellers change. We present the standard components intended in the first version in the following.
On the sellers’ side, the bids are ordered ascending by the limit (min_price), on the buyers’ side descending by the limit (max_price). Additionally, each buyer and seller states the amount of energy that needs to be bought or sold.
The matching algorithm iterates through all buyers and sellers from top to bottom and matches them accordingly. This process is performed once per cleared order book, for example, once every 15 min. Due to the sorting, the algorithm starts with the lowest sell price and the highest buy price and iterates down to the highest sell price and lowest buy price. This can be seen in Figure 3. A buyer can buy from multiple sellers, and a seller can sell to multiple buyers. The matching algorithm affects the market behaviour. For a market where local energy is scarce, buyers with high limits have a higher chance to be delivered with local energy. This may be beneficial to obtain lower prices compared to the energy from the grid and may also be an ideological incentive to support the local generation or obtain green energy.
The pricing algorithm calculates the price for each transaction. In the current version, the price for a matching buyer–seller pair is the mean from the two limits. This has some incentivizing side-effects: a seller who offers a lower price may be matched to the buyer with the highest price, leading to a higher price for the seller. On the other hand, the buyer has the incentive to bid a higher price to be matched to the cheapest seller, resulting in a lower price for the buyer. The external markets, here represented by the aggregator agg, are an exception in the price calculation. If the external market is involved, the price from the external market (seller or buyer) is used, and no average is calculated. This can be seen in the lower two transactions where the price is 27 cents per kWh. The additional service that the external market offers to justify the fixed price is the theoretically unlimited amount of energy they can buy or sell. The price offered here can also be the margin for the aggregator running the local energy grid: the aggregator buys and sells the surplus or missing energy at the national energy market, possibly to a better price than offered in the local market. The pricing algorithm is a possible candidate to change the market’s incentive, wherefore it is interchangeable in our market framework implementation. For example, it would be possible to always use the price from the seller, not the average price from the bids from the seller and buyer of a match.
3.5.2. Including Controllable Devices
The basic market schema presented above has some limitations. Mainly, controllable devices such as Energy Storage Systems (ESSs) are not taken into account. Those intend only to charge if there is surplus electricity from the local generation. The current market design could not limit their supply to the local generation or their sales to local consumers. We address these issues with an extended version of the local market, which is depicted in Figure 4.
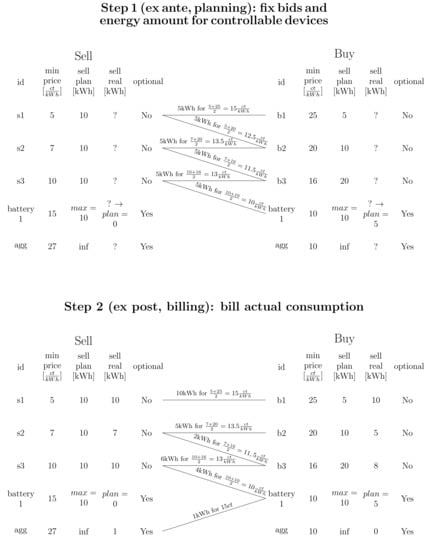
Figure 4.
Clearing mechanism for limit orders with controllable systems and possibility for divergent consumption and generation.
The first addition is the optional field. Controllable devices use the field by which they can buy or sell a certain amount of energy but can also decide freely if they will do that. This is opposed by household consumers, which cannot simply control their consumption, or solar systems, which cannot control their generation. This is also the reason for splitting the auction into planning (ex ante) and a billing step (ex post).
The planning step is performed before the actual consumption and generation happen, for example, before a new 15-min window. In this step, the participants make the bids with the limits. The prices cannot be changed afterward. Additionally, the forecasted energy amounts are added in this step. The forecasts have to be delivered by the market participants themselves, e.g., through forecasting algorithms that take historical data and weather forecasts into account. Nevertheless, with this two-step approach, it is acknowledged that the consumption and generation cannot be predicted with a 100% accuracy. The optional consumers and generators, here battery 1, add themselves to the market with the maximum amount of energy they want to buy or sell. Then, the market-clearing algorithm is run on the available orders with the forecasted data. The result in this example is that the battery currently cannot sell anything into the local market, but it can buy 5 . It would have bought at maximum 10 , but only 5 where available locally. Therefore, the battery will only consume these 5 in the time slot where this market-clearing run is for. In case a battery with buys and sells energy, the amounts are balanced.
The billing step is performed after the respective time slot, hence, after the actual generation and consumption. As can be seen in Figure 4, the actual generation and consumption differ from the plan. Now, the clearing algorithm is rerun, and the actual deliveries are calculated. The battery has planned to consume 5 , which is not changeable during the time period. Unfortunately, the locally available surplus energy has been less than expected, wherefore the battery consumes 1 from the grid. It can be seen here that a good forecast helps better manage the devices and that the planning step is helpful to have an estimate about the next time slot.
3.5.3. Discussion
The presented market design based on limit orders has the goal to integrate controllable energy devices such as batteries, non-controllable generation such as PV, non-controllable consumption from private households, and the energy grid. The planning step in the two-step approach makes it possible to plan the next time slot for controllable devices, while the billing step takes into account that the actual generation and consumption can differ from the plan.
The deviation from the plan is expected to be lower when the forecast is shorter, i.e., when the time slot for which the market is cleared is smaller. Hence, it could be helpful to reduce the time slot size from, for example, 15 to 1 . Nevertheless, the downsides are a higher communication overhead and shorter times for the energy systems. For example, a CHP would preferably run for a longer period of time instead of being turned on and off every few minutes or even seconds. The effects of different sizes for the time slot need to be analyzed.
The described pricing algorithm matches the highest buyer’s bid with the lowest seller’s price and takes the average of the two prices. This has the effect that the buyers have the incentive to bid higher prices to be matched with a cheaper seller, and the sellers have the incentive to bid lower prices to be matched with a more paying buyer. Nevertheless, the market consequences of this pricing algorithm have not been investigated; further, i.e., simulations and real-world tests are an open issue for further research. Similarly, some shortcomings would need to be investigated, e.g., how to handle the case that the same battery wins bids both in the selling and buying market.
3.6. Conclusions
In this chapter, we have presented a realistic and comprehensive approach to establishing LEMs under the current German framework for a residential district. Motivated by the efficient use of DERs, the higher market power on national markets, and the participation of residents, we presented our design process with the participation of citizens, including preliminary results. Building on that, we presented a market mechanism based on limit orders. It shall enable LEMs to integrate local consumers, local DERs such as PV, local ESSs and the grid in the market. The market implementation allows changing the matching and pricing algorithm. Research on the effects of the algorithms with simulations and real-world tests is necessary.
4. Long-Term Competitiveness of Combined Heat and Power
In an integrated energy supply system, heat generation devices play a big role in the electricity supply. This can be on both, the supply or the demand side, depending on whether a CHP or a Heat Pump (HP) is used. Thus, it is advised to spend special attention to these participants of the energy market.
Especially heating systems are replaced infrequently. In Germany, about 40% of the heating system were installed more then 20 years ago [45]. According to the applicable norm [46], boilers, HP or CHPs have depreciation periods of 15 to 20 years. Thus, not only current conditions play a role but foreseeable changes should be considered.
Energy costs are highly influenced by political decisions. On the one hand, the energy sector is highly subsidised [47]. On the other hand acquisition, distribution and margin only account for a fraction of the energy prices for households, i.e., in Germany, half of the price for natural gas is related to these market-related factors (25% taxes, 25% fees), while it is only 22% for electricity (23% taxes, 30% fees, 25% surcharges) [48]. So, in this Section the focus is on the mid to long term competitiveness in terms of CO2 emissions.
Coupling of the electricity and the heating sector, does not only allow for decarbonising space heating but does also provide flexible demand to match renewable production of electricity [49,50,51]. To fully use this potential, an energy system has to either use renewable electricity when it is available or alternatively produce electricity that complements the production of (other) renewable sources. Figure 5 displays real-world data for electricity demand and production for January 2022, as well as resulting specific emissions. Within that time frame, the CO2 intensity of grid emission varied between about 200 g/kWh and 700 g/kWh. Concluding, it is not sufficient to assume a gradually decreasing emission factor for electricity; instead time-varying emission factors are needed.
Figure 5.
Example time series for electricity production and demand as well as resulting emissions attributed to grid electricity [52].
4.1. Grid Emission Model
A modelling approach for this kind of data combines information about of power plants with historic weather data. The software DeFLeX [53,54] offers such kind of models of the German energy supply. By scaling the installed capacities of the power plants, time series for both, market clearance prices and specific emissions, are be created for various scenarios. For the sake of simplicity, in this paper the focus is on scaling the installation of wind power plants.
There are some simplifying assumptions made for the model, i.e., times for ramping up or down thermal plants are neglected, meaning negative electricity prices are abundant and zero emissions are reached if the supply of renewable sources is sufficient. While this does not correctly reproduce all details of the quantities of interest, the errors of the DeFLeX models are mostly systematic [55]. As this means all time series are effected in the same way, we consider it capable to investigate trends and long-term changes. The present study focuses on the addition of wind power to the national grid and is implemented by scaling historical generation data [56] of 2017. We consider two scenarios, both differ in the installed capacity of onshore wind farms. This choice has been made as we assume the impact greater when compared to PV, because heat demand is typically higher when sun is shining less. The value of 55 GW refers to the capacity currently installed [57], while 105 GW are a projected for 2030 [58] or 2035 [59]. The resulting CO2 emissions are given as a time series in the Supplementary Materials.
4.2. Ecologic Competitiveness of Operation
In the following, we investigate the long-term competitiveness of CHPs in systems where also a HP is available. For the latter, the Emission Factor (EF) depends on the (time-dependent) Coefficient Of Performance (COP) and the EF of the grid electricity
For the CHP, there are various methods that can be used to attribute emissions and costs to the produced electricity and heat [60]. As the breakdown is actually less important than the total, we subtract avoided emissions in the heat sector
where and denote the electrical and thermal efficiencies, respectively. Note that this way the calculation of total emissions just for the electricity sector is offset. In particular, the resulting emissions can be negative. Thus, the heat sector has to be considered to obtain meaningful absolute values. Combining Equations (2) and (3), yields
The simulation should be understood as a prove of concept and therefore rough estimations for efficiencies and COP are taken. The COP is assumed to be constant at 3. This corresponds to a ground-source heat pump that provides a flow temperature of about 50 °C, making it a conservative estimate. For the CHP, we set , , and . The latter is assuming natural gas.
Figure 6 shows duration curves for the specific emissions of the grid electricity and the CHP calculated according to Equation (4) for the two scenarios for the installed wind farm capacities. It can be seen that under current conditions (55 GW), the CHP is competitive approximately half of the time (the delta is less then zero in the lower panel in Figure 6). For the almost doubled capacity (105 GW), this time reduces to approximately 30%.
Figure 6.
Duration curves (100% corresponds to one year) of the emission factors of electricity from both, CHP and grid, for two scenarios of nation-wide installed wind capacity (upper panel) and difference of the two duration curves (lower panel). Based on data from [55,56].
If there is no option to store electricity or to reduce demand and to reduce global emissions that way, it is beneficial if a CHP can produce electricity when it is competitive. While these points in time where the CHP is competitive should become fewer with an increasing share of renewable energies, they do not stop to exist and operation strategies need to be developed in order to reduce emissions. At other times, heat has to be either produced using alternative techniques or provided by a storage. To estimate required capacity of a complementing heat storage, the duration of non-competitive times is relevant. A possible measure is the time since the last hour the CHP was competitive. Although one hour might not be enough to fill a storage, this quantity can provide an estimate—especially as the typical period is longer than this minimal time. It is displayed in Figure 7.
Figure 7.
Duration curves of the time since the last moment the CHP was competitive. (Steps are due to hourly time resolution.)
It can be seen that under current conditions of installed wind capacities (55 GW) a storage period of one day is sufficient to cover approximate 75% of the time. For the 105 GW scenario, the one-day storage can increase the time possibly covered by CHP heat increases from 30% to 45%. At other times, a different heat source has to be available if the operation of the CHP should not increase the local specific emissions of the electricity. To supply all heat by the CHP, significantly more then a week has to be buffered, rarely. On the other hand, one day of storage capacity combined with a HP is sufficient to perform load shifting so that electricity is only consumed when grid electricity has less specific emissions than the electricity provided by the CHP in 82% of time. For the increasing availability of wind power, this value increases to 92%.
4.3. Conclusions
It was shown that CHPs can find points in time for the production of electricity when they have emissions competitive to the upstream network, provided that there is demand for heat. In this scenario that uses a flow temperature of 50 °C which is not optimal for heat pumps, running an existing CHP is an ecologic option about half of the time when compared to the current German electricity mix. However, this result also implies that a HP is the better option if a single heat source is desired. The usage of this competitive time can be significantly expanded by a heat storage. In the investigated scenario, competitiveness increases to 75% of the time and remains at 45% of the time even if the capacity of installed wind turbines in Germany is doubled.
As the CHP has to be complemented by a second heat source to limit the size of the required heat storage, they also have to compete with this second heat source. So, the question remains for how long CHPs can remain profitable. Provided that the CHP is already in place, as long as the revenues from selling electricity cover fuel and maintenance costs. In a LEM this is easier to achieve.
It is ecological beneficial to operate CHPs as long as there is residual electric load. In this sense, load shifting is a favourable, yet more challenging solution. Traditionally, for residential demand the focus is on automated control of smart devices. Especially in a local energy community, empowering informed individual behaviour can be considered as an additional option.
5. Using Electricity Smartly with the ESL
This chapter describes the idea and our prototype of an Energy Signal Light (ESL). The purpose of the ESL is to indicate to the neighbourhood resident when it is beneficial to use electrical energy. For example, it is favourable during the periods when a lot of renewable electricity is produced in the neighbourhood.
The ESL is an energy feedback system. With energy feedback, information about personal energy consumption and potentially other energy data is provided to the residential consumer to effect a change in the consumer behaviour. Energy feedback can increase the awareness of energy consumption and can lead to changes in consumption behaviour [61]. Vine et al. [62] states that energy savings of 5% to 20% can be achieved by visualizing energy consumption using smart meters and digital displays. Many previous studies in the field of energy feedback investigated the effect on energy savings, especially the electrical one [62,63,64]. In extension, the goal of the ESL is to optimize the time of personal energy consumption with the help of load shifting. This way of conscious and well-timed consumption is intended to counteract the weakness of some renewable energy sources, such as solar- or wind power, namely weather-related fluctuation. The conventional solution would be electricity storage, which has disadvantages of requiring energy and materials to produce, operate and recycle, besides having high investment and operational costs at the moment. Load shifting with the help of the ESL comes to assistance in this regard. By load shifting, part of the electrical energy can be used directly without conversion losses of the electrical storage. Due to the adapted and increased direct consumption of electrical energy at times of high feed-in of renewable energy, smaller amounts of energy need to be stored. Lower stored energy amounts allow the electrical storage to be dimensioned smaller, thus saving resources and energy. The ESL is a lamp that can turn green or red. At optimal consumption times, the ESL turns green, signalling to residents the timing of conscious and smart energy consumption; for example, favourable time to switch on the washing machine or dishwasher or charge the battery of the e-bike during these times. In this way, every resident with a conscious electricity behaviour can physically increase their renewable energy share of electricity consumption and actively support the energy transition. The idea of the ESL has already been tested in field trials in the Franklin district in Mannheim (Germany) [65,66]. A similar, but purely digital approach to load shifting by using forecasts for today and tomorrow is taken by the Peakpick homepage [67].
We conducted an online survey to gather opinions on the ESL. For this purpose, we used a questionnaire with 26 questions on attitudes towards energy issues, the ESL, another demonstrator of the project, as well as demographic and other information of the participants. The 250 respondents were not familiar with the ESL before the survey. The survey concluded the following:
- 86% of respondents do not yet use systems to control their energy consumption, such as electricity meters, smart plugs, smart sockets, or apps.
- 75% of respondents can imagine using an ESL in their everyday life to optimize their energy consumption.
- 30% of respondents feel the hallway is an ideal location for the energy light, while 26% of respondents have no preference about location.
- 76% of respondents consider a local, green surplus power for display option as helpful. Low-carbon electricity was considered helpful by 65%, low-cost electricity by 64%, and a comprehensive algorithm by 64% of respondents.
- 73% of respondents would like to decide for themselves which of the display options is shown to them.
These lights are to be installed in every residential unit in the ENaQ neighbourhood called Helleheide. Our current ESL demonstrator consists of four components: a lamp, a frame, a power supply and a remotely controllable power switch (namely, the Shelly 2.5 (https://shelly.cloud/products/shelly-25-smart-home-automation-relay, accessed on 17 February 2022)). The demonstrator has the dimensions of a conventional light switch and fits together with the communication device into a flush-mounting box. To switch states (turning the light red or green), the ESL relies on external information from the DEMS, which publishes any changes using a message broker. The two main goals of the DEMS are to monitor and intelligently control all energy components in the neighbourhood. The controllable power switch of the ESL obtains the required information from the message broker and switches the corresponding lamps on and off. The demonstrator is displayed in Figure 8.
Figure 8.
Demonstrator of an ESL: (a) ESL is green. (b) ESL glows red.
Similar to the use in apartments in multi-party buildings, it would also be possible to install the ESL in a single-family house with its PV system. In this case, the ESL could turn green when the PV system produces more electricity than is consumed in the house. This display option would help the homeowner increase the self-consumption of own PV generation and thus reduce electricity costs.
Besides the good conscience of making something count for the energy transition and the environment, a dynamic electricity tariff can be an additional motivation for the user [9,68]. With a dynamic tariff, the electricity price fluctuates, for example, depending on the stock exchange price or during peak hours of high consumption. Since the stock exchange price is often low at times of high regenerative generation, the resident can save electricity costs by conscious consumption behaviour and load shifting, in case of electrical tariff with flexible prices.
6. Conclusions and Outlook
Concluding all over, we have presented a European/German market model where LEMs under the current German framework for a residential neighbourhood are linked to. Operating a CHP system with sufficient storage allows operation of CHPs at reduced emissions, even when wind power increased in the upstream network. Finally we introduced the concept of Energy Signal Light (ESL), which are used as an energy feedback system for residential consumers. More detailed conclusions can be found in the appropriate chapters.
As the ENaQ project proceeds, the concepts will be implemented and tested during operation of the Helleheide district. In the future, the results presented need to be compared with those of other research approaches and require qualitative and quantitative evaluation.
The presented electricity market model, based on EPEX, is a tool which requires low computing capacities. The method created for it is subject to the requirement of deterministic generation and the basis of historical data. This limitation suggests an effect on the quality. Quantitative and qualitative investigation in comparison with alternative approaches is needed to evaluate this conjecture.
The European Union intends to promote the participation of the citizens on energy markets and decentralised energy production. Seen from the current point of view, it is not clear if LEMs will be implemented all over Europe. Therefore LEMs need to be seen as one possible embodiment of the European Unions goals. Therefore, the proposed approaches of this paper need to be seen under that perspective as well. Furthermore, as mentioned before, the results of the survey will be analysed and introduced in a future research paper, in order to better understand the citizen’s interest in their own participation in energy markets.
With increased availability of renewable sources, the role of a integrated heat supply in the LEMs will probably shift from generation (CHP) to consumption (HP) of electricity. Sufficient heat storage capacity, however, facilitates timed operation, and thus increases the heat demand that can still be covered by a CHP in an ecologically favourable way. The influence of incomplete knowledge and imperfect forecasting on the results should be addressed in future work. Upcoming research should also investigate to which extent the shift will be accelerated by renewable energy storage such as batteries or power to gas.
In the near future, the previous Energy Signal Light (ESL) demonstrator is to be further developed and improved in three points: First, the ESL should communicate via the Long RangeWide AreaNetwork (LoRaWAN) of the neighbourhood to be independent of the Wi-Fi of the residents. Second, the design and usability shall be evaluated and improved in a co-design workshop and study with citizens. Third, each resident should have an opportunity to choose which display option their ESL will show. Nevertheless, there are still some research questions which need to be explored such as: How strong is the effect of the ESL on the residents’ behaviour? Which display option has the strongest effect? Is additional information such as a forecast for the next day useful?
Supplementary Materials
The following supporting information can be downloaded at: https://www.mdpi.com/article/10.3390/en15082749/s1, co2_emission_055GW.csv: time series of CO2 emissions for scenario of 55 GW of installed wind turbines; co2_emission_105GW.csv: time series of CO2 emissions for scenario of 105 GW of installed wind turbines.
Author Contributions
Conceptualization, methodology, writing—original draft preparation, and writing—review and editing, P.K., T.B., L.S., A.A.d.B., S.W., F.A.P.V., M.L., P.S., A.H. and N.K.; software, T.B., F.A.P.V., S.W., P.S. and A.H. All authors have read and agreed to the published version of the manuscript.
Funding
This research was funded by the Federal Ministry for Economic Affairs and Climate Action (BMWK) and the Federal Ministry of Education and Research (BMBF) of Germany in the project ENaQ (project number 03SBE111).
Informed Consent Statement
Informed consent was obtained from all subjects involved in the study.
Data Availability Statement
Data for Section 4 complement.
Acknowledgments
The authors thank all the other ENaQ project partners for support, inspiration and fruitful discussions. P.S. acknowledges Elif Turhan for providing data series for the long-term analysis. L.S., A.A.d.B. and N.K. acknowledge Alexandra Unger and Maren Wesselow for the support and realisation of the presented citizen participation formats and the participants of the focus groups for their active partaking and input. M.L. acknowledges Ekaterina Lesnyak and Christian Pieper for proofreading and providing data.
Conflicts of Interest
The authors declare no conflict of interest. The funders had no role in the design of the study; in the collection, analyses, or interpretation of data; in the writing of the manuscript, or in the decision to publish the results.
Abbreviations
The following abbreviations are used in this manuscript:
| C-MG | Community-based microgrid |
| CEC | Citizen Energy Communities |
| CHP | Combined Heat and Power Plant |
| COP | Coefficient Of Performance |
| DEMS | District energy management system |
| DER | Distributed Energy Resource |
| EEX | European Energy Exchange |
| EF | Emission Factor |
| ENaQ | Energetic Neighborhood Quarter (German: Energetisches Nachbarschafts Quartier) |
| EPEX | European Power Exchange |
| ESL | Energy Signal Light |
| ESS | Energy Storage System |
| HP | Heat Pump |
| LEM | Local Energy Market |
| LoRaWAN | Long Range Wide Area Network |
| MCP | Market-Clearing-Price |
| OTC | Over-The-Counter |
| PHELIX | Physical Electricity Index |
| PV | Photovoltaics |
| SGAM | Smart Grid Architecture Model |
| SIDC | Single Intraday Coupling |
| WAP | Weighted-Averager-Price |
References
- Commission of the European Communities CEC. Energy 2020 A Strategy for Competitive, Sustainable and Secure Energy Communication from the Commission to the European Parliament, the Council, the European Economic and Social Committee and the Committee of the Regions. 2010. Available online: https://eur-lex.europa.eu/legal-content/EN/ALL/?uri=CELEX:52010DC0639&qid=1644509887040 (accessed on 27 January 2022).
- Trivedi, R.; Patra, S.; Sidqi, Y.; Bowler, B.; Zimmermann, F.; Deconinck, G.; Papaemmanouil, A.; Khadem, S. Community-Based Microgrids: Literature Review and Pathways to Decarbonise the Local Electricity Network. Energies 2022, 15, 918. [Google Scholar] [CrossRef]
- Bauwens, T. Explaining the diversity of motivations behind community renewable energy. Energy Policy 2016, 93, 278–290. [Google Scholar] [CrossRef]
- The European Parliament and the Council of the European Union. Regulation (Eu) 2019/941 of the European Parliament and of the Council: On Risk-Preparedness in the Electricity Sector and Repealing Directive 2005/89/EC. Available online: http://data.europa.eu/eli/reg/2019/941/oj (accessed on 27 January 2022).
- Santodomingo, R.; Uslar, M.; Gottschlak, M.; Goering, A.; Nordström, L.; Valdenmaiier, G. The DISCERN tool support for knowledge sharing in large Smart Grid projects. In Proceedings of the CIRED Workshop 2016, Helsinki, Finland, 14–15 June 2016; pp. 1–4. [Google Scholar] [CrossRef]
- Abrishambaf, O.; Lezama, F.; Faria, P.; Vale, Z. Towards transactive energy systems: An analysis on current trends. Energy Strategy Rev. 2019, 26, 100418. [Google Scholar] [CrossRef]
- Wehkamp, S.; Schmeling, L.; Vorspel, L.; Roelcke, F.; Windmeier, K.L. District Energy Systems: Challenges and New Tools for Planning and Evaluation. Energies 2020, 13, 2967. [Google Scholar] [CrossRef]
- Schmeling, L.; Schönfeldt, P.; Klement, P.; Wehkamp, S.; Hanke, B.; Agert, C. Development of a Decision-Making Framework for Distributed Energy Systems in a German District. Energies 2020, 13, 552. [Google Scholar] [CrossRef]
- Brandt, T.; Schmeling, L.; Alcorta de Bronstein, A.; Schäfer, E.; Unger, A. Smart Energy Sharing in a German Living Lab. In Resilience, Entrepreneurship and ICT: Latest Research from Germany, South Africa, Mozambique and Namibia; Halberstadt, J., Marx Gómez, J., Greyling, J., Mufeti, T.K., Faasch, H., Eds.; Springer International Publishing: Cham, Switzerland, 2021; pp. 221–262. [Google Scholar] [CrossRef]
- Gilboa, I.; Rouziou, M.; Sibony, O. Decision theory made relevant: Between the software and the shrink. Res. Econ. 2018, 72, 240–250. [Google Scholar] [CrossRef]
- Kühberger, A.; Schulte-Mecklenbeck, M. Theories of Economic Decision-Making: Value, Risk and Affect. In Economic Psychology; John Wiley & Sons, Ltd.: Hoboken, NJ, USA, 2017; Chapter 2; pp. 19–34. [Google Scholar] [CrossRef]
- Wehkamp, S.; Kusch, P.W.; Marx Gómez, J. Qualitative Comparison of Valuation Methods for Power Plants and Flexibility; John Wiley & Sons, Ltd.: Hoboken, NJ, USA, 2021. [Google Scholar] [CrossRef]
- Schwab, A. Elektroenergiesysteme: Erzeugung, Übertragung und Verteilung Elektrischer Energie; Springer: Berlin/Heidelberg, Germany, 2015. [Google Scholar] [CrossRef]
- Graebig, M. Strom, Netz, Fluss Ein Atlas unserer Stromwelt und ihres Wandels; Ellery Studio: Berlin, Germany, 2021; Available online: https://www.stromnetzfluss.de/ (accessed on 17 February 2022).
- Power Derivatives Market Update December 2020. Available online: https://www.eex.com/fileadmin/EEX/Downloads/EEX_Power_Derivatives_Market_2020_Final_.pdf (accessed on 26 June 2021).
- Entwicklung des Stromverbrauchs. Available online: https://www.umweltbundesamt.de/daten/energie/stromverbrauch (accessed on 17 January 2021).
- Trading at EPEX SPOT 2021. Available online: https://www.epexspot.com/sites/default/files/download_center_files/21-03-09_Trading%20Brochure.pdf (accessed on 17 February 2021).
- Annual Report 2014. Available online: https://www.eex.com/fileadmin/EEX/Downloads/Newsroom/Publications/Annual_Reports/eex-gb-2014-en-data.pdf (accessed on 17 February 2021).
- Annual Report 2016. Available online: https://www.eex.com/fileadmin/EEX/Downloads/Newsroom/Publications/Annual_Reports/eex-gb-2016-en-viewer-data.pdf (accessed on 17 February 2021).
- Annual Report 2018. Available online: https://www.eex.com/fileadmin/EEX/Downloads/Newsroom/Publications/Annual_Reports/annual-report-2018-complete-de-data.pdf (accessed on 17 February 2021).
- Annual Report 2020. Available online: https://www.eex.com/fileadmin/EEXExchangeMarketModelling_Group/EEX_Group_Annual_Report/Annual_Report_2020/210421_EEX_Group_Annual_Report_2020_DE.pdf (accessed on 17 February 2021).
- Was Bedeutet Eigentlich “Uniform Pricing”? Available online: https://www.bmwi-energiewende.de/EWD/Redaktion/Newsletter/2015/17/Meldung/direkt-erklaert.html (accessed on 15 January 2021).
- Description of EPEX Spot Markets Indicies. Available online: https://www.epexspot.com/sites/default/files/download_center_files/EPEX%20SPOT%20Indices%202019-05_final.pdf (accessed on 28 January 2021).
- New ID3-Price Index on Continuous German Intraday Market. Available online: https://www.epexspot.com/en/news/new-id3-price-index-continuous-german-intraday-market (accessed on 10 February 2021).
- EPEX SPOT sFTP Server File Specifications. Available online: https://www.epexspot.com/sites/default/files/download_center_files/SFTP_specifications_2020-07.pdf (accessed on 3 February 2021).
- Hilpert, S.; Kaldemeyer, C.; Krien, U.; Günther, S.; Wingenbach, C.; Plessmann, G. The Open Energy Modelling Framework (oemof)—A new approach to facilitate open science in energy system modelling. Energy Strategy Rev. 2018, 22, 16–25. [Google Scholar] [CrossRef]
- Krien, U.; Kaldemeyer, C.; Günther, S.; Schönfeldt, P.; Möller, C.; Röder, J.; Schachler, B.; Endres, J.; Fabian, T.U.; Kochems, J.; et al. oemof-solph, Optimisation Software for Energy Systems. 2021. Available online: https://zenodo.org/record/4896226#.Yk1CKTURXIU (accessed on 17 February 2022).
- Witte, F.; Tuschy, I. TESPy: Thermal Engineering Systems in Python. J. Open Source Softw. 2020, 5, 2178. [Google Scholar] [CrossRef]
- Penaherrera, F.; Wehkamp, S. oemof.marketlib. Electricity Markets Lib. A Market Model for Selling or Buying Electricity on Several Markets with Obligatory Physical Fulfillment. 2022. Available online: https://zenodo.org/record/6382470#.Yk1C-TURXIU (accessed on 17 February 2022).
- Jacobs, S.B. The energy prosumer. Ecol. Law Q. 2016, 43, 519. [Google Scholar] [CrossRef]
- Saboori, H.; Mohammadi, M.; Taghe, R. Virtual Power Plant (VPP), Definition, Concept, Components and Types. In Proceedings of the 2011 Asia-Pacific Power and Energy Engineering Conference, Wuhan, China, 25–28 March 2011; pp. 1–4. [Google Scholar] [CrossRef]
- Weinhardt, C.; Mengelkamp, E.; Cramer, W.; Hambridge, S.; Hobert, A.; Kremers, E.; Otter, W.; Pinson, P.; Tiefenbeck, V.; Zade, M. How Far along Are Local Energy Markets in the DACH Region? A Comparative Market Engineering Approach. In Proceedings of the Tenth ACM International Conference on Future Energy Systems, Phoenix, AZ, USA, 25–28 June 2019; pp. 544–549. [Google Scholar] [CrossRef]
- Khorasany, M.; Mishra, Y.; Ledwich, G. Market framework for local energy trading: A review of potential designs and market clearing approaches. IET Gener. Transm. Distrib. 2018, 12, 5899–5908. [Google Scholar] [CrossRef]
- Zang, H.; Kim, J. Reinforcement Learning Based Peer-to-Peer Energy Trade Management Using Community Energy Storage in Local Energy Market. Energies 2021, 14, 4131. [Google Scholar] [CrossRef]
- Zia, M.F.; Benbouzid, M.; Elbouchikhi, E.; Muyeen, S.M.; Techato, K.; Guerrero, J.M. Microgrid Transactive Energy: Review, Architectures, Distributed Ledger Technologies, and Market Analysis. IEEE Access 2020, 8, 19410–19432. [Google Scholar] [CrossRef]
- Katic, N. Entwurf eines Marktplatzes für den Energieaustausch unter Nachbarn in Wohnquartieren. Bachelor’s Thesis, Jade University of Applied Sciences, Oldenburg, Germany, 2019. [Google Scholar]
- Katic, N.; Schmeling, L. Designing a marketplace for energy exchange among neighbors. In Innovations for Transformation—Entrepreneurship and Technology for Sustainable Development; Springer International Publishing: Cham, Switzerland, 2022; in press. [Google Scholar]
- Scheer, D.; Konrad, W.; Scheel, O.; Ulmer, F.; Hohlt, A. Fokusgruppen im Mixed-Method-Design: Kombination einer standardisierten und qualitativen Erhebung. In Fokusgruppen in der Empirischen Sozialwissenschaft; Springer Fachmedien: Wiesbaden, Germany, 2012; pp. 148–167. [Google Scholar]
- Renn, O. Technikakzeptanz: Lehren und Rückschlüsse der Akzeptanzforschung für die Bewältigung des technischen Wandels. Tech. Theor. Und Prax. 2005, 3, 29–38. [Google Scholar] [CrossRef]
- Presser, S.; Couper, M.P.; Lessler, J.T.; Martin, E.; Martin, J.; Rothgeb, J.M.; Singer, E. Methods for testing and evaluating survey questions. Public Opin. Q. 2004, 68, 109–130. [Google Scholar] [CrossRef]
- Dillman, D.A. Mail and Telephone Surveys: The Total Design Method; Wiley: New York, NY, USA, 1978; Volume 19. [Google Scholar]
- Schulz, M.; Mack, B.; Renn, O. Fokusgruppen in der Empirischen Sozialwissenschaft: Von der Konzeption bis zur Auswertung; Springer Fachmedien: Wiesbaden, Germany, 2012. [Google Scholar]
- Morgan, D.L. Focus Groups as Qualitative Research; Sage Publications: Thousand Oaks, CA, USA, 1996; Volume 16. [Google Scholar] [CrossRef]
- Bischoping, K.; Dykema, J. Toward a social psychological programme for improving focus group methods of developing questionnaires. J. Off. Stat. 1999, 15, 495. [Google Scholar]
- Wie heizt Deutschland 2019—BDEW-Studie zum Heizungsmarkt. 2019. Available online: https://www.bdew.de/energie/studie-wie-heizt-deutschland/ (accessed on 17 February 2022).
- Verband Deutscher Ingenieure (VDI). Economic Efficiency of Building Installations—Fundamentals and Economic Calculation; VDI 2067 Part 1; VDI: Düsseldorf, Germany, 2012. [Google Scholar]
- Taylor, M. Energy Subsidies: Evolution in the Global Energy Transformation to 2050; Technical Report; International Renewable Energy Agency: Abu Dhabi, United Arab Emirates, 2020; Available online: https://www.irena.org/publications/2020/Apr/Energy-Subsidies-2020 (accessed on 17 February 2022).
- Energy Prices and Transparency for Consumers. 2022. Available online: https://www.bmwi.de/Redaktion/EN/Textsammlungen/Energy/electricity-prices.html (accessed on 17 February 2022).
- Bloess, A.; Schill, W.P.; Zerrahn, A. Power-to-heat for renewable energy integration: A review of technologies, modeling approaches, and flexibility potentials. Appl. Energy 2018, 212, 1611–1626. [Google Scholar] [CrossRef]
- Lund, P.D.; Skytte, K.; Bolwig, S.; Bolkesjö, T.F.; Bergaentzlé, C.; Gunkel, P.A.; Kirkerud, J.G.; Klitkou, A.; Koduvere, H.; Gravelsins, A.; et al. Pathway Analysis of a Zero-Emission Transition in the Nordic-Baltic Region. Energies 2019, 12, 3337. [Google Scholar] [CrossRef]
- Prognos, Öko-Institut, Wuppertal-Institut. Towards a Climate-Neutral Germany. Executive Summary conducted for Agora Energiewende, Agora Verkehrswende and Stiftung Klimaneutralität. 2020. Available online: https://www.agora-energiewende.de/en/publications/towards-a-climate-neutral-germany-executive-summary/ (accessed on 17 February 2022).
- Hein, F.; Hermann, H. Agorameter Documentation Version 10; Technical Report; Agora Energiewende, Öko-Institut: Berlin, Germany, 2020; Available online: https://www.agora-energiewende.de/veroeffentlichungen/agorameter-dokumentation/ (accessed on 17 February 2022).
- Krien, U. Erweiterung der Bewertungskriterien von regionalen Strom-Wärme-Modellen durch die Kopplung mit Einem überregionalen Modell. Ph.D. Thesis, Technischen Universität Berlin, Berlin, Germany, 2020. Available online: https://www.reiner-lemoine-stiftung.de/pdf/dissertationen/Dissertation-Uwe_Krien.pdf (accessed on 17 February 2022).
- Krien, U.; Duran, P.; Beier, D. reegis/deflex, Simulation Model for German Electricity Grid. 2021. Available online: https://zenodo.org/record/4636714#.Yk1DSDURXIU (accessed on 17 February 2022).
- Turhan, E. The Effect of Technical Risks on the Achievement of Goals for Distributed Energy Supply Concepts in Residential Neighbourhoods. Master’s Thesis, University of Freiburg, Freiburg im Breisgau, Germany, 2021. Available online: https://elib.dlr.de/146157/ (accessed on 17 February 2022).
- Data Package Time Series. 2020. Available online: https://data.open-power-system-data.org/time_series/2019-06-05 (accessed on 17 February 2022).
- Status of Onshore Wind Energy Development in Germany, First Half of 2021. 2021. Available online: https://www.windguard.com/publications-wind-energy-statistics.html (accessed on 17 February 2022).
- Fette, M.; Brandstätt, C.; Gils, H.C.; Gardian, H.; Pregger, T.; Schaffert, J.; Tali, E.; Brücken, N. Multi-Sektor-Kopplung—Modellbasierte Analyse der Integration Erneuerbarer Stromerzeugung Durch die Kopplung der Stromversorgung mit dem Wärme-, Gas- und Verkehrssektor; Technical Report; Fraunhofer-Institut für Fertigungstechnik und Angewandte Materialforschung IFAM: Bremen, Germany, 2020; Available online: https://publica.fraunhofer.de/eprints/urn_nbn_de_0011-n-6182658.pdf (accessed on 17 February 2022).
- Dambeck, H.; Ess, F.; Falkenberg, H.; Kemmler, A.; Kirchner, A.; Koepp, M.; Kreidelmeyer, S.; Lübbers, S.; Piégsa, A.; Scheffer, S.; et al. Towards a Climate-Neutral Germany by 2045. How Germany can Reach Its Climate Targets before 2050; Technical Report; Prognos, Öko-Institut, Wuppertal-Institut: Wuppertal, Germany, 2021; Available online: https://static.agora-energiewende.de/fileadmin/Projekte/2021/2021_04_KNDE45/A-EW_213_KNDE2045_Summary_EN_WEB.pdf (accessed on 17 February 2022).
- Bianchi, M.; De Pascale, A. Emission Calculation Methodologies for CHP Plants. Energy Procedia 2012, 14, 1323–1330. [Google Scholar] [CrossRef][Green Version]
- Beyertt, A.; Verwiebe, P.; Seim, S.; Milojkovic, F.; Müller-Kirchenbauer, J. Felduntersuchung zu Behavioral Energy Efficiency Potentialen von Privaten Haushalten. Available online: https://zenodo.org/record/3855575#.Yk1DmDURXIU (accessed on 17 February 2022).
- Vine, D.; Buys, L.; Morris, P. The Effectiveness of Energy Feedback for Conservation and Peak Demand: A Literature Review. OJEE 2013, 2, 7–15. [Google Scholar] [CrossRef]
- Khosrowpour, A.; Jain, R.K.; Taylor, J.E.; Peschiera, G.; Chen, J.; Gulbinas, R. A review of occupant energy feedback research: Opportunities for methodological fusion at the intersection of experimentation, analytics, surveys and simulation. Appl. Energy 2018, 218, 304–316. [Google Scholar] [CrossRef]
- Zangheri, P.; Serrenho, T.; Bertoldi, P. Energy Savings from Feedback Systems: A Meta-Studies’ Review. Energies 2019, 12, 3788. [Google Scholar] [CrossRef]
- Evohaus in Den Medien|Evohaus—Part 2. Available online: https://www.evohaus.com/in-den-medien/page/2/ (accessed on 25 February 2022).
- W wie Wissen: Wie Gelingt die Energiewende?|ARD-Mediathek. Available online: https://www.ardmediathek.de/video/Y3JpZDovL2Rhc2Vyc3RlLmRlL3cgd2llIHdpc3Nlbi9hZjMwNzU0MS01ZmJlLTRkNDEtYjY0Ni1iYTAzNjM1NWRhMzc/ (accessed on 25 February 2022).
- PeakPick|We Pick Green Energy. Available online: https://www.peakpick.de/ (accessed on 28 February 2022).
- Öhrlund, I.; Linne, A.; Bartusch, C. Convenience before coins: Household responses to dual dynamic price signals and energy feedback in Sweden. Energy Res. Soc. Sci. 2019, 52, 236–246. [Google Scholar] [CrossRef]
Publisher’s Note: MDPI stays neutral with regard to jurisdictional claims in published maps and institutional affiliations. |
© 2022 by the authors. Licensee MDPI, Basel, Switzerland. This article is an open access article distributed under the terms and conditions of the Creative Commons Attribution (CC BY) license (https://creativecommons.org/licenses/by/4.0/).