Abstract
This study used social network analysis to examine the structure of the international trade of creative goods. The results showed that the US, Canada, Europe, and certain Asian countries (e.g., China, the Republic of Korea, Japan, and Thailand) ranked high in terms of out-degree/in-degree, eigenvector, and betweenness centrality compared to other countries in the international creative goods trade network. A quadratic assignment procedure (QAP) revealed interrelations between each creative goods networks. In particular, the new media network strongly interacted with the design and art crafts network. Furthermore, multiple regression confirmed that each country’s gross domestic product (GDP), gross national income (GNI) per capita, population, inbound tourism expenditure, and gross domestic expenditure on R&D (GERD) influenced their international trade of creative goods.
1. Introduction
The creative industries are representative of industry in general, in an era in which the significance of culture, leisure, and enjoyment has increased. The importance of creativity, technology, and talent has been increasingly recognized [1], and these attributes can be found at the core of the creative industries. Moreover, the creative industries function as important current indicators of national competitiveness. For example, the European Union (EU) launched a cultural policy program named Creative Europe, which was scheduled to operate from 2014 to 2027. The goal of this program was to strengthen the EU’s competitiveness in the creativity and tourism industries as a way of coping with the rapidly changing global situation [2]. Recognizing the significance of creativity, EU members have encouraged creative industries to converge and have collaborated to improve cultural and linguistic diversity, as well as economic growth [3].
Creative goods, the products of the creative industries, include art crafts, audiovisuals, design, new media, performing arts, publishing, and visual arts [4]. Creative goods are associated with cultural backgrounds, values, customs, and religions [5,6]. In terms of trade, cultural interchanges are interactions between cultures realized through the import and export of creative goods. Therefore, an understanding of the ways in which cultural interchanges occur has also provided an understanding of international interactions. Intercultural communication has enabled contact and cooperation among various cultural and social groups comprising individuals with different religious, social, ethnic, and educational backgrounds in a context of globalization [7].
Studies related to creative goods in the creative industries have tended to focus on particular countries or specific creative goods, relationships between property rights and creativity, the effect of word-of-mouth publicity on creative goods, teamwork management in the creative industries, and creative organizations’ social networks [8,9,10,11,12,13,14]. Although considerable research has been conducted on general trade networks [15,16,17,18], the authors of this paper are unaware of any studies that have attempted to identify the characteristics of creative goods networks as they relate to creative industries at the macro level.
Therefore, a social network analysis, which is considered to be a suitable method for identifying interactions between entities, was employed in this study. This method was applied to evaluate the structures and characteristics of all creative goods in different countries. Specifically, we examined the structural features of the international trade of creative goods and used a QAP to investigate the relationships between individual networks grouped by type of creative goods. In addition, the economic, environmental, geographical, and social elements of each country interacted with and affected trade [19,20]. Therefore, we were able to analyze the impact of economic, social, and cultural factors on out-degree/in-degree centrality indicators of the international creative goods trade network. Through this analysis, we can provide useful insights into the global structure of the creative industries.
2. Literature Review
The concept of the creative industry coincided with the concept of a national drive based on creative energy. It comprised industries such as advertisement, architecture, fine art, art and crafts, design, fashion, cinema, music, performance, publication, leisure, software, toys, television and radio broadcast, and video games. The use of the term varied among countries, including its use in relation to the entertainment industry, the content industry, and the copyright industry. The United Nations Conference on Trade and Development (UNCTAD) has defined creative products as the creation, production, and distribution of economic and cultural values, the types of products oriented to the market, and the chain of knowledge-based activities [2]. The United Nations Educational, Scientific and Cultural Organization Institute for Statistics (UNESCO-UIS), UNCTAD, and the World Intellectual Property Organization (WIPO) have shared several creative components, but certain differences remain. While WIPO has adopted a purely economic definition focused on copyright concepts, UNCTAD and UNESCO share more common cultural items [21].
The concept of the creative economy includes the system of the production, exchange, and use of creative products resulting from creativity, which require intellectual property rights in creative industries; this concept embraces the potential of creating economic values and employment [22,23]. Human creativity is an important economic resource, and a country’s creative and cultural industries have played a crucial part in the economic development of many developed countries [11,24]. Furthermore, UNCTAD [2] considered technology, demand, and tourism the most important drivers for the growth of the creative economy, and among them, the tourism industry was considered to be associated with the creative industry. This demonstrates the organic composition of the tourism and creative industries in the innovative frame of creativity. The capability of cultural and creative entities to respond to changing exogenous or external market conditions and to predict future trends will determine their functionality and performance in the value chain in general, which will ultimately determine their overall competitiveness [25]. Horobets [26] analyzed the dynamics of the international trade of EU cultural goods in 2012–2017 and discovered that the average 6% annual growth of the EU index provided a basis for sustained growth of the creative economy and industries. Moreover, the trade of different creative goods can have a positive ripple effect, leading to the consumption of connected goods.
The creative goods trade can reduce the intercultural communication gap among different cultural and social groups. Therefore, each country’s trade has been influenced by globalization. According to Meyer [27], globalization refers to the expanded interdependency among nations, which connotes not only economic exchange but also cultural awareness. The three key factors contributing to globalization are reduced trade and investment barriers, the development of countries’ economies and their impact on global production capacity, and technological change in transport and communications technologies [28]. Globalization has five attributes: it is dialectically dynamic, universally pervasive, culturally hybridized, holistically interconnected, and individually powerful [29]. As such, researchers have emphasized that countries form a massive, globalized network and affect one another’s cultures. Based on the intercultural communication theory, Kluver [30] stated that globalization and informatization trends have significantly influenced the understanding of culture, society, and communication. Globalization is occurring in social life, communication, travel, finance, the military, ecology, health, law, and the production of goods and services [31]. As companies develop a global mindset in the manufacturing, importing, or exporting of their products and services, intercultural communication becomes more important in international business. Therefore, the world trade network structure is related to the globalization perspective [32]. Although skeptics have argued that globalization has helped some Asian economies, this is not true for all parts of the world [33]. In the same context, there is an opinion that even in the age of globalization, the world economy is structured as an area of integration and isolation [34].
Chung [35] explored structural changes and continuity in the international film trade over ten years and emphasized that, although international trade in media products had once been one-way, there was now an increase in regional and cultural exchange, according to more recent studies. Thus, the structure of international film trade has become denser over time, and both geographical proximity and linguistic commonality were important determinants. Aage and Belussi [8] used social network analysis to discover the external fashion sources used by a group of designers and firms. Cattani and Ferriani [36] examined the role of social networks in the Hollywood motion picture industry.
The literature on the interactions of international trade, economic growth, and economic income has increased in recent decades [20]. In addition, education has been intended to establish a high level of culture, and cultural creative products and services generally require of consumers a certain level of cultural knowledge, which improves with education [5,27]. The effect of the national economy, environment, geography, and society on the trade network index has also been studied [19]. A study by Niu [5] revealed that economic growth in Beijing could promote the export of Beijing’s cultural creativity industry. That is, the concept of creativity constituted the core of creative industries in the creative economy, which induced a critical drive for the growth of national economies and of societies. Moreover, the global creativity index assesses a country’s technology use as a proxy for the country’s share of GDP on research and development (R&D) and its number of patents [37]. DiPietro and Anoruo [38] found a positive nexus between a country’s export performance and its creative activity. Van Dong and Truong [14] stated that Vietnam’s creative goods exports were positively affected by the economic scale, market development, and higher education of both Vietnam and its trading partners. In international trade, nations’ economic, social, and cultural elements affected and interacted with trade.
Based on this theoretical background, this study examined the structure of the global creative goods trade network using social network analysis. In addition, the present study identified relationships between the international trade of different creative goods using economic, social, and cultural indicators. Economic indicators were classified into GDP and GNI per capita; social indicators, including population, higher education and training, and GERD; and cultural indicators, including inbound tourism expenditure using the specific nation’s cultural resources. Therefore, the following research questions were developed:
RQ1. What are the structural features of the international creative goods trade network?
RQ2. Are there any relationships in the international trade networks between different types of creative goods?
RQ3. Are the social network analysis indicators of each country associated with economic, social, or cultural indicators (GDP, GNI per capita, population, higher education and training, GERD, or inbound tourism expenditure)?
3. Materials and Methods
3.1. Data
International creative goods trade data were collected from the UNCTAD [4] database. Creative goods comprised art crafts, audiovisuals, design, new media, performing arts, publishing, and visual arts. The details of each of the categories of creative goods appear in Table 1 below.

Table 1.
Creative goods composition.
International creative goods trade data were provided annually by UNCTAD Statistics. To date, they have reported their international creative industry trade data from 2002 to 2015. To include the main parts of the creative industries, data concerning the values and shares of creative goods imports were selected for this study. Trade amounts were reported in US dollars. Furthermore, it is important to note that some countries were missing data for one year during the studied period. The data covered all OECD and G20 countries. The most recent data available for this analysis were from 2014 and 2015; however, the data collected in 2014 (a total of 222 countries) included more countries than those collected in 2015.
For the multiple regression, data on the antecedent variables were collected from several sources. Data regarding each country’s GDP (in United States dollars (USD)), GNI per capita (USD), and total population were obtained from the World Bank [39]. Data regarding higher education and training in each country were obtained from the Global Competitiveness Report [40]. This report measures higher education and training rates, secondary and tertiary enrollment rates, and the quality of education as evaluated by business leaders [40]. Data regarding each country’s inbound tourism expenditure (USD million) were collected from the United Nations World Tourism Organization (UNWTO), while each country’s GERD data were gathered from UNESCO. Expressed as a percentage of GDP, GERD was the total intramural expenditure on R&D performed in a given national territory during a specific reference period [41]. The sample of the present study comprised 61 countries covered by the aforementioned data from 2014.
3.2. Analysis
Social network analysis identified the interactions between actors in a network formed through some type of relationship [16]. Social systems, which were the subject of social network analysis, were formed through the aforementioned relationships; social network analysis approached these systems by focusing on each relationship within a mutual connection [42]. Formal network analysis was the best approach for exploring and comparing the relational patterns of movement within these relationships [43].
In the present study, the countries were represented by nodes. A link between two countries involved the exchange of creative goods from one country to another. Degrees of connection were established based on the correlation coefficients of centrality scores and centrality rankings [44]. The social network measures assigned to individual actors and the typical social network measures used to describe the networks were shown in Table 2.
Table 2.
Social Network Measures.
The present analysis examined the following network indicators: in-degree/out-degree, betweenness, and eigenvector centrality. Degree centrality was computed using the row or column sums of the adjacency matrix [45]. The values of creative goods trade were coded into a one-mode matrix, with rows representing message senders and columns representing message receivers. These matrices were utilized as inputs for the social network analysis software package UCINET (Version 6.624, Analytic Technologies, Lexington, KY, USA). The international creative goods trade networks were analyzed and visualized by NetDraw (Version 2.160. Analytic Technologies, Lexington, KY, USA).
A QAP was used to investigate correlations between pairs of networks. This type of analysis calculated an ordinary measure of statistical association (e.g., Pearson’s r) [45,46]. The advantage of a QAP is that it provided a direct test to determine whether two matrices are similar to one another [47]. Therefore, a QAP was used in the present study to determine the relationships between different creative goods. This QAP identified a significant network-level correlation in the structure of the links between the creative goods trade network matrices.
4. Results
Regarding RQ1, the itemized international creative goods trade network is shown in Table 3, Table 4, Table 5, Table 6, Table 7, Table 8 and Table 9. Table 3 presents the out-degree/in-degree, eigenvector, and betweenness centrality of the top 20 countries in the international art crafts trade network. The results showed that China had the highest out-degree centrality (16,061,570,048), followed by India, Turkey, Belgium, the Republic of Korea, Taiwan, the US, and Germany. The US, Cambodia, the UK, Germany, Hong Kong, Japan, and Canada had the highest in-degree centrality. China had the highest eigenvector centrality, implying that the number of countries with which it is connected is not only large but also includes major countries. China was followed by the US, Cambodia, Hong Kong, Japan, Canada, and the UK. In terms of betweenness centrality, the US was the most central country by far, occupying the role of a message deliverer or a control in the network. The US was highly influential due to its high betweenness and eigenvector centrality. The next most central countries were France and Canada. The international art crafts trade network is displayed in Figure 1.
Table 3.
International trade of art crafts network.
Table 4.
International trade of audiovisuals network.
Table 5.
International trade of design network.
Table 6.
International trade of new media network.
Table 7.
International trade of performing arts network.
Table 8.
International trade of publishing network.
Table 9.
International trade of visual arts network.
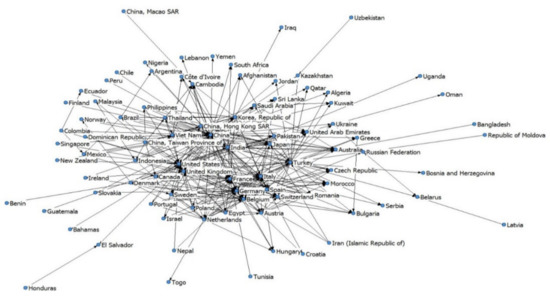
Figure 1.
International trade of art crafts network.
Table 4 presents the analytic indicators of the international audiovisuals trade network. The US, Germany, Singapore, Ireland, and Japan have the highest out-degree centrality. China, Germany, and the UK were the most central countries in terms of in-degree centrality. China had the highest eigenvector centrality, followed by the US, Singapore, Germany, Japan, Canada, and the UK. Furthermore, Thailand, France, Germany, the Netherlands, Switzerland, South Africa, the US, and Canada remained as the top countries in terms of betweenness centrality. Figure 2 graphically represents the global structure of the international audiovisuals trade network.
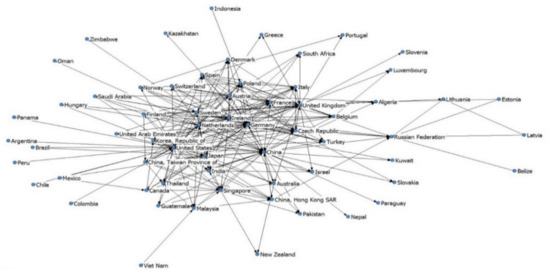
Figure 2.
International trade of audiovisuals network.
Table 5 shows the overall degree centrality of the top 20 countries in the international design trade network. Overall, the US and China were the most central countries in this network, followed by Italy, Hong Kong, France, and Germany. The international design trade network is displayed in Figure 3.
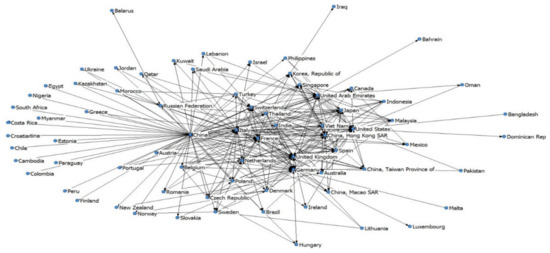
Figure 3.
International trade of design network.
Table 6 presents each country’s out-degree, in-degree, eigenvector, and betweenness centrality scores in the international new media trade network. The results show that China has the highest out-degree centrality, followed by Taiwan, the US, the Republic of Korea, Japan, Germany, and the Netherlands. The US had the highest in-degree centrality, followed by Hong Kong, Germany, the UK, Japan, China, France, and the Netherlands. Furthermore, China has the highest eigenvector centrality. Finally, France, the Netherlands, and Switzerland have the highest betweenness centrality. Figure 4 graphically represents the global structure of the international new media trade network.
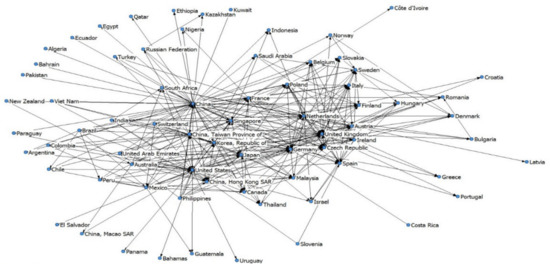
Figure 4.
International trade of new media network.
In terms of the international performing arts trade network (Table 7), China has the highest out-degree centrality. China’s eigenvector centrality is similar to that of the next most central country: the US. In terms of eigenvector centrality, these countries are followed by Germany, Japan, and Indonesia. Furthermore, the US, Germany, Japan, the UK, France, and China have the highest in-degree centrality. In terms of betweenness centrality, France is the most central country, followed by Canada, Germany, the US, and China. The international performing arts trade network is displayed in Figure 5.
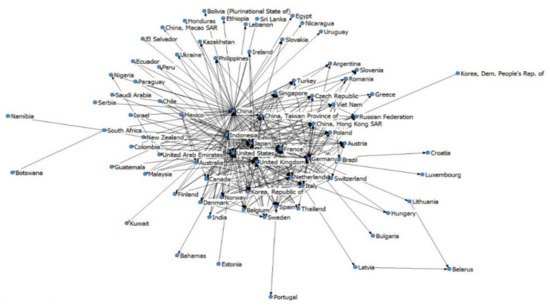
Figure 5.
International trade of performing arts network.
In terms of out-degree centrality, China is the most central country in the international publishing trade network (Table 8). In terms of in-degree centrality, the US is the most central country in this network. The US, China, Canada, the UK, and Hong Kong have the highest eigenvector centrality. Thailand, Canada, France, the Netherlands, and Switzerland were the most central countries in terms of betweenness centrality. Figure 6 graphically represents the global structure of the international publishing trade network.
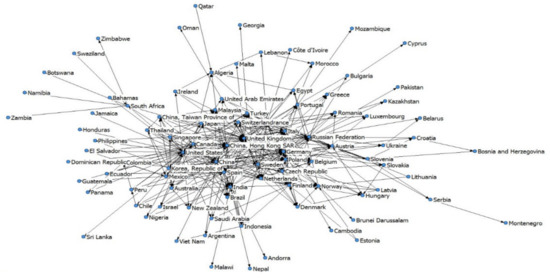
Figure 6.
International trade of publishing network.
In the international visual arts trade network (Table 9), the US, China, the UK, France, and Switzerland have the highest out-degree and in-degree centrality. The US is highly influential due to its high betweenness and eigenvector centrality. Figure 7 graphically represents the global structure of the international visual arts trade network.
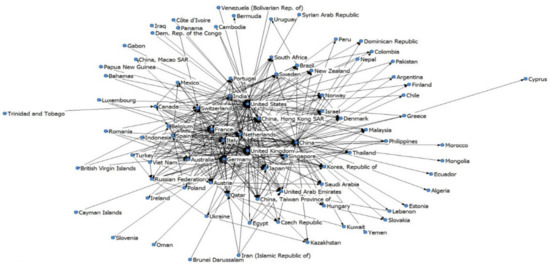
Figure 7.
International trade of visual arts network.
To address RQ2, the network structures for each of the seven goods in the international creative goods trade network were compared using a QAP. The correlations between these networks are presented in Table 10. The results of the QAP are representative of the equivalence between the creative goods. The network structures of the different creative goods in the international creative goods trade network are interrelated. In particular, the new media network strongly correlates with the design network (r = 0.92, p < 0.001). Furthermore, the design network strongly correlates with the art crafts network (r = 0.91, p < 0.001). Finally, the art crafts network correlates with the new media network (r = 0.89, p < 0.001).
Table 10.
QAP correlations between the networks of each creative goods.
Regarding RQ3, Table 11 shows the correlations between the out-degree/in-degree centrality of each creative good in the international trade network, GDP, GNI per capita, population, higher education and training, inbound tourism expenditure, and GERD for each country in 2014. The results indicate the out-degree/in-degree centrality of each international creative goods trade network correlated with GDP, higher education and training, inbound tourism expenditure, and GERD. However, the out-degree centrality of art crafts and that of design were not related to GNI per capita. Population was related to the out-degree centrality of art crafts, the in-degree centrality of audiovisuals, the out-degree centrality of design, and the in-degree centrality of publishing. The maximum variance inflation factor (VIF) did not exceed 10.
Table 11.
Descriptive statistics and a correlation analysis (N = 61).
The multiple regression results predicting the international trade of creative goods are shown in Table 12. These results show that population (β = 0.577, p < 0.001), inbound tourism expenditure (β = 1.068, p < 0.001), and GERD (β = 0.339, p < 0.01) have positive effects on the out-degree centrality of art crafts; however, GDP (β = −0.927, p < 0.001) negatively impacted the out-degree centrality of art crafts. In contrast, GDP (β = 0.643, p < 0.001) and inbound tourism expenditure (β = 0.399, p < 0.001) have positive effects on the in-degree centrality of art crafts, while population (β = −0.080, p < 0.01) and GERD (β = −0.085, p < 0.01) have a negative impact on the in-degree centrality of art crafts. Population, inbound tourism expenditure, and GERD have a positive impact on the in-degree centrality of audiovisuals (β = 0.265, p < 0.05 for population; β = 0.888, p < 0.01 for inbound tourism expenditure; and β = 0.304, p < 0.05 for GERD). Except for GDP, none of the variables significantly affected the out-degree centrality of audiovisuals. In addition, GDP and inbound tourism expenditure had statistically significant effects on the in-degree centrality of design. Furthermore, GDP, population, and inbound tourism expenditure had significant effects on the out-degree centrality of design. The variable with the greatest impact on the out-degree centrality of new media was GERD (β = 0.495, p < 0.001). Furthermore, GDP and inbound tourism expenditure impacted the in-degree centrality of new media. Additionally, GDP and GERD impacted the out-degree centrality of performing arts, while GDP, population, and GERD impacted the in-degree centrality of performing arts. Except for inbound tourism expenditure, none of the variables significantly affected the out-degree centrality of publishing. Inbound tourism expenditure was the best predictor of the in-degree centrality of publishing (β = 0.820, p < 0.001), followed by GNI per capita (β = 0.139, p < 0.05) and population (β = 0.117, p < 0.05). Except for GNI per capita and higher education and training, all variables significantly affected the in-degree centrality of visual arts. Except for inbound tourism expenditure, none of the variables significantly affected the out-degree centrality of the visual arts.
Table 12.
Multiple regression predicting international trade of creative goods (N = 61).
5. Discussion and Conclusions
This study has explored the structural features of the international creative goods trade network, as well as the relationships between different creative goods and the economic, social, and cultural indicators of nations.
Generally, the out-degree/in-degree, eigenvector, and betweenness centrality of the trade network were high in the US, Canada, Europe, and certain Asian countries. On a worldwide scale, the largest media, music, entertainment, and publishing companies were based in France, Germany, Japan, and the US [2]. Furthermore, several major Asia-Pacific economies (e.g., those of China, the Republic of Korea, Thailand, India, Indonesia, Malaysia, the Philippines, Singapore, and Vietnam) exhibited high creative economy activity as well as strategic interest in the development of the creative industry [2]. In Europe, the EU launched the Creative Europe cultural policy program, scheduled to operate from 2014 to 2020. OECD and G20 countries ranked high in terms of degree, eigenvector, and betweenness centrality compared to other countries. Therefore, these countries held important positions in the creative goods network and had great cultural influence over other countries.
Specifically, India, Turkey, and Cambodia ranked high in terms of out/in-degree, eigenvector, and betweenness centrality in the art crafts network relative to other creative goods networks. India and Turkey had high proportions of carpet exports (India: 935 million USD; Turkey: 2264 million USD), while Cambodia had a high proportion of yarn imports (2154 million USD). Regarding the audiovisuals network, Singapore and Ireland had relatively high out-degree and eigenvector centrality scores. Singapore and Ireland were substantial exporters of CDs, DVDs, and tapes (Singapore: 3091 million USD; Ireland: 716 million USD). In particular, the Singapore Asia-Pacific headquarters of Lucasfilm helped create the next chapter of the Star Wars franchise [48]. Italy and France ranked high in terms of out-degree in the design network relative to other creative goods networks. The US, China, and the Republic of Korea are at the forefront of in-degree and out-degree centrality in new media networks. China has a competitive advantage in the new media network, which may have been affected by China’s network infrastructure improvements in 2014, the dissemination of mobile devices, and an increase in income level. Indonesia ranked highly in terms of out-degree and eigenvector centrality in the performing arts network relative to other creative goods networks, having exported a high proportion of musical instruments (521 million USD). The major import and export destinations were the US, China, and the UK. The UK ranked high in terms of centrality in the publishing and visual arts networks relative to other creative goods networks, and Europe ranked high in terms of centrality in the visual arts network relative to other creative goods networks.
Using the QAP correlation, we found the network-level correlations between different creative goods networks. Particularly, the new media network strongly correlated with the design network, the design network strongly correlated with the art crafts network, and the art crafts network correlated with the new media network. Moreover, the multiple regression analysis confirmed that each country’s GDP, GNI per capita, population, inbound tourism expenditure, and GERD influenced their international trade of creative goods. Meanwhile, higher education and training did not affect the international trade of creative products. This was in line with the study by Niu [5], showing that Beijing’s economic growth promoted an increase in its exports of cultural creation industries, while an increase in residents’ consumption and education did not significantly promote such exports by Beijing.
Countries with handicraft or design-based products, such as art crafts and design exports, tended to have high populations and inbound tourism expenditures but low GDPs. In contrast, countries with art crafts, design, and visual arts imports tended to be characterized by low populations but high GDPs. Inbound tourism expenditure positively influenced the import and export of art crafts, design, visual arts, and publishing. These products are assumed to be valuable tourism products because a viable tourism economy is connected to the development of new and existing tourism products. Countries with many audiovisual exports had high GDPs, and countries with many imports had large populations, inbound tourism expenditures, and GERD. Countries with many imports and exports in the performing arts had high GDP and GERD.
Moreover, GERD had a strong positive impact on the export of new media. The US and the Republic of Korea were ranked highly in new media out-degree centrality networks. Companies in the US were innovative, sophisticated, and supported by an excellent university system that collaborated with the business sector in R&D; similarly, the Republic of Korea possessed a high degree of technological adoption and relatively strong business sophistication, explaining its remarkable capacity for innovation [40]. This finding is in accordance with the findings of DiPietro and Anoruo [38], who found a positive nexus between a country’s international trade and its creative activity. The capability of cultural and creative entities to respond to changing exogenous or external market conditions and predict future trends will determine their functionality and performance in the value chain in general, which will ultimately determine their overall competitiveness [25]. Based on the outcomes of this study, the following implications can be drawn.
First, the US, Canada, Europe, and certain Asian countries (e.g., China, Japan, Singapore, the Republic of Korea, and Thailand) ranked high in terms of out/in-degree, eigenvector, and betweenness centrality compared to other countries in the international creative goods trade network. Further, the top 20 countries in the international creative goods trade network included various regions. In recent times, the global community has been more strongly correlational and interdependent than in the past [49]. Cultural exchanges should reflect a mutual understanding; therefore, it is ideal to approach cultural exchanges from both directions, rather than unilaterally. In the same context, film production based on another culture is dependent on the bidirectional transfer between cultures, cultural borrowings, and reproduction [50]. From the perspective of a nation, forming cultural connections with other countries can serve as a strategy to create a new paradigm and reinforce intercultural communication in the cultural industry. Overall, the international trade of creative goods supports globalization, but there is also a case in which gaps between major countries occur and this affects some countries’ different creative goods disproportionately.
Second, the new media, design, art crafts, and performing arts networks are strongly associated with one another, indicating that art is connected to new media in circumstances where digitally based development has started to accelerate. The new media subgroup is the physical expression of connectivity; as such, it is highly dependent on access to equipment such as computers, mobile telephones, digital televisions, and MP3s [2]. New media art (e.g., art and technology) and computer and system art [51] appeared due to this phenomenon. In addition, the visual elements of various media triggered consumer interest and contributed to consumers’ immersion in content consumption. As indicated by the results of the present study, creative industries are fields of international exchange that are closely linked and generate synergy, thus promoting growth. In other words, creative industries have been proven to influence one another and to have integrated value chains.
Third, the international imports and exports of creative goods correlated with economic, cultural, and social factors. This was supported by the results of the multiple regression analysis, which showed the effect relationship between the in-degree/out-degree centrality of the creative goods network and GDP, GNI per capita, population, inbound tourism expenditure, and GERD. The performance of these creative industries was affected by global politics and the economy. This was in line with the study by Van Dong and Truong [14], which stated that Vietnam’s creative goods exports were positively affected by the economic scale and market development of both Vietnam and its trading partners. For instance, cultural exchange through the imports and exports of creative industries is related to inbound tourism expenditure. This indicates that each nation can use tourism as a method of cultural exchange to develop a creative industry. The vitalization of this phenomenon acts as a virtuous circle, playing a positive role in the development of a country’s economy. Because art crafts reflect cultural attributes, they can easily be developed into tourism products with various types of differentiated goods. Tourists are major consumers of leisure and cultural services as well as various creative products, such as craftwork, music, and performance arts. Active intercultural contact through overseas travel will decrease the cultural discount issue and lead to increased demand for overseas media. Overall, this requires the creation of diverse content related to creative industries by establishing social and cultural environments based on creativity. Policies and strategies to promote the sustainable development of creative industries must be implemented in alignment with various fields, such as the economy, society, culture, technology, and environment.
6. Limitations and Future Studies
The present study had some limitations. For one, this study utilized international creative goods trade data from 2014. The scope of this analysis could be expanded by conducting a longitudinal study focused on periodic changes. In addition, a comparative analysis of general and creative industrial trade networks should be carried out to explore their common features and differences. This study analyzed the in-degree/out-degree centrality of each country’s international creative goods trade network in connection with its economy, culture, and society. However, this paper did not discuss each country’s unique cultural, social, and economic factors; these factors require further exploration in future studies.
Author Contributions
Conceptualization, H.S. and Y.N.; methodology, H.S.; software, H.S.; formal analysis, H.S.; data curation, H.S.; writing—original draft preparation, H.S.; writing—review and editing, H.S. and Y.N.; visualization, H.S.; supervision, Y.N.; project administration, Y.N. All authors have read and agreed to the published version of the manuscript.
Funding
This research received no external funding.
Informed Consent Statement
Not applicable.
Data Availability Statement
Not applicable.
Conflicts of Interest
The authors declare no conflict of interest.
References
- Florida, R. The flight of the creative class: The new global competition for talent. Lib. Educ. 2006, 92, 22–29. [Google Scholar]
- UNCTAD. Creative Economy Report; UNCTAD: Geneva, Switzerland, 2010. [Google Scholar]
- EC. Commission Staff Working Document-Analysis of the Consultation launched by the Green Paper on “Unlocking the Potential of Cultural and Creative Industries”; EC: Brussels, Belgium, 2010. [Google Scholar]
- UNCTAD. Creative Economy Statistics; UNCTAD: Geneva, Switzerland, 2018. [Google Scholar]
- Niu, J. A study of the influencing factors of the export trade of Beijing’s cultural creativity industry. Am. J. Ind. Bus. Manag. 2017, 7, 69–77. [Google Scholar] [CrossRef][Green Version]
- UNCTAD. Creative Economy Report 2008: The Challenge of Assessing the Creative Economy Towards Informed Policy Making; United Nations: Geneva, Switzerland, 2008. [Google Scholar]
- Fomenko, T.; Bilotserkovets, M.; Klochkova, T.; Statsenko, O.; Sbruieva, A.; Kozlova, O.; Kozlov, D. Overcoming Barriers in Intercultural Communication: A Case Study on Agricultural Idioms in English, Ukrainian and Chinese. Acad. J. Interdiscip. Stud. 2020, 9, 157–166. [Google Scholar] [CrossRef]
- Aage, T.; Belussi, F. From fashion to design: Creative networks in industrial districts. Ind. Innov. 2008, 15, 475–491. [Google Scholar] [CrossRef]
- Barrère, C.; Delabruyère, S. Intellectual property rights on creativity and heritage: The case of the fashion industry. Eur. J. Law Econ. 2011, 32, 305–339. [Google Scholar] [CrossRef]
- Beck, J. The sales effect of word of mouth: A model for creative goods and estimates for novels. J. Cult. Econ. 2007, 31, 5–23. [Google Scholar] [CrossRef]
- Benita, F.; Urzúa, C.M. Efficient creativity in Mexican metropolitan areas. Econ. Model. 2018, 71, 25–33. [Google Scholar] [CrossRef]
- Černevičiūtė, J.; Strazdas, R. Teamwork management in Creative industries: Factors influencing productivity. Entrep. Sustain. Issues 2018, 6, 503–516. [Google Scholar] [CrossRef]
- Clement, J.; Shipilov, A.; Galunic, C. Brokerage as a Public Good: The Externalities of Network Hubs for Different Formal Roles in Creative Organizations. Adm. Sci. Q. 2017, 63, 251–286. [Google Scholar] [CrossRef]
- Dong, C.V.; Truong, H.Q. The determinants of creative goods exports: Evidence from Vietnam. J. Cult. Econ. 2019, 44, 281–308. [Google Scholar] [CrossRef]
- Bhattacharya, K.; Mukherjee, G.; Saramäki, J.; Kaski, K.; Manna, S.S. The international trade network: Weighted network analysis and modelling. J. Stat. Mech. Theory Exp. 2008, 2008, P02002. [Google Scholar] [CrossRef]
- De Andrade, R.L.; Rêgo, L.C. The use of nodes attributes in social network analysis with an application to an international trade network. Phys. Stat. Mech. Its Appl. 2018, 491, 249–270. [Google Scholar] [CrossRef]
- De Benedictis, L.; Nenci, S.; Santoni, G.; Tajoli, L.; Vicarelli, C. Network analysis of world trade using the BACI-CEPII dataset. Glob. Econ. J. 2014, 14, 287–343. [Google Scholar] [CrossRef]
- Smith, D.A.; White, D.R. Structure and dynamics of the global economy: Network analysis of international trade 1965–1980. Soc. Forces 1992, 70, 857–893. [Google Scholar] [CrossRef]
- Petridis, N.E.; Petridis, K.; Stiakakis, E. Global e-waste trade network analysis. Resour. Conserv. Recycl. 2020, 158, 104742. [Google Scholar] [CrossRef]
- Rassekh, F. The interplay of international trade, economic growth and income convergence: A brief intellectual history of recent developments. J. Int. Trade Econ. Dev. 2004, 13, 371–395. [Google Scholar] [CrossRef]
- UNESCO. The Globalisation Of Cultural Trade: A Shift in Consumption-International Flows of Cultural Goods and Services 2004–2013; UNESCO: Quebec, QC, Canada, 2016. [Google Scholar]
- Cerisola, S.; Panzera, E. Cultural and Creative Cities and Regional Economic Efficiency: Context Conditions as Catalyzers of Cultural Vibrancy and Creative Economy. Sustainability 2021, 13, 7150. [Google Scholar] [CrossRef]
- Howkins, J. The Creative Economy: How People Make Money from Ideas; Penguin: London, UK, 2002. [Google Scholar]
- Orefice, G.; Santoni, G. Exporting creative and cultural products: Birthplace diversity matters! World Econ. 2018, 41, 1867–1887. [Google Scholar] [CrossRef]
- European Union. Mapping the Creative Value Chains-A study on the Economy of Culture in the Digital Age; European Union: Luxembourg, Luxembourg, 2017. [Google Scholar]
- Horobets, O. The Book Trade as a Subcategory of the International trade in Cultural Goods of the European Union in the Creative Economy Sector: A Statistical Analysis; Access Press: Saint Paul, MN, USA, 2020; pp. 353–363. [Google Scholar]
- Meyer, J.W. Globalization: Theory and trends. Int. J. Comp. Sociol. 2007, 48, 261–273. [Google Scholar] [CrossRef]
- Harris, R.G. Globalization, trade, and income. Can. J. Econ./Revue Canadienne D’Economique 1993, 26, 755–776. [Google Scholar] [CrossRef]
- Chen, G.-M. The impact of new media on intercultural communication in global context. China Media Res. 2012, 8, 1–10. [Google Scholar]
- Kluver, R. Globalization, informatization, and intercultural communication. Am. Commun. J. 2000, 3. [Google Scholar]
- Holmes, P. Intercultural Communication in the Global Workplace, Critical Approaches. In The International Encyclopedia of Intercultural Communication; John Wiley Sons: New York, NY, USA, 2017; pp. 1–16. [Google Scholar]
- Arribas, I.; Pérez, F.; Tortosa-Ausina, E. Measuring Globalization of International Trade: Theory and Evidence. World Dev. 2009, 37, 127–145. [Google Scholar] [CrossRef][Green Version]
- Martell, L. The third wave in globalization theory. Int. Stud. Rev. 2007, 9, 173–196. [Google Scholar] [CrossRef]
- Clark, R.; Beckfield, J. A New Trichotomous Measure of World-system Position Using the International Trade Network. Int. J. Comp. Sociol. 2009, 50, 5–38. [Google Scholar] [CrossRef]
- Chung, J.E. Mapping International Film Trade: Network Analysis of International Film Trade Between 1996 and 2004. J. Commun. 2011, 61, 618–640. [Google Scholar] [CrossRef]
- Cattani, G.; Ferriani, S. A core/periphery perspective on individual creative performance: Social networks and cinematic achievements in the Hollywood film industry. Organ. Sci. 2008, 19, 824–844. [Google Scholar] [CrossRef]
- Florida, R.; Mellander, C.; King, K. The Global Creativity Index 2015; Martin Prosperity Institute: Toronto, ON, Canada, 2015. [Google Scholar]
- DiPietro, W.R.; Anoruo, E. Creativity, innovation, and export performance. J. Policy Modeling 2006, 28, 133–139. [Google Scholar] [CrossRef]
- World Bank. World Development Indicators; World Bank: Washington, DC, USA, 2020. [Google Scholar]
- WEF. The Global Competitiveness Report 2014–2015; WEF: Geneva, Switzerland, 2014. [Google Scholar]
- UNESCO. Dataset: Science, Technology and Innovation; UNESCO: Quebec, QC, Canada, 2021. [Google Scholar]
- Marin, A.; Wellman, B. Social network analysis: An introduction. SAGE Handb. Soc. Netw. Anal. 2011, 11, 25. [Google Scholar]
- Nam, Y.; Barnett, G.A. Globalization of technology: Network analysis of global patents and trademarks. Technol. Forecast. Soc. Chang. 2011, 78, 1471–1485. [Google Scholar] [CrossRef]
- Choi, J.H.; Barnett, G.A.; CHON, B.S. Comparing world city networks: A network analysis of Internet backbone and air transport intercity linkages. Glob. Netw. 2006, 6, 81–99. [Google Scholar] [CrossRef]
- Borgatti, S.P.; Everett, M.G.; Johnson, J.C. Analyzing Social Networks; Sage: Thousand Oaks, CA, USA, 2013. [Google Scholar]
- Park, J.H.; Lee, C.; Yoo, C.; Nam, Y. An analysis of the utilization of Facebook by local Korean governments for tourism development and the network of smart tourism ecosystem. Int. J. Inf. Manag. 2016, 36, 1320–1327. [Google Scholar] [CrossRef]
- Nam, Y. Institutional network structure of corporate stakeholders regarding global corporate social responsibility issues. Qual. Quant. 2015, 49, 1063–1080. [Google Scholar] [CrossRef]
- Forbes. Singapore’s Bet on a Creative Economy Hits the Road; Forbes: Washington, DC, USA, 2015. [Google Scholar]
- Samovar, L.A.; Porter, R.E.; McDaniel, E.R. Communication between Cultures; Wadsworth/Cengage Learning: Belmont, CA, USA, 2010. [Google Scholar]
- Xu, M.; Tian, C. Cultural deformations and reformulations: A case study of Disney’s Mulan in English and Chinese. Crit. Arts 2013, 27, 182–210. [Google Scholar] [CrossRef]
- Gere, C. New Media Art and the Gallery in the Digital Age. Tate Papers. 2004. Available online: https://www.tate.org.uk/research/publications/tate-papers/02/new-media-art-and-the-gallery-in-the-digital-age (accessed on 1 March 2022).


Publisher’s Note: MDPI stays neutral with regard to jurisdictional claims in published maps and institutional affiliations. |
© 2022 by the authors. Licensee MDPI, Basel, Switzerland. This article is an open access article distributed under the terms and conditions of the Creative Commons Attribution (CC BY) license (https://creativecommons.org/licenses/by/4.0/).