Article

Chemical Doping of a Silica Matrix with a New Organic Dye from the Group of Heterocyclic Compounds—Chemical, Optical and Surface Characteristics

1
Faculty of Materials Engineering and Physics, Cracow University of Technology, 30-084 Kraków, Poland
2
Faculty of Electrical Engineering, Silesian University of Technology, 44-100 Gliwice, Poland
3
Oil and Gas Institute—National Research Institute, 31-503 Kraków, Poland
*
Authors to whom correspondence should be addressed.
Crystals 2022, 12(4), 478; https://doi.org/10.3390/cryst12040478
Submission received: 28 February 2022 / Revised: 23 March 2022 / Accepted: 25 March 2022 / Published: 30 March 2022

Abstract

:
This paper presents the results of research on a luminescent dye bound in a silica matrix. The new developed dye from the group of azaheterocyclic compounds was used: 3-(p-hydroxyphenyl)-1-phenyl-1H-pyrazolo [3,4-b]quinoxaline. The structure and composition of the dye was examined by 1HNMR, 13CNMR, FTIR, and elemental analysis. Its absorption and photoluminescence characteristics were tested in solvents of different polarity in UV-Vis range. The films were prepared by sol–gel method and dip-coating technique. The dye was introduced into a sol in the course of a synthesis of the latter. DLS and FTIR measurements of sols were performed. Optical properties were investigated using UV-Vis spectrophotometry and monochromatic ellipsometry. The surface morphology of the layers was examined by atomic force microscopy. Our investigations showed that the dye bound in the silica matrix does not lose its photoluminescent properties. The emission band at λPL = 550 nm (λex = 365 nm) was recorded for the dye in the matrix. The layers are optically homogeneous with smooth surfaces. Dye doped silica films have RMS surface roughness of 2.17 nm over areas of 2 × 2 μm2. The idea of binding a photoluminescent dye in a silica matrix presented in the paper can be applied in the technology of luminescent solar concentrators.

1. Introduction

In recent years, there has been growing interest in receiving energy from renewable sources (RES) [1]. Solar energy is the purest form of energy; it can be transformed into electricity thanks to the photovoltaic effect [2,3]. For several decades, many research centers around the world have developed various technologies of photovoltaic cells [4], of which, the most popular applications are currently silicon cells (market share approx. 82%) [5].
The high-temperature technological processes necessary for the production of silicon photovoltaic cells adversely affect their price, as well as contribute to the emission of greenhouse gases. Therefore, for these reasons, many research centers conduct research on the development of new materials and designs of photovoltaic cells that can be produced in low-temperature processes [4]. Investigations on organic photovoltaics (OPV) is one of the trends in the development of photovoltaics. Organic solar cells can be produced in very efficient technological processes, at low temperatures. The ability to produce structures on flexible substrates is an important advantage of OPV [6]. However, there are also disadvantages. Unsatisfactory chemical stability is so far the most prominent one. This problem is faced by numerous research groups around the world [5,6,7,8]. Improving the efficiency of the photovoltaic systems can be achieved by using solar radiation concentrators. Currently, there are mirror, lens, and luminescent concentrators (LSC—Luminescent Solar Concentrator) [9,10]. LSCs consist of a matrix (glass or polymer) in which a dye is bound. Solar radiation is absorbed by the dye and then emitted in other spectral ranges, usually at longer wavelengths. LSCs are most often manufactured in the form of plates or rods in such a way that the light emitted by the dye, using the fiber optic effect, can reach the photodiode located on the edge of the structure [7,11,12]. The LSC structures are continuously undergoing further development. [13,14,15]. There is a demand for new luminescent materials as well as materials suitable for use as matrices for dopants [16,17,18,19,20]. Wu Jun et al. [21] proposed the use of a silocone-carbon dots (Si-CDs) composite as a luminescent material in order to improve the compatibility of the luminescent material with the matrix. In turn, Fiorini V. et al. [22] presented the results of studies on cationic Ir (III) tetrazole complexes used as dyes in various polymer matrices. In [23], organic dyes, thienopyrazine derivatives, are presented as potential dyes in LSC. M. de Clercq et al. [24] proposed a combination of two polymer matrices: PMMA (poly (methyl methacrylate)) and PS-b-PAA (polystyrene-block-poly (acrylic acid)), in various ratios, to reduce the phenomenon of radiation reabsorption. In this work we present the newly developed kind of photoluminescent layers. In our view, they can be used in the technology of luminescent solar concentrators.
The azaheterocyclic systems, including pyrazole, quinoline, quinoxaline, and benzoxazole derivatives, show good photophysical properties (absorption in the range of visible radiation, radiation emission, high fluorescence quantum yields, and long fluorescence lifetimes) [25,26]. For these reasons, they seem to be attractive for applications in optoelectronic devices, including photovoltaic devices [27,28]. The single-layer OPVs presented in [29,30], containing in active layers the derivatives of the 1H-pyrazolo [3,4-b]quinoxalines (PQX), have allowed an increase in their efficiency. In this work, we present composite luminescent structures produced in the form of layers in which mesoporous silica was used as a matrix and the new PQX derivative as a dye.
The thin film technologies are widely used in many technical fields. They are used to modify the surface of various materials, increasing their mechanical and chemical resistance and enhancing their aesthetic value. For example, silica layers can be applied as protective, anti-reflective, and self-cleaning coatings [31]. Thin dielectric layers with specific optical properties find numerous applications in optics, electronics, and photovoltaics. Thin films can be fabricated from vapor phase, using physical methods (PVD) and chemical methods (CVD) or from liquid phase using a sol–gel method. We applied the sol–gel method for fabrication of luminescent layers presented in this work. This method is used and is being developed in many research centers [32,33]. The sol–gel method is the chemical method significant in producing materials from the liquid phase. During a sol–gel process, chemical reactions of hydrolysis and condensation are simultaneously occuring. Sol layers are then deposited on substrates. For this purpose, in our research, we use the dip-coating method [34]. The sol–gel technique is also successfully used for the production of LSC [35].
Introducing molecules of organic materials into sol–gel matrices in order to produce photonic and sensor structures has been used for a long time [36,37]. There are two methods of immobilizing substances in sol–gel matrices: chemical doping and impregnation. In the case of chemical doping, organic particles are introduced into sol, from which composite layers are produced [38]. This method may result in the formation of aggregates of dye particles in the matrix, which has a positive effect on the intensity of luminescence [39]. In the case of the impregnation method, the organic particles are not annealed, so that their luminescent properties are not degraded by high temperatures. Impregnation on the surface can take place by adsorption or binding with the matrix by means of covalent bonds created under appropriate conditions.
The aim of this work is to present the results of our research on the development of composite layers, containing a new luminescent dye bound in a silica matrix. Luminescent dye from the group of azaheterocyclic compounds—3-(p-hydroxyphenyl)-1-phenyl-1H-pyrazolo [3,4-b]quinoxaline—was produced by two-step synthesis with high reaction yields. The use of dye in composite layers was preceded by tests of its photophysical properties in solvents. We examined the structure and composition of the dye using NMR (1H NMR, 13C NMR), FTIR, and elemental analysis methods. Composite layers were fabricated using the dip-coating technique by coating substrates with sol films doped with the dye. A distribution of particles size in the sol was determined by the DLS method, and the types of chemical bonds in the silica were determined by the FTIR method. The optical properties of composite luminescent layers were investigated using UV-Vis spectrophotometry and monochromatic ellipsometry. The surface morphology of the produced composite layers was examined by atomic force microscopy.
The research has shown that the dye bound in the silica matrix does not lose its photoluminescent properties and the layers are optically homogeneous and have smooth surfaces. Luminescent layers presented in this paper may find application in the technology of LSC.
The work is organized as follows: Section 2 describes the materials, methods of synthesis, and measurement methods of the studied structures. Section 3 contains the experimental results obtained and their extensive discussion.

2. Materials and Methods

2.1. Materials

All reagents and solvents used for the synthesis and spectroscopic studies were commercial products and were used without prior purification. Glacial acetic acid (CH3COOH, 99.5%) was used for the purpose of synthesis of the dye and in a process of cleaning of glass substrates. Isopropanol, hydrochloric acid (HCl, 36%), ethanol (EtOH, 96%), acetone, and tetrahydrofuran were supplied by Avantor Performance Materials (Gliwice, Poland). Tetraethyl ortosilicate (TEOS), hydrobromic acid (HBr, 62%), 1,2-diaminobenzene (1), acetonitrile, and methylcyclohexane were purchased from Sigma-Aldrich (Steinheim, Germany). 3-(4-methoxyphenyl)-1-phenyl-1H-pyrazole-4,5-dione (2) was supplied by Chemieliva Pharma&Chem Co., LTD (Chongqing, China). Solvents for purification of products by column chromatography, ethyl acetate and toluene, were supplied by Chempur (Piekary Śląskie, Poland). Aluminum oxide 90 active neutral 70–230 mesh was purchased from Merck. It was used for column chromatography. The purity of final compounds was monitored using silica gel GF254 precoated thin layer chromatography (TLC) plates (Merck, Darmstadt, Germany). The layers were applied onto soda-lime glass microscope slides (Menzel Gläser, Thermo Scientific, Waltham, MA, USA). Deionized water was used directly from the deionizer (Polwater DL2-100S613TUV, Labopol Solution & Technologies, Kraków, Poland). The synthesized sols were filtered using a 0.2 µm PTFE syringe filter (Puradisc 25 TF, Whatman, UK).

2.2. Synthesis

2.2.1. Synthesis of Organic Day PQXOH

The synthetic pathway for the preparation of 1-phenyl-3-(p-hydroxyphenyl)-1H-pyrazolo [3,4-b]quinoxaline (PQXOH) is shown in Figure 1.
The dye 1-phenyl-3-(p-hydroxyphenyl)-1H-pyrazolo [3,4-b]quinoxaline (PQXOH) was obtained in a two-step synthesis process. The first stage, leading to the formation of 1-phenyl-3-(p-methoxyphenyl)-1H-pyrazolo [3,4-b]quinoxaline (PQXOMe), was carried out according to the synthesis scheme of pyrazoloquinoxaline derivative systems proposed by Sachs and Becherescu [40]. In this reaction, 1,2-diaminobenzene (1) and the corresponding pyrazolodione (2) were heated in glacial acetic acid under reflux for 24 h. The precipitate (PQXOMe) was purified by column chromatography and then characterized by spectroscopic techniques and elemental analysis. In the second step, the demethylation of PQXOMe was performed. For this purpose, a solution of 62% bromic acid in acetic acid was added to PQXOMe and the mixture was kept at reflux for 1.5 h [41]. The obtained product, after purification by column chromatography, was examined by nuclear magnetic resonance (1H and 13C NMR), elemental analysis and FT-IR (ATR) spectra were performed.

2.2.2. Synthesis of Sols

Silica was synthesized by the sol–gel method. Two types of silica sols were prepared. The reference layers were fabricated from pure silica sol (A), whereas the composite layers were fabricated from dye-doped sol (B). The only difference between these sols was the presence of the dye (PQXOH). The flow chart diagram of the layer production processes is shown in Figure 2.
After mixing the ingredients (TEOS, EtOH, HCl, H2O, and Triton X-100), sol formation was carried out at the temperature of 50 °C. Ethanol acts as the homogenizing agent, and hydrochloric acid is the catalyst that controls the rate of the hydrolysis and condensation reactions. Triton X-100, serving as the non-ionic surfactant, reduces the surface tension and, as a result, contributes to the increase of porosity of the final silica layers [42,43]. The molar proportions of the ingredients used to make the silica sols are summarized in Table 1. The last column shows the percentage of PQXOH dye in sol B. After 30 min elapsed, a solution of PQXOH in EtOH was added to sol B. Sol formation reactions were stopped after 3 h. After cooling to room temperature, both sols were filtered and set aside for 24 h. The sol A was colorless, whereas the sol B was orange. Sol layers were deposited on both sides of soda-lime glass substrates the next day using the dip-coating technique.
For FTIR measurements, 3 mL of sol B were heated at 200 °C for 1 h, yielding a dry, crystalline, orange powder.

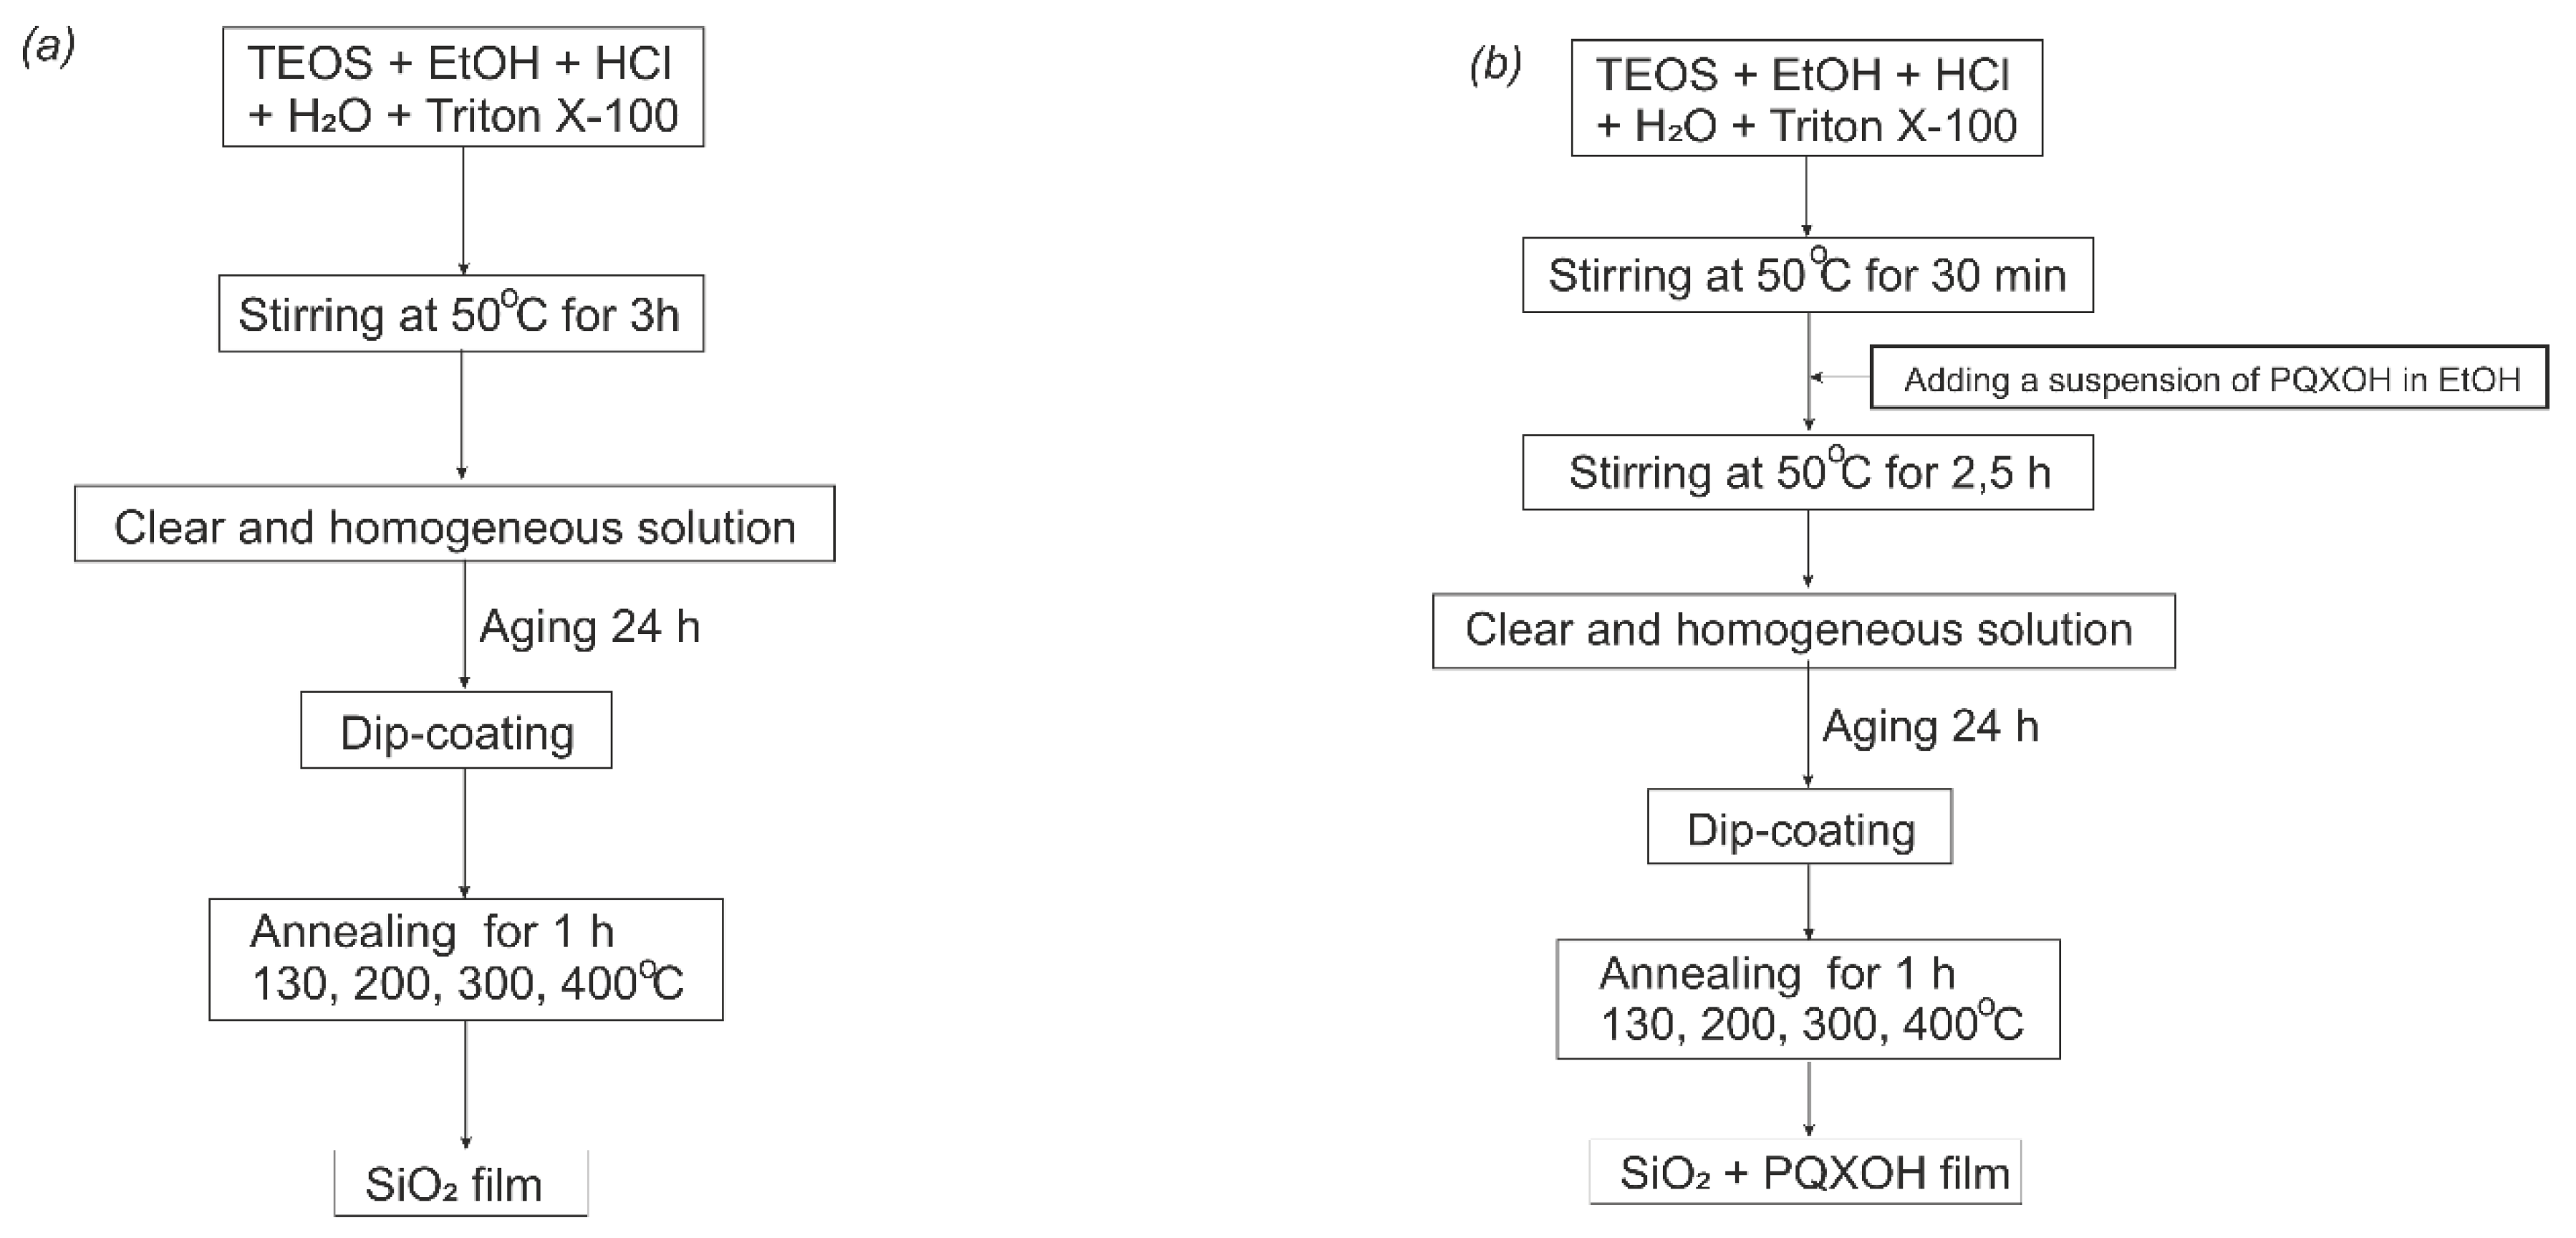
2.2.3. Films Fabrication

The main parameter allowing to control the thickness of the produced layers is the substrates withdrawal speed from the sol v. Both the reference and composite layers were applied at rates that varied from 3.2 to 6.5 cm/min. The structures were annealed at the temperature of 200 °C for 1 h after the application of layers. In the classical procedure of producing porous silica layers, the annealing temperatures are around 500 °C [42]. We have reduced the annealing temperature to 200 °C due to the presence of the organic dye. In addition, the silica layers and composite layers were also annealed at temperatures of 130, 300, and 400 °C for 1 h. The aim of these measures was to determine the effect of temperature, at which layers were annealed, on the change in their refractive index and thickness.

2.3. Equipment and Methods

The structure of the synthesized PQXOH derivative was examined by NMR (1H and 13C NMR) and FTIR. Elemental analysis and spectrophotometric tests were also performed. 1H NMR and 13C NMR spectra were recorded on a Bruker Avance III HD 400 MHz spectrometer in deuterated solvents (CDCl3, DMSO-d). The elemental analysis of the samples was performed on the Elementar Vario MICRO Cube analyzer. FTIR measurements were made on a Thermo Nicolet iS5 infrared spectrometer equipped with ATR accessory. Spectra were registered in the range of 4000–400 cm−1, with the resolution of 4 cm−1, in 64 scans. The absorption and photoluminescence spectra in the UV-Vis range were recorded for dye solutions in solvents of different polarity, such as methylcyclohexane (MCHX), tetrahydrofurane (THF), and acetonitrile (ACN). An Ocean Optics spectrophotometer was used in these measurements. The photoluminescence was excited with a UV light source operating at wavelength of 365 nm.
Measurements of the hydrodynamic diameter of the particles in the sols were made using the dynamic laser light scattering (DLS) method using a Zetasizer Nano ZS (Malvern Instruments, Worcestershire, UK) in disposable PMMA cuvettes. The hydrodynamic diameters were calculated from the correlation functions using the Malvern Nanosizer Software. FTIR measurements were made on a Thermo Nicolet iS5 infrared spectrometer equipped with ATR accessory. Spectra were registered in the range of 4000–400 cm−1, with the resolution of 4 cm−1, in 64 scans.
Values of layers’ refractive index and thickness were measured using a Sentech SE400 monochrome ellipsometer (Sentech, model 2003 (adv), operating at wavelength of 632.8 nm, Berlin, Germany).
The transmission and reflection properties of reference and composite films were investigated using the UV-Vis AvaSpec-ULS2048LTEC Spectrophotometer (Avantes, Apeldoorn, The Netherlands). The AvaLight-DH-S-BAL (Avantes) was used as a light source. The spectra were recorded in the wavelength range 200–1100 nm at room temperature. The emission of the dye in the silica matrix was measured in the same way as the photoluminescence of the dye in solutions.
The surface morphology of the produced films was examined by atomic force microscopy (AFM). From the recorded AFM images, their basis surface roughness of the films was determined. The measurements were carried out using AFM NTEGRA (NT-MDT, Moscow, Russia). Measurements were performed at a resonance frequency equal to 136.281 kHz in semi-contact mode with HA_NC (NT-MDT) silicon cantilever with nominal curvature tip radius of 10 nm. The average roughness measurements (RMS) were evaluated using NOVA 1.0.26.1644 (NT-MTD) software. The images were obtained from areas of size 2 × 2 μm2.

3. Results

3.1. The Synthesis of PQXOH and Their Photophysics Properties

In the first stage of the dye synthesis, 3-(p-methoxyphenyl)-1-phenyl-1H-pyrazolo [3,4-b]quinoxaline (PQXOMe) was obtained with the yield of 89% [44]. Then PQXOMe was the substrate in the next step of the synthesis, the product of which was PQXOH. The yield of this synthesis step was found to be 97%. Comprehensive characterization of PQXOMe and PQXOH was performed to determine their structures. 1H and 13C NMR and FTIR spectra for PQXOMe and PQXOH compounds are included in Supplementary Materials.

3.1.1. Synthetic Procedures

1,2-diaminobenzene (1) (250 mg, 2.3 mmol) was mixed with 3-(4-methoxyphenyl)-1-phenyl-1H-pyrazole-4,5-dione (2) (400 mg, 1.4 mmol) and 15 mL of glacial acetic acid. It was heated under reflux for 24 h. Then the mixture was allowed to cool to room temperature. Subsequently ethanol was added and the mixture was stirred. The precipitate was filtered off on a Buchner funnel and dried. In the next step, it was dissolved in chloroform and flashed through Aluminium Oxide 60. The resulting orange solid was crystallized from chloroform to yield 448 mg (89%) of orange crystalline 3-(p-methoxyphenyl)-1-phenyl-1H-pyrazolo [3,4-b]quinoxaline (PQXOMe).
Orange crystals, 448 mg, 89% yield, 1H NMR (CDCl3, 400 MHz): δ(ppm) 8.70 (dd, J = 2.0, 6.8 Hz, 2H), 8.55 (dd, J = 1.0, 8.7 Hz, 2H), 8.31 (dd, J = 0.6, 8.5 Hz, 1H), 8.19 (dd, J = 0.8, 8.6 Hz, 1H), 7.84–7.82 (m, 1H), 7.76–7.74 (m, 1H), 7.59 (dd, J = 7.4, 8.5 Hz, 2H), 7.31 (t, J = 7.4 Hz, 1H), 7.10 (d, J = 7.4 Hz, 2H), 3.91 (s, 3H); 13C NMR (CDCl3, 101 MHz): δ(ppm) 160.81, 143.44, 143.09, 141.34, 139.70, 137.31, 131.15, 130.74, 129.32, 129.18, 128.99, 128.13, 125.67, 124.06, 120.07, 114.40, 55.51. Anal. Calcd for C22H16N4O: C, 74.98; H, 4.58; N, 15.90. Found: C, 75.02; H, 4.45; N, 16.01. FTIR(ATR): ν = 3059 (C-Hsv), 3007 (C-Hsv), 1601, 1534, 1501, 1433, 1352, 1253 (C-O-C sv), 1174, 1120, 1028 (N = N), 983, 844, 754, 691, 604, 506, 420 cm−1.
3-(p-methoxyphenyl)-1-phenyl-1H-pyrazolo [3,4-b]quinoxaline (PQXOMe) (343 mg, 0.97 mmol) was mixed with 7 mL glacial acetic acid. Then, 7 mL (80 mmol) of HBr 62 % acid was slowly added. The mixture was heated under reflux for 1.5 h. After cooling, the mixture was poured into water, neutralized, and the resulting precipitate was filtered off on a Buchner funnel and dried. The pure product 3-(p-hydroxyphenyl)-1-phenyl-1H-pyrazolo [3,4-b]quinoxaline (PQXOH) was obtained in the form of a red crystalline powder with a yield of 97% (319 mg).
Red crystals, 319 mg, 97% yield, 1H NMR (DMSO-d, 400 MHz): δ(ppm) 8.51 (d, J = 8.6 Hz, 2H), 8.45 (d, J = 7.8 Hz, 2H), 8.31 (d, J = 8.4 Hz, 1H), 8.18 (d, J = 8.4 Hz, 1H), 7.97–7.94 (m, 1H), 7.87–7.85 (m, 1H), 7.64 (t, J = 7.7 Hz, 2H), 7.38 (t, J = 7.3 Hz, 1H), 7.02 (d, J = 8.6 Hz, 2H), 3.46 (s, −OH + H2O from DMSO-d6); 13C NMR (DMSO-d, 101 MHz): δ(ppm) 159.13, 142.98, 142.52, 140.54, 140.47, 139.03, 136.73, 131.80, 130.22, 129.42, 128.67, 125.72, 121.62, 119.63, 115.96, two signals are missing in the characterization. Anal. Calcd for C21H14N4O: C, 74.54; H, 4.17; N, 16.56. Found: C, 74.10; H, 4.33; N, 16.67; FTIR(ATR): ν = 3306 (O-Hsv), 3046 (C-Hsv), 1589 (N = Nvv), 1534, 1495, 1417, 1354, 1276, 1249, 1202, 1172, 1118, 1067 (N = N), 985, 842, 752, 689, 660, 605, 508, 426 cm−1.

3.1.2. The Photophysical Properties of PQXOH

The absorption measurements in the UV-Vis range and photoluminescence were performed for the PQXOH solution in three solvents differing in polarity: methylcyclohexane (MCHX), tetrahydrofuran (THF) and acetonitrile (ACN) (see Supplementary Materials). The photoluminescence were excited at a wavelength of λex = 365 nm. This choice of excitation wavelength was due to the availability of the light source and not due to the light absorption spectrum of the dye. The results for the PQXOH measurements in MCHX are shown in Figure 3. The positions of the absorption and photoluminescence band maxima and Stokes shifts (SS) obtained from the measurements are summarized in Table 2.
The absorption spectrum of the tested dye in the MCHX solution shows two absorption bands: the first one lying in the near ultraviolet, with a maximum at λ = 333 nm, and the second in the blue part of the visible spectrum. The spectrum shows the band responsible for the S0→S1 transition. Its maximum is observed at a wavelength of 458 nm. In turn, this system in the MCHX solution, excited by ultraviolet radiation with wavelength of 365 nm, emits radiation in the green range of the visible spectrum at a wavelength of 534 nm. The molecule displayed a large Stokes shift (76 nm (0.39 eV)). And it implies poor overlapping of absorption and emission spectra, which is an important feature for a potential application in LSC [45].
Based on the data collected in Table 2, it can be concluded that the position of the absorption band of the tested dye is independent of the polarity of the solvent. On the other hand, the position of the emission bands depends on the polarity of the solvent. In the non-polar solvent (MCHX), the emission band lies in the green range of visible light (λPL = 534 nm, λex = 365 nm), and in the polar solvent ACN, on the border between the yellow and orange range of visible light (λPL = 586 nm, λex = 365 nm). A bathochromic shift of the emission bands is observed with increasing polarity of the solvent. In the MCHX dye emission band, beyond the peak maximum, there is also a noticeable second weak maximum at λ = 593 nm. This band disappears in polar acetonitrile (see Supplementary Materials, Figure S8), possibly due to an efficient radial electron backtransfer process. This second maximum, shifted to the main maximum of the emission band by 59 nm, can be attributed presumably to the state with pronounced charge separation (charge transfer band).

3.2. Characteristics of the Sol with PQXOH Impregnated

Figure 4 shows the results of DLS measurements. These measurements were performed to determine the particle size in the silica sol (A) and the effect of the dopant PQXOH on the particle size in the doped sol (B). Measurements were carried out on the second day after sol synthesis.
One can observe two distinct maxima on the particle intensity distributions (Figure 4a) for silica sol (black squares and line): higher for particles with hydrodynamic diameters of about 5 nm, and lower for particles with diameters of about 28 nm. The few larger particles are likely to come from aggregates that are formed in the sol–gel processes from the very beginning of the initiation of condensation processes. By analyzing the particle size distribution by volume (Figure 4b) for silica sol, it can be observed that most of the particles in the sol are about 5 nm in size. The addition of the organic dye PQXOH to the sol during synthesis (sol B) affects the population of particles in the size distribution by intensity (Figure 4a, red squares and line), which is represented by the monomodal distribution. It is characterized by one peak for particles with a hydrodynamic diameter of about 5 nm. No particle aggregation processes are observed in the silica sol that was doped with PQXOH dye.
Figure 5 shows the FTIR spectrum of the powder obtained from the SiO2 + PQXOH sol by heating a small amount (about 3 mL) at 200 °C for 1 h. All absorption bands were assigned based on previously reported results for similar materials [46,47,48,49].
There are many absorption bands visible on the recorded spectrum. It is probably related to the relatively low temperature (200 °C) at which sol was annealed. Such proceedings were necessary to keep the tested PQXOH system in the matrix intact. However, the temperature was too low to get rid of all organic residues from the sol and obtain the SiO2 matrix [42]. The strongest, broad absorption band at 1041 cm−1 comes from the Si-O stretching vibrations. The absorption bands derived from C-O bonds in both solvents and precursors used for sol synthesis, may also overlap in this band due to the low sol annealing temperature [50]. The signal from the vibration of stretching C-O bonds is also attributed to the band at 1724 cm−1 [51]. The presence of Si-O bonds is confirmed by absorption bands at 423 cm−1 (Si-O sv) and 799 cm−1 (Si-O sv) [52]. The absorption bands at 1184 and 828 cm−1 may come from vibrations of Si-O-Si bonds [51]. In turn, the band at 951 cm−1 is attributed to the stretching vibrations of Si-OH bonds [52,53]. Distinct absorption bands located at 2950 and 2872 cm−1 are attributed to C-H stretching vibrations, while at 556 cm−1 to C-H bending vibrations. Due to the high capacity of silica to adsorb water, the absorption bands resulting from the vibrations of the O-H bond are located at the following positions: 3388 cm−1 (O-H sv) and 1513 cm−1 (O-H bv) [54]. Additionally, the band at 3388 cm−1 may indicate the presence of the organic dye PQXOH in the sol. The remaining visible absorption bands come from the organic parts remaining after heating the sol.

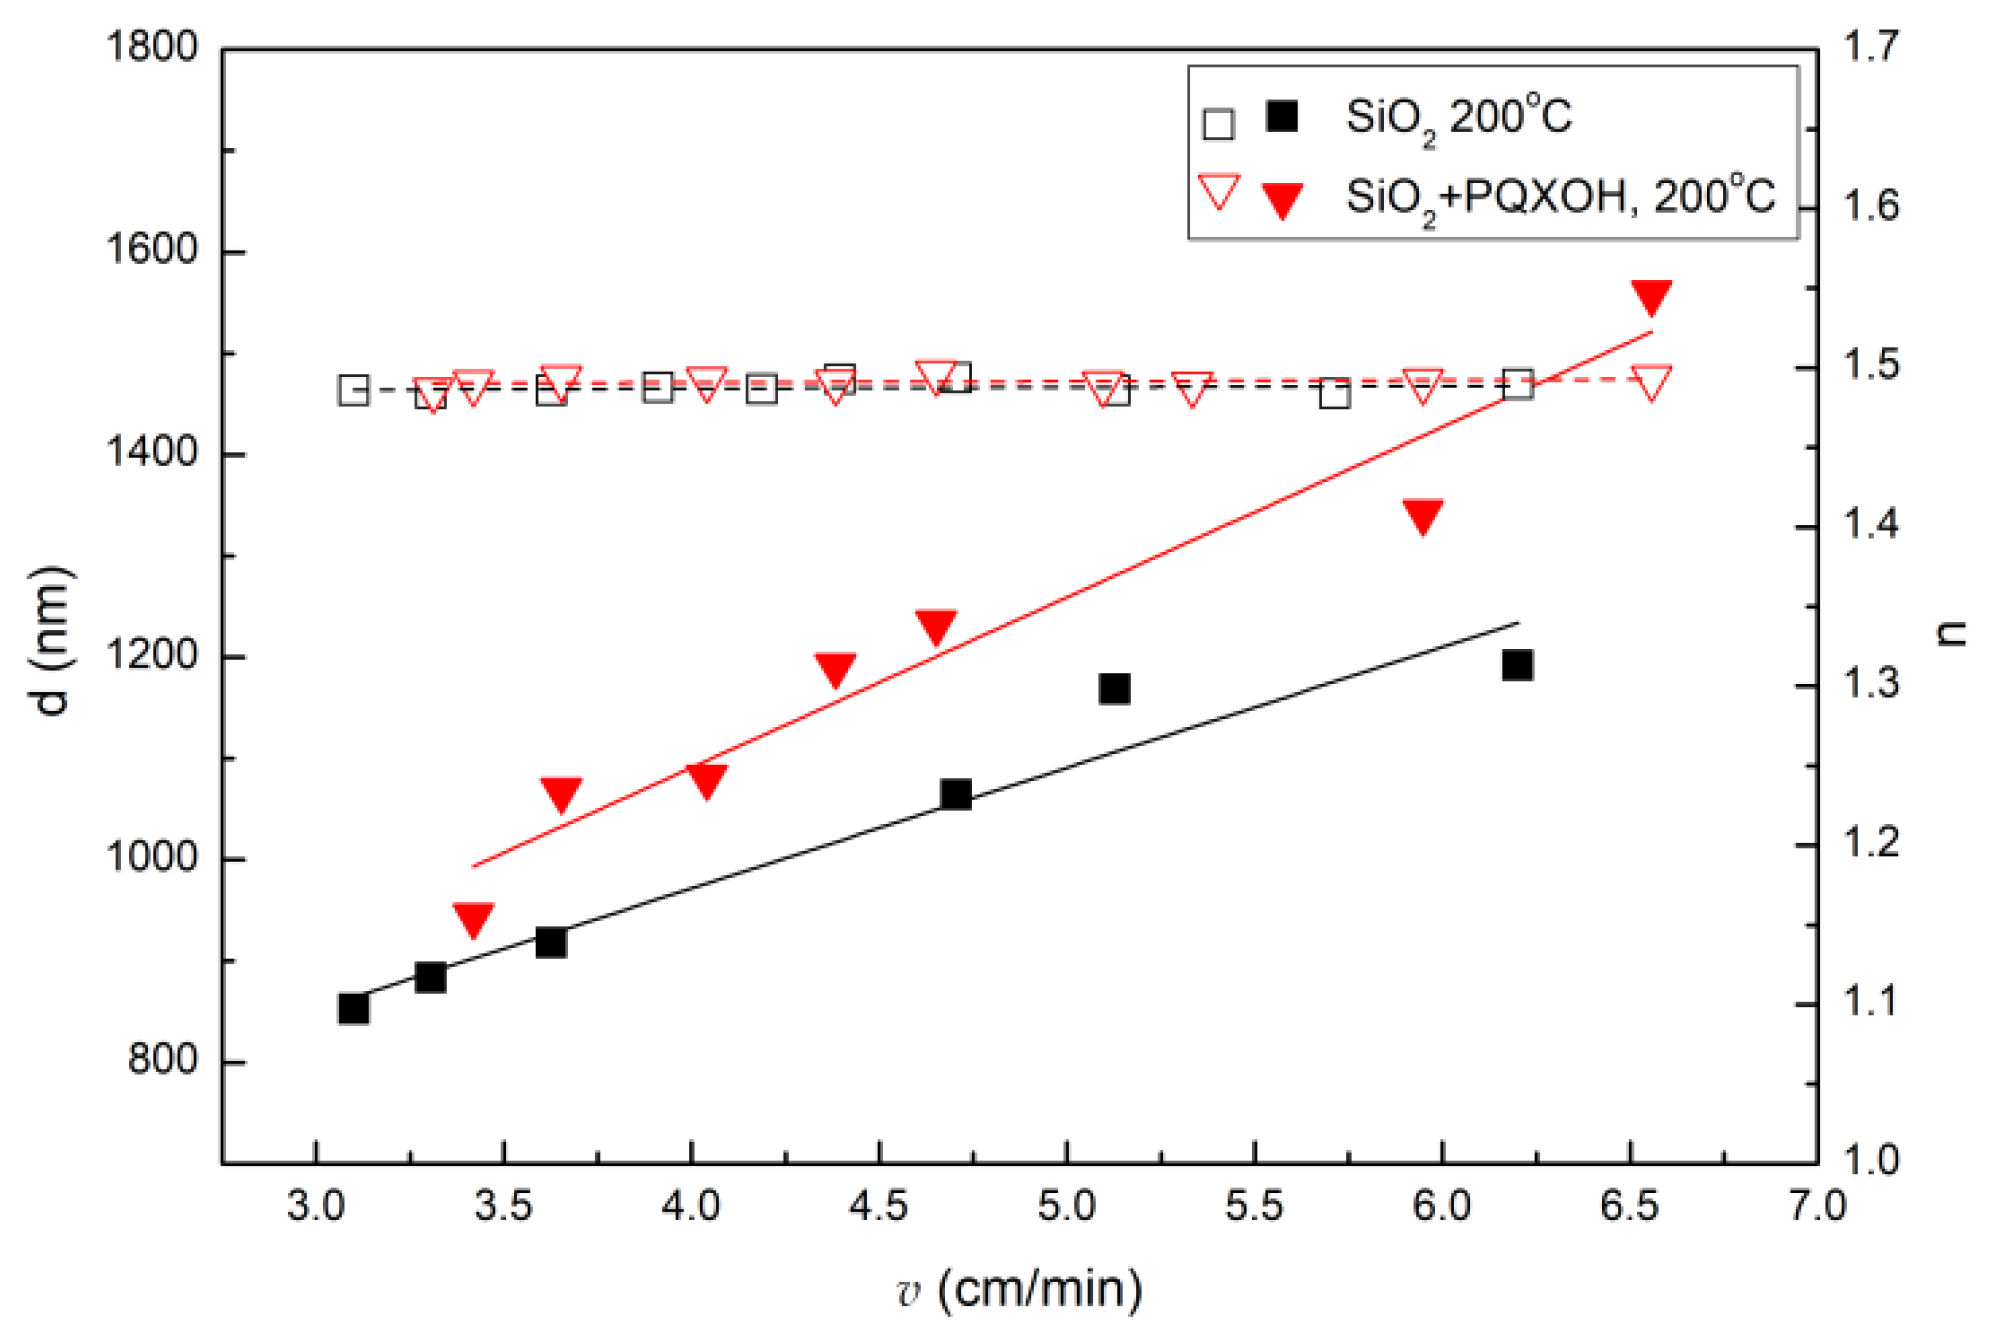
3.3. Technological Characteristics of the Produced Films

Figure 6 shows the technological characteristics of the dip-coating method applied for fabrication of SiO2 layers and composite layers doped with organic PQXOH dye. The experimental dependence d = d(v) is marked with full black squares and the empty black squares n = n(v) for silica layers. On the other hand, the red triangles represent the experimental relationships, respectively: solid—thickness dependence on the rate of emergence of sol substrates d = d(v) and empty—refractive index dependence on the sol substrate emergence rate n = n(v) for silica layers with an admixture of organic dye PQXOH. In both cases, the layer thicknesses increase with the increase of the withdrawal v, while the refractive indices remain constant. The speed v varied in the range of 3.1–6.6 cm/min. The layers fabricated in a one-step dip-coating process, annealed at the temperature of 200 °C, have thicknesses varying from 852.6 nm to 1191.8 nm for silica (sol A) and from 944.1 nm to 1559.2 nm for silica with PQXOH (sol B). On the other hand, characteristics n(v) for layers fabricated from both sols (A and B) are almost identical. Refractive index, measured for λ = 632.8 nm, is varying in the range of 1.4825–1.4895 for silica layers, and in the range 1.4858–1.4967 for SiO2 + PQXOH layers.
All experimental series were approximated with linear functions. One can observe that experimental points corresponding to values of thickness d are located close to the approximating lines. The fit is slightly weaker only at higher speeds, above 5 cm/min. On the other hand, considering the refractive index, the fit to n(v) is very good. The obtained technological characteristics indicate that the presence of the organic day has influence on sol viscosity. One can observe it comparing thicknesses of PQXOH doped layers and reference silica layers withdrawn from sols at the same values of speed v.
Figure 7 shows the influence of a magnitude of the annealing temperature on the thickness (black squares) and the refractive index (red triangles) of fabricated reference silica layers (empty characters) and silica layers doped with organic dye PQXOH (full characters). Presented characteristics are corresponding with layers coated at substrate withdrawal speed of 5 cm/min. Both thickness and refractive index of reference and doped layers are reduced as a result of increase in the annealing temperature. Presumably at a temperature of 300 °C, most of the organic parts which are introduced into sols are removed from the layer material. Presumably also the PQXOH dye. Therefore, the difference in the thicknesses of the layers annealed at 300 °C and 400 °C is not so large (for SiO2 d = 764 nm, T = 300 °C and d = 651 nm, T = 400 °C and for SiO2 + PQXOH d = 624 nm, T = 300 °C and d = 528 nm, T = 400 °C). Refractive index of silica layers decreases to a level of 1.2 if annealing temperature exceeds 300 °C. This result is in line with the values obtained for the porous silica reported earlier [42]. Considering annealing processes, layers doped with PQXOH behave similarly to reference silica layers.

3.4. Optical Properties of Composite Layers

Transmittance and reflectance spectra of fabricated layers are presented in Figure 8. Analysis of transmittance characteristics registered for reference silica layers and for layers doped with PQXOH, leads to the conclusion that above the wavelength of 550 nm, both types of layers show high transmittance, similar to the transmittance of the soda-lime glass substrate (90%). One can observe reduction of transmittance in the range of 400–500 nm and waviness of the characteristics. This effect results from the presence of the dye absorption band at λabs = 455 nm (Figure 3 and Figure S7 in Supplementary Materials). On the other hand, the undulation of the characteristics is the result of the interference of light in the layer. It is easy to notice that the period of these undulations coincides with the period of undulations of the reflection characteristics. The analysis of the reflection spectrum shows that the interference maxima above 560 nm lie on the reflection characteristics of the sodium-lime substrate, which may indicate the optical homogeneity of the layer [55].
The photoluminescence was measured for the composite layer doped with the PQXOH dye. Position of the emission band in the relevant spectrum was compared with emission bands of PQXOH dye dissolved in solvents of different polarity (Section 3.1) and the dye trapped in the silica matrix (Figure 9a). The PQXOH introduced into the silica matrix, excited at λex = 365 nm emits in the range of green-yellow visible light, at λPL = 550 nm. Compared to the measurement of the emission in the non-polar MCHX solution (black line), the PQXOH emission band in the composite layer is shifted toward longer wavelengths of 16 nm. On the other hand, when comparing this emission band with the bands observed in polar solvents (THF, green line; and ACN, blue line), the shift toward shorter wavelengths is observed. It is probably related to the solvatochromic effect of solvents and the occurrence of additional intermolecular interactions in polar solutions [56]. Figure 9b shows the emission of the silica layer and the composite layer after illumination with a 365 nm lamp.

3.5. The Surface Morphology

Figure 10 and Figure 11 show images obtained from a surface atomic force microscope and profiles of silica layer (Figure 10) and trapped silica PQXOH (Figure 11), respectively. The layers were obtained by the sol–gel method and the dip-coating technique. They were placed on soda-lime glass and annealed at the temperature of 200 °C for 1 h.
The surface of the silica layer (Figure 10a) is very flat. Figure 10b shows linear profiles along the surface marked in Figure 10a. The difference between the highest and the lowest point on the 2 × 2 μm2 test area is approximately 3.4 nm and is composed of irregular grains. The root mean square (RMS) surface roughness is 0.47 nm over a 2 × 2 μm2 area, which testifies to high smoothness of the layer surface. On the other hand, the surface of the silica layer with the chemically impregnated PQXOH dye (Figure 11) also shows a flat character, but its roughness for the area of 2 × 2 μm2 is higher and amounts to 2.17 nm. From the line profiles shown in Figure 11b, one can observe that the difference between the highest and the lowest point on the tested surface is about 15 nm. The surface of the SiO2 + PQXOH layer is made of irregular grains, but they are higher and have sharp ends. On the basis of the obtained images and profiles, it can be concluded that the chemical doping of the silica matrix with the tested organic dye PQXOH influences the surface structure of the layers, causing grain growth on the surface and an increase in the surface roughness of these layers.

4. Conclusions

The paper presents the results of research on chemical and optical properties as well as morphology of silica layers and silica layers chemically doped with a new organic dye from the group of azaheterocyclic compounds. The PQXOH compound is characterized by the absorption band in the UV-Vis range (λAbs = 458 nm in MCHX) and the emission band (λPL = 534 nm in MCHX). The layers were fabricated using the sol–gel method and the dip-coating technique. On the basis of DLS measurements we have found that particles do not aggregate, not only in the silica sol, but also in the silica sol doped with PQXOH. The presence of bands confirming the presence of bonds in silica was confirmed on the FTIR spectrum recorded for the powder, which was obtained from the doped sol, annealed at the temperature of 200 °C. The optical properties (refractive index, transmission and reflection characteristics, and photoluminescence) and surface morphology of the layers were investigated. The results confirmed high homogeneity of fabricated layers, very good optical transmittance above the absorption edge and high smoothness of their surfaces (for SiO2 RMS = 0.47 nm and for SiO2 + PQXOH RMS = 2.17 nm from a 2 × 2 μm2 area). The results presented in the paper show that the sol–gel method and the dip-coating technique can be used to obtain composite silica layers doped with the organic dye having very good luminescent properties. The dye trapped in the silica matrix did not lose its luminescent properties, and the emission shifted towards longer wavelengths. This provides the basis for further research towards the use of such systems as LSCs.

Supplementary Materials

The following supporting information can be downloaded at: https://www.mdpi.com/article/10.3390/cryst12040478/s1. Figure S1. 1H NMR spectra for PQXOMe; Figure S2. 1H NMR spectra for PQXOH; Figure S3. 13C NMR spectra for PQXMe; Figure S4. 13C NMR spectra for PQXOH; Figure S5. FTIR spectra for PQXOMe; Figure S6. FTIR spectra for PQXOH; Figure S7. Normalized absorbance for PQXOH dye in solvents of different polarity; Figure S8. Normalized photoluminescence for PQXOH dye in solvents of different polarity (λex = 365 nm).

Author Contributions

Conceptualization, K.W.; methodology, K.W., M.Z. and P.K.; software, C.T., formal analysis, K.W., M.Z., M.W., C.T., M.P.-K., E.G., A.D. and P.K.; investigation, K.W., M.Z., M.W., C.T., M.P.-K., E.G. and A.D.; writing—original draft preparation, K.W. and M.Z.; writing—review and editing, K.W. and P.K.; visualization, M.W., M.P.-K., A.D. and C.T.; supervision, P.K.; All authors have read and agreed to the published version of the manuscript.

Funding

This work is supported by the National Science Centre, Poland, on the basis of decision DEC-2017/25/B/ST7/02232.

Institutional Review Board Statement

Not applicable.

Informed Consent Statement

Not applicable.

Data Availability Statement

Not applicable.

Conflicts of Interest

The authors declare no conflict of interest.

References

  1. Marks-Bielska, R.; Bielski, S.; Pik, K.; Kurowska, K. The importance of renewable energy sources in Poland’s energy mix. Energies 2020, 13, 4624. [Google Scholar] [CrossRef]
  2. Dincer, I.; Bicer, Y. Photonic Energy Production. In Comprehensive Energy Systems; Elsevier Inc.: Amsterdam, The Netherlands, 2018; Volume 3–5, pp. 707–754. [Google Scholar] [CrossRef]
  3. Ramalingam, K.; Indulkar, C. Solar Energy and Photovoltaic Technology. In Distributed Generation Systems: Design, Operation and Grid Integration; Elsevier: Amsterdam, The Netherlands, 2017; pp. 69–147. [Google Scholar] [CrossRef]
  4. Best Research—Cell Efficiency Chart. Available online: https://www.nrel.gov/pv/cell-efficiency.html (accessed on 18 February 2022).
  5. Parida, B.; Iniyan, S.; Goic, R. A review of solar photovoltaic technologies. Renew. Sustain. Energy Rev. 2011, 15, 1625–1636. [Google Scholar] [CrossRef]
  6. Richardson, B.J.; Zhu, L.; Yu, Q. Design and development of plasmonic nanostructured electrodes for ITO-free organic photovoltaic cells on rigid and highly-flexible substrates. Nanotechnology 2017, 28, 165401. [Google Scholar] [CrossRef] [PubMed]
  7. Hong, L.; Yao, H.; Cui, Y.; Ge, Z.; Hou, J. Recent advances in high-efficiency organic solar cells fabricated by eco-compatible solvents at relatively large-area scale. APL Mater. 2020, 8, 120901. [Google Scholar] [CrossRef]
  8. Duan, L.; Uddin, A. Progress in Stability of Organic Solar Cells. Adv. Sci. 2020, 7, 1903259. [Google Scholar] [CrossRef] [Green Version]
  9. Hermann, A.M. Luminescent solar concentrators—A review. Sol. Energy 1982, 29, 323–329. [Google Scholar] [CrossRef]
  10. Aghaei, M.; Ebadi, H.; de Oliveira, A.K.V.; Vaezi, S.; Eskandari, A.; Castañón, J.M. New concepts and applications of solar PV systems. In Photovoltaic Solar Energy Conversion; Elsevier: Amsterdam, The Netherlands, 2020; pp. 349–390. [Google Scholar] [CrossRef]
  11. Moraitis, P.; Schropp, R.E.I.; van Sark, W.G.J.H.M. Nanoparticles for Luminescent Solar Concentrators—A review. Opt. Mater. 2018, 84, 636–645. [Google Scholar] [CrossRef]
  12. Meinardi, F.; Bruni, F.; Brovelli, S. Luminescent solar concentrators for building-integrated photovoltaics. Nat. Rev. Mater. 2017, 21, 17072. [Google Scholar] [CrossRef]
  13. Patrizi, B.; Iagatti, A.; Abbondanza, L.; Bussotti, L.; Zanardi, S.; Salvalaggio, M.; Fusco, R.; Foggi, P. Ultrafast Intramolecular and Solvation Dynamics in 4,7-Bis(4,5-dibutylbenzo[1,2- b:4,3- b′]bisthiophene[1,2- b:4,3- b′]bisthiophen-2-yl)-2,1,3-benzothiadiazole. J. Phys. Chem. C 2019, 123, 5840–5852. [Google Scholar] [CrossRef]
  14. Coropceanu, I.; Bawendi, M.G. Core/shell quantum dot based luminescent solar concentrators with reduced reabsorption and enhanced efficiency. Nano Lett. 2014, 14, 4097–4101. [Google Scholar] [CrossRef]
  15. Davis, N.J.L.K.; MacQueen, R.W.; Jones, S.T.E.; Orofino-Pena, C.; Cortizo-Lacalle, D.; Taylor, R.G.D.; Credgington, D.; Skabara, P.J.; Greenham, N.C. Star-shaped fluorene-BODIPY oligomers: Versatile donor-acceptor systems for luminescent solar concentrators. J. Mater. Chem. C 2017, 5, 1952–1962. [Google Scholar] [CrossRef] [Green Version]
  16. Papucci, C.; Charaf, R.; Coppola, C.; Sinicropi, A.; di Donato, M.; Taddei, M.; Foggi, P.; Battisti, A.; de Jong, B.; Zani, L.; et al. Luminescent solar concentrators with outstanding optical properties by employment of D–A–D quinoxaline fluorophores. J. Mater. Chem. C 2021, 9, 15608–15621. [Google Scholar] [CrossRef]
  17. Papucci, C.; Dessì, A.; Coppola, C.; Sinicropi, A.; Santi, G.; Di Donato, M.; Taddei, M.; Foggi, P.; Zani, L.; Reginato, G.; et al. Benzo[1,2-d:4,5-d′]bisthiazole fluorophores for luminescent solar concentrators: Synthesis, optical properties and effect of the polymer matrix on the device performances. Dye. Pigment. 2021, 188, 109207. [Google Scholar] [CrossRef]
  18. Bünzli, J.C.G.; Chauvin, A.S. Lanthanides in solar energy conversion. In Handbook on the Physics and Chemistry of Rare Earths; Elsevier: Amsterdam, The Netherlands, 2014; Volume 44, pp. 169–281. [Google Scholar] [CrossRef]
  19. Meinardi, F.; Colombo, A.; Velizhanin, K.A.; Simonutti, R.; Lorenzon, M.; Beverina, L.; Viswanatha, R.; Klimov, V.; Brovelli, S. Large-area luminescent solar concentrators based on Stokes-shift-engineered nanocrystals in a mass-polymerized PMMA matrix. Nat. Photonics 2014, 8, 392–399. [Google Scholar] [CrossRef]
  20. Lucarelli, J.; Lessi, M.; Manzini, C.; Minei, P.; Bellina, P.; Pucci, A. N-alkyl diketopyrrolopyrrole-based fluorophores for luminescent solar concentrators: Effect of the alkyl chain on dye efficiency. Dye. Pigment. 2016, 135, 154–162. [Google Scholar] [CrossRef]
  21. Wu, J.; Xin, W.; Wu, Y.; Zhan, Y.; Li, J.; Wang, J.; Huang, S.; Wang, X. Solid-state photoluminescent silicone-carbon dots/dendrimer composites for highly efficient luminescent solar concentrators. Chem. Eng. J. 2021, 422, 130158. [Google Scholar] [CrossRef]
  22. Fiorini, V.; Monti, N.; Vigarani, G.; Santi, G.; Fasulo, F.; Massi, M.; Giorgini, L.; Muñoz-García, A.B.; Pavone, M.; Pucci, A.; et al. Colourless luminescent solar concentrators based on Iridium(III)-Phosphors. Dye. Pigment. 2021, 193, 109532. [Google Scholar] [CrossRef]
  23. Yzeiri, X.; Calamante, M.; Dessì, A.; Franchi, D.; Pucci, A.; Ventura, F.; Reginato, G.; Zani, L.; Mordini, A. Synthesis and spectroscopic characterization of thienopyrazine-based fluorophores for application in luminescent solar concentrators (LSCs). Molecules 2021, 26, 5428. [Google Scholar] [CrossRef]
  24. de Clercq, D.M.; Chan, S.V.; Hardy, J.; Price, M.B.; Davis, N.J.L.K. Reducing reabsorption in luminescent solar concentrators with a self-assembling polymer matrix. J. Lumin. 2021, 236, 118095. [Google Scholar] [CrossRef]
  25. Wojtasik, K. Properties and application of 1H-pyrazolo[3,4-b]quinoxaline derivatives. Przem. Chem. 2018, 97, 1046–1050. [Google Scholar] [CrossRef]
  26. Uchacz, T.; Wojtasik, K.; Szlachcic, P.; Gondek, E.; Pokladko-Kowar, M.; Danel, A.; Stadnicka, K. The photophysical properties of 1H-pyrazolo[3,4-b]quinoxalines derivatives and their possible optoelectronic application. Opt. Mater. 2018, 80, 87–97. [Google Scholar] [CrossRef]
  27. Zoombelt, A.P.; Fonrodona, M.; Wienk, M.M.; Sieval, A.B.; Hummelen, J.C.; Janssen, R.A.J. Photovoltaic performance of an ultrasmall band gap polymer. Org. Lett. 2009, 11, 903–906. [Google Scholar] [CrossRef] [PubMed] [Green Version]
  28. Akel, S.; Sharif, M.A.; Al-Esseili, R.; Al-Wahish, M.A.; Hodali, H.A.; Müller-Buschbaum, P.; Schmidt-Mende, L.; Al-Hussein, M. Photovoltaic cells based on ternary P3HT:PCBM: Ruthenium(II) complex bearing 8-(diphenylphosphino)quinoline active layer. Colloids Surf. A Physicochem. Eng. Asp. 2021, 622, 126685. [Google Scholar] [CrossRef]
  29. Gondek, E.; Danel, A.; Kityk, I.V. 6-N,N-diarylsubstituted 1H-pyrazolo[3,4-b]quinoxalines-novel materials for single-layered photovoltaic devices. J. Mater. Sci. Mater. Electron. 2009, 20, 461–468. [Google Scholar] [CrossRef]
  30. Gondek, E.; Kityk, I.V.; Danel, A. Photovoltaic effect in single layer 1H-pyrazolo[3,4-b]quinoline and 1H-pyrazolo[3,4-b]quioxaline/poly(3-decylthiophene) polymer cells. Z. Naturforsch. Sect. A J. Phys. Sci. 2009, 64, 632–638. [Google Scholar] [CrossRef]
  31. Karasiński, P.; Skolik, M. Sol-gel derived antireflective structures for applications in silicon solar cells. Electron. Technol. Conf. 2016 2016, 10175, 1017517. [Google Scholar] [CrossRef]
  32. Esposito, S. “Traditional” Sol-Gel Chemistry as a Powerful Tool for the Preparation of Supported Metal and Metal Oxide Catalysts. Materials 2019, 12, 668. [Google Scholar] [CrossRef] [Green Version]
  33. Catauro, M.; Ciprioti, S.V. Characterization of Hybrid Materials Prepared by Sol-Gel Method for Biomedical Implementations. A Critical Review. Materials 2021, 14, 1788. [Google Scholar] [CrossRef]
  34. Levy, D.; Zayat, M. The Sol-Gel Handbook; Wiley Blackwell: Hoboken, NJ, USA, 2015. [Google Scholar] [CrossRef]
  35. Reisfeld, R. Luminescent Solar Concentrators and the Ways to Increase Their Efficiencies. In The Sol-Gel Handbook; Wiley Blackwell: Hoboken, NJ, USA, 2015; pp. 1281–1308. [Google Scholar] [CrossRef]
  36. Braun, S.; Rappoport, S.; Zusman, R.; Avnir, D.; Ottolenghi, M. Biochemically active sol-gel glasses: The trapping of enzymes. Mater. Lett. 1990, 10, 1–5. [Google Scholar] [CrossRef]
  37. Zaggout, F.R.; Qaraman, A.E.F.; Aziz, H.A.E. Behavior of α-Naphtholphthalein as analytical pH-Indicator entrapped into sol gel matrix. J. Dispers. Sci. Technol. 2008, 29, 58–62. [Google Scholar] [CrossRef]
  38. Klein, L.; Aparicio, M.; Jitianu, A. Handbook of Sol-Gel Science and Technology—Processing, Characterization and Applications; Springer: New York, NY, USA, 2018. [Google Scholar]
  39. Avnir, D.; Ottolenghi, M.; Braun, S.; Lev, O.; Levy, D. Organically Doped Sol-Gel Porous Glasses: Chemical Sensors, Enzymatic Sensors, Electrooptical Materials, Luminescent Materials and Photochromic Materials. In Sol-Gel Optics; Springer: New York, NY, USA, 1994; pp. 539–582. [Google Scholar] [CrossRef]
  40. Sachs, F.; Becherescu, P. Ueber Ketopyrazolone. II. 1.3-Diphenylpyrazolindion-(4.5). Ber. Dtsch. Chem. Ges. 1903, 36, 1132–1138. [Google Scholar] [CrossRef]
  41. Pettit, G.R.; Piatak, D.M.; Gavrilov, B.G.; Mal, N.A.; Zapiski, U. Hydrogen Bromide-Acetic Acid Demethylation of 2,3-Dimethoxy-6-bromobenzoic Acid. An Example of Concomitant Bromine Migration1,2. J. Org. Chem. 1960, 25, 721–725. [Google Scholar] [CrossRef]
  42. Karasiński, P.; Jaglarz, J.; Reben, M.; Skoczek, E.; Mazur, J. Porous silica xerogel films as antireflective coatings—Fabrication and characterization. Opt. Mater. 2011, 33, 1989–1994. [Google Scholar] [CrossRef]
  43. Avnir, D.; Kaufman, V.R.; Reisfeld, R. Organic fluorescent dyes trapped in silica and silica-titania thin films by the sol-gel method. Photophysical, film and cage properties. J. Non. Cryst. Solids 1985, 74, 395–406. [Google Scholar] [CrossRef]
  44. Dahn, H.; Nussbaum, J. Groupes de départ inhabituels lors de cyclisations dans la série des quinoxalines, II [1]. Helv. Chim. Acta 1969, 52, 1661–1671. [Google Scholar] [CrossRef]
  45. Della Sala, P.; Buccheri, N.; Sanzone, A.; Sassi, M.; Neri, P.; Talotta, C.; Rocco, A.; Pinchetti, V.; Beverina, L.; Brovelli, S. First demonstration of the use of very large Stokes shift cycloparaphenylenes as promising organic luminophores for transparent luminescent solar concentrators. Chem. Commun. 2019, 55, 3160–3163. [Google Scholar] [CrossRef]
  46. Fu, J.; Shang, H.; Li, Z.; Wang, W.; Chen, D. Thermal annealing effects on the stress stability in silicon dioxide films grown by plasma-enhanced chemical vapor deposition. Microsyst. Technol. 2017, 23, 2753–2757. [Google Scholar] [CrossRef]
  47. Ramalla, I.; Gupta, R.K.; Bansal, K. Effect on superhydrophobic surfaces on electrical porcelain insulator, improved technique at polluted areas for longer life and reliability. Int. J. Eng. Technol. 2015, 4, 509. [Google Scholar] [CrossRef] [Green Version]
  48. Martins, O.; Almeida, R.M. Sintering anomaly in silica-titania sol-gel films. J. Sol-Gel Sci. Technol. 2000, 19, 651–655. [Google Scholar] [CrossRef]
  49. Zięba, M.; Wojtasik, K.; Tyszkiewicz, C.; Gondek, E.; Nizioł, J.; Suchanek, K.; Wojtasik, M.; Pakieła, W.; Karasiński, P. High refractive index silica-titania films fabricated via the sol–gel method and dip-coating technique—Physical and chemical characterization. Materials 2021, 14, 7125. [Google Scholar] [CrossRef] [PubMed]
  50. Asthana, Y.; Hong, L.Y.; Kim, D.P.; Lee, T.S.; Sung, Y.M. Formulation of thermally cured organic-inorganic superhydrophilic coating for antifogging optical application. Mol. Cryst. Liq. Cryst. 2007, 463, 117–129. [Google Scholar] [CrossRef]
  51. O’Sullivan, M.; Odewunmi, N.A.; Cullen, M.; Sorour, A.A.; Duffy, B.; Gasem, Z.M.; Oubaha, M. The Role of the Chelating Agent on the Structure and Anticorrosion Performances of an Organosilane—Zirconium Sol-Gel Coatings. Adv. Mater. Phys. Chem. 2018, 8, 89–104. [Google Scholar] [CrossRef] [Green Version]
  52. Kermadi, S.; Agoudjil, N.; Sali, S.; Zougar, L.; Boumaour, M.; Broch, L.; En Naciri, A.; Placido, F. Microstructure and optical dispersion characterization of nanocomposite sol-gel TiO2-SiO2 thin films with different compositions. Spectrochim. Acta Part A Mol. Biomol. Spectrosc. 2015, 145, 145–154. [Google Scholar] [CrossRef] [PubMed]
  53. Aizawa, M.; Nosaka, Y.; Fujii, N. FT-IR liquid attenuated total reflection study of TiO2SiO2 sol-gel reaction. J. Non. Cryst. Solids 1991, 128, 77–85. [Google Scholar] [CrossRef]
  54. Shajari-Ghasemkheili, S.; Sarraf-Mamoory, R. Development of a transparent silica-titania-methyl siliconate nanocoating with photocatalytic-hydrophobic properties aided by response surface method. Mater. Res. Express 2019, 6, 106430. [Google Scholar] [CrossRef]
  55. Karasiński, P.; Domanowska, A.; Gondek, E.; Sikora, A.; Tyszkiewicz, C.; Skolik, M. Homogeneity of sol-gel derived silica-titania waveguide films—Spectroscopic and AFM studies. Opt. Laser Technol. 2020, 121, 105840. [Google Scholar] [CrossRef]
  56. di Nunzio, M.R.; Gutiérrez, M.; Douhal, A. Electronic and Molecular Motions in Silica-Material Hosts. In Chemistry of Silica and Zeolite-Based Materials—Synthesis, Characterization and Applications; Douhal, A., Anpo, M., Eds.; Elsevier Inc.: Amsterdam, The Netherlands, 2019; pp. 273–294. [Google Scholar] [CrossRef]
Figure 1. Reactions in synthesis of PQX-OH.
Crystals 12 00478 g001
Figure 2. Diagram of the procedure for the production of thin layers from the reference silica sol (a) and silica sol doped with PQXOH (b).
Crystals 12 00478 g002
Figure 3. Normalized absorption and photoluminescence of PQXOH solution in MCHX solution.
Crystals 12 00478 g003
Figure 4. Hydrodynamic diameters of particles in SiO2 sol (sol A) and SiO2 + PQXOH sol (sol B); size distribution by intensity (a), and size distribution by volume (b).
Crystals 12 00478 g004
Figure 5. FTIR spectrum for powder SiO2 with PQXOH in the range 400–4000 cm−1.
Crystals 12 00478 g005
Figure 6. Technological characteristics of the produced films of silica (SiO2) and silica with PQXOH dye (SiO2 + PQXOH) on soda-lime glass substrates. All layers were annealed at the temperature of 200 °C for 1 h.
Crystals 12 00478 g006
Figure 7. Change in the thickness and refractive index of the silica films and PQXOH doped silica films depending on the annealing temperature of the produced layers on soda-lime glass substrates (130, 200, 300, 400 °C). The solid lines were drawn to guide the eye.
Crystals 12 00478 g007
Figure 8. Transmission and reflection characteristics of the silica film and the silica film impregnated with PQXOH dye.
Crystals 12 00478 g008
Figure 9. PQXOH photoluminescence in a solution of MCHX (black line), THF (green line), ACN (blue line), and SiO2 + PQXOH film (red line) (a), and the image of substrates with a layer of SiO2, respectively, 2d = 2350 nm (left) and SiO2 + PQXOH, 2d = 2780 nm (right), illuminated by a lamp λ = 365 nm (b).
Crystals 12 00478 g009
Figure 10. AFM surface topography images of the SiO2 thin film deposited at 200 °C (a) and profiles in two cross-sections (b).
Crystals 12 00478 g010
Figure 11. AFM surface topography images of the SiO2 + PQXOH thin film deposited at 200 °C (a) and profiles in two cross-sections (b).
Crystals 12 00478 g011
Table 1. Molar ratio of the components of the SiO2 sol.
SolTEOSEtOHHClH2OTriton X-100PQXOH
A13.890.022.440.22-
B13.890.022.440.220.17%
Table 2. Position of the absorption and emission of the tested PQXOH in various solvents.
CompoundSolventλAbs (nm)λPL (nm)
ex = 365 nm)
SS [nm (eV)]
PQXOHMCHX45853476 (0.39)
THF455570115 (0.55)
CAN455586131 (0.61)
Publisher’s Note: MDPI stays neutral with regard to jurisdictional claims in published maps and institutional affiliations.

