Abstract
The increasing use of nonlinear loads in the power grid introduces some unwanted effects, such as harmonic and interharmonic contamination. Since the existence of spectral contamination causes waveform distortion that may be harmful to the loads that are connected to the grid, it is important to identify the frequency components that are related to specific loads in order to determine how relevant their contribution is to the waveform distortion levels. Due to the diversity of frequency components that are merged in an electrical signal, it is a challenging task to discriminate the relevant frequencies from those that are not. Therefore, it is necessary to develop techniques that allow performing this selection in an efficient way. This paper proposes the use of spectral kurtosis for the identification of stationary frequency components in electrical signals along the day in a sustainable building. Then, the behavior of the identified frequencies is analyzed to determine which of the loads connected to the grid are introducing them. Experimentation is performed in a sustainable building where, besides the loads associated with the normal operation of the building, there are several power electronics equipment that is used for the electric generation process from renewable sources. Results prove that using the proposed methodology it is possible to detect the behavior of specific loads, such as office equipment and air conditioning.
1. Introduction
In a world that needs to evolve towards energy sustainability, smart buildings that are energy efficient are a necessity. These buildings are characterized by energy flexibility, renewable energy production and user interaction [1], and must be designed for near-zero energy, which is accomplished by managing renewable energy sources, advanced monitoring and control systems, energy storage and demand flexibility. Climate and user responses along with monitoring and supervision are some of the basic functions of smart buildings [1], which adapt to climatic conditions to minimize energy demand and generate energy to supply their energy consumption [2], and monitoring and supervision are necessary to control loads and set comfort settings [3]. However, to achieve the aim of adequate energy efficiency it is necessary to use modern lighting systems (LED and compact fluorescent lamps) [4,5], as well as numerous types of non-linear loads or DC appliances that need individual rectifiers to facilitate the connection of the equipment to the AC grid [6], and of course, to integrate the use of renewable energies, especially photovoltaic technology.
However, despite the advantages that the introduction of these elements brings when it comes to achieving a smart building, power quality (PQ) problems can arise in the electrical networks of these buildings that generate distortions, overloads, unbalances and voltage fluctuations [7,8,9,10,11,12,13] Within these PQ problems, the generation of harmonics and interharmonics are a particularly important concern in the electrical grid, as they arise precisely due to the operation of interconnected electricity producers (cogeneration, photovoltaics, etc.) [14] and the use of converters based on power electronics as an interface between distributed generation and the electricity grid [15], as well as the numerous non-linear loads existing in this type of buildings, thus causing energy losses, reduction of the life cycle and malfunctioning of equipment and installations. For this reason, research into power quality has increased a lot in recent times, especially in its detection, and since a disturbance can appear in the power grid at any time, it is important to develop techniques that allow continuous monitoring of electrical signals to determine the existence of anomalous behavior. In this sense, techniques that focus on the detection of PQ disturbances can be classified into two sets: transform-based (non-parametric) methodologies and model-based (parametric) methodologies [16], with the first group being the most observed in recent literature. Among all the non-parametric methodologies, the fast Fourier transform (FFT) is yet the most used technique when it is necessary to carry out an analysis in the frequency domain [17]. Notwithstanding, the FFT presents some drawbacks: it can only be used when the signal to analyze is stationary, and the spectral leakage that appears when a frequency component is not an integer multiple of the resolution of the transform. Thus, several techniques have been proposed for dealing with the issues related to the use of the FFT. Most of these alternative techniques extend their analysis to the time-frequency domain allowing studying both stationary and transient disturbances. Examples of these techniques are the short-time Fourier transform (STFT), wavelet transform (WT), S-transform (ST), Hilbert–Huang transform (HHT), empirical mode decomposition (EMD), multiple signal classification (MUSIC), among others [12,18,19]. Although these techniques deal with some of the concerns regarding FFT, they present other non-desired effects as mode mixing and high computational effort.
On the other hand, the parametric approaches aim to develop an accurate mathematical model that describes the behavior of any PQ disturbance [20,21]. These methods require an a priori knowledge of the parameters that describe the disturbance (severity, duration, spectral content, among others); however, they do not provide information regarding how these parameters are obtained. Thus, the use of methodologies that involve time and frequency domain high order statistic (HOS) have gained popularity, not only for parameter identification but also for working along with artificial intelligence tools, such as artificial neural networks (ANN) and support vector machines (SVM) to detect and classify a large set of PQ disturbances [22]. Within parametric approaches and given that spectral contamination with harmonics and interharmonics is probably the most common issue related to the existence of non-linear loads and distributed generation, the use of frequency-domain features, such as spectral kurtosis (SK), has gained popularity. Recently, the SK has been widely explored to perform a feature extraction that provides information about the existence of specific spectral components in electric signals [23,24]. The effectiveness of the spectral kurtosis relies on the fact that it is insensitive to Gaussian noise, and the computational burden and execution time associated with this feature are low. The works reported so far, using SK [25,26] or other techniques [27], have been demonstrated to be effective for detecting the presence of harmonics and interharmonics with a constant amplitude trend, even when their energy is low. However, they do not provide a time tracking of the detected spectral components to see their behavior along the day. The presence of non-linear loads is inherent in every smart building, not only for the existence of office or residential equipment but also for the use of self-generation systems mainly based on renewable energies. Therefore, smart buildings are likely to experience high levels of spectral distortion due to the large number of non-linear loads they have to handle. In this sense, it is important to develop techniques that allow performing a complete detection, quantification, and tracking of the most significant spectral components in the grid to determine how they evolve and be able to take actions when required to guarantee a proper quality for the final users.
The contribution of this work is developed in this line, introducing a methodology for the detection and quantification of stationary frequency components (harmonics and interharmonics) in the electrical signals of a smart building, and fusing the SK with the FFT. The use of the proposed methodology presents some advantages against the conventional approaches, for instance, the ease of its implementation since the mathematics behind this methodology are simple. This situation results in a technique that is efficient and demands a low computational burden. Moreover, it is possible to perform a time tracking of a specific stationary frequency component (SFC) without problems, such as the mode mixing introduced by time-frequency transforms, such as WT and EMD, this way it is possible to perform a quantification of how every SFC contributes to detriment the quality of the power grid. Finally, it is important to mention that, although SK is a widely explored technique, its use is more extended in the identification of transient events. Additionally, the combination of SK and FFT represents a novel solution for the time tracking and quantification of SFC. The proposed methodology aims to be a helpful tool to perform an estimation of the types of loads that appear in the grid and how they impact the quality of the supply. This way it is possible to propose actions in order to mitigate the undesired effects associated with a specific type of load. To validate this methodology, measurements have been carried out in a smart building located in the northeast of Spain, using two weeks of data from two different years. Since the proposed methodology performs a time tracking of the harmonics and interharmonics in the electric signals, it can be used as a tool for monitoring the levels of distortion associated with any frequency component along the day. This is helpful to determine when the distortion levels are beyond the admissible levels and take corrective actions when required. Moreover, with the proposed methodology, it is possible to perform an analysis of the power consumption habits that are presented in the building and how they influence the PQ of the building.
2. LUCIA Nearly Zero Energy Building
The building under analysis is named LUCIA (Lanzadera Universitaria de Centros de Investigación Aplicada, in Spanish for University Shuttle of Applied Research Centers) [28]. Founded in 2015 by the University of Valladolid, Spain, with the purpose of working as an applied research building that incorporates scientific centers from different disciplines and applied research laboratories through the creation of spin-off companies from enterprises with a technological base. The building presents a flexible distribution that allows several simultaneous uses to meet a changing demand from the users.
LUCIA is a Nearly Zero Energy Building (NZEB) and a ZERO CO2 building that has obtained some certifications that endorse it as the most sustainable building in Europe and in the entire northern hemisphere, and it is also ranked second in the same category all over the world. It is the second building in the world with the best score in the LEED certification (the first in the northern hemisphere), and it has the LEED Platinum certificate with 98 points. LEED is a worldwide voluntary certification system for sustainable buildings; it was developed by the U.S. Green Building Council and it is the certification in matter of sustainable buildings with the highest global recognition [29]. Additionally, the LUCIA building holds the highest rating (5 leaves) in the VERDE certification, a voluntary national certification that evaluates the reduction of the environmental impacts regarding the building under test, compared with those associated with another hypothetical building that is limited to meet the requirements specified by the local regulations [30]. Moreover, the LUCIA building has been awarded and recognized in different competitions and forums for the sustainable solutions that have been implemented in it. This building has been designed as a base for investigating the social aspects of sustainable buildings; it is a prototype for verifying the hypothesis that sustains the methods for environmental evaluation and one of its main tasks is the investigation on topics that have not been parameterized so far by using only renewable energies.
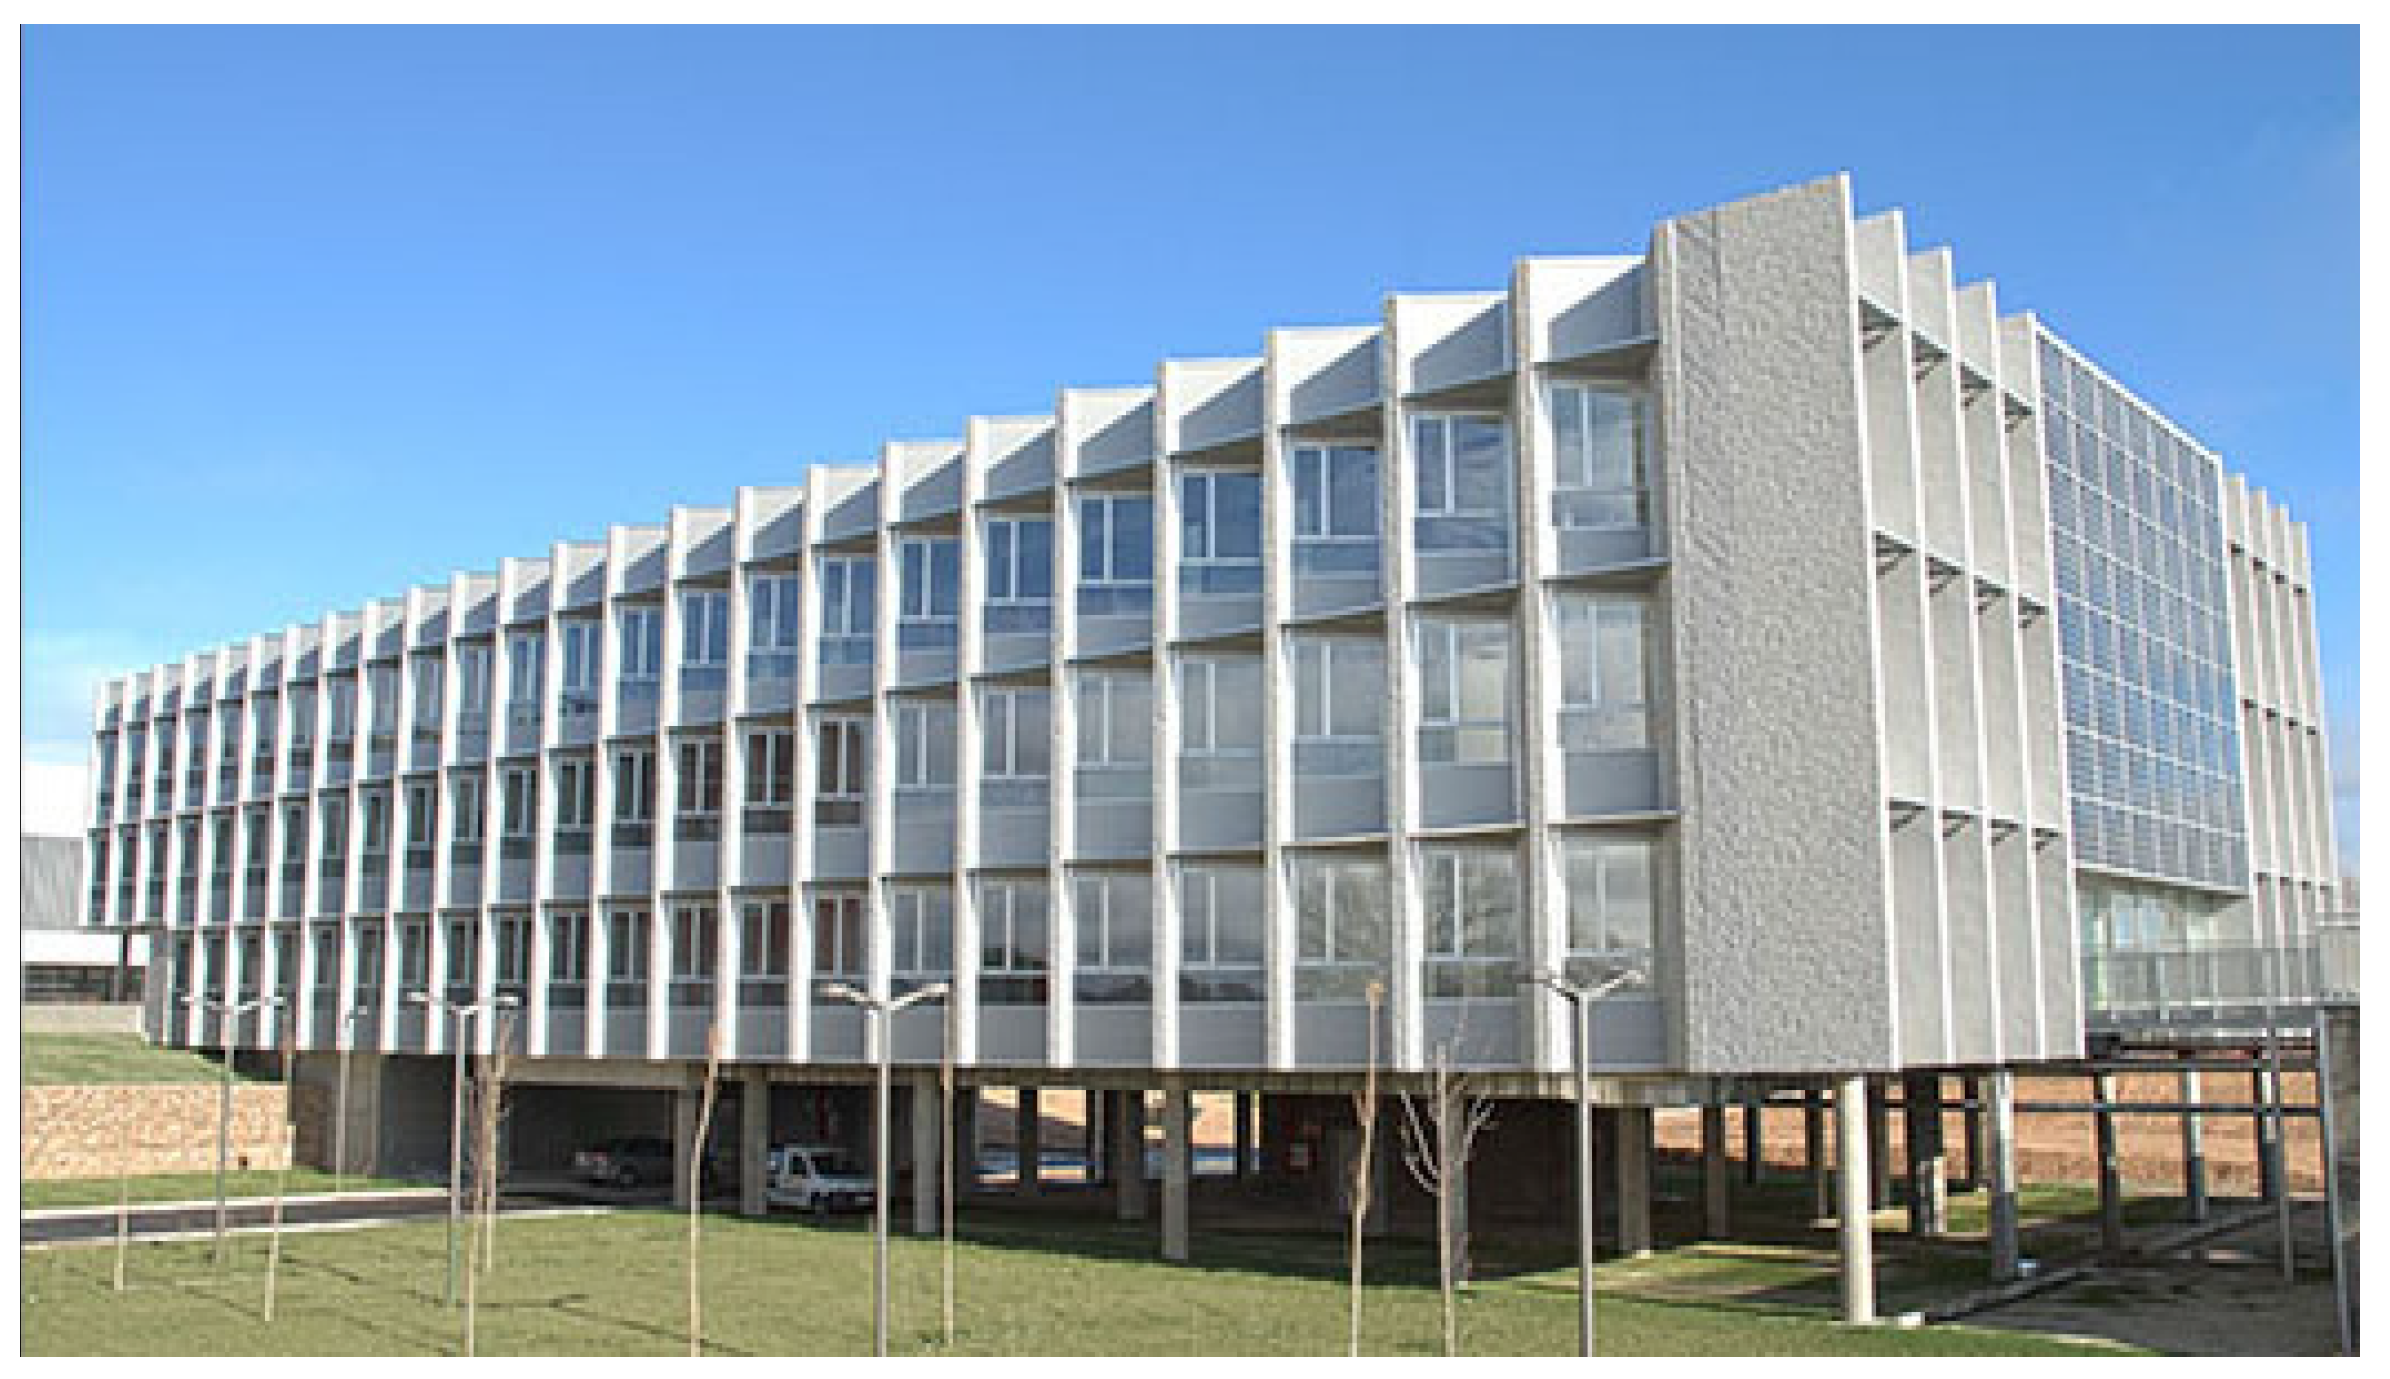
The building has an area of 7500 m2, distributed over 4 floors: three of them are located above the ground level and the fourth consists of a basement with a fully open parking space with natural lighting and ventilation (see Figure 1).
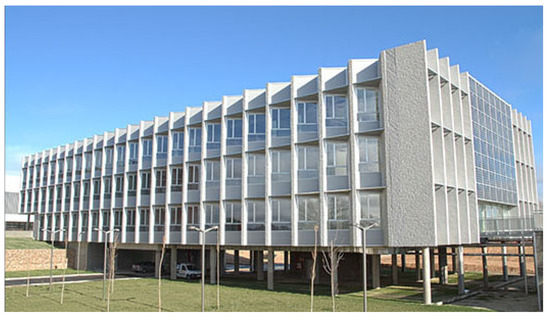
Figure 1.
General view of the LUCIA building.
With the aim of minimizing the water and energy consumption, as well as the environmental impact, a series of systems and strategies have been implemented in the building to incorporate renewable energies in order to satisfy the requirements of air conditioning, heating and all the electrical services and lighting. These strategies can be categorized into two groups: active and passive strategies. The passive strategies are related to the building design, such as quality thermal isolation, sunlight control through skylights, a geothermal energy system for ventilation among others. In the case of the active strategies, they are described in more detail below since their importance is bigger due to the purpose of the present work:
- (a)
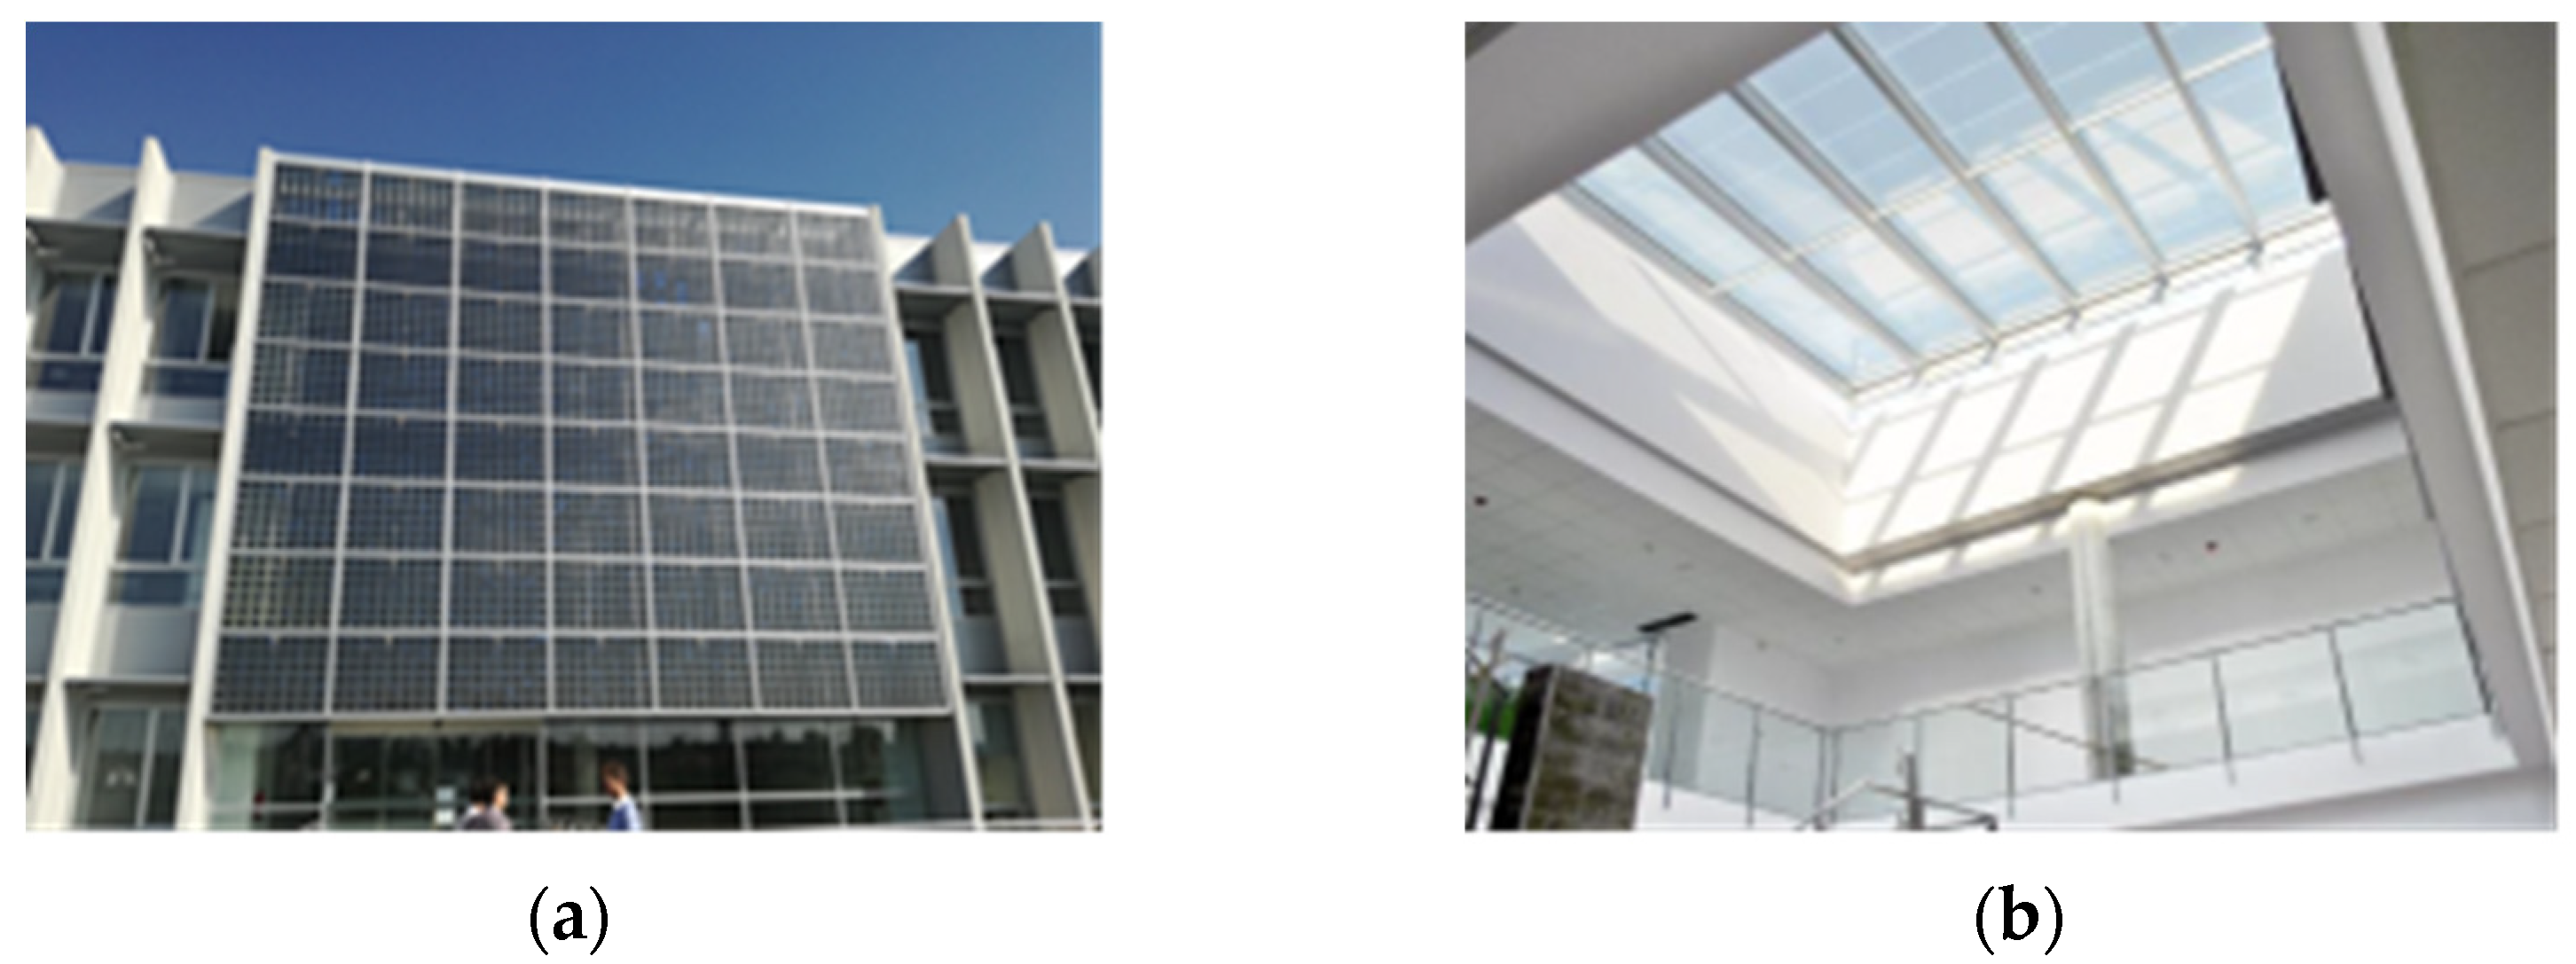
- Solar photovoltaic energy: A part of the electric energy consumption is covered by two photovoltaic generation systems that are installed in the building. One of them is compounded by several photovoltaic modules that are located on the outer face of the double curtain wall in the central area of the southeast side of the building (Figure 2a). This first system (herein called the south system) delivers a rated power of 10 kW. The second system consists of photovoltaic glasses incorporated in two skylights (Figure 2b) above each one of the stairwells in the two communication blocks of the building; therefore, this system fulfills a double function: it provides natural lighting as a part of the roof structure, and it also produces energy delivering a rated power of about 5 kW.
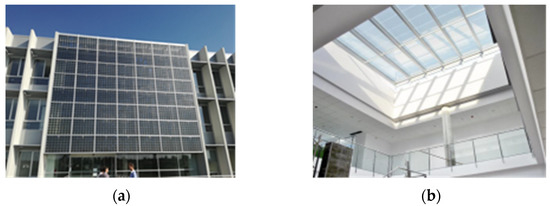 Figure 2. View of the photovoltaic installations (a) south system; and (b) skylight.
- (b)
- Trigeneration system: There is a biomass cogeneration installation with a nominal power of 100 kWe and about 180 kWt. It is a gasifier that transforms biomass and wood chips, into syngas that feeds some internal combustion engines. The thermal use of the system, when there is a demand for cooling, is completed with the installation of an absorption chiller that allows the air conditioning installation to provide cold.
- (c)
- Installation of air conditioning and ventilation: it is a mixed air-water system with four-pipe fan coils as terminal units that allow to provide heating and cooling simultaneously in different parts of the building. The air is treated in the primary air conditioning system, equipped with a high-efficiency adiabatic heat recovery unit before it is delivered to the different locations inside the building through the fan coils.
- (d)
- Both, the motors of the pumps from the hydraulic circuits and the motors from the fans of the air conditioner, are connected to variable frequency drives (VFD) that allow achieving the maximum efficiency by adjusting the operating conditions to the instantaneous needs. This way, only the required water flow is handled.
- (e)
- Intelligent building management through a supervision, control and monitoring system of the facilities that allow configuring the different elements of the air conditioning and lighting systems for an efficient operation.
- For lighting control, there are light intensity sensors that regulate and adjust the luminosity of the lamps in the workspaces when they need to be turned on. In the common areas, there are also presence detectors to limit the lamp activation to the necessary moments and when the levels of natural lighting are not sufficient.
- For air conditioning, there are thermostats in each space that allow to independently regulate and control the contribution of heath or cold in each room.
- The building is fully monitored in terms of thermal and electrical parameters; it counts with 97 grid analyzers that allow knowing the consumption of each workspace in the facility as well as the energy that is being produced by generation systems located in the building. It also integrates seven thermal energy meters at different locations within the air conditioning installation; temperature sensors in offices, laboratories and common spaces and even a weather station on the roof of the building to know different environmental and meteorological parameters.
Additionally, it must be mentioned that the LUCIA building incorporates its own electrical substation to manage the building energy consumption. This substation uses an 800 kVA dry-type transformer from Merlin Gerin. The main specifications of the substation are presented in Table 1.

Table 1.
Specifications for the substation in the LUCIA building.
Although all the aforementioned technology allows the building to generate its own energy and ensures more efficient performance of the overall tasks that must be carried out, the use of cogeneration with renewable energies, such as solar photovoltaic and biomass, along with the intelligent systems for the building management, introduces some challenges for the power grid. Since all these systems require nonlinear elements for proper functioning, a considerable number of spectral components (harmonics and interharmonics) are introduced to the power grid. Therefore, it is important to perform a continuous tracking of these components in order to guarantee that the power quality of the grid remains at acceptable levels that allow the proper operation of the numerous sensitive equipment operating in the technology laboratories that make up this building. Moreover, since the building possesses its own substation, a degradation in the power quality of the grid must be associated only with loads and processes that are performed inside the building, because the transformer acts as a filter for all the disturbances that may come from the outside.
3. Methodology
This paper presents a methodology for the detection and quantification of stationary frequency components (harmonics and interharmonics) in the electrical signals of a smart building, fusing SK with FFT, and the assessment of their impact on the electrical network of a building.
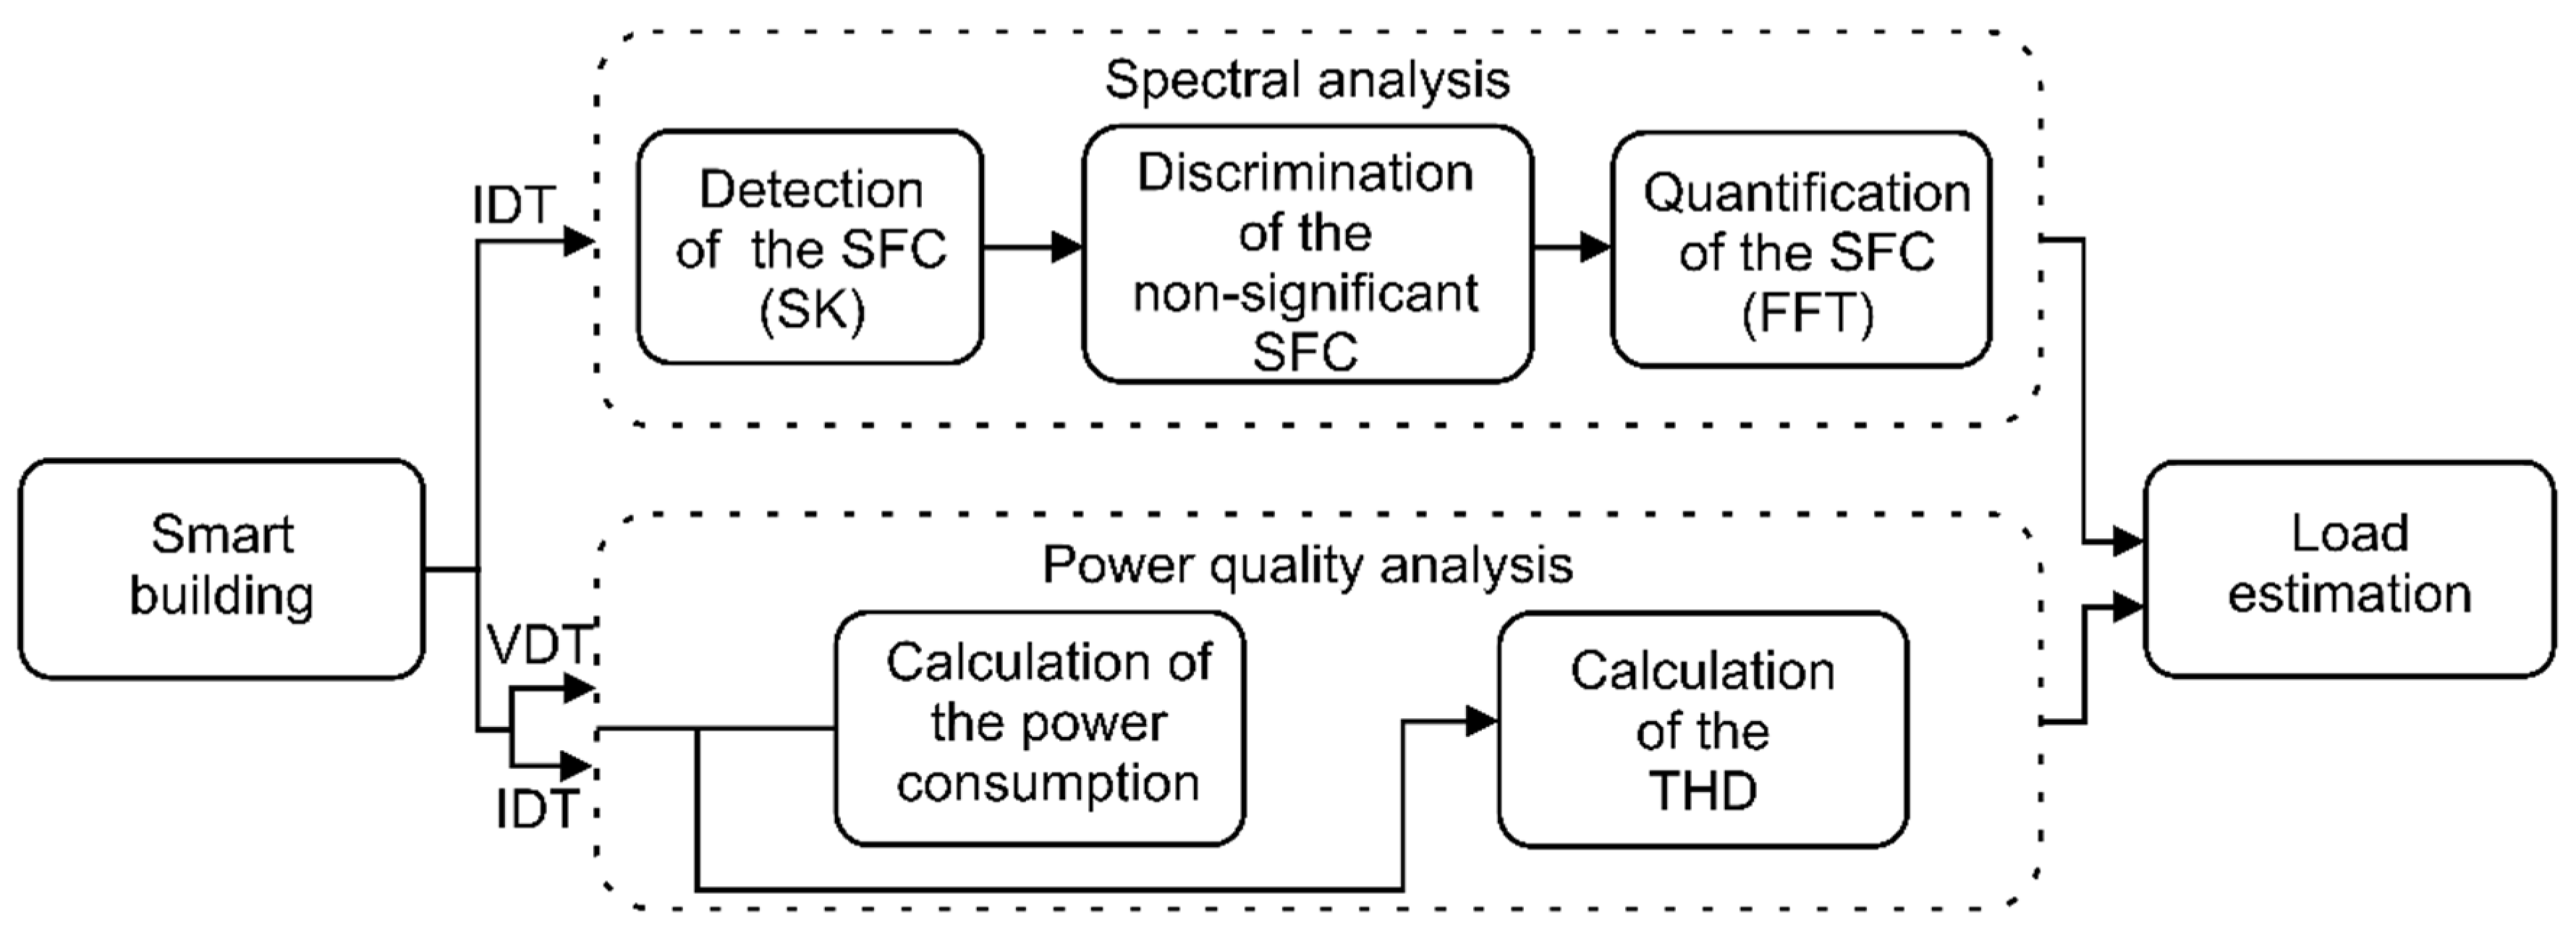
Figure 3 shows a general block diagram of the proposed methodology that is intended to develop two main tasks:

Figure 3.
Description of the proposed methodology.
- A spectral analysis, which is in charge of the identification and quantification of stationary frequency components (SFC) in electrical signals and will, in turn, be performed in three stages. First, the SK is used for the detection of SFC in current signals in order to identify specific frequency components that are related to consumption habits in the building. Then, since there are frequency components that are irrelevant to the study, discrimination of non-significant SFC is performed based on characteristics, such as amplitude variability throughout the day, and persistence during working hours. Finally, FFT is performed on the current signal to quantify the SFC detected by the SK.
- A PQ analysis, which aims to assess the impact of SFCs on the smart building network. A PQ analysis is performed with the current and voltage signals to calculate the power consumption and THD associated with the loads inside the building.
These two analyses are designed to provide a reliable estimate of the nature of the loads introducing pollution into the network to assist network maintainers. The voltage and current signals from the smart building are measured at the low voltage panel and are used in both the spectral analysis and the PQ analysis.
In a first step, the SK assesses all the spectral components that appear in the electric signals and separate the stationary components from those that sporadically appear. Then the FFT is computed to measure the energy of the frequency components that are selected by the SK. Additionally, a general PQ analysis is performed to complement the evaluation of the smart building. Finally, results are analyzed to determine the impact of harmonics, inter-harmonics, and PQ in the electric grid of the smart building. This process is iteratively carried out to obtain a timestamp of the daily behavior of the stationary frequency components (SFC) that are present in the electric signals.
3.1. Spectral Analysis
As indicated above, the main task of the spectral analysis consists of the detection and quantification of the SFCs appearing in the current signals of the building, considering the fusion of two different techniques: SK and FFT. This analysis has been set up in three phases.
3.1.1. Detection of the SFC
The first step in the spectral analysis consists of the detection of the SFC and the SK is the technique that allows achieving this goal. SK is a technique that uses statistical tools for identifying spectral components that may be transient or stationary. These last are those that concern this work. To perform the computation of the SK the Welch estimation is used according to (1):
where is the frequency domain series that contain the SK values; and are the spectra of the fourth and the second order moment of the signal, respectively, and they are obtained as described by (2) and (3):
where is the expected value of time-series from the signal spectrum .
Although the estimation of the SK presented in (1) is mainly used for the identification and characterization of non-stationary series [31], it can also be suitable for the identification of stationary components since it considers the presence of both: Gaussian and non-Gaussian components in a signal. The parameters for computing the algorithm are selected as follows: 8192 samples for computing FFT with an overlap of 3072 points. Additionally, a Hann window of 4082 points is used to reduce the spectral leakage. The obtained spectra are averaged every 10 min and the fourth and the second moment of the signal are computed over these averaged values. The resulting values are substituted in (1) and a total of 144 values are obtained to represent the behavior of everyday analysis. It is important to mention, that the average spectrum is stored to be used later to obtain the energy of the identified stationary components.
As aforementioned, SK is a powerful tool for detecting non-stationary and stationary frequency components as well. This detection is characterized by positive values for non-stationary frequencies and negative values for stationary frequencies, the rest of spectral components, such as Gaussian noise, present a zero (or close to zero) value. Thus, to start with the identification task, all the frequency components with an SK value lower than −0.89 are isolated and considered as preliminary results. This process is carried out on the 144 SK values obtained for each day of analysis.
3.1.2. Discrimination of the Non-Significant SFC
Since the purpose of this work is to identify those frequencies that show a consistent amplitude behavior along the day, it is important to track those frequencies that repeatedly appear as stationary in the SK computation. Moreover, it is desirable to identify the frequency components that can be related to the building occupation during working hours. In order to separate the SFC that significantly contributes to the harmonic and interharmonic contamination of the grid, a discrimination of the non-significant SFC is conducted. Therefore, the frequencies that are present in at least 8 h of the day (i.e., frequencies that appear in 48 of the SK computation), are selected. The rest of the frequency components are discarded because they appear just for short time periods during the day. Furthermore, in this analysis, it is expected that frequencies, such as the fundamental frequency and some of its harmonics appear as stationary frequencies.
Even though a Hann window is applied to reduce the spectral leakage related to the calculation of the FFT, this effect can still be present in the results and it may lead to a misinterpretation of the stationary frequencies. Thus, the tracking of the stationary frequencies is performed searching for frequency values within a threshold instead of looking for a specific frequency. All the frequencies within the threshold are considered to be the same and they are addressed with the central value of the threshold.
3.1.3. Quantification of the SFC
For the quantification of the SFC, the spectrum calculated for the SK values is used. However, only the energy of those frequencies selected in the previous stage is considered. The energy of each frequency is stored to visualize its behavior and trend amplitude during each day. Furthermore, the quantification presents a form to visualize the results of the identification of the SFC in graphs showing amplitude variability along each day.
3.2. Power Quality Analysis
To complement the results delivered by the SK-FFT methodology and to make an overview of the occupation patterns in the sustainable building, a PQ analysis is performed. Since the main purpose of this work is related to the existence of frequency components different than the fundamental one, harmonic analysis is performed using the THD as the parameter to measure the levels of distortion during the days of analysis. The THD is calculated according to the standard IEEE 1159-2019 [32] using (4):
where THD represents the total harmonic distortion as a percentage of the energy of the fundamental frequency component; represents the electric magnitude under analysis (voltage or current signal); is the energy of the fundamental frequency component, and; is the energy of the i-th harmonic. The THD index is obtained for the current and for the voltage signals. The THD is obtained for time windows of 200 ms and then the average per minute is calculated and reported.
Additionally, the power consumption related to the building is calculated to show the difference in the occupation level for the two years of analysis. This way it is also possible to determine how the increase of the loads attached to the grid influence the quality of the power supply. In this work, the instantaneous power is computed as the product of the instantaneous values of the voltage and current signals as presented in (5):
where is the instantaneous apparent power as a time function; and are the instantaneous value of the voltage and current signals, respectively. Since the data acquisition systems work at a sampling rate of 8000 Hz, a total of 8000 values per second are computed for the apparent power. However, the obtained power values are separated into one-minute windows and the average per minute is delivered as result. Additionally, to obtain a more reliable analysis of the power that is effectively used in the building, the active power is obtained considering (6):
where: is the active power and is the time interval over the active power computation is carried out. In order to keep the consistency of the data, is also selected as 1 min. Since the calculation of the active power is performed over discrete signals, the discretization of (6) presented in (7) is used:
where is the number of samples and and are the n-th samples of the voltage and current signals, respectively. Finally, the reactive power is calculated using (8) to provide an overview of the energy that is not effectively used in the building.
The 1-min window used in the power consumption computation is selected so there exists consistency between the values for the THD and the power consumption. THD and power provide information about the change in the consumption habits in the building and determine the existence of an increment in the PQ contamination, and distortion levels between the days and years analyzed. This information gives a general picture of the status of the building each year, but it does not provide specific information, such as which harmonics or interharmonics are stationary or how they behave along the day. Then, the cooperation between the SK-FFT methodology for the identification of stationary frequencies and the PQ analysis delivers a more complete study of the building consumption along the time.
4. Experimental Setup
4.1. Description of the Data Acquisition System
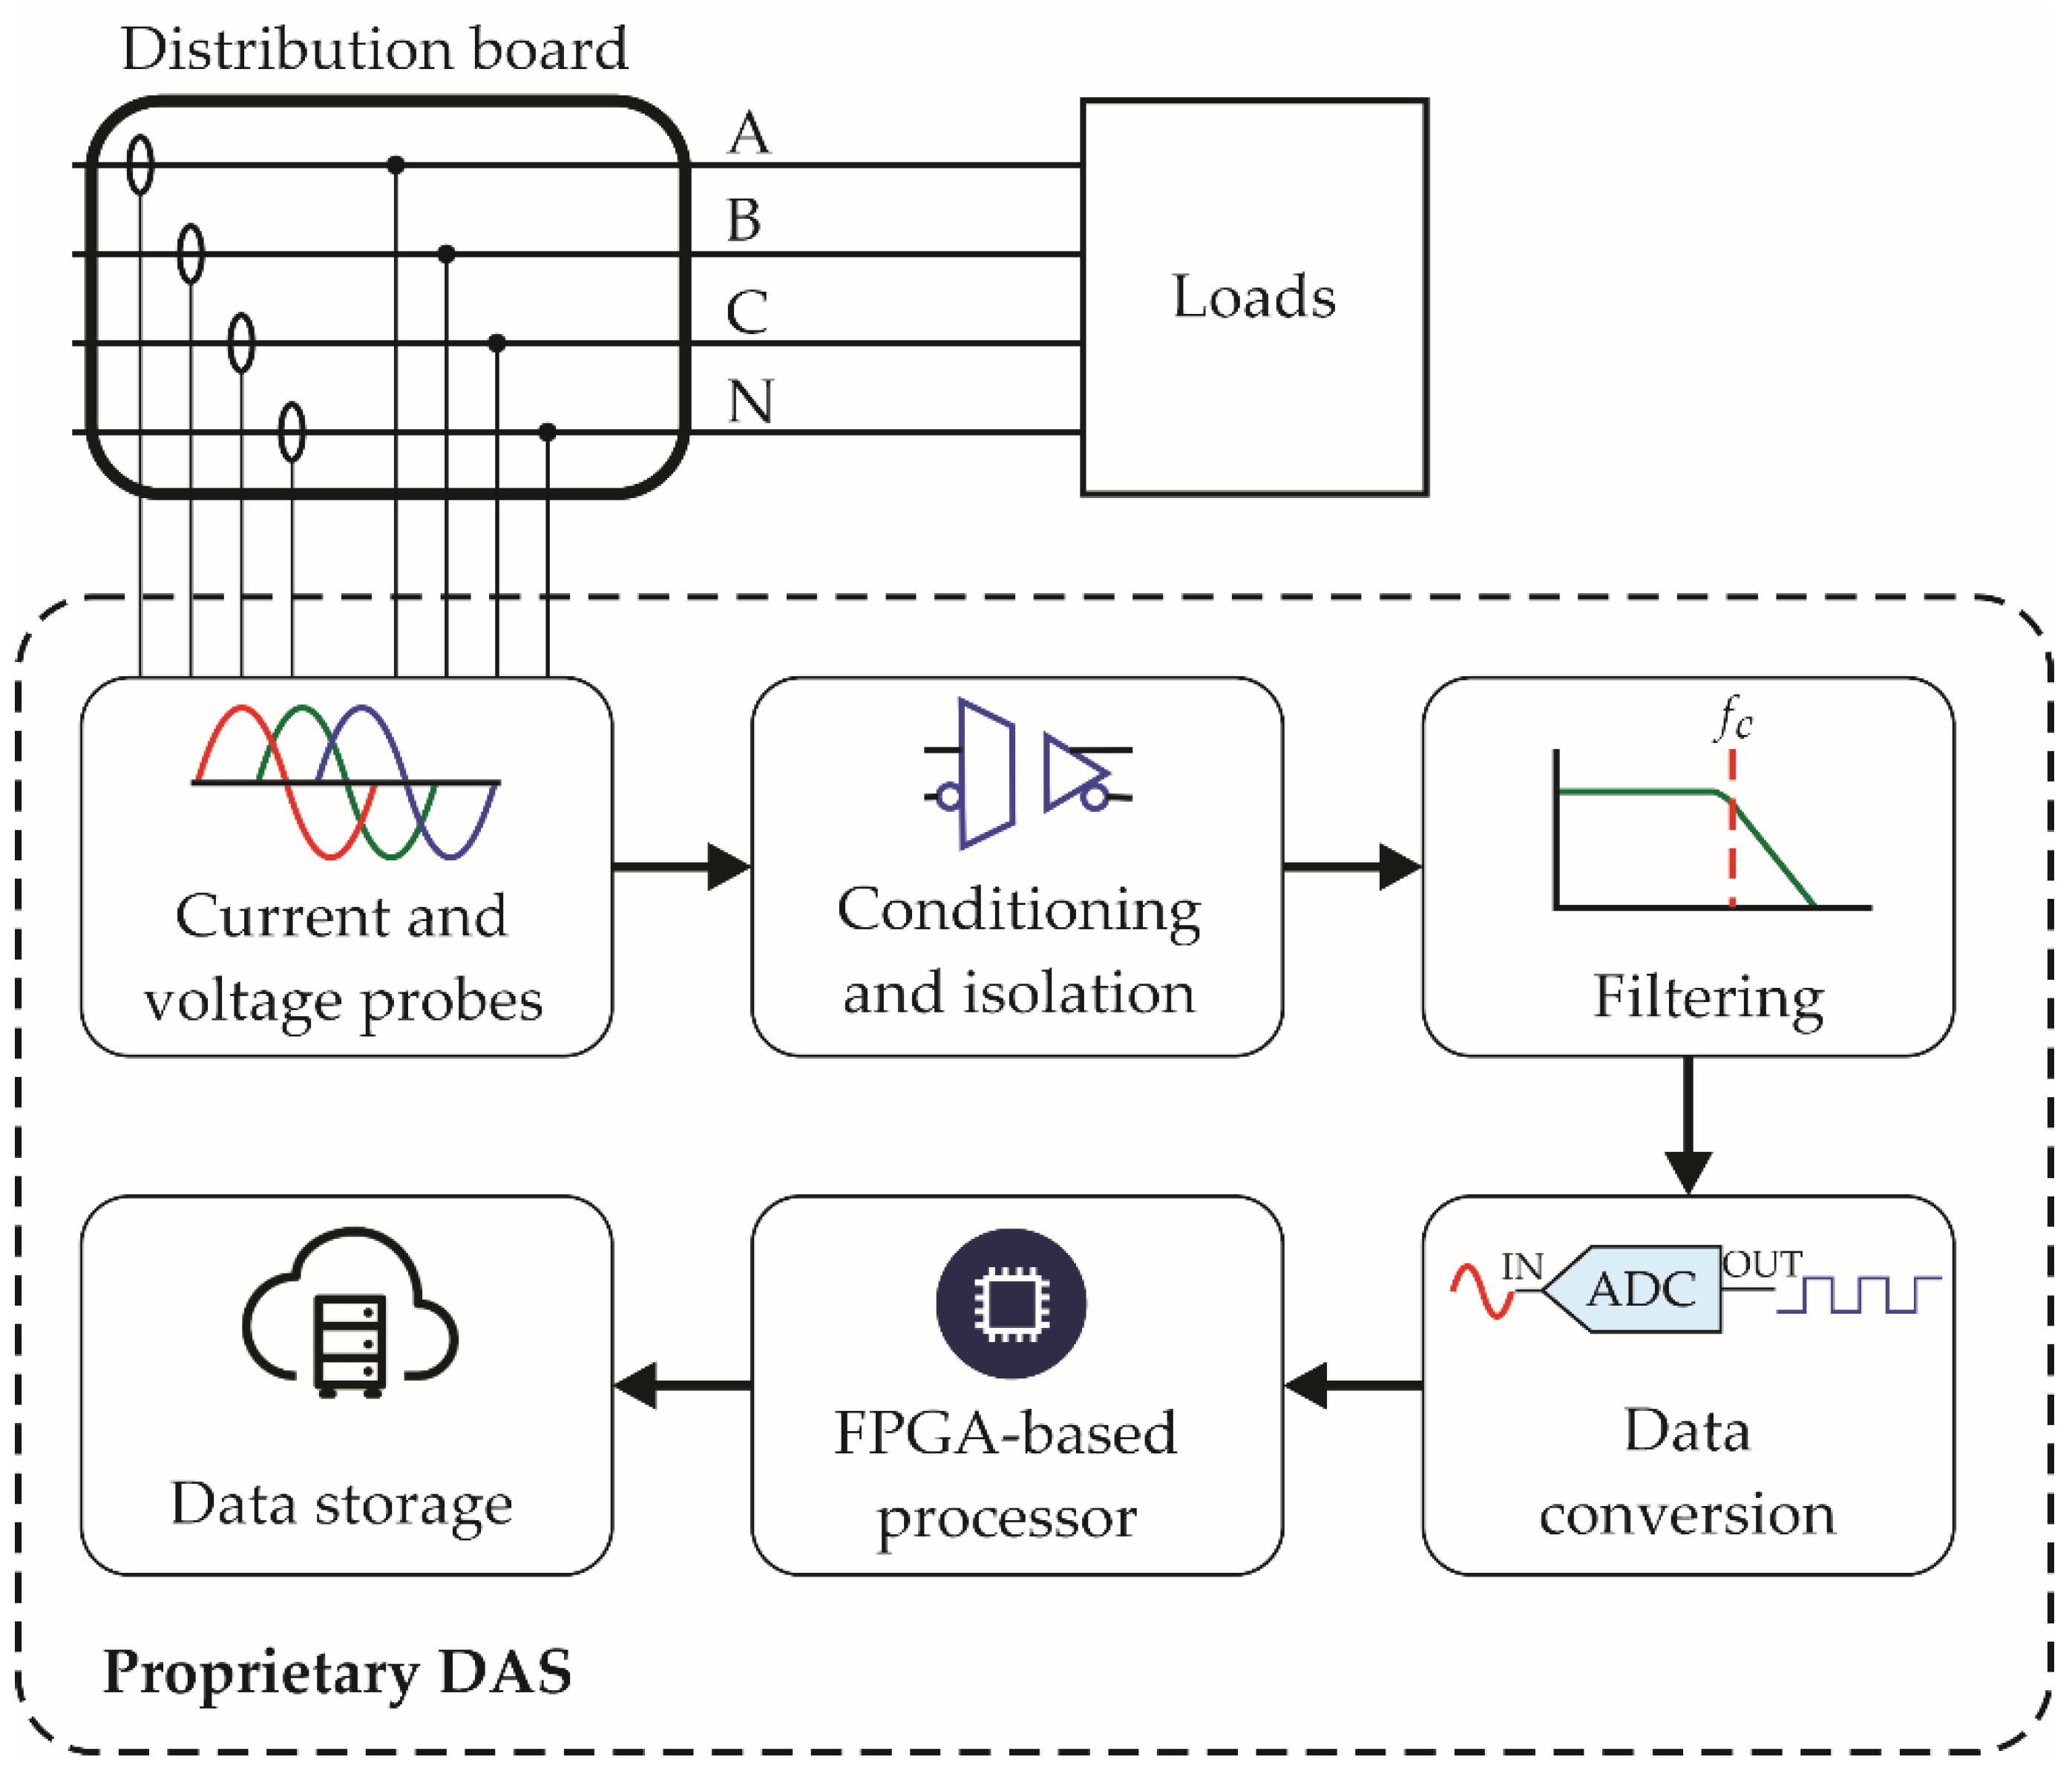
Experimentation is performed in the facilities of the LUCIA building. Here, the consumptions of the complete building are measured at the low voltage distribution panel using a proprietary data acquisition system (DAS). The DAS uses a Field Programmable Gate Array (FPGA) device as the main processor and it is able to acquire signals from seven simultaneous channels (three for voltage signals and four for current signals) with a 16-bit resolution and at a sampling frequency of 8000 Hz. The data acquisition is carried out following a series of steps as depicted in Figure 4. In the first stage, the current and voltage from the probes are received by the DAS. Then, the signals are carried through a conditioning and isolation process. The conditioning mainly consists of an impedance coupling; therefore, a resistive element of 10 kΩ is selected to work along with the inductive elements associated with current probes, whereas a 250 kΩ resistive element is incorporated for the voltage probes. It must be mentioned that the values of the voltage and current signals must remain within ±2 VDC. In order to avoid security risks, the physical ground must be decoupled; thus, an isolation amplifier is used to accomplish this purpose. Additionally, the same amplifier allows obtaining a differential amplification with a gain of 8. Next and with the aim of avoiding signal aliasing, a filtering stage is performed. Here, a passive low-pass filter with a cutoff frequency of 3.2 kHz is implemented. At this point, the signals have been properly conditioned so they can be used in the data conversion process. To perform this conversion, an 8-channel analog to digital converter (ADC) is used. The selected ADC includes a programmable gain amplifier (PGA) and an electromagnetic interference (EMI) filter specially designed for PQ applications. The responsible for the configuration and the proper operation of the ADC is an FPGA-based processor. This processor is also in charge of establishing the sampling frequency, that in this particular case is selected to be 8000 Hz. Finally, the data storage is performed using an external micro SD module that allows easily changing the memory card once it is full. The DAS incorporates Bluetooth communication; thus, a personal tablet can be used as a user interface (see Figure 5a). Voltage signals are directly measured with cables from the secondary of the power transformer in the low voltage panel of the building whereas the current measurements are performed using the SCT-013-010 sensors by YHDC (see Figure 5b) installed in the secondary winding of measurement current transformers. The data are collected for two years with different consumptions. During the first year, the building works at about 50% of its capacity, whereas in the second year the installation operates at 100% of its capacity. One week of each year is selected for applying the proposed methodology to determine the existence of spectral components that constantly appear in the power grid and that may be related to the building operation. Additionally, a power quality analysis is performed on the voltage and current signals for the two weeks to determine how the SFC identified by the methodology impacts the grid.
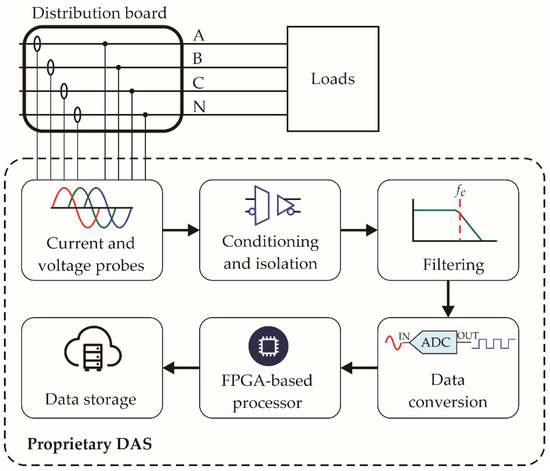
Figure 4.
Functional diagram for the DAS.
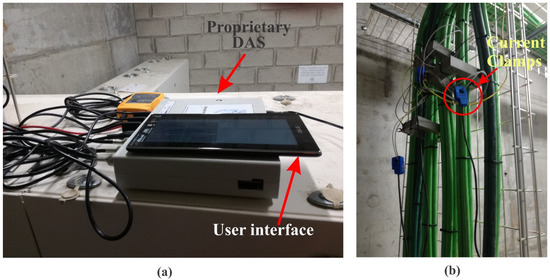
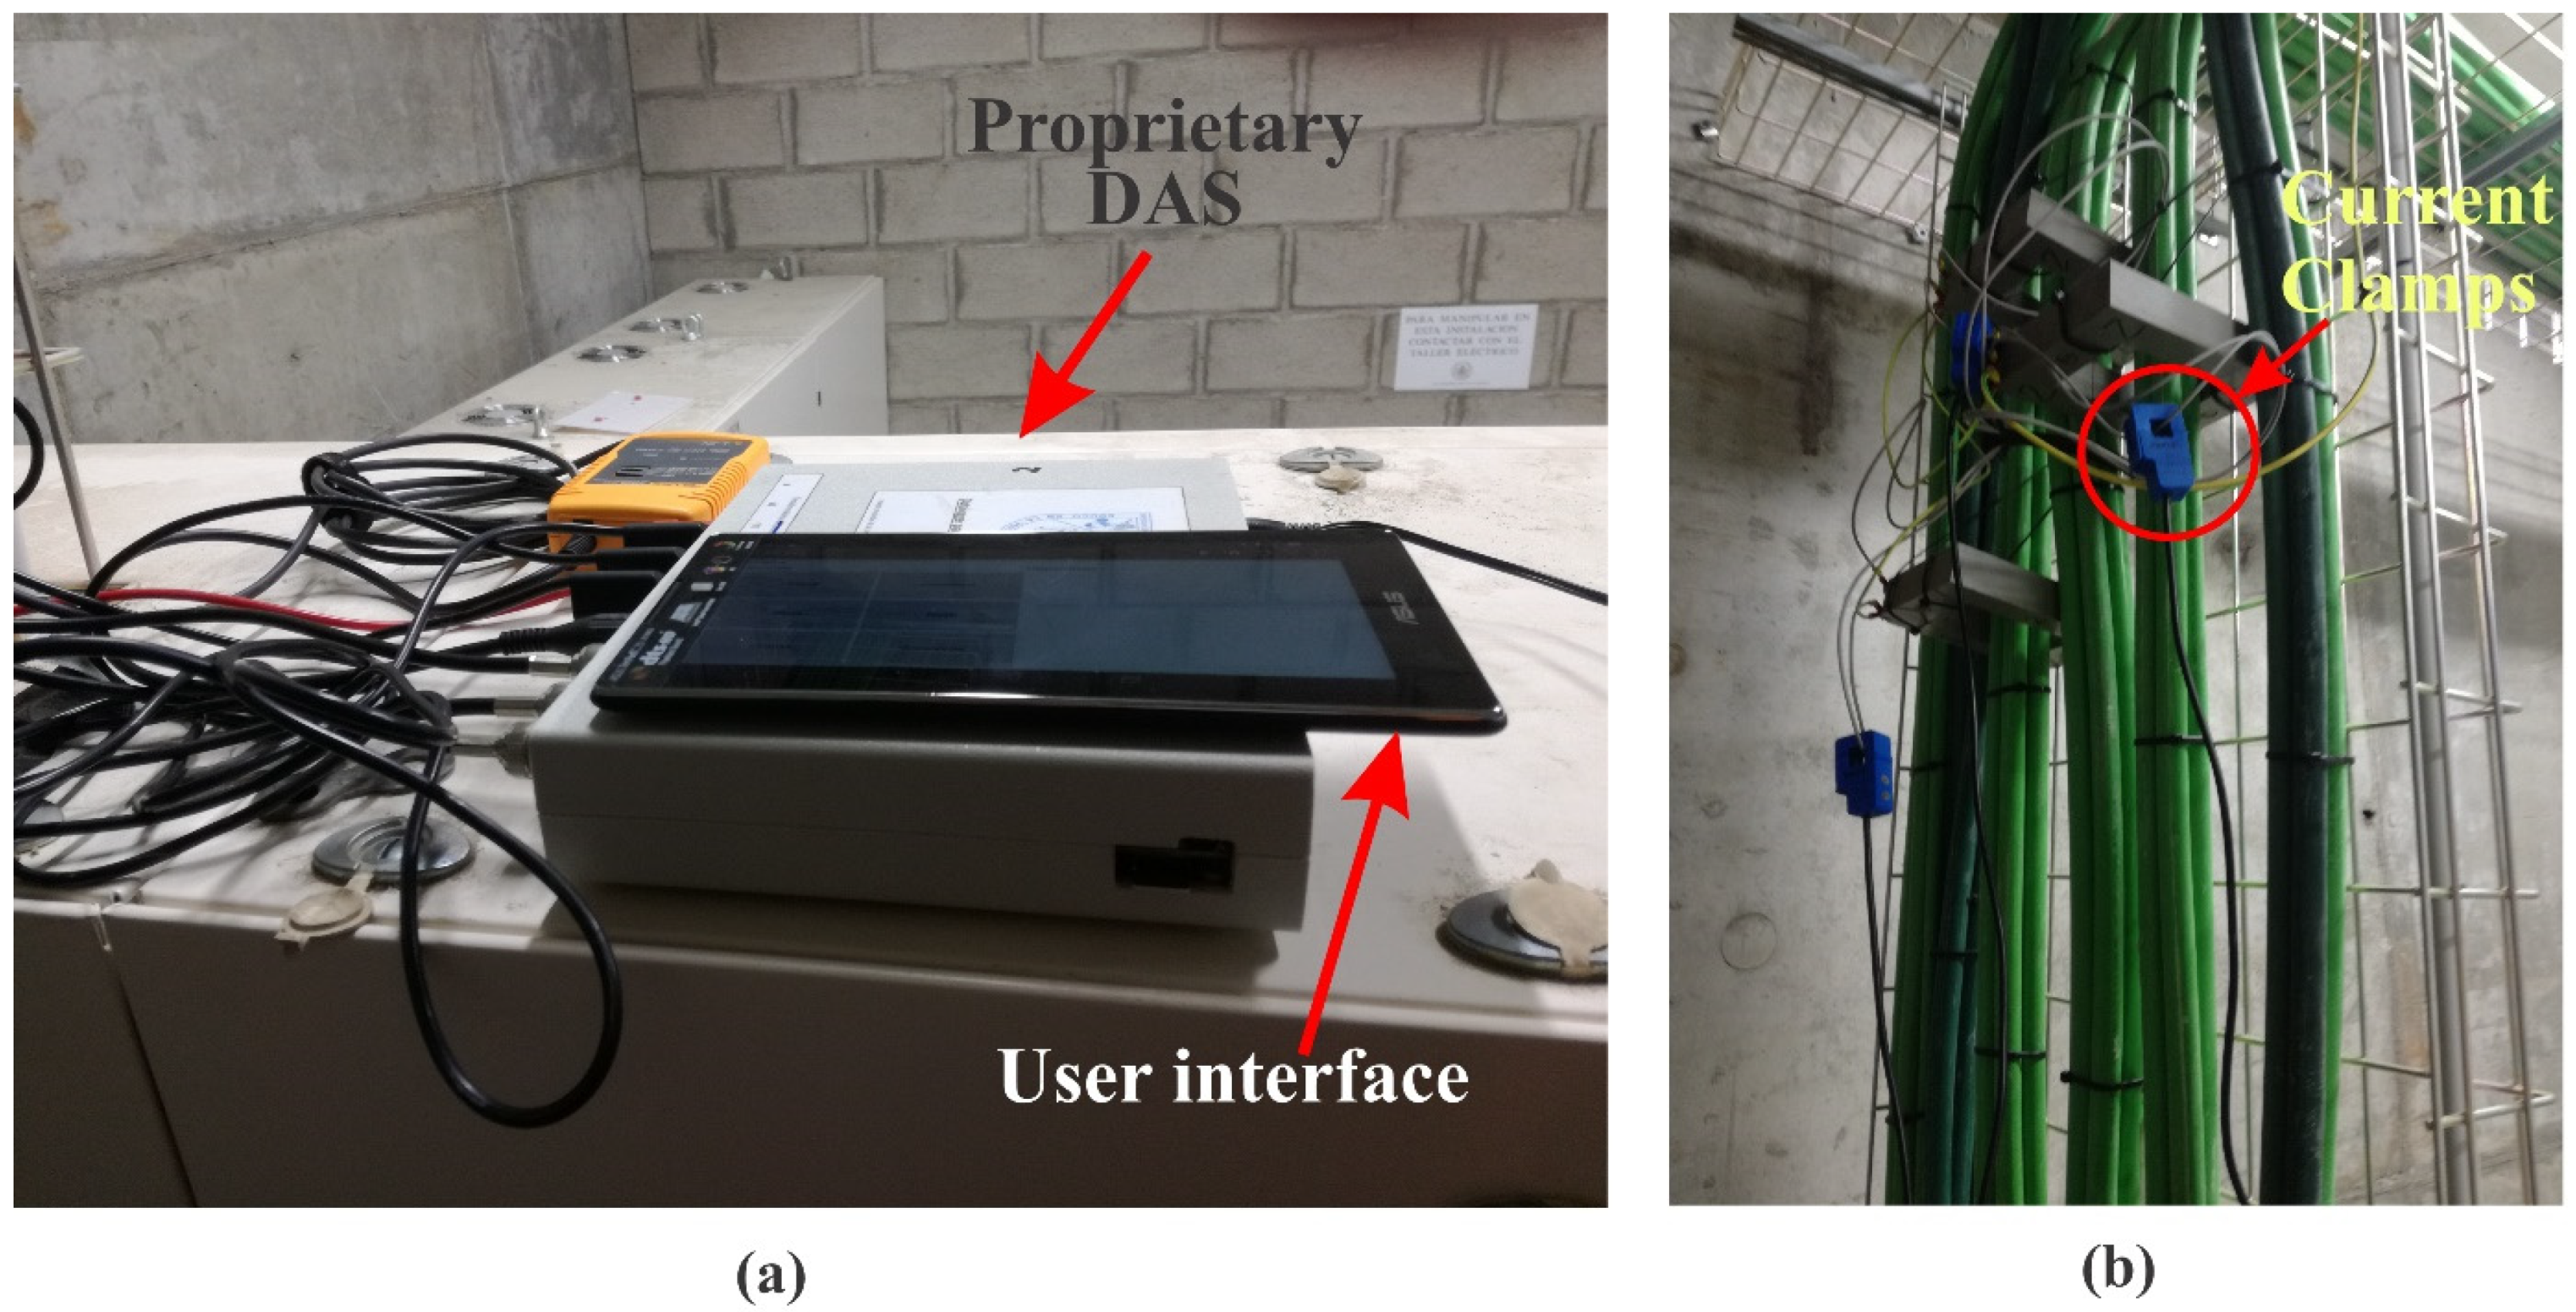
Figure 5.
Description of the (a) Proprietary DAS with user interface; and (b) placement of the current clamps in the secondary winding of measurement current transformers.
4.2. Description of the Experimentation Dates
Two different data sets are selected in this work. The first data set is formed by the voltage and current signals from a complete week comprised between the months of February and March during the year 2018. The selected week goes from 24 February to 2 March. These days are selected because they are winter days but they are also working days; therefore, it is possible to observe the effect of important loads associated with climatization. The second data set is selected to be a week from the year 2019. In this case, the selected dates start on 15 May and end on 21 May. This week was chosen to take into account the effects of air-conditioning systems. The one-year separation between the two data sets is intended to present a view of the change in the consumption patterns inside the building from one year to another.
5. Results and Discussion
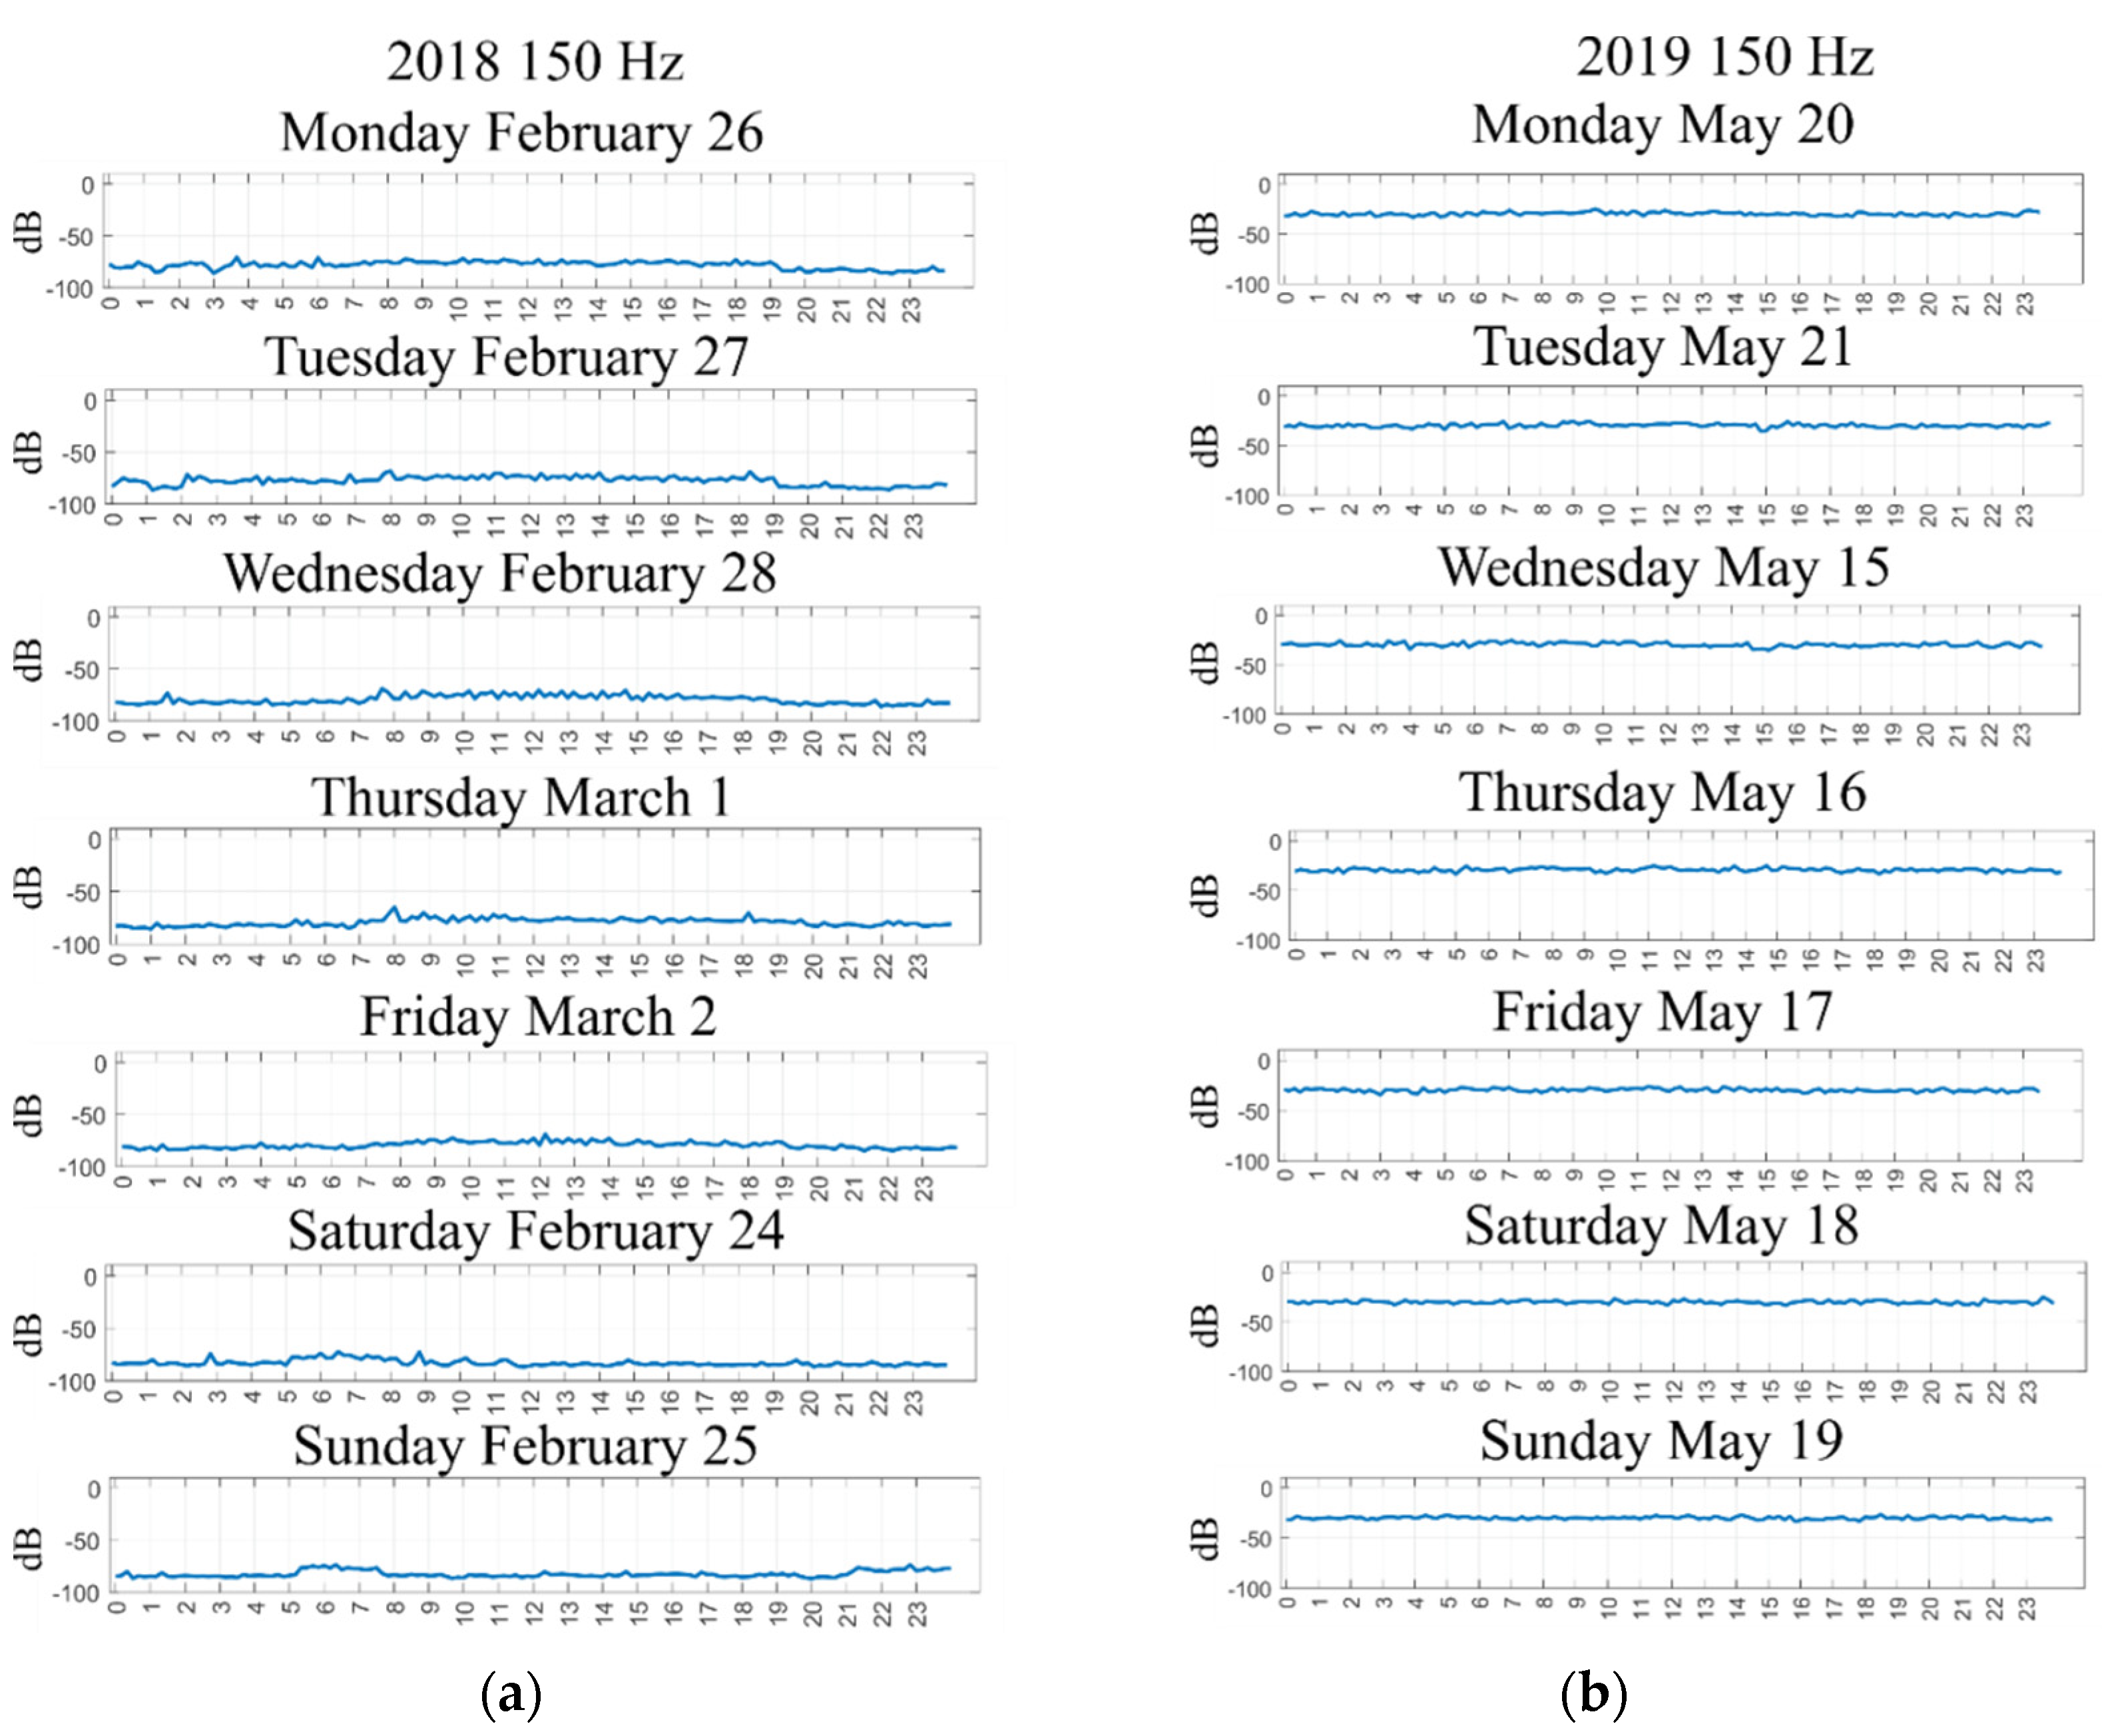
As mentioned in the experimental setup, a week of data is acquired in different years (2018 and 2019) from the described smart building. The proposed methodology is used for detecting stationary frequency components (SFC) and performing the power quality (PQ) analysis on the acquired data. Then, an analysis is performed to estimate the relationship between the SFC detected and loads of the smart building. Due to the nature of the loads in the smart building and the implemented strategies for control and energy generation, it is expected that the signals present harmonic and interharmonic contamination; therefore, the proposed methodology is suitable for finding the spectral component that is contaminating the power supply. Several SFC are identified by the methodology in the two years of analysis. The methodology identifies SFC until the range of 4 kHz (half the sampling frequency); however, this work analyzes frequencies until 1 kHz. A total of 39 SFC are identified in 2018 whereas 44 SFC are found in 2019. It is worth noticing that most of the SFC detected by the methodology are interharmonics; notwithstanding, the fundamental frequency and its harmonics are also detected as SFC. Figure 6 shows the amplitude behavior of the 3rd harmonic for each monitored day in the years 2018 and 2019. The 3rd harmonic in both years shows a constant amplitude all the week, but a different amplitude between the two years. This difference is related to the weather, 2018 data are acquired in winter and 2019 data are acquired in spring. Therefore, most of the loads used in the smart building are weather dependent, for instance, climatization.
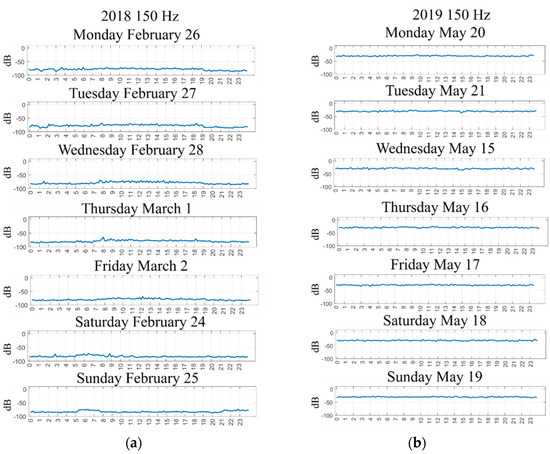
Figure 6.
Amplitude behavior for the 3rd harmonic of the current signal (a) in 2018; and (b) in 2019.
The result of the spectral analysis and the PQ analysis are shown below.
5.1. Stationary Frequency Components and Loads Estimation
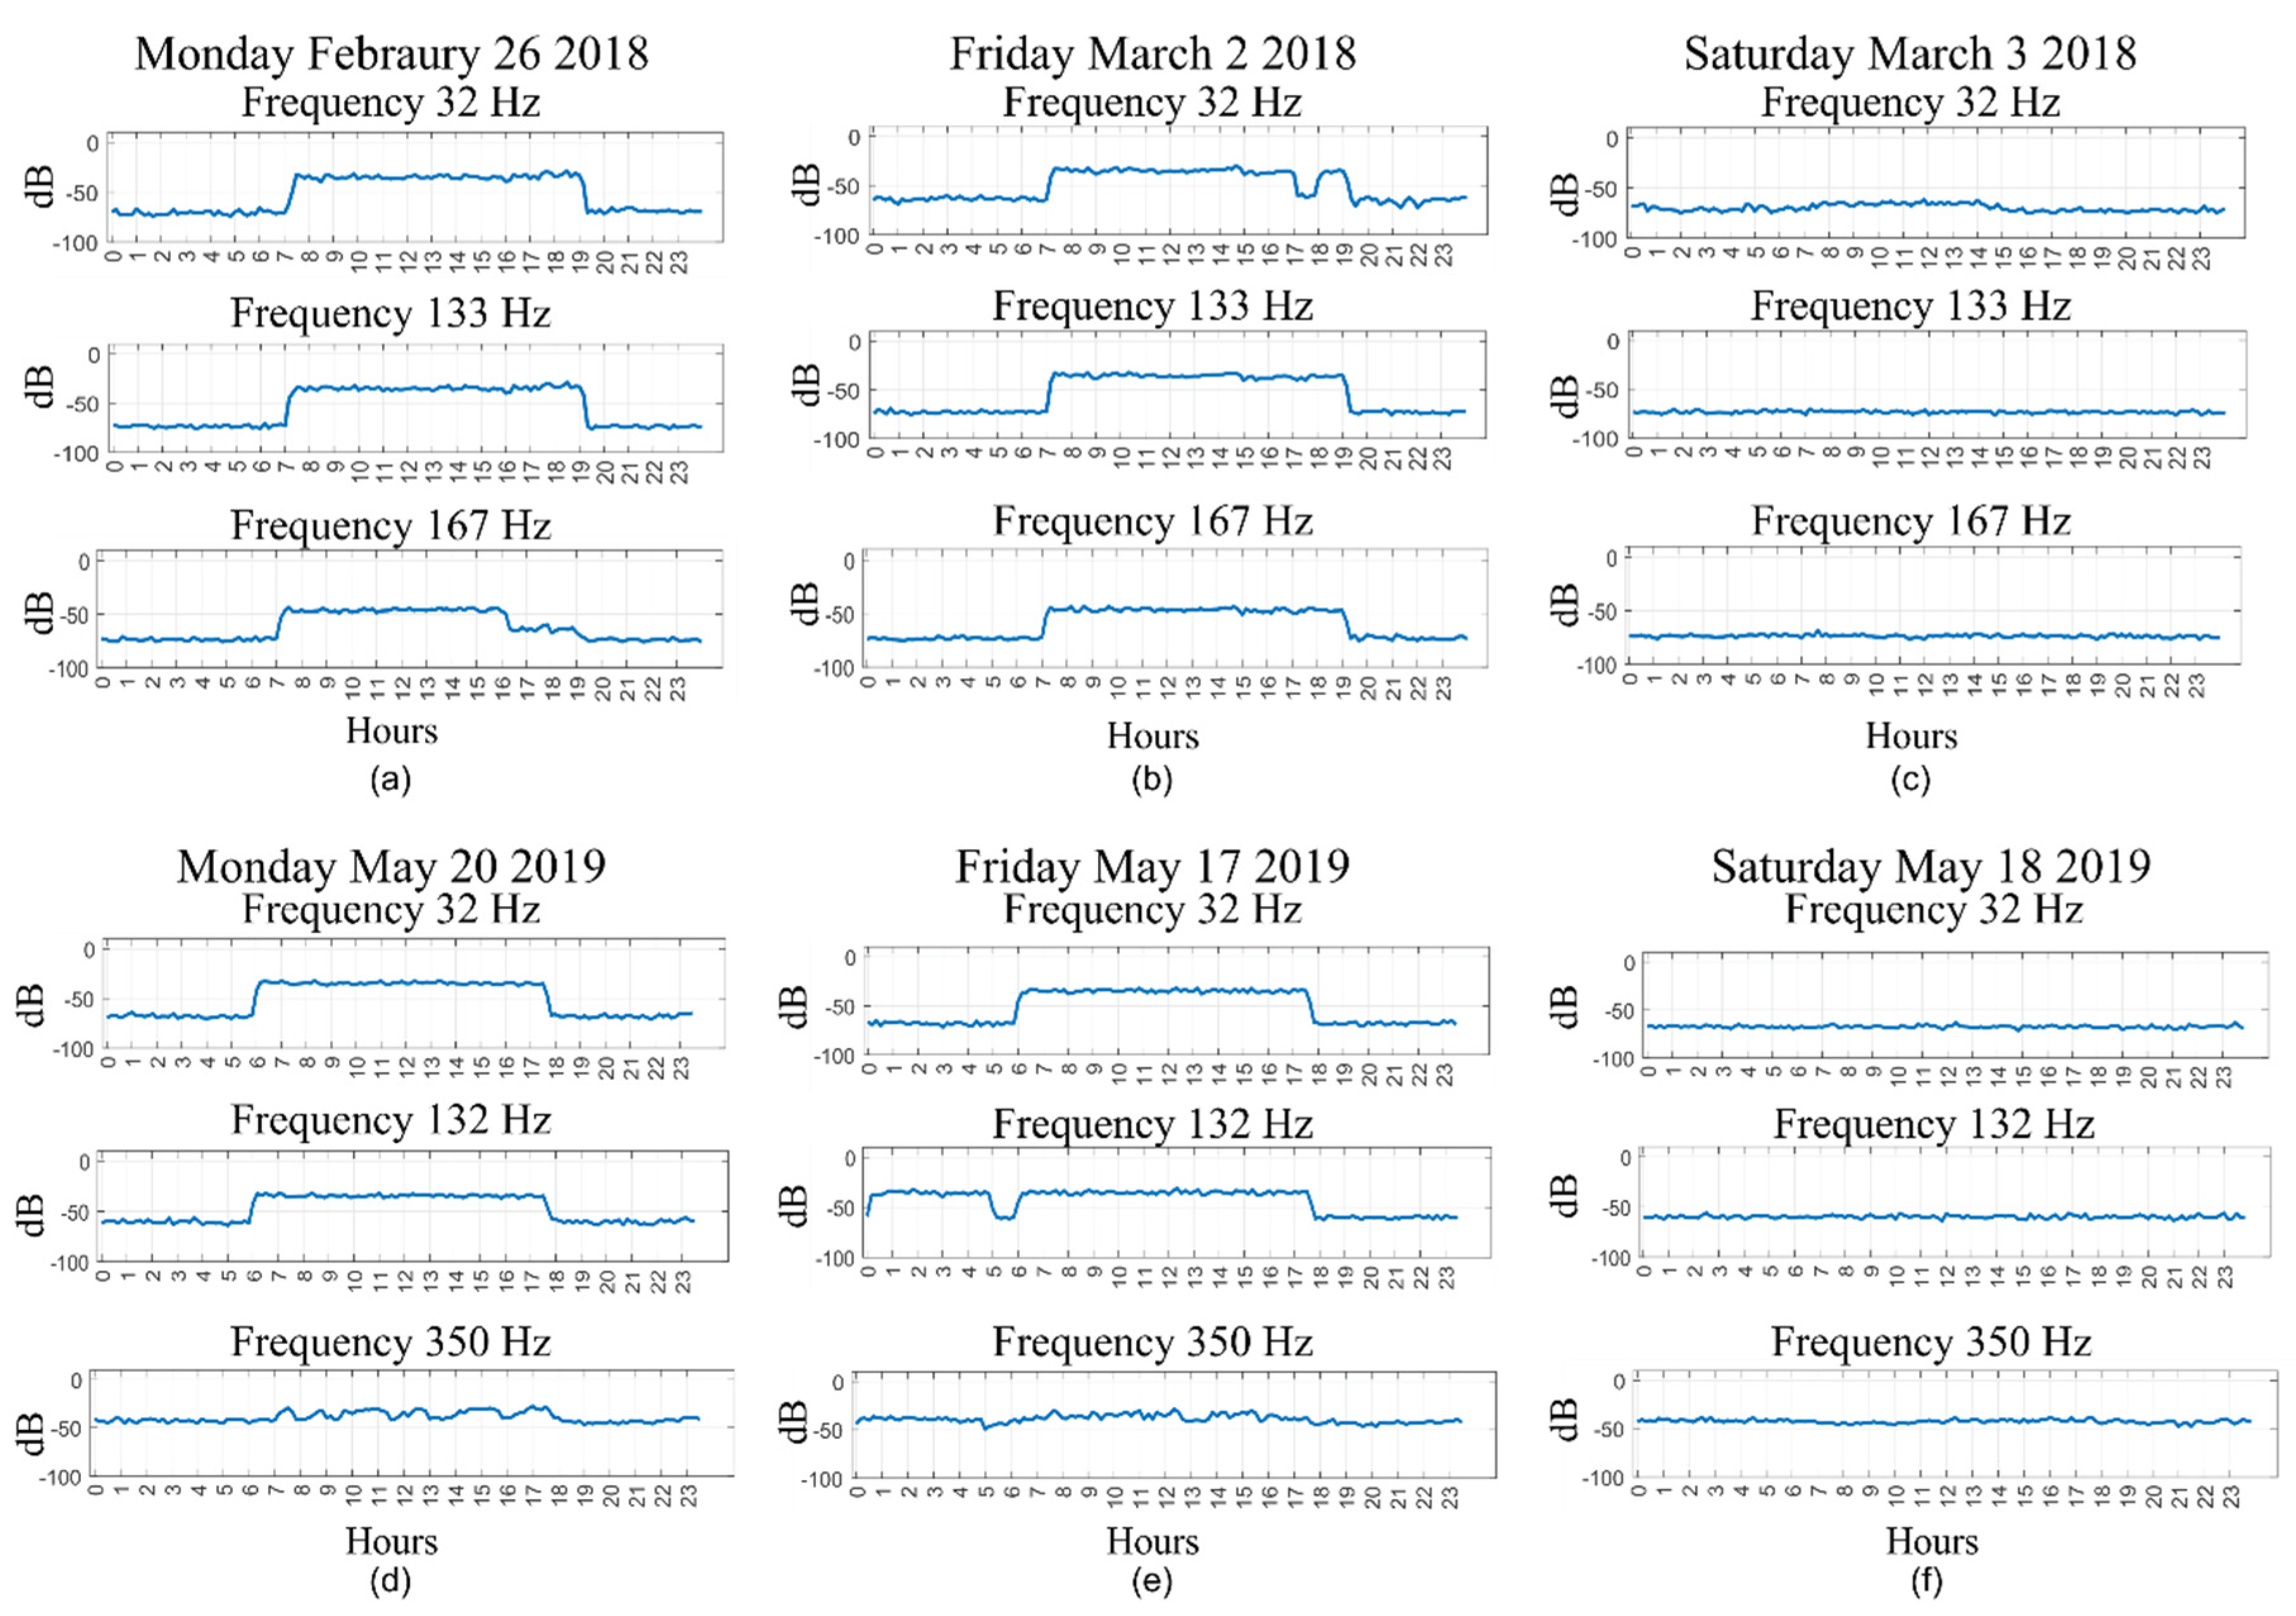
The amplitude behavior of the SFC detected in the current signals has a direct relationship with the loads connected to the electric grid in the smart building. Figure 6 shows some of the detected SFC in the electric current; these frequencies present changes in their energy values at specific hours during the weekdays. For the week taken from the year 2018, it is observed that the appearance of the frequencies of 32 Hz, 133 Hz and 167 Hz is consistent for different workdays (see Figure 7a,b). Moreover, the behavior of these three components is very similar so it can be inferred that all of them are produced for loads with similar characteristics. It is observed that the amplitude of the fluctuations in these frequency components presents a magnitude between 30 and the 70 dB and they occur at the beginning of the day, around 7:00, and at the end of the day, nearly 19:00 h. This schedule represents the period of the maximum occupancy of the building and it also corresponds with the start-up and the shutdown of the climatization systems. It is expected that these types of loads introduce a noticeable SFC since around 80% of the building consumption, because of the climatization (fan coils) and a Data Processing Centre (DPC). On the other hand, during the weekend the energy values of these spectral components remain constant (see Figure 7c,f). Additionally, it is worth noticing the fact that during the weekend, the amplitude values for the 32 Hz, 132 Hz and 167 Hz components are not only constant but low, indicating that the loads that cause the existence of such components are not operating during these days. Moreover, the climatization system is not started during the weekend; therefore, it cannot introduce SFC to the power grid. Some of the SFC that appear in the year 2018, still remain in the year 2019. This is the case for the 32 Hz and the 132 Hz components (see Figure 7d,e). Although in 2018 the identified SFC corresponds with a 133 Hz frequency and in the year 2019 the reported value is 132 Hz, these frequencies are so close to each other that it can be assumed that they are the same. Another important situation is the fact that harmonics always appear as SFC because they present a constant behavior for all the days. Notwithstanding, Figure 7d–f presents the temporal behavior of the 7th harmonic and it is observed that it behaves the same during weekdays as on weekends. This is an important situation because it shows that most loads of the building impact the generation of interharmonics instead of harmonics. This is an expected situation since many of the loads associated with sustainable buildings are nonlinear. In contrast, in Figure 7e it is observed that an increment in the amplitude of the 132 Hz starts at 0:00 h and finishes at 5:00 h. This time lapse coincides with the operation of the air purification system. At this point, it is worth noticing that the existence of frequency components different from the fundamental component causes a waveform distortion of the voltage and current signals. Such waveform distortion is harmful to the loads attached to the power grid because it reduces the lifetime of the internal components of every electric and electronic device. In industrial facilities, this kind of situation may lead to unexpected stops in the production process representing financial losses. On the other hand, at residential facilities, the presence of waveform distortions can be traduced in the malfunctioning of home appliances. Therefore, in order to propose solutions for mitigating the detrimental effects associated with harmonic and interharmonic components, it is necessary to develop robust and reliable methodologies that allow quantifying and identifying the specific components that cause waveform distortion. This turns out to be the main purpose of the proposed methodology.
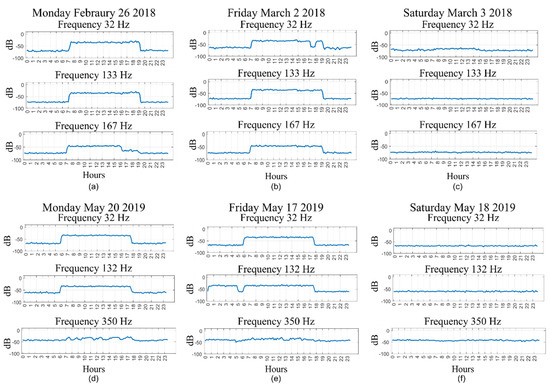
Figure 7.
SFC for the current signals: (a) frequencies 32 Hz, 133 Hz and 167 Hz for Monday 26 February 2018, (b) frequencies 32 Hz, 133 Hz and 167 Hz for Friday 2 March 2018, (c) frequencies 32 Hz, 133 Hz and 167 Hz for Saturday 3 March 2018, (d) frequencies 32 Hz, 132 Hz, and 350 Hz for Monday 20 May 2019, (e) frequencies 32 Hz, 132 Hz, and 350 Hz for Friday 17 May 2019, and (f) frequencies 32 Hz, 132 Hz, and 350 Hz for Saturday 18 May 2019.
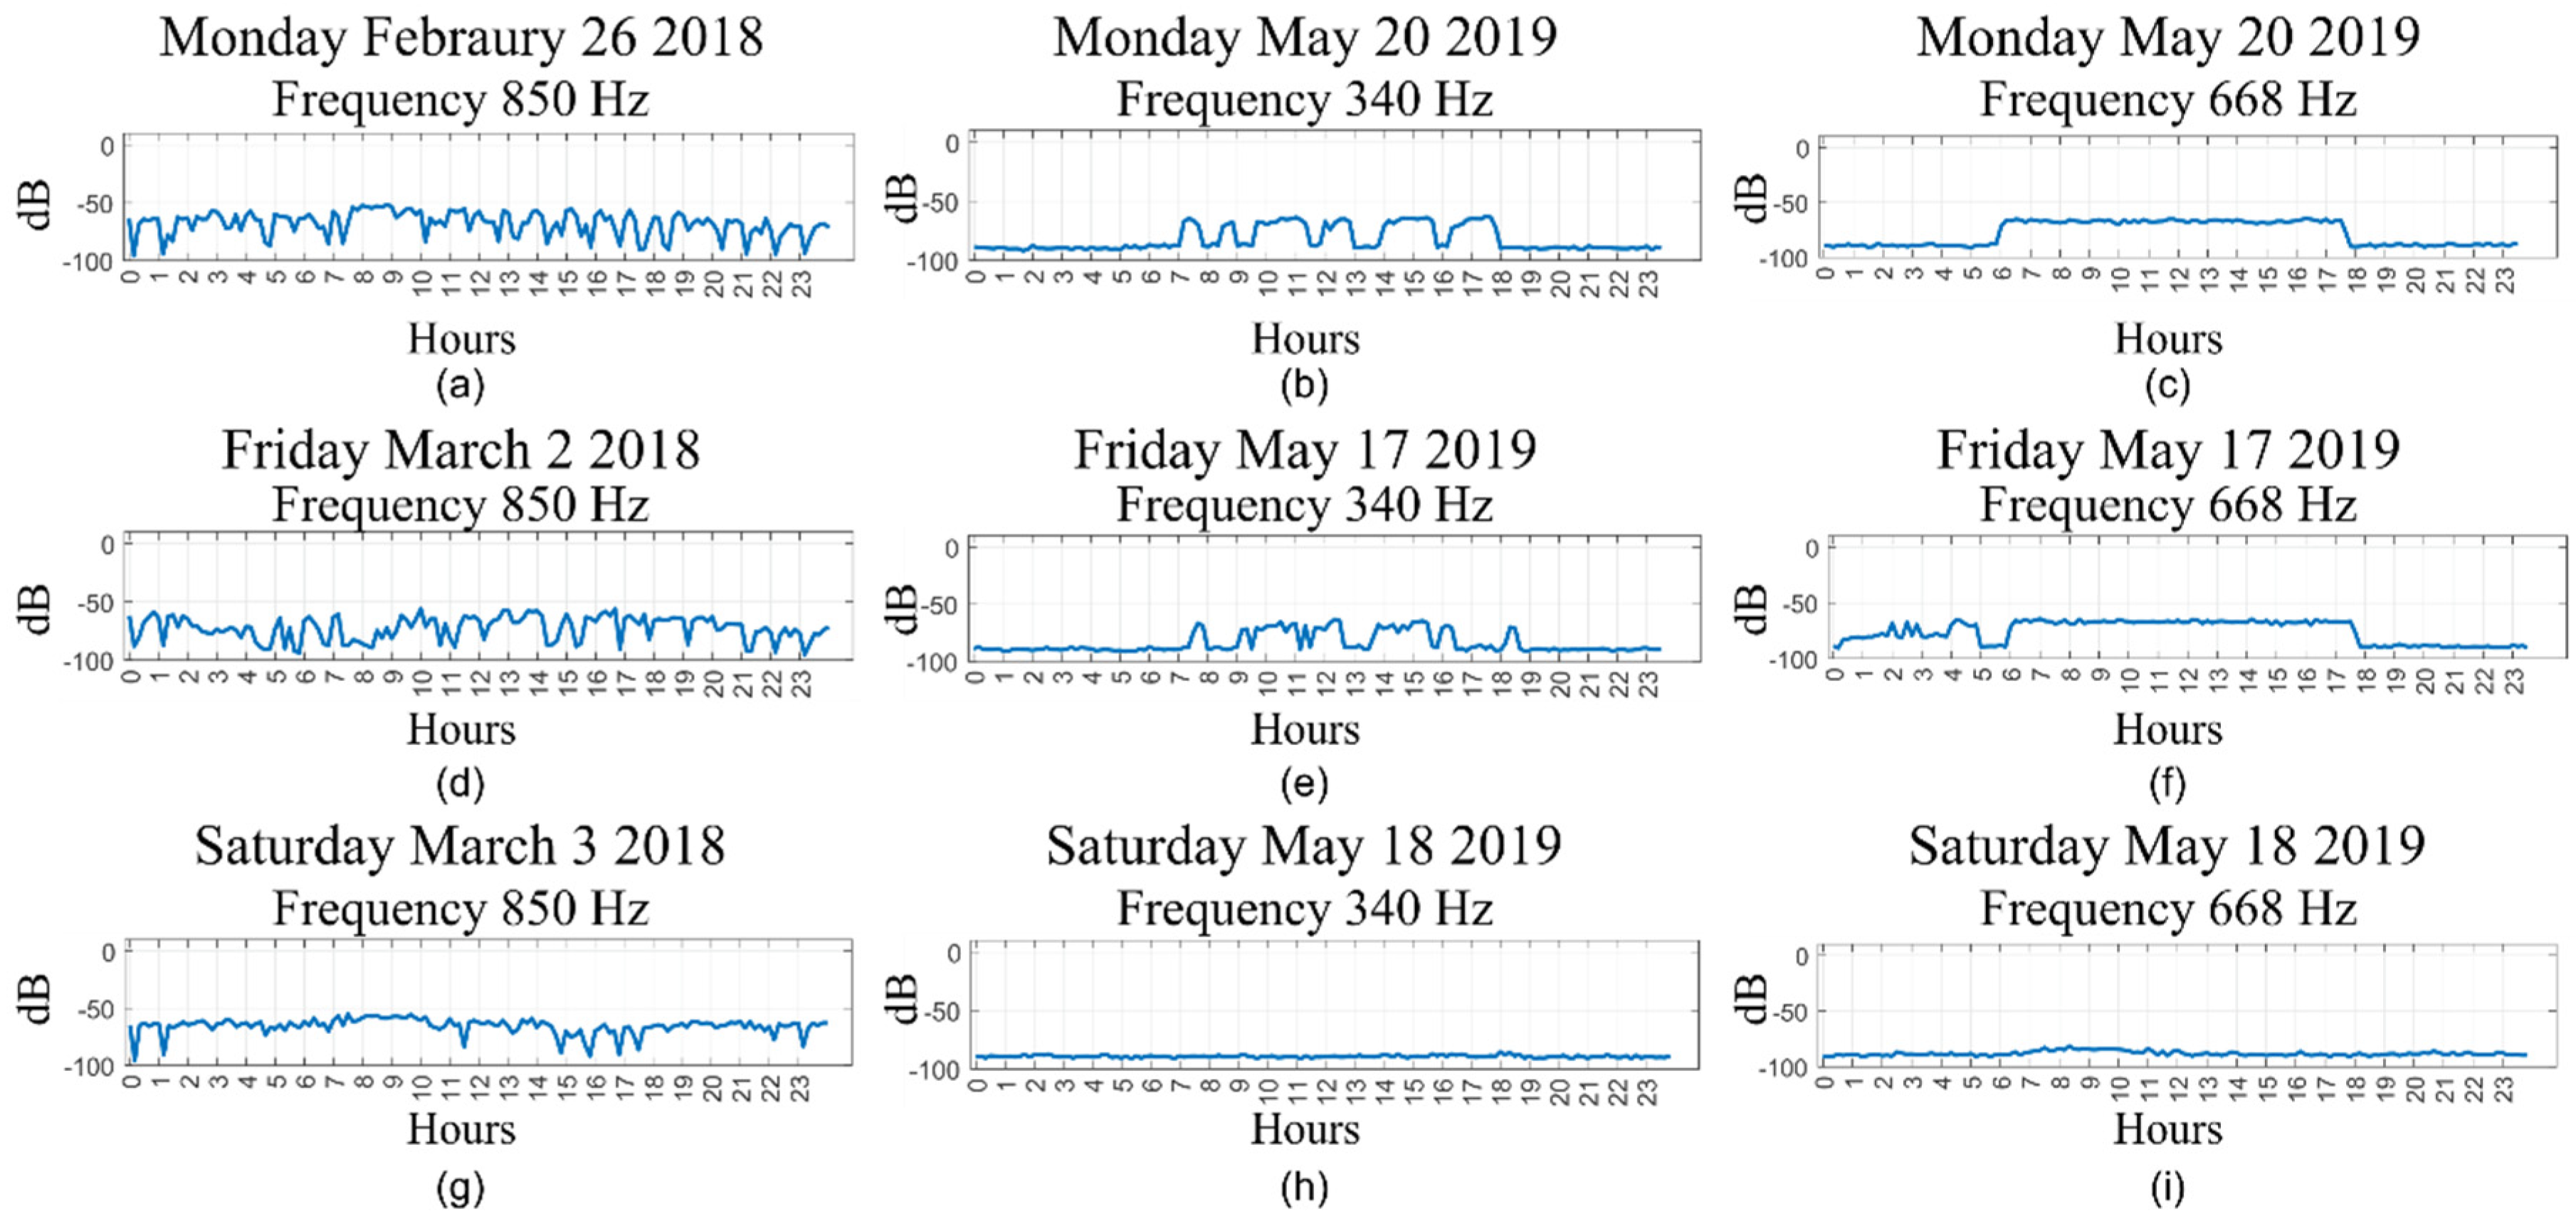
It is reported that freezers and cool rooms represent between 20% to 25% of the building power consumption, whereas the consumption related to loads, such as illumination and office equipment, is almost imperceptible. The freezers and cool rooms can turn on at any time of the day. Figure 8a,d,g shows the 850 Hz component detected as SFC on different days of the year 2018, and the 340 Hz component detected as SFC on some other days of the year 2019 (see Figure 8b,e,h). These frequencies show a random variability in their amplitude that can be related to the operation of freezers and cool rooms. At this point is important to mention that these two frequencies present similar behavior during all the workdays. However, some frequency components behave differently depending on the weekday. For instance, during the year 2019, it is found that 668 Hz is an SFC. On Monday 20 May 2019 this frequency component presents a rising at 6:00 and then a falling at around 18:00 (see Figure 8c). Notwithstanding, on Friday 17 May the amplitude behavior is different since it presents several minor variations at night (see Figure 8f). Thus, it can be inferred that an atypical load was started during the night of 17 May 2019. During the weekend these SFC remain in very low values, but the 850 Hz component found on 3 March 2018 shows several variations (see Figure 8g). This situation can be easily explained due to the fact that the vending machines and some of the freezers in the building remain working even at weekend.
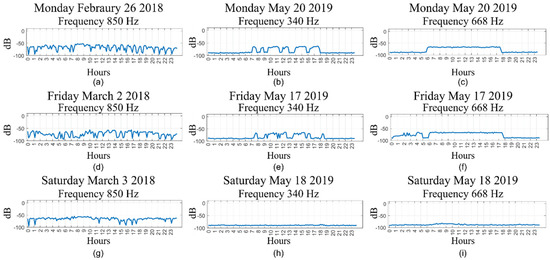
Figure 8.
SFC for the current signals: (a) frequency 850 Hz Monday 26 February 2018, (b) frequency 340 Hz Monday 20 May 2019, (c) frequency 668 Hz Monday 20 May 2019, (d) frequency 850 Hz Friday 2 March 2018, (e) frequency 340 Hz Friday 17 May 2019, (f) frequency 668 Hz Friday 17 May 2019, (g) frequency 850 Hz Saturday 3 March 2018, (h) frequency 340 Hz Saturday 18 May 2019, (i) frequency 668 Hz Saturday 18 May 2019.
In addition, the detected SFC can cause long-term problems to the grid and the loads attached to it, because these frequencies cause waveform distortion that compromises the correct functioning of the loads attached to the grid. The proposed methodology brings information that makes it possible to take more specific corrective actions to mitigate the undesired effects. For instance, by knowing the frequencies that are mainly contributing to the detriment of the power quality in the grid, it is possible to correctly tune a filter that helps to attenuate the amplitude of the harmonic and interharmonic components. This way, the waveform distortion due to harmonic and interharmonic contamination can be reduced and the power quality can be improved.
It is important to mention that there are some other techniques that can also perform identification of SFC in an electrical signal, for instance, the FFT can perform this identification by itself. However, by using only the FFT it is not possible to perform the time tracking that is achieved by the proposed methodology. Some other techniques, such as WT and EMD could provide a solution that brings information regarding the temporal behavior of certain frequencies. Notwithstanding, these techniques deliver information for frequency bands rather than for specific frequencies. The proposed approach identifies and quantifies single frequency components delivering more accurate data since it avoids the mode mixing that can cause the contribution of a frequency component to be considered more than one time for the same analysis. Finally, there is some commercial equipment that allows performing an analysis of the harmonic distortion in an electrical signal. However, this equipment provides information regarding the total contribution of all the existent harmonics and it is not possible to obtain data about any specific harmonic. Moreover, only harmonics are considered and interharmonics are left aside. By using the methodology proposed in this work, it is possible to perform an analysis of both: harmonics and interharmonics. Additionally, information regarding specific frequencies is available for being used as a tool to cope with the methodologies for harmonic and interharmonic mitigation.
Since there are some other works and methodologies that try to address the same or similar issues to the methodology proposed in this work, Table 2 presents a comparison of the previously reported works against this work (The x indicates the capabilities of the different methodologies).
Table 2.
Comparison of the proposed methodology with previous works.
From Table 2, it is observed that the SK by itself has been previously used for the identification of stationary frequency components; however, its use has been reported only for the identification of harmonics, and interharmonics are left aside. Moreover, the SK also performs a time tracking of the frequency components but only on a 1-h basis and it does not provide information regarding the nature of the load that causes the existence of certain harmonics. On the other hand, the technique reported in [27] fuses adaptive variational mode decomposition (AVMD) with the Hilbert transform (HT). Although this methodology delivers good results on the identification of stationary harmonics, interharmonics are not analyzed and no time tracking of the behavior of the harmonic is presented. An explanation of the loads that may cause the detected harmonics is not provided either. Besides the proposed methodology, in [32] it is proposed the use of recursive least squares (RLS) and an iterated extended Kalman filter (IEKF) for the identification of both: harmonic and interharmonic components. Notwithstanding, a time tracking of the frequency components is not presented and the type of load that may be related to a specific frequency component is not analyzed. In [33] the use of wavelet transform (WT) is introduced for identifying harmonic components and the authors of this work also try to introduce an explanation of the loads that generate such harmonics. However, interharmonics are not studied and the time evolution of the found frequencies is not presented. Finally, the SK-FFT methodology proposed in this particular work is able to identify and quantify any SFC considering harmonics and interharmonics as well. Moreover, the time evolution of every SFC is tracked and presented and this behavior over time is used for analyzing the type of load that causes each SFC. Thus, the methodology here proposed is the only one that is capable of fulfilling these four tasks: identification of stationary harmonics, identification of stationary interharmonics, tracking behavior over time and presenting a relationship with possible loads.
5.2. PQ Analysis
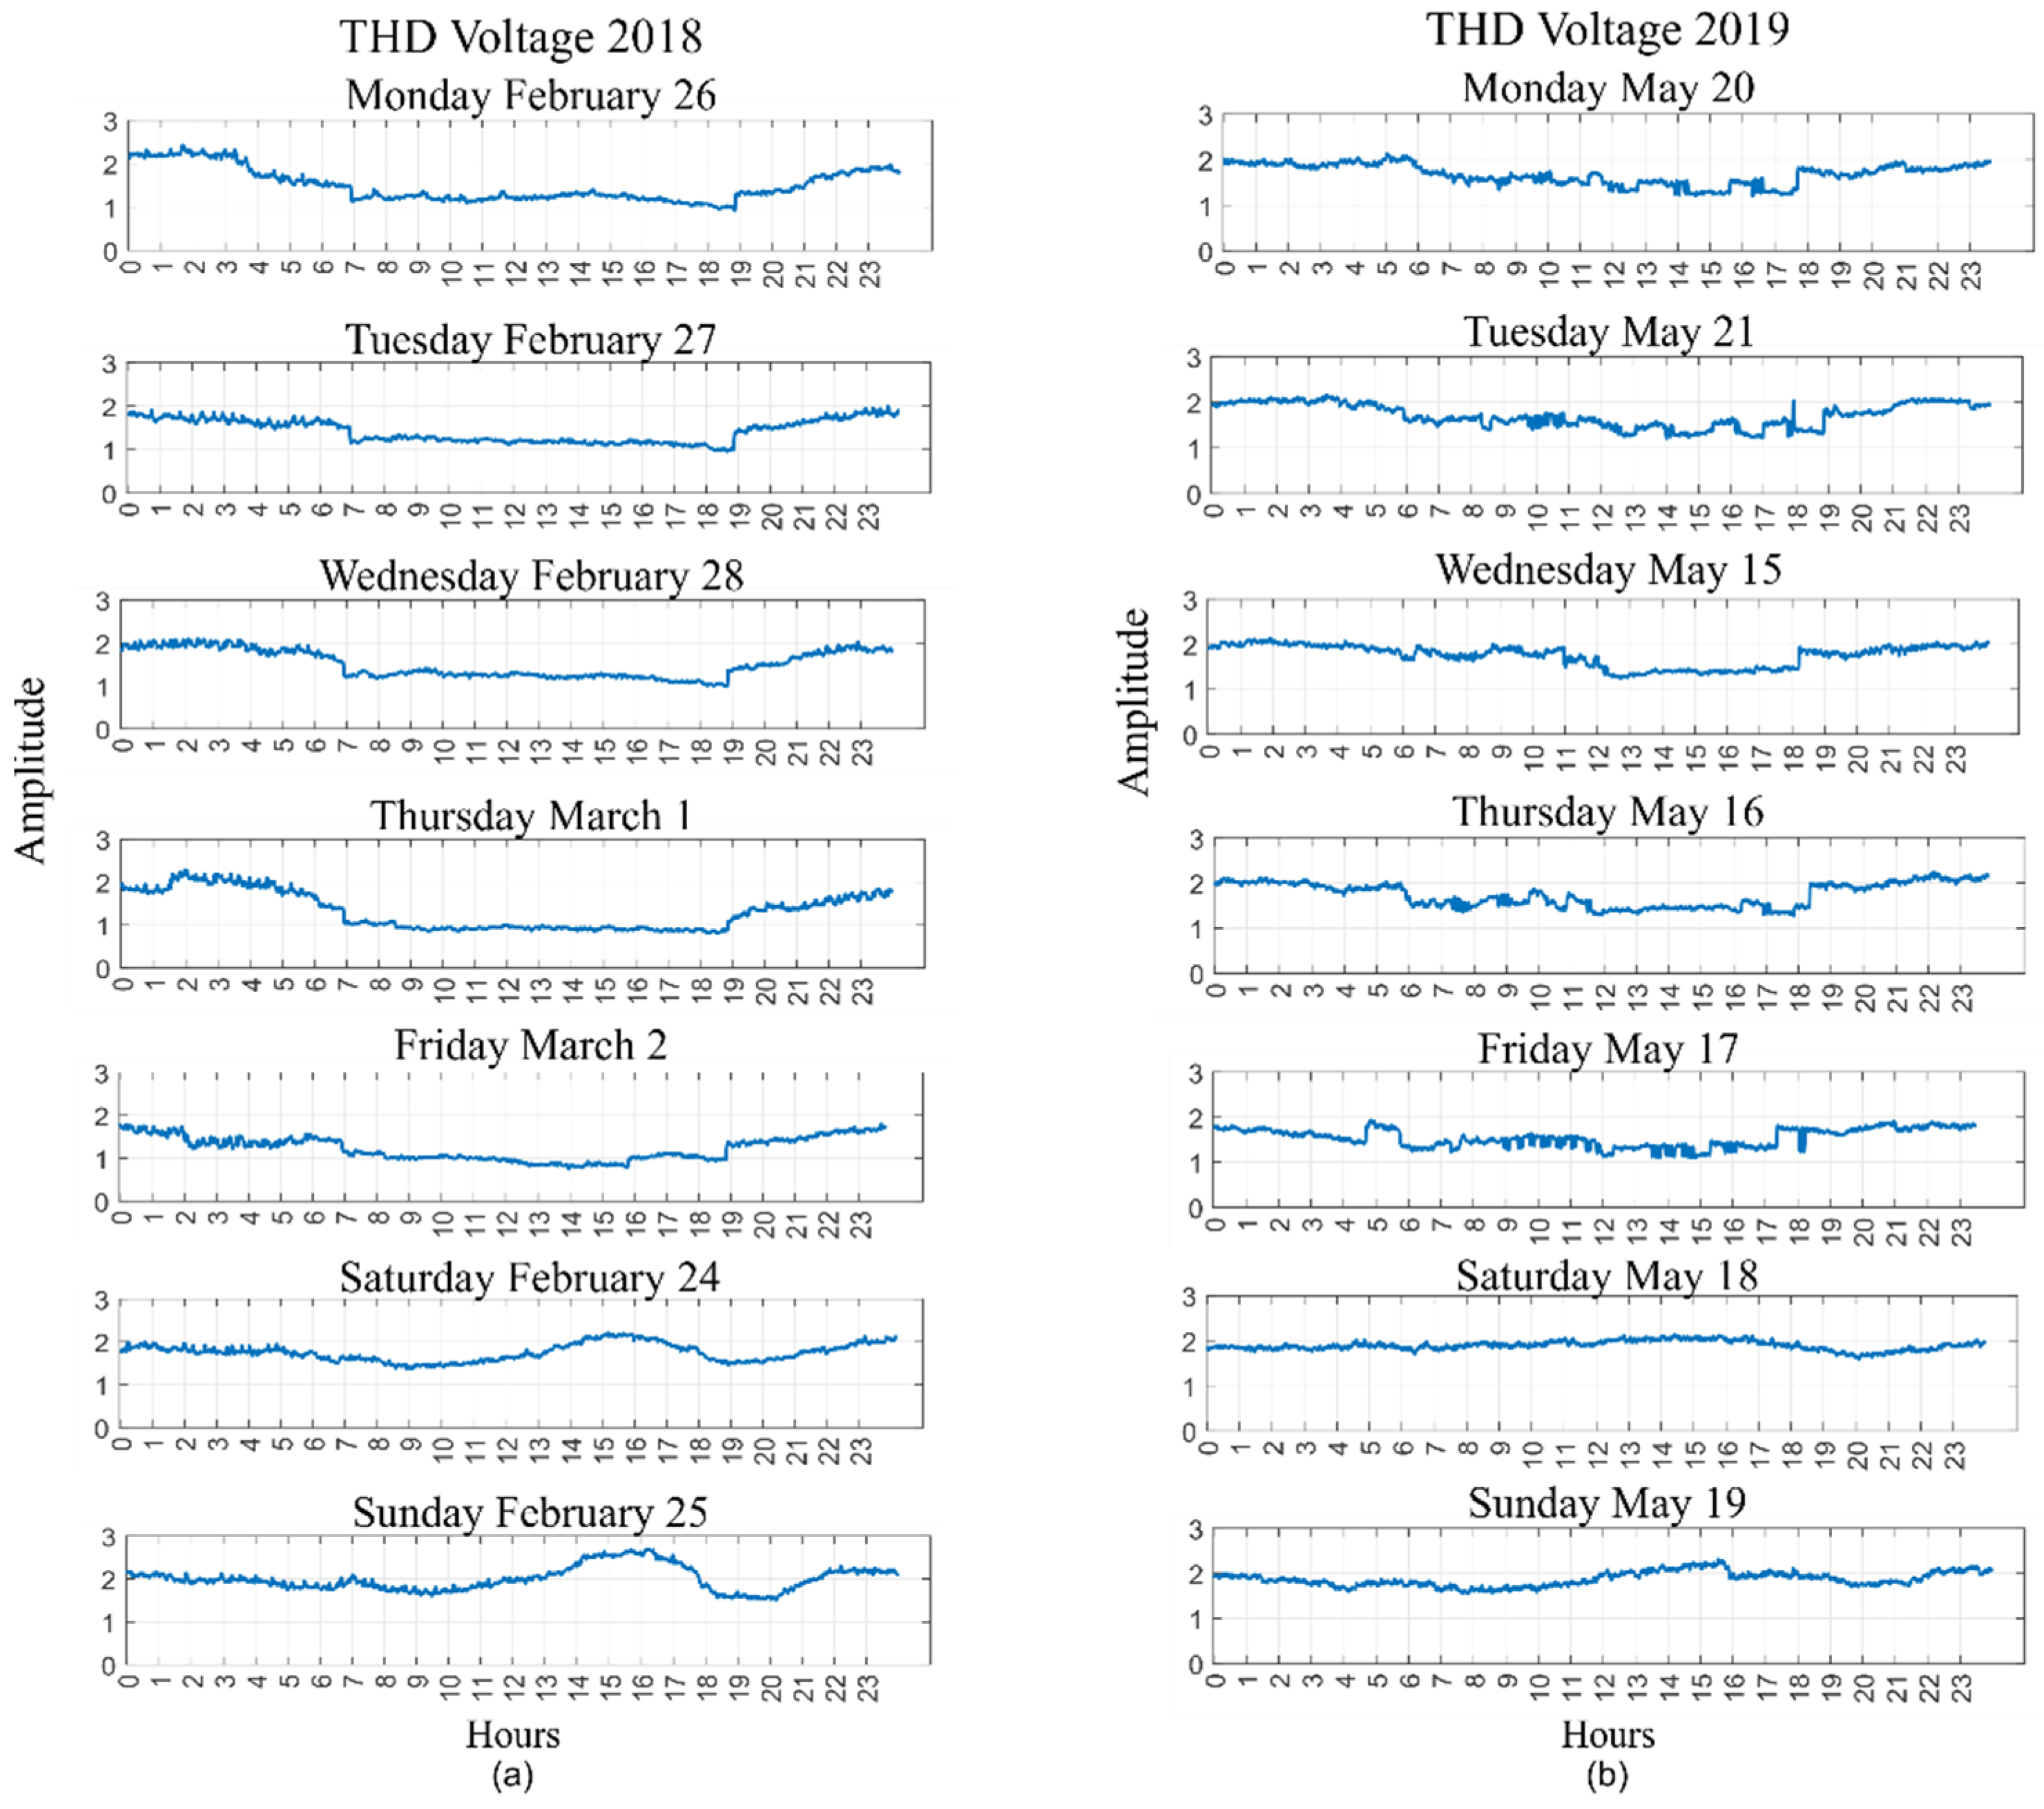
The PQ analysis is performed on data from both years. This analysis is used as a complement to the results obtained by the SK-FFT methodology. Figure 9 shows the voltage THD calculated for both years, the behavior of this index is similar from 2018 to 2019. The register of the loads from the smart building shows that in both years there is almost the same number of loads, and this is reflected in the THD. Furthermore, the THD remains within acceptable levels during the two years of analysis. At this point, it is important to mention that the THD index is computed considering only the influence of harmonics. As it can be observed in the previous sections, most of the SFC that appear are interharmonics; therefore, their contribution is not considered. This is an important situation because most of the international standards that regulate PQ issues consider the THD as the main index for quantifying waveform distortion. The results found in this work show that interharmonics can also have a significant contribution to waveform distortion; then, their contribution should be considered. In this sense, the proposed methodology can inform about the interharmonics that significantly contribute to the waveform distortion so they can be considered in a new index for quantifying this waveform distortion.
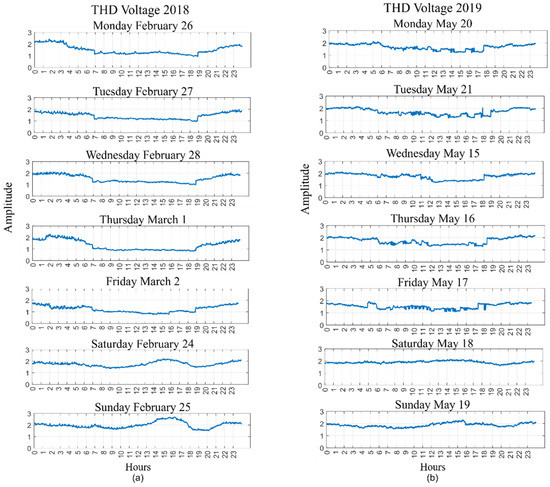
Figure 9.
Voltage THD for the: (a) week from 2018, (b) week from 2019.
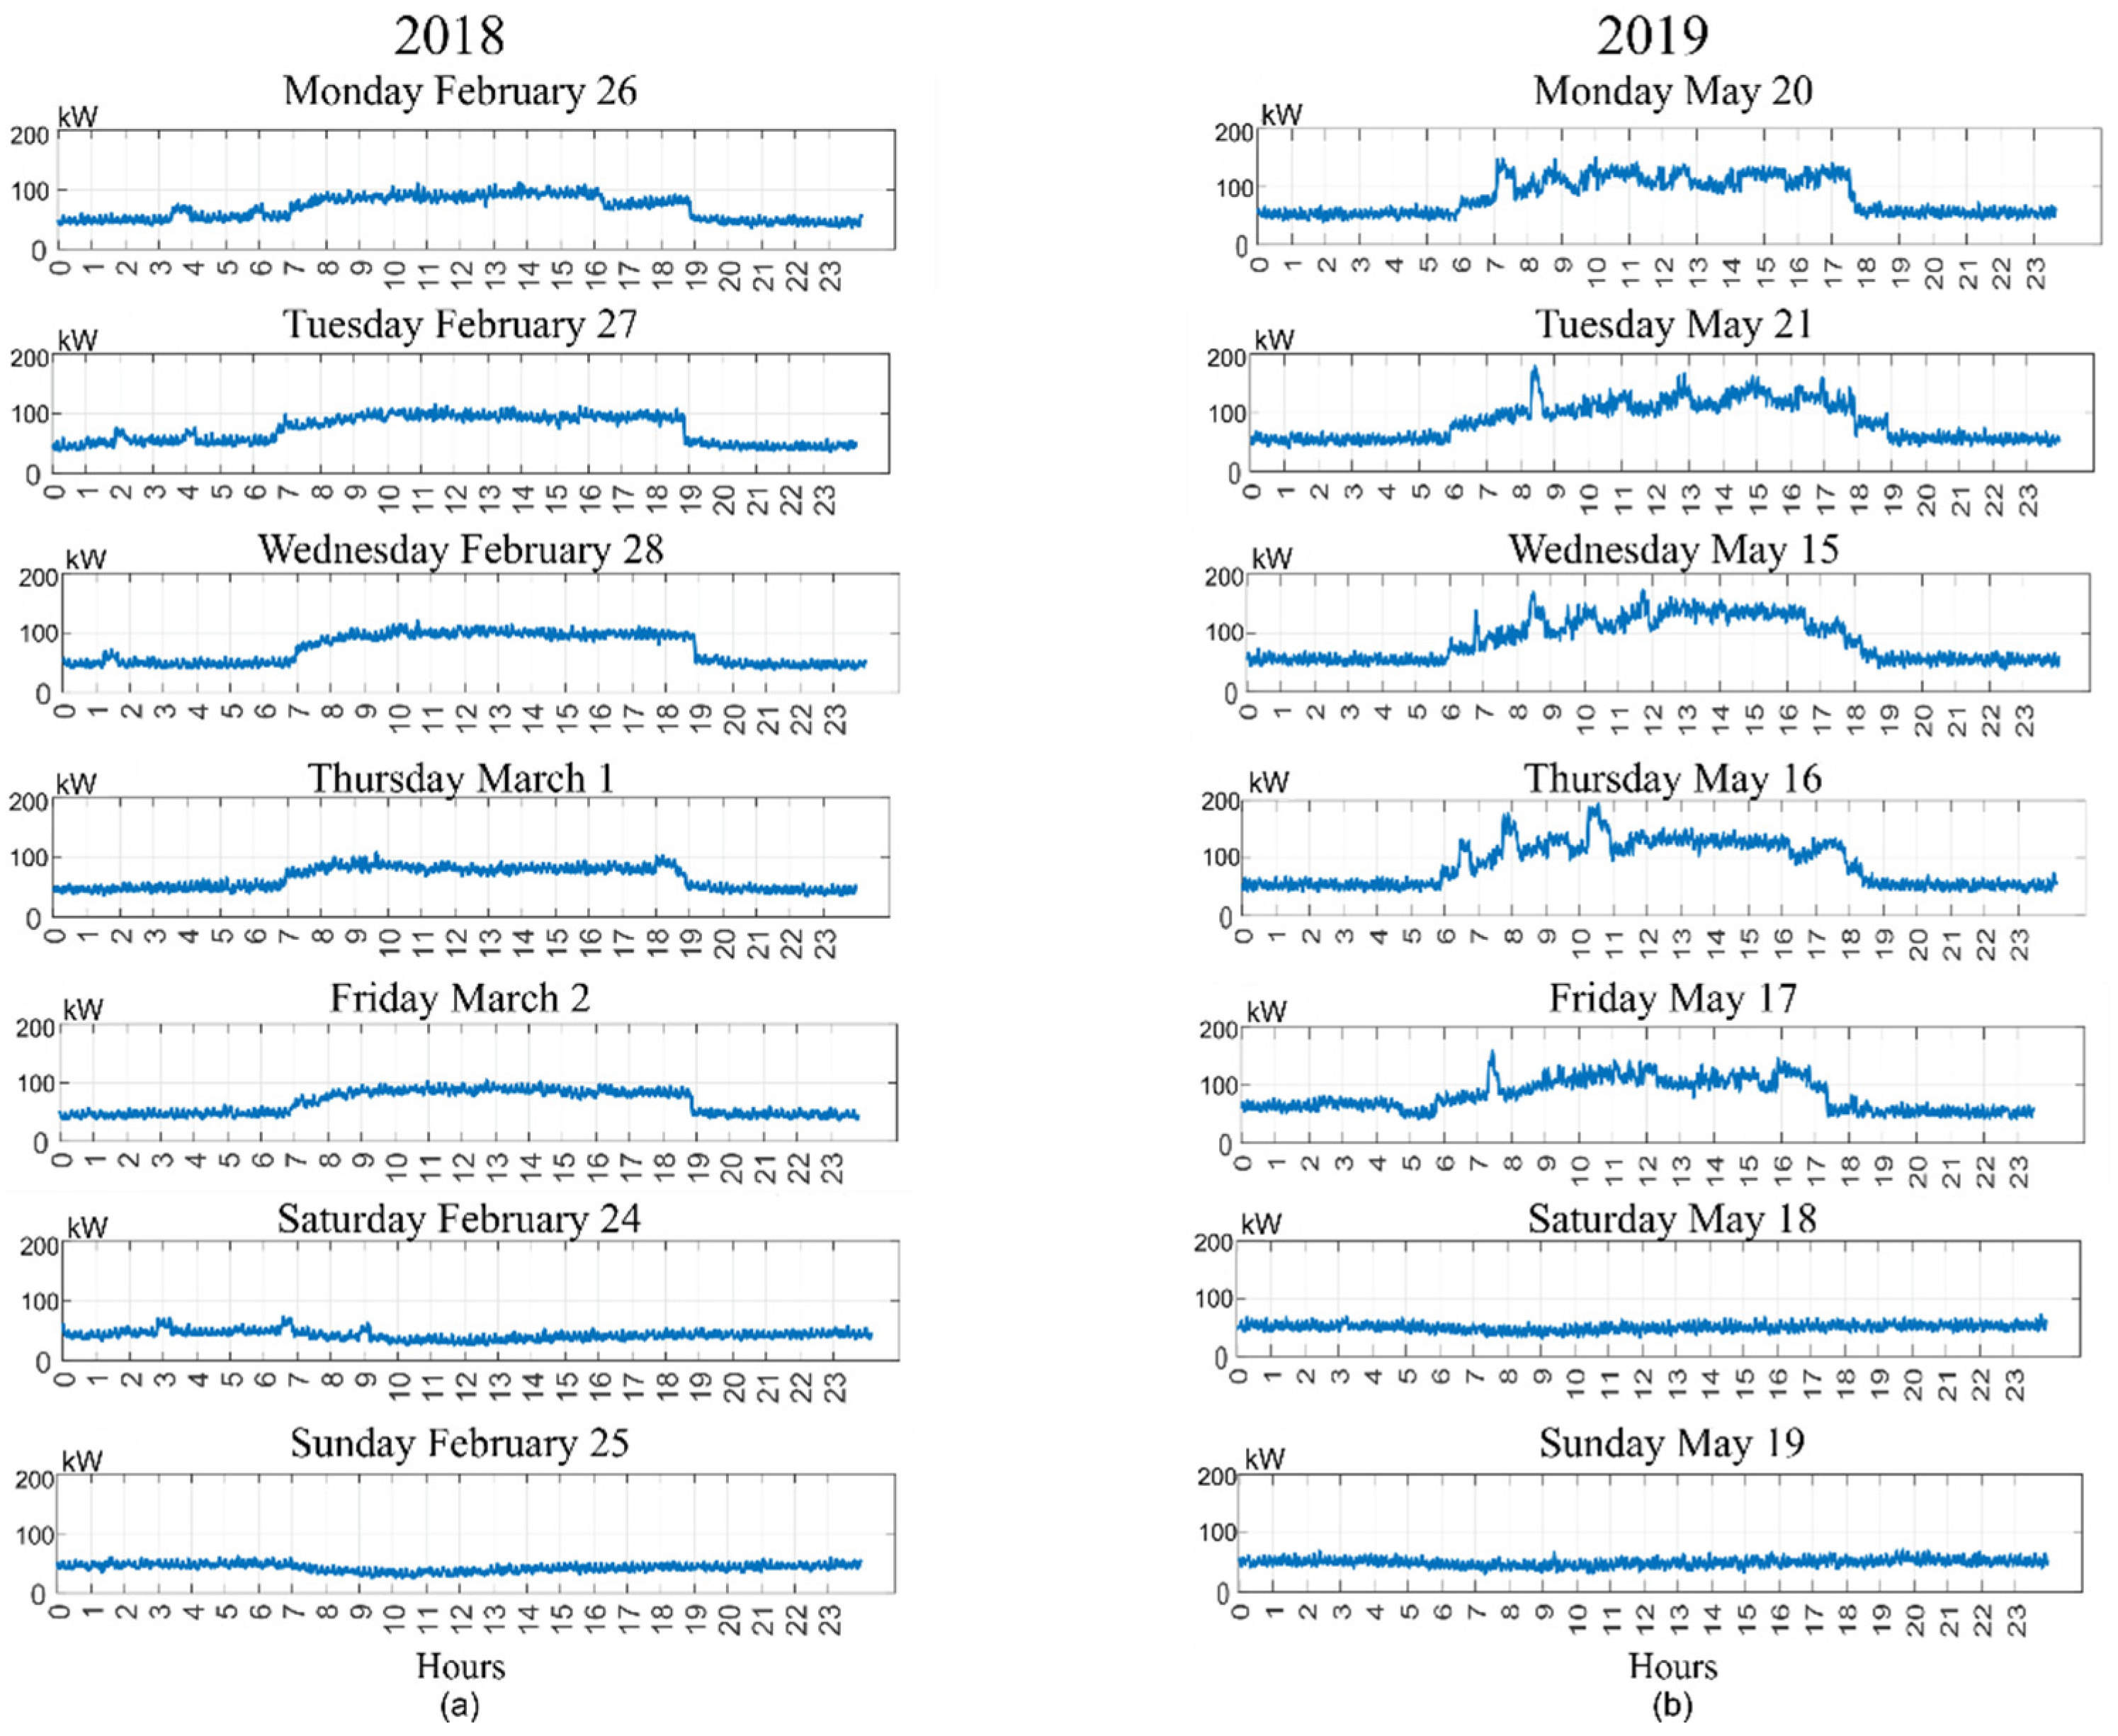
As part of the PQ analysis, the active power is calculated. Figure 10 shows the active power from both years. The levels of active power in 2018 have a maximus in 100 kW, and the levels of active power in 2019 have a maximus in 200 kW. This difference is related to the weather because the data from 2018 is acquired in winter and the data from 2019 is acquired in spring and it is observed that more energy is required for cooling the building than for warming it.
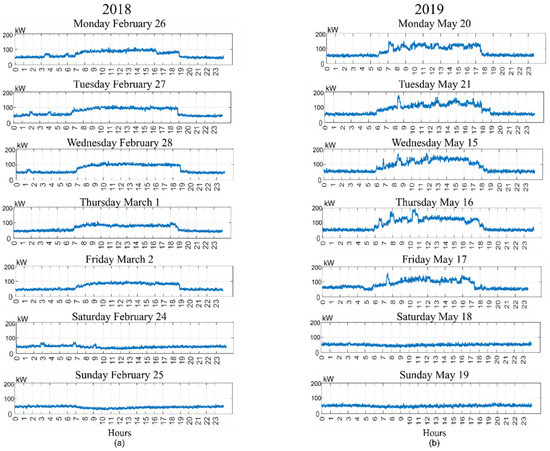
Figure 10.
Active Power (a) week from 2018 (b) week from 2019.
Finally, it is important to mention that this methodology is suitable to be applied in facilities and installations different than the smart building presented here. For instance, this methodology may result helpful at industrial facilities where an important number of loads, such as electric motors, are operating simultaneously. Identifying unexpected frequency components can be useful for avoiding damage to sensitive equipment and reducing losses for the enterprise related to unexpected stops and poor PQ. Thus, the application of the proposed methodology at industrial facilities is left as a perspective for future work.
6. Conclusions
In this work, the fusion of two well-known techniques is proposed for the identification and isolation of stationary frequency components in electric signals. These techniques are the SK and the FFT. By combining these two techniques it is possible to use SK for tracking specific frequency components with stationary behavior, and with the FFT it is possible to perform an accurate estimation of each stationary component. This allows the identification and quantification of the SFC that cause waveform distortion in a robust and reliable way.
In addition, the described methodology has some advantages over some of the conventional approaches, as explained below. First, this proposed approach identifies and quantifies individual frequency components rather than frequency bands. This situation makes it possible to provide more accurate data, as it avoids mode mixing. Secondly, this methodology also allows observing the behavior of each frequency component over time; therefore, it is possible to determine the causes of specific frequencies to determine if any corrective action needs to be implemented.
Author Contributions
Conceptualization, L.A.R.-R., D.A.E.-O. and R.d.J.R.-T.; methodology, L.A.R.-R., D.A.E.-O. and D.M.-S.; validation, L.A.R.-R., D.A.E.-O. and R.A.O.-R.; formal analysis, A.L.Z.-L., S.L.G.-G. and D.M.-S.; investigation, L.A.R.-R., D.A.E.-O., and S.L.G.-G.; resources, A.L.Z.-L., D.M.-S. and R.A.O.-R.; data curation, L.A.R.-R., D.A.E.-O. and D.M.-S.; writing—original draft preparation, L.A.R.-R., D.A.E.-O. and D.M.-S.; writing—review and editing, A.L.Z.-L., R.A.O.-R. and R.d.J.R.-T.; visualization, D.A.E.-O. and D.M.-S.; supervision, D.M.-S., R.d.J.R.-T. and A.L.Z.-L.; project administration, R.d.J.R.-T. and D.M.-S.; funding acquisition, A.L.Z.-L., D.M.-S. and R.A.O.-R. All authors have read and agreed to the published version of the manuscript.
Funding
This work was partially funded by the Universidad de Valladolid; by the Mexican council of science and technology (CONACYT) under grant 743842; and by FONDEC-UAQ 2020 FIN202011 project.
Institutional Review Board Statement
Not applicable.
Informed Consent Statement
Not applicable.
Conflicts of Interest
The authors declare no conflict of interest.
References
- Al Dakheel, J.; Del Pero, C.; Aste, N.; Leonforte, F. Smart buildings features and key performance indicators: A review. Sustain. Cities Soc. 2020, 61, 102328. [Google Scholar] [CrossRef]
- Golpîra, H.; Khan, S.A.R. A multi-objective risk-based robust optimization approach to energy management in smart residential buildings under combined demand and supply uncertainty. Energy 2019, 170, 1113–1129. [Google Scholar] [CrossRef]
- Marinakis, V.; Karakosta, C.; Doukas, H.; Androulaki, S.; Psarras, J. A building automation and control tool for remote and real time monitoring of energy consumption. Sustain. Cities Soc. 2013, 6, 11–15. [Google Scholar] [CrossRef]
- Ciugudeanu, C.; Buzdugan, M.; Beu, D.; Campianu, A.; Galatanu, C.D. Sustainable Lighting-Retrofit Versus Dedicated Luminaires-Light Versus Power Quality. Sustainability 2019, 11, 7125. [Google Scholar] [CrossRef] [Green Version]
- Lucia, O.; Cvetkovic, I.; Sarnago, H.; Boroyevich, D.; Mattavelli, P.; Lee, F.C. Design of Home Appliances for a DC-Based Nanogrid System: An Induction Range Study Case. IEEE J. Emerg. Sel. Top. Power Electron. 2013, 1, 315–326. [Google Scholar] [CrossRef]
- Pena-Alzola, R.; Bianchi, M.A.; Ordonez, M. Control Design of a PFC with Harmonic Mitigation Function for Small Hybrid AC/DC Buildings. IEEE Trans. Power Electron. 2015, 31, 6607–6620. [Google Scholar] [CrossRef]
- Nallusamy, S.; Velayutham, D.; Govindarajan, U.; Parvathyshankar, D. Power quality improvement in a low-voltage DC ceiling grid powered system. IET Power Electron. 2015, 8, 1902–1911. [Google Scholar] [CrossRef]
- Wunder, B.; Ott, L.; Szpek, M.; Boeke, U.; Weiß, R. Energy efficient DC-grids for commercial buildings. In Proceedings of the 2014 IEEE 36th International Telecommunications Energy Conference (IN TEL EC), Sao Paulo, Brazil, 17–20 August 2014; pp. 1–8. [Google Scholar]
- Parchure, A.; Tyler, S.J.; Peskin, M.A.; Rahimi, K.; Broadwater, R.P.; Dilek, M. Investigating PV Generation Induced Voltage Volatility for Customers Sharing a Distribution Service Transformer. IEEE Trans. Ind. Appl. 2017, 53, 71–79. [Google Scholar] [CrossRef]
- Alam, M.J.E.; Muttaqi, K.M.; Sutanto, D. Battery Energy Storage to Mitigate Rapid Voltage/Power Fluctuations in Power Grids Due to Fast Variations of Solar/Wind Outputs. IEEE Access 2021, 9, 12191–12202. [Google Scholar] [CrossRef]
- Chamana, M.; Chowdhury, B.H.; Jahanbakhsh, F. Distributed Control of Voltage Regulating Devices in the Presence of High PV Penetration to Mitigate Ramp-Rate Issues. IEEE Trans. Smart Grid 2018, 9, 1086–1095. [Google Scholar] [CrossRef]
- Elvira-Ortiz, D.A.; Morinigo-Sotelo, D.; Duque-Perez, O.; Jaen-Cuellar, A.Y.; Osornio-Rios, R.A.; Romero-Troncoso, R.D.J. Methodology for Flicker Estimation and Its Correlation to Environmental Factors in Photovoltaic Generation. IEEE Access 2018, 6, 24035–24047. [Google Scholar] [CrossRef]
- Zahedmanesh, A.; Muttaqi, K.M.; Sutanto, D. Alleviation of Voltage Variations Introduced by Unbalanced Allocation of Single-phase Loads in a Distribution Network Integrated with PVs and PEVs. In Proceedings of the 2020 IEEE International Conference on Power Electronics, Smart Grid and Renewable Energy (PESGRE2020), Kerala, India, 2–4 January 2020; pp. 1–6. [Google Scholar] [CrossRef]
- Raj, N.T.; Iniyan, S.; Goic, R. A review of renewable energy based cogeneration technologies. Renew. Sustain. Energy Rev. 2011, 15, 3640–3648. [Google Scholar] [CrossRef]
- Mancasi, M.; Vatu, R.; Ceaki, O.; Porumb, R.; Seritan, G. Evolution of smart buildings. A Romanian case. In Proceedings of the 2015 50th International Universities Power Engineering Conference (UPEC), Stoke-on-Trent, UK, 1–4 September 2015; pp. 1–4. [Google Scholar]
- Mahela, O.P.; Shaik, A.G.; Gupta, N. A critical review of detection and classification of power quality events. Renew. Sustain. Energy Rev. 2015, 41, 495–505. [Google Scholar] [CrossRef]
- Deng, H.; Gao, Y.; Chen, X.; Zhang, Y.; Wu, Q.; Zhao, H. Harmonic Analysis of Power Grid Based on FFT Algorithm. In Proceedings of the 2020 IEEE International Conference on Smart Cloud, Washington, DC, USA, 6–8 November 2020; pp. 161–164. [Google Scholar]
- Gupta, N.; Seethalekshmi, K.; Datta, S.S. Wavelet based real-time monitoring of electrical signals in Distributed Generation (DG) integrated system. Eng. Sci. Technol. Int. J. 2020, 24, 218–228. [Google Scholar] [CrossRef]
- Thirumala, K.; Pal, S.; Jain, T.; Umarikar, A.C. A classification method for multiple power quality disturbances using EWT based adaptive filtering and multiclass SVM. Neurocomputing 2019, 334, 265–274. [Google Scholar] [CrossRef]
- Rodriguez-Guerrero, M.A.; Carranza-Lopez-Padilla, R.; Osornio-Rios, R.A.; Romero-Troncoso, R.D.J. A novel methodology for modeling waveforms for power quality disturbance analysis. Electr. Power Syst. Res. 2017, 143, 14–24. [Google Scholar] [CrossRef]
- Elkholy, A. Harmonics assessment and mathematical modeling of power quality parameters for low voltage grid connected photovoltaic systems. Sol. Energy 2019, 183, 315–326. [Google Scholar] [CrossRef]
- Mishra, M. Power quality disturbance detection and classification using signal processing and soft computing techniques: A comprehensive review. Int. Trans. Electr. Energy Syst. 2019, 29. [Google Scholar] [CrossRef] [Green Version]
- Liu, Z.; Zhang, Q.; Han, Z.; Chen, G. A new classification method for transient power quality combining spectral kurtosis with neural network. Neurocomputing 2014, 125, 95–101. [Google Scholar] [CrossRef]
- Ray, P.K.; Eddy, Y.F.; Krishnan, A.; Dubey, H.C.; Gooi, H.B.; Amaratunga, G.A.J. Wavelet Trans-form-Spectral Kurtosis Based Hybrid Technique for Disturbance Detection in a Microgrid. In Proceedings of the 2018 IEEE Power & Energy Society General Meeting (PESGM), Portland, OR, USA, 5–10 August 2018; pp. 1–5. [Google Scholar]
- Sierra-Fernández, J.-M.; Rönnberg, S.; De La Rosa, J.-J.G.; Bollen, M.H.J.; Palomares-Salas, J.-C. Application of Spectral Kurtosis to Characterize Amplitude Variability in Power Systems’ Harmonics. Energies 2019, 12, 194. [Google Scholar] [CrossRef] [Green Version]
- Cifredo-Chacón, M.Á.; Perez-Peña, F.; Quirós-Olozábal, Á.; González-de-la-Rosa, J.J. Implementation of pro-cessing functions for autonomous power quality measurement equipment: A performance evaluation of CPU and FPGA-based embedded system. Energies 2019, 12, 914. [Google Scholar]
- Cai, G.; Wang, L.; Yang, D.; Sun, Z.; Wang, B. Harmonic Detection for Power Grids Using Adaptive Variational Mode Decomposition. Energies 2019, 12, 232. [Google Scholar] [CrossRef] [Green Version]
- Edificio LUCIA-Universidad de Valladolid. Available online: http://edificio-lucia.blogspot.com/ (accessed on 16 October 2021).
- LEED Rating System. Available online: https://www.usgbc.org/leed (accessed on 27 December 2021).
- Green Building Council España-Certificación Verde. Available online: https://gbce.es/certificacion-verde/ (accessed on 16 October 2021).
- Antoni, J. The spectral kurtosis: A useful tool for characterizing nonstationary signals. Mech. Syst. Signal Process. 2006, 20, 282–307. [Google Scholar]
- Enayati, J.; Moravej, Z. Real-time harmonics estimation in power systems using a novel hybrid algorithm. IET Gener. Transm. Distrib. 2017, 11, 3532–3538. [Google Scholar] [CrossRef]
- Nath, S.; Sinha, P.; Goswami, S.K. A wavelet based novel method for the detection of harmonic sources in power systems. Int. J. Electr. Power Energy Syst. 2012, 40, 54–61. [Google Scholar] [CrossRef]
Publisher’s Note: MDPI stays neutral with regard to jurisdictional claims in published maps and institutional affiliations. |
© 2022 by the authors. Licensee MDPI, Basel, Switzerland. This article is an open access article distributed under the terms and conditions of the Creative Commons Attribution (CC BY) license (https://creativecommons.org/licenses/by/4.0/).