
On-Farm Spatial Composition, Management Practices and Estimated Productivity of Urban Farms in the San Francisco Bay Area


1
Department of Biology and Environmental Studies, Warren Wilson College, Swannanoa, NC 28778, USA
2
Department of Environment, Science, Policy and Management, University of California, Berkeley, Berkeley, CA 94720, USA
Processes 2022, 10(3), 558; https://doi.org/10.3390/pr10030558
Submission received: 24 January 2022
/
Revised: 2 March 2022
/
Accepted: 4 March 2022
/
Published: 13 March 2022
(This article belongs to the Special Issue Processes in Urban Farming and Food Security)
Abstract
:Urban areas are the fastest growing land type worldwide. By 2060, it is expected that approximately 70% of the human population will live in cities. With increased urban population growth, food sovereignty and security issues have gained more attention, resulting in a drastic increase in urban food production activities including, urban farming and gardening. The extent to which urban farms function, their social, ecological and economic composition, and their overall impact on local food security has become an often overlooked, but important topic. From 2014 to 2017, we partnered with 29 urban farms in the San Francisco Bay Area for a broad-scale survey of urban farm characteristics. Findings reported in this research focused on local (on-farm) characteristics, including management practices, on-farm spatial composition, and estimated productivity. We implemented open-ended surveys for farm managers to better understand management practices, measured on-farm elements, including yields, crop biodiversity, weed composition and abundance, and measured spatial characteristics such as area of production, non-crop area, and proportion of infrastructure to better understand how urban farms were spatially configured. We found trends regarding spatial composition, including a large proportion of farm area dedicated to infrastructure and underutilized potential production space. All farms surveyed had adopted a breadth of agroecological management practices, including cover cropping, crop rotations, intercropping, and a range of soil conservation practices. Measured farms are incredibly productive, with estimated seasonal yields of 7.14 kg/square meter. Estimated yields were comparable with actual yields as measured at two participating farms.
1. Introduction
Urban agriculture (UA) sites, herein identified as urban farms, are co-created by the immeasurable factors that occur in the built environment. Not only do ecological factors, such as soils, and climate impact their function, but social and economic processes shape their location, size and even what they produce [1,2]. These farms occur in vacant lots, schools, city parks and other underused urban spaces; and span a variety of typologies, including institutional urban farms, small allotment style gardens, collectively managed spaces and many distinct combinations in between [3,4]. Each urban farm has a network of social and economic support structures situated in a unique ecosystem that, in sum, influence form and function [3,5,6]. Despite UA’s prevalence in the modern urban landscape, little is known about on-farm composition, management and function; or whether trends exist across these different categories.
The San Francisco Bay Area is a historical focal point for urban agriculture initiatives, often affiliated with food sovereignty and food justice organizations that currently operate urban farms throughout the East Bay. To better understand the form and function of urban agriculture systems, we initiated the Urban Agroecology survey in 2014 and engaged with urban farms and their managers in the East Bay of the San Francisco Bay area for three years. Our research goal was to better describe urban agriculture’s local composition and practices by investigating the on-farm characteristics of urban farms, including landscape composition, prevalence of management practices and a variety of production measures, including estimated yields, biodiversity and disposition of harvests.
1.1. On-Farm Composition
Investigations regarding local and landscape spatial features of urban farms have been mainly constrained to three foci: the overall size, surrounding landscape and ecological composition of the farm, especially in the context of species abundance or diversity and species-mediated biodiversity and ecosystem services (B&ES) [7]. Urban farms are often framed as potential habitats (i.e., habitat patches) in urban areas and are studied from the existing literature on species–area relationships in fragmented landscapes [8]. Generally speaking, species diversity is reduced in urban and peri-urban landscapes, and the abundance of urban-tolerant species increases [9,10,11]. These dynamics are incredibly complex and confound research regarding species occurrence, persistence, and species moderated ecosystem services in urban environments [8,12]. Despite conflicting results regarding species–area relationships and B&ES in fragmented landscapes, the size of urban farms has been a significant explanatory variable for a variety of measured ecological phenomena. Farm size has been found to influence ecological function, especially provisioning of regulatory ecosystem services such as biological control services and mediation of abundance and diversity of natural enemy and herbivorous pest species [13,14,15,16,17,18,19,20,21,22,23,24,25].
Landscape analysis is also common and similarly framed from a B&ES approach to and from urban farms with urban arthropods and resulting regulatory ecosystem services. These studies typically measure surrounding imperviousness at varying distances and resulting impacts to natural enemy abundance and diversity [13,15,21,22,26,27,28], herbivorous pest abundance and diversity [19,27,29,30,31], or focus specifically on regulatory ecosystem services [7,23]. Despite the obvious utility of these studies in understanding ecological function on urban farms, regulatory ecosystem services, and overall urban landscape ecology, the available landscape data are often criticized for their low resolution. The available technology cannot discern the fine detail of off- or on-farm composition [32], necessitating an on-the-ground approach to complement further research and better understand on-farm composition.
Previous studies that have measured landscape effects on urban agriculture ecosystem function have also incorporated local, on-farm, structural factors such as the height of and canopy cover of perennials and overall structural diversity [7,13,15,19,21,22,30,31]. Incorporation of these structural factors and other features commonly associated with management practices such as floral provisioning into their analysis have shown significant effects on species occurrence, but these factors are often measured in isolation of other spatial composition and land uses in UA.
While landscape and local factors demonstrably have an impact on ecosystem function, to the authors’ knowledge, no studies expressly incorporate the “patches within patches” concept in UA and include on-farm land-use composition (i.e., the area of production, infrastructure, unused spaces or areas set aside for natural habitat) in their analysis. In short, existing literature that accounts for both on- and off-farm effects on ecosystem function treats on-farm spatial composition as homogenous. Failure to account for spatial composition in landscape ecology studies can have significant implications for the validity of explanatory factors in these investigations as density-dependent, and species–area relationships should depend on the farm’s spatial composition [33]. Furthermore, the size and production capacity are essential factors for the planning and design of urban farms, as urban agriculture is a persistent and growing land use in urban spaces that directly impacts urban food security [34,35]. How these patches of agricultural production are managed in urban areas can have significant consequences regarding the future of UA and ecological studies within these systems. For this research, we investigate the preliminary aspects of these future research questions, seek to determine the overall spatial composition of urban farm land use, and investigate whether specific trends regarding land-use types exist in our participating farms.
1.2. On-Farm Management Practices
Urban farms exist within a landscape that has been co-created through social, economic, and ecological processes. Not unique to but prevalent in urban farms are a variety of abiotic and biotic conditions that offer unique challenges for urban farmers. Often, farmers can mitigate or adapt to challenges encountered while urban farming by implementing specific agroecological practices. Our survey sought to understand better how urban farmers manage their farms from an agroecological perspective and the extent to which management practices have been adopted or utilized in these unique landscapes. Implementing specific diversification and management practices can directly impact soil quality and mediate regulatory B&ES essential for ecological management of soils, pests and weeds.
Urban farmers are often practicing on ruderal or underused urban landscapes that often have a variety of factors that decrease urban soil biodiversity and function [36]. Urban soils typically have a higher bulk density, lower amounts of organic matter, and higher levels of debris and contamination [37]. Moreover, urban soils have lower levels of nutrient cycling due to disruptions or reductions in biological materials such as leaf-litter and water cycling [38]. Of note, areas where urban agriculture may be most impactful from a food security standpoint, are also areas with lower levels of tree canopy and greenspace [39,40], important aspects of nutrient cycling in natural ecosystems. These factors often create poor conditions for agricultural production and require intensive management to restore soil quality and fertility.
Several agroecological practices have been shown to have significant impacts on soil composition and function in non-urban agroecosystems, including the application of organic matter (compost, manure and other organic amendments) [41], crop rotations [42], cover cropping, and no-till practices [43,44]. The extent to which these practices have been implemented in urban agriculture has been understudied. Still, urban farmers have widely adopted these practices under the auspices of restoring the ecological function of urban soils. In addition to these practices creating favorable conditions in agroecosystems, they also are primarily rooted in indigenous agricultural practices that rely on ecological management, eschewing chemical inputs such as synthetic fertilizers and pesticides. Reducing the need for off-farm inputs and focusing on ecological management practices are essential aspects of UA ethics that focus on ecological and individual health.
Many of these practices are beneficial to restoring the tilth to urban soils and have many beneficial effects on pest and weed management. Herbivorous pests in urban areas can be challenging to manage due to increased urban temperatures [45], stressed urban plants [46,47,48,49], and the prevalence of disturbed areas often colonized by weedy alternative host species [10]. In addition to being beneficial to soil health, diversification practices such as intercropping, crop rotations, and floral provisioning have been shown to have beneficial effects on natural enemy populations, reduce herbivorous insect abundance, and decrease crop damage [50,51]. Moreover, soil management practices are inexorably linked to biological control of weed species, especially granivory, disruption of, and competition of weed species [52,53,54].
The extent to which agroecological management practices regarding soil health, pest and weed management, have been adopted and practiced by urban farmers is unclear. Understanding adoption of and implementation of these practices can be of great importance to understanding how urban agroecosystems function and how urban farmers can overcome challenges unique to the built environment.
1.3. Productivity and Crop Biodiversity
Urban agriculture is often considered within the context of a production paradigm, value derived from urban farms is contextualized in a production mindset despite the myriad of measured benefits to the community who engage with these spaces [34,35]. While productivity is not explicitly a goal of most urban agroecosystems [55], it is an important aspect of food security [35]. That being said, production capacity is often cited when both justifying and criticizing UA’s efficacy and continues to be a salient topic in UA discussions [56,57]. Many studies have attempted to address productivity, both through direct measurements of yields and yield estimates in an effort to better understand urban agroecosystem production capacity [58,59,60,61].
Agricultural yields in urban agroecosystems have been notoriously difficult to measure. Because these spaces often operate outside of traditional crop planning, harvesting often occurs sporadically and outside the scope of top-down farm management, making it difficult to capture overall yield of each plant. Moreover, many crops grown in UA systems are harvested repeatedly throughout the growing season, so one engagement with the plant is unlikely to represent its true yield. Another difficulty often encountered in this process is that removing crops for measurement is a significant impact to the farm. Several strategies have been implemented in the previously cited studies, including estimates and direct counting and weighing of crops. While estimates are not a particularly effective way of understanding true production, they can be a useful tool for estimating potential yields. For the purpose of this research, we used the estimated productivity per plant to create a productivity measure per unit of area to gain a better understanding of overall potential yields in UA.
Related to productivity, disposition of harvest is an important factor connecting productivity to food security. Most often, research that has measured productivity on urban farms has failed to gain insight into where harvests go, and how they are utilized. Most literature regarding urban food production and distribution rely on theorized or hypothetical scenarios but fail to understand how and if urban farm production impacts food insecurity or alleviates food impoverishment [35]. In this research we worked directly with farm managers through open-ended surveys to gain insight on the ultimate fate of urban farm production.
1.4. Research Efforts
Despite these differences and typologies, and myriad of challenges and benefits derived from such systems, little is known about the prevalence of certain management practices, on-farm spatial composition or trends regarding the productivity of these spaces. This agroecological survey attempts to clarify these aspects of urban farming to gain a better insight into urban agroecosystem function, composition, and productivity—this information will hopefully be of great utility to urban planners, urban farming advocates and ecologists studying these important and complex managed ecosystems.
2. Methods
2.1. Study Design
Initial outreach to local urban farms in the East Bay area of San Francisco started in 2014. Potential community partners were identified through a review of local news, social media and websites that identified urban farmers and community gardens that were impacting local food security. After initial contact, an initial meeting was scheduled for researchers and farm managers. During the first visit, researchers administered an open-ended interview that included 54 questions based on management practices, social and economic factors, and ecological phenomena (see Appendix A). Research questions qualify as exempted from Institutional Review Board approval as per the criteria on research set forth by the Committee for Protection of Human Subjects (CPHS) and Office for Protection of Human Subjects (OPHS) [62]. Additional community partners were identified during this process during research visits and referrals from initial contacts. Research partners and affiliated urban agriculture sites were asked to be community partners if they met two criteria: 1. level of community engagement (i.e., operations were open to community participation and community members derived some benefit) and 2. they were not explicitly for-profit, production-centric operations. Some selection bias probably occurred during this time as organizations that had a full or part-time farm manager were more likely to sustain contact with researchers. Nineteen sites were identified for research in year one. Researchers visited several times throughout the summer and fall growing season as approved by farm managers.
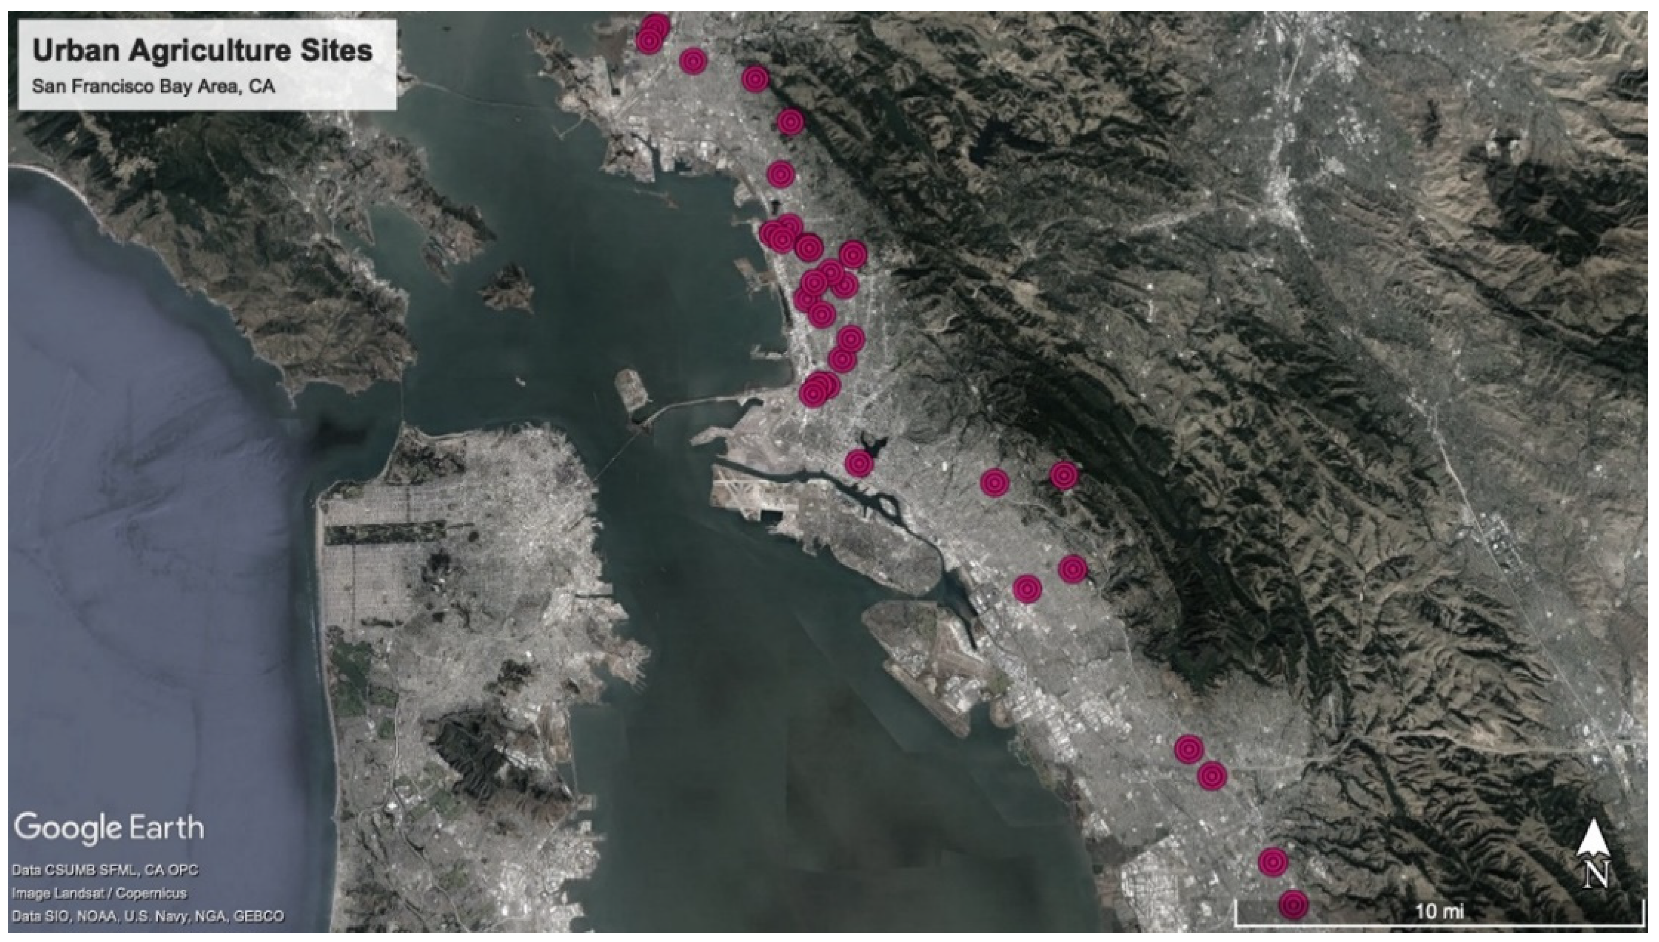
In 2015 we saw some attrition from previous farms due to low response rates and difficulty in scheduling. Four additional research partner sites were included in 2015. All measures except open-ended surveys were repeated in 2015. Subsequently, in proceeding research years six additional sites were added for a total of 29 farms that participated in this research (Figure 1). Due to variability in support, turnover of garden managers, and a variety of other factors, some farms only participated in portions of the research (see Appendix A). During the duration of the urban agroecology survey, six of our community partner sites were abandoned and/or developed.
2.2. On-Farm Composition
To determine on-farm composition of research sites, we physically measured urban farm size, area of production, non-crop areas and areas used for infrastructure. Total farm size was measured using Google Earth Pro and ground-proofed during site visits. Farm production space was measured by hand and included all space in the gardens used for producing crops (both annual and perennial). Not all production occurred in-ground, therefore, the overall estimate of area used for production included both raised garden beds and in-ground production. Non-crop areas are defined as managed areas not primarily used for food production and were often set aside as pollinator or natural enemy habitat. These spaces included a variety of perennials and annuals, flowers, and other non-crop features. Infrastructure was defined as the area not being used for production, or conserved for non-crop habitat (includes buildings, pathways, etc.) and can generally be considered areas utilized for other on-farm uses. These measurements were translated into proportions of total farm area for analysis (Table 1).
2.3. Productivity and Distribution
Estimated Productivity (EP) was measured by randomized quadrat counts of land in agricultural production. All crop plants within the quadrat were identified to cultivar. Each quadrat was also identified for production practices, whether the bed was raised or in-ground, and type of irrigation (drip irrigation or hand watered). Estimated productivity was measured by the number of plants per quadrat. Per plant yields were limited by available data and a diversity of sources were used to estimate yields including How to Grow More Vegetables [63] and yield data from field trials at the Oxford Tract Research Station at UC Berkeley [64]. The methodology used to estimate the average potential yields per square meter are based on prior work in urban agriculture [58,59,64,65,66]. Distribution of harvests were self-reported by farm managers during open-ended questionnaires. Farm managers were asked to report proportions of harvest that went home with people who worked on the farm or were donated to farm neighbors, crop sales through farmers markets and donations to community food organizations such as food banks.
2.4. Crop Diversity and Weed Occurrence
Crop biodiversity was measured using two methodologies, productivity quadrats and eight-meter transects, to account for in-bed diversity as well as on-farm diversity. Both methodologies counted all visually identifiable crop plants and non-crop plants (flowers). Iterations of transect counts were determined by overall farm size with larger farms requiring six to nine transect counts and smaller farms only three. Crop biodiversity was measured five times on each farm over the duration of the research. Weed abundance and diversity were measured using in-bed quadrat counts and categorized as broadleaf and/or grasses. More developed weeds were identified to morphospecies.
2.5. Management Practices
Information on common land management and farming practices (see Appendix A) such as crop rotations, cover cropping, use of mulch, intercropping, on-site composting, soil management practices, pest control strategies, weed management were collected during the open-ended survey (Table 2). Confirmation of practices implemented on the farm were ground-truthed over several visits to the farm. In some cases, community farms were managed individually rather than collectively. In most cases we observed common practices among plots and generalized these as commonly used on the site, however, not all participants can be expected to use uniform management practices, and not all practices are visually observable, especially in the context of soil amendments and pest management practices (excluding pesticide use which was always prohibited on all research sites). For analysis, practices including crop rotations, cover-crops, intercropping, mulching, application of soil amendments including compost, manure and fish emulsion, composting on-site and no-till practices were aggregated to create an overall management-intensity index.
2.6. Data Analysis
Data analysis focused on the spatial composition of farms and how spatial composition, including proportions or production space, natural habitat and infrastructure were related to the overall farm size. We analyzed on-farm spatial composition using regression and classification trees (CART) in the package rpart in R [67]. Management practice occurrences were measured and used as explanatory variables for proportion of weed coverage (weed density) and estimated productivity (EP). Weed density was checked for normality using a Shapiro–Wilks Test, and for homogeneity of variance using Levene’s test. Weed data were analyzed using a non-parametric Kruskal–Wallis test with Dunn’s post hoc analysis.
3. Results
3.1. On-Farm Composition
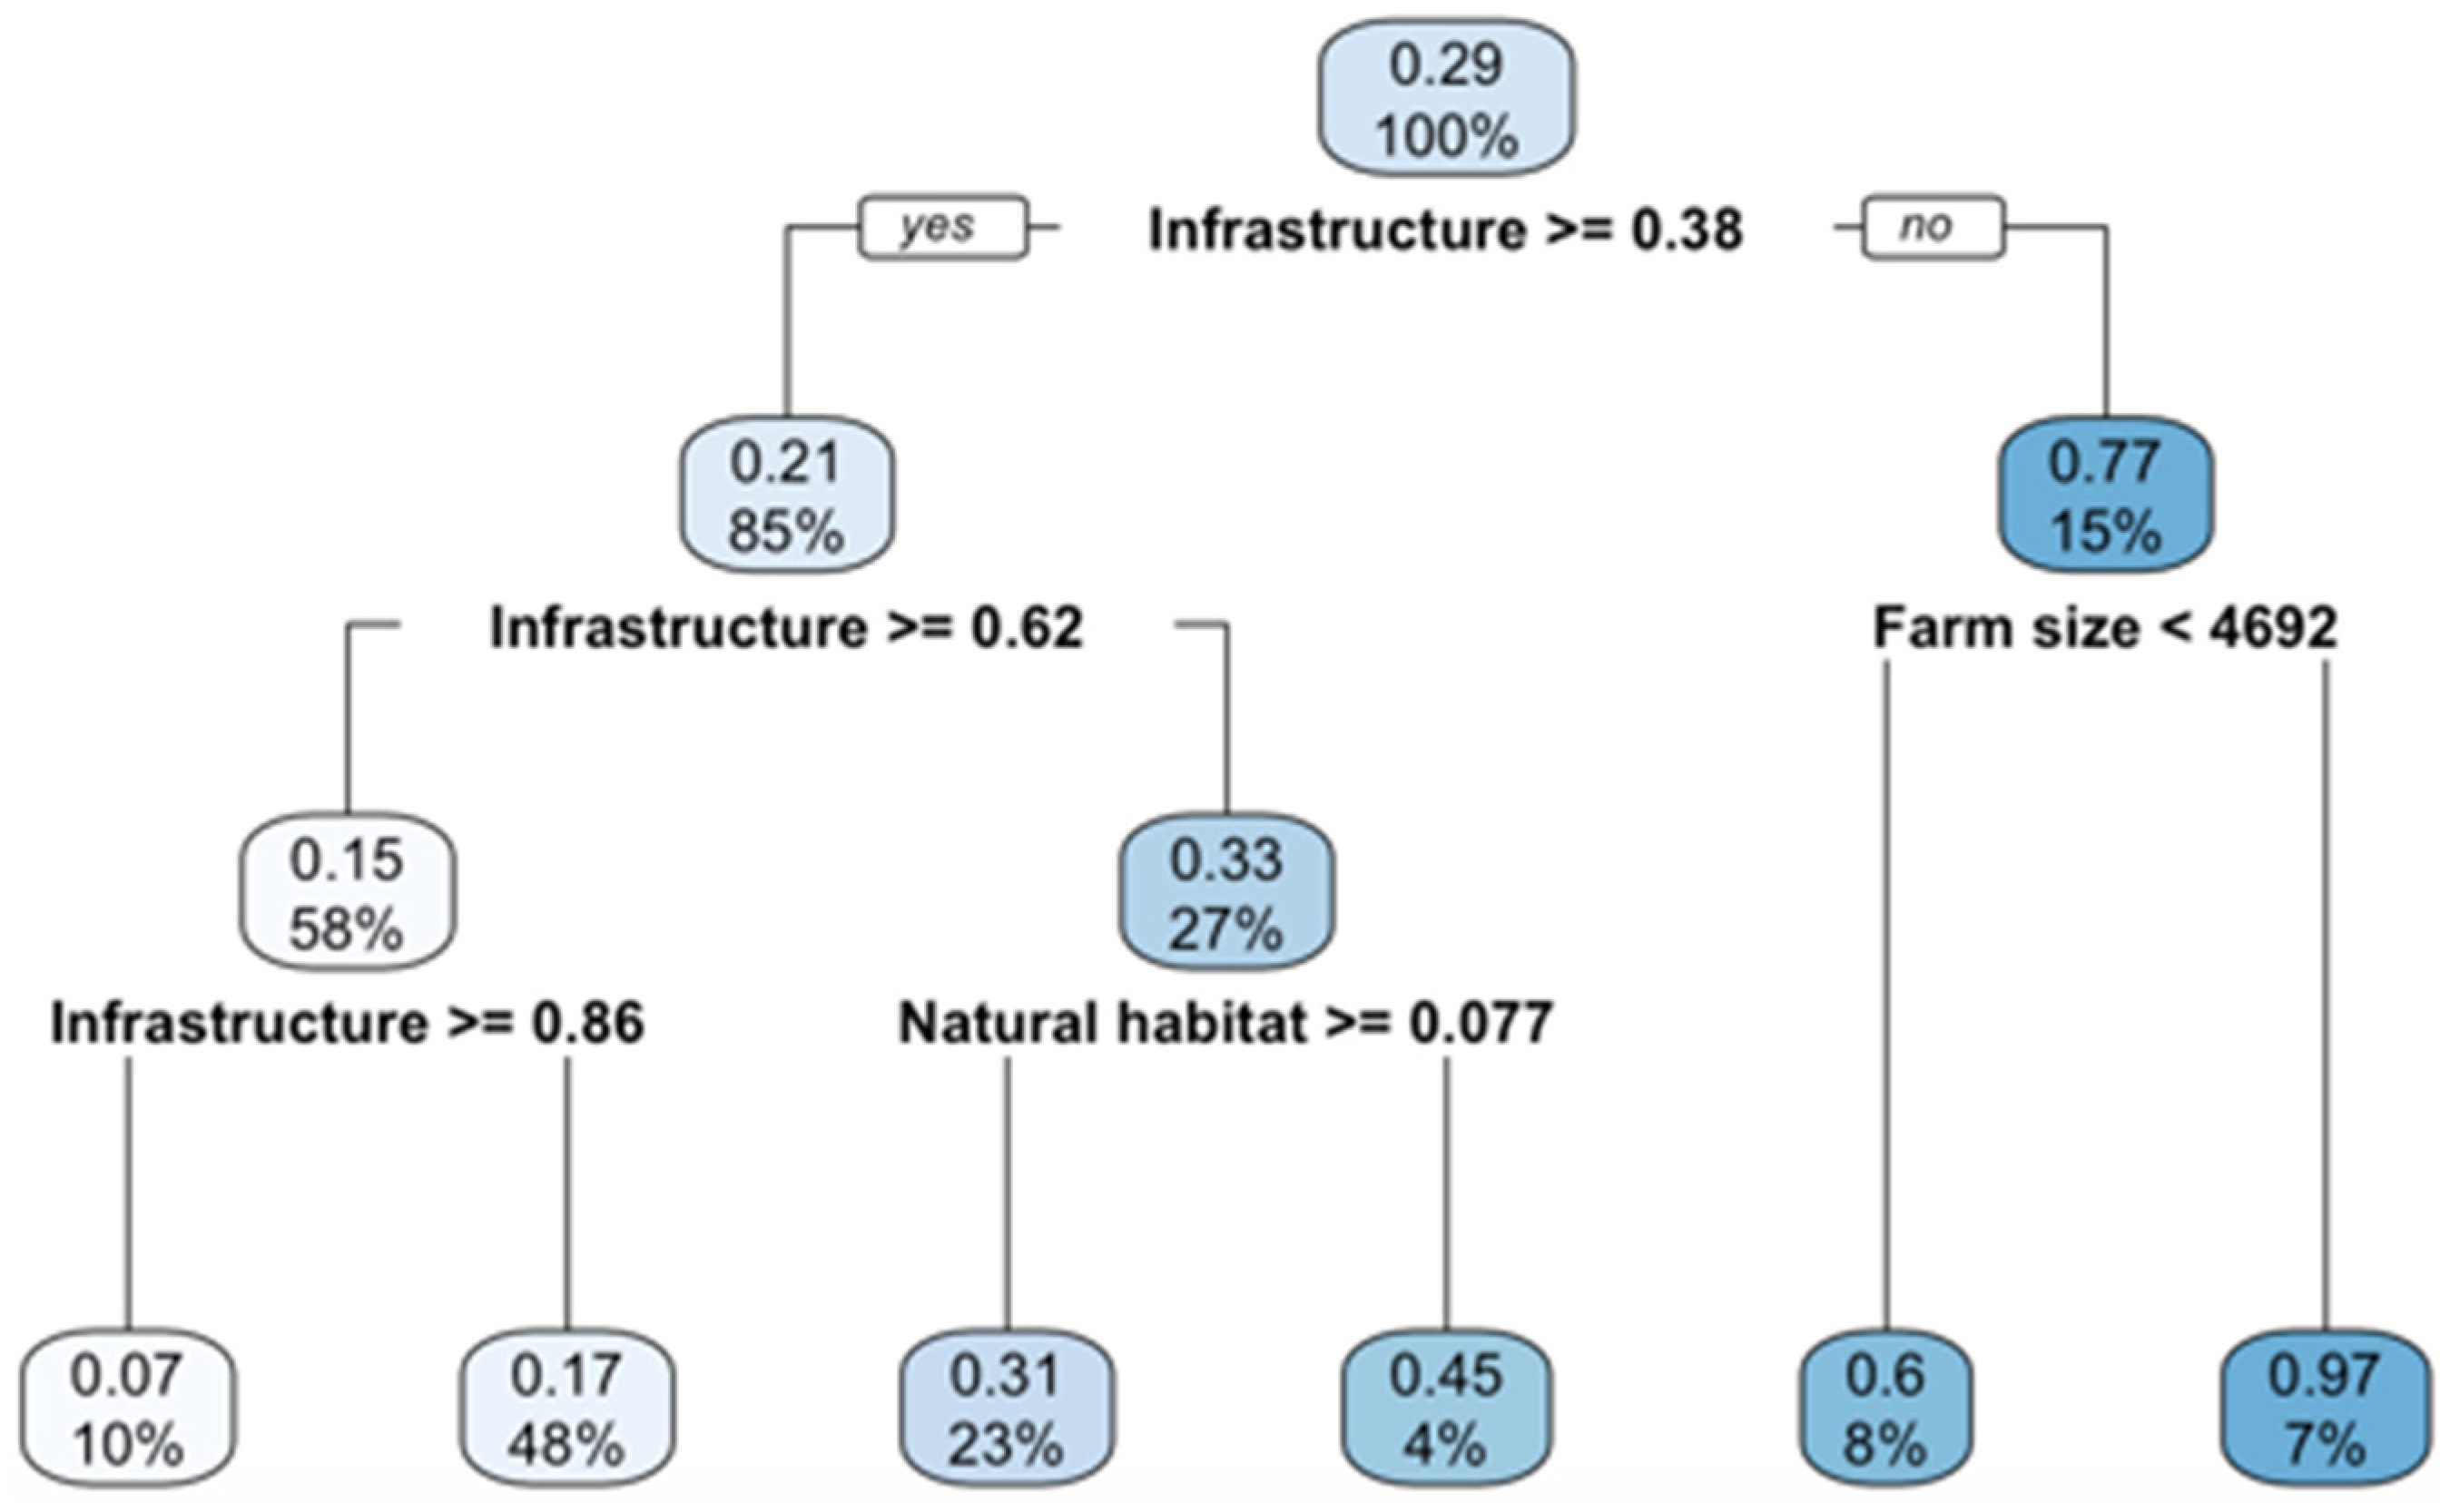
For analysis we questioned how on-farm land use categories and overall size influenced the proportion of production, natural habitat and infrastructure. We used classification and regression trees (CART) to look at predictors of the three land use categories. CART analysis indicated that the proportion of production was best predicted by overall proportion of on-farm infrastructure. In total, 85% of farms had over 40% of their overall area committed to farm infrastructure, and 58% of those farms had infrastructure in excess of 62% of overall farm size. Infrastructure was by far the largest on-farm land use category, accounting for an average of (57%) in all farms measured (Figure 2). When accounting for other non-production land use, an average of 68% of on-farm area was not utilized for food production. Overall size of farms was a poor predictor of any other land use type.
3.2. On-Farm Management Practices
Survey results and ground-proofing indicate that agroecological management practices have been widely adopted throughout East Bay urban farms and gardens. Almost all farms assessed incorporated inter-cropping as well as cover cropping and applied compost. Indexed management practices (crop rotations, cover crops, intercropping, compost, manure, and fish emulsion applications, on-site composting, no-till practices and whether or not plots were mulched) when compared with mean estimated productivity, weed density and overall crop biodiversity did not have a significant effect.
3.2.1. Crop and Non-Crop Diversity
Crop richness was measured both using quadrats and transects to better capture overall farm crop diversity. Mean quadrat diversity (n = 933) was 2.97 crops/m2. Eight-meter transect count averaged 10.28 crops. Management intensity as indexed by measured agroecological practices did have a weak correlation with crop biodiversity, but this is not reported as crop biodiversity was largely a mechanism of crop selection by urban farmers. Crop biodiversity and management intensity are interesting in the sense that crop biodiversity on site may be a proxy for agroecological management practices.
3.2.2. Weed Occurrence
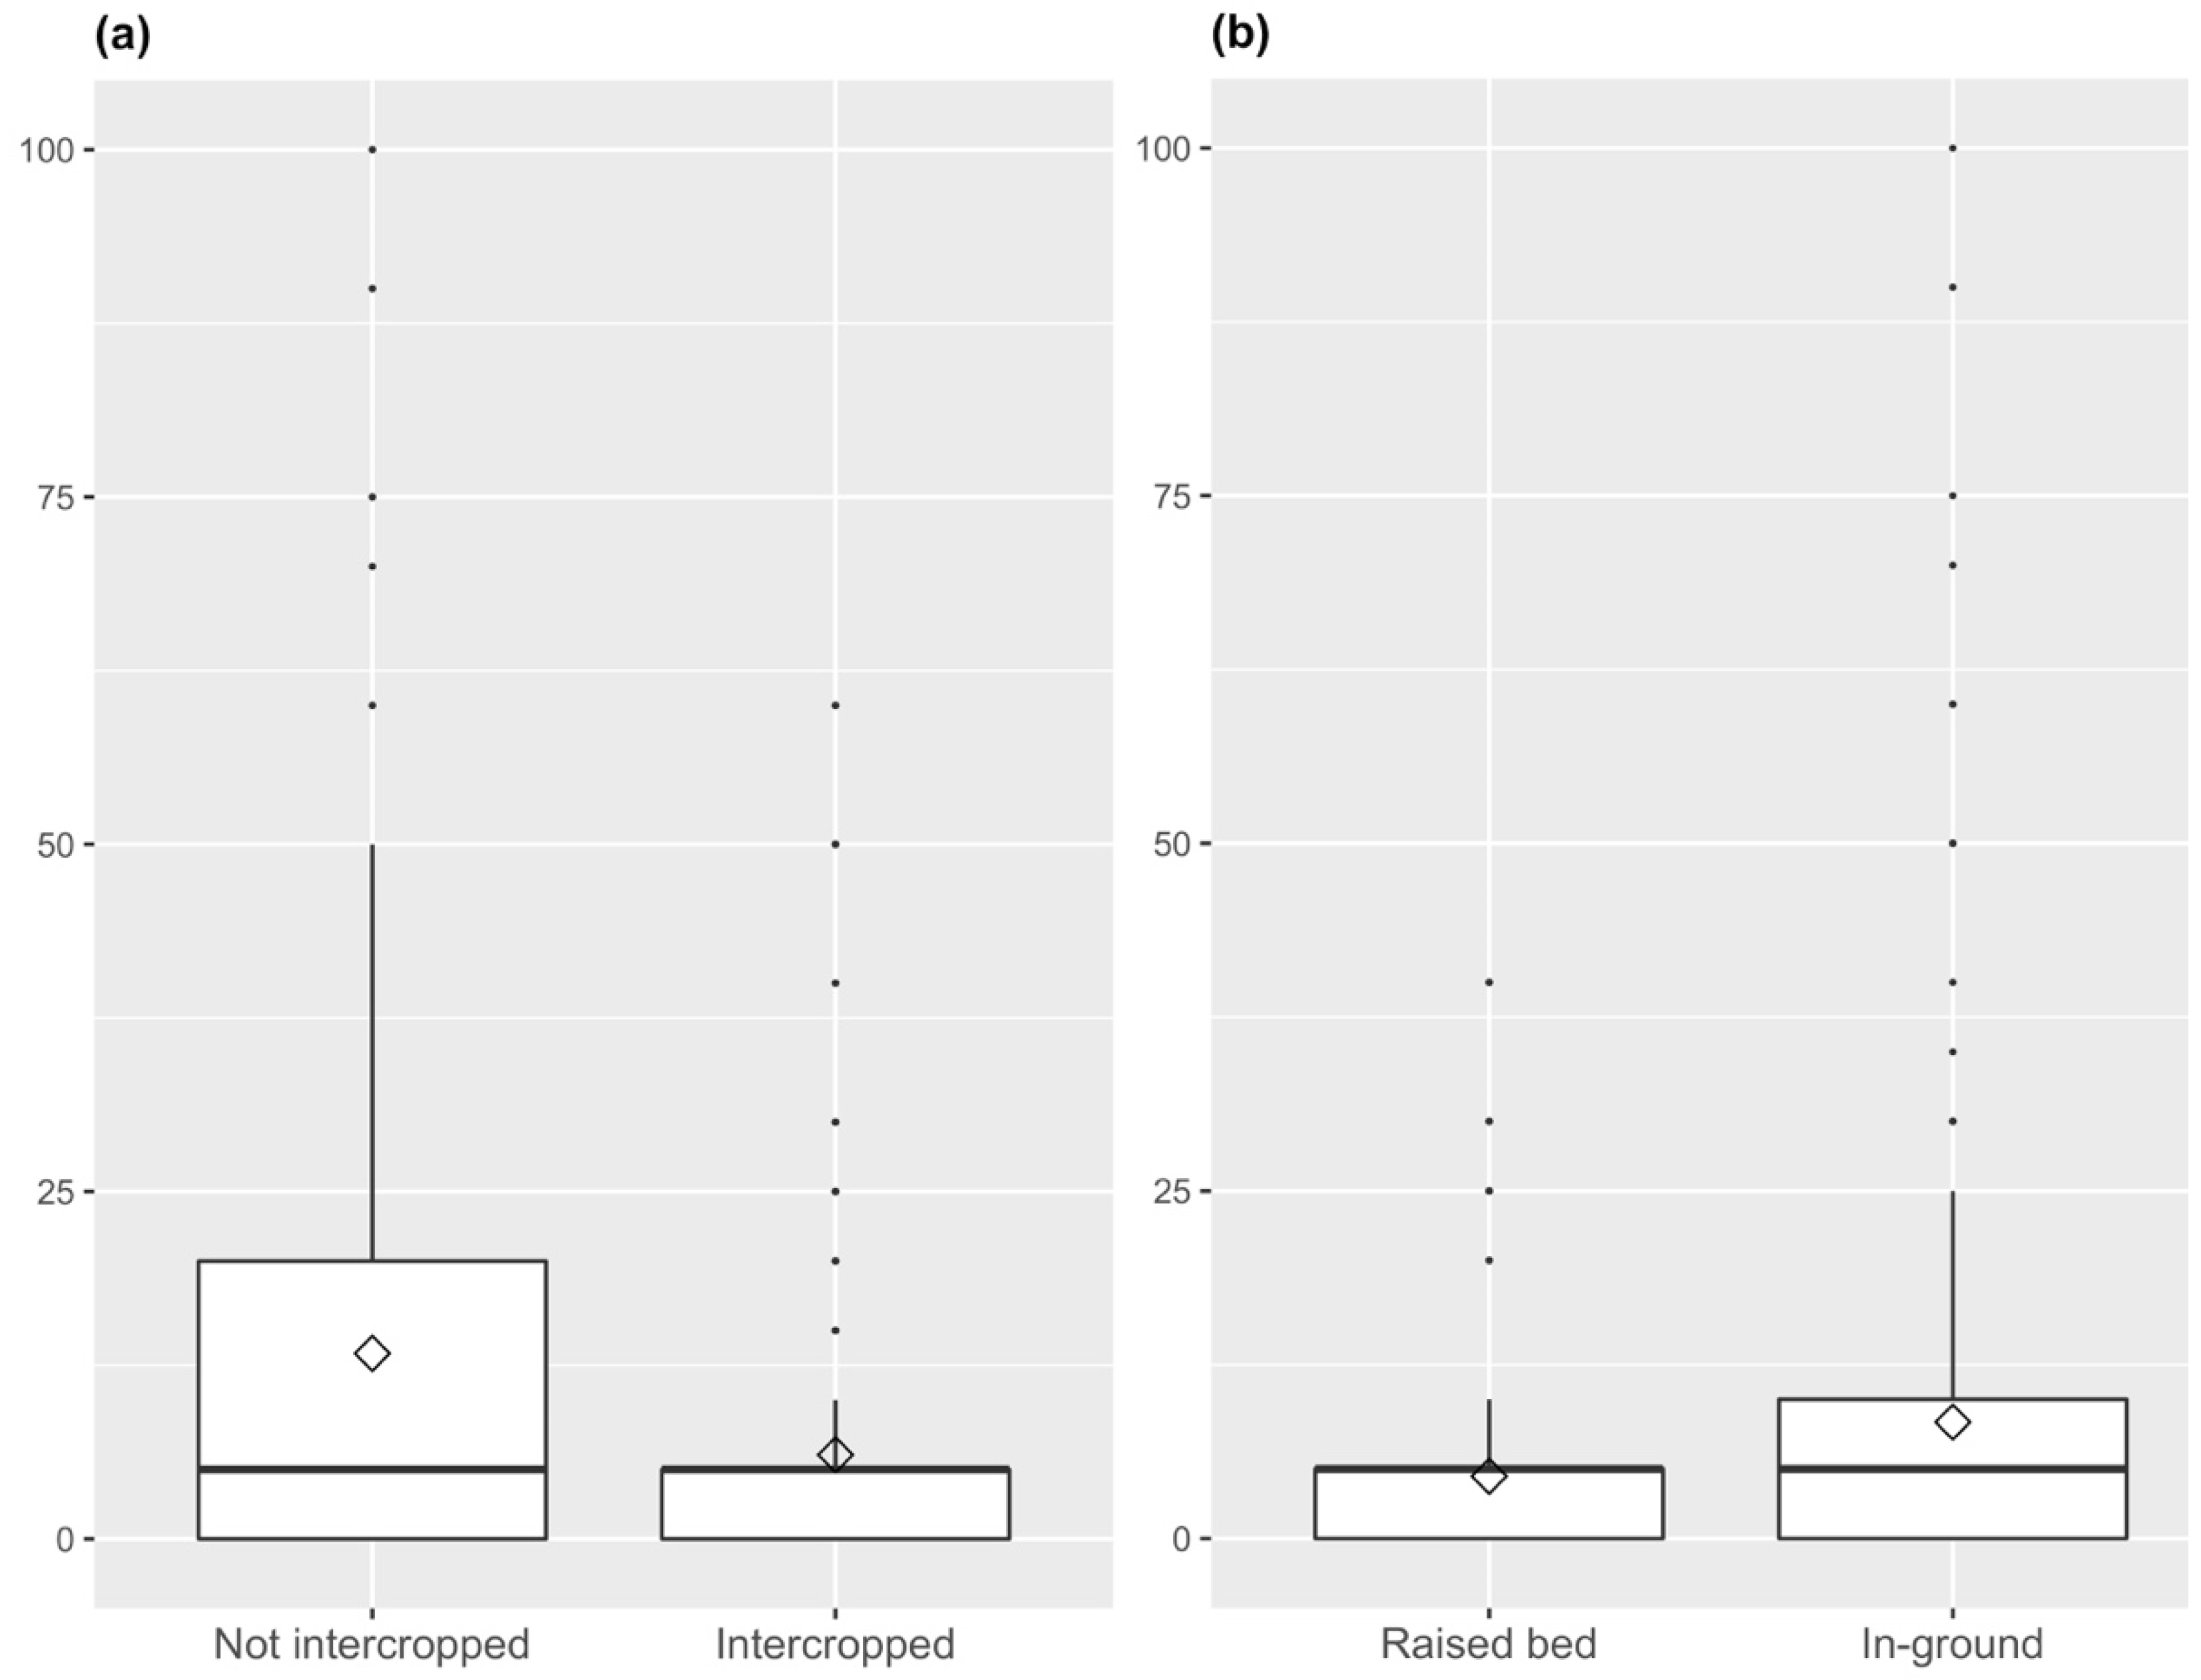
Overall weed coverage per quadrat was measured over two years. Average weed coverage in quadrats was 7%. Broadleaf weeds were found in a greater proportion than grass weeds. Approximately 40% of sampled quadrats had no weeds (Table 3). A non-parametric Kruskal–Wallis test revealed that there was a statistically significant difference in weed percentages per unit of area between intercropped and not intercropped quadrats (H (1) = 7.1671, p = 0.007), and raised bed and in-ground production (H (1) = 30.434, p = 0.001) (Figure 3).
3.2.3. Management Practices and Estimated Productivity
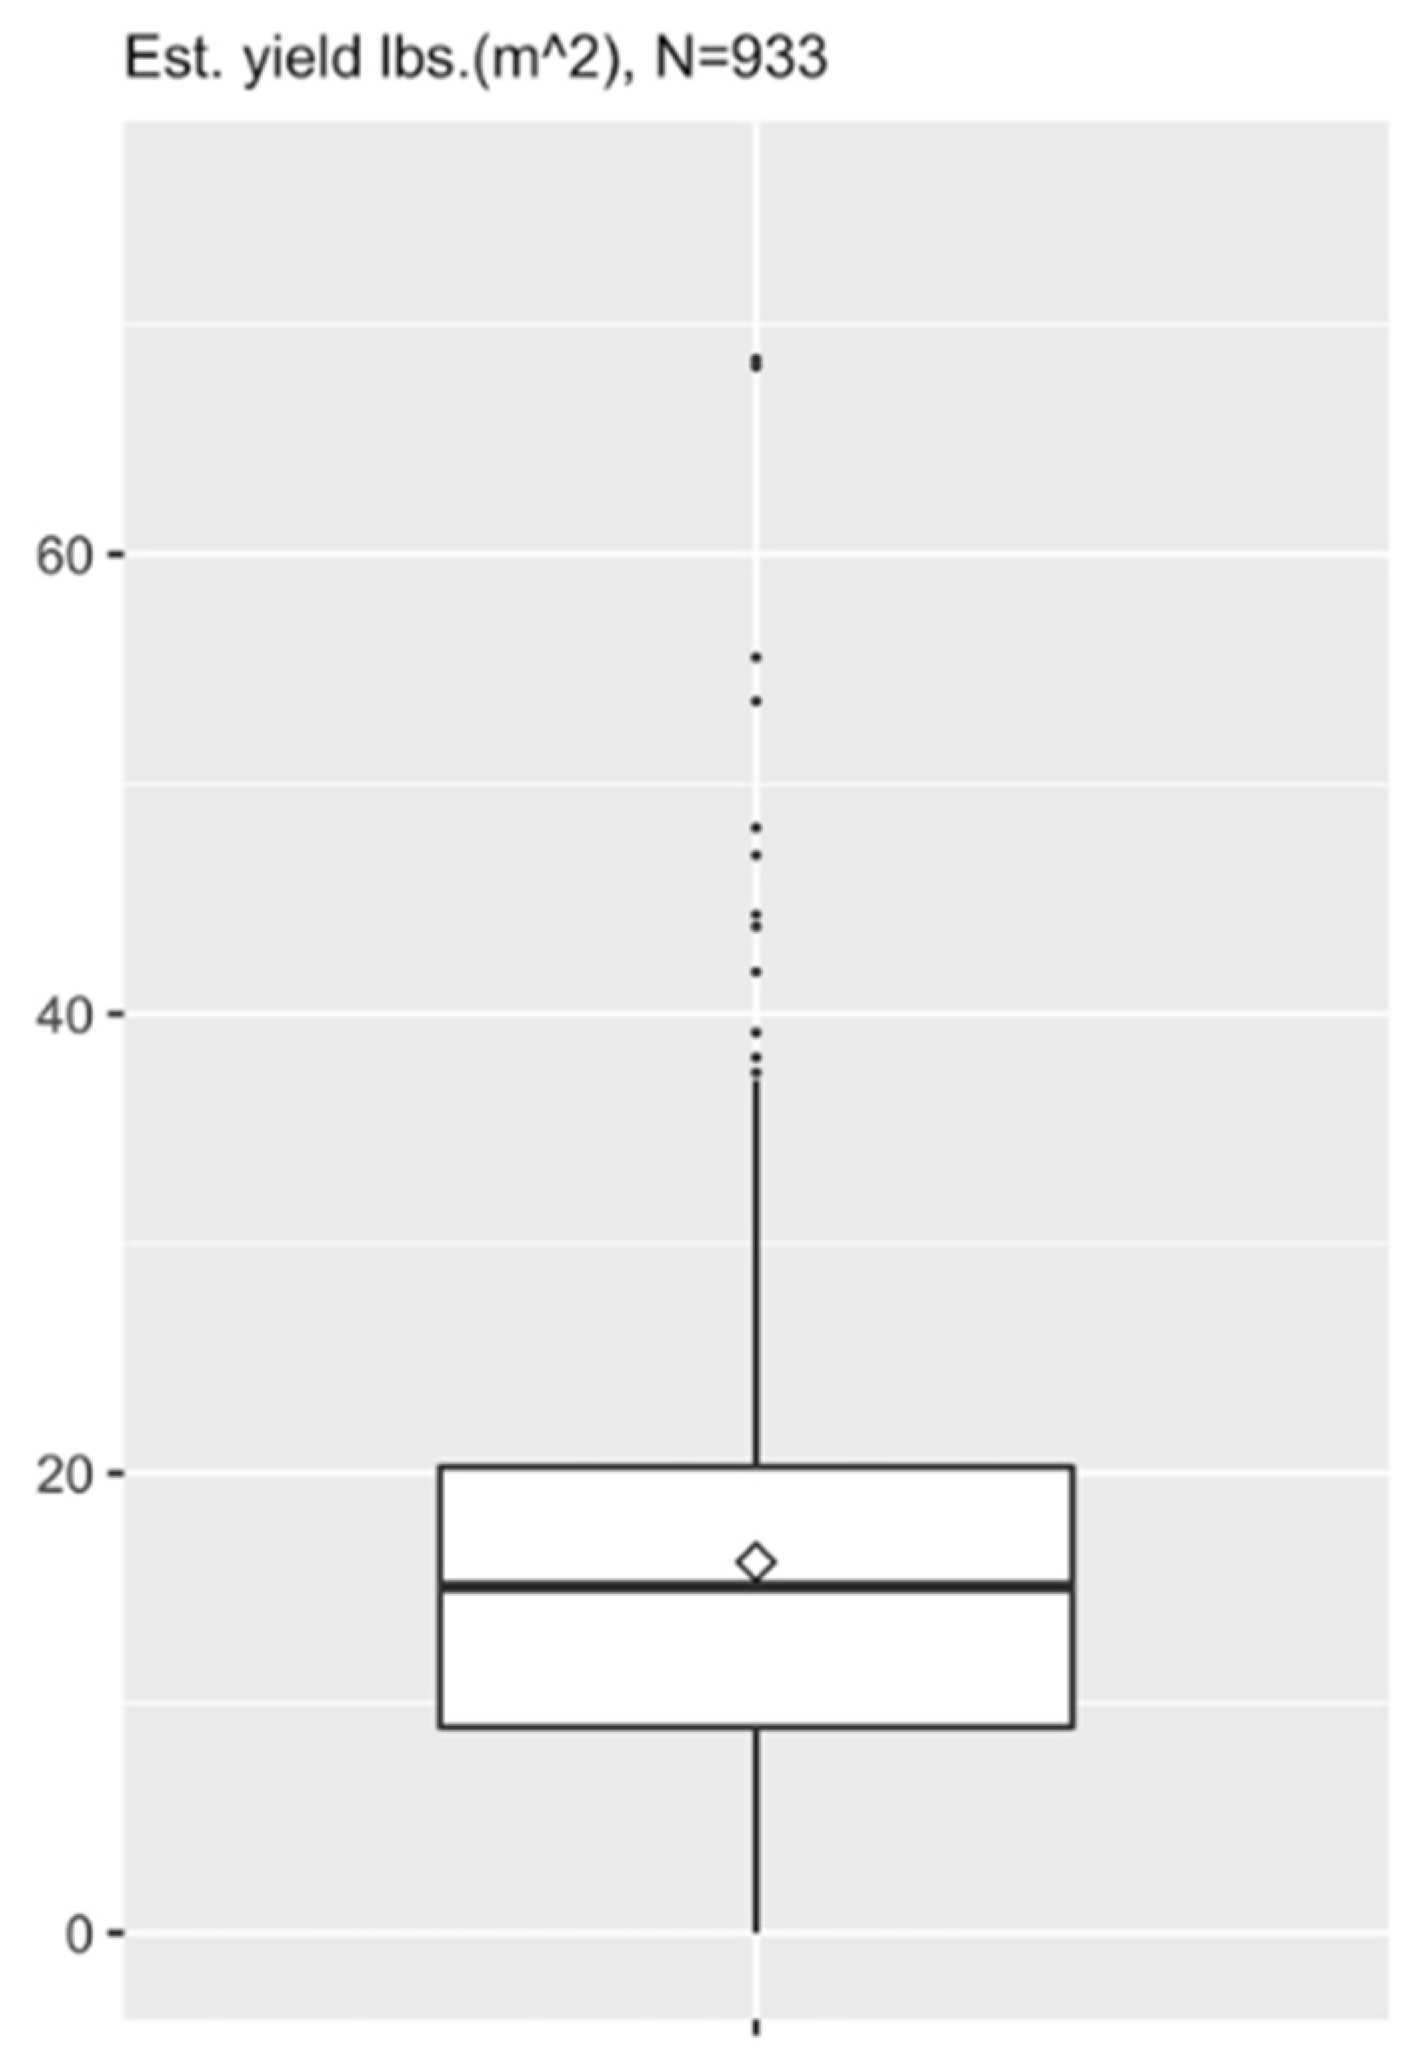
Estimated productivity was calculated per square meter quadrat (n = 933) at 20 urban agriculture sites. Using yield estimates per plant/quadrat, and total farm production space, we estimate that sampled urban farms produce 7.14 kg/square meter (Figure 4). As productivity estimates were not measures of true production, we used actual yields from two large urban farms that recorded total seasonal yield and divided that number by their overall production area. Our estimates closely matched comparative true yields (8.6 kg/m2) by weight and area of production on these two farms. Estimated yields were comparable to previous studies of urban farm production, including Grewal & Grewal (2010) [68], that estimated on-farm productivity at 6.20 kg/m2 under their intensive urban gardening scenario. As well as Gittleman et al. (2012) [59] who measured productivity at over 500 urban farms and found actual yields between 5.85 kg/m2 and 1.6 kg/m2).
3.2.4. Disposition of Harvest
Aggregated survey data indicate that harvests are distributed in the following proportions: 69% of harvests go to the farmers’ families or the community surrounding the farm who are affiliated or familiar with the farm operations. In total, 10% of harvests go to farmers markets or Community Supported Agriculture (CSAs) supporting the organizations (or members) economically. A total of 10% of the harvest goes to organizations that are directly helping vulnerable populations (i.e., shelters and community kitchens).
4. Discussion
Developing a better understanding of the agroecological elements of urban farms will be an important topic in an increasingly urbanized world. Previous analysis suggests that worldwide urban food production can significantly impact global food requirements [56]. However, as urban populations grow, urban land becomes increasingly valuable, and the “highest and best use” of vacant urban land may limit the implementation of UA. Production capability impacts on local food security, and the overall economic efficacy of UA will be crucial in promoting and prioritizing it in future and current urban food systems [34,35]. Further, developing a better understanding of the multi-functionality of UA, including the social, economic and ecological benefits these systems provide, can better help policymakers and urban planners bolster UA, acknowledging its utility and benefit in the built environment. Understanding spatial composition trends, management practices and production potential are important and understudied topics that contribute to our understanding of urban farms’ form and function. This research provides data and context that may influence future discussions regarding the viability and efficacy of UA.
4.1. Spatial Composition and Potential Productivity of Urban Farms
A deeper understanding of UA production capabilities, especially in the context of on-farm land use, is an important topic when questioning the efficacy of urban food production on high-value urban land. Urban land cycles are largely dependent on rent-seeking and attempt to exploit rent gaps for profit by landowners and developers [24]. Developing under-used urban land is often very profitable, counter to UA operations. High land values consistently challenge urban agriculture systems in the context of “highest and best” use—the concept that land use should always create the most profit. Urban farms are consistently put in a dilemma; they must justify their existence in the context of production. However, if they are not generating substantial profits, their implementation on high-value urban land will always be questioned.
Urban farms also suffer from a fundamental misalignment with “highest and best use” objectives; previously published survey data indicate that urban farm goals are often focused on social goods and food security [55]. Generating profits is often a tertiary goal at best. Despite this misalignment and lack of financial support, estimated yields per unit area are high, with approximately 7.14 kg/square meter of fresh vegetables being grown. Urban farms also significantly impact local food security, with approximately 69% of on-farm production going to the local community.
Our findings indicate that increasing overall production capacity in UA, an important consideration in urban land use, can be linked to on-farm land use. Despite high yields per unit of area, our on-farm spatial analysis found that an average of only 32% of available area is being utilized for production. With land being such a limiting factor of UA adoption, we found that UA sites may not be maximizing potential production area. These findings indicate that overall urban farm size is not a limiting factor to increased production. Two possible explanations may influence underutilization of production area. Firstly, these farms often exist on volunteer labor and often lack consistent funding to pay farm managers and employees [55]. Investment, infrastructure and labor may be limiting full production potential. Moreover, these spaces are serving residents more than markets. If local food needs are met there may be less incentive to put additional land into production. Conversely, spatial composition, especially in the context of production area, may be influenced by management practices. The three farms with the highest proportion of production area all utilized in ground management practices. Contrariwise, UA sites with the most significant proportion of infrastructure (and minimal production area) all utilized raised beds in their production systems.
Raised-bed production is often linked to concerns about soil health or security of tenure. Raised-bed production can help mitigate potential soil contamination issues, often found in UA. This production practice is also modular and can be broken down and moved in cases of insecure tenure. In summary, UA production is not limited by yields per unit of area but more explicitly linked to social–ecological factors that prohibit the full implementation of long-term, in-ground production systems.
4.2. Agroecological Management Practices on Urban Farms
We found that implementation of sustainable farming practices is widespread among urban farmers and practiced across measured sites. Intercropping, cover-cropping and soil building practices are common and often practiced simultaneously (Table 2).
Adoption of sustainable farming practices may be in response to abiotic and ecological challenges faced by converting impacted urban land into productive farms. Crop rotations, cover-cropping, mulching and manure and compost application were often cited during interviews with farm managers as strategies to remediate impacted urban soils. Management practices were also frequently cited as strategies used in response to pest and weed pressures. Weeds were prevalent in all measured sites, but broadleaf weeds were most pervasive and were especially abundant for in-ground production systems as opposed to raised beds. Average weed coverage in quadrats was reduced by the implementation of intercropping. These results have important similarities to findings in rural agricultural systems and show that these practices can be implemented at small scales in novel urban agroecosystems.
5. Conclusions
Our findings help us better understand urban farm spatial composition and management practices. We found that urban farms are diverse in spatial composition, have adopted a broad spectrum of agroecological management practices, are highly productive and directly impact local food security. We were unable to link specific practices to increased production per area unit, but we found that intercropping can decrease weed occurrence. Underutilization of available farm area for production was prevalent. We propose that production limits are linked to social and economic factors that prohibit urban farms from developing high-yielding, in-ground production systems. Our findings on UA form and function give us a better understanding of how urban farms function in the landscape. However, they are often under-supported and often suffer from insecure tenure, limiting their potential impact [55,69]. Despite these limitations, UA systems continue to impact local food security and provide a myriad of social goods to local communities. Changing perspectives of how UA systems function and their social and economic benefits will be of great importance for their continued existence in high-cost cities.
Summary: UA sites are incredibly productive and have the potential to provide a suite of both social, economic and ecological services to surrounding communities. This research addresses some of the enduring questions about urban agroecological form and function, and details information valuable to planners, policy makers, urban ecologists and urban farmers.
Funding
This research was funded by the Berkeley Food Institute Seed Grant Program, and the APC was funded by the UC Berkeley Research Impact Initiative (BRII) sponsored by the UC Berkeley Library.
Institutional Review Board Statement
Not applicable.
Informed Consent Statement
Not applicable.
Data Availability Statement
Data available upon request.
Conflicts of Interest
The authors declare no conflict of interest.
Appendix A

Table A1.
Scheme. Survey questions.
| Scheme. Survey Questions. |
|---|
|
|
|
|
|
|
|
|
|
|
|
|
|
|
|
|
|
|
|
|
|
|
|
|
|
|
|
|
|
|
|
|
|
|
|
|
|
|
|
|
|
|
|
|
|
|
|
|
|
|
|
|
|
|
Table A2.
Farm participation in research (not all farms participated in all aspects of this survey).
Table A2.
Farm participation in research (not all farms participated in all aspects of this survey).
| Farm Participation (n = 29) | |||||||
|---|---|---|---|---|---|---|---|
| Survey | Production Area | Size | Impervious Surface (%) | Yield | Weeds | Ground Cover | Crop Biodiversity |
| 25 | 25 | 25 | 12 | 17 | 15 | 13 | 13 |
| 86% | 86% | 86% | 41% | 58% | 51% | 44% | 44% |
Table A3.
Description of on-farm management practices.
| Inter-cropping | Growing of two or more crops simultaneously in close proximity |
| Mulch | Using organic matter, often fallen leaves or wood chips, to cover bare soil in production areas |
| Crop rotations | Spatially shifting cultivation of particular crop families seasonally |
| Green manure | Incorporating green crop residues into the soil |
| Double-digging | Method of incorporating organic matter into garden beds through hand-tillage. The method is typically attributed to the French-intensive style of gardening. |
| No-till | Soil management practices that reduce disturbance of soils. This technique is regionally associated with soil management practices similar to those implemented at Singing Frog Farms in Sebastopol, California |
Table A4.
Descriptive statistics, Kruskal–Wallis test (Weed %/m2).
| Descriptive Statistics, Kruskal–Wallis Test (Weed %/m2) | ||||||||||
|---|---|---|---|---|---|---|---|---|---|---|
| H | DF | p-Value | Z | n | Mean | sd | Min | Max | % zero | |
| 30.434 | 1 | 3.45 × 10⁻⁸ | −5.516696 | - | - | - | - | - | - | |
| Raised bed production | - | - | - | - | 372 | 4.47 | 6.95 | 0 | 40 | 0.48 |
| In-ground production | - | - | - | - | 560 | 8.36 | 12.79 | 0 | 100 | 0.34 |
| 7.1671 | 1 | 7.43 × 10⁻³ | 2.677151 | - | - | - | - | - | - | |
| Not intercropped | - | - | - | - | 97 | 13.350516 | 20.26802 | 0 | 100 | 0.38 |
| Intercropped | - | - | - | - | 835 | 6.053892 | 9.080811 | 0 | 60 | 0.4 |
References
- Caruso, C.C.; McClintock, N.; Myers, G.; Weissman, E.; Herrera, H.; Block, D.; Reynolds, K. Beyond the Kale: Urban Agriculture and Social Justice Activism in New York City. The AAG Review of Books 2016, 4, 234–243. [Google Scholar] [CrossRef] [Green Version]
- Lawson, L.J. City Bountiful: A Century of Community Gardening in America; University of California Press: Berkeley, CA, USA, 2005. [Google Scholar]
- Lin, B.B.; Philpott, S.M.; Jha, S. The Future of Urban Agriculture and Biodiversity-Ecosystem Services: Challenges and next Steps. Basic Appl. Ecol. 2015, 16, 189–201. [Google Scholar] [CrossRef]
- McClintock, N. Why Farm the City? Theorizing Urban Agriculture through a Lens of Metabolic Rift. Camb. J. Reg. Econ. Soc. 2010, 3, 191–207. [Google Scholar] [CrossRef] [Green Version]
- Mougeot, L.J. Urban Agriculture: Definition, Presence, Potentials and Risks, and Policy Challenges; Cities Feeding People Series; Report 31; International Development Research Centre: La Habana, Cuba, 1999. [Google Scholar]
- Zezza, A.; Tasciotti, L. Urban Agriculture, Poverty, and Food Security: Empirical Evidence from a Sample of Developing Countries. Food Policy 2010, 35, 265–273. [Google Scholar] [CrossRef]
- Arnold, J.E.; Egerer, M.; Daane, K.M. Local and Landscape Effects to Biological Controls in Urban Agriculture—A Review. Insects 2019, 10, 215. [Google Scholar] [CrossRef] [PubMed] [Green Version]
- Tscharntke, T.; Tylianakis, J.M.; Rand, T.A.; Didham, R.K.; Fahrig, L.; Batáry, P.; Bengtsson, J.; Clough, Y.; Crist, T.O.; Dormann, C.F.; et al. Landscape Moderation of Biodiversity Patterns and Processes—Eight Hypotheses. Biol. Rev. 2012, 87, 661–685. [Google Scholar] [CrossRef] [PubMed]
- Faeth, S.H.; Bang, C.; Saari, S. Urban Biodiversity: Patterns and Mechanisms: Urban Biodiversity. Ann. N. Y. Acad. Sci. 2011, 1223, 69–81. [Google Scholar] [CrossRef] [PubMed] [Green Version]
- Gaertner, M.; Wilson, J.R.U.; Cadotte, M.W.; MacIvor, J.S.; Zenni, R.D.; Richardson, D.M. Non-Native Species in Urban Environments: Patterns, Processes, Impacts and Challenges. Biol. Invasions 2017, 19, 3461–3469. [Google Scholar] [CrossRef] [Green Version]
- Kruess, A.; Tscharntke, T. Habitat Fragmentation, Species Loss. And Biological-Control. Science 1994, 264, 1581–1584. [Google Scholar] [CrossRef] [PubMed]
- Tscharntke, T.; Klein, A.M.; Kruess, A.; Steffan-Dewenter, I.; Thies, C. Landscape Perspectives on Agricultural Intensification and Biodiversity—Ecosystem Service Management. Ecol. Lett. 2005, 8, 857–874. [Google Scholar] [CrossRef]
- Burks, J.M.; Philpott, S.M. Local and Landscape Drivers of Parasitoid Abundance, Richness, and Composition in Urban Gardens. Environ. Entomol. 2017, 46, 201–209. [Google Scholar] [CrossRef] [PubMed] [Green Version]
- Christie, F.J.; Hochuli, D.F. Responses of Wasp Communities to Urbanization: Effects on Community Resilience and Species Diversity. J. Insect Conserv. 2009, 13, 213–221. [Google Scholar] [CrossRef]
- Egerer, M.H.; Arel, C.; Otoshi, M.D.; Quistberg, R.D.; Bichier, P.; Philpott, S.M. Urban Arthropods Respond Variably to Changes in Landscape Context and Spatial Scale. J. Urban Ecol. 2017, 3, 1–10. [Google Scholar] [CrossRef] [Green Version]
- Egerer, M.H.; Bichier, P.; Philpott, S.M. Landscape and Local Habitat Correlates of Lady Beetle Abundance and Species Richness in Urban Agriculture. Ann. Entomol. Soc. Am. 2017, 110, 97–103. [Google Scholar] [CrossRef]
- Fenoglio, M.S.; Salvo, A.; Estallo, E.L. Effects of Urbanisation on the Parasitoid Community of a Leafminer. Acta Oecol. 2009, 35, 318–326. [Google Scholar] [CrossRef]
- Fenoglio, M.S.; Videla, M.; Salvo, A.; Valladares, G. Beneficial Insects in Urban Environments: Parasitism Rates Increase in Large and Less Isolated Plant Patches via Enhanced Parasitoid Species Richness. Biol. Conserv. 2013, 164, 82–89. [Google Scholar] [CrossRef]
- Lagucki, E.; Burdine, J.D.; McCluney, K.E. Urbanization Alters Communities of Flying Arthropods in Parks and Gardens of a Medium-Sized City. PeerJ 2017, 5, e3620. [Google Scholar] [CrossRef] [Green Version]
- Matteson, K.C.; Langellotto, G.A. Small Scale Additions of Native Plants Fail to Increase Beneficial Insect Richness in Urban Gardens: Native Plant Additions in Urban Gardens. Insect Conserv. Divers. 2011, 4, 89–98. [Google Scholar] [CrossRef]
- Morales, H.; Ferguson, B.; Marín, L.; Gutiérrez, D.; Bichier, P.; Philpott, S. Agroecological Pest Management in the City: Experiences from California and Chiapas. Sustainability 2018, 10, 2068. [Google Scholar] [CrossRef] [Green Version]
- Otoshi, M.D.; Bichier, P.; Philpott, S.M. Local and Landscape Correlates of Spider Activity Density and Species Richness in Urban Gardens. Environ. Entomol. 2015, 44, 1043–1051. [Google Scholar] [CrossRef] [Green Version]
- Philpott, S.M.; Cotton, J.; Bichier, P.; Friedrich, R.L.; Moorhead, L.C.; Uno, S.; Valdez, M. Local and Landscape Drivers of Arthropod Abundance, Richness, and Trophic Composition in Urban Habitats. Urban Ecosyst. 2014, 17, 513–532. [Google Scholar] [CrossRef] [Green Version]
- Smith, N. The New Urban Frontier, Gentrification and the Revanchist City; 11 New Fetter Lane, London EC4P 4EE; Routledge: London, UK, 1996. [Google Scholar]
- Sperling, C.D.; Lortie, C.J. The Importance of Urban Backgardens on Plant and Invertebrate Recruitment: A Field Microcosm Experiment. Urban Ecosyst. 2010, 13, 223–235. [Google Scholar] [CrossRef]
- Egerer, M.H.; Liere, H.; Bichier, P.; Philpott, S.M. Cityscape Quality and Resource Manipulation Affect Natural Enemy Biodiversity in and Fidelity to Urban Agroecosystems. Landsc. Ecol. 2018, 33, 985–998. [Google Scholar] [CrossRef] [Green Version]
- Egerer, M.H.; Liere, H.; Lin, B.B.; Jha, S.; Bichier, P.; Philpott, S.M. Herbivore Regulation in Urban Agroecosystems: Direct and Indirect Effects. Basic Appl. Ecol. 2018, 29, 44–54. [Google Scholar] [CrossRef] [Green Version]
- Mace-Hill, K.C. Understanding, Using, and Promoting Biological Control: From Commercial Walnut Orchards to School Gardens. Ph.D. Dissertation, University of California Berkeley, Berkeley, CA, USA, 2015. [Google Scholar]
- Lowenstein, D.M.; Minor, E.S. Herbivores and Natural Enemies of Brassica Crops in Urban Agriculture. Urban Ecosyst. 2018, 21, 519–529. [Google Scholar] [CrossRef]
- Lowenstein, D.M.; Gharehaghaji, M.; Wise, D.H. Substantial Mortality of Cabbage Looper (Lepidoptera: Noctuidae) From Predators in Urban Agriculture Is Not Influenced by Scale of Production or Variation in Local and Landscape-Level Factors. Environ. Entomol. 2016, 46. [Google Scholar] [CrossRef] [PubMed]
- Smith, R.M.; Warren, P.H.; Thompson, K.; Gaston, K.J. Urban Domestic Gardens (VI): Environmental Correlates of Invertebrate Species Richness. Biodivers. Conserv. 2006, 15, 2415–2438. [Google Scholar] [CrossRef]
- Qian, Y.; Zhou, W.; Yu, W.; Pickett, S.T.A. Quantifying Spatiotemporal Pattern of Urban Greenspace: New Insights from High Resolution Data. Landsc. Ecol. 2015, 30, 1165–1173. [Google Scholar] [CrossRef]
- Haan, N.L.; Zhang, Y.; Landis, D.A. Predicting Landscape Configuration Effects on Agricultural Pest Suppression. Trends Ecol. Evol. 2020, 35, 175–186. [Google Scholar] [CrossRef] [PubMed] [Green Version]
- Horst, M.; McClintock, N.; Hoey, L. The Intersection of Planning, Urban Agriculture, and Food Justice: A Review of the Literature. J. Am. Plan. Assoc. 2017, 83, 277–295. [Google Scholar] [CrossRef] [Green Version]
- Siegner, A.; Sowerwine, J.; Acey, C. Does Urban Agriculture Improve Food Security? Examining the Nexus of Food Access and Distribution of Urban Produced Foods in the United States: A Systematic Review. Sustainability 2018, 10, 2988. [Google Scholar] [CrossRef] [Green Version]
- Wortman, S.E.; Lovell, S.T. Environmental Challenges Threatening the Growth of Urban Agriculture in the United States. J. Environ. Qual. 2013, 42, 1283. [Google Scholar] [CrossRef] [PubMed]
- Lehmann, A.; Stahr, K. Nature and Significance of Anthropogenic Urban Soils. J. Soils Sediments 2007, 7, 247–260. [Google Scholar] [CrossRef]
- White, C.S.; McDonnell, M.J. Nitrogen Cycling Processes and Soil Characteristics in an Urban versus Rural Forest. Biogeochemistry 1988, 5, 243–262. [Google Scholar] [CrossRef]
- Casey, J.; James, P.; Cushing, L.; Jesdale, B.; Morello-Frosch, R. Race, Ethnicity, Income Concentration and 10-Year Change in Urban Greenness in the United States. Int. J. Environ. Res. Public Health 2017, 14, 1546. [Google Scholar] [CrossRef] [PubMed] [Green Version]
- Heynen, N. Green Urban Political Ecologies: Toward a Better Understanding of Inner-City Environmental Change. Environ. Plan. A 2006, 38, 499–516. [Google Scholar] [CrossRef]
- Loper, S.; Shober, A.L.; Wiese, C.; Denny, G.C.; Stanley, C.D.; Gilman, E.F. Organic Soil Amendment and Tillage Affect Soil Quality and Plant Performance in Simulated Residential Landscapes. HortScience 2010, 45, 1522–1528. [Google Scholar] [CrossRef] [Green Version]
- Bowles, T.M.; Mooshammer, M.; Socolar, Y.; Calderón, F.; Cavigelli, M.A.; Culman, S.W.; Deen, W.; Drury, C.F.; Garcia y Garcia, A.; Gaudin, A.C.M.; et al. Long-Term Evidence Shows That Crop-Rotation Diversification Increases Agricultural Resilience to Adverse Growing Conditions in North America. One Earth 2020, 2, 284–293. [Google Scholar] [CrossRef]
- Feng, H.; Sekaran, U.; Wang, T.; Kumar, S. On-Farm Assessment of Cover Cropping Effects on Soil C and N Pools, Enzyme Activities, and Microbial Community Structure. J. Agric. Sci. 2021, 159, 216–226. [Google Scholar] [CrossRef]
- Sharma, P.; Singh, A.; Kahlon, C.S.; Brar, A.S.; Grover, K.K.; Dia, M.; Steiner, R.L. The Role of Cover Crops towards Sustainable Soil Health and Agriculture—A Review Paper. Am. J. Plant Sci. 2018, 9, 1935–1951. [Google Scholar] [CrossRef] [Green Version]
- Taha, H. Urban Climates and Heat Islands: Albedo, Evapotranspiration, and Anthropogenic Heat. Energy Build. 1997, 25, 99–103. [Google Scholar] [CrossRef] [Green Version]
- Dale, A.G.; Frank, S.D. Urban Warming Trumps Natural Enemy Regulation of Herbivorous Pests. Ecol. Appl. 2014, 24, 1596–1607. [Google Scholar] [CrossRef] [PubMed] [Green Version]
- Dale, A.G.; Frank, S.D. Urban Plants and Climate Drive Unique Arthropod Interactions with Unpredictable Consequences. Curr. Opin. Insect Sci. 2018, 29, 27–33. [Google Scholar] [CrossRef] [PubMed]
- Parsons, S.E.; Frank, S.D. Urban Tree Pests and Natural Enemies Respond to Habitat at Different Spatial Scales. J. Urban Ecol. 2019, 5, juz010. [Google Scholar] [CrossRef]
- Turrini, T.; Sanders, D.; Knop, E. Effects of Urbanization on Direct and Indirect Interactions in a Tri-Trophic System. Ecol. Appl. 2016, 26, 664–675. [Google Scholar] [CrossRef] [PubMed]
- Landis, D.A.; Wratten, S.D.; Gurr, G.M. Habitat Management to Conserve Natural Enemies of Arthropod Pests in Agriculture. Annu. Rev. Entomol. 2000, 45, 175–201. [Google Scholar] [CrossRef] [PubMed]
- Letourneau, D.K.; Armbrecht, I.; Rivera, B.S.; Lerma, J.M.; Rrez, C.G.; Rangel, J.H.; Rivera, L.; Saavedra, C.A.; Torres, A.M.; Trujillo, A.R. Does Plant Diversity Benefit Agroecosystems? A Synthetic Review. Ecol. Appl. 2011, 21, 13. [Google Scholar] [CrossRef] [PubMed]
- Liebman, M.; Davis, A.S. Integration of Soil, Crop and Weed Management in Low-External-Input Farming Systems. Weed Res. 2000, 40, 27–47. [Google Scholar] [CrossRef] [Green Version]
- Lundgren, J.G. Ground Beetles as Weed Control Agents: Effects of Farm Management on Granivory. Am. Entomol. 2005, 51, 224–226. [Google Scholar] [CrossRef] [Green Version]
- Sarabi, V. Factors That Influence the Level of Weed Seed Predation: A Review. Weed Biol. Manag. 2019, 19, 61–74. [Google Scholar] [CrossRef]
- Arnold, J.; Rogé, P. Indicators of Land Insecurity for Urban Farms: Institutional Affiliation, Investment, and Location. Sustainability 2018, 10, 1963. [Google Scholar] [CrossRef] [Green Version]
- Clinton, N.; Stuhlmacher, M.; Miles, A.; Uludere Aragon, N.; Wagner, M.; Georgescu, M.; Herwig, C.; Gong, P. A Global Geospatial Ecosystem Services Estimate of Urban Agriculture. Earth’s Futur. 2018, 6, 40–60. [Google Scholar] [CrossRef]
- Martellozzo, F.; Landry, J.-S.; Plouffe, D.; Seufert, V.; Rowhani, P.; Ramankutty, N. Urban Agriculture: A Global Analysis of the Space Constraint to Meet Urban Vegetable Demand. Environ. Res. Lett. 2014, 9, 064025. [Google Scholar] [CrossRef]
- Colasanti, K.; Litjens, C.; Hamm, M. Growing Food in the City: The Production Potential of Detroit’s Vacant Land; The CS Mott Group for Sustainable Food Systems at Michigan State University: East Lansing, MI, USA,, 2010. [Google Scholar]
- Gittleman, M.; Jordan, K.; Brelsford, E. Using Citizen Science to Quantify Community Garden Crop Yields. Cities Environ. (CATE) 2012, 5, 4. [Google Scholar]
- McDougall, R.; Kristiansen, P.; Rader, R. Small-Scale Urban Agriculture Results in High Yields but Requires Judicious Management of Inputs to Achieve Sustainability. Proc. Natl. Acad. Sci. USA 2019, 116, 129–134. [Google Scholar] [CrossRef] [PubMed] [Green Version]
- Wekerle, G.R.; Classens, M. Food Production in the City: (Re)Negotiating Land, Food and Property. Local Environ. 2015, 20, 1175–1193. [Google Scholar] [CrossRef]
- UC Berkeley Committee for Protection of Human Subjects. Available online: https://cphs.berkeley.edu/eprotocol.html (accessed on 17 December 2021).
- Jeavons, J. How to Grow More Vegetables: (And Fruits, Nuts, Berries, Grains, and Other Crops) than You Ever Thought Possible on Less Land than You Can Imagine, 8th ed.; Ten Speed Press: Berkeley, CA, USA, 2012. [Google Scholar]
- Altieri, M.A.; Nicholls, C.I. Agroecología Urbana: Diseño de Granjas Urbanas Ricas En Biodiversidad, Productivas y Resilientes. Agrosur 2018, 46, 49–60. [Google Scholar] [CrossRef] [Green Version]
- Ackerman, K. (Ed.) The Potential for Urban Agriculture in New York City. Growing Capacity, Food Security, & Green Infrastructure; Urban Design Lab at the Earth Institute, Columbia University: New York, NY, USA, 2012; p. 118. [Google Scholar]
- Vitiello, D.; Nairn, M.; Planning, P. Community Gardening in Philadelphia 2008 Harvest Report; Penn Planning and Urban Studies, University of Pennsylvania: Philadelphia, PA, USA, 2009; p. 68. [Google Scholar]
- Therneau, T.; Atkinson, B.; port, B.R. (producer of the initial R.; maintainer 1999–2017). Rpart: Recursive Partitioning and Regression Trees, 2022.
- Grewal, S.S.; Grewal, P.S. Can Cities Become Self-Reliant in Food? Cities 2012, 29, 1–11. [Google Scholar] [CrossRef]
- Daftary-Steel, S.; Herrera, H.; Porter, C. The Unattainable Trifecta of Urban Agriculture. J. Agric. Food Syst. Community Dev. 2015, 6, 19–32. [Google Scholar] [CrossRef] [Green Version]
Figure 1.
Urban farm study sites (n = 29).

Figure 2.
CART analysis of explanatory variables (proportion of infrastructure, non-crop area and overall size) predicting the proportion of production area. When conditions of significance are met, the graph branches and lists the value of the explanatory variable.
Figure 2.
CART analysis of explanatory variables (proportion of infrastructure, non-crop area and overall size) predicting the proportion of production area. When conditions of significance are met, the graph branches and lists the value of the explanatory variable.

Figure 3.
Percent coverage of weeds in intercropped beds and in-ground or bed production. (a) H(1) = 7.1671, p = 0.007; (b) H(1) = 30.434, p = 0.001.
Figure 3.
Percent coverage of weeds in intercropped beds and in-ground or bed production. (a) H(1) = 7.1671, p = 0.007; (b) H(1) = 30.434, p = 0.001.

Figure 4.
Yield estimates in lbs. per square meter.

Table 1.
Farm size and land use composition.
| Farm Size and Land Use Composition (n = 19) | |||||||
|---|---|---|---|---|---|---|---|
| Site | Total size (m2) | Production (m2) | Non-crop (m2) | Infrastructure (m2) | Production (%) | Non-Crop (%) | Infrastructure (%) |
| 1 | 95 | 10.6 | 12 | 72.4 | 0.11 | 0.13 | 0.76 |
| 2 | 117 | 31.3 | 31 | 54.7 | 0.27 | 0.26 | 0.47 |
| 3 | 140 | 24.1 | 24 | 91.9 | 0.17 | 0.17 | 0.66 |
| 4 | 175 | 58.36 | 30 | 86 | 0.33 | 0.17 | 0.49 |
| 5 | 394 | 255 | 12 | 127 | 0.65 | 0.03 | 0.32 |
| 6 | 522 | 296.72 | 100 | 125.28 | 0.57 | 0.19 | 0.24 |
| 7 | 537 | 25 | 25 | 487 | 0.05 | 0.05 | 0.91 |
| 8 | 566 | 42 | 0 | 524 | 0.07 | 0.00 | 0.93 |
| 9 | 664 | 300 | 49 | 315 | 0.45 | 0.07 | 0.47 |
| 10 | 728 | 136 | 119.75 | 472.25 | 0.19 | 0.16 | 0.65 |
| 11 | 778 | 96.5 | 106.7 | 574.8 | 0.12 | 0.14 | 0.74 |
| 12 | 964 | 184 | 0 | 780 | 0.19 | 0.00 | 0.81 |
| 13 | 1367 | 867 | 90 | 410 | 0.63 | 0.07 | 0.30 |
| 14 | 2348 | 760 | 188 | 1400 | 0.32 | 0.08 | 0.60 |
| 15 | 2443 | 511 | 200 | 1732 | 0.21 | 0.08 | 0.71 |
| 16 | 2603 | 405.18 | 440 | 1757.82 | 0.16 | 0.17 | 0.68 |
| 17 | 3105 | 973.5 | 800 | 1331.5 | 0.31 | 0.26 | 0.43 |
| 18 | 4477 | 966 | 595 | 2916 | 0.22 | 0.13 | 0.65 |
| 19 | 8016 | 7775 | 0 | 241 | 0.97 | 0.00 | 0.03 |
| Average | 1581 | 722 | 149 | 710 | 0.32 | 0.11 | 0.57 |
Table 2.
On-farm management practices.
| On-Farm Management Practices (n = 29) | ||||||
|---|---|---|---|---|---|---|
| Agricultural practices | ||||||
| Inter-Cropping | Cover-Cropping | Mulch | Rotations | Green manure | Double-Dig | No-Till |
| 27 | 25 | 19 | 18 | 7 | 6 | 1 |
| 93% | 86% | 65% | 62% | 24% | 20% | 3% |
| Soil management | ||||||
| Compost | Manure | Fish emulsion | Compost tea | Worm Castings | Minerals | - |
| 24 | 11 | 10 | 9 | 5 | 3 | - |
| 82% | 38% | 34% | 31% | 17% | 10% | - |
| Animal Integration | ||||||
| Bees | Chickens | Worms | Goats | Fish | Ducks | Rabbits |
| 10 | 7 | 4 | 3 | 2 | 1 | 1 |
| 34% | 24% | 14% | 10% | 6% | 3% | 3% |
Table 3.
Weed coverage in production areas.
| Weeds (%/m2), n = 933 | |
|---|---|
| Average weed coverage (m2)—all quadrats | 7% |
| Quadrats with only broadleaf weeds | 31% |
| Quadrats with only grass weeds | 8% |
| Quadrats with mixed weeds (both broadleaf and grass weeds) | 21% |
| No weeds present | 40% |
Publisher’s Note: MDPI stays neutral with regard to jurisdictional claims in published maps and institutional affiliations. |
© 2022 by the author. Licensee MDPI, Basel, Switzerland. This article is an open access article distributed under the terms and conditions of the Creative Commons Attribution (CC BY) license (https://creativecommons.org/licenses/by/4.0/).
Share and Cite
MDPI and ACS Style
Arnold, J.E. On-Farm Spatial Composition, Management Practices and Estimated Productivity of Urban Farms in the San Francisco Bay Area. Processes 2022, 10, 558. https://doi.org/10.3390/pr10030558
AMA Style
Arnold JE. On-Farm Spatial Composition, Management Practices and Estimated Productivity of Urban Farms in the San Francisco Bay Area. Processes. 2022; 10(3):558. https://doi.org/10.3390/pr10030558
Chicago/Turabian StyleArnold, Joshua Earl. 2022. "On-Farm Spatial Composition, Management Practices and Estimated Productivity of Urban Farms in the San Francisco Bay Area" Processes 10, no. 3: 558. https://doi.org/10.3390/pr10030558
Note that from the first issue of 2016, this journal uses article numbers instead of page numbers. See further details here.