Article

Changes and Relationships between Components in the Plant-Soil System and the Dominant Plant Functional Groups in Alpine Kobresia Meadows Due to Overgrazing

1
Northwest Institute of Plateau Biology, Chinese Academy of Sciences, Xining 810008, China
2
University of Chinese Academy of Sciences, Beijing 100049, China
3
Institute of Geographic Sciences and Natural Resources Research, Chinese Academy of Sciences, Beijing 130028, China
4
State Key Laboratory of Plateau Ecology and Agriculture, Qinghai University, Xining 810016, China
5
College of Ecology and Environment, Hainan University, Haikou 570228, China
*
Authors to whom correspondence should be addressed.
Diversity 2022, 14(3), 183; https://doi.org/10.3390/d14030183
Submission received: 30 December 2021 / Revised: 22 February 2022 / Accepted: 26 February 2022 / Published: 2 March 2022

Abstract

:
In the last several decades, overgrazing has led to various changes in the plant communities, soil nutrients and soil microbial communities in alpine Kobresia meadows, which contain various plant communities coexisting on the Qinghai–Tibet Plateau. Investigating the variations in the biomass and concentration of nutrients in the plant–soil system in these communities may improve understanding of the biochemical responses and adaptation strategies they use to resist disturbances due to overgrazing. We therefore assessed 12 factors across four grazing intensities in alpine Kobresia meadows to explore the following three questions. (1) What the responses are in alpine Kobresia meadows to overgrazing. (2) How they affect plant–soil systems in alpine Kobresia meadows under overgrazing. (3) What factors can be used to evaluate the effects of overgrazing on the ecosystem health status of alpine Kobresia meadows. The results gave the following answers to the above questions. (1) Overgrazing caused the total aboveground biomass to decrease from 333.2 ± 17.4 g/m2 to 217.4 ± 30.2 g/m2, the coverage of plant functional groups of Gramineae and Cyperaceae to decrease from 74.2 ± 3% to 22.5 ± 1.9%, and the total belowground biomass to increase from 4028.5 ± 7.3 g/m2 to 6325.6 ± 24.8 g/m2. (2) Overgrazing resulted in variations in plant–soil systems at three levels. The concentrations of carbon (C) in soil nutrients and plant communities, explained 50.9% of the variation of biomass in plant functional groups; the concentration of soil available nutrients, explained 22.2% of the variation; and the ratio of C and N in shoots and soil total N, explained 11.0% of the variation. (3) The variations in C/N stoichiometry in total soil nutrients and soil microorganisms were 3.4–8.4% and 2.0–3.0%, respectively, and the load of (ammonium-nitrogen (NH4+-N) + nitrate-nitrogen (NO3-N)) to growth of roots tissue increased from 84.1 ± 5.0 g/m2/(mg/kg) via 99.0 ± 1.3 g/m2/(mg/kg) to 86.1 ± 2.1 g/m2/(mg/kg) at 0 to 40 cm soil in an alpine meadow with grazing intensities rising. Overgrazing would thus increase the deficit of those two kinds of inorganic N on roots growing by 11.4%, 17.7% and 2.4% as grazing rates increased by 93.3%, 126.7% and 213.3%, respectively, compared to a meadow grazed at the lowest rate in the research. We concluded that the alpine meadow changed its distribution of biomass in the plant community, which increased the limiting nutrient deficit on production and altered the concentration and ratio of C and N. This destroyed the original balance to enable the plant community to resist overgrazing. Plot “KH”—a pasture with a grazing intensity next to the lowest one—was the key state in which persistent overgrazing could increase the limiting nutrient load on plant community production, change the dominant position of functional plant groups and species, and lead to plant community degradation. Using ratio of Gramineae to Cyperaceae or Kobresia humilis to K. pygmaea to monitor plant community succession could indirectly estimate these limiting nutrients deficit and balance, and their strategy for incorporating matter into roots and shoots. However how to use those outward characteristics to assess the ecosystem health requires further studies.

1. Introduction

Alpine Kobresia meadows are the typical and primary pasture of the Qinghai–Tibet plateau, occupying more than 35% of its total area. The ecosystem health of those pastures not only affects livestock production but also influences ecological functions and stability [1].
In the past decades, frequent overgrazing of Kobresia meadows on the Qinghai–Tibet Plateau [2] has led to various alteration in plant community structure, soil nutrient concentrations and soil microbial community composition and structure. This has resulted in about 90% of Kobresia meadows on the Qinghai–Tibet Plateau deteriorating into other plant communities, forming diverse plant communities coexisting in the same climate and topography, or succeeding into disturbed disclimax stage [3].
Plant community structure and composition as well as soil nutrient concentrations are the most important factors that change in response to overgrazing in alpine Kobresia meadows, for ecosystems have the ability to adjust their structures and contents of material and energy by altering those factors referred above as a response to disturbance. The balance of material and energy in plant–soil systems are partially determined by the ability of plant species (and/or plant functional groups) in tolerating resource limitation in a particular environment and specific ecological processes, while they can be measured based on inputs by plants to the environment and outputs of heterotrophic respiration and erosion [4,5]. In order to form the balance of material and energy input and output in ecosystems, the pastures can establish different stable states, but only the ones sustaining a high and steady yield are considered as the healthy pastures [6,7]. Gaining knowledge on adjustment in plant–soil composition and structure as well as their nutrient concentrations and allocation can reveal the mechanisms of biochemical reactions and dynamic ecosystem adaptions [8,9].
The plant community component and construction respond more strongly than soil nutrient to overgrazing. Overgrazing can significantly decrease plant community diversity, evenness [10], and coverage of the plant community, the height and biomass of palatable species [11], as well as replace the dominant plant functional groups in the ecosystem [6]. It also generally leads to a higher ratio of root biomass to shoot biomass (R/S) through continuous overgrazing and trampling by livestock. This decreases the storage of the palatable forage in pastures and reduces their root biomass. The reason for the phenomenon can be explained by two theories. One is that the nutrients reserve in root are essential in greening of the plants, recovering ecosystem from grazing and retaining grass resource sustainable developed under the disturbing [12]. The other one is that root tissue is vital in researching more moisture and limiting nutrients which would deficit under overgrazing [13].
Features of plant-soil nutrient concentrations under the disturbance vary among plant communities during the ecosystem dynamic. C and N play key roles in biogeochemical cycles by linking the plant community, soil and soil microorganism systems [8,9,14,15,16,17]. Soil organic matter provides the nutrient pool for organic C storage and circulation, and can be degraded by overgrazing [18,19,20]. In general, N is the limiting nutrient in yielding net primary productivity in Kobresia meadows [21], and more than 80% of total N nutrition was inorganic source for alpine plants asexually propagating [22]. NH4+-N and NO3-N are the main forms of inorganic N [21,23,24], and their amounts and concentrations are regulated by N mineralization processes and factors such as molecular structure, condensation reactions, fire residues, rhizosphere inputs, physical disconnection, soil depth, freezing and thawing, and microbial products [24]. The root biomass is an important factor to consider the ability to compete with microorganisms for inorganic N [22], while soil microbes that can use dead root tissue and root exudate as substrates on which to live and from which to produce nutrients are primarily responsible for organic matter mineralization in the rhizosphere [25]. This association contributes to the development of mutualism and characteristics in adjusting the balance and accumulation of nutrients in alpine meadows succession process [26,27].
Features of plant-soil nutrient location and proportion under overgrazing vary among plant communities, soil and soil microorganisms during the ecosystem dynamic. C/N stoichiometry has attracted much attention due to their impact on the plant-soil system adjustment strategies under severe disturbance. C/N stoichiometry maintains stability in certain biotic systems, and its shift consistently indicates that the nutrient structure and/or components have also changed [28]. Consequently, the magnitude of grazing effects on C/N stoichiometry depends on the intensity of grazing in various types of vegetation and the variation of environmental factors within the ecosystem [8,29].
Although many studies have described the characteristics of plant communities, soil and soil microorganisms of alpine meadows under different grazing intensities, the effects of overgrazing on root activity and the relationship between the variety of appearance features and the mechanism of plant community succession remain vague. We therefore studied four pastures in the same topography and climate subjected to different levels of grazing intensity that were selected by their landowners. All pastures were characterized by similar environmental factors and they only differed in grazing intensity. We aimed to explore the following questions: (1) What the responses are in alpine Kobresia meadows to overgrazing. (2) How they affect plant–soil systems in alpine Kobresia meadows under overgrazing. And (3) what factors can be used to evaluate the effects of overgrazing on alpine Kobresia meadows.

2. Materials and Methods
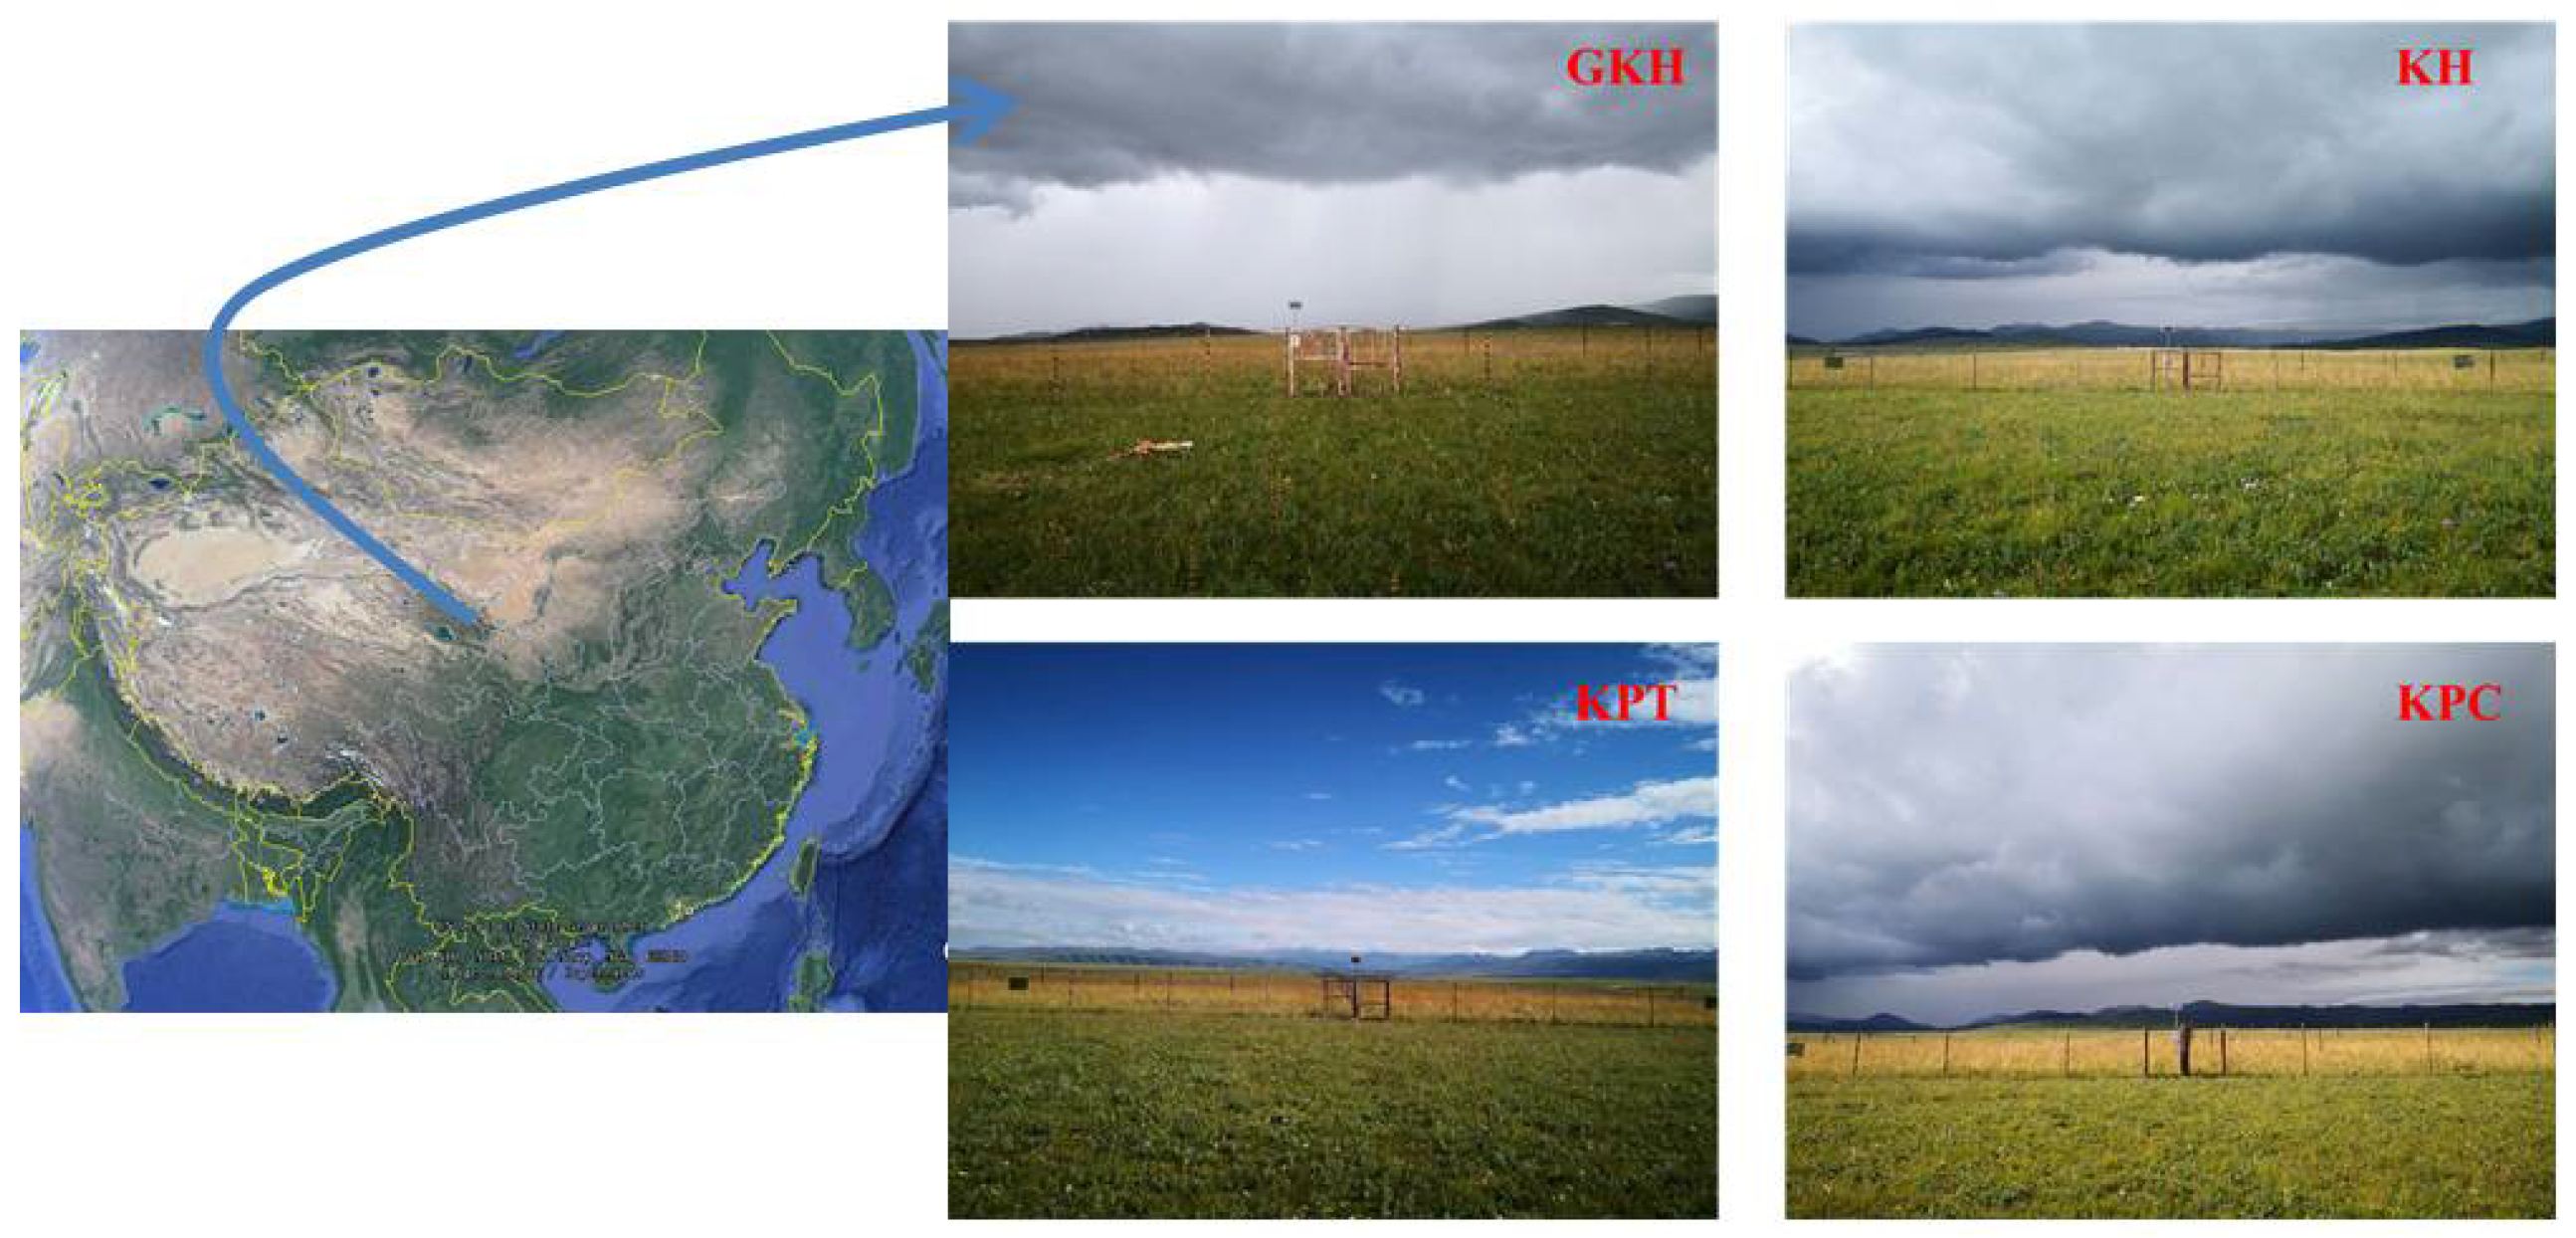
2.1. Study Sites

The study sites with original alpine Kobresia meadow communities are located in the town of Huangcheng in Menyuan county, Qinghai province, China (Figure 1). The average annual precipitation and temperature were 582.1 mm and −1.7 °C, respectively during 1980 to 2010. The warmest and coldest months are July and January, respectively. The dominant plants in these communities are Stipa spp., Festuca spp. and Kobresia spp. The growing season is from May to September, and plant community biomass peaks in August. The alpine meadow soil is classified as clay loam with diluvial and highly permeable parent material, and has a thickness of approximately 60 to 80 cm, with 80 to 90% of roots concentrated from 0 to 20 cm below the surface. Mattic epipedon, which is a diagnostic soil layer in the Chinese Soil Taxonomy, is mainly distributed in the top 30 cm of soil [4]. The detailed characteristics of the study sites are shown in Table 1.
The selection of the study sites was based on a semi-structured questionnaire survey on the pasture management mode and the grazing intensity, as well as monitoring on the characteristics of plant communities. Pasture management has changed substantially since the 1950s. The ownership and management systems of these alpine meadows has changed several times from 1951 to the present day [30] The four study sites have the same topography and climate and was managed by a single person from 1984 to 1995. The four adjacent pastures were not physically separated until the year of 1995, and they were previously subjected to the same intensity of disturbance based on the semi-structured questionnaire survey. Thus, the present significant variations in plant community and soil nutrient characteristics were due to the changes in the intensity of disturbance caused by their physical separation in 1995 and subsequent variations in livestock grazing intensity.

2.2. Experimental Design

The formerly continuous pasture has been divided into four pastures of 14.6 ha, 13.5 ha, 13.1 ha and 20.1 ha, respectively, since 1995, and since then each pasture has been managed by one of four households (the original landowner and his three sons). The pastures are located in the same climatic and topographic area but had been subjected to different intensities of grazing by livestock. The dominant plant species or plant groups in each plots were Gramineae + K. humilis (GKH), K. humilis, K. pygmaea and K. pygmaea according to the grazing intensity of 3.75 ± 0.75, 7.25 ± 0.25, 8.50 ± 0.35 and 11.75 ± 0.95 sheep/ha. Besides that, the surface characteristics of the landscape and the thickness of mattic epipedon have been substantially altered over between each other, forming plant communities with different structures and components (Table 1).
Although, those pastures are differences in management modes among herdsmen, they cooperate with the government to complete the projects in improving the ability of yield in alpine meadows, such as eradicating poisonous weeds, and small mammal species such as Ochotona spp. and Myospalax spp., and Gynaephora spp., but no other measures like fertilization or cutting herbage.

2.3. Soil and Plant Sampling

The aboveground biomass (shoot) was collected by species using a standard harvesting method with a frame quadrat (25 cm × 25 cm area, 6 per study site and sampling date) in late August or early September in 2014, 2017, and 2020 which had the approximate accumulated temperature and amount of precipitation in growing season during the span of 2014 to 2020 based on the meteorological data from Haibei National Field Research Station of Alpine Grassland Ecosystem. The plant samples were heated in an oven at 105 °C for 30 min to deactivate enzymes, dried at 60 to 70 °C for 48 h, weighed, and then passed through a 0.5-mm-mesh sieve, total C and N concentrations in six aliquots of the sieved material were determined [31].
The soil samples were collected at five soil depths (0–5 cm, 5–10 cm, 10–20 cm, 20–30 cm, and 30–40 cm) per study site and sampling data, in an “S” type pattern at each depth in every plot using stainless-steel cylinders with an inner diameter of 5 cm. Six such soil pillars were combined to form one sample, which was air dried after removing roots. We divided the sample into two parts. The first part was passed through a 2-mm-mesh, and the NH4+-N and NO3-N concentrations in six aliquots of the sieved material were determined. The second part was passed through a 0.25-mm-mesh sieve, and the total C, N, and inorganic C concentrations in six aliquots of the sieved material were determined [31].
Root biomass was collected using the above method. A water-wash pretreatment was used to separate roots and soil, and a specific gravity method was used to separate living roots from dead roots [6], weighed, and then passed through a 0.5-mm-mesh sieve, total C and N concentrations in six aliquots of the sieved material were determined [31].
Soil and plant samples were stored at room temperature for the determination of soil chemical properties. Approximately 500 g of each fresh soil sample was refrigerated at 4 °C for later determination of the concentration of C and N in soil microorganisms.
The concentrations of total C and N of soil, plant species, root were determined by dry combustion using an Elemental Analyzer (Elementar Vario EL Cube, Elementar Inc., Hesse, Germany). Soil inorganic C concentration was analyzed by gasometric method (Eijkelkamp Calcimeter, Eijkelkamp Instruments Inc., EN Giesbeek, The Netherlands). Soil NH4+-N and NO3-N concentrations were analyzed by colorimetry using a Discrete Chemistry Analyzer (Smartchem 140, WESTCO Scientific Instruments Inc., Brookfield, CT, USA) [6]. Soil microbial biomass C and N were determined by chloroform-fumigation extraction using a Total Organic Carbon Analyzer (Elementar Enviro TOC, Elementar Inc., Hesse, Germany) [32,33].

2.4. Statistical Analyses

The aboveground plant samples were categorized into four groups: Gramineae, Cyperaceae, Leguminosae and forbs. The C and N concentrations in the aboveground plant community were calculated as the C or N concentration of each species in the community multiplied by their ratio of total aboveground biomass, as follows.
C P F G = j = 1 n i = 1 m ( S C i j × B r i j ) n × m   N P F G = j = 1 n i = 1 m ( S N i j × B r i j ) n × m
where “Cij and “Nij “represent the concentrations of C and N in species “i “in the “j” samples in each groups, “Brij represents the biomass of species ”i“ in the “j samples in each group, ”m represents the number of species in each group in one frame quadrat, and “n represents the number of frame quadrats in each group in one sample plot [34].
The C or N concentrations of the belowground plant community were calculated as the species C and N concentrations multiplied by their ratio of living or dead root biomass to total belowground biomass.
C R i j = j = 1 a i = 1 b ( C R i j × B R i j ) a × b   N P F G = j = 1 a i = 1 b ( C R i j × B R i j ) a × b
where “i “= 1, “CRij” and “RNij” represent the concentrations of living root tissue; “i = 2, “CRij” and “RNij” represent the C and N concentrations of dead tissue; “Brij” are the ratio of living or dead root biomass, respectively, and “a” is the number of samples in one sample plot.
The continuous observations of yield and soil nutrient contents in this area found that the contribution of changes in variance of observed values among different years were less than theirs’ in different pastures and within-pasture [6,35], indicating that the observed values vary among different years, but the impact is smaller than the within-pasture, so the variance could be seen as data fluctuations rather than changes in a longtime monitor system. Besides that, the amount of precipitation from May to September changes among years in this area, and it has a significant moderate relationship to soil nutrient contents [35], so it is seemed more reasonable to calculate the value with the average observation value in each pasture and year as the one repeat, and using those average values to calculate the variation of the plant-soil characteristics among the span of the years and different pastures.
Characteristics of inorganic N was represented by the sum content of NH4+-N and NO3-N, while the characteristics of inorganic N (NH4+-N + NO3-N) load calculated by the biomass of living root divided by the sum content of (NH4+-N + NO3-N).
Statistical analyses were conducted with SPSS 19.0. Analyses of variance and Duncan’s multiple range tests at α = 0.05 were used to evaluate community biomass, C/N stoichiometry, and the concentrations of soil organic C, inorganic C and total N, and NH4+-N and NO3-N. A reduction dimensionality analysis (RDA) was conducted with R studio (1.4.1106) using the average of soil nutrients concentrations in 0–40 cm soil layers as environment factors, while using the biomass of plant functional groups as the species factors to determine which factors could explain the variance the biomass aboveground and belowground.

3. Results

3.1. Plant Community Characteristics

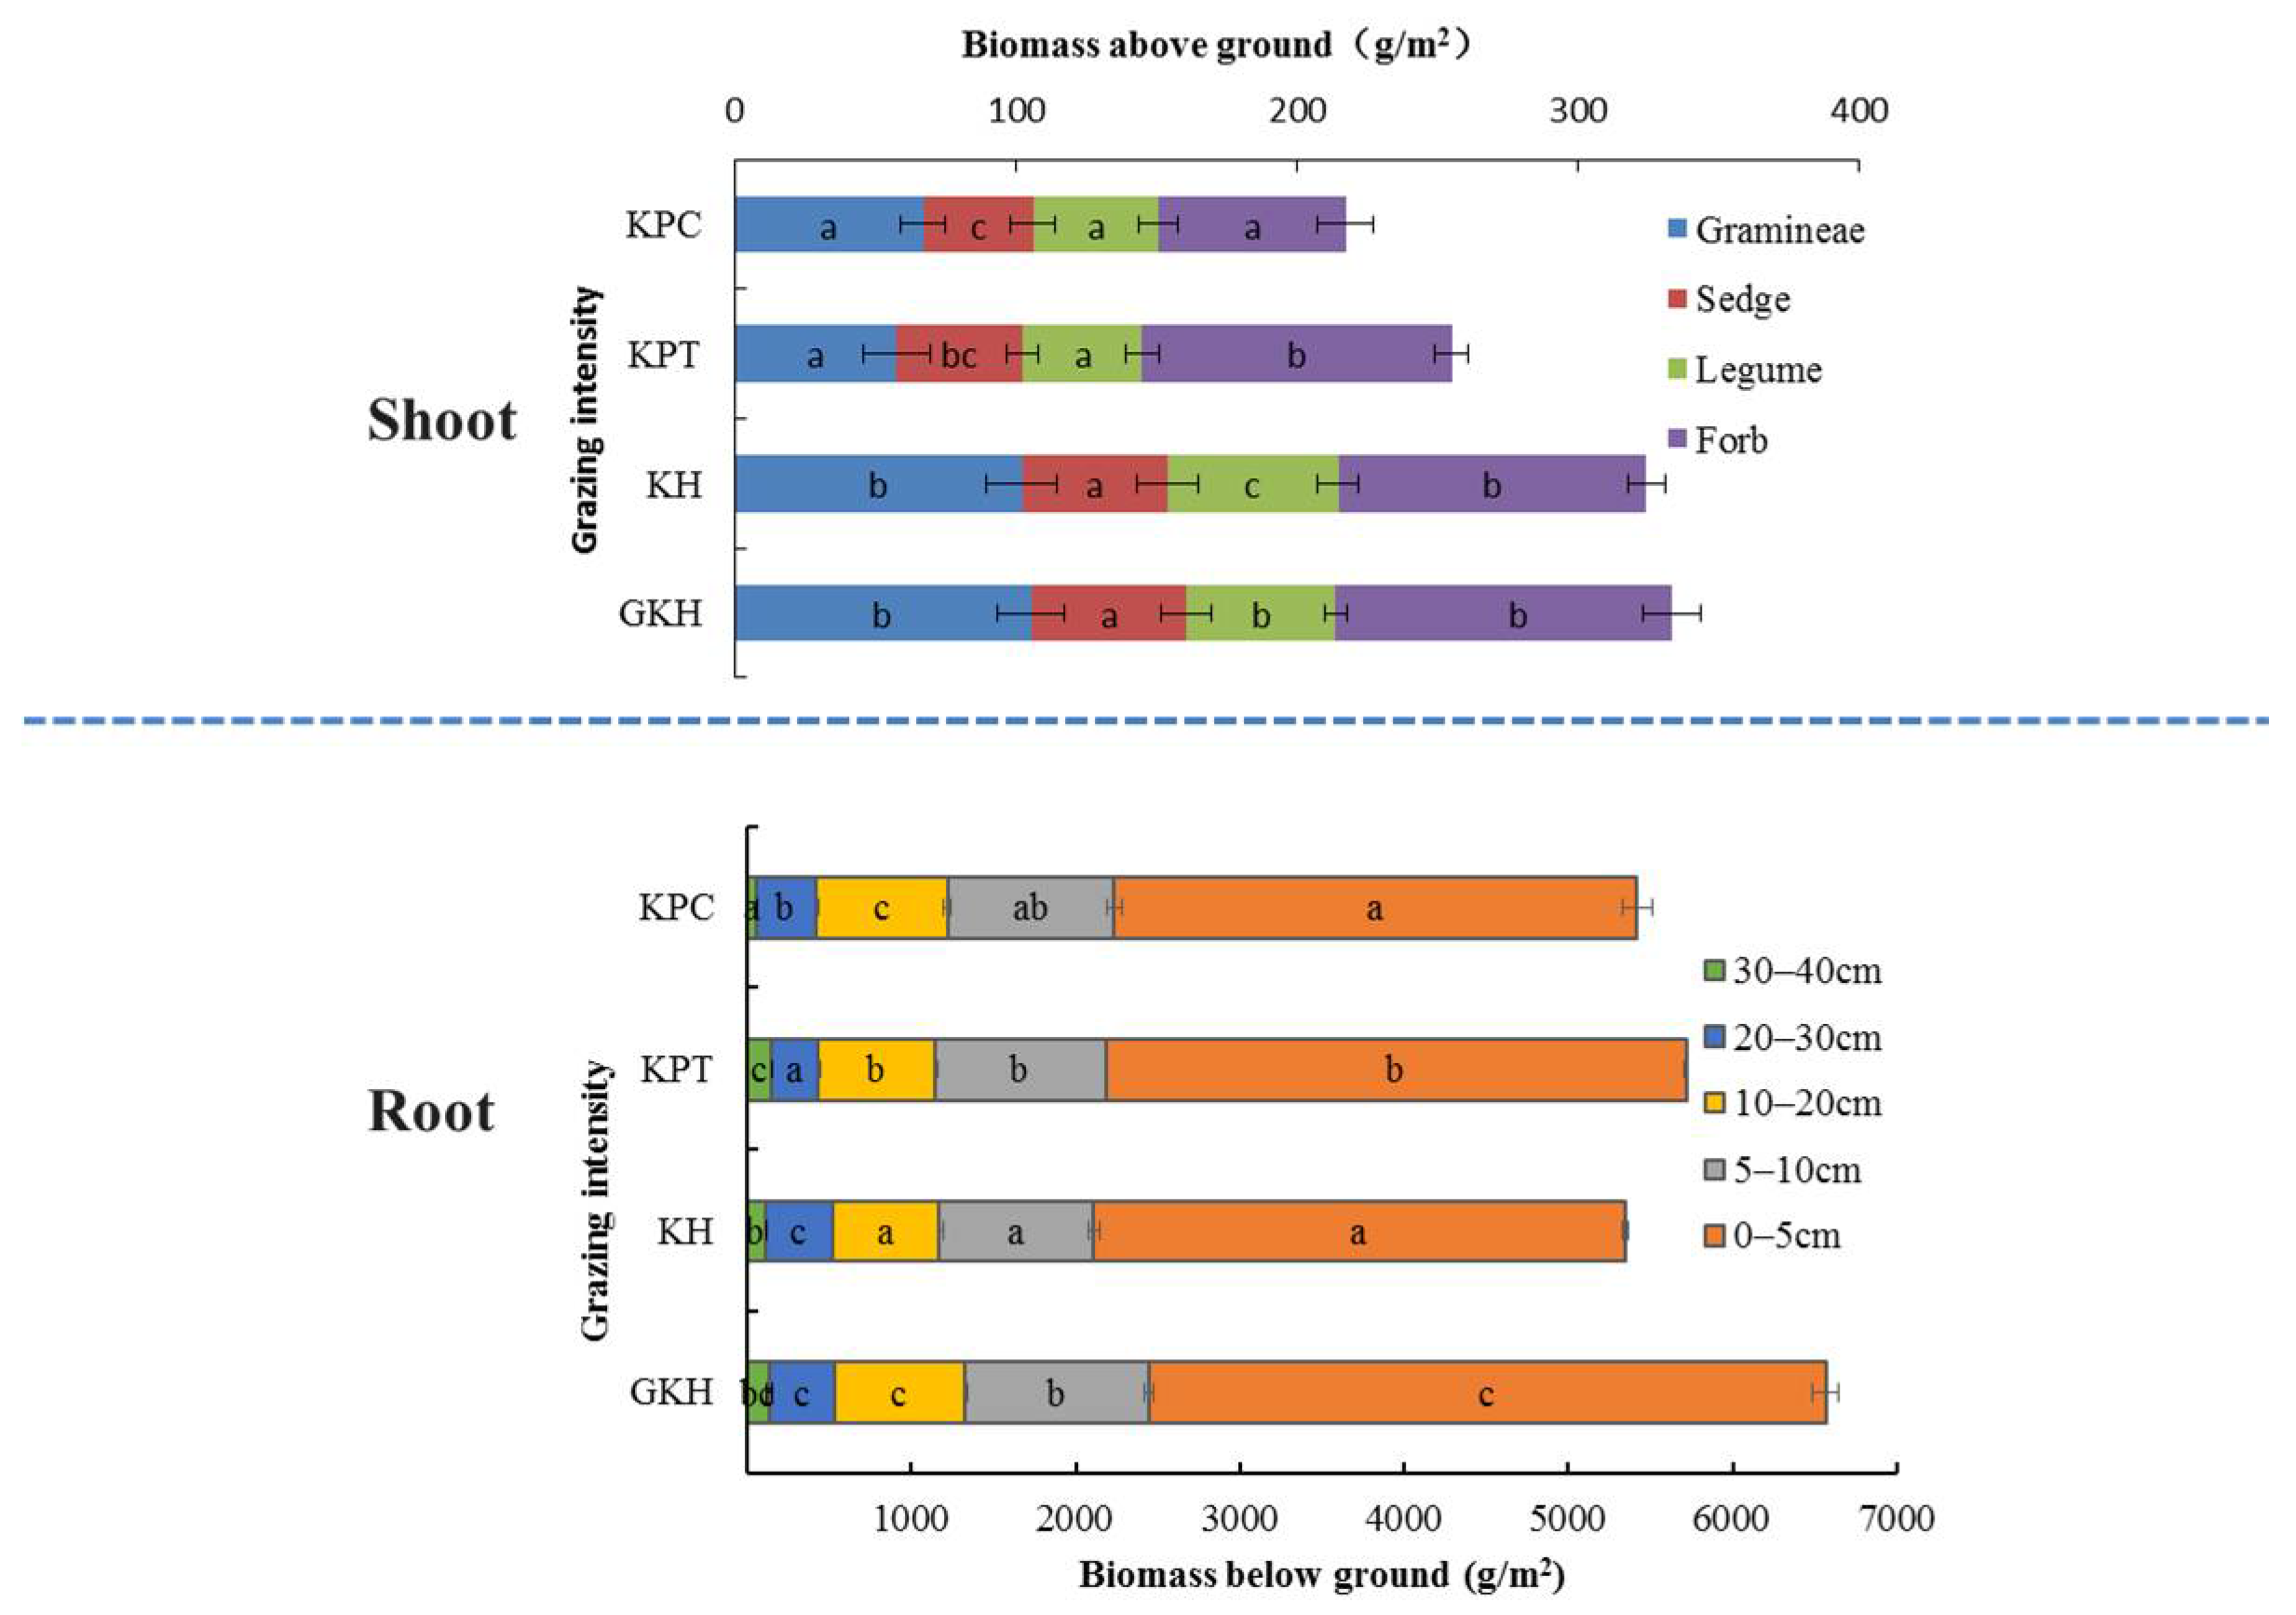
3.1.1. Aboveground Plant Community Characteristics

The total aboveground biomass of Gramineae and Cyperaceae (G + C) decreased from 333.2 ± 17.4 g/m2 to 217.4 ± 30.2 g/m2 and the coverage of “G + C” decreased from 74.2 ± 3% to 22.5 ± 1.9% with increasing grazing rate (Table 2 and Figure 2). The coverage of “G + C” decreased by 1.3%, 28.2% and 57.1%, the aboveground biomass decreased by 3.0%, 43.7% and 16.5%, and the grazing intensities increased by 93.3%, 126.7% and 213.3% in KH, KPT and KPC compared to in GKH, respectively. The four plots were divided into two groups based on the degree of numerical characteristics variance in aboveground plant community. The first group was comprised of “GKH” and “KH” and had a significantly higher yield and total coverage of “G + C” than the second group, which was comprised of “KTP” and “KCP” (Figure 2).

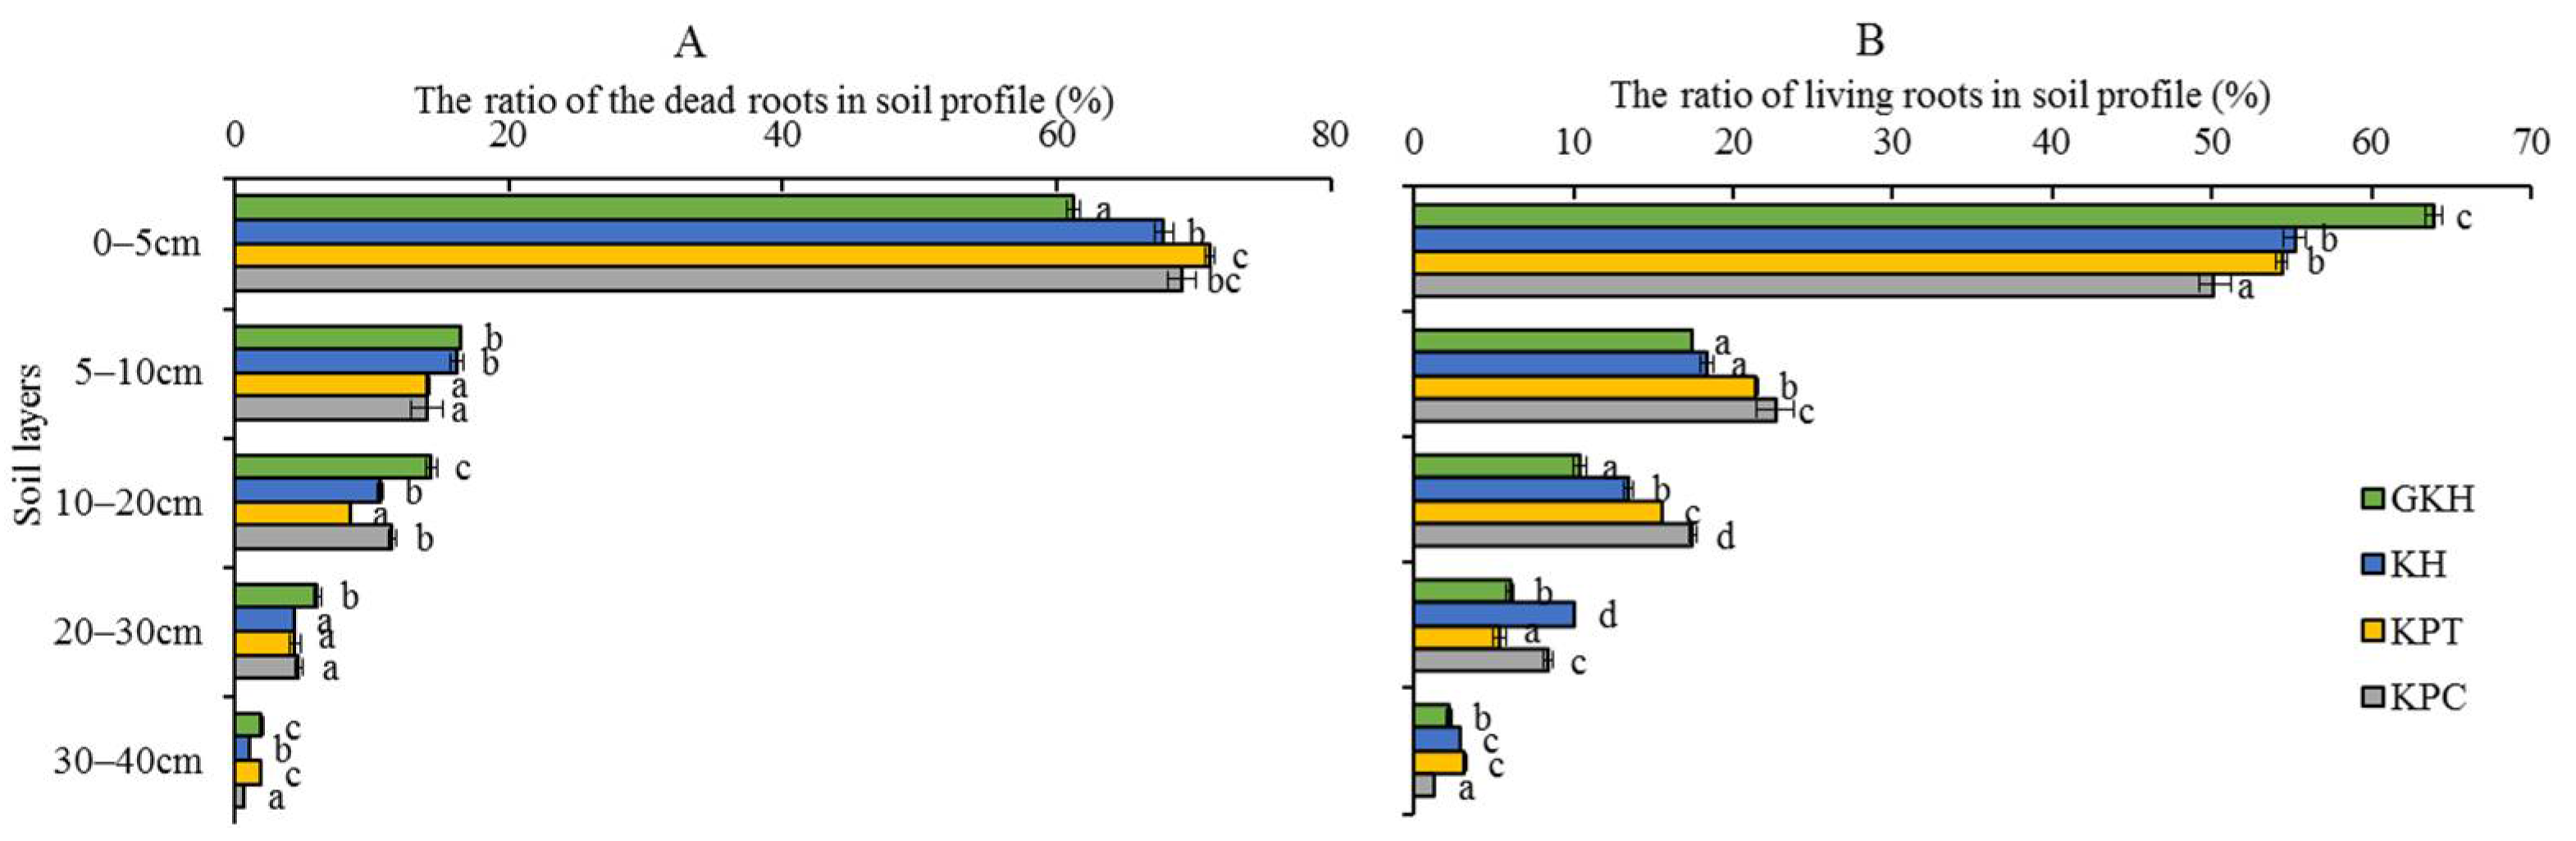
3.1.2. Belowground Plant Community Characteristics

The root quantity, quality, and location all changed under overgrazing. First, the proportions of dead root tissue at 0 to 5 cm increased from 61.2 ± 0.5% to 71.2 ± 0.4%, then decreased to 69.2 ± 1.0% in accordance with increasing grazing intensity (the increasing order: GKH, KH, KPT and KPC; Figure 3A) and more dead tissue accumulated near the soil surface. The proportion of living root tissue also decreased from 63.9 ± 0.09% to 50.2 ± 0.9% at 0 to 5 cm with increasing grazing intensity. However, it increased from 17.4 ± 0.2% to 22.7 ± 0.3% at 5 to 10 cm, before once again decreased at 20 to 40 cm (Figure 3B). Second, the highest root biomass was 6419.8 ± 197.0 g/m2 at 0 to 40 cm in plot “KPT.” The root biomass increased by 57.0%, 59.4% and 45.3% in “KH,” “KPT,” and “KPC,” respectively, relative to that in “GKH” (Figure 2). Third, the proportions of R/S were 19.7, 16.5, 22.4 and 24.9 respective to GKH, KH, KPT and KPC (Figure 2).

3.2. Concentrations of C and N in the Plant Community

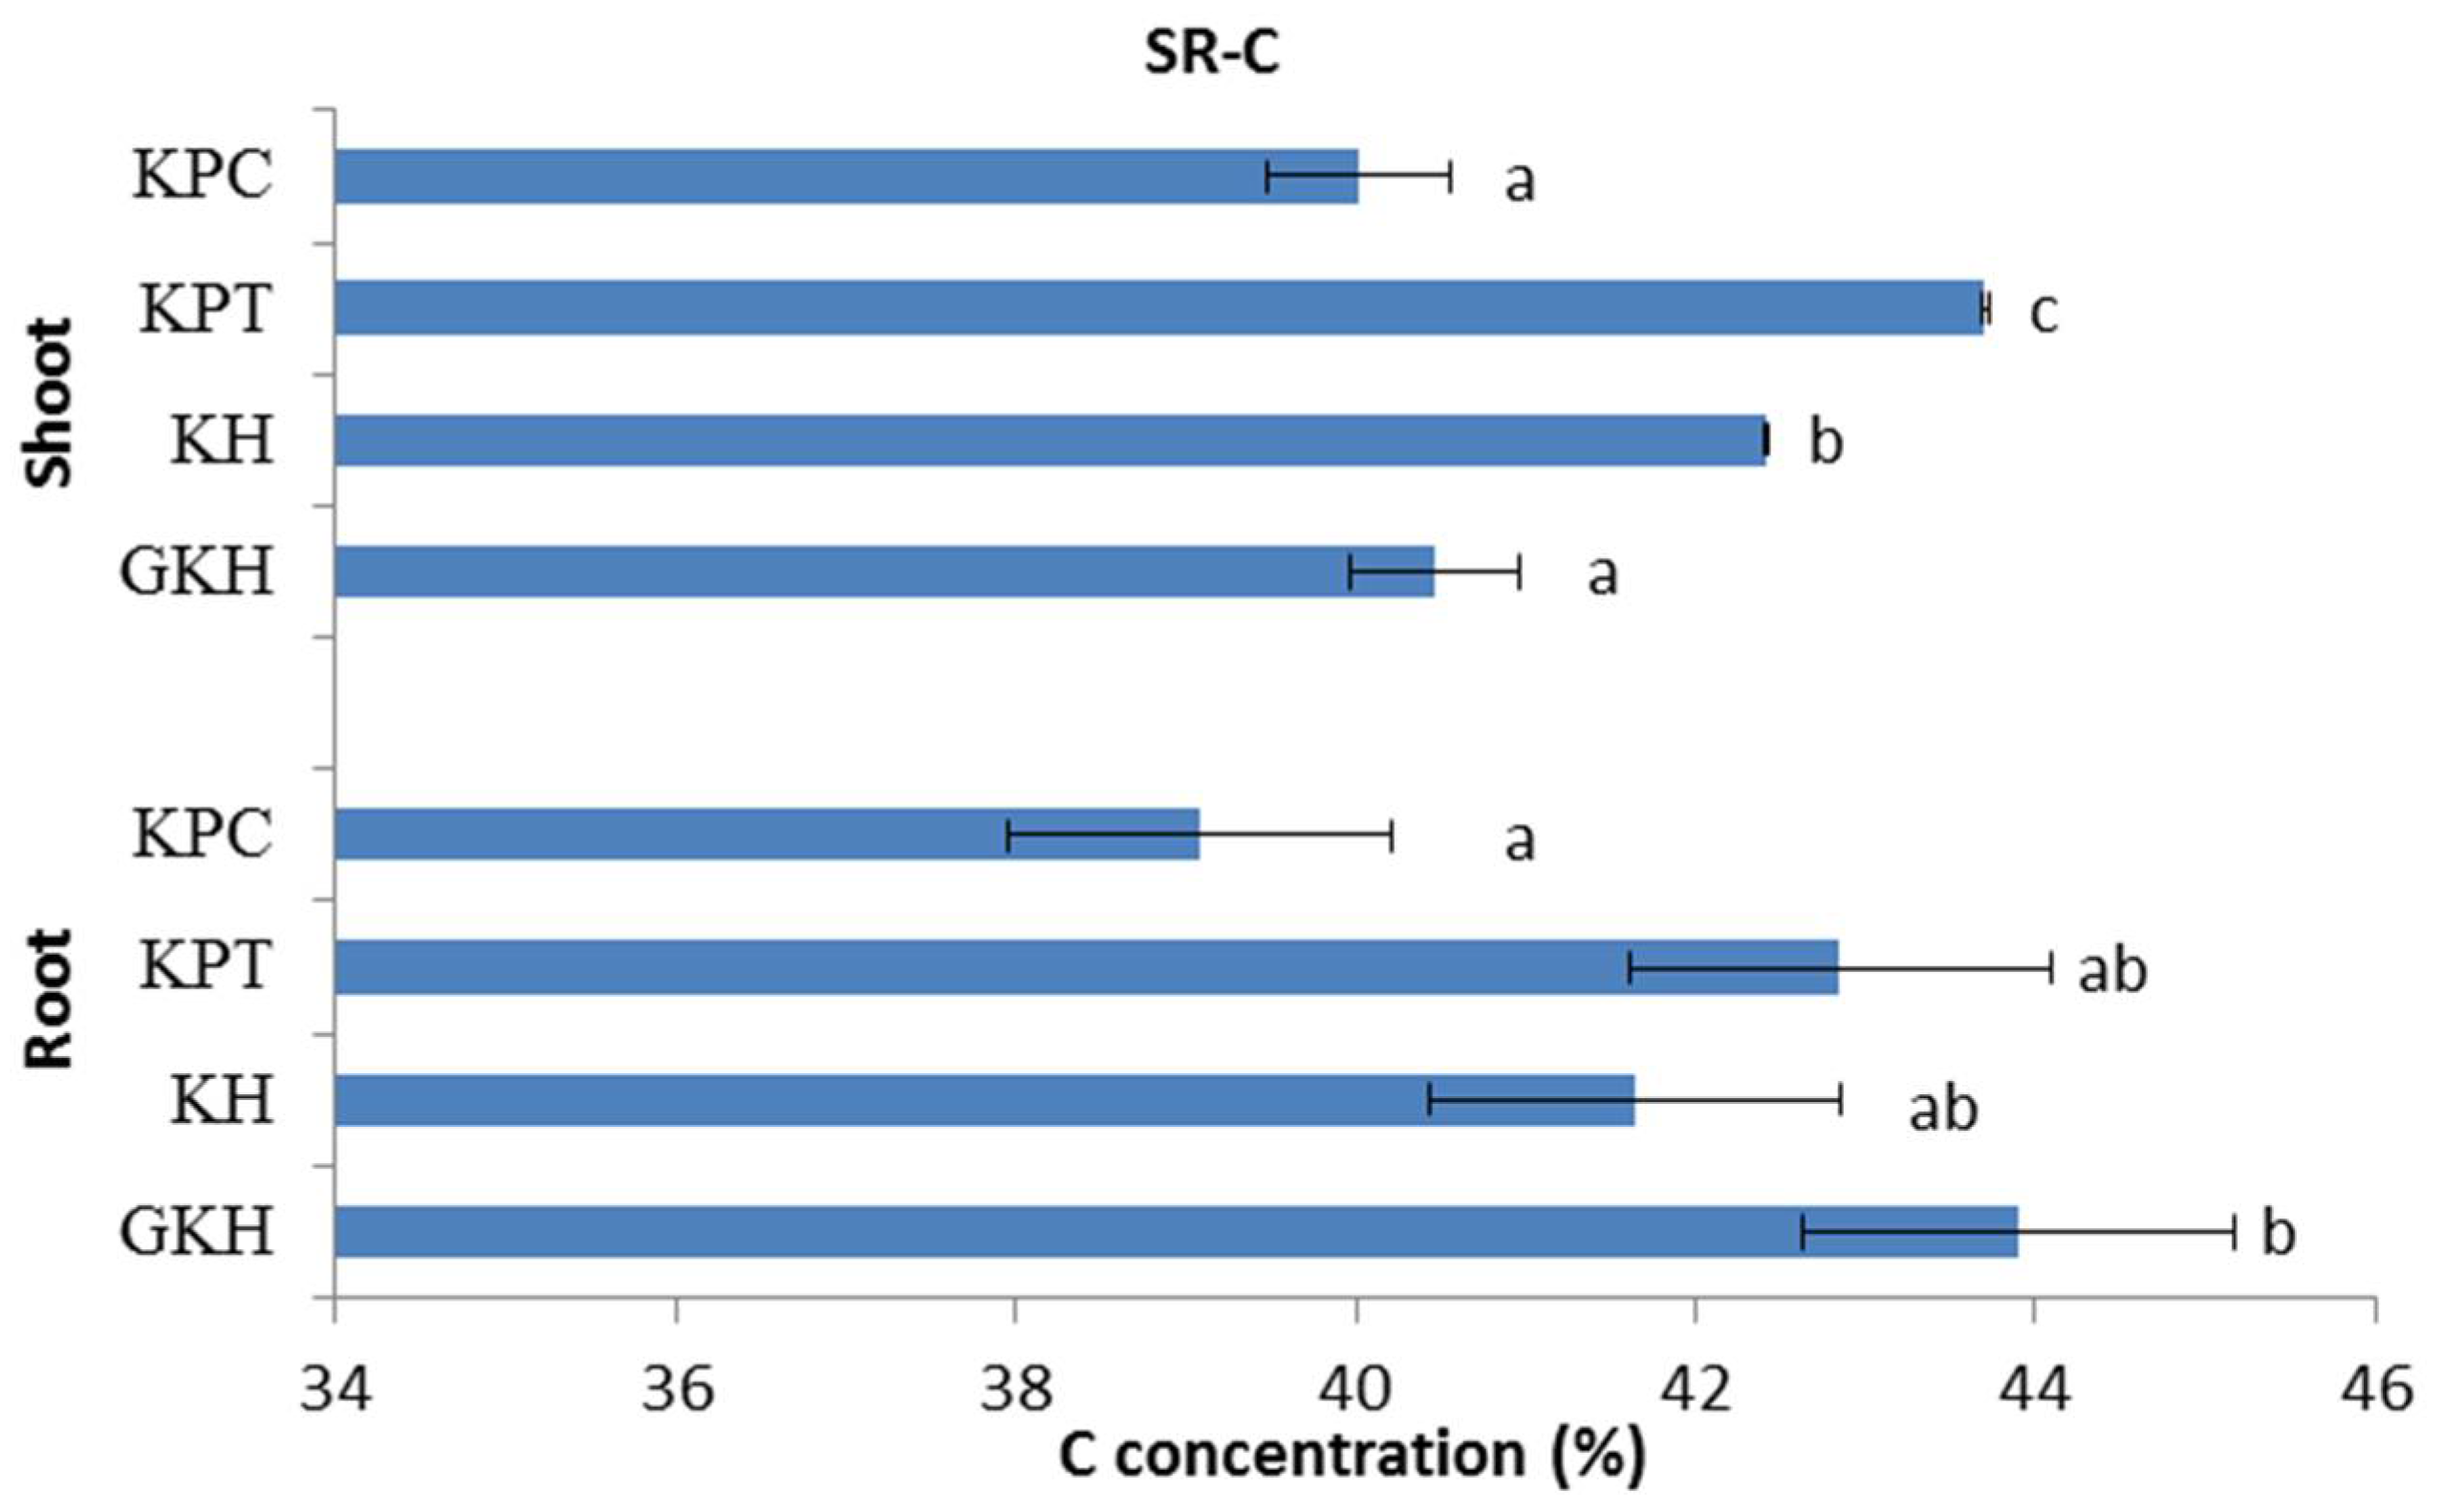
3.2.1. Concentration of C in the Plant Community

C concentrations in the aboveground plant community first rose and then fell with increasing grazing intensity. The highest C concentration occurred in “KPT,” indicating that a grazing rate of 7 to 8 sheep/ha was an optimum level at which grazing could raise the aboveground C concentration, whereas argument grazing intensity decreased the aboveground C concentration (Figure 4).
The trend of C concentrations in the belowground plant community decreased with increasing grazing intensity. The highest belowground C concentration was in plot “GKH” and the lowest was in plot “KPC,” while “KH” and “KPC” had no significant different between each other and kept in an intermediate values during the decreasing process (Figure 4).

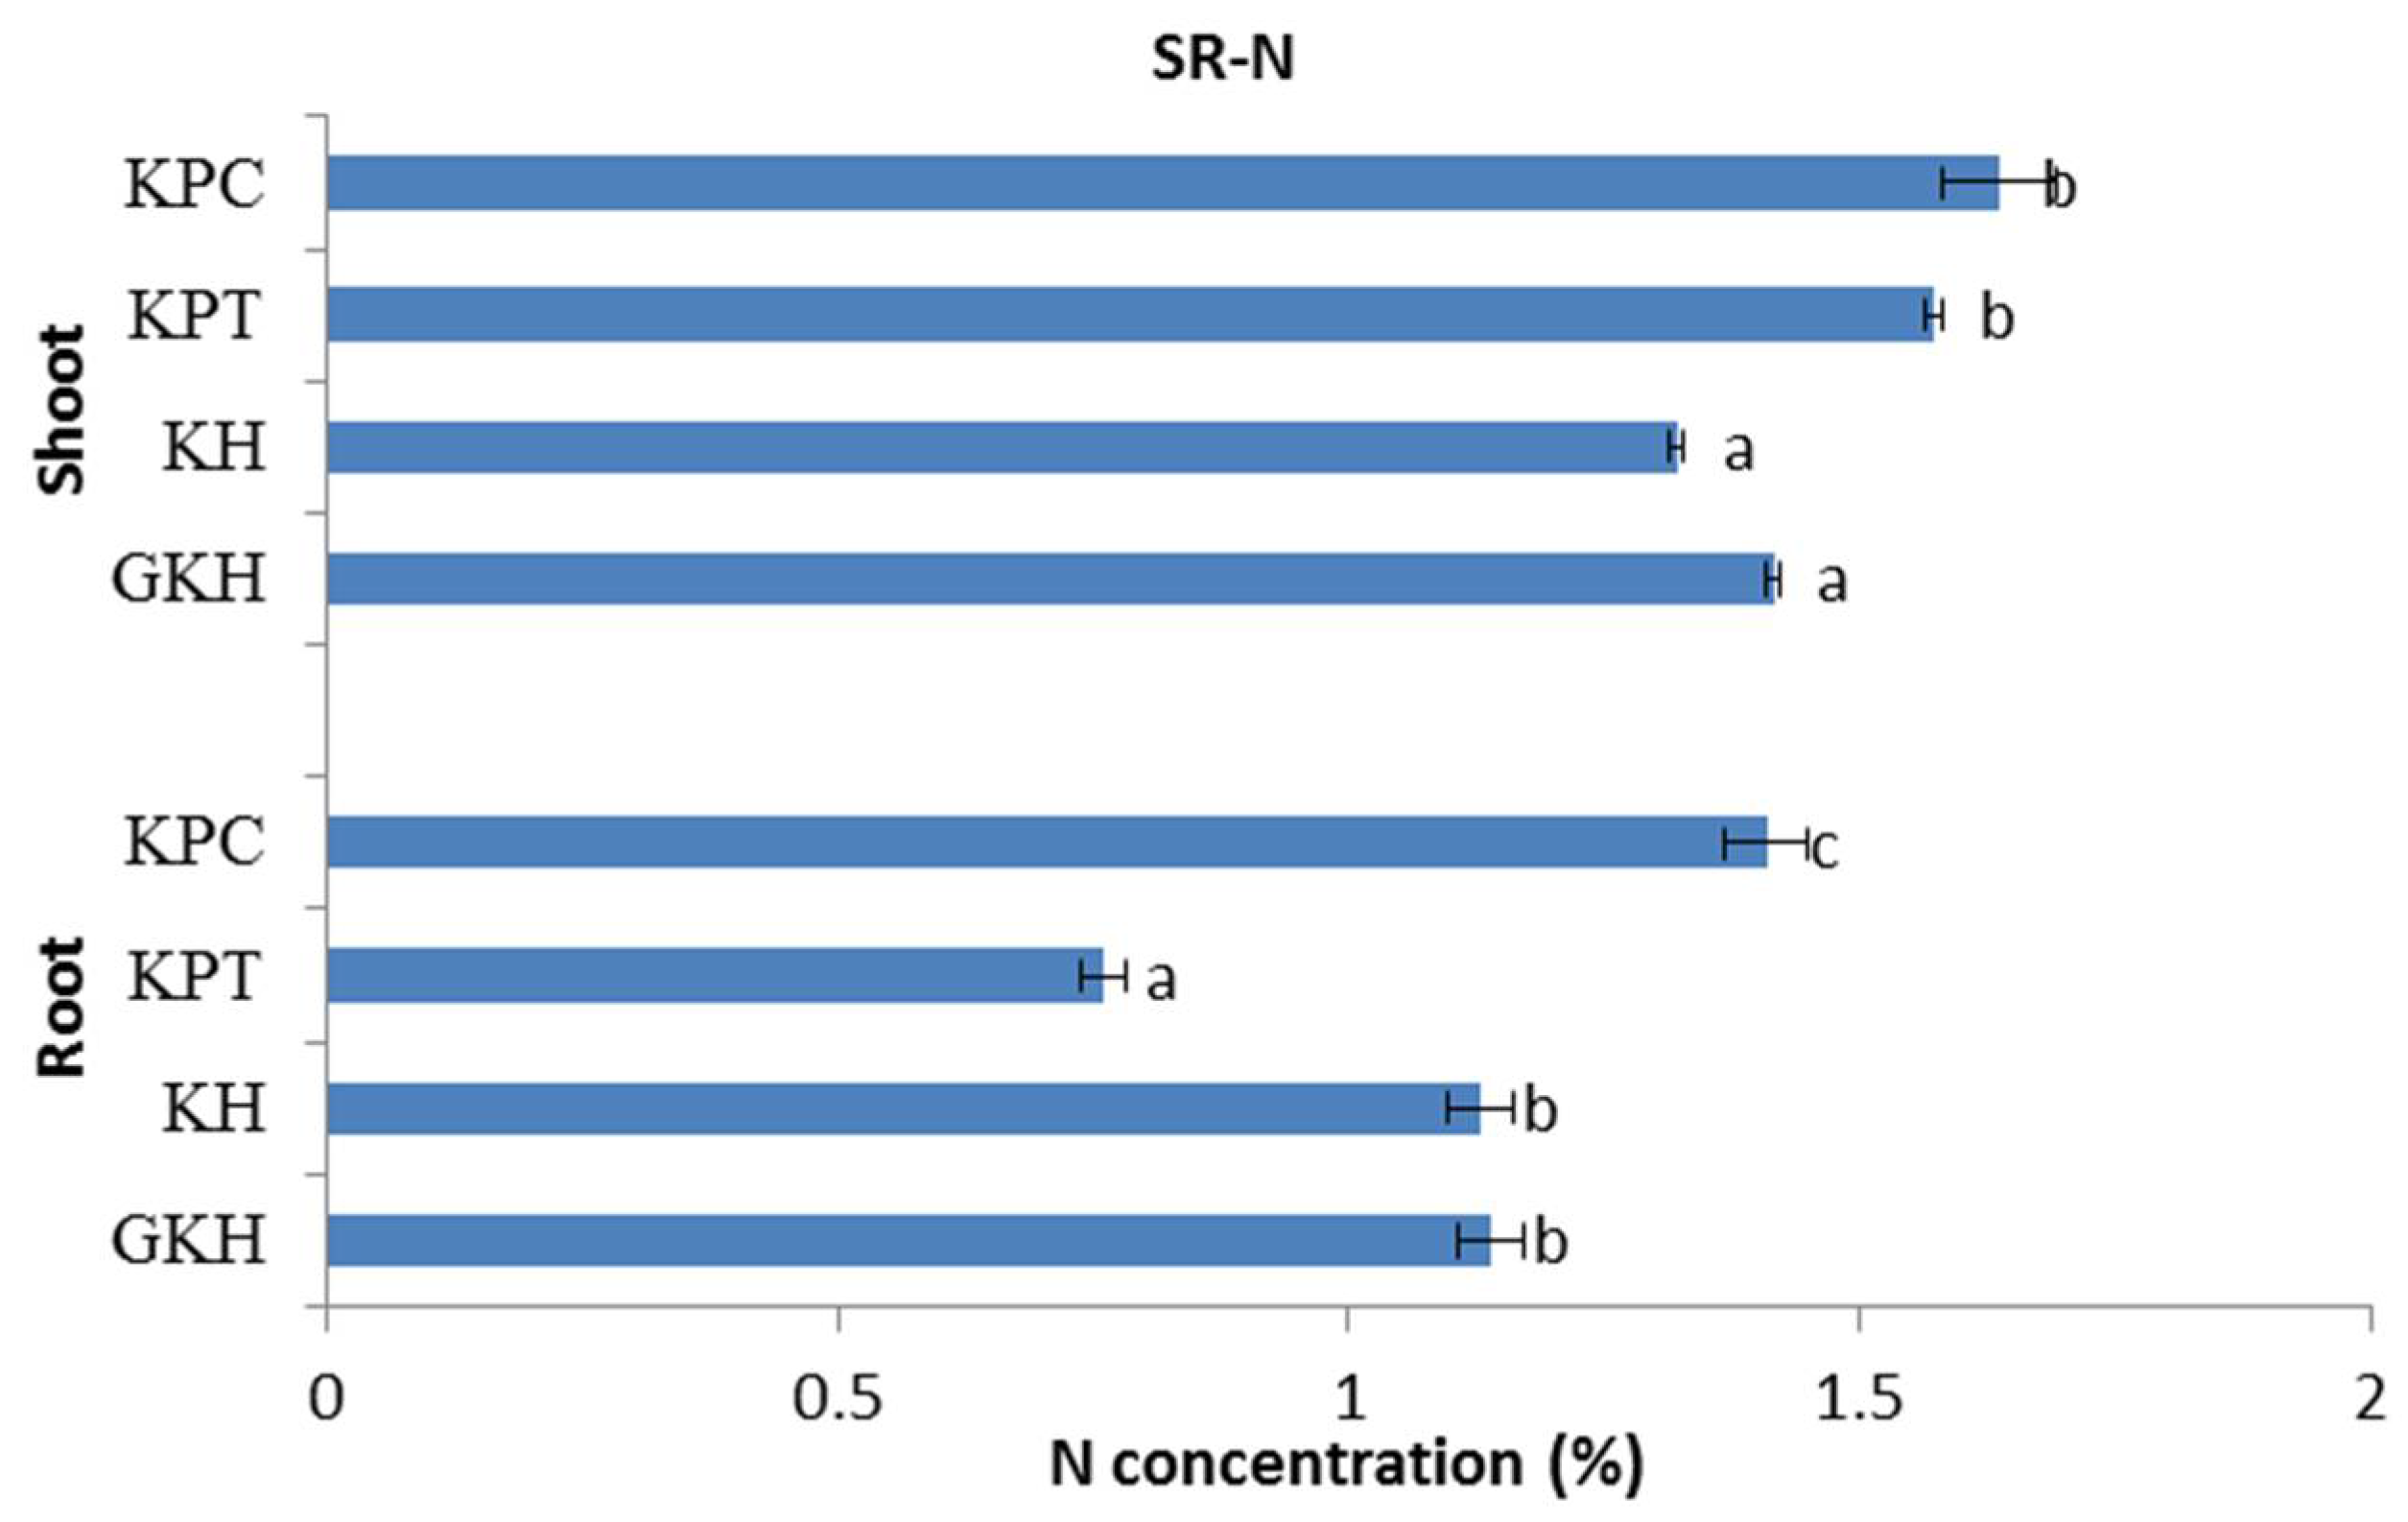
3.2.2. Concentration of N in the Plant Community

N concentrations in the aboveground plant community rose with increasing grazing intensity and were divided into two categories: the first comprised “GKH” and “KH” and the second comprised “KPT” and “KPC.” The N concentrations in the first group were significantly lower than those in the second group (Figure 5).
The trend of N concentrations in the belowground plant community was different from those in the aboveground community. There was no significant difference between the belowground N concentrations in “GKH” and “KH”, but their N concentrations were significantly lower than that in “KPC”, while “KPT” had the lowest value in grazing intensity increased process (Figure 5).

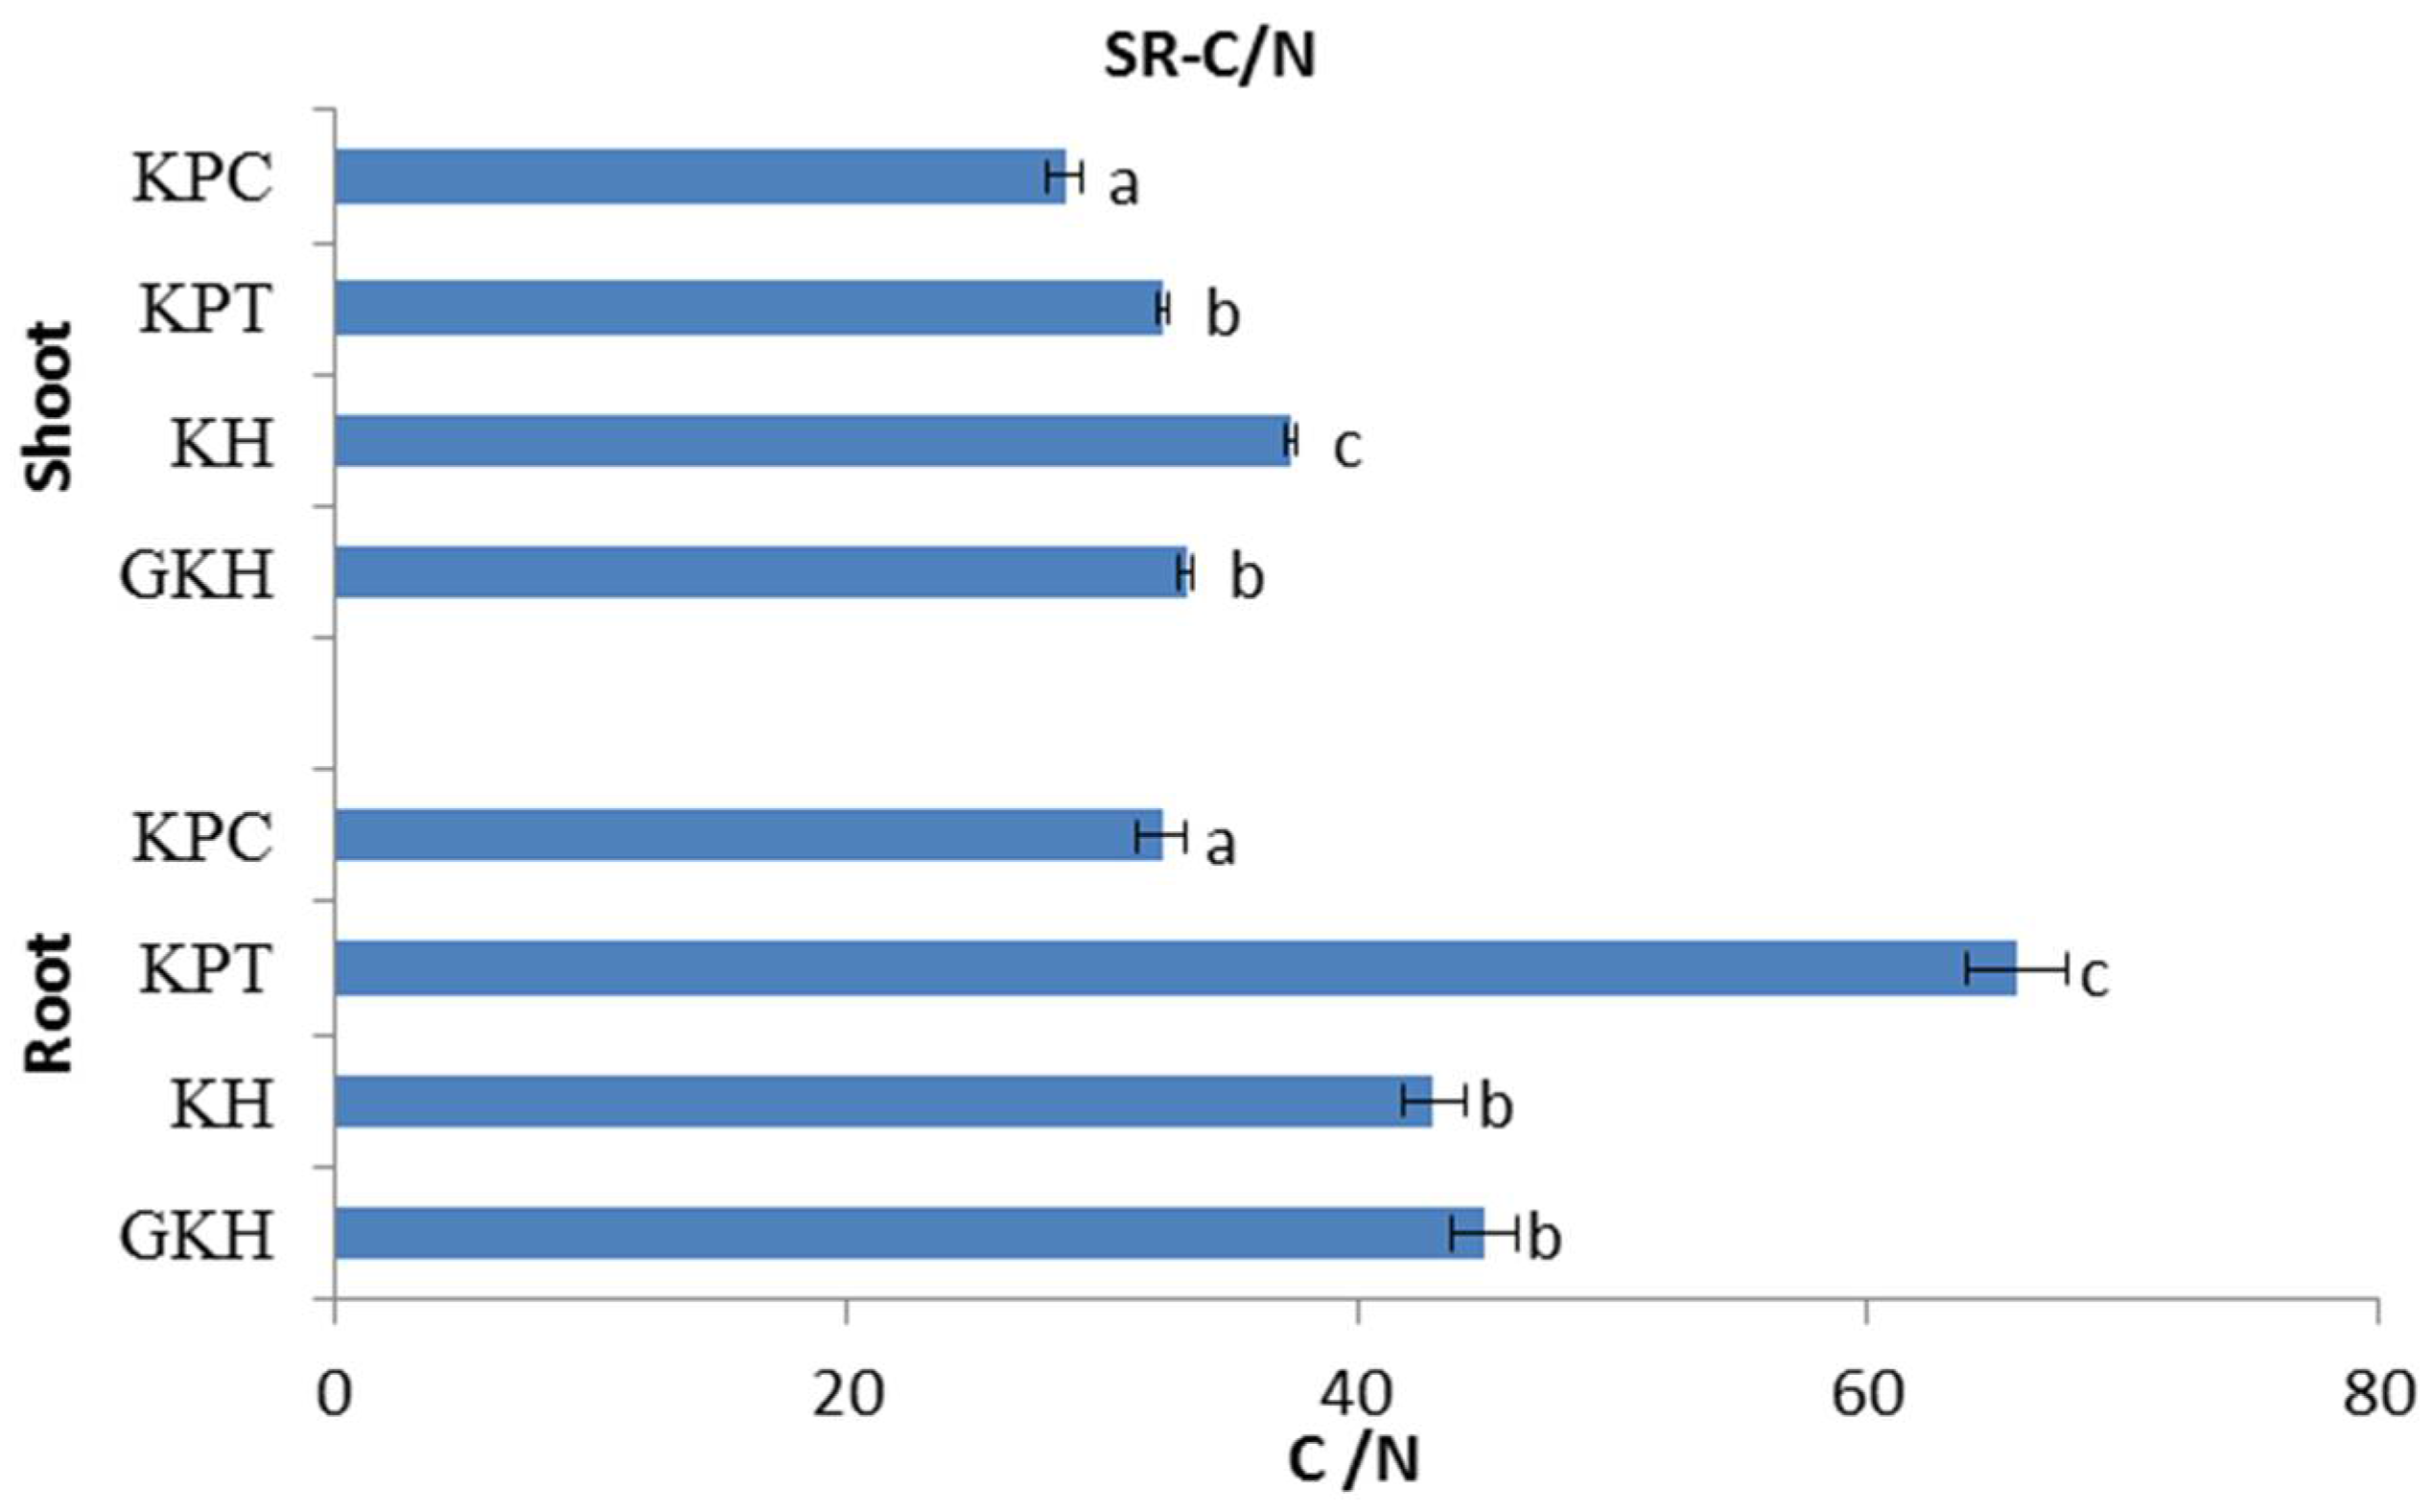
3.2.3. C/N in the Plant Community

The C/N stoichiometry in the aboveground plant community initially gentle increased, and then sharp decreased with the increasing grazing intensity. The highest value of C/N occurred in plot “KH,” while the lowest occurred in plot “KPC” (Figure 6). The trend of C/N in the belowground plant community was similar to that of the aboveground community with respect to increasing grazing intensity, but the highest value occurred in “KPT” (Figure 6).

3.3. Soil Nutrient Content

The concentrations of soil nutrients varied with increasing grazing intensity. The concentrations of organic C, total N, nitrate-N (NO3-N) and ammonium-N (NH4+-N) are the key factors influencing ecological stoichiometry in alpine meadows. We selected these factors to test the interactions between different nutrients in the soil system under different levels of grazing disturbance.

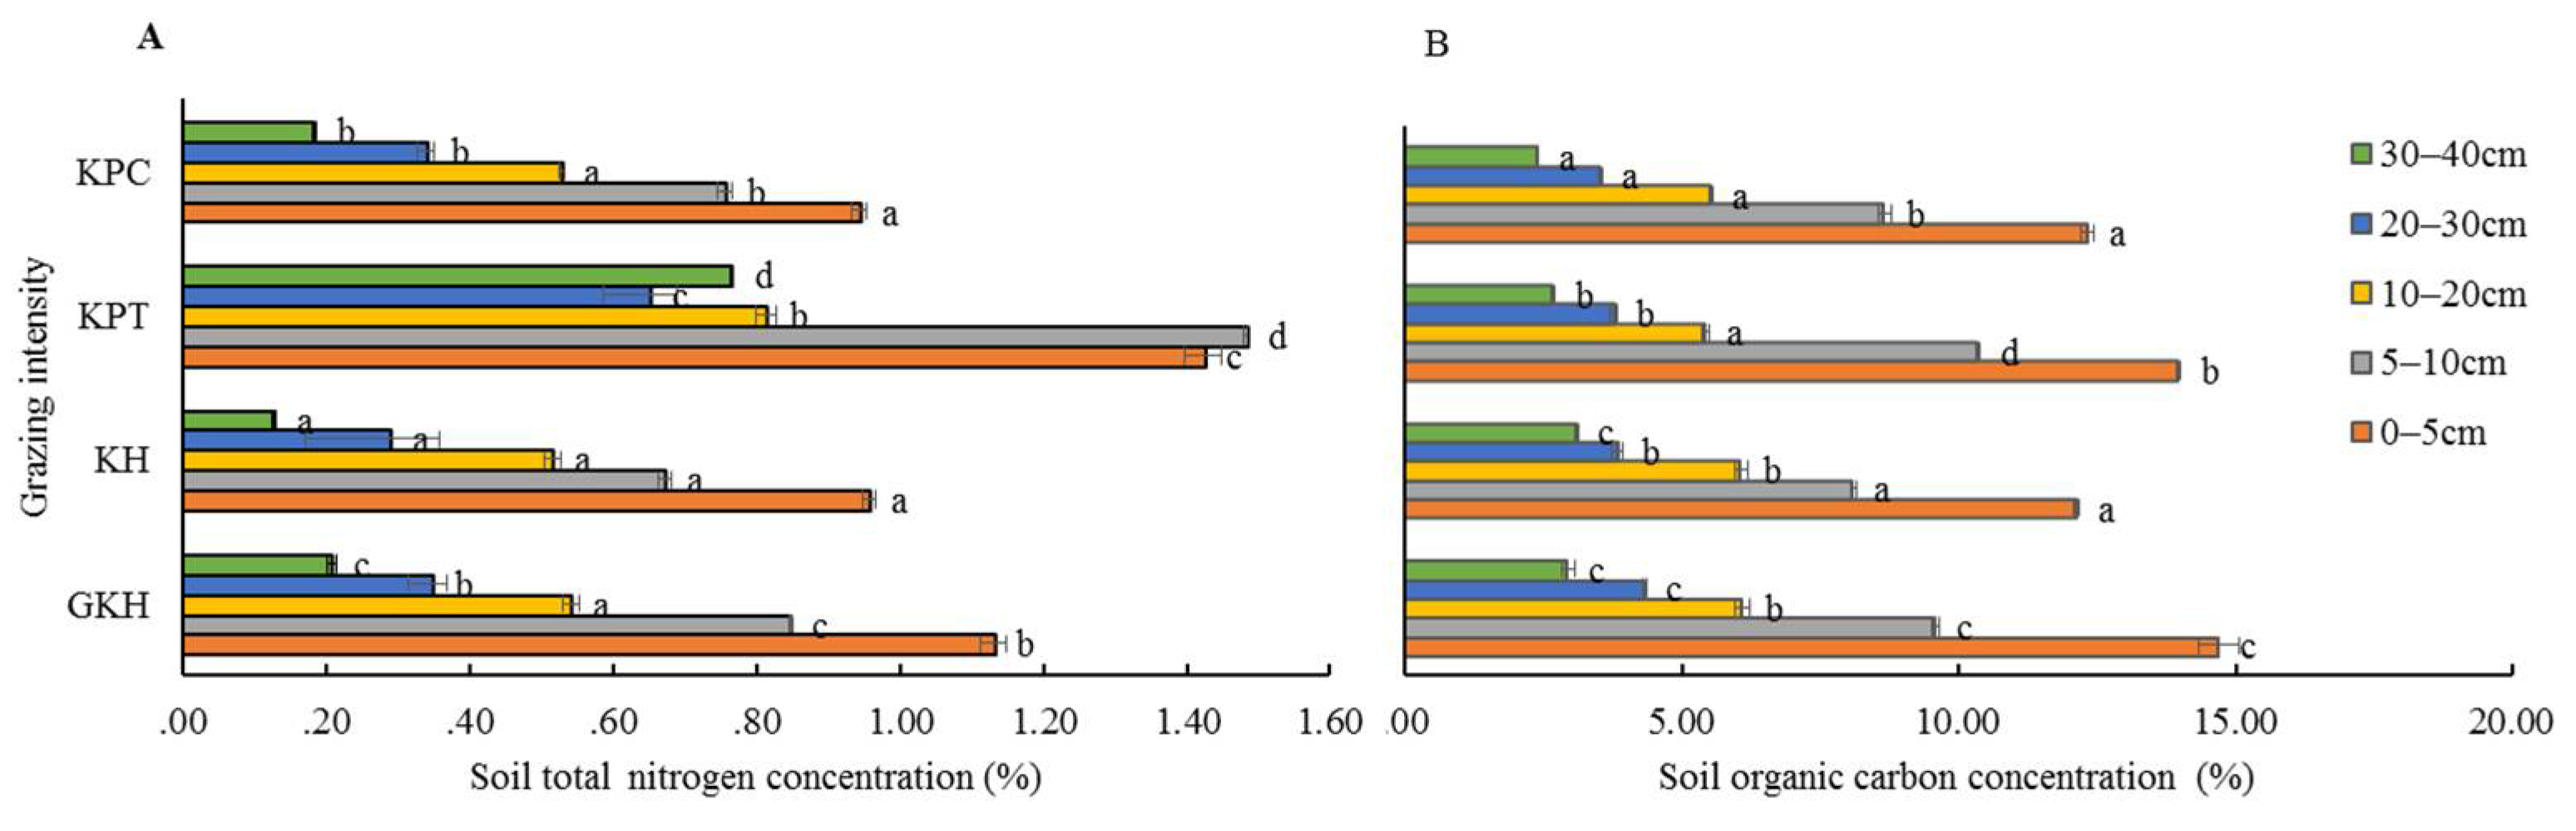
3.3.1. Concentration of Organic C in Soil

The highest concentrations of solid organic C were found in “GKH” at 0 to 5 cm and 10 to 40 cm soil layers, while the lowest ones were found in “KPC” (Figure 7A). In soil layers from 5 to 10 cm, the highest concentration of soil organic C was found samples from in “KPT”, the second-highest concentration was found in samples from “GKH”, the third-highest concentration was found in samples from “KPC”, while the lowest concentration was found in samples from “KPC.” The coefficients of variation in soil organic C concentration in soils from pastures subjected at all grazing intensities were 4.9%, 5.4%, 8.1%, 9.6% and 6.8% at 0 to 5 cm, 5 to 10 cm, 10 to 20 cm, 20 to 30 cm and 30 to 40 cm in“GKH”, “KH”, “KPT” and “KPC” respectively, which were lower than the coefficients of variation for soil organic N concentration. The soil total C had the same coefficient of variation as soil organic carbon with increasing grazing intensity.

3.3.2. Concentration of Total N in Soil

The highest concentrations of total N occurred in “KPT,” while the lowest ones were in “GKH” at all grazing intensities (Figure 7A). The coefficients of variation in total N were 16.1%, 53.3%, 28.3%, 42.4% and 80.8% at 0 to 5 cm, 5 to 10 cm, 10 to 20 cm, 20 to 30 cm and 30 to 40 cm, respectively, at all grazing intensity.

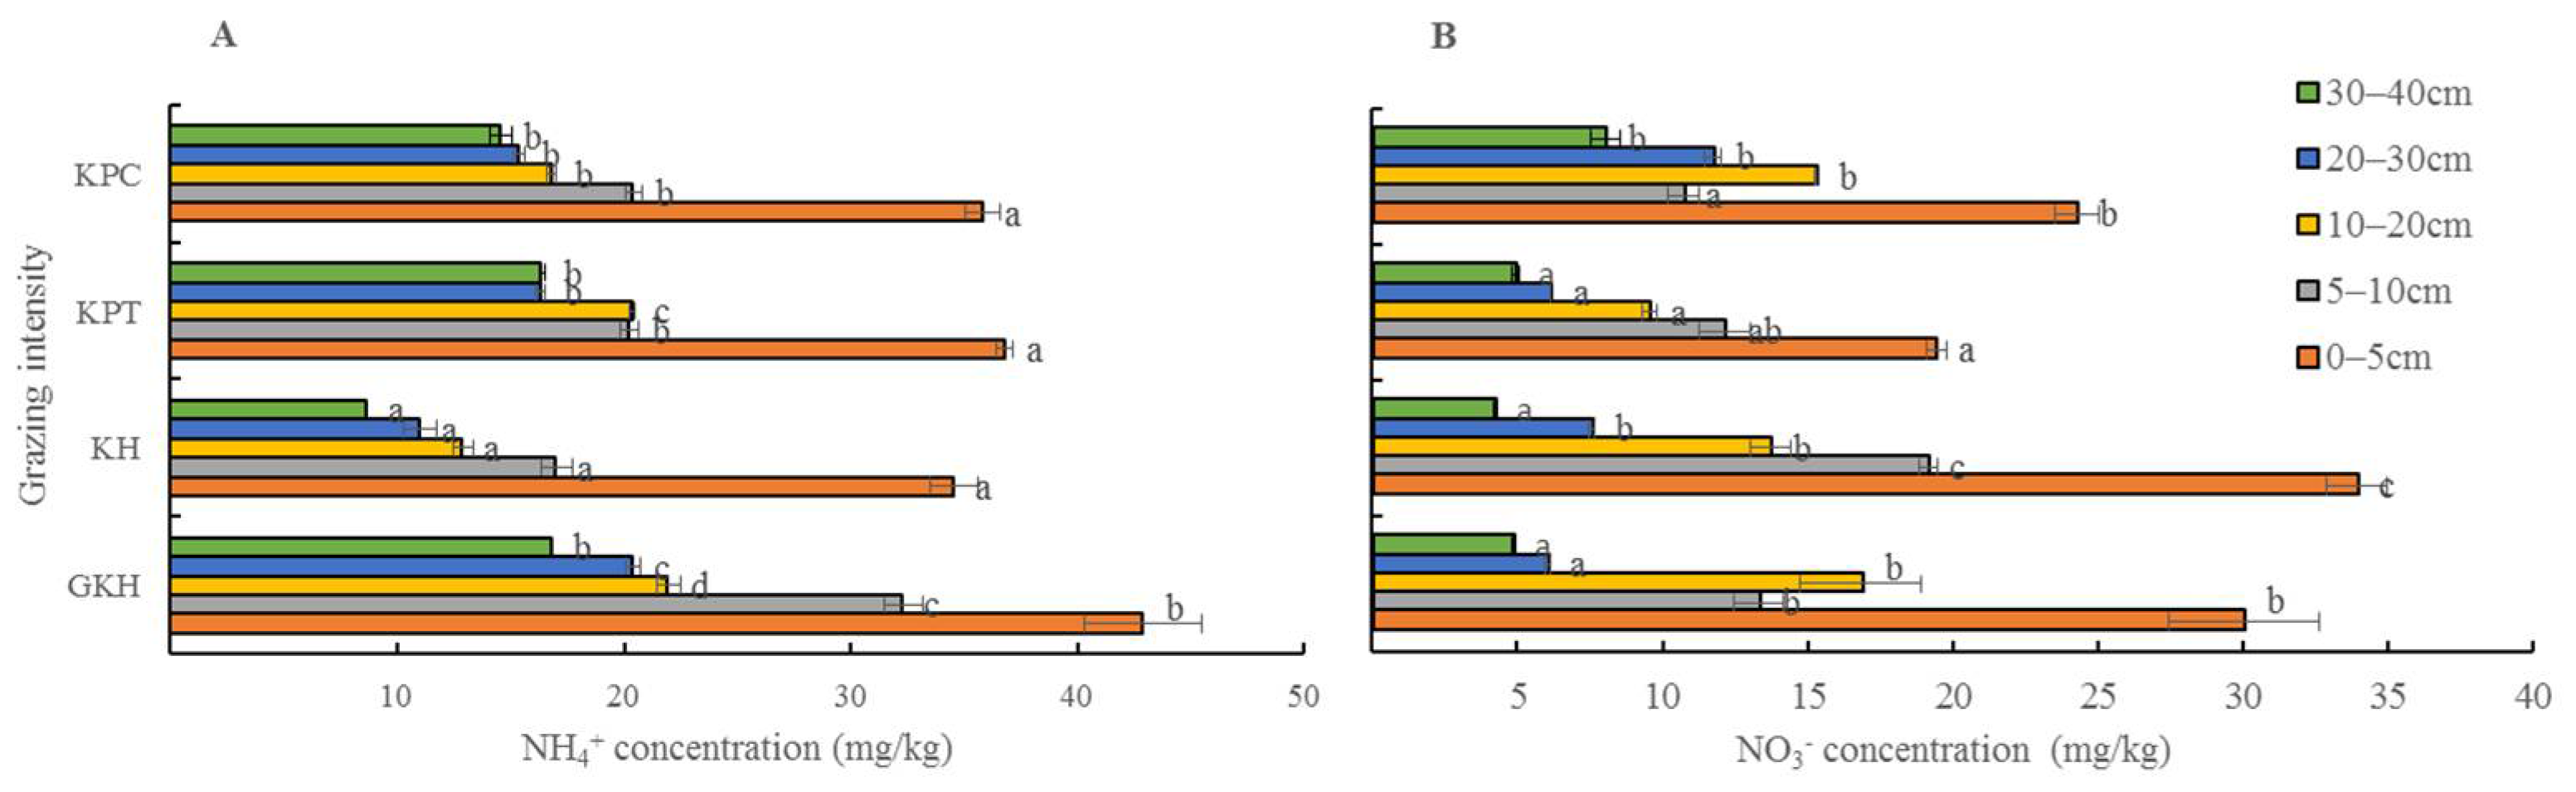
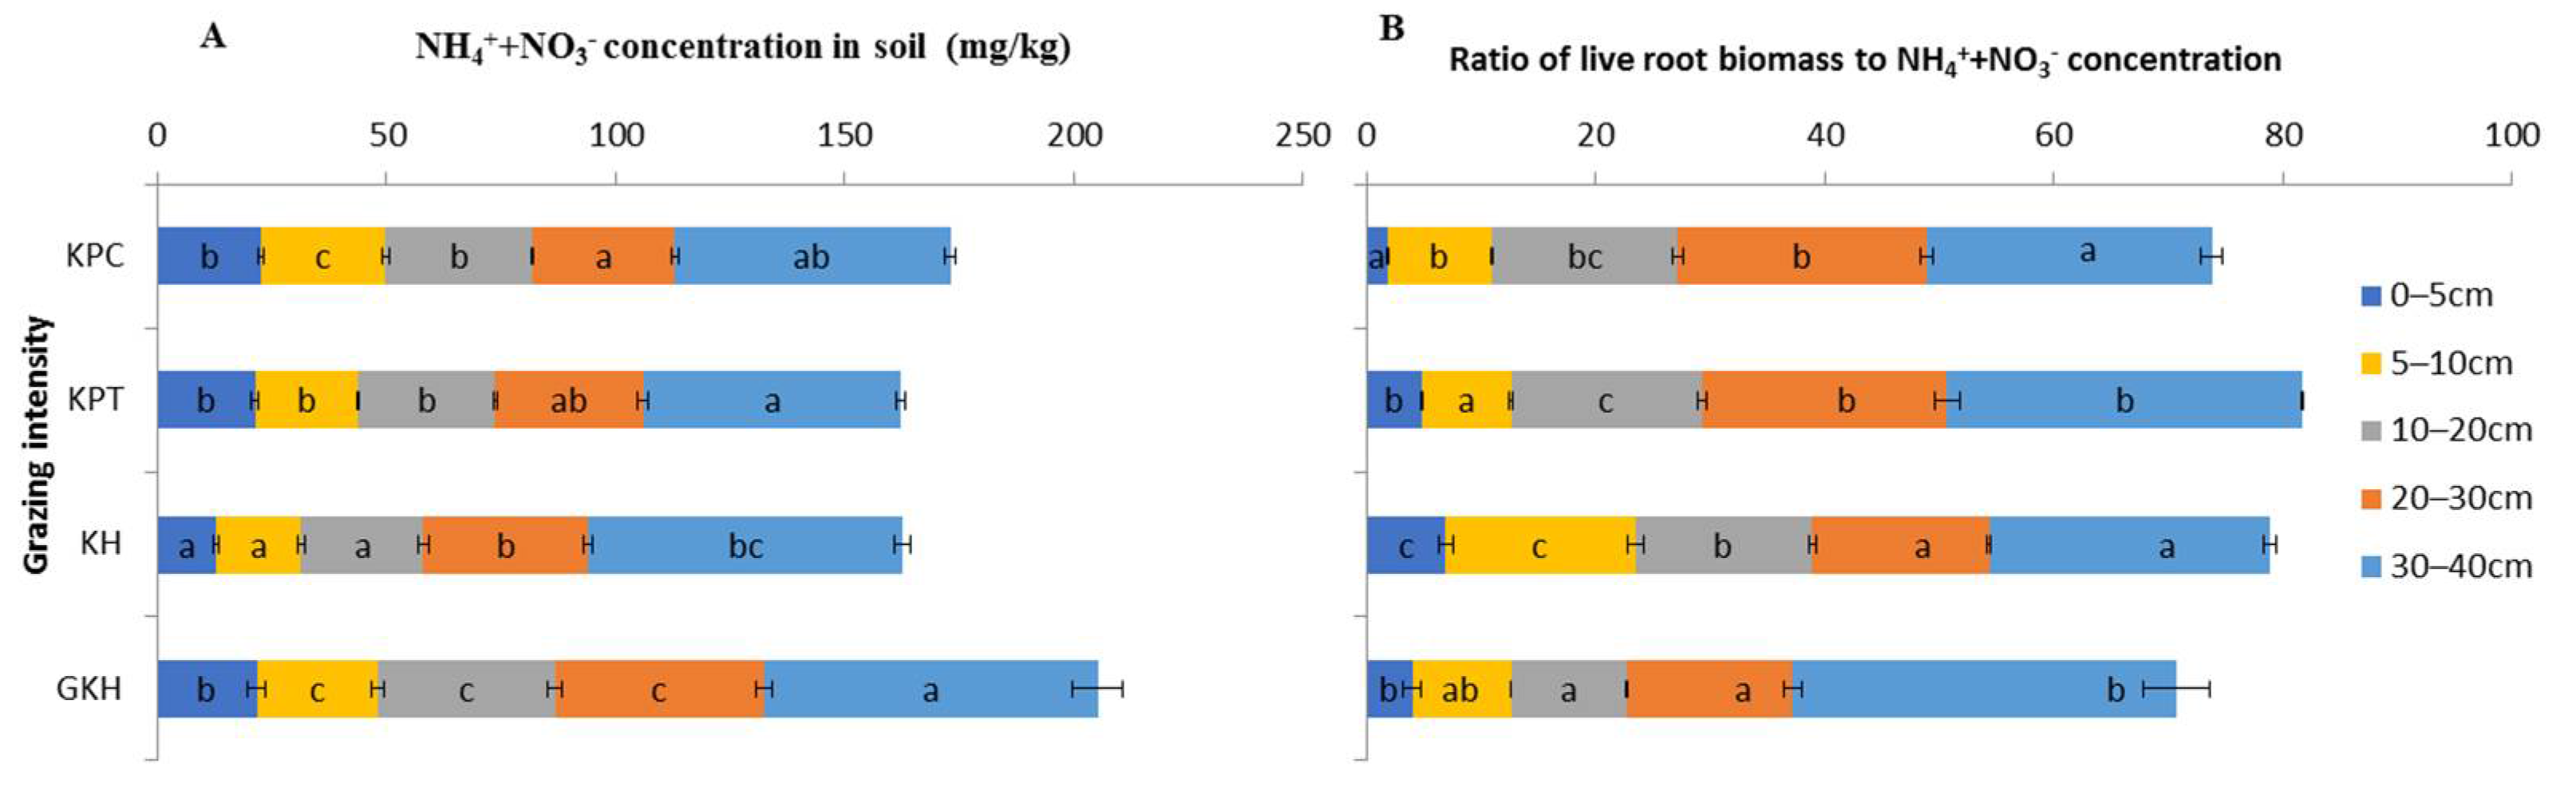
3.3.3. Concentration of Inorganic N in Soil

NH4+-N and NO3-N are considered the most important forms of inorganic nitrogen. The highest concentrations of NH4+-N in the soil profile occurred in “GKH,” while the lowest occurred in “KH” with the increasing grazing intensity. The highest concentrations of NO3-N occurred in “KH,” while the lowest occurred in “KPT” (Figure 8).
With increasing grazing intensity, the concentrations of “NH4+-N + NO3-N” decreased from 72.9 ± 5.5 mg/kg to 60.1 ± 1.4 mg/kg at 0 to 5 cm and from 45.6 ± 1.7 mg/kg to 31.1 ± 0.9 mg/kg at 5 to 10 cm at 10 to 40 cm, the highest concentrations of “NH4+-N + NO3-N” occurred in “GKH” and the lowest concentrations occurred in “KPT”. There were no significant differences between the concentrations of these two inorganic N in most soil layers in plots “KPT” and “KPC”, but the concentrations were significantly lower in “KH” and “GKH” than those in “KPT” and “KPC” (Figure 9A).
The ratio of live root biomass to “NH4+-N + NO3-N” concentration (LR/IN) represents the load of inorganic N offer to the growth of root tissue. We found that LR/IN increased from 84.1 ± 5.0 g/m2/(mg/kg), via 93.7 ± 2.0 g/m2/(mg/kg) and 99.0 ± 1.3 g/m2/(mg/kg), decreased to 86.1 ± 2.1 g/m2/(mg/kg) at 0 to 40 cm responded to “GKH”, “KH”, “KPT” and “KPC” which was in the order of increasing grazing intensity, but the values varied at different soil layers in different grazing intensities. Overgrazing would thus increase the deficit of those two kinds of inorganic N on roots growing by 11.4%, 17.7% and 2.4% compared to those in “GKH” at 0 to 40 cm soil as grazing intensity increased by 93.3%, 126.7% and 213.3% compared to the disturbing intensity in “GKH”. LR/IN maintained a “N” shape decreasing trend at 0 to 5 cm with increasing grazing rate, but significantly increased (from 47.5% to 65.0%) at 5 to 20 cm compared to in “GKH” which was in the lowest grazing intensity in the research (Figure 9B).

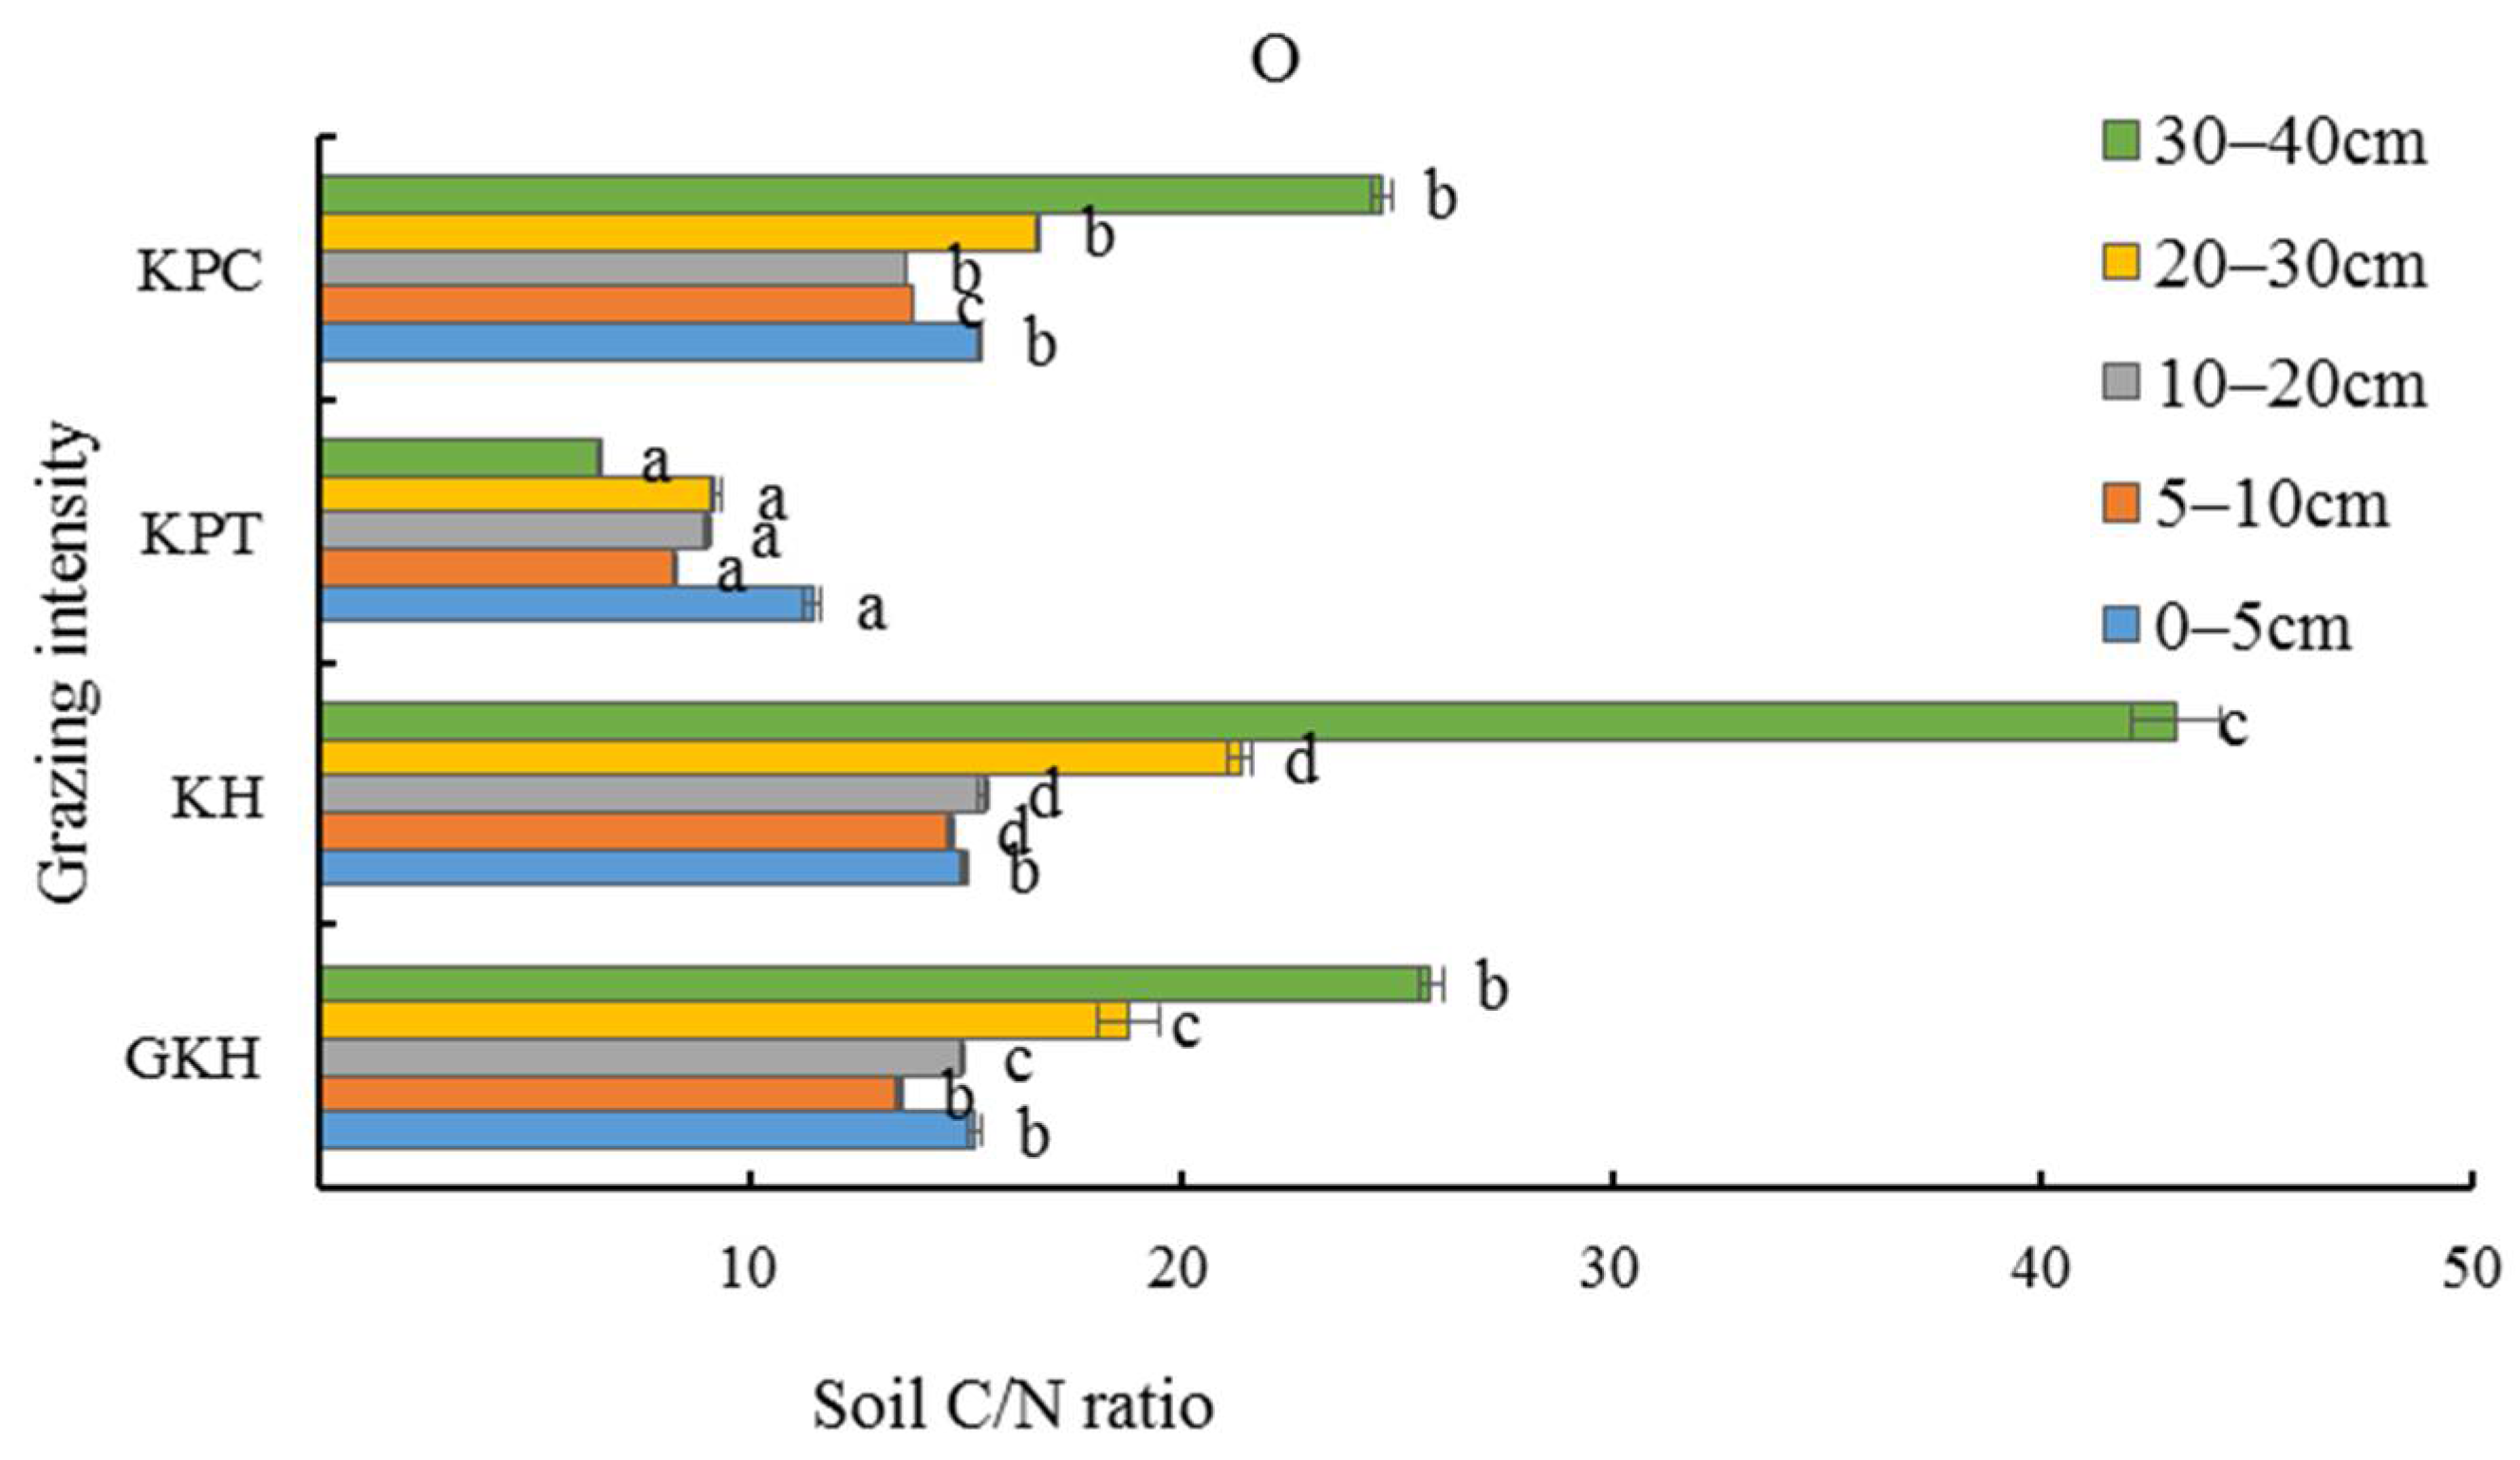
3.3.4. C/N Stoichiometry in Soil

The stoichiometric characteristics of soil OC/TN (organic carbon/total nitrogen) at 0 to 20 cm was lower than at other soil layers in the aboveground plant community. The lowest soil OC/TN (<14) was found in all soil layers in “KTP”. The OC/TN values in most of the soil layers in the other three plots were greater than 15 (Figure 10), and had the same trend of coefficient of variation as soil TC/TN (total carbon/total nitrogen) with the increasing grazing intensity.

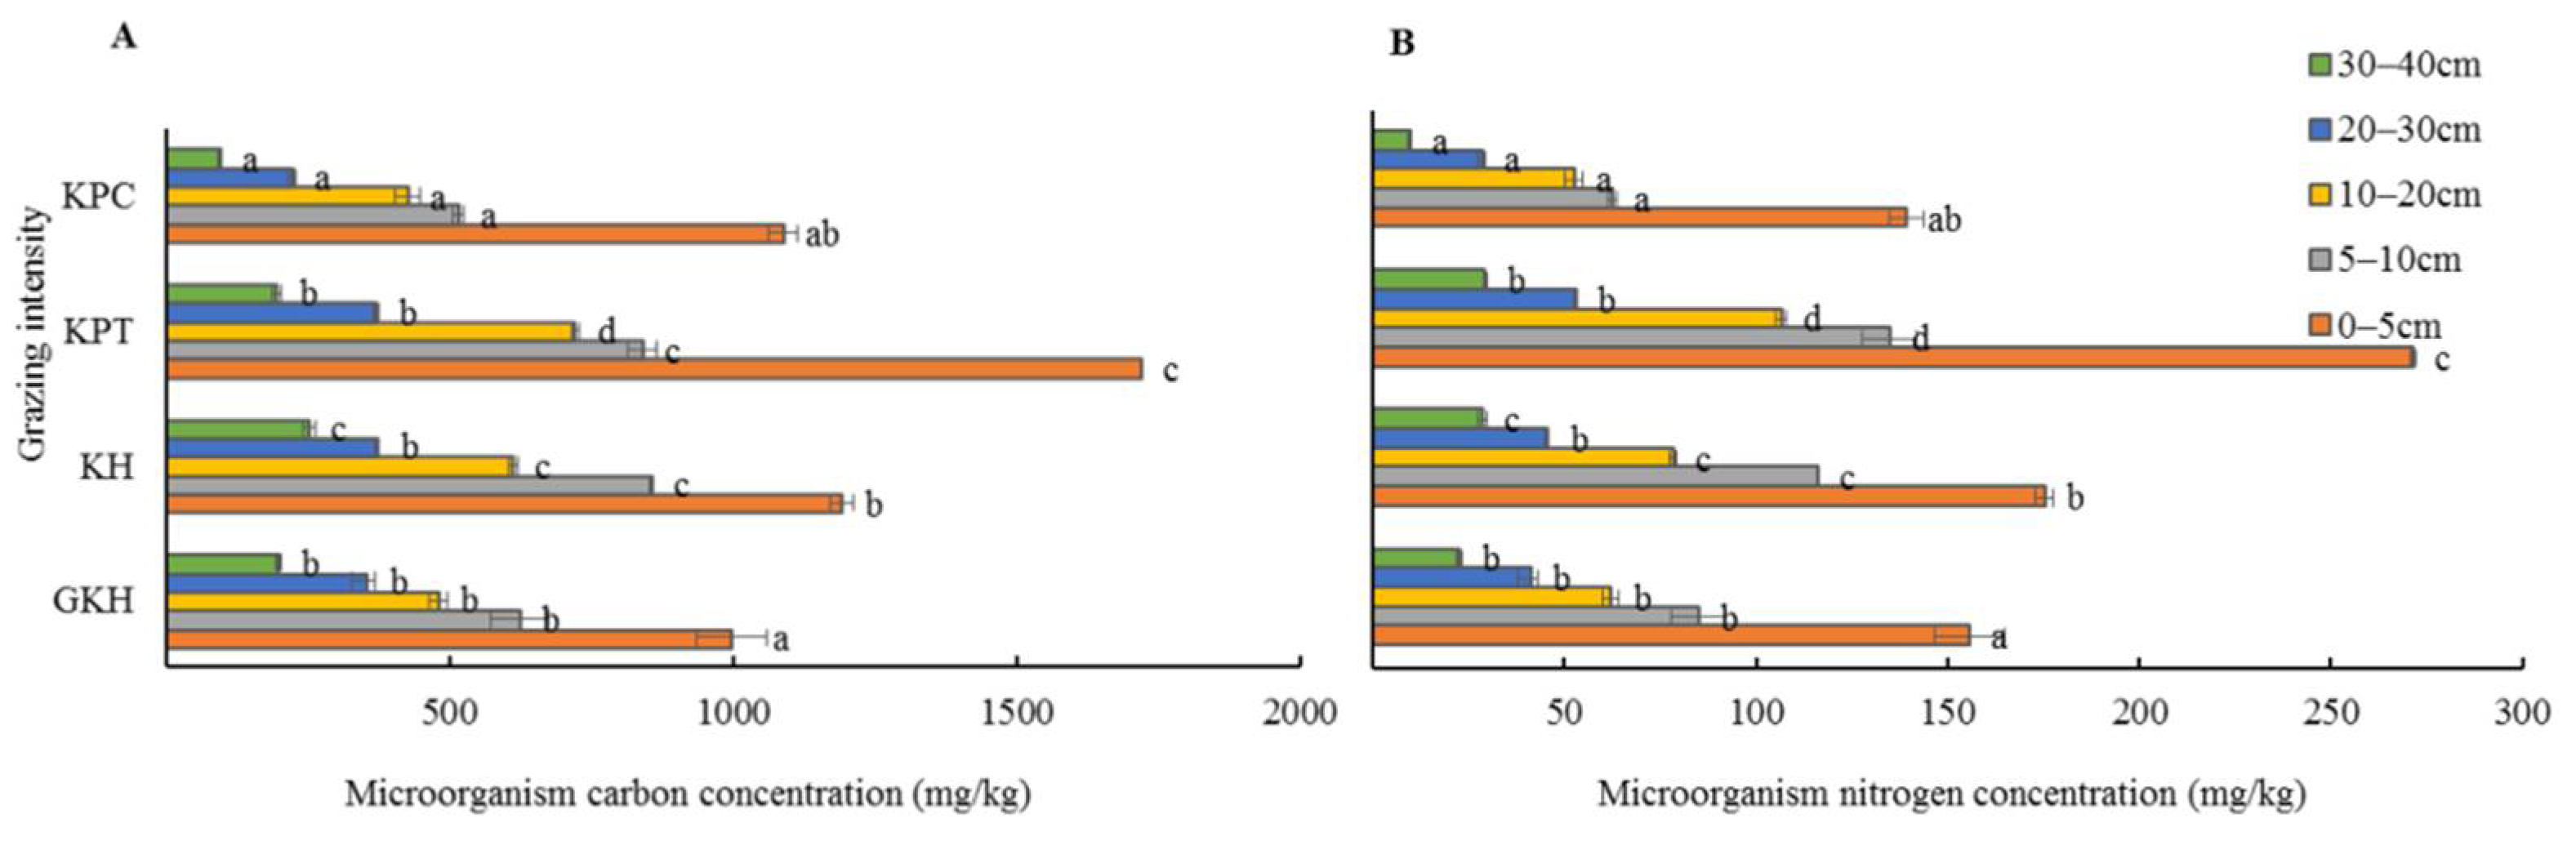
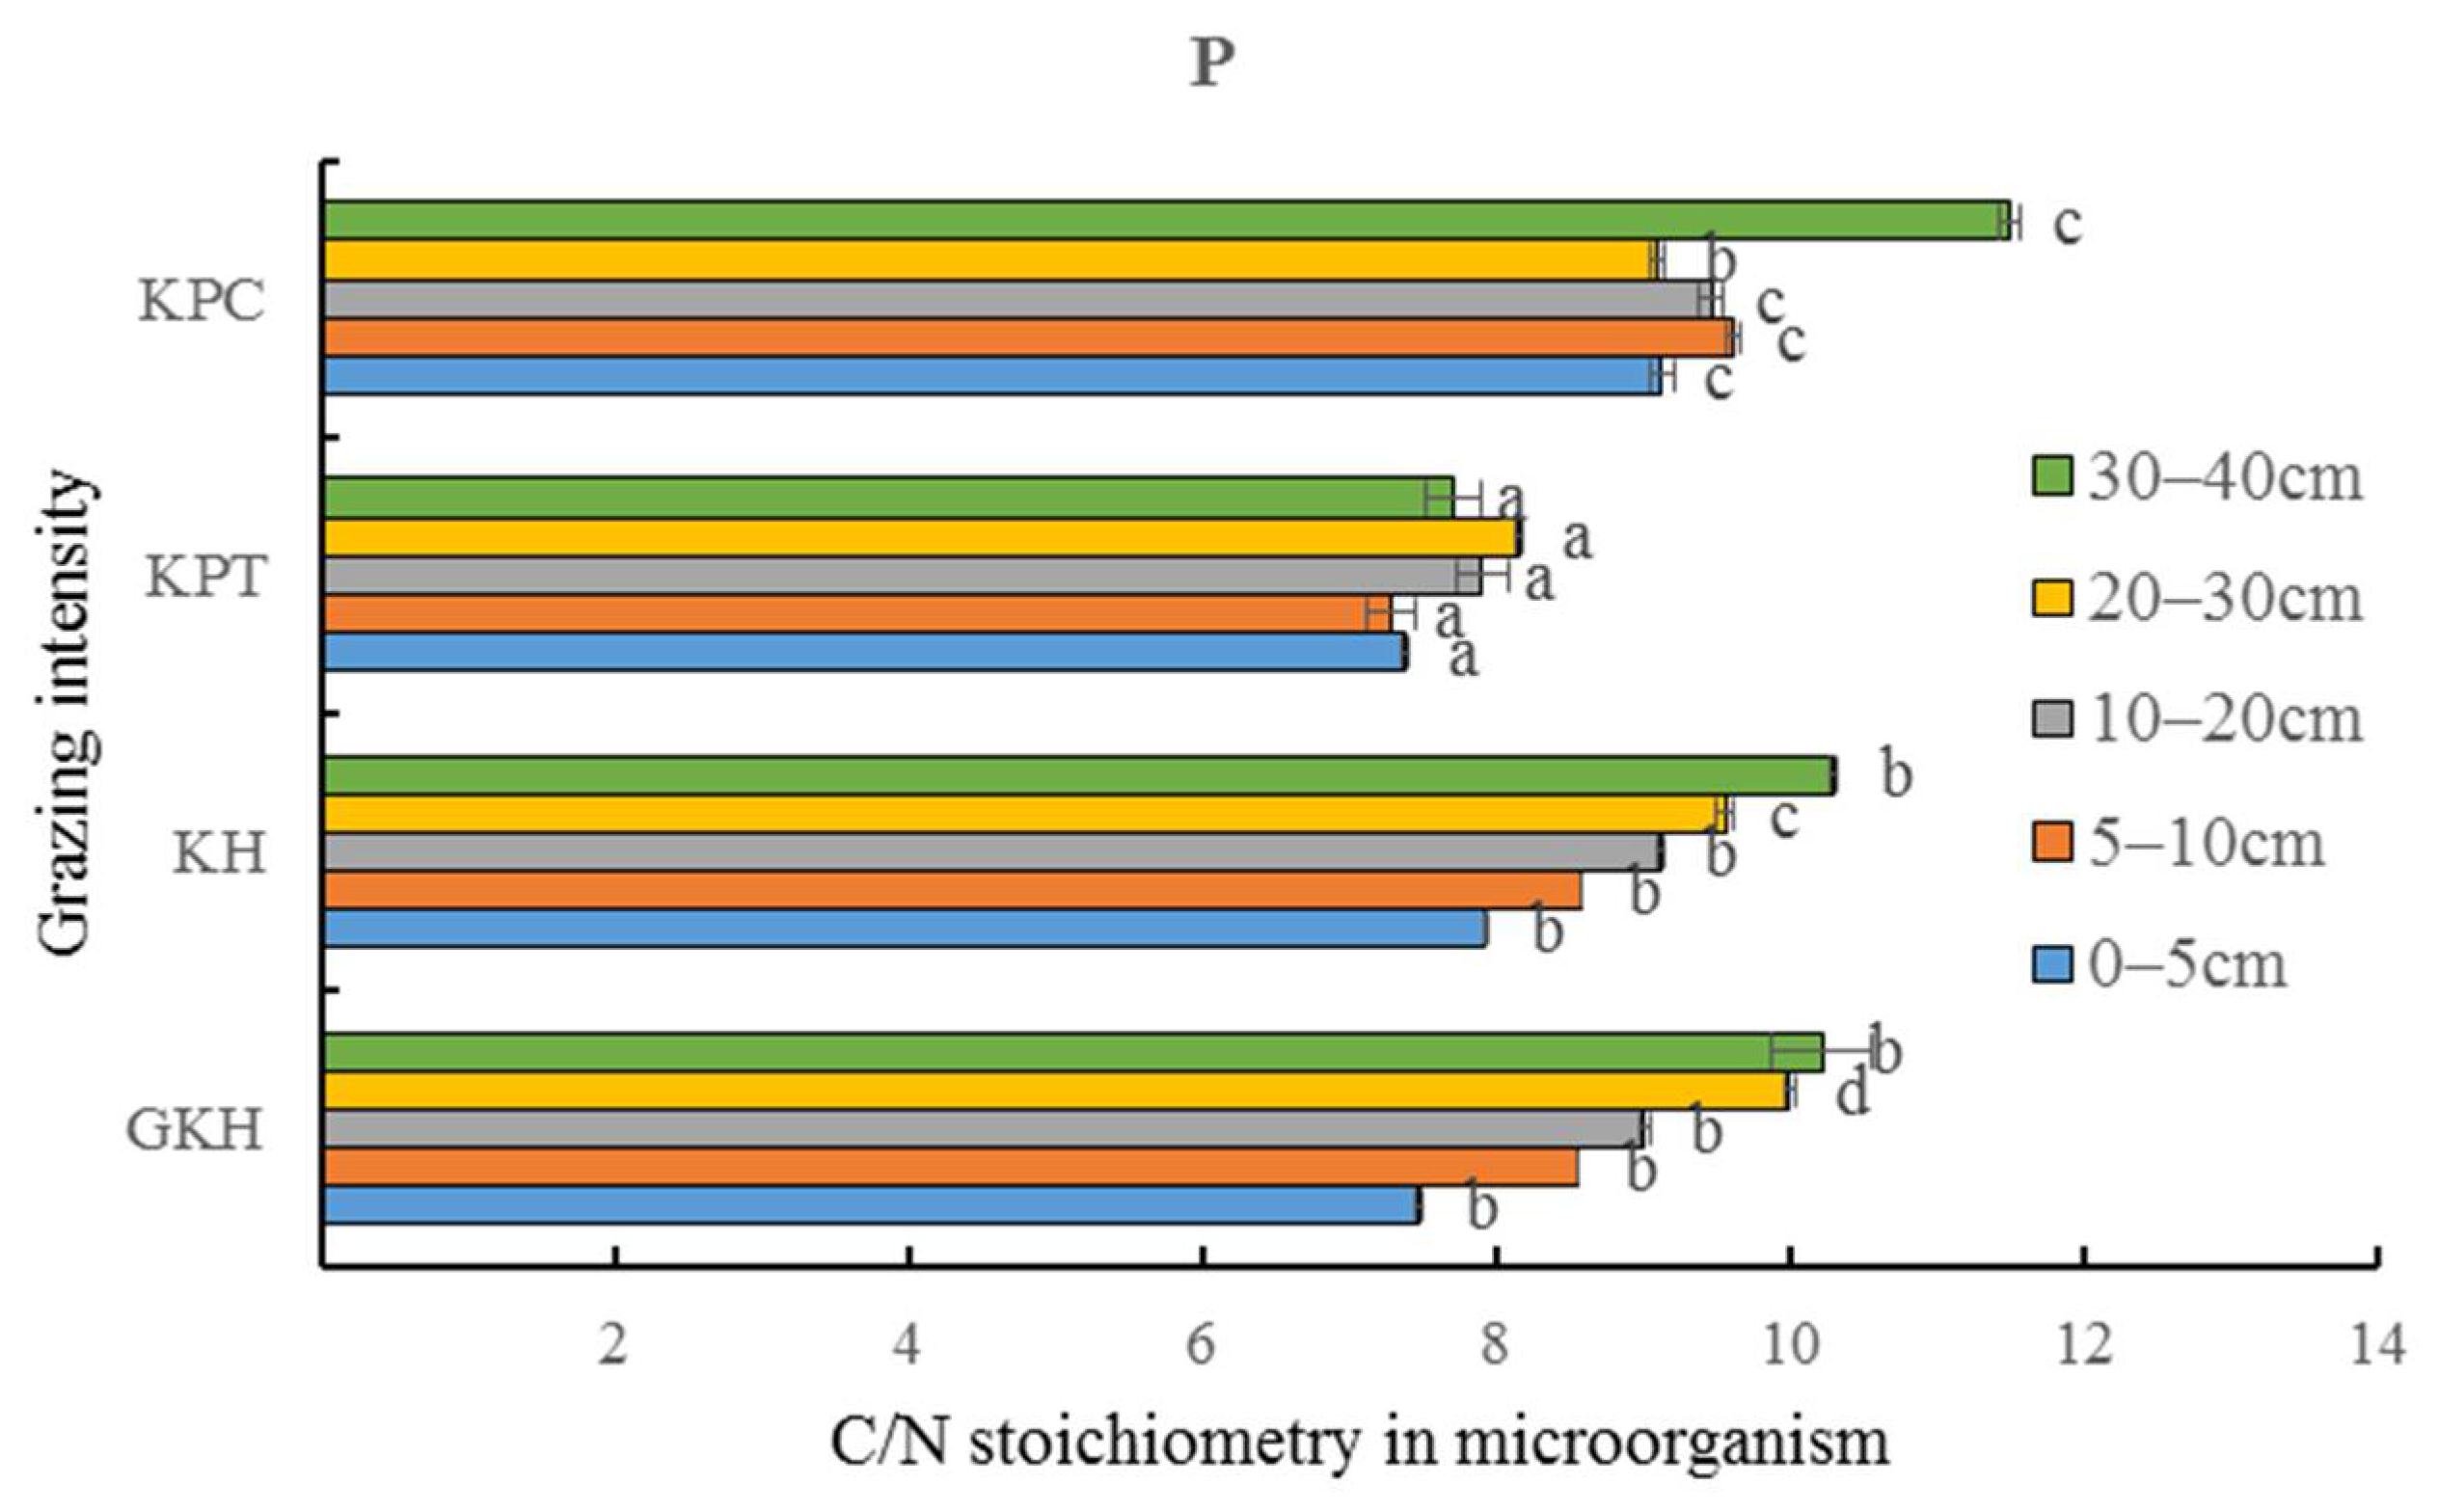
3.4. Quantity of C and N in Soil Microorganisms

The concentration of soil microbial C and N concentration showed an invert “V” shape with increasing grazing rate. The highest values were in “KPT” which were significantly higher than those in all other plots, whereas the lowest values appeared in “KPC” in most of the soil layers in the increasing grazing process (Figure 11). The variation of concentration in soil microbial C and N did not have a significant synchronous with grazing intensity modified.

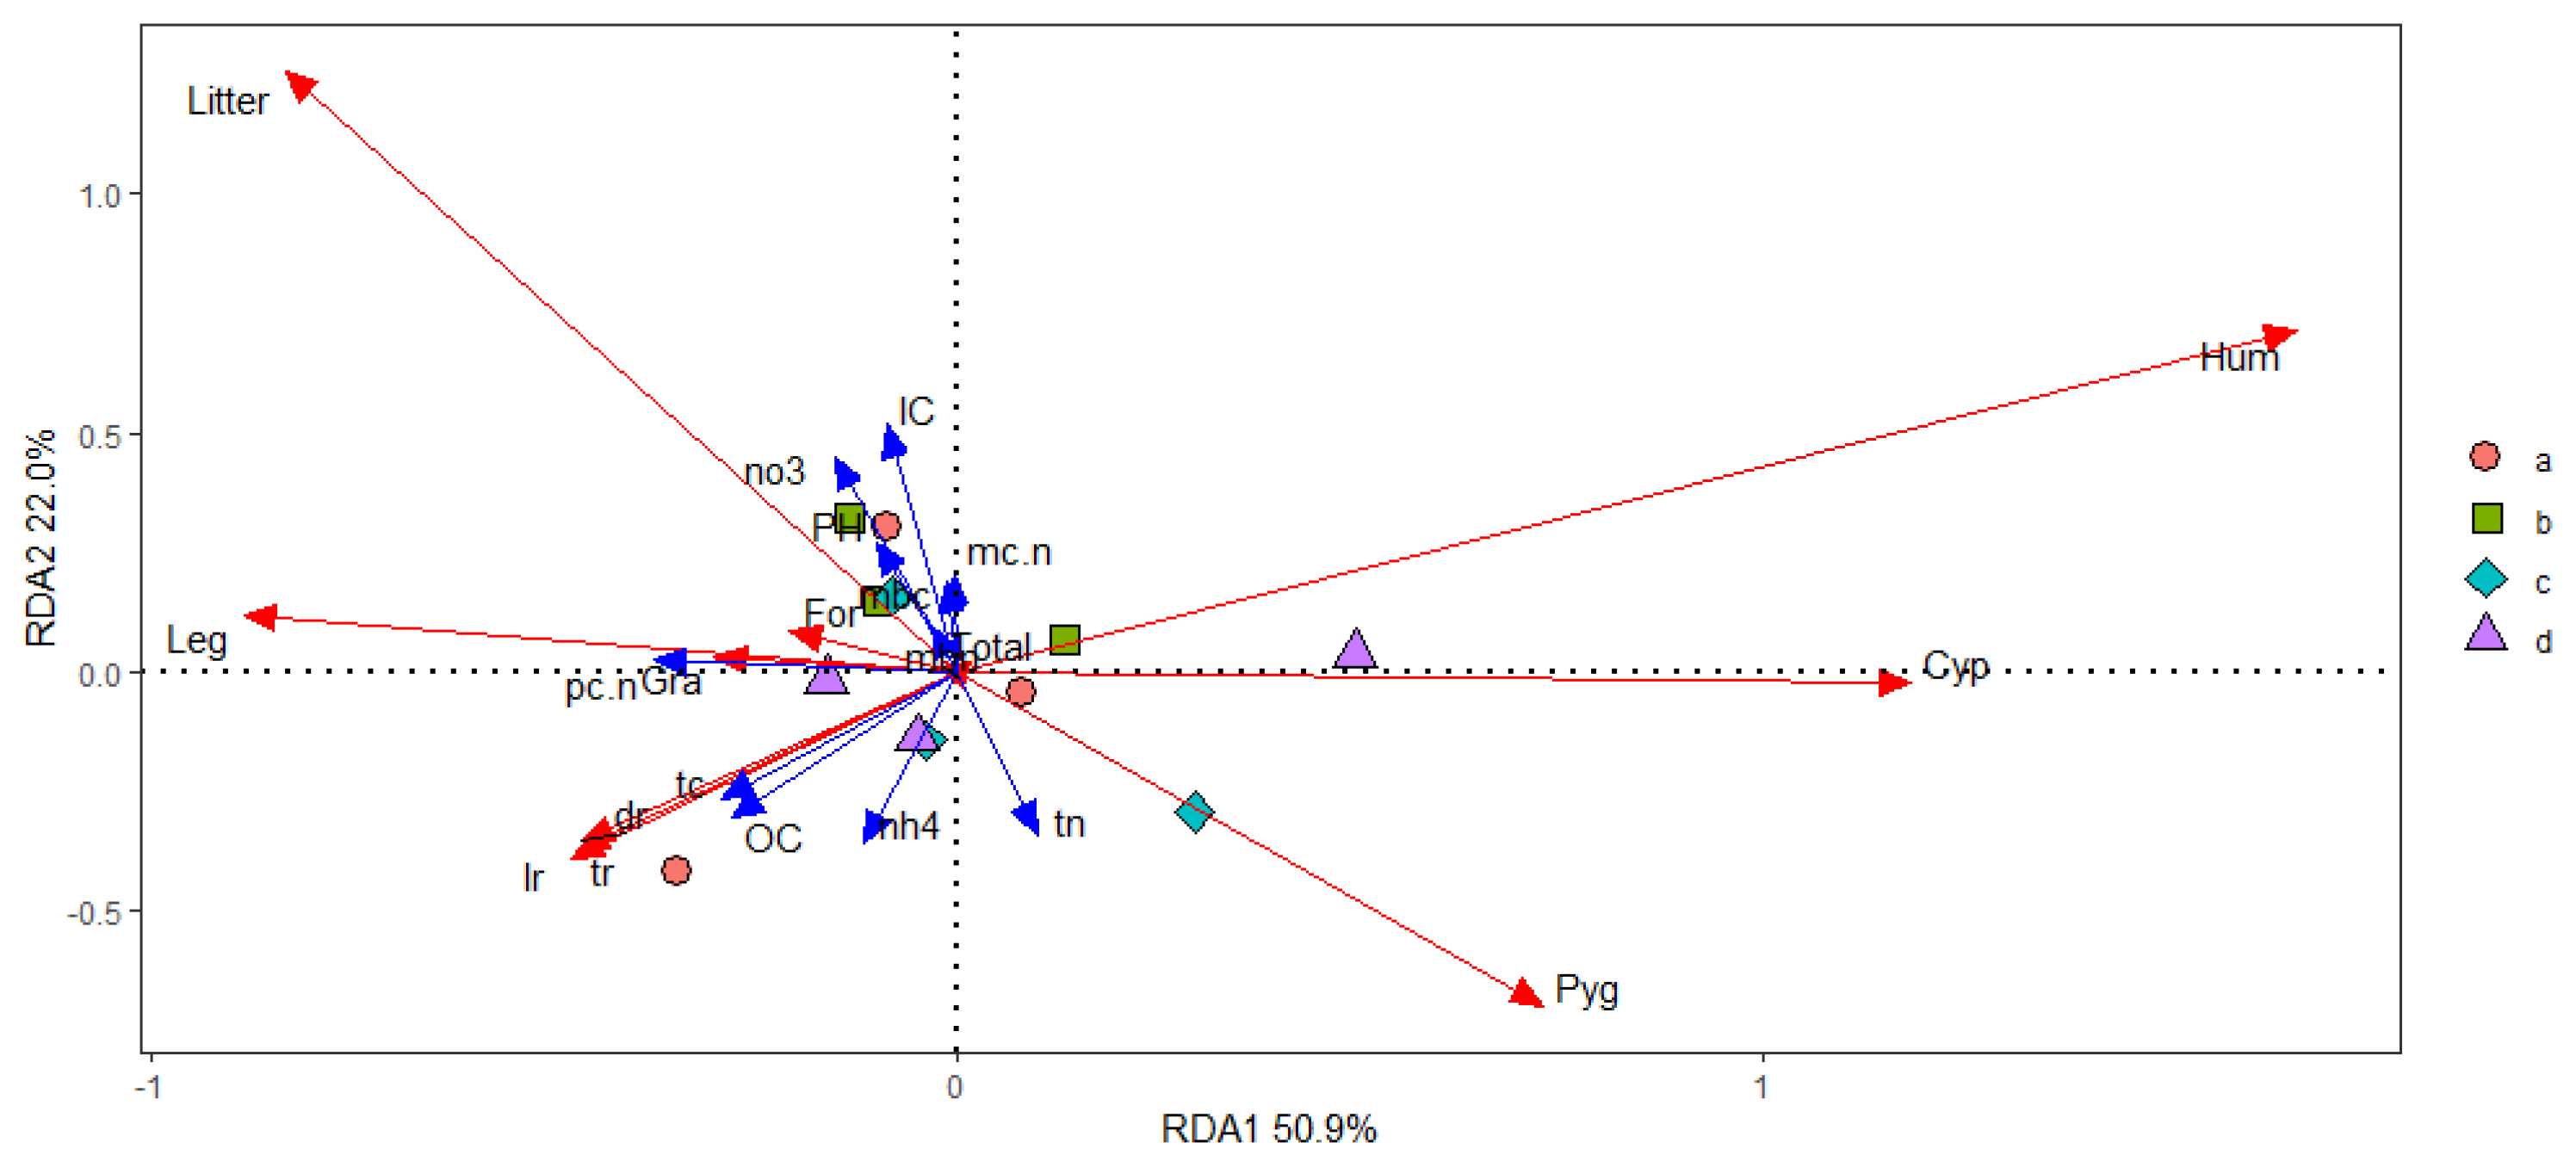
3.5. The Relationships between Plant Community Yield, Soil Nutrients and Soil Microbes Mediated by C and N under Overgrazing

The C/N stoichiometry in soil microorganisms remained stable with a range of coefficients from 2.0 to 3.0% at 0 to 30 cm, which were lower than those of total soil C/N (3.4 to 8.4%) (Table 3). The variation coefficient of soil microorganism C/N and total soil C/N decreased with increasing grazing intensity. “KH” had the highest variation coefficient in the balance of soil and soil microorganism C and N, showing that a persistently high grazing intensity increased C and N concentrations, but the degree of increasing of concentration of C and N were different (Figure 12), which could lead to an imbalance in the ecosystem.
We calculated the concentrations of soil microbial C(mbc) and N(mbn), soil total C (TC), organic C (OC) and inorganic C (IC) and soil total N (TN), soil NH4+-N (nh4) and NO3-N (no3), soil pH, stoichiometry of soil microbial total C to total N (mc.n), plant community total C to total N aboveground (pc.n), soil organic C to soil total N (sc.n), and soil total C to soil total N(tn.tc) as the environment factor to explain the variation of the biomass in dead(dr), living(lr), and total root tissue(tr), and Gramineae, Cyperaceae, Leguminosae, Forb, K. humilis, K. pygmaea, and the litter aboveground with grazing intensity altering. The environment factors revealed that 83.9% of the variance could be explained by three factors (Figure 13). The first factor was the C concentrations in the plant community and soil, and explained 50.9% of the variance with grazing intensity increasing, and this factor correlated to the yield of K. humilis, K. pgymaea, and Cyperaceae. The second factor was the available nutrient contents in the soil, and explained 22.2% of the variance with grazing intensity increasing, and this factor correlated to the yield of litter aboveground. The third factor was the C/N balance in shoots and the amount of soil total N, and explained 11.0% of variance with grazing intensity increasing, and this factor correlated to the yield of Gramineae of the biomass aboveground. (Figure 13).

4. Discussion

4.1. Overgrazing Initially Drove Ecosystem Degradation by Reducing Nutrient Concentrations and Biomass, Triggering a New Ecosystem Succession Process

Overgrazing changed dead and living root distributions, causing dead root tissue to gather near the soil surface and the amount of living root tissue to decrease. This was primarily due to nutrient shortages. Most researches have shown that a range of overgrazing intensity triggers a plant community to grow more root tissue in response to biomass removal by herbivores [6]. Subsequently, more photosynthetic products are consumed by livestock and more nutrients are transformed under overgrazing, particularly under grazing in spring, leading to decreased root and shoot biomass [36].
The nutrient shortage was due to overgrazing which may initiate a chain reaction in the soil–plant system, which increases nutrient competition between the root and soil microorganisms [26], increases the deterioration of soil nutrients [37,38], compresses the available space for roots living [6], and reduces live root activity by changing the rate of soil nutrient cycling, transformation and accumulation [39]. It also decreases soil microbial activity and root exudate production [40], transforms the ratio of energy supply and biomass production by different microorganisms [41,42], rapidly increases the R/S and strengthens the mattic epipedon by root anchoring and reinforcement [43], and decreased living root tissue while increasing dead root tissue near the soil surface (observed in the research).
Previous studies have shown that cracking in the mattic epipedon is one adaptation strategy used to resist herbivore overgrazing, and the total surface area of mattic epipedon is associated with grazing intensity. Meadows with less than 5% cracking in the mattic epipedon of the soil surface are those subjected to a lower grazing intensity, which maintain the dominant species belonged to Gramineae group or Gramineae–Kobresia shared group [6]. While alpine meadows have 5% to 30% cracking of the mattic epipedon on their soil surface, maintains Kobresia as the dominant species [3,6,44]. In our research, “KPC” displayed 10 to 15% cracks in its soil surface [3], which could help mattic epipedon increase soil moisture concentration and decrease soil compactness based on the previous studies [6,45]. This enhances the quantity of microorganisms and the potential ability for inorganic N production [26], improves the physical environment by loosen soil and increasing water infiltration, then increases meadow recovery and sustainably development [39].
However, alpine meadows only partly recover by creating cracks in their soil surface to resist nutrient and moisture shortage under a certain range of grazing intensity [46]. The shoot yields produced by compensatory growth do not offset that consumed by livestock, and nutrients are thus removed from the ecosystem. As the roots and shoots grow in a fixed ratio, more root tissue remains in the soil, and thus subsequently becomes the main organ consuming photosynthetic products and limiting nutrients [47]. This increased the load of soil nutrient supplying to the root growth, forcing the ecosystem to destroy its inner balance and increasing the risk of the meadow driven into an uncertain succession process.

4.2. Using Ratio of Gramineae to Cyperaceae or K. Humilis to K. pygmaea Could Indirectly Estimate the Ability of Ecosystem Maintain Stabilization

It is common for multiple plant communities to coexist in the same topography and climate, and characteristics of these plant communities differ due to the frequency and/or intensity of disturbances to which they are subjected [7]. While in our research, the pasture managers chose different grazing intensities, which led to different frequencies and intensities of disturbance, and thus variations between the structures of each pasture’s plant communities. The optimum grazing intensity for an alpine meadow is generally considered to be achieved with 1.15 sheep unit/ha [48], so all of the research plots were in the condition of overgrazing. “GKH” was a “Gramineae + K. humilis” meadow, which maintained the highest palatable forage production (estimated by the biomass of Gramineae and Kobresia groups) and had a clear two-layered aboveground plant community structure. Although it could be considered overgrazed based on previous standards [48], in the current research and in previous studies, this type of alpine meadow always had a higher and relatively stable production of palatable forage, coverage of the plant community, and available nutrient production, compared to other types of alpine meadow, so we considered it as the control group. “KH” had a higher grazing rate than “GKH,” and Gramineae was previously more controlled by this level of grazing intensity, leading K. humilis to become the dominant species [44]. “KPT” and “KPC” were K. pygmaea communities and formed by continuous increasing grazing intensity in a K. humilis meadow [44]. The meadow thus changed from a K. humilis to a K. pygmaea community, which itself originated from Gramineae + K. humilis communities disturbed by overgrazing [6,44,49].
We found that overgrazing in an alpine meadow could affect its plant–soil system at three aspects: the concentration of C in plant-soil nutrients, available nutrient contents in the soil; the balance of shoots nutrients and the concentration of soil total N. Overgrazing increased the concentrations of carbon and nitrogen in plant community and soil at different rates. This suggested that the change in community structure caused by overgrazing not only affected the concentrations of C and N by changing the structure of plant communities, but also caused an imbalance between C and N in different parts (the soil nutrients and plant community) in ecosystem. Bionts can typically maintain homeostasis [15], but we found that overgrazing first changed the belowground amount of C and N in the alpine meadow systems and then changed the balance of C/N in shoots. Soil microorganisms and the roots are the core components in limiting soil nutrients uptake and transformation in an alpine meadow [50]. Thus, the relationship between the quantities of roots and microorganisms suggested that they are mutually dependent and that microorganisms have developed various mechanisms for symbiotically coexisting within the root system, as this provides a suitable environment for microorganisms to facilitate nutrient exchange [26,51,52]. In addition, the available nutrients did not increase with root quantity, which would eventually lead to shortages of limiting nutrients and increase the risk of alpine meadow degradation. Soil C/N stoichiometry was also higher than soil microorganism C/N stoichiometry, lower than that of the plant community, and closer to the value of the former than the latter, which indicates that soil microorganisms made higher contributions to soil C and N accumulation and construction than the plant community. The phenomena of increasing the concentration of soil microorganisms C and N with grazing intensity might also be an adjustment strategy to avoid shortages in nutrient supply and accumulation in the soil system. However, soil microorganism outcompeted roots for nutrient uptake after a certain level of meadow degeneration, increasing the difference in C/N stoichiometry between soil microorganisms, soil nutrient and plant communities. This was especially prevalent in the thickening mattic epipedon of K. pygmaea communities, which had a higher C/N stoichiometry than any other communities. Thus, when increased concentrations of soil microorganisms could not compensate for nutrient shortages, the mattic epipedon in alpine meadows underwent to crack to effectively control shortages of soil nutrients and inhibit further alpine meadow degradation [3].
We found that overgrazing was the one of primary driving forces in alpine meadow degradation, and that it unbalanced nutrient supply and accumulation, and the distribution of plant community biomass. The lowest amount of nutrient provision to the plant community occurred as dominant plant functional groups and species changed, so ratio of Gramineae to Cyperaceae or K. humilis to K. pygmaea were used to monitor plant community dynamics and indirectly estimate their ability to supply and maintain stabilization in soil nutrients, and to change their strategy for incorporating matter into roots and shoots

5. Conclusions

Overgrazing can lead to ecosystem degradation by changing the amount of biomass and nutrients present in an ecosystem, which can lead to shortages in limiting nutrients and cause an imbalance in their distribution in soil–plant systems.
We found that the asynchronous changes in C and N accumulation and use strategies in soil, microorganisms and the plant community represented a buffer strategy to resist overgrazing, but this strategy of destroying the old balance could also raise the risk of degradation.
The highest limiting nutrient load for the plant community occurred as dominant plant functional groups and species changing, so ratio of Gramineae to Cyperaceae or K. humilis to K. pygmaea were used to monitor plant community dynamics and indirectly estimate these communities’ ability to supply nutrients and maintain stabilization.
Accordingly plant species or functional groups are outward characteristics of the environment and interference in grassland ecosystem, and their successions always develops toward to the most suitable state under the given circumstances. The changes in plant species composition can have considerable effects on forage quality which is crucial in grazing management. In that case, using the plant species or functional groups may be the simplest and most efficient way to monitor the ecosystem health condition. However gaining knowledge on how to use those outward characteristics to assess the ecosystem health requires further studies.

Author Contributions

Conceptualization, G.C.; methodology, L.L. and G.C.; software, L.L.; validation, G.C. and X.X.; formal analysis, L.L.; investigation, B.F., Y.L., B.L., M.S. and L.D.; resources, L.L. and G.C.; data curation, L.L.; writing—original draft preparation, L.L.; writing—review and editing, L.L., X.X. and C.L.; visualization, L.L.; supervision, L.L.; project administration, L.L. and G.C.; funding acquisition, L.L. and G.C. All authors have read and agreed to the published version of the manuscript.

Funding

The Natural Science Foundation of Qinghai Province for providing funding for “Research on health assessment and sustainable development in alpine Kobresia meadows in Qinghai Province” (2020-ZJ-720) and “Development of the Nutrient Regulation Technology System for Grassland Recovery” (2019YFC0507704).

Institutional Review Board Statement

Not applicable.

Data Availability Statement

All data are available in the text.

Conflicts of Interest

The authors declare no conflict of interest.

References

  1. Zhang, J.X.; Cao, G.M.; Zhou, D.W.; Hu, Q.W.; Zhao, X. The carbon storage and carbon cycle among the atmosphere, soil, vegetation and animal in the Kobresia humilis alpine meadow ecosystem. Acta Ecol. Sin. 2003, 23, 627–634. [Google Scholar]
  2. Li, F.Y.H.; Jäschke, Y.; Guo, K.; Wesche, K. Grasslands of China. Encycl. World’s Biomes 2020, 3, 773–784. [Google Scholar] [CrossRef]
  3. Cao, G.M.; Du, Y.G.; Wang, Q.L.; Wang, C.T.; Liang, D.Y. Character of passive active degradation process and its mechanism in Alpine Kobresia meadow. J. Mt. Sci. 2007, 25, 641–648. [Google Scholar]
  4. De Deyn, G.B.; Cornelissen, J.H.C.; Bardgett, R.D. Plant functional traits and soil carbon sequestration in contrasting biomes. Ecol. Lett. 2008, 11, 516–531. [Google Scholar] [CrossRef] [PubMed]
  5. Jobbágy, E.G.; Jackson, R.B. The vertical distribution of soil organic carbon and its relation to climate and vegetation. Ecol. Appl. 2000, 10, 423–436. [Google Scholar] [CrossRef]
  6. Lin, L. Response and Adaptation of Plant-Soil System of Alpine Meadows in Different Successional Stages to Grazing Intensity. Ph.D. Thesis, Gansu Agricultural University, Lanzhou, China, 2017. [Google Scholar]
  7. Tadashi, F.; William, G.L. Alternative stable states, trait dispersion and ecological restoration. Oikos 2006, 113, 353–356. [Google Scholar]
  8. Peñuelas, J.; Poulter, B.; Sardans, J.; Ciais, P.; Van Der Velde, M.; Bopp, L.; Boucher, O.; Godderis, Y.; Hinsinger, P.; Llusia, J.; et al. Human-induced nitrogen-phosphorus imbalances alter natural and managed ecosystems across the globe. Nat. Commun. 2013, 4, 2934. [Google Scholar] [CrossRef] [Green Version]
  9. Sardans, J.; Rivas-Ubach, A.; Peñuelas, J. The C:N stoichiometry of organisms and ecosystems in a changing world: A review and perspectives. Perspectives in Plant Ecology. Evol. Syst. 2012, 14, 33–47. [Google Scholar]
  10. Wang, C.Y.; Wei, M.; Wu, B.D.; Wang, S.H.; Jiang, K. Alpine grassland degradation reduced plant species diversity and stability of plant communities in the Northern Tibet Plateau. Acta Oecol. 2019, 98, 25–29. [Google Scholar] [CrossRef]
  11. Shang, Z.H.; Yang, S.; Wang, Y.; Shi, J.J.; Ding, L.M.; Long, R.J. Soil seed bank and its relation with above-ground vegetation along the degraded gradients of alpine meadow. Ecol. Eng. 2016, 90, 268–277. [Google Scholar] [CrossRef]
  12. White, L.M. Carbohydrate reserves of grass: A review. J. Range Manag. 1973, 26, 13–18. [Google Scholar] [CrossRef]
  13. Pigliucci, M. How organisms respond to environmental change: From phenotypes to molecules (and vice versa). Trends Ecol. Evol. 1996, 11, 168–173. [Google Scholar] [CrossRef]
  14. Zhang, J.Y.; Ai, Z.M.; Liang, C.T.; Wang, G.L.; Liu, G.B.; Xue, S. How microbes cope with short-term N addition in a Pinus tabuliformis forest-ecological stoichiometry. Geoderma 2019, 337, 630–640. [Google Scholar] [CrossRef]
  15. Sterner, R.W.; Elser, J.J. Ecological Stoichiometry: The Biology of Elements from Molecules to the Biosphere; Princeton University Press: Princeton, NJ, USA, 2002. [Google Scholar]
  16. Sardans, J.; Rivas-Ubach, A.; Peñuelas, J. The elemental stoichiometry of aquatic and terrestrial ecosystems and its relationships with organismic lifestyle and ecosystem structure and function: A review and perspectives. Biogeochemistry 2012, 111, 1–39. [Google Scholar] [CrossRef]
  17. Lin, L.; Li, Y.K.; Cui, Y.; Zhang, F.W.; Han, D.R.; Guo, X.W.; Li, J.; Cao, G.M. Relationship between dissolved nitrogen and plant biomass in Qing- Tibet Plateau typical vegetation types. J. Mt. Sci. 2012, 30, 721–727. [Google Scholar]
  18. Li, Y.; Wang, W.; Liu, Z.; Jiang, S. Grazing gradient versus restoration succession of Leymus chinensis grassland in Inner Mongolia. Restor. Ecol. 2008, 16, 572–583. [Google Scholar] [CrossRef]
  19. Nunes, J.S.; Araujo, A.S.F.; Nunes, L.A.P.L.; Lima, L.M.; Carneiro, R.F.V.; Salviano, A.A.C.; Tsai, S.M. Impact of land degradation on soil microbial biomass and activity in Northeast Brazil. Pedosphere 2012, 22, 88–95. [Google Scholar] [CrossRef]
  20. Lin, L.; Cao, G.M.; Li, Y.K.; Zhang, F.W.; Guo, X.W.; Han, D.R. Effects of human activities on organic carbon storage in the Kobresia humilis meadow ecosystem on the Tibetan Plateau. Acta Ecol. Sin. 2010, 30, 4012–4018. [Google Scholar]
  21. Korhonen, J.F.J.; Pihlatie, M.; Pumpanen, J.; Altonen, H.; Hari, P.; Levul, A.J.; Kieloaho, A.J.; Nikinmaa, E.; Vesala, T.; Ilvesniemi, H. Nitrogen balance of a boreal Scots pine forest. Biogeosciences 2013, 10, 1083–1095. [Google Scholar] [CrossRef] [Green Version]
  22. Xu, X.; Ouyang, H.; Richter, A.; Wanek, W.; Cao, G.; Kuzyakov, Y. Spatio-temporal variations determine plant—microbe competition for inorganic nitrogen in an alpine meadow. J. Ecol. 2011, 99, 563–571. [Google Scholar] [CrossRef]
  23. Schulten, H.R.; Schnitzer, M. The chemistry of soil organic nitrogen: A review. Biol. Fertil. Soils 1998, 26, 1–15. [Google Scholar] [CrossRef]
  24. Schmidt, M.W.I.; Torn, M.S.; Dittmar, S.A.T.; Guggenberger, G.; Janssens, I.A.; Kleber, M.; Kögel-knabner, I.; Lehmann, J.; Manning, D.A.C.; Nannipieri, P.; et al. Persistence of soil organic matter as an ecosystem property. Nature 2011, 478, 49–56. [Google Scholar] [CrossRef] [PubMed] [Green Version]
  25. Enriquez, S.; Duarte, C.M.; Sandjensen, K. Patterns in decomposition rates among photosynthetic organisms: The importance of detritus C:N:P concentration. Oecologia 1993, 94, 457–471. [Google Scholar] [CrossRef]
  26. Kuzyakov, Y.; Xu, X.L. Competition between roots and microorganisms for nitrogen: Mechanisms and ecological relevance. New Phytol. 2013, 198, 656–669. [Google Scholar] [CrossRef] [PubMed]
  27. Blagodatskaya, E.; Kuzyakov, Y. Active microorganisms in soil: Critical review of estimation criteria and approaches. Soil Biol. Biochem. 2013, 67, 192–211. [Google Scholar] [CrossRef]
  28. Zhao, Y.; Ding, Y.; Hou, X.; Li, F.Y.; Yun, X. Effects of temperature and grazing on soil organic carbon storage in grasslands along the Eurasian steppe eastern transect. PLoS ONE 2017, 12, e0186980. [Google Scholar] [CrossRef] [Green Version]
  29. Song, Z.L.; Liu, H.Y.; Zhao, F.J.; Xu, C.Y. Ecological stoichiometry of N:P:Si in China’s grasslands. Plant Soil 2014, 380, 165–179. [Google Scholar] [CrossRef]
  30. Yuan, W.Y.; Ma, X.W. The study in the policy system transition of using and property in pasture area. Product. Res. 2013, 11, 26–28. [Google Scholar]
  31. Wang, C.; Wang, G.; Wang, Y.; Rashad, R.; Ma, L.; Hu, L.; Luo, Y. Fire alters vegetation and soil microbial community in alpine meadow. Land Degrad. Dev. 2015, 27, 1379–1390. [Google Scholar] [CrossRef]
  32. Jenkinson, D.S.; Parry, L.C.; Vance, E.D.; Wu, J.; Harkness, D.D. Modeling the turnover of organic matter in soil. J. Sci. Food Agric. 1988, 45, 132–133. [Google Scholar]
  33. Sparling, G.P.; Shepherd, T.G.; Schipper, L.A. Topsoil characteristics of three contrasting New Zealand soils under four long-term land uses. N. Z. J. Agric. Res. 2000, 43, 569–583. [Google Scholar] [CrossRef]
  34. Lavorel, S.; Grigulis, K.; Mcintyre, S.; Williams, N.; Garden, D.; Dorrough, J.; Berman, S.; Quétier, F.; Thébault, A.; Bonis, A. Assessing functional diversity in the field- Methodology matters! Funct. Ecol. 2008, 22, 134–147. [Google Scholar] [CrossRef]
  35. Lin, L.; Cao, G.M.; Zhang, F.W.; Ke, X.; Li, Y.; Xu, X.; Li, Q.; Guo, X.; Fan, B.; Du, D. Spatial and temporal variations in available soil nitrogen—A case study in Kobresia Alpine Meadow in the Qinghai-Tibetan Plateau. J. Geosci. Environ. Prot. 2019, 7, 177–189. [Google Scholar] [CrossRef] [Green Version]
  36. Cao, G.M.; Long, R.J.; Zhang, F.W.; Li, Y.K.; Lin, L.; Guo, X.W.; Han, D.R.; Li, J. A method to estimate carbon storage potential in alpine Kobresia meadows on the Qinghai-Tibetan Plateau. Acta Ecol. Sin. 2010, 30, 6591–6597. [Google Scholar]
  37. Du, Y.G.; Cao, G.M.; Wang, Q.L.; Wang, C.T. Effect of grazing on surface character and soil physical property in alpine meadow. J. Mt. Sci. 2007, 25, 338–343. [Google Scholar]
  38. Neumann, G.; Bott, S.; Ohler, M.A.; Mock, H.P.; Lippmann, R.; Grosch, R.; Smalla, K. Root exudation and root development of lettuce (Lactuca sativa L. cv. Tizian) as affected by different soils. Front. Microbiol. 2014, 5, 2–6. [Google Scholar]
  39. Mehdi, C.; Carolyn, F.; Guo, J.W.; Cédric, L.; Meunier, J.S.; Wojciech, U.; Francisco, R.V. An operational framework for the advancement of a molecule-to-biosphere stoichiometry theory. Front. Mar. Sci. 2017, 4, 286–302. [Google Scholar]
  40. Hertenberger, G.; Zampach, P.; Bachmann, G. Plant species affect the concentration of free sugars and free amino acids in different types of soil. J. Plant Nutr. Soil Sci. 2002, 165, 557–565. [Google Scholar] [CrossRef]
  41. Baudoin, E.; Benizri, E.; Guckert, A. Impact of artificial root exudates on the bacterial community structure in bulk soil and maize rhizosphere. Soil Biol. Biochem. 2003, 35, 1183–1192. [Google Scholar] [CrossRef]
  42. Marschner, H. Mineral Nutrition of Higher Plants, 2nd ed.; Academic Press Inc.: San Diego, CA, USA, 1995. [Google Scholar]
  43. Cao, B.; Cao, Z.D.; Wang, L.M.; Sun, B.P.; Wang, D.C.; Zhang, X.B.; Liu, J.F. Research progress on soil-fixing in plant root system. Appl. Technol. Soil Water Conserv. 2009, 26–28. [Google Scholar]
  44. Li, Y.K.; Lin, L.; Zhang, F.W.; Liang, D.Y.; Wang, X.; Cao, G.M. Kobresia pygmaea community-disclimax of alpine meadow zonal vegetation in the pressure of grazing. J. Mt. Sci. 2010, 28, 257–265. [Google Scholar]
  45. Niu, Y.J. Study the Reason of Soil Crack Formation and Its Ecological Impact Assessment in Alpine Meadow. Master’s Thesis, Gansu Agricultural University, Lanzhou, China, 2017. [Google Scholar]
  46. Mulder, C.; Elser, J.J. Soil acidity, ecological stoichiometry and allometric scaling in grassland food webs. Glob. Chang. Biol. 2009, 15, 2730–2738. [Google Scholar] [CrossRef] [Green Version]
  47. Allen, A.S.; Andrew, J.A.; Finzi, A.C.; Matamala, R.; Schlesinger, D. Effects of free-air CO2 enrichment (FACE) on belowground process in a Pinus taeda forest. Ecol. Appl. 2000, 10, 437–448. [Google Scholar]
  48. Xu, P. Grassland Survey and Planning Science; Chinese Agricultural Press: Beijing, China, 1999. [Google Scholar]
  49. Li, X.L.; Perry, G.L.W.; Brierley, G.; Sun, H.Q.; Li, C.H.; Lu, G.X. Quantitative assessment of degradation classifications for degraded alpine meadows (heitutan), Sanjiangyuan, western China. Land Degrad. Dev. 2014, 25, 417–427. [Google Scholar] [CrossRef]
  50. Yu, Q.; Chen, Q.S.; Elser, J.J.; Cease, A.; He, N.P.; Wu, H.H.; Zhang, G.M.; Wu, J.G.; Bai, Y.F.; Han, X.G. Linking stoichiometric homeostasis with ecosystem structure, functioning, and stability. Ecol. Lett. 2010, 13, 1390–1399. [Google Scholar] [CrossRef] [PubMed]
  51. Luo, Y.; Field, C.B.; Jackson, R.B. Does nitrogen constrain carbon cycling or does carbon input stimulate nitrogen cycling? Ecology 2006, 87, 3–4. [Google Scholar] [CrossRef] [Green Version]
  52. Kuzyakov, Y. Review: Factors affecting rhizosphere priming effects. J. Plant Nutr. Soil Sci. 2002, 165, 382–396. [Google Scholar] [CrossRef]
Figure 1. Study sites. Note: Plot names are “GKH”, “KH”, “KPT” and “KPC” are for the grazing intensities of 3.75 ± 0.75 sheep/ha, 7.25 ± 0.25 sheep/ha, 8.50 ± 0.35 sheep/ha and 11.75 ± 0.95 sheep/ha respectively. Photos were taken by Li Lin.
Diversity 14 00183 g001
Figure 2. Aboveground and belowground biomass at varied grazing intensities: GKH (3.75 ± 0.75 sheep/ha), KH (7.25 ± 0.25 270 sheep/ha), KPT (8.50 ± 0.35 sheep/ha), and KPC (11.75 ± 0.95 sheep/ha). Notations: different letters indicate significant differences between pastures (α = 0.05).
Diversity 14 00183 g002
Figure 3. Quantity of two types of roots—(A) The ratio of biomass of living root in soil profile and (B) the ratio of biomass of dead root in soil profile—at different grazing intensities: GKH (3.75 ± 0.75 sheep/ha), KH (7.25 ± 0.25 270 sheep/ha), KPT (8.50 ± 0.35 sheep/ha), and KPC (11.75 ± 0.95 sheep/ha). Notations: different letters indicate significant differences between pastures (α = 0.05).
Diversity 14 00183 g003
Figure 4. Carbon (C) concentration in the plant community aboveground (Shoot) and belowground (Root) at different grazing intensities: GKH (3.75 ± 0.75 sheep/ha), KH (7.25 ± 0.25 270 sheep/ha), KPT (8.50 ± 0.35 sheep/ha), and KPC (11.75 ± 0.95 sheep/ha). Notations: different letters indicate significant differences between pastures (α = 0.05).
Diversity 14 00183 g004
Figure 5. Nitrogen (N) concentration in the plant community aboveground (Shoot) and belowground (Root) at different grazing intensities: GKH (3.75 ± 0.75 sheep/ha), KH (7.25 ± 0.25 270 sheep/ha), KPT (8.50 ± 0.35 sheep/ha), and KPC (11.75 ± 0.95 sheep/ha). Notations: different letters indicate significant differences between pastures (α = 0.05).
Diversity 14 00183 g005
Figure 6. C/N of the plant community aboveground (Shoot) and belowground (Root) at different grazing intensities: GKH (3.75 ± 0.75 sheep/ha), KH (7.25 ± 0.25 270 sheep/ha), KPT (8.50 ± 0.35 sheep/ha), and KPC (11.75 ± 0.95 sheep/ha). Notations: different letters indicate significant differences between pastures (α = 0.05).
Diversity 14 00183 g006
Figure 7. Concentrations of total nitrogen (N) (A) and total organic carbon (C) (B) in the plant community at different grazing intensities: GKH (3.75 ± 0.75 sheep/ha), KH (7.25 ± 0.25 270 sheep/ha), KPT (8.50 ± 0.35 sheep/ha), and KPC (11.75 ± 0.95 sheep/ha). Notations: different letters indicate significant differences between pastures (α = 0.05).
Diversity 14 00183 g007
Figure 8. (A) Concentration of ammonium (NH4+-N) and (B) concentration of (NO3-N) in various soil layers at different grazing intensities: GKH (3.75 ± 0.75 sheep/ha), KH (7.25 ± 0.25 270 sheep/ha), KPT (8.50 ± 0.35 sheep/ha), and KPC (11.75 ± 0.95 sheep/ha). Notations: different letters indicate significant differences between pastures (α = 0.05).
Diversity 14 00183 g008
Figure 9. Total concentration and ratio of soil ammonium (NH4+-N) to nitrate (NO3-N) in the plant community at different grazing intensities: GKH (3.75 ± 0.75 sheep/ha), KH (7.25 ± 0.25 270 sheep/ha), KPT (8.50 ± 0.35 sheep/ha), and KPC (11.75 ± 0.95 sheep/ha). Notations: different letters indicate significant differences between pastures (α = 0.05). A is the total concentration of “NH4+-N + NO3--N” in different soil layers; B is the ratio of root biomass to “NH4+-N + NO3-N” concentration.
Diversity 14 00183 g009
Figure 10. Soil C/N ratio (total carbon/total nitrogen) in the plant community at different grazing intensities: GKH (3.75 ± 0.75 sheep/ha), KH (7.25 ± 0.25 270 sheep/ha), KPT (8.50 ± 0.35 sheep/ha), and KPC (11.75 ± 0.95 sheep/ha). Notations: different letters indicate significant differences between pastures (α = 0.05).
Diversity 14 00183 g010
Figure 11. Concentrations of microbial carbon (C) (A) and nitrogen (N) (B) at different grazing intensities: GKH (3.75 ± 0.75 sheep/ha), KH (7.25 ± 0.25 270 sheep/ha), KPT (8.50 ± 0.35 sheep/ha), and KPC (11.75 ± 0.95 sheep/ha). Notations: different letters indicate significant differences between pastures (α = 0.05).
Diversity 14 00183 g011
Figure 12. C/N (total carbon/ total nitrogen) stoichiometry in microorganisms at different grazing intensities: GKH (3.75 ± 0.75 sheep/ha), KH (7.25 ± 0.25 sheep/ha), KPT (8.50 ± 0.35 sheep/ha), and KPC (11.75 ± 0.95 sheep/ha). Notations: different letters indicate significant differences between pastures (α = 0.05).
Diversity 14 00183 g012
Figure 13. Reduction dimension analysis of in soil−plant−microbial system. Notation: “a” denoted GKH (3.75 ± 0.75 sheep/ha), “b” denoted KH (7.25 ± 0.25 sheep/ha), “c” denoted KPT (8.50 ± 0.35 sheep/ha), and “d” denonted KPC (11.75 ± 0.95 sheep/ha). Concentrations of soil microbial C(mbc), concentrations of soil microbial N (mbn), soil total C (TC), soil organic C (OC), soil inorganic C (IC), soil total N (TN), soil NH4+-N (nh4) and NO3-N (no3), soil pH (pH), stoichiometry of soil microbial total C to total N (mc.n), plant community total C to total N aboveground (pc.n), soil organic C to soil total N (sc.n), soil total C to soil total N(tn.tc), dead root tissue (dr), living root tissue (lr), total root tissue(tr), biomass of Gramineae (Gra), biomass of Cyperaceae (Cyp), biomass of Leguminosae (Leg), biomass of Forb (For), biomass of K. humilis (Hum), biomass of K. pygmaea, biomass of the litter aboveground.
Diversity 14 00183 g013
Table 1. General overview of the study sites.
Plant Succession Process StageGramineae + Kobresia humilis CommunityK. humilis CommunityThickening Mattic Epipedon in K. pygmaea CommunityCracking Mattic Epipedon in K. pygmaea Community
Item
CodeGKHKHKPTKPC
Location37°39.023′ N, 101° E 10.638′, 3230 m37°40.155′ N, 101° E 10.021′, 3241 m37°40.054′ N, 101° E 10.620′, 3239 m37°42.089′ N, 101° E 15.928′, 3278 m
Average grazing rate (sheep per ha)3.75 ± 0.757.25 ± 0.258.50 ± 0.3511.75 ± 0.95
Type of herbivore(s)SheepSheepSheep and yakSheep
Ground surface featureNo cracksNo cracksCoverage of crack area < 8%Coverage of crack area 10–15%
Mattic epipedon featureThickness < 5 cmThickness 5–6 cmThickness 7–8 cmThickness 8–9 cm
Table 2. Characteristics of aboveground plant community.
Plant Succession Process StageGramineae + Kobresia humilis CommunityK. humilis CommunityThickening Mattic Epipedon in K. pygmaea CommunityCracking Mattic Epipedon in K. pygmaea Community
Item
CodeGKHKHKPTKPC
Dominant species in plant communityStipa spp.
Festuca spp.
Helictotrichon tibeticum
K. humilisK. pygmaeaK. pygmaea
Subdominant species in plant communityK. humilis
K. pygmaea
Gentiana straminea
Stipa spp.
Festuca spp.
K. pygmaea
K. humilis
Thermopsis lanceolata
Oxytropis spp.
K. humilis
Thermopsis lanceolata
Oxytropis spp.
Companion speciesSaussurea pulchra
Thermopsis lanceolata
Potentilla nivea
Oxytropis spp.
Stipa spp.
Festuca spp.
Stipa spp.
Festuca spp.
Total coverage85.7 ± 2.7%91.1 ± 0.6% 71.8 ± 1.6%82.2 ± 0.6%
Gramineae coverage36.4 ± 2.8%41.1 ± 0.2%20.3 ± 1.3%5.6 ± 1.4%
Cyperaceae coverage37.8 ± 0.2%32.1 ± 0.8%32.2 ± 1.4%16.9 ± 0.5%
Gramineae biomass ratio27.7 ± 3.2%26.8 ± 0.4%18.0 ± 0.2%22.8 ± 0.2%
Cyperaceae biomass ratio19.8 ± 0.9%13.5 ± 0.1%13.9 ± 0.2%7.9 ± 0.3%
Table 3. Characteristics of carbon (C) and nitrogen (N) stoichiometry in soil and soil microorganisms in different soil layers.
Soil LayerVariation Coefficient of Micro-C/N (%)Variation Coefficient of Soil C/N (%)
0–5 cm2.63.4
5–10 cm3.06.1
10–20 cm2.05.8
20–30 cm2.38.4
30–40 cm4.315.6
Publisher’s Note: MDPI stays neutral with regard to jurisdictional claims in published maps and institutional affiliations.

