Abstract
The Qinghai–Tibet Plateau (QTP) has an important function in ensuring the water ecological security of China, even Asia, and the soil water storage of alpine grassland is an important part of the ecosystem water. Grassland degradation directly affects the soil water storage capacity. However, the impact of degradation on specific soil storage capacity, especially alpine shrubs, is rarely studied. Here, we chose two plots of alpine non-degraded shrub and degraded shrub, using the automatic soil moisture monitoring system to study the change process of soil moisture storage, and then adopted the boosted regression tree (BRT) model to quantitatively evaluate the relative influence of environmental variables on soil water storage. Our results show: (1) The soil water storage in the growing season (May–September) is higher than that in the non-growing season (January–April and October–December), and the soil water storage reaches its highest in mid-July. (2) During the growing season, the 100 cm soil temperature was the most important factor affecting the seasonal variation in soil water storage, accounting for 51% of the total variation. During the non-growing season, the 40 cm soil temperature was the most important factor affecting the variation in soil water storage, accounting for 80% of the total variation. (3) The soil water storage of non-degraded Potentilla fruticosa shrub meadow increased by 6–25%, compared with degraded grassland shrub meadow during growing-season. (4) Various meteorological factors have a weak impact on soil water storage.
1. Introduction
Soil water is a limiting factor for vegetation growth [1,2] and is an important part of water circulation in the soil–vegetation–atmosphere system; thus, soil water storage plays a vital role in the ecological system and hydrological processes in the interaction between groundwater and surface water, with research in this field having acquired a global scale [3]. However, because of the grass degradation caused by global warming and human activities, water loss and soil erosion are aggravated, resulting in the continuous decline of grassland ecosystem productivity and water holding capacity [4,5], as well as the acceleration of soil desiccation leading to increased vegetation water shortage overall [6]. The topsoil layer provides conditions for the transformation of precipitation into the soil water. The soil receives rainfall, whereas it also consumes water because of vegetation growth [2]. Therefore, the changing pattern of soil moisture and its influencing factors have become a topic of great interest in the research of water conservation functions in recent years.
Many scholars have adopted modeling methods [7,8] to simulate the impact of climate change and predict the change on water storage in the coming decades, using remote sensing images, satellite altimetry data, and gravimetry data, such as ICESat/GLAS altimetry data, MSS/TM/ETM plus imagery [9], and GRACE Satellites [10]; though the results obtained from these methods have been limited. However, many recent studies have shown that extensive evaluation of global-scale high-resolution satellite-based rainfall (SBR) products, especially IMERG-V5 and GSMaP-V7 [11,12,13], which can be a good alternative for monitoring daily precipitation, explains the merit of precipitation products in a near-real-time way. Dekai Lu (2018) indicated that accurately measuring light rainfall and winter snow was still a challenging task for the current satellite precipitation retrievals in the paper “Evaluation and Hydrological Utility of the Latest GPM IMERG V5 and GSMaP V7 Precipitation Products over the Tibetan Plateau” [14]. Based on these aspects, on the one hand, the parameters of the same models are often different because of spatiotemporal heterogeneity, leading to the uncertainty of the models. At the same time, some models fail to consider important meteorological factors, such as evaporation. On the other hand, because the change in water storage is a complex process, it is not only affected by climate conditions and human activities, but also by vegetation, topography, and other factors, resulting in significant dissimilarities in the simulation results of different models. Therefore, it is necessary to combine the measured water content data to further clarify the response characteristics to environmental factors.
The QTP has great strategic significance to guarantee water resource security in China and Southeast Asia [15]. The study of environmental factors on the characteristics of water storage on QTP, and the seasonal and interannual dynamics of water storage is weak and mainly focuses on lakes, such as Nam Co Lake [16], Aksai Chin Lake, and Bangdag Co Lake [17], Chibuzhang Co Lake and Duoersuodong Co Lake [18], and alpine meadow [19]. The study of water storage in alpine shrubs, which is an important part of alpine meadows, has been rarely reported. Previous studies have shown that soil water storage was largely determined by soil organic matter [20] and mattic epipedon [21] in alpine grassland; soil water infiltration rates of topsoil decreased as alpine grasslands degraded [22]. Rainfall exerts little effect on the seasonal dynamics of deep soil water infiltration, as almost all rainfall returns to the atmosphere via evapotranspiration on QTP [23]. In addition to the soil and biological factors, the capacity of soil water storage is restricted by meteorological factors through interaction with the soil–vegetation–atmosphere system [24]. Climate change could reduce soil water storage in many regions [25,26]; this is consistent with the data observed from 2001 to 2020 in our monitoring sites. Reductions in soil water storage will affect the hydrological cycle by affecting surface albedo [27]. Furthermore, meteorological factors are an important measure of climate change; in this study, we tried to deplore the meteorological factors on soil water storage on the QTP.
Therefore, we used continuous automatic observation data of total net radiation, air temperature, differential pressure of saturated water vapor, precipitation, wind speed, relative humidity, and sunshine duration from 2017 to 2020, with the aim of quantitatively evaluating the contribution of meteorological factors to soil water storage in an alpine shrub meadow at the stage of degradation and non-degradation in this study. Consequently, we examined the dominant factors and revealed the influencing mechanism of grassland degradation on soil water retention. These results will help inform decisions on the management of degraded alpine shrub meadows.
2. Materials and Methods
2.1. Study Area
The study was conducted at Ganchaitan, which is a site close to the Haibei station (101°19′ E, 37°37′ N, 3240 m) in the northeastern QTP, located in Qinghai Province, China (Figure 1), from June 2017 to November 2020. This site has a plateau continental monsoon climate. The mean annual precipitation is approximately 562 mm, of which almost 80% falls during the growing season (May to September) [28]. The mean annual air temperature is approximately −1.7 °C, with the maximum in July (9.8 °C) and the minimum in January (−14.80 °C) [29]. The soil type in the study area was classified as Mollic Gryic Cambisols according to Soil Taxonomy [30], with abundant soil organic matter (SOM) in the surface layer. The thickness of the aquifer is approximately 50–70 m, and the shallow groundwater depth is 2.56 m [20]. Rodent infestation has been recognized as the main cause of shrub degradation at this site [20]. We used Potentilla fruticosa shrub coverage and the number of species as indicators of degradation. The aboveground biomass, belowground biomass, and other basic information of the study site are shown in Table 1. The soil characteristics are shown in Table 2 [31].
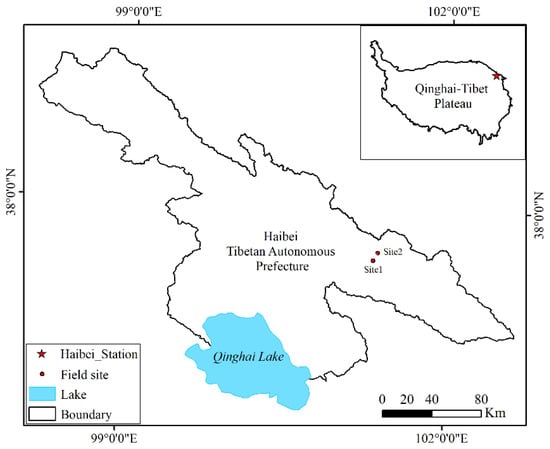
Figure 1.
The location of study area. Site 1 was the location of the degraded shrub, while site 2 was the location of the non-degraded shrub.

Table 1.
The basic information of alpine shrub meadow in this study.
Table 2.
The soil characteristics of alpine shrub meadow in this study.
2.2. Data Collection
2.2.1. Meteorological Data
The meteorological parameters included relative humidity (RH), wind speed (WS), net radiation (NR), soil temperature (ST), effective radiation (ER), air pressure (AP), heat flux (HF), and mean air temperature (MT). They were obtained from a meteorological station (Molis 520; Vaisala, Finland) between 2017 and 2020. Precipitation was collected using a precipitation gauge (52,203, RM Young, MI, USA) at a height of 0.5 m. Evapotranspiration (ET) was collected from the eddy covariance system at a distance of 80 m away from our study site in the southwest. The observation frequency of all meteorological parameters was 30 min.
2.2.2. Ground Reference Data
The plant community was surveyed every month during the growing season using a grid method of quadrat survey procedure (0.5 × 0.5 m). Absolute coverage was calculated based on the occurrence within 100 points. The number of species was measured based on the relative aboveground biomass in the same quadrat. Aboveground biomass was obtained using a standard harvesting method; 5–8 repeated samplings were carried out using a 50 × 50 cm sample box, root biomass was obtained using root drilling with an inner diameter of 7 cm, randomly arranged in the aboveground biomass survey quadrats, the roots were washed and then dried at 65 °C to constant weight; the total number of samples was 18. Soil organic matter was determined by volumetric dichromate method, and total soil carbon and total nitrogen were determined by an elemental analyzer (Perkin Elmer 2400II).
2.2.3. Soil Water Storage
Soil volumetric water content (SWC) and soil temperature (Ts) were simultaneously measured by a coaxial impedance dielectric reflectometer (Hydra probe II, Stevens, OR, USA), and the observation equipment was installed in May 2016. The observed soil depths were 5, 10, 15, 20, 30, 40, 50, 60, 80, and 100 cm in sequence, and the observation frequency was 30 min. The different depths of soil temperature were described as ×5 cm ST, ×10 cm ST, ×15 cm ST, etc. The measured data were recorded in a data collector CR800 (Campbell, UT, USA). There were no repetitions in the instrument measurement, and measurement frequency was increased to reduce errors. Furthermore, to avoid the effect of soil properties on the accuracy of soil water content measured by reflectometer, we adopted a field manual calibration method to calibrate the soil water content measured by reflectometer measurements, i.e., using a cutting ring sampler to obtain the undisturbed soil sample at the same depth around the buried site of the probe sensors in each month, with four replicates in each depth; then the soil moisture was measured by manual measurement with linear regression and the soil moisture was measured by reflectometer measurements to obtain the calibration coefficient. The total soil water storage (SWS), defined as the actual water content in a soil sample of a given thickness under natural conditions and expressed in mm precipitation, was calculated as follows:
SWS is the soil water storage (mm), Wv is the soil moisture content (wt %), and H is the thickness of the soil (cm).
The daily soil water storage and meteorological data from 2017 to 2020 was averaged according to the sequence day to obtain the general seasonal variation characteristics of soil water storage at different levels in order to reduce the impact of abnormal weather. The resolution (temporal/spatial), sources, and data ranges of the different datasets of the study site are shown in Table 3.
Table 3.
The dataset information of alpine shrub meadow in this study.
2.3. Statistical Analysis
Because stronger collinearities and nonlinearities were observed among meteorological variables, it is inappropriate to examine the results based solely on the coefficient value of independent variables in multiple regression analysis. Consequently, a boosted regression tree (BRT) model was adopted to quantitatively evaluate the relative influence of environmental variables on soil water storage, without any transformations. The BRT approach has often been applied to improve the performance of a single model by fitting a large number of models, which are then combined to yield an overall prediction. The BRT model only uses two algorithms [32]. First, regression trees are obtained from the regression and classification groups of individual models. Second, the collection of models is then combined to yield the boosted regression tree. In addition, BRT incorporates the important advantages of tree-based methods and can deal with different types of predictor variables, irrespective of whether the variables are normally distributed. Furthermore, neither transformations nor outlier elimination are required, and the method can cope well with nonlinear relationships [33]. Therefore, BRT was applied to assess the individual influences of controlling factors on the variations in soil water storage, without gap-filling, and then each of the variables’ contributions to dependent factors was demonstrated using the BRT results.
The Corrgram package and Dismo [34] package was used in R software to complete the statistical analysis. The bag fraction, learning rate, and tree complexity, which were the main parameters in the BRT model sampling were 0.5, 0.001 and 5, respectively, and 10 cross-validations were performed. All statistical analyses were conducted using R software version 4.03, and all figures were plotted using Origin 9.1.
3. Results and Analysis
3.1. The Variation of Meteorological Factors
All meteorological factors exhibited seasonal changes (Figure 2); the daily mean temperature raised gradually from January to July and reached the maximum value in July, which was 11.18 °C, and showed a downward trend from August to December. The evapotranspiration had a similar trend with the temperature change, with a maximum value of 107.18 ± 5.62 mm in July. The precipitation and relative humidity increased gradually from January to August and May, reached their maximum in August, which was 101.87 ± 4.46 mm and 85 ± 1%, respectively, and decreased from August to December. The effective radiation, net radiation, and heat flux reached the maximum in May. The wind speed and air pressure reached the maximum in April and September. However, the rainfall was mainly concentrated in the growing season (80%), and the precipitation was lower in the non-growing season. The difference of evapotranspiration and precipitation was −29.86 to 4.63, evapotranspiration was greater than precipitation except for August, September, and October, on a monthly scale. The total evapotranspiration and precipitation value was 576.97 ± 5.83 mm and 531.9 1 ± 4.47 mm on an annual scale during 2017 to 2020.
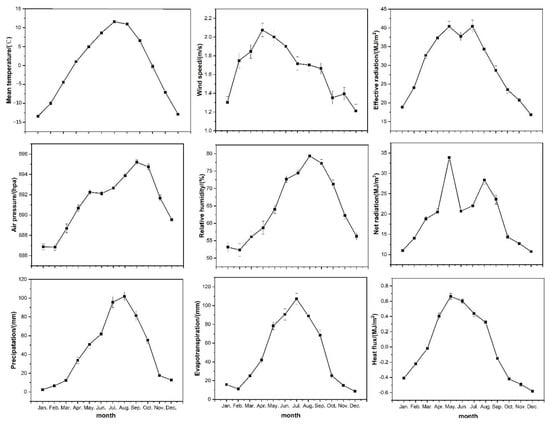
Figure 2.
Seasonal variation of meteorological factor.
The temperature and soil water content of each soil layer varied greatly throughout the year according to the data from 2017 to 2020 (Figure 3). The temperature of each soil layer in both non-degraded and degraded shrub had the same trend: the shallow soil temperature (0−60 cm) fluctuated greatly, while the deep soil temperature (60−100 cm) fluctuated slightly for the shallow soil temperature, which was significantly affected by air temperature (Figure 3a). The change in soil water content of non-degraded shrub (Figure 3b) and degraded shrub (Figure 3c) was roughly the same as that of temperature. In the growing season, the change in soil water content in the shallow layer (0−60 cm) fluctuated greatly, while that in the deep layer (60−100 cm) fluctuated slightly because the precipitation from May to September was more abundant than that in the non-growing season, and 70% occurred from July to September. In the non-growing season, the soil water content in each layer decreased compared with the growing season, and the surface soil water content was the lowest, which was mainly caused by the gradually increasing freezing depth. The soil frost began to melt on mid-March, completely melted in early May, and a new round of permafrost began until early November; the soil water content increased significantly when the soil frost completely melted. This is consistent with the theory that freezing is one-way freezing and thawing is two-way thawing [23].
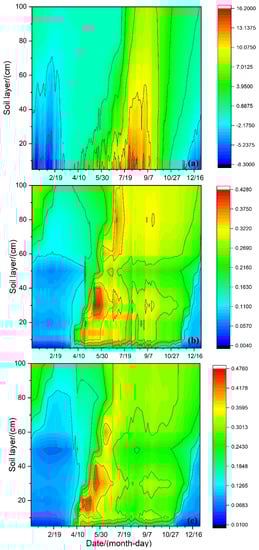
Figure 3.
Variations of soil temperature (a), water content in non-degraded shrub (b) and water content in degraded shrub (c) during the year.
3.2. Soil Water Storage of the Degraded and Non-Degraded Shrub
Based on the data for 2017−2020 (Figure 4), on a seasonal scale, the soil water storage in the growing season was significantly higher than that in the non-growing season, and there were obvious fluctuations in soil water storage at 0−100 cm soil depth in the alpine shrub. During the growing season, soil water storage can be characterized by a double peak. Due to the melting of seasonally frozen soil, soil water storage began to increase dramatically in mid-March, peaking at the beginning of the growing season in May and then gradually decreasing until mid-July, when the lowest value of the growing season appeared, and peaked again in September due to the withering of the pants; until mid-December, the soil water storage decreased sharply (Figure 4). The soil water storage of degraded shrub was 7% lower than that of the non-degraded shrub, except for the period from mid-March to mid-May, which had unstable difference of soil water storage.
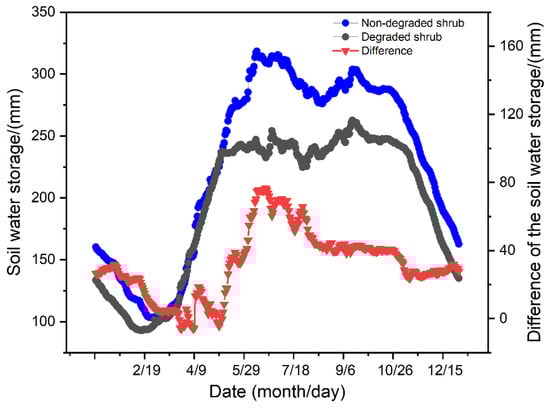
Figure 4.
Variation of soil water storage of degraded and non-degraded shrub during the year.
3.3. Factors Influencing Soil Water Storage in Alpine Shrub
The driving factors of soil water storage were different during the growing and non-growing seasons. Thus, we analyzed the relationships between driving factors and soil water storage during the frozen and growing seasons separately. During the growing season (Figure 5a), the BRT results show that the 100 cm soil temperature was the most important factor affecting the seasonal variation in soil water storage, accounting for 51% of the total variation. This was followed by the 40 cm soil temperature (20%), mean soil temperature (5%), 20 cm soil temperature (4%), total radiation (4%), mean air temperature (3%), 5 cm soil temperature (3%), total reflected radiation (2%), air pressure (2%), wind speed (2%), and relative humidity (1%). Meanwhile, net radiation and rainfall had little impact on the seasonal variation in soil water storage. During the non-growing season (Figure 5b), the 40 cm soil temperature was the most important factor affecting the variation in soil water storage, accounting for 80% of total variation, followed by soil temperature at 100 cm (16%), mean soil temperature (2%), soil temperature at 5 cm (1%), and soil temperature at 20 cm (1%).
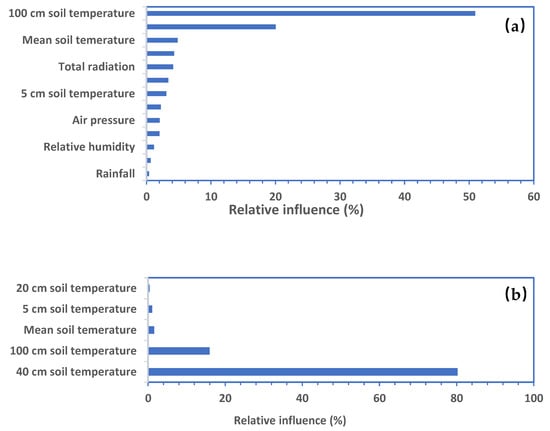
Figure 5.
Relative influence of environmental factors on soil water storage during the growing season (a) and the non-growing season (b).
To better understand the effects of driving factors on soil water storage, we next examined the partial effects of environmental factors on soil water storage during both the growing and non-growing seasons. During the growing season (Figure 6a), the 100 cm soil temperature showed a positive effect on soil water storage when the 100 cm soil temperature exceeded 0 °C, suggesting that the soil water storage rose as the ground thawed; soil temperatures at the 5 cm, 20 cm, and 40 cm depths had negative impacts on soil water storage, but their effects became weak when soil temperature exceeded 0 °C. During the non-growing season (Figure 6b), the soil water storage declined with increasing 40 cm soil temperature below 0 °C, but there was little effect above 0 °C. The 100 cm soil temperature was positively related to soil water storage, but there was little effect above 1 °C. Relative humidity, precipitation, and other environmental factors had no significant impact on soil water storage.
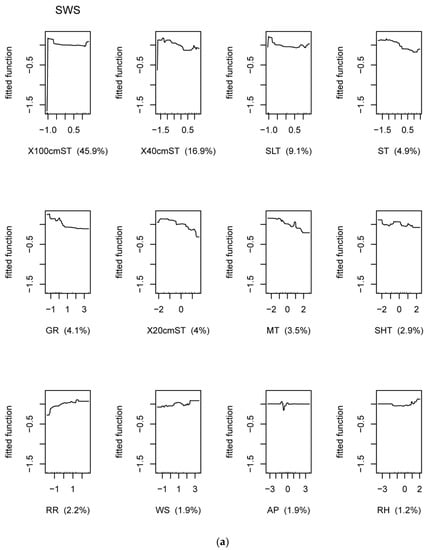
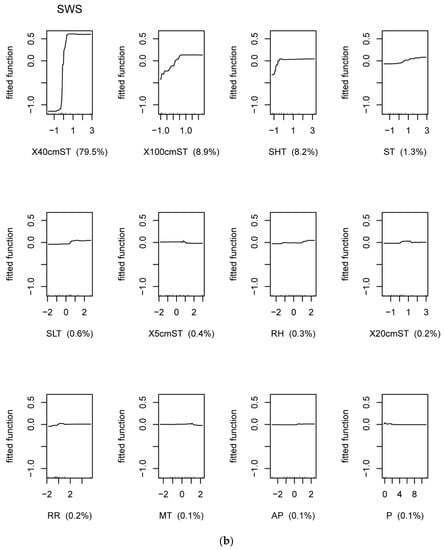
Figure 6.
Partial effects of environmental factors on soil water storage during the frozen growing season (a) and non-growing season (b). The fitted functions from a BRT model were plotted using gbm. plot. The function gbm. plot. fit was used to plot the fitted values in relation to each of the predictors used in the model. Positive or negative relationships were indicated by the slope value; ×100 cm ST: 100 cm soil temperature, ×40 cm ST: 40 cm soil temperature, ×5 cm ST: 5 cm soil temperature, ×20 cm ST: 20 cm soil temperature, SLT: soil lowest temperature, ST: mean soil temperature, P: precipitation, MT: mean air temperature, SHT: soil highest temperature, RR: total reflected radiation, AP: air pressure, WS: wind speed, and RH: relative humidity.
4. Discussion
4.1. Factors Influencing Shrub Water Storage
Our results showed that soil water storage was less affected by the external climate and showed obvious characteristics of hydrothermal coupling. Soil temperature of 100 cm and soil temperature of 40 cm were the main factors affecting soil water storage in the growing and non-growing seasons, respectively. These results are inconsistent with previous studies conducted in alpine grasslands on the QTP [19], where shallow groundwater is an important contributor to grassland moisture, and soil temperature was the second most important environmental factor affecting grassland water storage. The reason for this is that groundwater measurements were not performed in our experiments because it was difficult to detect, so the soil temperature was more important than the external climate on our study site. Furthermore, the correlation between soil moisture and precipitation is low [35,36], which was not in line with previous studies that have concluded that in lake water storage [8,37], rainfall is the dominant factor, and evaporation is of secondary importance to the lake water storage, rainfall, and evaporation causing lake expansion and shrinking directly. However, the evapotranspiration was greater than precipitation except for August, September, and October, on a monthly scale, and greater, too, on an annual scale on our experimental sites. A possible explanation for the phenomenon is that ecosystem water includes storage and fluxes [10,23], and soil water storage is related to water processes, especially on the QTP. On average, 80% of precipitation occurs in the growing season, the sunshine duration is long, and the evaporation capacity is strong. There was infiltration only after the heavy rain in August; however, most of the precipitation returned to the atmosphere in the form of evaporation or transpiration; when the soil freezes, the soil hydraulic conductivity decreases significantly, resulting in a more significant decrease in the infiltration of precipitation in the soil layer [38,39]. In contrast, the active soil layer reflects the degree to which the soil is affected by external factors such as soil temperature and evaporation, and the active layer of soil moisture is always deep in arid and semi-arid lands [2]. Last but not least, frozen soil regulates soil moisture and affects the ecosystem and hydrological cycle of the QTP [40]. In other words, the thawing of seasonally frozen soil influences the soil water storage.
4.2. Instructions for the Management of Alpine Shrub Degradation and Hydrological Processes
The soil water storage of the non-degraded Potentilla fruticosa shrub meadow increased by 7%, compared with degraded grassland shrub meadow during the growing season. With the intensification of the degradation degree of Potentilla fruticosa shrub meadow, its aboveground biomass, underground root biomass, and species richness, all showed a gradual decline; however, underground root biomass tended to accumulate in the surface soil to obtain more nutrients and moisture [20]. Above all, stemflow can be an important source of soil moisture in arid and semi-arid lands [41], litter also proved to be the key control factor of increasing soil water storage [20], and the special sedge plants, such as Kobresia humilis and Scirpus triqueter L. on our experimental sites, which have a thick grass felt root system, lead to strong water absorption characteristics [42]. Secondly, the aboveground biomass reduced, and the rainfall infiltration rate reduced, which was not conducive to the replenishment of shallow soil moisture [43]. At the same time, the soil water potential of each layer of grassland is significantly reduced, and the drought stress of degraded grassland is enhanced [44], which aggravates the degradation of grassland, and ultimately a decline in ecosystem stability and a loss of ecological functions [29,45]. Ultimately, the topsoil Mattic Epipedon, soil organic matter content, and root systems’ role in vertical moisture movement should be taken into consideration when modeling hydrological processes in alpine meadows.
5. Conclusions and Future Directions
On a seasonal scale, soil water storage showed a bimodal curve. The soil water storage in the growing season (May–September) was higher than that in the non-growing season (January–April and October–December), and the soil water storage reached the highest in mid-July (319 ± 6 mm, 300 ± 3 mm, respectively). The lowest soil water storage level in January was approximately (103 ± 3, 93 ± 2 mm, respectively). Soil water storage was less affected by the external climate, and showed obvious characteristics of hydrothermal coupling.
Although our study used meteorological data from automatic meteorological observatories to explore the driving laws of meteorological factors on soil water storage in the growing and non-growing seasons, the change in soil water storage is a comprehensive effect of multiple factors, and the water distribution of the ecosystem is not limited to storage water or flux water. Due to the complex terrain of the QTP and few meteorological stations, it is difficult to obtain data. This study was based only on three-year data from a meteorological station and the time period of this study was short. Multi-site continuous observation in time, with a view to clarifying the temporal and spatial variation laws of water changes on the QTP is needed for future studies.
Author Contributions
Conceptualization, J.L. and X.G.; methodology, F.Z.; software, Y.D.; validation, L.L.; formal analysis, J.L.; investigation, J.L.; resources, M.S.; data curation, B.L.; writing—original draft preparation, J.L.; writing—review and editing, J.L. and Y.L.; visualization, X.G.; supervision, G.C.; project administration, G.C.; funding acquisition, X.G. All authors have read and agreed to the published version of the manuscript.
Funding
This work was supported by “National Natural Science Key Foundation of China (Y711641501)” to G.C. and “Natural Science Foundation of Qinghai (2021-HZ-811)” to X.G.
Institutional Review Board Statement
Not applicable.
Data Availability Statement
The original data can be available in Barcode of Life Database under the DOI:dx.doi.org/10.5883/DS-070222.
Acknowledgments
We are grateful to Jianshe Ge for the assistance in the data collection and the routine maintenance of our instruments.
Conflicts of Interest
The authors declare no conflict of interest.
References
- Gao, X.; Wu, P.; Zhao, X.; Zhang, B.; Wang, J.; Shi, Y. Estimating the spatial means and variability of root-zone soil moisture in gullies using measurements from nearby uplands. J. Hydrol. 2013, 476, 28–41. [Google Scholar] [CrossRef]
- Sun, Z.; Ma, L.; Mei, X.; Liu, J.; Wang, F.; Zhang, J.; Yan, L. Analysis of Soil Moisture Characteristics and Main Influencing Factors in Different Hydrological Years in the Loess Region of Western Shanxi. J. Zhejiang AF Univ. 2021, 38, 10–20. [Google Scholar]
- Velasco-Muñoz, J.F.; Aznar-Sánchez, J.A.; Belmonte-Ureña, L.J.; Román-Sánchez, I.M. Sustainable water use in agriculture: A review of worldwide research. Sustainability 2018, 10, 1084. [Google Scholar] [CrossRef] [Green Version]
- Zhu, J.; He, H.; Li, H.; Yang, Y.; Wei, Y.; Luo, J.; Li, Y. Response of soil water storage in alpine meadow grassland to grazing pressure gradient. Chin. J. Grassl. 2018, 40, 88–94. [Google Scholar]
- Shikui, D.; Zhanhuan, S.; Jixi, G.; Boone, B.R. Enhancing sustainability of grassland ecosystems through ecological restoration and grazing management in an era of climate change on Qinghai-Tibetan Plateau. Agric. Ecosyst. Environ. 2020, 287, 106684. [Google Scholar]
- Ning, T.; Guo, Z. Characteristics of the soil water cycle in an abandoned sloping field in the semiarid Loess Hilly Region. Acta Ecol. Sin. 2015, 35, 5168–5174. [Google Scholar]
- Scanlon, B.R.; Zhang, Z.; Rateb, A.; Sun, A.; Wiese, D.; Save, H.; Beaudoing, H.; Lo, M.H.; Müller-Schmied, H.; Döll, P.; et al. Tracking Seasonal Fluctuations in Land Water Storage Using Global Models and GRACE Satellites. Geophys. Res. Lett. 2019, 46, 5254–5264. [Google Scholar] [CrossRef]
- Qiao, B.; Zhu, L.; Yang, R. Temporal-spatial differences in lake water storage changes and their links to climate change throughout the Tibetan Plateau. Remote Sens. Environ. 2019, 222, 232–243. [Google Scholar] [CrossRef]
- Song, C.; Huang, B.; Ke, L. Modeling and analysis of lake water storage changes on the Tibetan Plateau using multi-mission satellite data. Remote Sens. Environ. 2013, 135, 25–35. [Google Scholar] [CrossRef]
- Scanlon, B.R.; Zhang, Z.; Save, H.; Sun, A.Y.; Schmied, H.M.; van Beek, L.P.H.; Wiese, D.N.; Wada, Y.; Long, D.; Reedy, R.C.; et al. Global models underestimate large decadal declining and rising water storage trends relative to GRACE satellite data. Proc. Natl. Acad. Sci. USA 2018, 115, E1080–E1089. [Google Scholar] [CrossRef] [Green Version]
- Nepal, B.; Shrestha, D.; Sharma, S.; Shrestha, M.S.; Aryal, D.; Shrestha, N. Assessment of GPM-Era Satellite Products’ (IMERG and GSMaP) ability to detect precipitation extremes over mountainous country Nepal. Atmosphere 2021, 12, 254. [Google Scholar] [CrossRef]
- Li, X.; Chen, S.; Liang, Z.; Huang, C.; Li, Z.; Hu, B. Performance Assessment of GSMaP and GPM IMERG Products during Typhoon Mangkhut. Atmosphere 2021, 12, 134. [Google Scholar] [CrossRef]
- Zhou, Z.; Guo, B.; Xing, W.; Zhou, J.; Xu, F.; Xu, Y. Comprehensive evaluation of latest GPM era IMERG and GSMaP precipitation products over mainland China. Atmos. Res. 2020, 246, 105132. [Google Scholar] [CrossRef]
- Lu, D.; Yong, B. Evaluation and hydrological utility of the latest GPM IMERG V5 and GSMaP V7 precipitation products over the Tibetan Plateau. Remote Sens. 2018, 10, 2022. [Google Scholar] [CrossRef] [Green Version]
- Zhao, L.; Ding, Y.; Liu, G.; Wang, S.; Jin, H. Estimation and evaluation of underground ice reserves in permafrost on the Qinghai-Tibet Plateau. Glacier Frozen Soil 2010, 32, 1–9. [Google Scholar]
- Zhang, B.; Wu, Y.; Zhu, L.; Wang, J.; Li, J.; Chen, D. Estimation and trend detection of water storage at Nam Co Lake, central Tibetan Plateau. J. Hydrol. 2011, 405, 161–170. [Google Scholar] [CrossRef]
- Qiao, B.; Zhu, L.; Wang, J.; Ju, J.; Ma, Q.; Liu, C. Estimation of lakes water storage and their changes on the northwestern Tibetan Plateau based on bathymetric and Landsat data and driving force analyses. Quat. Int. 2017, 454, 56–67. [Google Scholar] [CrossRef]
- Baojin, Q.; Liping, Z.; Junbo, W.; Jianting, J.; Qingfeng, M.; Lei, H.; Hao, C.; Chong, L.; Teng, X. Estimation of lake water storage and changes based on bathymetric data and altimetry data and the association with climate change in the central Tibetan Plateau. J. Hydrol. 2019, 578, 124052. [Google Scholar]
- Guo, X.; Dai, L.; Li, Q.; Qian, D.; Cao, G.; Zhou, H.; Du, Y. Light Grazing Significantly Reduces Soil Water Storage in Alpine Grasslands on the Qinghai-Tibet Plateau. Sustainability 2020, 12, 2523. [Google Scholar] [CrossRef] [Green Version]
- Dai, L.; Guo, X.; Ke, X.; Du, Y.; Zhang, F.; Cao, G. The variation in soil water retention of alpine shrub meadow under different degrees of degradation on northeastern Qinghai-Tibetan plateau. Plant Soil 2021, 458, 231–244. [Google Scholar] [CrossRef]
- Li, J.; Du, Y.; Zhang, F.; Guo, X.; Han, D.; Liu, S.; Cao, G. Mattic Epipedon Impact on Water Conservation in Alpine Meadow. Acta Agrestia Sin. 2012, 20, 836–841. [Google Scholar]
- Li, J.; Zhang, F.; Lin, L.; Li, H.; Du, Y.; Li, Y.; Cao, G. Response of the plant community and soil water status to alpine Kobresia meadow degradation gradients on the Qinghai–Tibetan Plateau, China. Ecol. Res. 2015, 30, 589–596. [Google Scholar] [CrossRef]
- Dai, L.; Guo, X.; Zhang, F.; Du, Y.; Ke, X.; Li, Y.; Cao, G.; Li, Q.; Lin, L.; Shu, K.; et al. Seasonal dynamics and controls of deep soil water infiltration in the seasonally-frozen region of the Qinghai-Tibet plateau. J. Hydrol. 2019, 571, 740–748. [Google Scholar] [CrossRef]
- Wang, X.; Yang, L.; Zhao, Q.; Zhang, X. Spatial heterogeneity and environmental drive of functional traits of grassland communities in a small watershed of semi-arid loess. Grassl. Sci. 2019, 36, 2201–2211. [Google Scholar]
- Pokhrel, Y.; Felfelani, F.; Satoh, Y.; Boulange, J.; Burek, P.; Gädeke, A.; Gerten, D.; Gosling, S.N.; Grillakis, M.; Gudmundsson, L. Global terrestrial water storage and drought severity under climate change. Nat. Clim. Chang. 2021, 11, 226–233. [Google Scholar] [CrossRef]
- Sarvia, F.; De Petris, S.; Borgogno-Mondino, E. Exploring climate change effects on vegetation phenology by MOD13Q1 data: The piemonte region case study in the period 2001–2019. Agronomy 2021, 11, 555. [Google Scholar] [CrossRef]
- Qin, Y.; He, H.; Ou, X.; Bao, T. Experimental study on darkening water-rich mud tailings for accelerating desiccation. J. Clean. Prod. 2019, 240, 118235. [Google Scholar] [CrossRef]
- Dai, L.; Yuan, Y.; Guo, X.; Du, Y.; Ke, X.; Zhang, F.; Li, Y.; Li, Q.; Lin, L.; Zhou, H. Soil water retention in alpine meadows under different degradation stages on the northeastern Qinghai-Tibet Plateau. J. Hydrol. 2020, 590, 125397. [Google Scholar] [CrossRef]
- Zhang, F.; Li, H.; Li, Y.; Guo, X.; Dai, L.; Lin, L.; Cao, G.; Li, Y.; Zhou, H. Strong seasonal connectivity between shallow groundwater and soil frost in a humid alpine meadow, northeastern Qinghai-Tibetan Plateau. J. Hydrol. 2019, 574, 926–935. [Google Scholar] [CrossRef]
- Li, H.; Zhang, F.; Li, Y.; Wang, J.; Zhang, L.; Zhao, L.; Cao, G.; Zhao, X.; Du, M. Seasonal and inter-annual variations in CO2 fluxes over 10 years in an alpine shrubland on the Qinghai-Tibetan Plateau, China. Agric. For. Meteorol. 2016, 228–229, 95–103. [Google Scholar] [CrossRef]
- Dai, L.; Guo, X.; Du, Y.; Zhang, F.; Ke, X.; Cao, Y.; Li, Y.; Li, Q.; Lin, L.; Cao, G. The Response of Shallow Groundwater Levels to Soil Freeze-Thaw Process on the Qinghai-Tibet Plateau. Ground Water 2019, 57, 602–611. [Google Scholar] [CrossRef] [PubMed]
- Elith, J.; Leathwick, J.R.; Hastie, T. A working guide to boosted regression trees. J. Anim. Ecol. 2008, 77, 802–813. [Google Scholar] [CrossRef] [PubMed]
- Martínez-Rincón, R.O.; Ortega-García, S.; Vaca-Rodríguez, J.G. Comparative performance of generalized additive models and boosted regression trees for statistical modeling of incidental catch of wahoo (Acanthocybium solandri) in the Mexican tuna purse-seine fishery. Ecol. Model. 2012, 233, 20–25. [Google Scholar] [CrossRef]
- Lefcheck, J.S. piecewiseSEM: Piecewise structural equation modelling in r for ecology, evolution, and systematics. Methods Ecol. Evol. 2016, 7, 573–579. [Google Scholar] [CrossRef]
- Zeng, D.; Wu, J.; Li, H.; Zhao, Q.; Liu, S.; Qin, J. Research progress of hydrogen and oxygen isotopes in precipitation in the arid area of Northwest China. Arid Area Res. 2020, 37, 857–869. [Google Scholar]
- Jian, S.; Zhao, C.; Fang, S.; Yu, K. Effects of different vegetation restoration on soil water storage and water balance in the Chinese Loess Plateau. Agric. For. Meteorol. 2015, 206, 85–96. [Google Scholar] [CrossRef]
- Klaassen, W.; Bosveld, F.; de Water, E. Water storage and evaporation as constituents of rainfall interception. J. Hydrol. 1998, 212, 36–50. [Google Scholar] [CrossRef] [Green Version]
- Dai, L.; Ke, X.; Cao, Y.; Zhang, F.; Du, Y.; Li, Y.; Guo, X.; Li, Q.; Cao, G. The response of shallow groundwater level to environmental factors on alpine meadow in Qinghai-Tibet Plateau: A case study on Qinghai Haibei station. Ecol. Environ. Sci. 2018, 27, 1750–1757. [Google Scholar]
- Chang, J.; Wang, G.; Li, C.; Mao, T. Seasonal dynamics of water on the frozen layer in the continuous permafrost region of the Qinghai-Tibet Plateau and its response characteristics to the freezing and thawing process of active soil. Sci. China Earth Sci. 2015, 45, 481–493. [Google Scholar]
- Wu, X.; Liu, G.; Li, X.; Ji, G.; Li, L.; Mao, N.; Xu, H.; Wu, X. Changes of soil moisture in permafrost and seasonally frozen soil regions of the Qinghai-Tibet Plateau and its relationship with precipitation. Hydrology 2021, 41, 73–78+101. [Google Scholar]
- Tromble, J.M. Water interception by two arid land shrubs. J. Arid Environ. 1988, 15, 65–70. [Google Scholar] [CrossRef]
- Tang, K.; Zhang, G.; Ren, Z.; Wang, D. Dynamic mechanism of thin water flow on slope surface separating soil. J. Soil Water Conserv. 2011, 25, 46–49. [Google Scholar]
- Xu, R.; Zhang, S.; Zhu, Z.; Pang, T. The effect of grazing on soil moisture and its response to rainfall in typical grassland areas. Chin. J. Grassl. 2019, 41, 59–66. [Google Scholar]
- Li, T.; Wu, T.; Pan, H.; Huo, W.; Wu, Y. The relationship between soil water potential and community structure on a typical grassland degradation gradient. Green Technol. 2017, 22, 1–4. [Google Scholar]
- Leemhuis, C.; Thonfeld, F.; Näschen, K.; Steinbach, S.; Muro, J.; Strauch, A.; López, A.; Daconto, G.; Games, I.; Diekkrüger, B. Sustainability in the Food-Water-Ecosystem Nexus: The Role of Land Use and Land Cover Change for Water Resources and Ecosystems in the Kilombero Wetland, Tanzania. Sustainability 2017, 9, 1513. [Google Scholar] [CrossRef] [Green Version]
Publisher’s Note: MDPI stays neutral with regard to jurisdictional claims in published maps and institutional affiliations. |
© 2022 by the authors. Licensee MDPI, Basel, Switzerland. This article is an open access article distributed under the terms and conditions of the Creative Commons Attribution (CC BY) license (https://creativecommons.org/licenses/by/4.0/).