
Effects of Hazelnut Consumption on Cardiometabolic Risk Factors and Acceptance: A Systematic Review


Abstract
1. Introduction
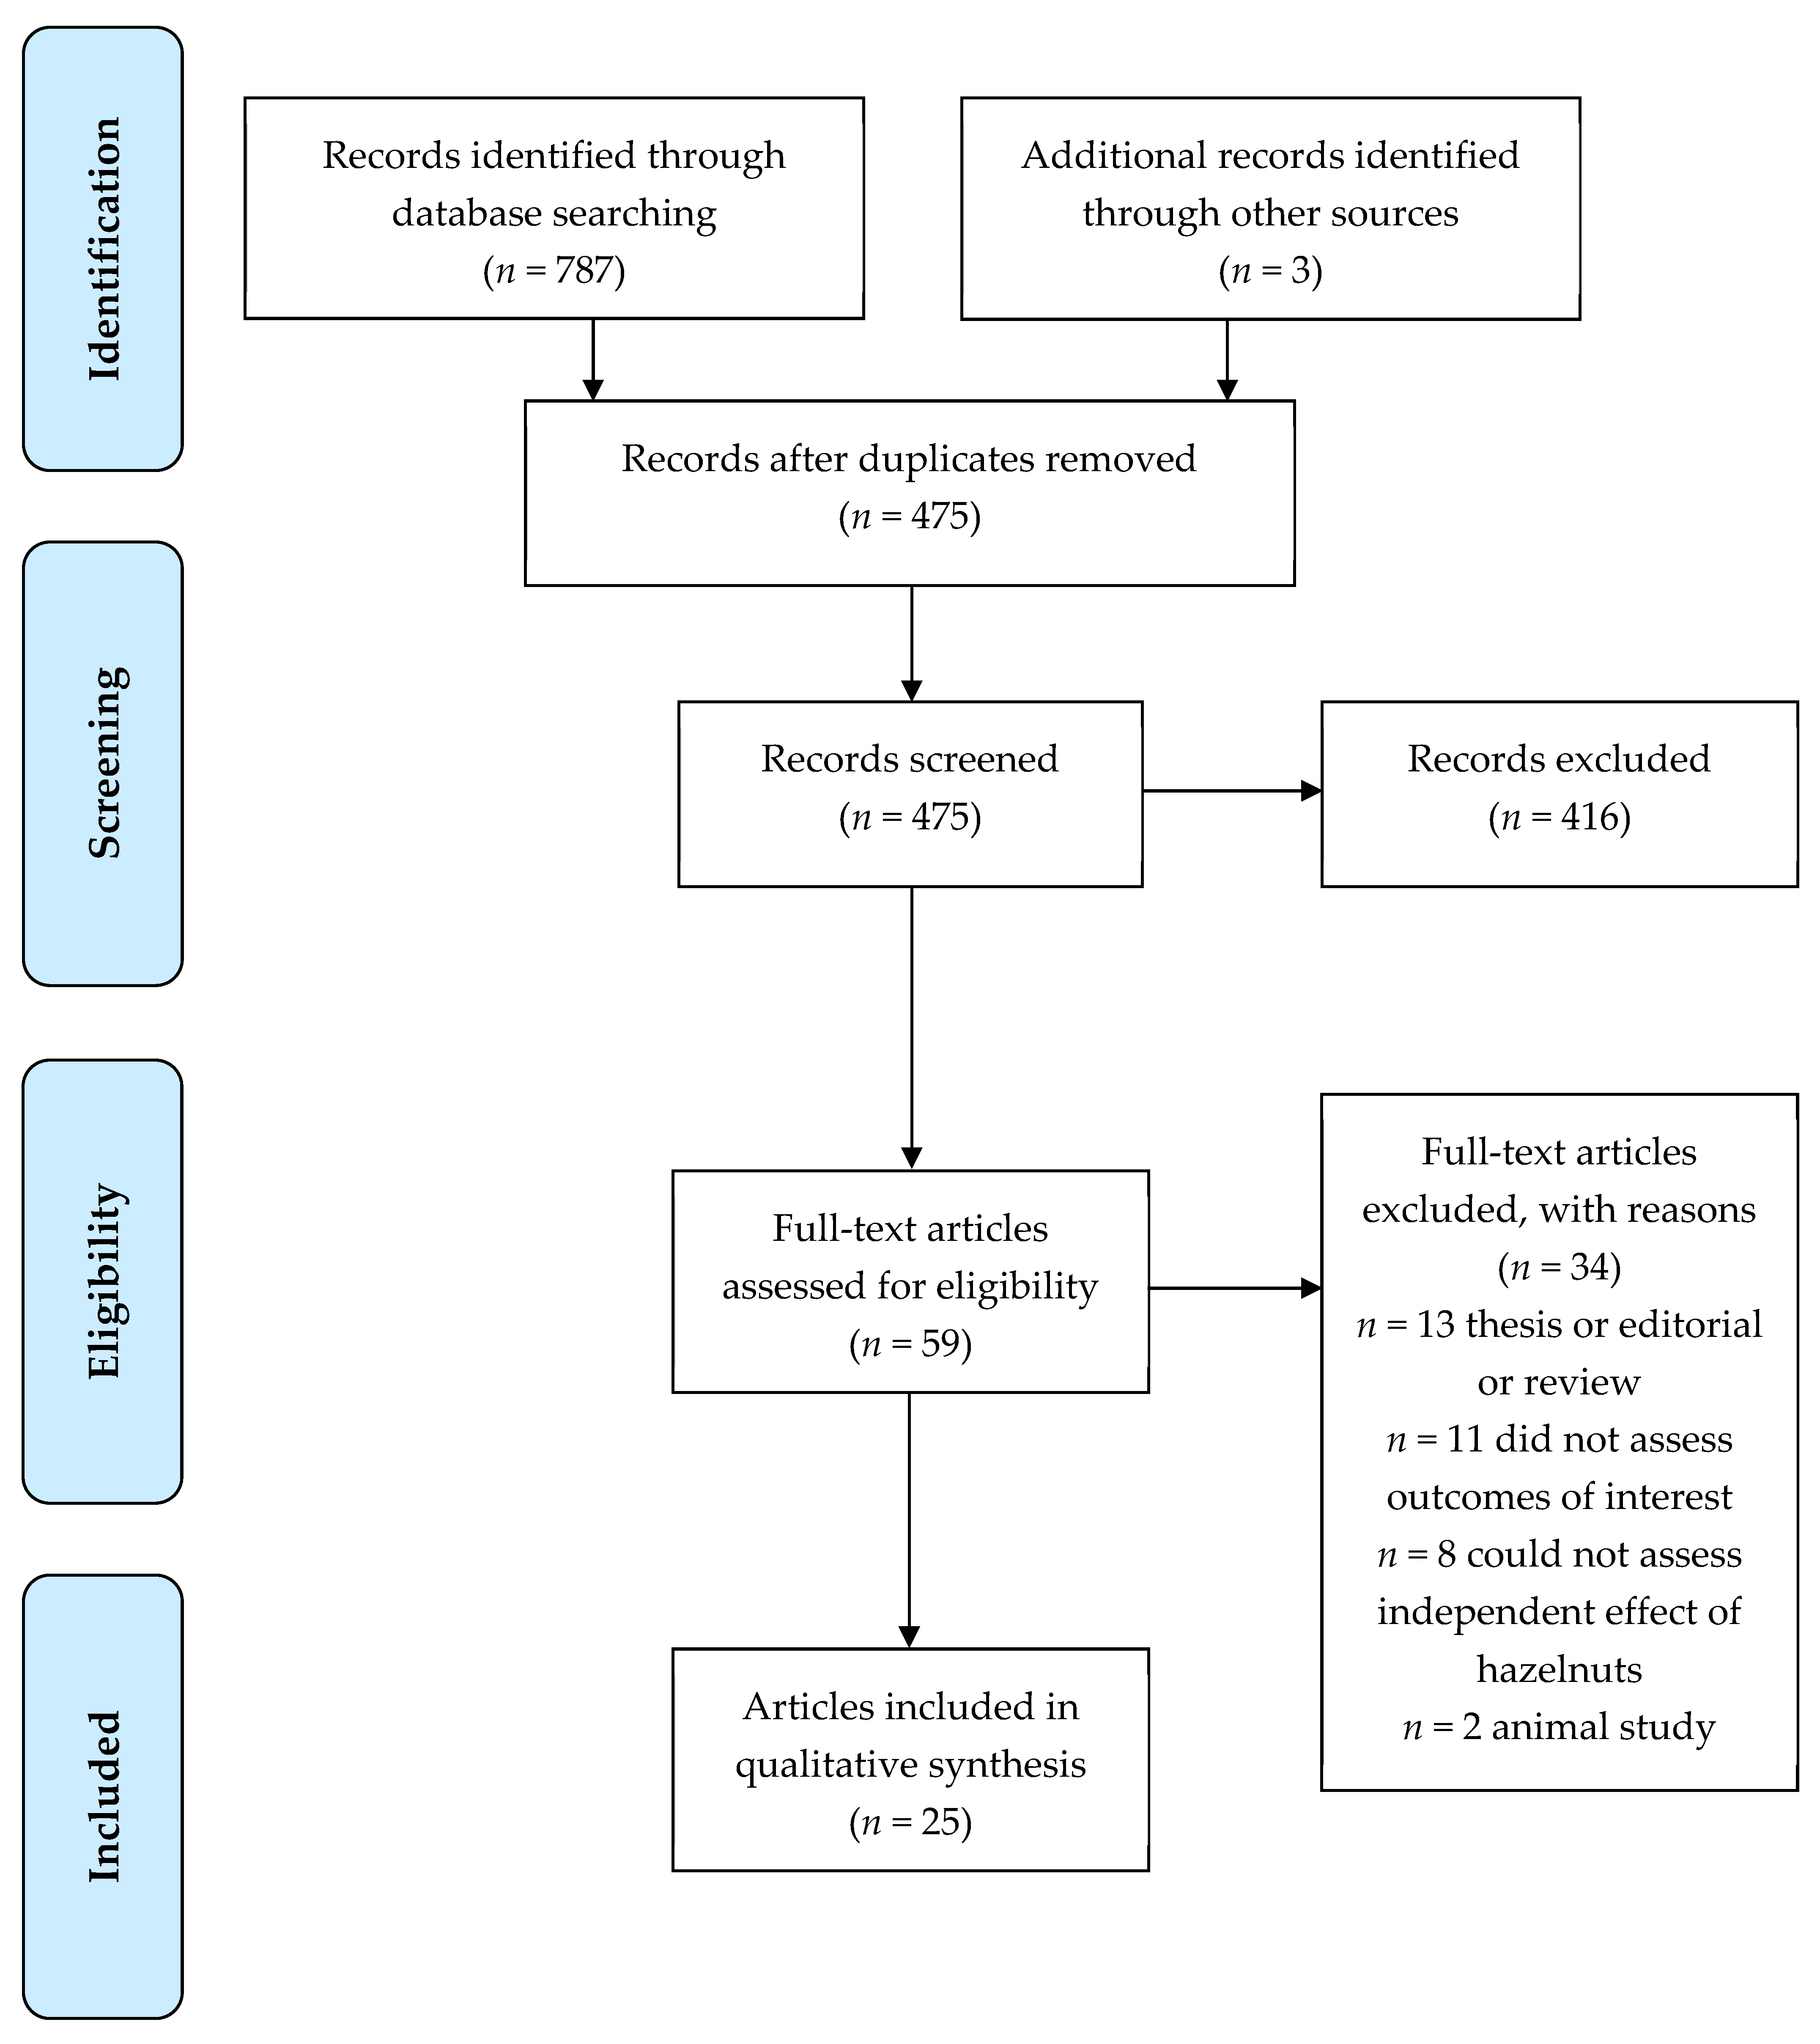
2. Materials and Methods
2.1. Search Strategy
2.2. Inclusion and Exclusion Criteria
2.3. Data Extraction
2.4. Study Quality
3. Results
3.1. Risk of Bias
3.2. Blood Lipids and Lipoproteins
3.3. Apolipoproteins A and B
3.4. Body Weight and Composition
3.5. Blood Pressure
3.6. Glycaemia
3.7. Inflammation, Oxidation, and Endothelial Function
3.8. Sensory Acceptance
4. Discussion
5. Conclusions
Supplementary Materials
Author Contributions
Funding
Institutional Review Board Statement
Informed Consent Statement
Data Availability Statement
Conflicts of Interest
References
- Becerra-Tomás, N.; Paz-Graniel, I.; Kendall, C.W.C.; Kahleova, H.; Rahelić, D.; Sievenpiper, J.L.; Salas-Salvadó, J. Nut consumption and incidence of cardiovascular diseases and cardiovascular disease mortality: A meta-analysis of prospective cohort studies. Nutr. Rev. 2019, 77, 691–709. [Google Scholar] [CrossRef] [PubMed]
- Ros, E.; Singh, A.; O’Keefe, J.H. Nuts: Natural pleiotropic nutraceuticals. Nutrients 2021, 13, 3269. [Google Scholar] [CrossRef] [PubMed]
- Zhang, D.; Dai, C.; Zhou, L.; Li, Y.; Liu, K.; Deng, Y.-J.; Li, N.; Zheng, Y.; Hao, Q.; Yang, S.; et al. Meta-analysis of the association between nut consumption and the risks of cancer incidence and cancer-specific mortality. Aging 2020, 12, 10772–10794. [Google Scholar] [CrossRef]
- Becerra-Tomás, N.; Paz-Graniel, I.; Hernández-Alonso, P.; Jenkins, D.J.A.; Kendall, C.W.C.; Sievenpiper, J.L.; Salas-Salvadó, J. Nut consumption and type 2 diabetes risk: A systematic review and meta-analysis of observational studies. Am. J. Clin. Nutr. 2021, 113, 960–971. [Google Scholar] [CrossRef] [PubMed]
- Luo, C.; Zhang, Y.; Ding, Y.; Shan, Z.; Chen, S.; Yu, M.; Hu, F.B.; Liu, L. Nut consumption and risk of type 2 diabetes, cardiovascular disease, and all-cause mortality: A systematic review and meta-analysis. Am. J. Clin. Nutr. 2014, 100, 256–269. [Google Scholar] [CrossRef] [PubMed]
- Wu, L.; Wang, Z.; Zhu, J.; Murad, A.L.; Prokop, L.J.; Murad, M.H. Nut consumption and risk of cancer and type 2 diabetes: A systematic review and meta-analysis. Nutr. Rev. 2015, 73, 409–425. [Google Scholar] [CrossRef] [PubMed]
- Zhou, D.; Yu, H.; He, F.; Reilly, K.H.; Zhang, J.; Li, S.; Zhang, T.; Wang, B.; Ding, Y.; Xi, B. Nut consumption in relation to cardiovascular disease risk and type 2 diabetes: A systematic review and meta-analysis of prospective studies. Am. J. Clin. Nutr. 2014, 100, 270–277. [Google Scholar] [CrossRef]
- Brown, R.; Tey, S.; Gray, A.; Chisholm, A.; Smith, C.; Fleming, E.; Parnell, W. Association of nut consumption with cardiometabolic risk factors in the 2008/2009 New Zealand Adult Nutrition Survey. Nutrients 2015, 7, 5351. [Google Scholar] [CrossRef]
- O’Neil, C.E.; Keast, D.R.; Nicklas, T.A.; Fulgoni, V.L. Nut consumption is associated with decreased health risk factors for cardiovascular disease and metabolic syndrome in U.S. adults: NHANES 1999–2004. J. Am. Coll. Nutr. 2011, 30, 502–510. [Google Scholar] [CrossRef]
- Bes-Rastrollo, M.; Sabate, J.; Gomez-Gracia, E.; Alonso, A.; Martinez, J.A.; Martinez-Gonzalez, M.A. Nut consumption and weight gain in a Mediterranean cohort: The SUN Study. Obesity 2007, 15, 107–116. [Google Scholar] [CrossRef]
- Nishi, S.K.; Viguiliouk, E.; Blanco Mejia, S.; Kendall, C.W.C.; Bazinet, R.P.; Hanley, A.J.; Comelli, E.M.; Salas Salvadó, J.; Jenkins, D.J.A.; Sievenpiper, J.L. Are fatty nuts a weighty concern? A systematic review and meta-analysis and dose–response meta-regression of prospective cohorts and randomized controlled trials. Obes. Rev. 2021, 22, e13330. [Google Scholar] [CrossRef] [PubMed]
- Altamimi, M.; Zidan, S.; Badrasawi, M. Effect of tree nuts consumption on serum lipid profile in hyperlipidemic individuals: A systematic review. Nutr. Metab. Insights 2020, 13, 1178638820926521. [Google Scholar] [CrossRef] [PubMed]
- Del Gobbo, L.C.; Falk, M.C.; Feldman, R.; Lewis, K.; Mozaffarian, D. Effects of tree nuts on blood lipids, apolipoproteins, and blood pressure: Systematic review, meta-analysis, and dose-response of 61 controlled intervention trials. Am. J. Clin. Nutr. 2015, 102, 1347–1356. [Google Scholar] [CrossRef]
- Sabaté, J.; Oda, K.; Ros, E. Nut consumption and blood lipid levels: A pooled analysis of 25 intervention trials. Arch. Intern. Med. 2010, 170, 821–827. [Google Scholar] [CrossRef]
- Yu, Z.; Malik, V.S.; Keum, N.; Hu, F.B.; Giovannucci, E.L.; Stampfer, M.J.; Willett, W.C.; Fuchs, C.S.; Bao, Y. Associations between nut consumption and inflammatory biomarkers. Am. J. Clin. Nutr. 2016, 104, 722–728. [Google Scholar] [CrossRef]
- Xiao, Y.; Huang, W.; Peng, C.; Zhang, J.; Wong, C.; Kim, J.H.; Yeoh, E.-k.; Su, X. Effect of nut consumption on vascular endothelial function: A systematic review and meta-analysis of randomized controlled trials. Clin. Nutr. 2018, 37, 831–839. [Google Scholar] [CrossRef]
- Xiao, Y.; Xia, J.; Ke, Y.; Cheng, J.; Yuan, J.; Wu, S.; Lv, Z.; Huang, S.; Kim, J.H.; Wong, S.Y.-s.; et al. Effects of nut consumption on selected inflammatory markers: A systematic review and meta-analysis of randomized controlled trials. Nutrition 2018, 54, 129–143. [Google Scholar] [CrossRef] [PubMed]
- Silveira, B.K.S.; da Silva, A.; Hermsdorff, H.H.M.; Bressan, J. Effect of chronic consumption of nuts on oxidative stress: A systematic review of clinical trials. Crit. Rev. Food Sci. Nutr. 2022, 62, 726–737. [Google Scholar] [CrossRef]
- Guarneiri, L.L.; Cooper, J.A. Intake of nuts or nut products does not lead to weight gain, independent of dietary substitution instructions: A systematic review and meta-analysis of randomized trials. Adv. Nutr. 2021, 12, 384–401. [Google Scholar] [CrossRef]
- Alasalvar, C.; Shahidi, F. Tree nuts: Composition, phytochemicals, and health effects: An overview. In Tree Nuts: Composition, Phytochemicals, and Health Effect; Alasalvar, C., Shahidi, F., Eds.; Taylor & Francis Group: Boca Raton, FL, USA, 2008; pp. 1–10. [Google Scholar]
- Di Nunzio, M. Hazelnuts as source of bioactive compounds and health value underestimated food. Curr. Res. Nutr. Food Sci. 2019, 7, 17–28. [Google Scholar] [CrossRef]
- Pelvan, E.; Alasalvar, C.; Uzman, S. Effects of roasting on the antioxidant status and phenolic profiles of commercial Turkish hazelnut varieties (Corylus avellana L.). J. Agric. Food Chem. 2012, 60, 1218–1223. [Google Scholar] [CrossRef] [PubMed]
- Pelvan, E.; Olgun, E.Ö.; Karadağ, A.; Alasalvar, C. Phenolic profiles and antioxidant activity of Turkish Tombul hazelnut samples (natural, roasted, and roasted hazelnut skin). Food Chem. 2018, 244, 102–108. [Google Scholar] [CrossRef] [PubMed]
- Dreher, M.L. A comprehensive review of almond clinical trials on weight measures, metabolic health biomarkers and outcomes, and the gut microbiota. Nutrients 2021, 13, 1968. [Google Scholar] [CrossRef] [PubMed]
- Jamshidi, S.; Moradi, Y.; Nameni, G.; Mohsenpour, M.A.; Vafa, M. Effects of cashew nut consumption on body composition and glycemic indices: A meta-analysis and systematic review of randomized controlled trials. Diabetes Metab. Syndr. 2021, 15, 605–613. [Google Scholar] [CrossRef] [PubMed]
- Asbaghi, O.; Hadi, A.; Campbell, M.S.; Venkatakrishnan, K.; Ghaedi, E. Effects of pistachios on anthropometric indices, inflammatory markers, endothelial function and blood pressure in adults: A systematic review and meta-analysis of randomised controlled trials. Br. J. Nutr. 2021, 126, 718–729. [Google Scholar] [CrossRef] [PubMed]
- Fogacci, F.; Cicero, A.F.G.; Derosa, G.; Rizzo, M.; Veronesi, M.; Borghi, C. Effect of pistachio on brachial artery diameter and flow-mediated dilatation: A systematic review and meta-analysis of randomized, controlled-feeding clinical studies. Crit. Rev. Food Sci. Nutr. 2019, 59, 328–335. [Google Scholar] [CrossRef] [PubMed]
- Malmir, H.; Larijani, B.; Esmaillzadeh, A. The effect of walnut consumption on cardiometabolic profiles of individuals with abnormal glucose homoeostasis: A systematic review and meta-analysis of clinical trials. Br. J. Nutr. 2021, 1–31. [Google Scholar] [CrossRef]
- Mohammadi-Sartang, M.; Bellissimo, N.; Totosy de Zepetnek, J.O.; Bazyar, H.; Mahmoodi, M.; Mazloom, Z. Effects of walnuts consumption on vascular endothelial function in humans: A systematic review and meta-analysis of randomized controlled trials. Clin. Nutr. ESPEN 2018, 28, 52–58. [Google Scholar] [CrossRef] [PubMed]
- Neale, E.P.; Guan, V.; Tapsell, L.C.; Probst, Y.C. Effect of walnut consumption on markers of blood glucose control: A systematic review and meta-analysis. Br. J. Nutr. 2020, 124, 641–653. [Google Scholar] [CrossRef] [PubMed]
- Perna, S.; Giacosa, A.; Bonitta, G.; Bologna, C.; Isu, A.; Guido, D.; Rondanelli, M. Effects of hazelnut consumption on blood lipids and body weight: A systematic review and Bayesian meta-analysis. Nutrients 2016, 8, 747. [Google Scholar] [CrossRef]
- Ouzzani, M.; Hammady, H.; Fedorowicz, Z.; Elmagarmid, A. Rayyan—a web and mobile app for systematic reviews. Syst. Rev. 2016, 5, 210. [Google Scholar] [CrossRef] [PubMed]
- Page, M.J.; McKenzie, J.E.; Bossuyt, P.M.; Boutron, I.; Hoffmann, T.C.; Mulrow, C.D.; Shamseer, L.; Tetzlaff, J.M.; Akl, E.A.; Brennan, S.E.; et al. The PRISMA 2020 statement: An updated guideline for reporting systematic reviews. BMJ 2021, 372, n71. [Google Scholar] [CrossRef] [PubMed]
- Sterne, J.A.C.; Savović, J.; Page, M.J.; Elbers, R.G.; Blencowe, N.S.; Boutron, I.; Cates, C.J.; Cheng, H.-Y.; Corbett, M.S.; Eldridge, S.M.; et al. RoB 2: A revised tool for assessing risk of bias in randomised trials. BMJ 2019, 366, l4898. [Google Scholar] [CrossRef] [PubMed]
- Sterne, J.A.C.; Hernán, M.A.; Reeves, B.C.; Savović, J.; Berkman, N.D.; Viswanathan, M.; Henry, D.; Altman, D.G.; Ansari, M.T.; Boutron, I.; et al. ROBINS-I: A tool for assessing risk of bias in non-randomised studies of interventions. BMJ 2016, 355, i4919. [Google Scholar] [CrossRef]
- Adamo, M.; Labate, A.M.; Ferrulli, A.; Macrì, C.; Terruzzi, I.; Luzi, L. Effects of hazelnuts and cocoa on vascular reactivity in healthy subjects: A randomised study. Int. J. Food Sci. Nutr. 2018, 69, 223–234. [Google Scholar] [CrossRef]
- Damavandi, R.; Eghtesadi, S.; Shidfar, F.; Heydari, I.; Foroushani, A. Effects of hazelnut consumption on fasting blood sugar, total antioxidant capacity, hs-CRP and paraoxonase-1 activity in patients with type 2 diabetes. Razi J. Med. Sci. 2012, 19, 40–50. [Google Scholar]
- Damavandi, R.; Eghtesadi, S.; Shidfar, F.; Heydari, I.; Foroushani, A. Effects of hazelnuts consumption on fasting blood sugar and lipoproteins in patients with type 2 diabetes. J. Res. Med. Sci. Off. J. Isfahan Univ. Med. Sci. 2013, 18, 314–321. [Google Scholar]
- Deon, V.; Del Bo, C.; Guaraldi, F.; Abello, F.; Belviso, S.; Porrini, M.; Riso, P.; Guardamagna, O. Effect of hazelnut on serum lipid profile and fatty acid composition of erythrocyte phospholipids in children and adolescents with primary hyperlipidemia: A randomized controlled trial. Clin. Nutr. 2018, 37, 1193–1201. [Google Scholar] [CrossRef]
- Devi, A.; Chisholm, A.; Gray, A.; Tey, S.L.; Williamson-Poutama, D.; Cameron, S.L.; Brown, R.C. Nut-enriched bread is an effective and acceptable vehicle to improve regular nut consumption. Eur. J. Nutr. 2016, 55, 2281–2293. [Google Scholar] [CrossRef]
- Di Renzo, L.; Merra, G.; Botta, R.; Gualtieri, P.; Manzo, A.; Perrone, M.A.; Mazza, M.; Cascapera, S.; De Lorenzo, A. Post-prandial effects of hazelnut-enriched high fat meal on LDL oxidative status, oxidative and inflammatory gene expression of healthy subjects: A randomized trial. Eur Rev Med Pharm. Sci. 2017, 21, 1610–1626. [Google Scholar]
- Guaraldi, F.; Deon, V.; Del Bo, C.; Vendrame, S.; Porrini, M.; Riso, P.; Guardamagna, O. Effect of short-term hazelnut consumption on DNA damage and oxidized LDL in children and adolescents with primary hyperlipidemia: A randomized controlled trial. J. Nutr. Biochem. 2018, 57, 206–211. [Google Scholar] [CrossRef] [PubMed]
- Tey, S.L.; Brown, R.C.; Chisholm, A.W.; Delahunty, C.M.; Gray, R.; Williams, S.M. Effects of different forms of hazelnuts on blood lipids and α-tocopherol concentrations in mildly hypercholesterolemic individuals. Eur. J. Clin. Nutr. 2011, 65, 117–124. [Google Scholar] [CrossRef] [PubMed]
- Tey, S.L.; Brown, R.; Chisholm, A.; Gray, A.; Williams, S.; Delahunty, C. Current guidelines for nut consumption are achievable and sustainable: A hazelnut intervention. Br. J. Nutr. 2011, 105, 1503–1511. [Google Scholar] [CrossRef] [PubMed]
- Tey, S.L.; Brown, R.; Gray, A.; Chisholm, A.; Delahunty, C. Nuts improve diet quality compared to other energy-dense snacks while maintaining body weight. J. Nutr. Metab. 2011, 2011, 357350. [Google Scholar] [CrossRef] [PubMed]
- Tey, S.L.; Brown, R.C.; Gray, A.R.; Chisholm, A.W.; Delahunty, C.M. Long-term consumption of high energy-dense snack foods on sensory-specific satiety and intake. Am. J. Clin. Nutr. 2012, 95, 1038–1047. [Google Scholar] [CrossRef]
- Tey, S.L.; Gray, A.R.; Chisholm, A.W.; Delahunty, C.M.; Brown, R.C. The dose of hazelnuts influences acceptance and diet quality but not inflammatory markers and body composition in overweight and obese individuals. J. Nutr. 2013, 143, 1254–1262. [Google Scholar] [CrossRef]
- Tey, S.L.; Delahunty, C.; Gray, A.; Chisholm, A.; Brown, R.C. Effects of regular consumption of different forms of almonds and hazelnuts on acceptance and blood lipids. Eur. J. Nutr. 2015, 54, 483–487. [Google Scholar] [CrossRef]
- Tey, S.L.; Robinson, T.; Gray, A.R.; Chisholm, A.W.; Brown, R.C. Do dry roasting, lightly salting nuts affect their cardioprotective properties and acceptability? Eur. J. Nutr. 2017, 56, 1025–1036. [Google Scholar] [CrossRef]
- Yilmaz, H.Ö.; Özyildirim, B. Evaluation of the effects of raisins and hazelnuts added to the diet on lipid profiles and anthropometric measurements in women with hyperlipidemia. Bezmiâlem Sci. 2019, 7, 294–306. [Google Scholar] [CrossRef]
- Alphan, E.; Pala, M.; Ackurt, F.; Yilmaz, T. Nutritional composition of hazelnuts and its effects on glucose and lipid metabolism. Acta Hort 1997, 445, 305–310. [Google Scholar] [CrossRef]
- Di Renzo, L.; Alberto, C.; Daniela, M.; Botta, R.; Contessa, C.; Sartor, C.; Iacopino, A.M.; De Lorenzo, A. Nutrient Analysis Critical Control Point (NACCP): Hazelnut as a prototype of nutrigenomic study. Food Nutr. Sci. 2014, 5, 79–88. [Google Scholar] [CrossRef][Green Version]
- Di Renzo, L.; Cioccoloni, G.; Bernardini, S.; Abenavoli, L.; Aiello, V.; Marchetti, M.; Cammarano, A.; Alipourfard, I.; Ceravolo, I.; Gratteri, S. A hazelnut-enriched diet modulates oxidative stress and inflammation gene expression without weight gain. Oxidative Med. Cell. Longev. 2019, 2019, 4683723. [Google Scholar] [CrossRef] [PubMed]
- Durak, I.; Köksal, I.; Kaçmaz, M.; Büyükkoçak, S.; Çimen, B.M.Y.; Öztürk, H.S. Hazelnut supplementation enhances plasma antioxidant potential and lowers plasma cholesterol levels. Clin. Chim. Acta 1999, 284, 113–115. [Google Scholar] [CrossRef]
- Mercanligil, S.M.; Arslan, P.; Alasalvar, C.; Okut, E.; Akgul, E.; Pinar, A.; Geyik, P.O.; Tokgozoglu, L.; Shahidi, F. Effects of hazelnut-enriched diet on plasma cholesterol and lipoprotein profiles in hypercholesterolemic adult men. Eur. J. Clin. Nutr. 2007, 61, 212–220. [Google Scholar] [CrossRef]
- Michels, A.J.; Leonard, S.W.; Uesugi, S.L.; Bobe, G.; Frei, B.; Traber, M.G. Daily consumption of Oregon hazelnuts affects α-tocopherol status in healthy older adults: A pre-post intervention study. J. Nutr. 2018, 148, 1924–1930. [Google Scholar] [CrossRef] [PubMed]
- Orem, A.; Yucesan, F.B.; Orem, C.; Akcan, B.; Kural, B.V.; Alasalvar, C.; Shahidi, F. Hazelnut-enriched diet improves cardiovascular risk biomarkers beyond a lipid-lowering effect in hypercholesterolemic subjects. J. Clin. Lipidol. 2013, 7, 123–131. [Google Scholar] [CrossRef]
- Santi, C.; Giorni, A.; Terenzi, C.T.; Altavista, P.; Bacchetta, L. Daily hazelnut intake exerts multiple reversible effects on plasma profile of healthy subjects. Food Nutr. Sci. 2017, 8, 633–646. [Google Scholar] [CrossRef][Green Version]
- Tey, S.L.; Robinson, T.; Davis, H.; Gray, A.R.; Chisholm, A.W.; Brown, R.C. The effect of regular hazelnut consumption on cardiovascular risk factors and acceptance in Māori and European. J. Nutr. 2015, 2, 39–53. [Google Scholar] [CrossRef][Green Version]
- Yücesan, F.B.; Örem, A.; Kural, B.V.; Örem, C.; Turan, İ. Hazelnut consumption decreases the susceptibility of LDL to oxidation, plasma oxidized LDL level and increases the ratio of large/small LDL in normolipidemic healthy subjects. Anadolu Kardiyol Derg 2010, 10, 28–35. [Google Scholar] [CrossRef]
- Akhlaghi, M.; Ghobadi, S.; Zare, M.; Foshati, S. Effect of nuts on energy intake, hunger, and fullness, a systematic review and meta-analysis of randomized clinical trials. Crit. Rev. Food Sci. Nutr. 2020, 60, 84–93. [Google Scholar] [CrossRef]
- Franco Estrada, Y.M.; Caldas, A.P.S.; da Silva, A.; Bressan, J. Effects of acute and chronic nuts consumption on energy metabolism: A systematic review of randomised clinical trials. Int. J. Food Sci. Nutr. 2021, 1–11. [Google Scholar] [CrossRef] [PubMed]
- Mattes, R.D.; Dreher, M.L. Nuts and healthy body weight maintenance mechanisms. Asia Pac. J. Clin. Nutr. 2010, 19, 137–141. [Google Scholar] [PubMed]
- Fernández-Rodríguez, R.; Martínez-Vizcaíno, V.; Garrido-Miguel, M.; Martínez-Ortega, I.A.; Álvarez-Bueno, C.; Eumann Mesas, A. Nut consumption, body weight, and adiposity in patients with type 2 diabetes: A systematic review and meta-analysis of randomized controlled trials. Nutr. Rev. 2021. [Google Scholar] [CrossRef] [PubMed]
- Barbour, J.A.; Howe, P.R.C.; Buckley, J.D.; Bryan, J.; Coates, A.M. Nut consumption for vascular health and cognitive function. Nutr. Res. Rev. 2014, 27, 131–158. [Google Scholar] [CrossRef]
- Mohammadifard, N.; Salehi-Abargouei, A.; Salas-Salvadó, J.; Guasch-Ferré, M.; Humphries, K.; Sarrafzadegan, N. The effect of tree nut, peanut, and soy nut consumption on blood pressure: A systematic review and meta-analysis of randomized controlled clinical trials. Am. J. Clin. Nutr. 2015, 101, 966–982. [Google Scholar] [CrossRef]
- Jenkins, D.J.; Kendall, C.W.; Josse, A.R.; Salvatore, S.; Brighenti, F.; Augustin, L.S.; Ellis, P.R.; Vidgen, E.; Rao, A.V. Almonds decrease postprandial glycemia, insulinemia, and oxidative damage in healthy individuals. J. Nutr. 2006, 136, 2987–2992. [Google Scholar] [CrossRef]
- Josse, A.R.; Kendall, C.W.; Augustin, L.S.; Ellis, P.R.; Jenkins, D.J. Almonds and postprandial glycemia--a dose-response study. Metabolism 2007, 56, 400–404. [Google Scholar] [CrossRef]
- Kendall, C.W.C.; West, S.G.; Augustin, L.S.; Esfahani, A.; Vidgen, E.; Bashyam, B.; Sauder, K.A.; Campbell, J.; Chiavaroli, L.; Jenkins, A.L.; et al. Acute effects of pistachio consumption on glucose and insulin, satiety hormones and endothelial function in the metabolic syndrome. Eur. J. Clin. Nutr. 2014, 68, 370–375. [Google Scholar] [CrossRef]
- Tindall, A.M.; Johnston, E.A.; Kris-Etherton, P.M.; Petersen, K.S. The effect of nuts on markers of glycemic control: A systematic review and meta-analysis of randomized controlled trials. Am. J. Clin. Nutr. 2019, 109, 297–314. [Google Scholar] [CrossRef]
- Alasalvar, C.; Bolling, B.W. Review of nut phytochemicals, fat-soluble bioactives, antioxidant components and health effects. Br. J. Nutr. 2015, 113, S68–S78. [Google Scholar] [CrossRef]
- Alasalvar, C.; Salvadó, J.-S.; Ros, E. Bioactives and health benefits of nuts and dried fruits. Food Chem. 2020, 314, 126192. [Google Scholar] [CrossRef] [PubMed]
- Bolling, B.W.; Chen, C.Y.; McKay, D.L.; Blumberg, J.B. Tree nut phytochemicals: Composition, antioxidant capacity, bioactivity, impact factors. A systematic review of almonds, Brazils, cashews, hazelnuts, macadamias, pecans, pine nuts, pistachios and walnuts. Nutr. Res. Rev. 2011, 24, 244–275. [Google Scholar] [CrossRef] [PubMed]
- López-Uriarte, P.; Bulló, M.; Casas-Agustench, P.; Babio, N.; Salas-Salvadó, J. Nuts and oxidation: A systematic review. Nutr. Rev. 2009, 67, 497–508. [Google Scholar] [CrossRef] [PubMed]
- Mazidi, M.; Rezaie, P.; Ferns, G.A.; Gao, H.-k. Impact of different types of tree nut, peanut, and soy nut consumption on serum C-reactive protein (CRP): A systematic review and meta-analysis of randomized controlled clinical trials. Medicine 2016, 95, e5165. [Google Scholar] [CrossRef]
- Neale, E.P.; Tapsell, L.C.; Guan, V.; Batterham, M.J. The effect of nut consumption on markers of inflammation and endothelial function: A systematic review and meta-analysis of randomised controlled trials. BMJ Open 2017, 7, e016863. [Google Scholar] [CrossRef] [PubMed]
- Smeets, E.T.H.C.; Mensink, R.P.; Joris, P.J. Effects of tree nut and groundnut consumption compared with those of l-arginine supplementation on fasting and postprandial flow-mediated vasodilation: Meta-analysis of human randomized controlled trials. Clin. Nutr. 2021, 40, 1699–1710. [Google Scholar] [CrossRef]
- Pearson, K.R.; Tey, S.L.; Gray, A.R.; Chisholm, A.; Brown, R.C. Energy compensation and nutrient displacement following regular consumption of hazelnuts and other energy-dense snack foods in non-obese individuals. Eur. J. Nutr. 2017, 56, 1255–1267. [Google Scholar] [CrossRef]
- Lloyd-Williams, F.; Mwatsama, M.; Ireland, R.; Capewell, S. Small changes in snacking behaviour: The potential impact on CVD mortality. Public Health Nutr. 2009, 12, 871–876. [Google Scholar] [CrossRef]
- Mozaffarian, D.; Capewell, S. United Nations’ dietary policies to prevent cardiovascular disease. BMJ 2011, 343, d5747. [Google Scholar] [CrossRef][Green Version]
- Jardim, T.V.; Mozaffarian, D.; Abrahams-Gessel, S.; Sy, S.; Lee, Y.; Liu, J.; Huang, Y.; Rehm, C.; Wilde, P.; Micha, R.; et al. Cardiometabolic disease costs associated with suboptimal diet in the United States: A cost analysis based on a microsimulation model. PLoS Med. 2019, 16, e1002981. [Google Scholar] [CrossRef]
- Mozaffarian, D.; Appel, L.J.; Horn, L.V. Components of a cardioprotective diet. Circulation 2011, 123, 2870–2891. [Google Scholar] [CrossRef] [PubMed]


| Parameter | Criterion |
| Participants | Humans |
| Intervention | Consumption of hazelnuts |
| Comparator | No nut control, control food, baseline |
| Outcomes | Total cholesterol, LDL-C, HDL-C, TAG, apolipoprotein A1, apolipoprotein B100, body weight, blood pressure, glycaemic control, antioxidant status, vitamin E, oxidative stress, inflammatory markers, endothelial function, acceptance |
| Study design | Intervention studies in peer-reviewed journals where hazelnuts were the dietary component under study. |
| Author, Year (Study Location) | Random Sequence Generation | Allocation Concealment | Selective Reporting | Blinding | Blinding of Outcome Assessment | Incomplete Outcome Assessment | Overall Quality |
|---|---|---|---|---|---|---|---|
| Adamo et al., 2018 [36] (Italy) | low | unclear | high | high | high | low | poor |
| Damavandi et al., 2012 [37] (Iran) | low | unclear | low | high | low | low | good |
| Damavandi et al., 2013 [38] (Iran) | low | unclear | low | high | low | low | good |
| Deon et al., 2018 [39] (Italy) | low | unclear | low | high | low | low | good |
| Devi et al., 2016 [40] (New Zealand) | low | low | low | high | low | low | good |
| Di Renzo et al., 2017 [41] (Italy) | low | low | low | high | low | low | good |
| Guaraldi et al., 2018 [42] (Italy) | low | low | low | high | low | low | good |
| Tey et al., 2011 [43] (New Zealand) | low | low | low | high | low | low | good |
| Tey et al., 2011 [44] (New Zealand) | low | low | low | high | low | low | good |
| Tey et al., 2011 [45] (New Zealand) | low | low | low | high | low | low | good |
| Tey et al., 2012 [46] (New Zealand) | low | low | low | high | low | low | good |
| Tey et al., 2013 [47] (New Zealand) | low | low | low | high | low | low | good |
| Tey et al., 2015 [48] (New Zealand) | low | low | low | high | low | low | good |
| Tey et al., 2017 [49] (New Zealand) | low | low | low | high | low | low | good |
| Yilmaz et al., 2019 [50] (Turkey) | unclear | unclear | low | high | high | low | fair |
| Author, Year (Study Location) | Bias Due to Confounding | Bias in Selection of Participants into the Study | Bias in Classification of Interventions | Bias Due to Deviations from Intended Interventions | Bias Due to Missing Data | Bias in Measurement of Outcomes | Bias in Selection of the Reported Result | Overall Risk of Bias |
|---|---|---|---|---|---|---|---|---|
| Alphan et al., 1997 [51] (Turkey) | critical | no information | low | low | no information | moderate | serious | critical |
| Di Renzo et al., 2014 [52] (Italy) | critical | low | low | low | moderate | moderate | serious | critical |
| Di Renzo et al., 2019 [53] (Italy) | critical | low | low | low | moderate | moderate | low | critical |
| Durak et al., 1999 [54] (Turkey) | critical | moderate | low | low | no information | serious | serious | critical |
| Mercanligil et al., 2007 [55] (Turkey) | critical | low | low | low | low | serious | low | critical |
| Michels et al., 2018 [56] (USA) | critical | moderate | low | low | moderate | moderate | low | critical |
| Orem et al., 2013 [57] (Turkey) | serious | moderate | low | low | no information | moderate | moderate | moderate |
| Santi et al., 2017 [58] (Italy) | serious | moderate | low | low | no information | moderate | moderate | moderate |
| Tey et al., 2015 [59] (New Zealand) | critical | low | low | low | moderate | moderate | low | critical |
| Yucesan et al., 2010 [60] (Turkey) | critical | moderate | low | low | no information | moderate | moderate | critical |
| Author, Year | Study Design | Participant Characteristics | Duration | Treatment | TC mmol/L | LDL-C mmol/L | HDL-C mmol/L | TAG mmol/L | Between Treatments |
|---|---|---|---|---|---|---|---|---|---|
| Adamo et al., 2018 [36] | Randomised parallel 6 treatments | 61 (31 M, 30 F) BMI 18.5–24.9 kg/m2 | 2-weeks | Breakfasts including: (i) 30 g/d peeled hazelnut paste | NR | NR | NR | NR | 30 g of unpeeled hazelnut significantly increased HDL-C compared to control (16.0%, p = 0.02) |
| Baseline (ii) 30 g/d unpeeled hazelnut paste | NR NR | 2.49 2.33 | 1.68 1.82 | NR NR | |||||
| Change 1 | NR | −0.16 a | +0.14 b | NR | |||||
| % change | −2.0% | −6.0% | +16.0% | NR | |||||
| (iii) snack with 30 g/d peeled hazelnut paste | NR | NR | NR | NR | |||||
| (iv) snack with 2.5 g cocoa powder | NR | NR | NR | NR | |||||
| Baseline | NR | NR | NR | NR | |||||
| (v) Snack with 30 g/d peeled hazelnut paste and 2.5 g cocoa powder | NR | NR | NR | NR | |||||
| % change | −0.9% | −3.4% a | +5.2% | NR | |||||
| (vi) no snack control group N.B. Data was only presented for treatment ii vs. control and treatment v vs. control | NR | NR | NR | NR | |||||
| Alphan et al., 1997 [51] | Sequential intervention periods | 19 (5 M, 14 F) with type 2 diabetes | 30 days | Baseline | 5.40 | 3.36 | 0.95 | 2.78 | Between-group analysis NR. |
| (i) High CHO diet (60% CHO, 25% fat) | 5.67 | 3.92 | 0.97 | 2.45 | |||||
| Change 1 | +0.27 b | +0.56 b | +0.02 | −0.33 | |||||
| Baseline | 6.13 | 4.66 | 0.96 | 2.47 | |||||
| (ii) Hazelnuts (40% CHO, 45% fat—quantity of hazelnuts not reported) | 5.40 | 3.44 | 1.04 | 2.07 | |||||
| Change 1 | −0.73 b | −1.22 b | +0.08 | −0.40 | |||||
| Damavandi et al., 2013 [38] | Randomised parallel 2 treatments | 50 (16 M, 34 F) with type 2 diabetes | 8 weeks | Baseline | 4.12 | 2.18 | 1.14 | 1.75 | Significantly greater decrease in HDL-C in the control group compared to the hazelnut group (p = 0.009) |
| (i) Hazelnuts 10% of TE | 3.75 | 2.21 | 1.08 | 1.45 | |||||
| Change 1 | −0.37 | +0.02 | −0.06 | −0.30 | |||||
| Baseline | 3.62 | 1.94 | 1.04 | 1.41 | |||||
| (ii) Control (no hazelnuts) | 3.47 | 1.90 | 0.95 | 1.40 | |||||
| Change 1 | −0.15 | −0.04 | −0.09 b | −0.01 | |||||
| Deon et al., 2018 [39] | Randomised parallel 3 treatments | 66 children and adolescents (35 M 31 F) with hyperlipidaemia | 8 weeks | Baseline | 5.58 | 3.67 | 1.60 | 0.76 ‡ | No significant between-group differences |
| (i) Hazelnuts with skin (0.43 g /kg (15–30 g)) | 5.28 | 3.43 | 1.63 | 0.66 ‡ | |||||
| Change 1 | −0.30 | −0.24 a | +0.03 | −0.10 | |||||
| Baseline | 5.73 | 3.66 | 1.58 | 0.69 ‡ | |||||
| (ii) Hazelnuts without skin (0.43 g/kg (15–30 g)) | 5.49 | 3.43 | 1.61 | 0.79 ‡ | |||||
| Change 1 | −0.24 | −0.23 a | +0.03 | +0.10 | |||||
| Baseline | 5.44 | 3.54 | 1.43 | 0.86 ‡ | |||||
| Control (dietary advice only) | 5.28 | 3.41 | 1.44 | 0.87 ‡ | |||||
| Change 1 | −0.16 | −0.13 | +0.01 | +0.01 | |||||
| Di Renzo et al., 2019 [53] | Single intervention Pilot | 24 (14 M, 10 F) healthy | 6 weeks | Baseline | 4.68 ‡ | 2.95 ‡ | 1.33 ‡ | 1.34 ‡ | N/A, single intervention |
| (i) Hazelnuts (40 g /d) | 4.32 ‡ | 2.66 ‡ | 1.23 ‡ | 0.93 ‡ | |||||
| Change 1 | −0.36 b | −0.29 b | −0.10 | −0.41 | |||||
| Durak et al., 1999 [54] | Single intervention | 30 (18 M, 12 F) Healthy medical students | 1 month | Baseline | 3.38 | 1.95 | 1.03 | 0.86 | N/A, single intervention |
| (i) Hazelnuts (1 g/kg BW (68–69 g)) | 3.17 | 1.58 | 1.11 | 1.07 | |||||
| Change 1 | −0.21 b | −0.37 c | +0.08 a | +0.21 c | |||||
| Mercanligil et al., 2007 [55] | Sequential intervention periods 2 treatments | 15 (15 M, 0 F) with hyper-cholesterolaemia | 4 weeks | Baseline | 6.22 | 4.03 | 1.14 | 2.30 | Compared with the control diet, the hazelnut-enriched diet significantly improved HDL-C (p < 0.05). |
| (i) Control LF, low cholesterol, high CHO diet | 5.86 | 3.80 | 1.13 | 2.02 | |||||
| Change 1 | −0.36 | −0.23 | −0.01 | −0.28 | |||||
| Baseline | 6.22 | 4.03 | 1.14 | 2.30 | |||||
| (ii) Control + Hazelnuts (40 g) | 5.89 | 3.90 | 1.28 | 1.57 | |||||
| Change 1 | −0.33 | −0.13 | +0.14 a | −0.73 a | |||||
| Michels et al., 2018 [56] | Single intervention | 32 (10 M, 22F F) healthy, non-frequent nut consumers, Vit E intake <10 mg a-tocopherol/d, no Vit E supplements in previous 12 months | 16 weeks | Baseline | 5.05 | 2.97 | 1.67 | 0.93 | N/A, single intervention |
| (i) Hazelnuts, dry roasted (~57 g/day) | 4.95 | 2.79 | 1.72 | 0.97 | |||||
| Change 1 | −0.1 | −0.18 a | +0.05 | +0.04 | |||||
| Orem et al., 2013 [57] | Double control sandwich model intervention | 21 (18 M, 3 F) Hypercholesterolaemia | 4 weeks | (i) 4 week no-nut (Control I) diet | 5.77 | 4.01 | 1.12 | 1.65 ‡ | Compared with the Control I period, hazelnut period significantly improved lipid and lipoprotein profile. Compared with the hazelnut period, the lipid and lipoprotein profile were significantly worse on the Control II period. All p < 0.05. |
| (ii) 4-week hazelnut-enriched diet (49–86 g/d (18–20% TER)) | 5.30 | 3.75 | 1.19 | 1.38 ‡ | |||||
| Change 1 from (i) to (ii) | −0.47 | −0.26 | +0.07 | −0.27 | |||||
| % change | −7.82% | −6.17% | +6.07% | −7.3% | |||||
| (iii) 4 week no-nut (Control II) diet | 5.82 | 4.09 | 1.03 | 1.63 ‡ | |||||
| Change 1 from (ii) to (iii) | +0.52 | +0.34 | −0.16 | +0.25 | |||||
| % change | +9.78% | +9.37% | −3.67% | +13.7% | |||||
| Santi et al., 2017 [58] | Double control sandwich model intervention | 24 (14 M, 10 F) Healthy BMI > 19 kg/m2, <30 kg/m2 | 6-weeks | (i) 2-week ‘standard’ diet | 5.33 | 3.44 | 1.45 | 1.18 | TC and LDL decreased significantly after the hazelnut diet compared to after Control I diet (p = 0.01) and p = 0.003, respectively). TC and LDL-C increased after Control II diet but not significantly; TC and LDL-C were significantly lower after Control II compared to after Control I i.e., the reduction during hazelnut diet remained significant (p = 0.04 and p = 0.004) respectively. |
| (ii) 6-week 40 g raw hazelnut | 4.90 | 3.08 | 1.38 | 1.20 | |||||
| Change 1 from (i) to (ii) | −0.43 | −0.36 b | −0.07 | +0.02 | |||||
| (iii) 6-week ‘standard’ diet ‘washout’ | 5.16 | 3.33 | 1.36 | 1.29 | |||||
| Change 1 from (ii) to (iii) | +0.26 | +0.25 | −0.02 | +0.09 | |||||
| Change 1 from (i) to (iii) | −0.17 a | −0.11 b | −0.09 | +0.11 | |||||
| Tey et al., 2011 [43] | Randomised Crossover 3 treatments | 48 (20 M, 28 F) with mild hyper-cholesterolaemia | 4 weeks | Baseline | 5.88 | 4.01 | 1.21 | 1.43 | There were no significant differences in blood lipids and lipoproteins between different forms of nuts. |
| (i) Ground hazelnuts (30 g/d) | 5.71 | 3.82 | 1.26 | 1.37 | |||||
| Change 1 | −0.17 c | −0.19 c | +0.05 a | −0.06 | |||||
| Baseline | 5.88 | 4.01 | 1.21 | 1.43 | |||||
| (ii) Sliced hazelnuts (30 g/d) | 5.67 | 3.77 | 1.24 | 1.44 | |||||
| Change 1 | −0.21 c | −0.24 c | +0.03 a | +0.01 | |||||
| Baseline | 5.88 | 4.01 | 1.21 | 1.43 | |||||
| (iii) Whole hazelnuts (30 g/d) | 5.63 | 3.74 | 1.25 | 1.39 | |||||
| Change 1 | −0.25 c | −0.27 c | +0.04 a | −0.04 | |||||
| Tey et al., 2011 [45] | Randomised Parallel 4 treatments | 118 (55 M, 63 F) Healthy, BMI < 30 kg/m2 | 12 weeks | Baseline | 4.79 | 2.94 | 1.32 ^ | 0.98 ^ | There were no significant differences in blood lipids and lipoproteins between different treatments. |
| (i) Control | 4.89 | 3.03 | N/R | N/R | |||||
| Change 1 | +0.10 | +0.09 | 1.00 ^ | 1.03 ^ | |||||
| Baseline | 4.79 | 2.94 | 1.32 ^ | 0.98 ^ | |||||
| (ii) Hazelnuts (42 g/d) | 4.73 | 2.85 | N/R | N/R | |||||
| Change 1 | −0.06 | −0.09 | 1.02 ^ | 0.99 ^ | |||||
| Baseline | 4.79 | 2.94 | 1.32 ^ | 0.98 ^ | |||||
| (iii) Chocolate (50 g/d) | 5.01 | 3.07 | N/R | N/R | |||||
| Change 1 | +0.22 | +0.13 | 1.04 ^ | 1.05 ^ | |||||
| Baseline | 4.79 | 2.94 | 1.32 ^ | 0.98 ^ | |||||
| (iv) Potato crisp (50 g/d) | 4.84 | 2.88 | N/R | N/R | |||||
| Change 1 | +0.05 | −0.06 | 1.04 ^ | 1.04 ^ | |||||
| Tey et al., 2013 [47] | Randomised Parallel 3 treatments | 107 (46 M, 61 F) BMI ≥ 25 kg/m2 | 12 weeks | Baseline | 4.93 | 3.03 | 1.32 | 1.27 | There were no significant differences in blood lipids and lipoproteins between treatments. |
| (i) Control (no hazelnuts) | 4.91 | 3.05 | 1.34 | 1.13 | |||||
| Change 1 | −0.02 | +0.02 | +0.02 | −0.14 | |||||
| Baseline | 4.92 | 3.07 | 1.26 | 1.29 | |||||
| (ii) Hazelnuts (30 g/d) | 4.78 | 2.93 | 1.30 | 1.19 | |||||
| Change 1 | −0.14 | −0.14 | +0.04 | −0.10 | |||||
| Baseline | 4.93 | 3.05 | 1.20 | 1.49 | |||||
| (iii) Hazelnuts (60 g/d) | 4.80 | 2.96 | 1.20 | 1.41 | |||||
| Change 1 | −0.13 | −0.09 | 0.00 | −0.08 | |||||
| Tey et al., 2015 [59] | Single intervention | 20 Māori (8 M, 12 F) and 19 (5 M, 14 F) European aged above 18 years | 4 weeks | Māori | N/A, single intervention, but there were no significant differences in blood lipids and lipoprotein between Māori and Europeans. | ||||
| Baseline | 4.14^ | 2.46^ | 1.16^ | 1.01^ | |||||
| (i) Raw hazelnuts (30 g/d) | 4.17^ | 2.42^ | 1.19^ | 1.04^ | |||||
| Change 1 | N/R | N/R | N/R | N/R | |||||
| European | |||||||||
| Baseline | 3.96 ^ | 2.28 ^ | 1.16 ^ | 0.96 ^ | |||||
| (i) Raw hazelnuts (30 g/d) | 3.93 ^ | 2.25 ^ | 1.18 ^ | 0.94 ^ | |||||
| Change 1 | N/R | N/R | N/R | N/R | |||||
| Tey et al., 2017 [49] | Randomised Crossover 2 treatments | 72 (24 M, 48 F) Aged 18 years and above | 4 weeks | Baseline | 5.11 | 3.25 | 1.35 | 1.10 | HDL-C (p = 0.037) was significantly higher following the consumption of raw hazelnuts, while triacylglycerol (p < 0.001) was significantly lower following the consumption of dry-roasted, lightly salted hazelnuts. No significant differences in TC and LDL-C between the treatments. |
| (i) Raw hazelnuts (30 g/d) | 5.13 | 3.14 | 1.45 | 1.12 | |||||
| Change 1 | +0.02 | −0.11 a | +0.10 c | +0.02 | |||||
| Baseline | 5.11 | 3.25 | 1.35 | 1.10 | |||||
| (ii) Dry roasted, lightly salted hazelnuts (30 g/d) | 5.06 | 3.17 | 1.41 | 1.03 | |||||
| Change 1 | −0.05 | −0.08 | +0.06 c | −0.07 a | |||||
| Yilmaz et al., 2019 [50] | Randomised Parallel 4 treatments | 37 (0 M, 37 F) Hyperlipidaemia, Obese | 6 weeks | Baseline | 6.17 | 4.09 | 1.29 | 1.71 | There were no significant differences in blood lipids and lipoproteins between treatments. |
| (i) Hazelnuts (50 g/d) and cardioprotective diet | 5.61 | 3.61 | 1.36 | 1.40 | |||||
| Change 1 | −0.56 b | −0.48 b | +0.07 | −0.31 | |||||
| Baseline | 6.02 | 3.97 | 1.33 | 1.55 | |||||
| (ii) Raisins (50 g/d) and cardioprotective diet | 5.43 | 3.49 | 1.29 | 1.45 | |||||
| Change 1 | −0.59 a | −0.48 b | −0.04 | −0.10 | |||||
| Baseline | 5.93 | 3.69 | 1.33 | 1.99 | |||||
| (iii) Hazelnuts (50 g/d) and Raisins and cardioprotective diet (50 g/d) | 5.29 | 3.18 | 1.36 | 1.65 | |||||
| Change 1 | −0.64 a | −0.51 b | +0.03 | −0.34 | |||||
| Baseline | 6.01 | 4.02 | 1.27 | 1.59 | |||||
| (iv) Control (Cardioprotective diet) | 5.61 | 3.53 | 1.26 | 1.87 | |||||
| Change 1 | −0.40 b | −0.49 a | −0.01 | +0.28 | |||||
| Yucesan et al., 2010 [60] | Single intervention | 21 (8 M, 13 F) with normolipidaemia | 4 weeks | Baseline | 4.21 | 2.81 | 1.38 | 1.01 | N/A, single intervention |
| (i) Hazelnuts (1 g/kg BW (49–86 g)) | 3.85 | 2.60 | 1.44 | 0.88 | |||||
| Change 1 | −0.36 c | −0.21 b | +0.06 | −0.13 |
| Author, Year | Study Design | Participant Characteristics | Duration | Treatment | Apo A g/L | Apo B g/L | Between Treatments |
|---|---|---|---|---|---|---|---|
| Alphan et al., 1997 [51] | Sequential intervention periods 2 treatments | 19 (5 M, 14 F) Type 2 diabetics | 30 days | Baseline | 1.89 | 2.29 | Between-group analysis NR. |
| (i) High CHO diet (60% CHO, 25% fat) | 2.33 | 2.92 | |||||
| Change 1 | +0.44 | +0.63 | |||||
| Baseline | 1.81 | 2.03 | |||||
| (ii) Hazelnuts (40% CHO, 45% fat, hazelnuts amount NR) | 1.94 | 1.87 | |||||
| Change 1 | +0.13 | −0.16 | |||||
| Mercanligil et al., 2007 [55] | Sequential intervention periods 2 treatments | 15 (15 M, 0 F) Hyper-cholesterolaemic | 4 weeks | Baseline | 1.36 | 1.33 | There were no significant differences in apo A and apo B between the diets. |
| (i) Control LF, low cholesterol, high CHO diet | 1.32 | 1.28 | |||||
| Change 1 | −0.04 | −0.05 | |||||
| Baseline | 1.36 | 1.33 | |||||
| (ii) Control + Hazelnuts (40 g/d) | 1.36 | 1.21 | |||||
| Change 1 | 0.00 | −0.12 a | |||||
| Orem et al., 2013 [57] | Double control sandwich model intervention | 21 (18 M, 3 F) Hyper-cholesterolaemic | 4 weeks | (i) 4 week no-nut (Control I) diet | 1.31 | 1.15 | Apo A significantly increased after hazelnut period compared to Control I. Apo A significantly decreased after the Control II period compared to the hazelnut-enriched diet Apo B significantly increased after the Control II period compared to the hazelnut-enriched diet |
| (ii) 4-week hazelnut-enriched diet (49–86 g/d (18–20% TER)) | 1.46 | 1.12 | |||||
| (iii) 4 week no-nut (Control II) diet | 1.38 | 1.20 | |||||
| % change from (i) to (ii) | +12.0 | −1.90 | |||||
| % change from (ii) to (iii) | −5.61 | +15.2 | |||||
| Tey et al., 2011 [43] | Randomised Crossover 3 treatments | 48 (20 M, 28 F) Mildly hyper-cholesterolaemic | 4 weeks | Baseline | 1.78 | 1.05 | There were no significant differences in apo A and apo B between the different forms of nuts. |
| (i) Ground hazelnuts (30 g) | 1.79 | 1.02 | |||||
| Change 1 | +0.01 | −0.03 b | |||||
| Baseline | 1.78 | 1.05 | |||||
| (ii) Sliced hazelnuts (30 g) | 1.78 | 1.01 | |||||
| Change 1 | 0.00 | −0.04 b | |||||
| Baseline | 1.78 | 1.05 | |||||
| (iii) Whole hazelnuts (30 g) | 1.79 | 1.00 | |||||
| Change 1 | +0.01 | −0.05 b | |||||
| Tey et al., 2013 [47] | Randomised Parallel 3 treatments | 107 (46 M, 61 F) Overweight and obese individuals with a BMI ≥ 25 kg/m2 | 12 weeks | Baseline | 1.67 | 0.87 | There were no significant differences in apo A and apo B between the groups. |
| (i) Control group (no hazelnuts) | 1.65 | 0.86 | |||||
| Change 1 | −0.02 | −0.01 | |||||
| Baseline | 1.60 | 0.88 | |||||
| (ii) Hazelnuts (30 g/d) | 1.63 | 0.85 | |||||
| Change 1 | +0.03 | −0.03 | |||||
| Baseline | 1.56 | 0.89 | |||||
| (ii) Hazelnuts (60 g/d) | 1.57 | 0.87 | |||||
| Change 1 | +0.01 | −0.02 | |||||
| Tey et al., 2015 [59] | Single intervention | 20 Māori (8 M, 12 F) and 19 (5 M, 14 F) European aged above 18 years | 4 weeks | Māori | N/A, single intervention, but there were no significant differences in apo A and apo B between Māori and Europeans. | ||
| Baseline | 1.51 ^ | 0.71 ^ | |||||
| (i) Raw hazelnuts (30 g/d) | 1.57 ^ | 0.70 ^ | |||||
| Change 1 | N/R | N/R | |||||
| European | |||||||
| Baseline | 1.51 ^ | 0.65 ^ | |||||
| (i) Raw hazelnuts (30 g/d) | 1.52 ^ | 0.63 ^ | |||||
| Change 1 | N/R | N/R | |||||
| Tey et al., 2017 [49] | Randomised Crossover 2 treatments | 72 (24 M, 48 F) Aged 18 years and above | 4 weeks | Baseline | 1.59 | 0.87 | There were no significant differences in apo A and apo B between the groups. |
| (i) Raw hazelnuts (30 g/d) | 1.65 | 0.86 | |||||
| Change 1 | +0.06 b | −0.01 | |||||
| Baseline | 1.59 | 0.87 | |||||
| (ii) Dry roasted, lightly salted hazelnuts (30 g/d) | 1.63 | 0.86 | |||||
| Change 1 | +0.04 b | −0.01 | |||||
| Yucesan et al., 2010 [60] | Single intervention | 21 (8 M, 13 F) Normolipidaemic | 4 weeks | Baseline | 1.35 | 0.78 | N/A, single intervention |
| (i) Hazelnuts (1 g/kg BW (49–86 g)) | 1.41 | 0.71 | |||||
| Change 1 | +0.06 b | −0.07 b |
| Author, Year | Study Design | Participant Characteristics | Duration | Comparison Made Body Weight | Treatment Body Weight | Change in Body Weight 1 | Between Treatments |
|---|---|---|---|---|---|---|---|
| Alphan et al., 1997 [51] | Sequential intervention periods 2 treatments | 19 (5 M, 14 F) Type 2 diabetics | 30 days | (i) Baseline BMI: 27.5 kg/m2 | (i) High CHO diet (60% CHO, 25% fat) BMI: 27.3 kg/m2 | (i) No significant change | Between-group analysis NR. |
| (ii) Baseline BMI: 27.1 kg/m2 | (ii) Hazelnut diet (40% CHO, 40% fat, Hazelnut amount NR) BMI: 27.1 kg/m2 | (ii) No significant change | |||||
| Damavandi et al., 2012 [37] | Randomised parallel 2 treatments | 50 (16 M, 34 F) with type 2 diabetes | 8 weeks | (i)Baseline Weight: 72.13 kg BMI: 28.47 kg/m2 | (i) Hazelnut (10% TE) Weight: 71.47 kg BMI: 27.92 kg/m2 | (i) No significant change | No significant between-group differences in body weight or BMI. |
| (ii) Baseline Weight: 71.98 kg BMI: 28.18 kg/m2 | (ii) Control: no hazelnuts Weight: 71.64 kg BMI: 28.08 kg/m2 | (ii) No significant change | |||||
| Deon et al., 2018 [39] | Randomised parallel 3 treatments | 66 children and adolescents (35 M 31 F) with hyperlipidaemia | 8 weeks | (i) Baseline Weight: 44.4 kg BMI: 20.4 kg/m2 | (i) Hazelnuts with skin (0.43 g/kg (15–30 g/d)) Weight: 45.0 kg BMI: 20.3 kg/m2 | (i) No significant change for BMI | No significant between-group differences in BMI, there was a time effect for height and weight. |
| (ii) Baseline Weight: 47.8 kg BMI: 20.3 kg/m2 | (ii) Hazelnuts without skin (0.43 g/kg (15–30 g/d)) Weight: 48.4 kg BMI: 20.3 kg/m2 | (ii) No significant change for BMI | |||||
| (iii) Baseline Weight: 49.5 kg BMI: 20.9 kg/m2 | (iii) Control: no hazelnuts Weight: 50.0 kg BMI: 20.8 kg/m2 | (iii) No significant change for BMI | |||||
| Di Renzo et al., 2014 [52] | Sequential intervention periods 2 treatments | 24 participants BMI ≥ 19 kg/m2 | 4 weeks | (i) Baseline Weight: 66.15 kg | (i) 4 week standard diet (Italian Mediterranean diet) Weight: 67.8 kg WC: 77.44 cm HC: 97.5 cm Fat mass: 16.93 kg LBM: 34.56 kg | NR | HC and LBM was significantly higher, and fat mass was significantly lower after the hazelnut diet compared to the standard diet (all p < 0.05). |
| (ii) Baseline NR | (ii) Hazelnuts (40 g/d) Weight: 66.8 kg WC: 76.43 cm HC: 99.76 cm Fat mass: 14.83 kg LBM: 35.07 kg | ||||||
| Di Renzo et al., 2019 [53] | Single intervention Pilot | 24 (14 M, 10 F) healthy | 6 weeks | (i) Baseline ‡ Weight: 71.4 kg BMI: 25.95 kg/m2 WC: 86.25 cm AC: 94.00 cm HC: 98.25 cm Total body fat: 34.75 kg Total BF: 29.65% Android BF: 28.75% Gynoid BF: 21.08% LBM: 47.63 kg ASMMI: 8.37 | (i) Hazelnuts (40 g/d) ‡ Weight: 71.05 kg BMI: 25.76 kg/m2 WC: 85.00 cm AC: 93.50 cm HC: 99.00 cm Total body fat: 34.95 kg Total BF: 29.05% Android BF: 28.80% Gynoid BF: 21.34% LBM: 48.09 kg ASMMI: 8.05 | (i) AC was significantly lower after the hazelnut intervention | N/A, single intervention |
| Durak et al., 1999 [54] | Single intervention | 30 (18 M, 12 F) Healthy Medical students | 1 month | (i) Habitual diet Weight: 68.7 kg | (i) Hazelnuts (1 g/kg BW (68–69 g)) Weight: 69.2 kg | (i) No significant change | N/A, single intervention |
| Mercanligil et al., 2007 [55] | Sequential intervention periods 2 treatments | 15 (15 M, 0 F) Hyper-cholesterolaemic | 4 weeks | (i) Baseline Weight: 74.3 kg | (i) Control LF, high CHO diet Weight: 74.2 kg | (i) No significant change | No significant between-group differences in body weight. |
| (ii) Baseline Weight: 74.3 kg | (ii) Control + Hazelnuts (40 g/d) Weight: 74.0 kg | (ii) No significant change | |||||
| Michels et al., 2018 [56] | Single intervention | 32 (10 M, 22F F) healthy, non-frequent nut consumers, Vit E intake <10 mg a-tocopherol/d, no Vit E supplements in previous 12 months | 16 weeks | (i) Baseline BMI: 26.1 kg/m2 | (i) Hazelnuts, dry roasted (~57 g/day) BMI: 26.3 kg/m2 | (i) BMI: +0.2 kg/m2 (p = 0.009) | N/A, single intervention |
| Orem et al., 2013 [57] | Double control sandwich model intervention | 21 (18 M, 3 F) Hyper-cholesterolaemic | 4 weeks | (i) 4 week no-nut (Control I) diet Weight: 81.0 kg BMI: 27.4 kg/m2 | (ii) 4-week hazelnut-enriched diet (49–86 g/d (18–20% TER)) Weight: 79.1 kg BMI: 26.9 kg/m2 | (i) to (ii): Weight: −0.9 kg; −2.3% BMI: −0.5 kg/m2; −2.02% | Body weight and BMI were significantly different between (i) and (ii) and between (i) and (iii). There was no significant difference in body weight or BMI between (ii) and (iii). |
| (ii) 4-week hazelnut-enriched diet (49–86 g/d (18–20% TER)) Weight: 79.1 kg BMI: 26.9 kg/m2 | (iii) 4 week no-nut (Control II) diet Weight: 79.5 kg BMI: 26.9 kg/m2 | (ii) to (iii): Weight: +0.4 kg; +0.4% BMI: no numerical change; +0.07% | |||||
| Santi et al., 2017 [58] | Double control sandwich model intervention | 24 (14 M, 10 F) Healthy, BMI > 19 kg/m2, <30 kg/m2 | 6-weeks | (i) 2-week ‘standard’ diet | (ii) 6-week raw hazelnut (40 g/d) (iii) 6-week ‘standard’ diet ‘washout’ | No significant changes in body weight | NR |
| Tey et al., 2011 [43] | Randomised Crossover 3 treatments | 48 (20 M, 28 F) Mildly hyper-cholesterolaemic | 4 weeks | (i) Baseline Weight: 73.7 kg BMI: 25.7 kg/m2 | (i) Ground hazelnuts (30 g/d) Weight: 73.8 kg BMI: 25.8 kg/m2 | (i) No significant change | No significant between-group differences in body weight or BMI. |
| (ii) Baseline Weight: 73.7 kg BMI: 25.7 kg/m2 | (ii) Sliced hazelnuts (30 g/d) Weight: 74.0 kg BMI: 25.9 kg/m2 | (ii) No significant change | |||||
| (iii) Baseline Weight: 73.7 kg BMI: 25.7 kg/m2 | (iii) Whole hazelnuts (30 g/d) Weight: 74.0 kg BMI: 25.9 kg/m2 | (iii) No significant change | |||||
| Tey et al., 2011 [45] | Randomised Parallel 4 treatments | 118 (55 M, 63 F) Healthy, BMI < 30 kg/m2 | 12 weeks | (i) Baseline Weight: 67.3 kg BMI: 22.9 kg/m2 Body fat: 25.8% Waist circ: 79.0 cm | (i) Control (no hazelnuts) Weight: 67.76 kg BMI: 23.04 kg/m2 Body fat: 24.96% Waist circ: 80.36 cm | (i) No significant change | No significant between-group differences in body weight, BMI, body fat, and waist circumference. |
| (ii) Baseline Weight: 72.0 kg BMI: 24.6 kg/m2 Body fat: 28.1% Waist circ: 82.1 cm | (ii) Hazelnuts (42 g/d) Weight: 72.83 kg BMI: 24.88 kg/m2 Body fat: 27.35% Waist circ: 84.23 cm | (ii) No significant change | |||||
| (iii) Baseline Weight: 69.2 kg BMI: 23.6 kg/m2 Body fat: 26.7% Waist circ: 80.2 cm | (iii) Chocolate (50 g/d) Weight: 69.79 kg BMI: 23.81 kg/m2 Body fat: 25.47% Waist circ: 81.5 cm | (iii) No significant change | |||||
| (iv) Baseline Weight: 69.5 kg BMI: 23.9 kg/m2 Body fat: 26.9% Waist circ: 81.7 cm | (iv) Potato crisps (50 g/d) Weight: 70.0 kg BMI: 24.05 kg/m2 Body fat: 25.81% Waist circ: 81.17 cm | (iv) No significant change | |||||
| Tey et al., 2013 [47] | Randomised Parallel 3 treatments | 107 (46 M, 61 F) Overweight and obese individuals with a BMI ≥ 25 kg/m2 | 12 weeks | (i) Baseline Weight: 88.7 kg BMI: 30.4 kg/m2 Body fat: 33.9% Fat mass: 30.1 kg Fat-free mass: 58.7 kg | (i) Control (no hazelnuts) Weight: 88.7 kg BMI: 30.4 kg/m2 Body fat: 33.9% Fat mass: 30.1 kg Fat-free mass: 58.6 kg | (i) No significant change | There were no significant differences in body weight, BMI, body fat percent, fat mass, and fat-free mass between the treatments. |
| (ii) Baseline Weight: 86.2 kg BMI: 30.7 kg/m2 Body fat: 35.4% Fat mass: 30.7 kg Fat-free mass: 55.5 kg | (ii) Hazelnuts (30 g/d) Weight: 86.2 kg BMI: 30.7 kg/m2 Body fat: 35.4% Fat mass: 30.7 kg Fat-free mass: 55.6 kg | (ii) No significant change | |||||
| (iii) Baseline Weight: 92.0 kg BMI: 30.9 kg/m2 Body fat: 35.0% Fat mass: 32.5 kg Fat-free mass: 59.5 kg | (iii) Hazelnuts (60 g/d) Weight: 92.2 kg BMI: 30.9 kg/m2 Body fat: 34.9% Fat mass: 32.5 kg Fat-free mass: 59.7 kg | (iii) No significant change | |||||
| Tey et al., 2015 [59] | Single intervention | 20 Māori (8 M, 12 F) and 19 (5 M, 14 F) European aged above 18 years | 4 weeks | Māori (i) Baseline Weight ^: 76.3 kg BMI ^: 25.5 kg/m2 Body fat ^: 26.9% | Māori (i) Hazelnuts (30 g/d) Weight ^: 76.3 kg BMI ^: 25.5 kg/m2 Body fat ^: 27.3% | Māori (i) No significant change | N/A, single intervention, but there were no significant differences in body weight, BMI, and body fat percent between Māori and Europeans. |
| European (ii) Baseline Weight ^: 71.5 kg BMI ^: 24.4 kg/m2 Body fat ^: 25.9% | European (ii) Hazelnuts (30 g/d) Weight ^: 71.8 kg BMI ^: 24.4 kg/m2 Body fat ^: 26.6% | European (i) No significant change | |||||
| Tey et al., 2017 [49] | Randomised Crossover 2 treatments | 72 (24 M, 48 F) Aged 18 years and above | 4 weeks | (i) Baseline Weight: 76.7 kg BMI: 26.7 kg/m2 Body fat: 32.0% Fat mass: 25.1 kg Fat-free mass: 51.6 kg | (i) Raw hazelnuts (30 g/d) Weight: 76.57 kg BMI: 26.65 kg/m2 Body fat: 31.83% Fat mass: 24.83 kg Fat-free mass: 51.71 kg | (i) No significant change | There were no significant differences in body weight, BMI, body fat, fat mass, and fat-free mass between the treatments. |
| (ii) Baseline Weight: 76.7 kg BMI: 26.7 kg/m2 Body fat: 32.0% Fat mass: 25.1 kg Fat-free mass: 51.6 kg | (ii) Dry roasted, lightly salted hazelnuts (30 g/d) Weight: 76.67 kg BMI: 26.68 kg/m2 Body fat: 31.86% Fat mass: 24.96 kg Fat-free mass: 51.69 kg | (ii) No significant change | |||||
| Yilmaz et al., 2019 [50] | Randomised Parallel 4 treatments | 37 (0 M, 37 F) Hyperlipidaemia, Obese | 6 weeks | (i) Baseline Weight: 78.5 kg BMI: 35.7 kg/m2 Waist circ: 104.1 cm Waist/Hip ratio: 0.88 Fat mass: 34.0 kg Fat mass: 43.1% | (i) Hazelnuts (50 g/d) and cardioprotective diet Weight: 76.0 kg BMI: 34.5 kg/m2 Waist circ: 98.3 cm Waist/Hip ratio: 0.85 Fat mass: 31.8 kg Fat mass: 41.7% | (i) Hazelnuts (50 g/d) Weight: −2.5 kg (p = 0.030) BMI: −1.2 kg/m2 (p = 0.031) Waist circ: −5.7 cm (p = 0.113) Waist/Hip ratio: −0.03 (p = 0.650) Fat mass: −2.21 kg (p = 0.005) Fat mass: −1.41% (p = 0.001) | There were no significant differences in body weight, BMI, waist circumference, waist/hip ratio, and fat mass between the treatments. |
| (ii) Baseline Weight: 83.7 kg BMI: 35.8 kg/m2 Waist circ: 106.1 cm Waist/Hip ratio: 0.89 Fat mass: 35.4 kg Fat mass: 41.9% | (ii) Raisins (50 g/d) and cardioprotective diet Weight: 82.2 kg BMI: 35.1 kg/m2 Waist circ: 101.2 cm Waist/Hip ratio: 0.86 Fat mass: 34.1 kg Fat mass: 41.1% | (ii) Raisins (50 g/d) Weight: −1.5 kg (p = 0.074) BMI: −0.7 kg/m2 (p = 0.046) Waist circ: −4.9 cm (p = 0.0001) Waist/Hip ratio: −0.03 (p = 0.009) Fat mass: −1.32 kg (p = 0.021) Fat mass: −0.90% (p = 0.241) | |||||
| (iii) Baseline Weight: 80.0 kg BMI: 34.6 kg/m2 Waist circ: 98.3 cm Waist/Hip ratio: 0.85 Fat mass: 33.3 kg Fat mass: 41.4% | (iii) Hazelnuts (50 g/d) and Raisins (50 g/d) and cardioprotective diet Weight: 77.9 kg BMI: 33.6 kg/m2 Waist circ: 95.1 cm Waist/Hip ratio: 0.85 Fat mass: 31.1 kg Fat mass: 39.6% | (iii) Hazelnuts (50 g/d) and Raisins (50 g/d) Weight: −2.1 kg (p = 0.002) BMI: −0.9 kg/m2 (p = 0.004) Waist circ: −3.2 cm (p = 0.122) Waist/Hip ratio: −0.01 (p = 1.000) Fat mass: −2.26 kg (p = 0.001) Fat mass: −1.72% (p = 0.002) | |||||
| (iv) Baseline Weight: 81.9 kg BMI: 36.0 kg/m2 Waist circ: 108.1 cm Waist/Hip ratio: 0.91 Fat mass: 35.7 kg Fat mass: 43.4% | (iv) Control (Cardioprotective diet) Weight: 79.6 kg BMI: 34.9 kg/m2 Waist circ: 99.9 cm Waist/Hip ratio: 0.87 Fat mass: 33.5 kg Fat mass: 41.9% | (iv) Control (Cardioprotective diet) Weight: −2.4 kg (p = 0.017) BMI: −1.1 kg/m2 (p = 0.020) Waist circ: −8.2 cm (p = 0.002) Waist/Hip ratio: −0.05 (p = 0.009) Fat mass: −2.17 kg (p = 0.002) Fat mass: −1.42% (p = 0.003) | |||||
| Yucesan et al., 2010 [60] | Single intervention | 21 (8 M, 13 F) Normolipidaemic | 4 weeks | (i) Baseline: 64.5 kg | (i) Hazelnuts (1 g/kg BW (49–86 g/d)): 64.7 kg | (i) No significant change | N/A, single intervention |
| Author, Year | Study Design | Participant Characteristics | Duration | Treatment | SBP mmHg | DBP mmHg | Between Treatments |
|---|---|---|---|---|---|---|---|
| Deon et al., 2018 [39] | Randomised parallel 3 treatments | 66 children and adolescents (35 M 31 F) with hyperlipidaemia | 8 weeks | (i) Baseline | 103.0 | 65.6 | No significant differences in systolic blood pressure or diastolic blood pressure between the treatments. |
| Hazelnuts with skin (0.43 g/kg (15–30 g/d)) | 105.2 | 66.4 | |||||
| Change 1 | +2.2 | +0.8 | |||||
| (ii) Baseline | 102.8 | 65.1 | |||||
| Hazelnuts without skin (0.43 g/kg (15–30 g/d)) | 102.5 | 66.3 | |||||
| Change 1 | −0.3 | +1.2 | |||||
| (iii) Baseline | 106.8 | 68.0 | |||||
| Control | 109.0 | 67.1 | |||||
| Change 1 | +2.2 | −0.9 | |||||
| Di Renzo et al., 2019 [53] | Single intervention Pilot | 24 (14 M, 10 F) healthy | 6 weeks | Baseline ‡ | 116.5 | 73.0 | N/A, single intervention. |
| (i) Hazelnuts (40 g/d) ‡ | 112.0 | 75.0 | |||||
| Change 1 | −4.5 | +2.0 | |||||
| Michels et al., 2018 [56] | Single intervention | 32 (10 M, 22 F) healthy, non-frequent nut consumers, Vit E intake <10 mg a-tocopherol/d, no Vit E supplements in previous 12 months | 16 weeks | Baseline | 120 | 76.6 | N/A, single intervention. |
| (i) Hazelnuts, dry roasted (~57 g/d) | 120 | 76.3 | |||||
| Change 1 | 0 | −0.3 | |||||
| Tey et al., 2013 [47] | Randomised Parallel 2 treatments | 107 (46 M, 61 F) Overweight and obese individuals with a BMI ≥ 25 kg/m2 | 12 weeks | Baseline | 128 | 75.3 | No significant difference in systolic and diastolic blood pressure between the treatments. |
| (i) Control (no hazelnuts) | 123 | 72.9 | |||||
| Change 1 | −5 a | −2.4 a | |||||
| Baseline | 126 | 73.2 | |||||
| (ii) Hazelnuts (30 g/d) | 124 | 72.6 | |||||
| Change 1 | −2 | −0.6 | |||||
| Baseline | 124 | 76.3 | |||||
| (iii) Hazelnuts (60 g/d) | 121 | 73.3 | |||||
| Change 1 | −3 a | −3.0 a | |||||
| Tey et al., 2015 [59] | Single intervention | 20 Māori (8 M, 12 F) and 19 (5 M, 14 F) European aged above 18 years | 4 weeks | Māori Baseline ^ (i) Raw hazelnuts (30 g/d) ^ Change 1 | 123.6 117.1 N/R | 67.7 68.5 N/R | N/A, single intervention, but there were no significant differences in systolic and diastolic blood pressure between Māori and Europeans. |
| European Baseline ^ (i) Raw hazelnuts (30 g/d) ^ Change 1 | 120.1 118.4 N/R | 65.5 65.1 N/R | |||||
| Tey et al., 2017 [49] | Randomised Crossover 2 treatments | 72 (24 M, 48 F) Aged 18 years and above | 4 weeks | Baseline | 124 | 73.5 | No significant differences in systolic blood pressure between the treatments. There was a tendency that diastolic blood pressure was lower after consuming dry roasted and lightly salted hazelnuts. |
| (i) Raw hazelnuts (30 g/d) | 122 | 72.7 | |||||
| Change 1 | −2.0 a | −0.8 | |||||
| Baseline | 124 | 73.5 | |||||
| (ii) Dry roasted, lightly salted hazelnuts (30 g/d) | 121.1 | 71.5 | |||||
| Change 1 | −2.9 b | −2.0 b | |||||
| Yilmaz et al., 2019 [50] | Randomised Parallel 4 treatments | 37 (0 M, 37 F) Hyperlipidaemia, Obese | 6 weeks | Baseline | 121.7 | 77.2 | No significant difference in systolic and diastolic blood pressure between the treatments. |
| (i) Hazelnuts (50 g/d) and cardioprotective diet | 121.1 | 75.6 | |||||
| Change 1 | −0.6 | −1.7 | |||||
| Baseline | 123.3 | 76.7 | |||||
| (ii) Raisins (50 g/d) and cardioprotective diet | 119.4 | 76.7 | |||||
| Change 1 | −3.9 | 0.0 | |||||
| Baseline | 123.6 | 79.7 | |||||
| (iii) Hazelnuts (50 g/d) and Raisins (50 g/d) and cardioprotective diet | 115.6 | 75.6 | |||||
| Change 1 | −8.0 a | −4.1 | |||||
| Baseline | 126.0 | 80.5 | |||||
| (iv) Control (Cardioprotective diet) | 122.0 | 77.5 | |||||
| Change 1 | −4.0 | −3.0 |
| Author, Year | Study Design | Participant Characteristics | Duration | Treatment | Outcome Measurements: Results |
|---|---|---|---|---|---|
| Acute study | |||||
| Devi et al., 2016 [40] | Randomised crossover 4 treatments | 32 (11 M 21 F) healthy | Acute 2 h | (i) Bread containing 30 g finely sliced hazelnuts per 120 g | 2 h iAUC for blood glucose (i) 152 mmol/L·min |
| (ii) Bread containing 30 g defatted hazelnut flour per 120 g | (ii) 137 mmol/L·min | ||||
| (iii) Bread containing 15 g finely sliced hazelnuts and 15 g defatted hazelnut flour per 120 g | (iii) 154 mmol/L·min | ||||
| (iv) Control white bread with no nuts | (iv) 179 mmol/L·min All hazelnut breads had a lower iAUC compared to the control bread (all p < 0.001). There were no significant differences between breads. | ||||
| Chronic studies | |||||
| Adamo et al., 2017 [36] | Randomised parallel 6 treatments | 61 (31 M, 30 F) Healthy BMI | 2 weeks | Breakfasts including: (i) 30 g peeled hazelnut paste | Insulin and HOMA-IR Insulin and HOMA-IR remained stable in those consuming the hazelnut-only enriched breakfasts. Actual data was not presented. |
| (ii) 30 g unpeeled hazelnut paste | |||||
| (iii) snack with 30 g peeled hazelnut paste | |||||
| (iv) snack with 2.5 g cocoa powder | |||||
| (v) Snack with 30 g/d peeled hazelnut paste and 2.5 g cocoa powder | |||||
| (vi) no snack control group N.B. Data was only presented for treatments vs. control i.e., no other between-group comparisons were reported | |||||
| Alphan et al., 1997 [51] | Sequential intervention periods 2 treatments | 19 (5 M, 14 F) Type 2 diabetics | 30 days | (i) High CHO diet (60% CHO, 25% fat): HbA1c Baseline: 8.1% End: 7.8% Change: −0.3% FBG Baseline6.92 mmol/L End: 6.94 mmol/L Change: +0.02 mmol/L PPBG Baseline9.16 mmol/L End: 8.49 mmol/L Change: −0.67 mmol/L Fasting insulin Baseline: 86.4 pmol/L End: 72.6 pmol/L Change: −13.4 pmol/L PP insulin Baseline 249.0 pmol/L End: 196.8 pmol/L Change: −52.2 pmol/L | Between-group analysis NR. |
| (ii) Hazelnut diet (40% CHO, 45% fat, amount of hazelnuts NR): HbA1c Baseline: 8.3% End: 7.2% Change: −1.1% a FBG: Baseline: 7.28 mmol/L End: 7.28 mmol/L Change: 0.00 mmol/L PPBG Baseline: 8.37 mmol/L End:8.28 mmol/L Change: −0.09 mmol/L Fasting insulin Baseline: 78.0 pmol/L End:97.2 pmol/L Change: +19.2 pmol/L PP insulin Baseline: 223.2 pmol/L End: 225.0 pmol/L Change: +1.8 pmol/L | |||||
| Damavandi et al., 2012 [37] | Randomised parallel 2 treatments | 50 (16 M, 34 F) participants with type 2 diabetes | 8 weeks | (i) Control: No hazelnuts FBG Baseline: 8.69 mmol/L End: 8.97 mmol/L Change: +0.28 mmol/L | Fasting blood glucose There were no significant differences in fasting blood glucose concentrations |
| (ii) 10% of total energy hazelnuts FBG Baseline: 8.10 mmol/L End: 8.04 mmol/L Change: −0.06 mmol/L | |||||
| Michels et al., 2018 [56] | Single intervention | 32 (10 M, 22F F) healthy, non-frequent nut consumers, Vit E intake <10 mg a-tocopherol/d, no Vit E supplements in previous 12 months | 16 weeks | (i) Baseline FBG: 5.67 mmol/L Fasting insulin: 48.6 pmol/L | Significant reduction in plasma FBG (−3.4%, p = 0.03) after 16 weeks consuming 57 g/day hazelnuts. There was no significant change in fasting insulin. |
| (ii) Hazelnuts, dry roasted (~57 g/day) FBG: 5.5 mmol/L Fasting insulin: 49.8 pmol/L | |||||
| Orem et al., 2013 [57] | Double control sandwich model intervention | 21 (18 M, 3 F) Hyper-cholesterolaemic | 4 weeks | (i) 4 week no-nut (Control I) diet FBG: 5.22 mmol/L Fasting insulin: 42.6 pmol/L HOMA-IR: 1.69 | There was no significant difference in FBG, fasting insulin, or HOMA-IR between treatments. |
| (ii) 4-week hazelnut-enriched diet (49–86 g/d (18–20% TER)) FBG: 5.11 mmol/L, Δ: −1.52% Fasting insulin: 45.6 pmol/L, Δ: +14.7% HOMA-IR: 1.78, Δ: +13.1% | |||||
| (iii) 4-week no-nut (Control II) diet FBG: 4.89 mmol/L, Δ: −3.51% Fasting insulin: 37.8 pmol/L, Δ: −11.9% HOMA-IR: 1.39, Δ: −12.7% | |||||
| Santi et al., 2017 [58] | Double control sandwich model intervention | 24 (14 M, 10 F) Healthy BMI > 19 kg/m2, <30 kg/m2 | 6 weeks | (i) 2-week ‘standard’ diet FBG: 4.79 mmol/L | There was no significant difference in FBG between treatments. |
| (ii) 6-week 40 g raw hazelnut FBG: 4.76 mmol/L | |||||
| (iii) 6-week ‘standard’ diet ‘washout’ FBG: 4.77 mmol/L | |||||
| Tey et al., 2017 [49] | Randomised Crossover 2 treatments | 72 (24 M, 48 F) Aged 18 years and above | 4 weeks | Fasting blood glucose Baseline: 4.82 mmol/L (i) Raw hazelnuts (30 g/d): 4.80 mmol/L Change: −0.02 mmol/L | There was no significant difference in fasting blood glucose between the treatments. |
| Baseline: 4.82 mmol/L (ii) Dry roasted, lightly salted hazelnuts (30 g/d): 4.81 mmol/L Change: −0.01 mmol/L | |||||
| Yilmaz et al., 2019 [50] | Randomised Parallel 4 treatments | 37 (0 M, 37 F) Hyperlipidaemia, Obese | 6 weeks | Fasting blood glucose Baseline: 5.23 mmol/L (i) Hazelnuts (50 g/d): 5.18 mmol/L Change: −0.05 mmol/L | There was no significant difference in fasting blood glucose between the treatments. |
| Baseline: 5.16 mmol/L (ii) Raisins (50 g/d): 5.64 mmol/L Change: +0.48 mmol/L | |||||
| Baseline: 5.33 mmol/L (iii) Hazelnuts (50 g/d) and Raisins (50 g/d): 5.17 mmol/L Change: −0.16 mmol/L | |||||
| Baseline: 5.26 mmol/L (iv) Control (Cardioprotective diet): 5.47 mmol/L Change: +0.21 mmol/L | |||||
| Author, Year | Study Design | Participant Characteristics | Duration | Treatments | Outcome Measurements: Results 1 |
|---|---|---|---|---|---|
| Acute study | |||||
| Di Renzo et al., 2017 [41] | Randomised crossover 2 treatments | 22 healthy BMI ≥ 19 kg/m2 BMI < 30 kg/m2 | 3 h | (i) A high-fat McDonald’s meal | Oxidised LDL using ELISA kits (i) Levels increased significantly by 18% from fasting to after the McDonald’s meal a (ii) No significant difference in levels for the McDonald’s meal with 40 g of hazelnuts Levels were significantly lower after the McDonald’s meal with 40 g of hazelnuts compared to the McDonald’s meal (−24.43%, p < 0.05) N.B. Actual baseline and end of study values NR |
| (ii) A high-fat McDonald’s meal with 40 g of hazelnuts | |||||
| Chronic studies | |||||
| Adamo et al., 2017 [36] | Randomised parallel 6 treatments | 61 (31 M, 30 F) Healthy BMI | 2-weeks | Breakfasts including: (i) 30 g/d peeled hazelnut paste (ii) 30 g/d unpeeled hazelnut paste (iii) snack with 30 g/d peeled hazelnut paste (iv) snack with 2.5 g/d cocoa powder (v) Snack with 30 g/d peeled hazelnut paste and 2.5 g/d cocoa powder (vi) no snack control group | Peak systolic velocities (PSV), using Doppler ultrasound, at rest vs. control (i) Change: +80.5% a (ii) Change: +16.9% (iii) Change: +33.7% (iv) Change: +31.5% (v) Change: +26.4% Compared to the control group PSV at rest increased significantly in the peeled hazelnut paste group (57.8%, p = 0.04); the unpeeled hazelnut group (56.9%, p = 0.04); the snack with peeled hazelnut paste group (95.1%, p = 0.002); the peeled hazelnuts and cocoa powder group (68.5%, p = 0.01). No significant differences between the snack group with 2.5 g/d cocoa powder and control Peak systolic velocities (PSV) after 3 min of occlusion: (i) Change: +102.7% (ii) Change: +15.6% (iii) Change: +60.7% (iv) Change: −7.1% (v) Change: +64.7% Compared to the control, there were significant increases in the snack with 30 g/d of peeled hazelnut (67.3%, p = 0.002); and in the snack with 30 g/d peeled hazelnut paste and 2.5 g cocoa powder group (22.9%, p = 0.04). Erythrocyte sedimentation rate and hs-CRP No between-group differences for ESR or hs-CRP Heart rate No significant differences in heart rate N.B. Data was only presented for treatments vs. control, i.e., no other between-group comparisons were reported. Actual follow-up values NR. Actual end of study values for Erythrocyte sedimentation rate, hs-CRP, and heart rate NR |
| Damavandi et al., 2012 [37] | Randomised parallel 2 treatments | 50 ((16 M, 34 F) with type 2 diabetes | 8 weeks | (i) Control: no hazelnuts (ii) 10% of total energy hazelnuts | Total antioxidant capacity using colorimetric methods (i) Baseline: 11.19 U/mL End: 9.47 U/mL Change: −1.72 U/mL c (ii) Baseline: 11.39 U/mL End: 974 U/mL Change: −1.65 U/mL b No significant differences between-groups hs-CRP (i) Baseline: 1.14 mg/L End: 1.68 mg/L Change: +0.54 mg/L (ii) Baseline: 1.39 mg/L End: 1.17 mg/L Change: −0.22 mg/L No significant differences between-groups Paraoxonase−1 activity (i) Baseline: 68.01 U/mL End: 70.47 U/mL Change: +2.47 U/mL (ii) Baseline: 66.38 U/mL End: 64.55 U/mL Change: −1.73 U/mL No significant differences between-groups |
| Di Renzo et al., 2014 [52] | Sequential intervention periods 2 treatments | 24 BMI ≥ 19 kg/m2 | 4 weeks | (i) 4-week standard diet (Italian Mediterranean diet) (ii) 4-week standard diet with hazelnuts 40 g/d | Oxidised LDL using ELISA kits (i) study end: 40.38 U/L (ii) study end: 36.99 U/L b Oxidised LDL was significantly lower after hazelnut diet compared to after standard diet (p < 0.05). Gene expression was assessed using Quantitative Real-Time PCR (RT2 Profiler PCR assays The following genes were upregulated after hazelnut consumption a: BNIP3, GPX2, GSR, HSPAIA, TTN, TXNRDI The following genes were downregulated after hazelnut consumption a: CCL5, KRTI, MBL2, PRDX6, SODI |
| Di Renzo et al., 2019 [53] | Single intervention Pilot | 24 (14 M, 10 F) healthy | 6 weeks | (i) Hazelnuts 40 g/d | Gene expression was assessed using Quantitative Real Time PCR (RT2 Profiler PCR assays There was significant upregulation in the following genes after consuming hazelnuts a: superoxide dismutase (SODI) and catalase (CAT), macrophage migration inhibitory factor (MFI), peroxisome proliferator-activated receptor gamma (PPARγ), vitamin D receptor (VDR), methylenetetrahydrofolate reductase (MTHFR), angiotensin I-converting enzyme (ACE)—all involved in antioxidant and/or anti-inflammatory pathways No significant change in the expression of the following genes after consuming hazelnuts: apolipoprotein E (APOE), interleukin 6 receptor (IL6R), nuclear factor of kappa light polypeptide gene enhancer in B-cell 1 (NFKB1), insulin-like growth factor 2 receptor (IFG2R), upstream transcription factor 1 (USF1) |
| Durak et al., 1999 [54] | Single intervention | 30 (18 M, 12 F) Healthy Medical students | 1 month | (i) Hazelnuts (1 g/kg BW (68–69 g)) | Antioxidant potential by measuring TBARS (1/nmol/mL·h): (i) Baseline: 0.09, Hazelnut: 0.11, Δ: +0.02 c Plasma malondialdehyde quantified as tissue thiobarbituric acid-reactive material (nmol/mL): (i) Baseline: 1.33, Hazelnuts: 0.99, Δ: −0.34 c |
| Guaraldi et al., 2018 [42] | Parallel intervention | 60 children and adolescents (mean age 11.6 ± 2.6 years) with hyperlipidaemia | 8 weeks | (i) Control (No nuts) (ii) Hazelnuts with skin (15–30 g/d) (iii) Hazelnuts without skin (15–30 g/d) | DNA strand breaks using COMET assay Using endonuclease buffer (%DNA in tail) (i) Baseline: 17.44% End: 13.65% Change: −3.65% a (ii) Baseline: 18.66% End: 13.41% Change: −5.25% a (iii) Baseline: 19.70% End: 16.00% Change: −3.70% a No differences between treatments. DNA strand breaks using phosphate buffer saline (%DNA in tail) (i) Baseline: 6.85% End: 6.25% Change: −0.60% (ii) Baseline: 6.53% End: 6.83% Change: +0.30% (iii) Baseline: 6.15% End: 6.64% Change: +0.49% No differences between treatments. FPG-sensitive sites in PBMCs measured using the enzyme formamidopyrimidine DNA glycosylase (% DNA in tail) (i) Baseline: 15.9% End: 18.9% Change: +3.0% a (ii) Baseline: 14.7% End: 10.5% Change: −4.2% b (iii) Baseline: 13.9% End: 10.1% Change: −3.8% b Significant between-group differences (p = 0.001) between the 2 hazelnut groups and the control group. H2O2-induced DNA damage using COMET assay (% DNA in tail) (i) Baseline: 35.3% End: 29.6% Change: −5.7% (ii) Baseline: 36.6% End: 28.7% Change: −7.9% b (iii) Baseline: 37.4% End: 32.0% Change: −5.4% No significant differences between treatments Oxidised LDL by ELISA (i) Baseline: 54.1 U/L End: 55.1 U/L Change: 1.0 U/L (ii) Baseline: 54.5 U/L End: 53.3 U/L Change: −1.2 U/L (iii) Baseline: Not measured End: Not measured Change: Not measured No significant differences between treatments |
| Mercanligil et al., 2007 [55] | Sequential intervention periods 2 treatments | 15 (15 M, 0 F) Hyper-cholesterolaemic | 4 weeks | (i) Control LF, low cholesterol, high CHO diet | Vascular endothelium function by Doppler ultrasound (i) Baseline: NR, Control: NR, Change: NR (ii) Baseline: NR, Hazelnuts: NR, Change: NR |
| (ii) Control + Hazelnuts (40 g/d) | There were no significant differences in endothelial function between the groups. | ||||
| Michels et al., 2018 [56] | Single intervention | 32 (10 M, 22F F) healthy, non-frequent nut consumers, Vit E intake <10 mg a-tocopherol/d, no Vit E supplements in previous 12 months | 16 weeks | Baseline (i) Hazelnuts, dry roasted (~57 g/d) | No significant change in serum hs-CRP No significant change in plasma α-tocopherol or ɣ-tocopherol, mmol/mol lipid (Mol lipid = total cholesterol + TGs), measured using HPLC Urinary α-carboxyethyl hydroxychomanol and g-carboxyethyl hydroxychomanol (used to assess Vit E), measured using mass spectroscopy: α-CECH Baseline: 0.844 mmol/g creatinine, Hazelnut diet: 1.14 mmol/g creatinine Δ = +0.296 c No significant change in ɣ-CECHe from baseline Lymphocyte proliferation assay micronutrient profile, percentage of control cells (data are presented as the proliferation rates of cells in test media compared to control (complete) media): No significant change in α-tocopherol or ɣ-tocopherol (µM) from baseline. Total antioxidant function: Baseline: 56, Hazelnut diet: 60, Change = +4 a |
| Orem et al., 2013 [57] | Double control sandwich model intervention | 21 (18 M, 3 F) Hyper-cholesterolaemic | 4-weeks | (i) 4 week no-nut (Control I) diet (ii) 4 week hazelnut-enriched diet (49–86 g/d (18–20% TER)) (iii) 4 week no-nut (Control II) diet | Flow mediated dilation (%) measured using vascular ultrasound of the brachial artery: (i) Control I diet: 15.2% (ii) Hazelnut: 21.8%, Change: +56.6% (iii) Control II diet: 15.9%, Change: −24.6% There was a significant difference in flow-mediated dilation between (i) and (ii), and between (ii) and (iii). There was no significant difference between (i) and (iii). Hs- CRP (mg/L) ‡ measured by immunophelometric method: (i) Control I diet: 1.30 mg/L (ii) Hazelnut: 0.7 mg/L, Change: −35.9 (iii) Control II diet: 0.90 mg/L, Change: +71.1% There was a significant difference in Hs-CRP between (i) and (ii), and between (ii) and (iii). There was no significant difference between (i) and (iii). Oxidised-LDL (U/L) measured using commercial ELISA kits: (i) Control I diet: 106 U/L (ii) Hazelnut: 93 U/L, Change: −9.25% (iii) Control II diet: 102 U/L, Change: +9.77.6% There was a significant difference in oxidized-LDL between (i) and (ii), and between (ii) and (iii). There was no significant difference between (i) and (iii). sICAM-1 (ng/mL) measured using commercial ELISA kits: (i) Control I diet: 236 ng/mL (ii) Hazelnut: 216 ng/mL, Change: −8.08% (iii) Control II diet: 234 ng/mL, Change: 6.8% There was a significant difference in sICAM-1 between (i) and (ii), and between (ii) and (iii). There was no significant difference between (i) and (iii). sVCAM-1 (ng/mL) measured using commercial ELISA kits: (i) Control I diet: 981 ng/mL (ii) Hazelnut: 864 ng/mL, Change: −10.6% (iii) Control II diet: 1025 ng/mL, Change: +18.4% There was a significant difference in sVCAM-1 between (i) and (ii), and between (ii) and (iii). There was no significant difference between (i) and (iii). Adiponectin measured using commercial ELISA kits: (i) Control I diet: 4598 ng/mL (ii) Hazelnut: 5615 ng/mL, Change: +29.1% (iii) Control II diet: 5057 ng/mL, Change: −5.15% There was a significant difference in adiponectin between (i) and (ii). There was no significant difference between any other treatments. Plasma α-tocopherol (mg/L) determined by HPLC: (i) Control I diet: 11.7 mg/L (ii) Hazelnut: 13.7 mg/L, Change: 16.9% (iii) Control II diet: 13.1 mg/L, Change: −2.24% There was a significant difference in plasma α-tocopherol between (i) and (ii), and between (i) and (iii). There was no significant difference between (ii) and (iii). α-tocopherol in LDL, determined by HPLC (µg/mg LDL protein): (i) Control I diet: 4.71 µg/mg (ii) Hazelnut: 5.76 µg/mg, Change: 24.5% (iii) Control II diet: 4.41 µg/mg, Change: −22.3% There was a significant difference in α-tocopherol in LDL between (i) and (ii) and between (ii) and (iii). There was no significant difference between (i) and (iii). Vitamin B12 (pg/mL) measured by enzymatic methods: (i) Control I diet: 375 pg/mL (ii) Hazelnut: 386 pg/mL, Change: +2.94% (iii) Control II diet: 334 pg/mL, Change: −13.8% There was a significant difference in vitamin B12 between (i) and (iii), and between (ii) and (iii). There was no significant difference between (i) and (ii). Folic acid (ng/mL), measured by enzymatic methods: (i) Control I diet: 8.58 ng/mL (ii) Hazelnut: 9.08 ng/mL, Change: +6.24% (iii) Control II diet: 8.04 ng/mL, Change: −11.3% There was a significant difference in folic acid between (ii) and (iii). There was no significant difference between the other treatments. There was no significant difference in endothelin-1 (fmol/mL) or homocysteine (µmol/L) across any of the treatments, overall p-value p = 0.651 and p = 0.484 respectively. N.B. p-values for between-group differences NR. |
| Santi et al., 2017 [58] | Double control sandwich model intervention | 24 (14 M, 10 F) Healthy BMI > 19 kg/m2, <30 kg/m2 | 6-weeks | (i) 2-week ‘standard’ diet (ii) 6-week raw hazelnut (40 g/d) (iii) 6-week ‘standard’ diet ‘washout’ | Uric acid (mg/dL) measured by uricase and peroxidase reactions: (i): 4.66 (ii): 4.31, Change: −0.35 (iii): 4.66, Change: +0.35 There was a significant (i) vs. (ii) p = 0.025 (i) vs. (iii) p = 0.99 (ii) vs. (iii) p = 0.013 Serum creatinine (mg/dL) measured by creatinine amidohydrolase, sarcosine oxidase and peroxidase reactions: (i): 0.94 (ii): 0.93, Change: −0.01 (iii): 0.82, Change: −0.11 (i) vs. (ii) p = 0.29 (i) vs. (iii) p ≤ 0.001 (ii) vs. (iii) p = 0.001 Alanine aminotransferase (ALT) (U/L) measured by latticodehydrogenase reactions: (i): 30.09 (ii): 35.22, Change: +5.13 (iii): 31.52, Change: −3.70 (i) vs. (ii) p = 0.011 (i) vs. (iii) p = 0.065 (ii) vs. (iii) p = 0.99 Gamma-glutamyl transferase (GGT) (U/L) measured by oxaloacetate decarboxylase, pyruvate oxidase and peroxidase reactions: (i): 38.04 (ii): 35.27, Change: −2.77 (iii): 36.26, Change: +0.99 (i) vs. (ii) p = 0.001 (i) vs. (iii) p = 0.31 (ii) vs. (iii) p = 0.16 There was no significant difference in AST, serum iron, azotaemia, total bilirubin, Hb, WBCs, RBC, platelet count, or total plasma protein content between any of the treatment groups. |
| Tey et al., 2011 [43] | Randomised Crossover 3 treatments | 48 (20 M, 28 F) Mildly hyper-cholesterolaemic | 4 weeks | (i) Ground hazelnuts (30 g/d) (ii) Sliced hazelnuts (30 g/d) (iii) Whole hazelnuts (30 g/d) | α-tocopherol measured using HPLC (mmol/L): (i) Baseline: 33.1, Ground: 34.7, Change: +1.6 b (ii) Baseline: 33.1, Sliced: 34.2, Change: +1.1 b (iii) Baseline: 33.1, Whole: 34.2, Change: +1.1 b There was no significant difference in α-tocopherol between different forms of nuts. |
| Tey et al., 2013 [47] | Randomised Parallel 3 treatments | 107 (46 M, 61 F) Overweight and obese individuals with a BMI ≥ 25 kg/m2 | 12 weeks | (i) Control group (no hazelnuts) (ii) Hazelnuts (30 g/d) (iii) Hazelnuts (60 g/d) | α-tocopherol measured using HPLC (µmol/L): (i) Baseline: 24.3, Control: 24.2, Change: −0.01 (ii) Baseline: 25.4, 30 g/d: 24.6, Change: −0.08 (iii) Baseline: 24.5, 60 g/d: 25.1, Change: +0.6 There was no significant difference in α-tocopherol between the treatments. Hs-CRP^ measured using a CRP Unimate kit (mg/L): (i) Baseline: 1.93, Control: 1.75, Change: N/R (ii) Baseline: 1.47, 30 g/d: 1.45, Change: N/R (iii) Baseline: 1.51, 60 g/d: 1.37, Change: N/R There was no significant difference in Hs-CRP between the treatments. IL-6^ measured using ELISA kits (pg/mL): (i) Baseline: 1.37, Control: 1.52, Change: N/R (ii) Baseline: 1.28, 30 g/d: 1.30, Change: N/R (iii) Baseline: 1.74, 60 g/d: 1.49, Change: N/R There was no significant difference in IL-6 between the treatments. ICAM-1 measured using ELISA kits (µg/L): (i) Baseline: 208, Control: 204, Change: −4 (ii) Baseline: 221, 30 g/d: 206, Change: −15 a (iii) Baseline: 207, 60 g/d: 195, Change: +12 a There was no significant difference in ICAM-1 between the treatments. VCAM-1 measured using ELISA kits (µg/L): (i) Baseline: 571, Control: 567, Change: −4 (ii) Baseline: 652, 30 g/d: 644, Change: −8 (iii) Baseline: 628, 60 g/d: 586, Change: −42 There was a tendency toward improvement in VCAM-1 in the 60 g/d hazelnut group (p = 0.07). |
| Tey et al., 2015 [59] | Single intervention | 20 Māori (8 M, 12 F) and 19 (5 M, 14 F) European aged above 18 years | 4 weeks | (i) Raw hazelnuts (30 g/d) | Hs-CRP ^ measured using a CRP Unimate kit (mg/L): Māori: (i) Baseline: 0.42, Hazelnuts: 0.70, Change: N/R Europeans: (i) Baseline: 0.69, Hazelnuts: 0.83, Change: N/R |
| Tey et al., 2017 [49] | Randomised Crossover 2 treatments | 72 (24 M, 48 F) Aged 18 years and above | 4 weeks | (i) Raw hazelnuts (30 g/d) (ii) Dry roasted, lightly salted hazelnuts (30 g/d) | α-tocopherol measured using HPLC (µmol/L): (i) Baseline: 30.2, Raw: 31.42, Change: +1.22 b (ii) Baseline: 30.2, Lightly salted: 31.26, Change: +1.06 There was no significant difference in α-tocopherol between the treatments. |
| Yucesan et al., 2010 [60] | Single intervention | 21 (8 M, 13 F) Normolipidaemic | 4 weeks | (i) Hazelnuts (1 g/kg BW (49–86 g)) | α-tocopherol in LDL (µg/mg LDL protein), measured using HPLC: (i) Baseline: 4.82, Hazelnuts: 5.35, Change: +0.53 a Oxidised LDL (U/L): (i) Baseline: 57.2, Hazelnut: 48.2, Change: −9.0 b Hs-CRP (mg/dL), measured using immunophrelometric method: (i) Baseline: 0.13, Hazelnut: 0.11, Change: −0.02 sVCAM-1 (ng/mL), measured using ELISA kits: (i) Baseline: 478, Hazelnut: 446, Change: −32 Endothelin-1 (fmol/mL), measured using ELISA kits: (i) Baseline: 2.04, Hazelnut: 1.99, Change: −0.05 |
| Author, Year | Study Design | Subjects | Measurement; Timepoint | Treatments; Number of Exposures | Results 1 |
|---|---|---|---|---|---|
| Devi et al., 2016 [40] | Randomised Crossover 4 treatments | 32 (11 M 21 F) healthy | Desire to consume on a 150 mm VAS; Measured daily during the exposure period | (i) Bread containing 30 g finely sliced hazelnuts per 120 g; Exp. period = 5 d (ii) Bread containing 30 g defatted hazelnut flour per 120 g; Exp. period = 5 d (iii) Bread containing 15 g finely sliced defatted hazelnuts and 15 g hazelnut flour per 120 g; Exp. period = 5 d (iv) Control white bread with no nuts; Exp. period = 5 d | 5-day exposure period (i) Stable: a (ii) Stable: c (iii) Stable: a (iv) Stable: b |
| Overall liking on a 150 mm VAS; Measured daily during the exposure period | (i) Bread containing 30 g finely sliced hazelnuts per 120 g; Exp. period = 5 d (ii) Bread containing 30 g defatted hazelnut flour per 120 g; Exp. period = 5 d (iii) Bread containing 15 g of finely sliced defatted hazelnuts and 15 g hazelnut flour per 120 g; Exp. period = 5 d (iv) Control white bread with no nuts; Exp. period = 5 d | 5-day exposure period (i) Stable: a (ii) Stable: c (iii) Stable: b (iv) Stable: b Pre- vs. Post- (i) No significant change: 74.8 b vs. 79.3 b (ii) No significant change: 46.5 a vs. 41.4 a (iii) Significant increase: 53.4 a vs. 66.4 c (p < 0.05) (iv) No significant change: 44.5 a vs. 46.5 a | |||
| Tey et al., 2011 [44] | Randomised Crossover 3 treatments | 20 M, 28 F | Desire to consume on a 150 mm VAS; Measured daily during the exposure period | (i) Ground hazelnuts (30 g/d); Exp. period = 28 d (ii) Sliced hazelnuts (30 g/d); Exp. period = 28 d (iii) Whole hazelnuts (30 g/d); Exp. period = 28 d | 28-day exposure period (i) Stable: 92.1 a (ii) Stable: 107.7 b (iii) Stable: 116.2 b |
| Overall liking on a 150 mm VAS; Measured daily during the exposure period and at pre- and post-exposure | (i) Ground hazelnuts (30 g/d); Exp. period = 28 d (ii) Sliced hazelnuts (30 g/d); Exp. period = 28 d (iii) Whole hazelnuts (30 g/d); Exp. period = 28 d | 28-day exposure period (i) Stable: 100.8 a (ii) Stable: 109.9 b (iii) Stable: 117.7 b Pre- vs. Post- (i) No significant change: 92.8 a vs. 87.4 a (ii) No significant change: 109.1 b vs. 107.3 b (iii) No significant change: 113.7 b vs. 110.2 b | |||
| Tey et al., 2012 [46] | Randomised Parallel 4 treatments | 55 M, 63 F | Desire to consume on a 100 mm VAS; Measured daily during the exposure period | (i) Hazelnuts (42 g/d); Exp. period = 84 d (ii) Chocolate (50 g/d); Exp. period = 84 d (iii) Potato crisps (50 g/d); Exp. period = 84 d | 84-day exposure period (i) Stable: 60.9 a (ii) Stable: 64.9 a (iii) Stable: 62.7 a |
| Overall liking on a 100 mm VAS; Measured daily during the exposure period and at pre- and post-exposure | (i) Hazelnuts (42 g/d); Exp. period = 84 d (ii) Chocolate (50 g/d); Exp. period = 84 d (iii) Potato crisps (50 g/d); Exp. period = 84 d | 84-day exposure period (i) Stable: 57.9 a (ii) Decrease over time: −9.9 a (p = 0.002) (iii) Decrease over time: −8.6 a (p = 0.031) Pre- vs. Post- (i) No significant change: 61.1 a vs. 53.8 a (ii) Significant decrease: 76.2 a vs. 53.6 a (p < 0.001) (iii) No significant change: 67.0 a vs. 58.0 a | |||
| Tey et al., 2013 [47] | Randomised Parallel 3 treatments | 107 (46 M, 61 F) Overweight and obese individuals with a | Desire to consume on a 150 mm VAS; Measured daily during the exposure period | (i) Hazelnuts (30 g/d); Exp. period = 84 d (ii) Hazelnuts (60 g/d); Exp. period = 84 d | 84-day exposure period (i) Increase over time: +14.2 a (p = 0.003) (ii) Decrease over time: −29.4 b (p < 0.001) |
| BMI ≥ 25 kg/m2 | Overall liking on a 150 mm VAS; Measured daily during the exposure period and at pre- and post-exposure | (i) Hazelnuts (30 g/d); Exp. period = 84 d (ii) Hazelnuts (60 g/d); Exp. period = 84 d | (i) 84-day exposure period (i) Stable: +0.4 a (ii) Decrease over time: −24.4 b (p < 0.001) Pre- vs. Post- (i) vs. (ii): +14.6 (p < 0.05) | ||
| Tey et al., 2015 [59] | Single intervention | 20 Māori (8 M, 12 F) and 19 (5 M, 14 F) European | Desire to consume on a 150 mm VAS; Measured daily during the exposure period | (i) Māori: Hazelnuts (30 g/d), Exp. period = 28 d (ii) European: Hazelnuts (30 g/d), Exp. period = 28 d | 28-day exposure period (i) No significant change (ii) No significant change |
| aged above 18 years | Overall liking on a 150 mm VAS; Measured daily during the exposure period | (i) Māori: Hazelnuts (30 g/d), Exp. period = 28 d (ii) European: Hazelnuts (30 g/d), Exp. period = 28 d | 28-day exposure period (i) No significant change (ii) No significant change Pre- vs. Post- (i) vs. (ii): No difference | ||
| Tey et al., 2015 [48] | Randomised Crossover 6 treatments (only 3 hazelnut treatments reported) | 74 (34 M, 40 F) healthy participants | Desire to consume on a 150 mm VAS; Measured daily during the exposure period | (i) Ground hazelnuts (30 g/d); Exp. period = 5 d (ii) Sliced hazelnuts (30 g/d); Exp. period = 5 d (iii) Whole hazelnuts (30 g/d); Exp. period = 5 d | 5-day exposure period (i) Stable: a (ii) Stable: b (iii) Stable: c |
| Overall liking on a 150 mm VAS; Measured daily during the exposure period and at pre- and post-exposure | (i) Ground hazelnuts (30 g/d); Exp. period = 5 d (ii) Sliced hazelnuts (30 g/d); Exp. period = 5 d (iii) Whole hazelnuts (30 g/d); Exp. period = 5 d | 5-day exposure period (i) Stable: a (ii) Stable: b (iii) Stable: c | |||
| Tey et al., 2017 [49] | Randomised Crossover 2 treatments | 72 (24 M, 48 F) Aged 18 years and above | Desire to consume on a 150 mm VAS; Measured daily during the exposure period | (i) Raw hazelnuts (30 g/d); Exp. period = 28 d (ii) Dry roasted, lightly salted hazelnuts (30 g/d); Exp. period = 28 d | 28-day exposure period (i) Stable: a (ii) Stable: a |
| Overall liking on a 150 mm VAS; Measured daily during the exposure period and at pre- and post-exposure | (i) Raw hazelnuts (30 g/d); Exp. period = 28 d (ii) Dry roasted, lightly salted hazelnuts (30 g/d); Exp. period = 28 d | 28-day exposure period (i) Stable: a (ii) Stable: a Pre- vs. Post- (i) No significant change: 105 a vs. 108 a (ii) No significant change: 107 a vs. 111 a |
Publisher’s Note: MDPI stays neutral with regard to jurisdictional claims in published maps and institutional affiliations. |
© 2022 by the authors. Licensee MDPI, Basel, Switzerland. This article is an open access article distributed under the terms and conditions of the Creative Commons Attribution (CC BY) license (https://creativecommons.org/licenses/by/4.0/).
Share and Cite
Brown, R.; Ware, L.; Tey, S.L. Effects of Hazelnut Consumption on Cardiometabolic Risk Factors and Acceptance: A Systematic Review. Int. J. Environ. Res. Public Health 2022, 19, 2880. https://doi.org/10.3390/ijerph19052880
Brown R, Ware L, Tey SL. Effects of Hazelnut Consumption on Cardiometabolic Risk Factors and Acceptance: A Systematic Review. International Journal of Environmental Research and Public Health. 2022; 19(5):2880. https://doi.org/10.3390/ijerph19052880
Chicago/Turabian StyleBrown, Rachel, Lara Ware, and Siew Ling Tey. 2022. "Effects of Hazelnut Consumption on Cardiometabolic Risk Factors and Acceptance: A Systematic Review" International Journal of Environmental Research and Public Health 19, no. 5: 2880. https://doi.org/10.3390/ijerph19052880
APA StyleBrown, R., Ware, L., & Tey, S. L. (2022). Effects of Hazelnut Consumption on Cardiometabolic Risk Factors and Acceptance: A Systematic Review. International Journal of Environmental Research and Public Health, 19(5), 2880. https://doi.org/10.3390/ijerph19052880