
A Review of Air Pollution Mitigation Approach Using Air Pollution Tolerance Index (APTI) and Anticipated Performance Index (API)

 ,
,  , and
, and
Abstract
1. Introduction
2. Components and Impacts of Ambient Air Pollutants
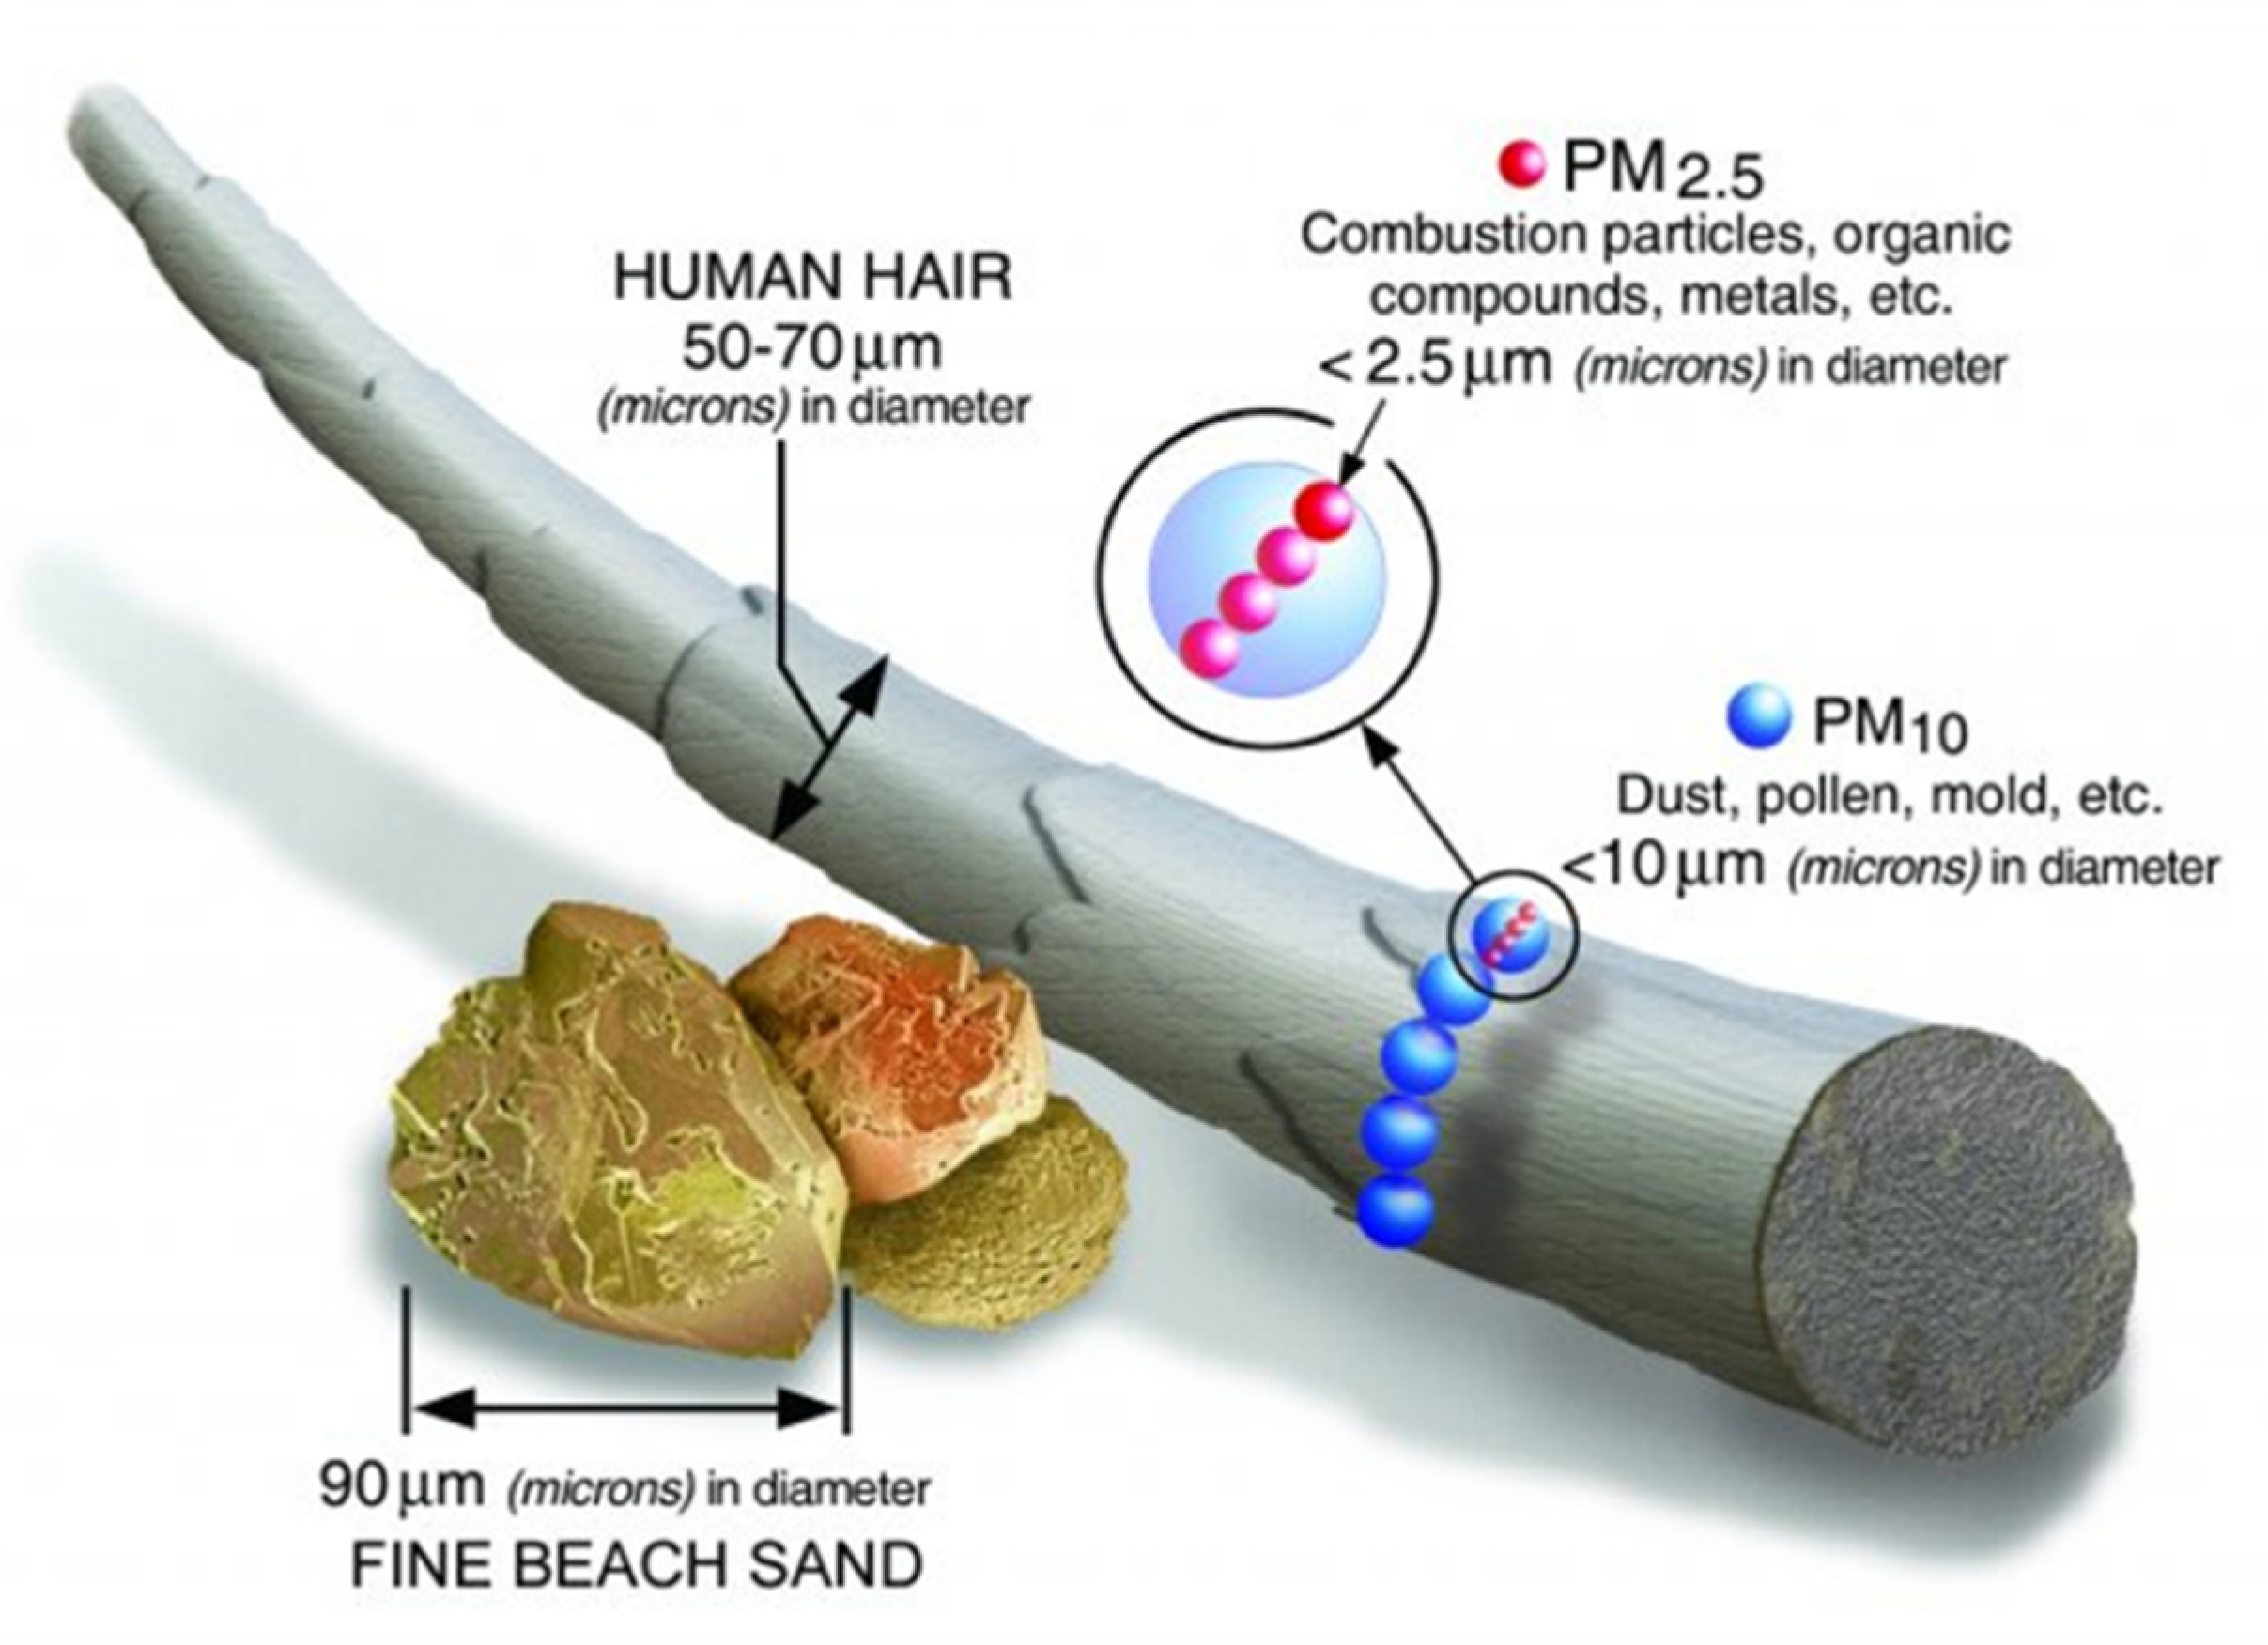
2.1. Particulate Matter (PM10 and PM2.5)
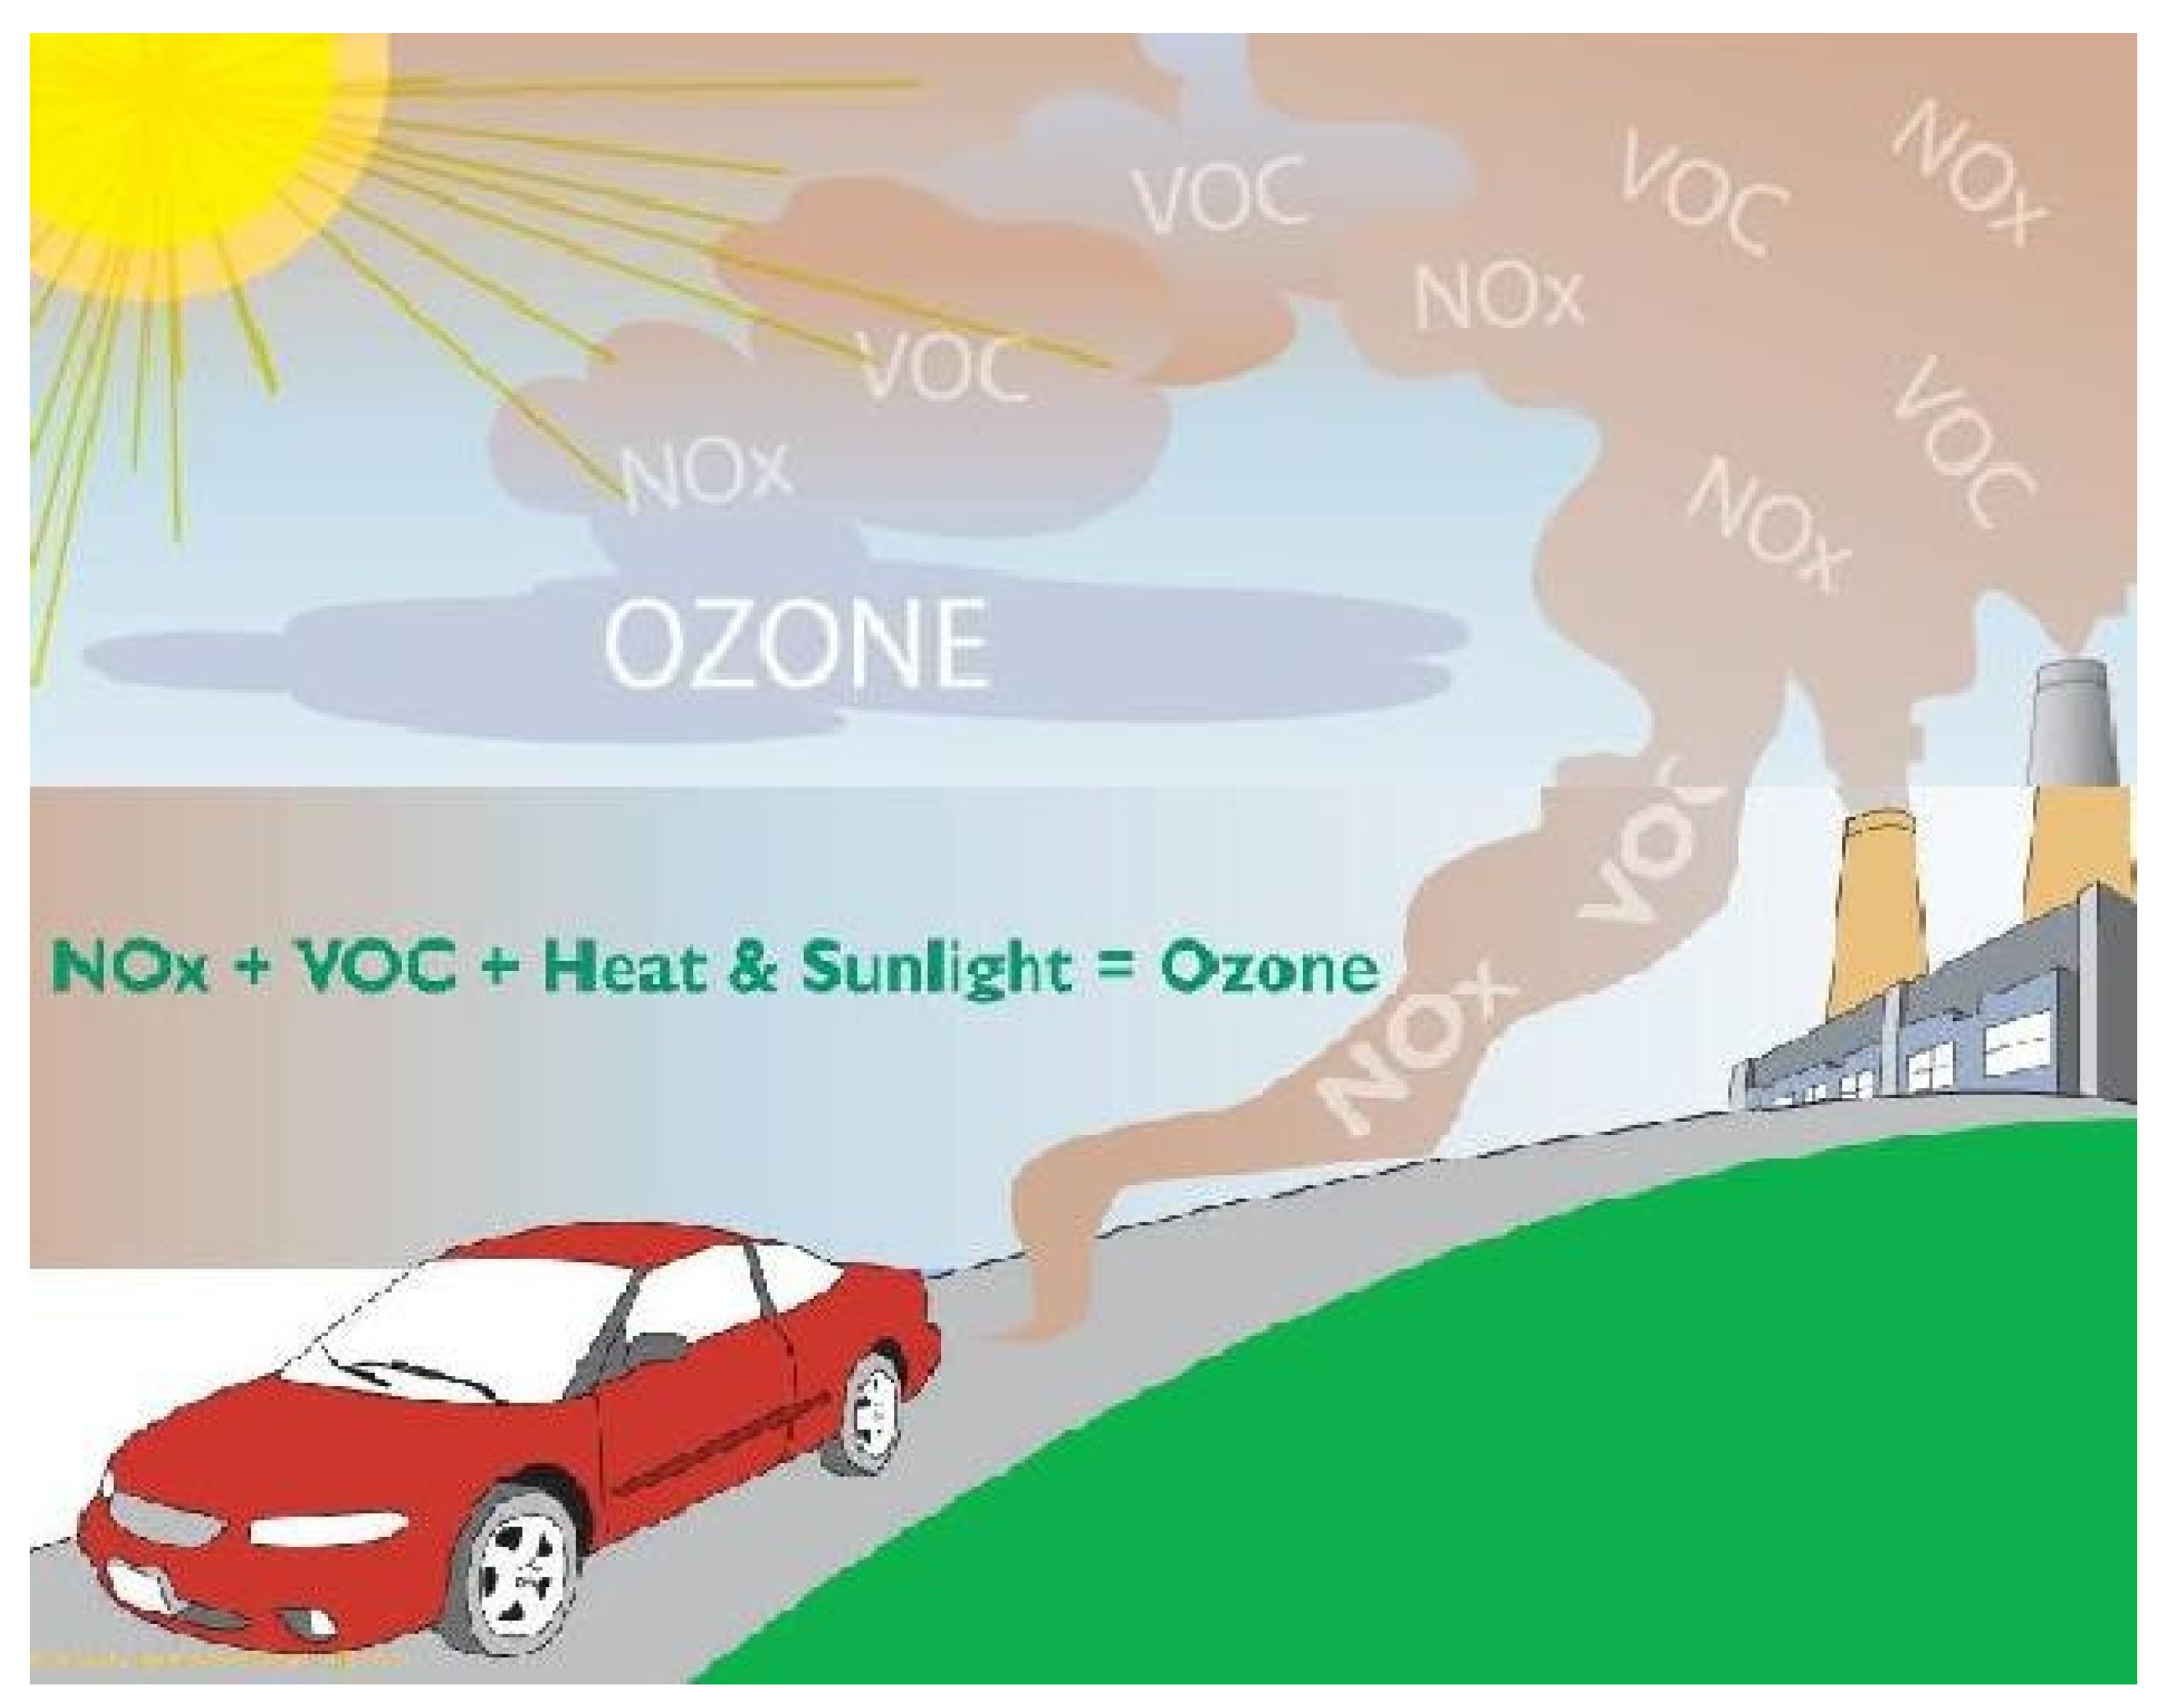
2.2. Ozone (O3)
2.3. Carbon Monoxide (CO)
2.4. Sulphur Dioxide (SO2)
2.5. Nitrogen Dioxide (NO2)
3. Phytoremediation, an Eco-Friendly Management Method in Reducing Air Pollution
Phytoremediation Techniques
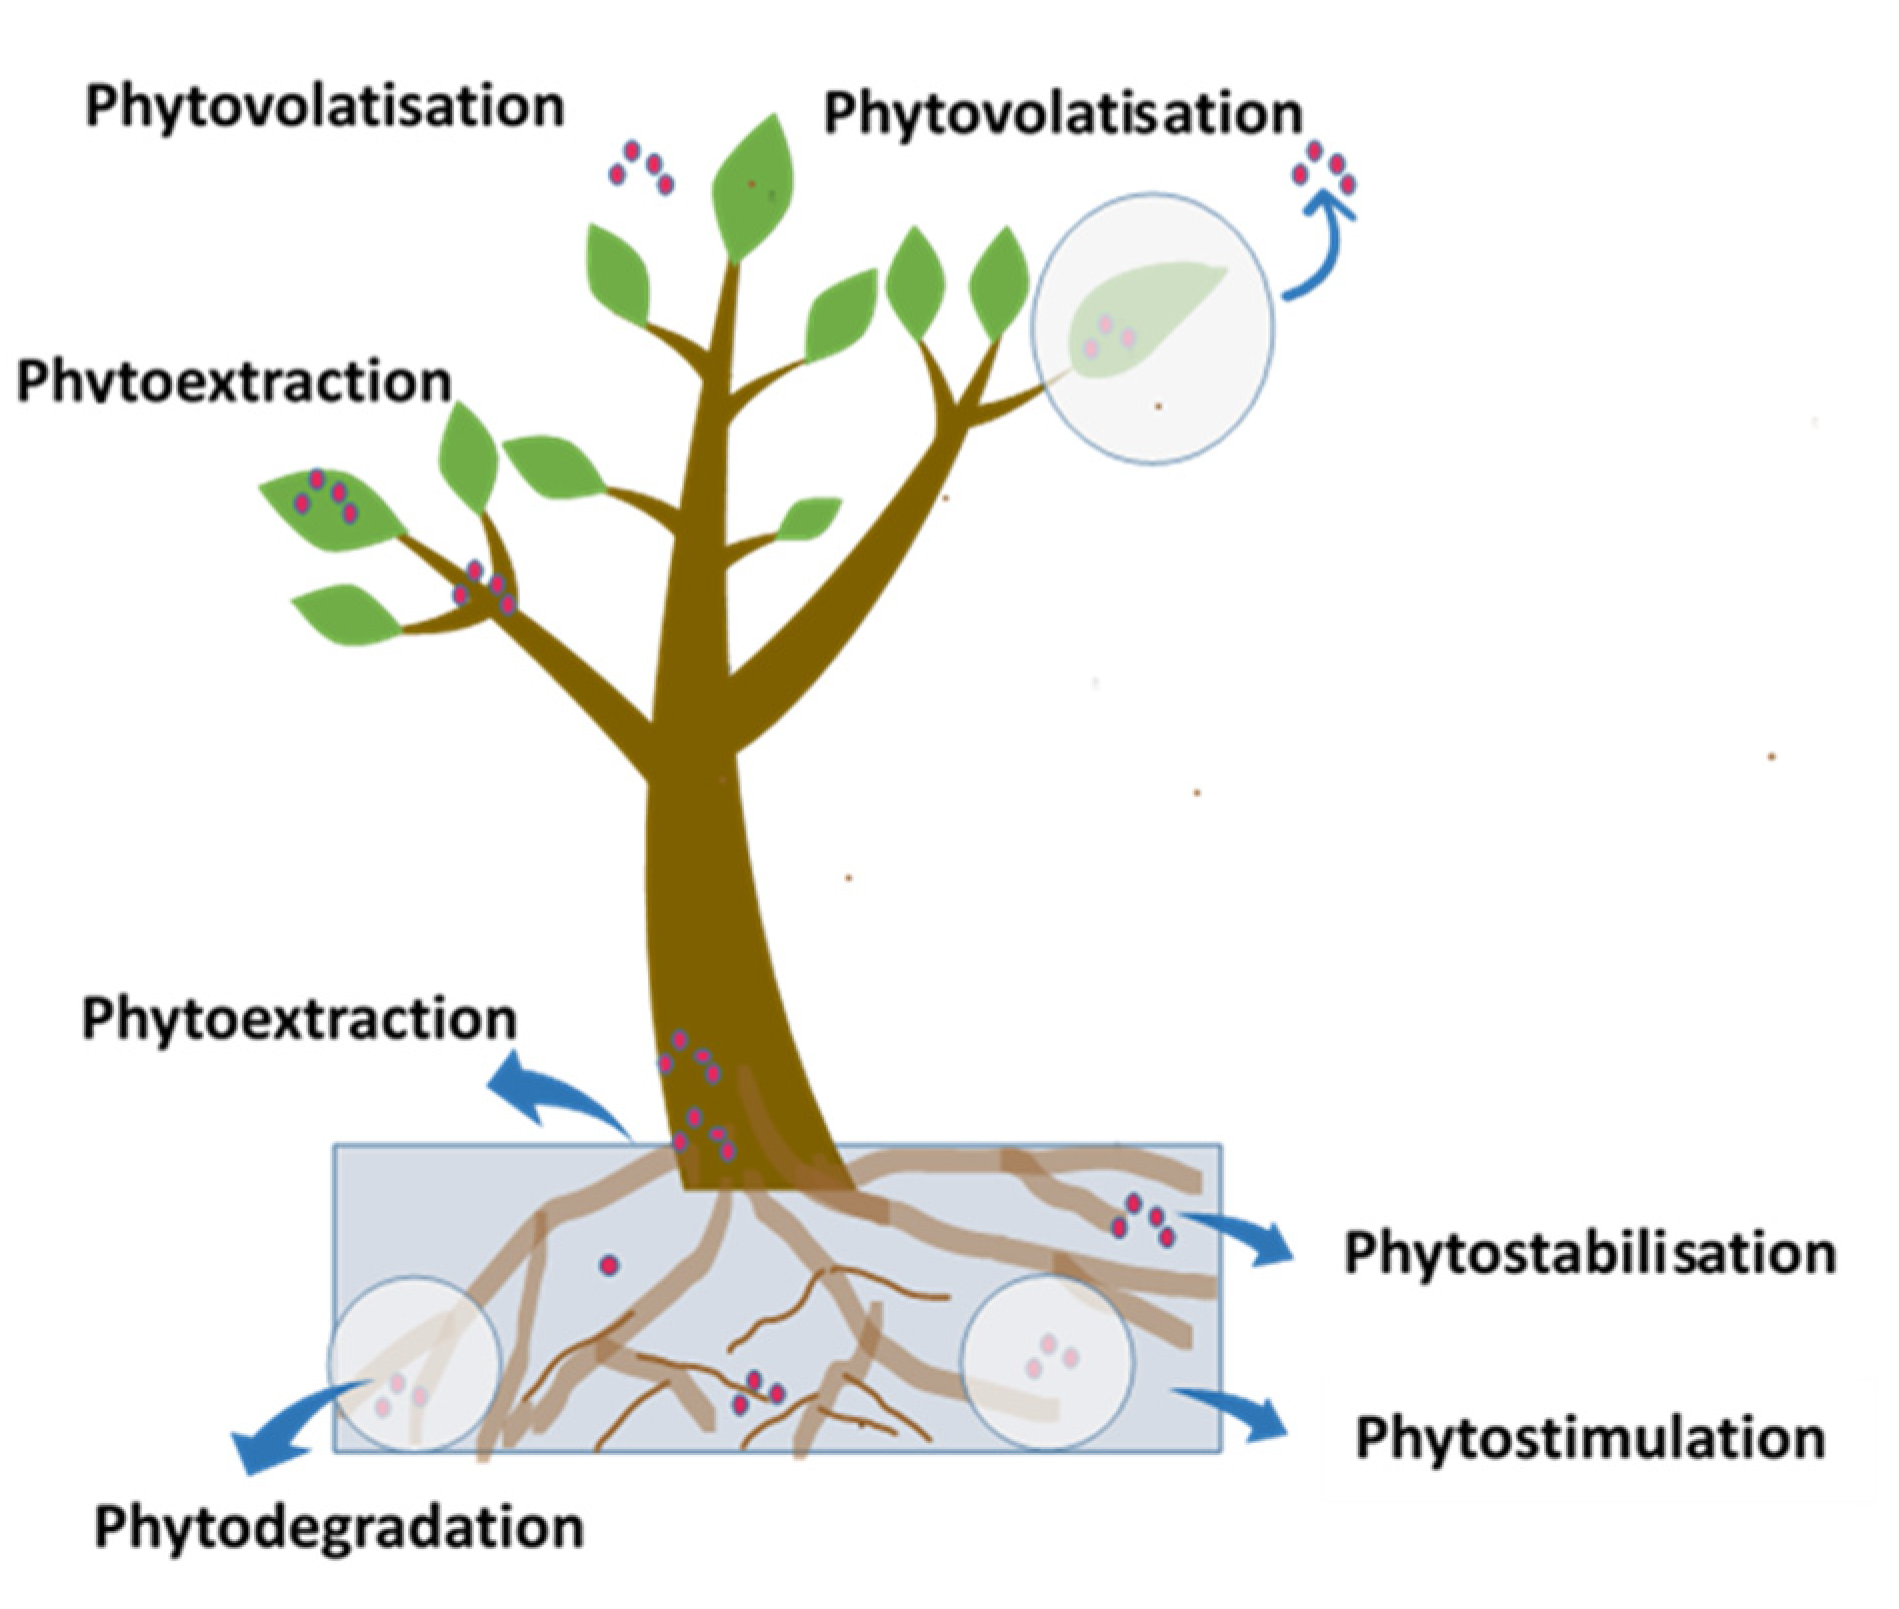
- PhytoextractionThis is the accumulation or uptake of pollutants by the plant as they absorb water from soil and the environment, which are stored in the plant leaves, roots and shoots but are not broken down. This technology is most often applied to metal-contaminated soil and may be toxic to organisms, even at relatively low concentrations [72]. According to Kapourchal et al. [73], there was a high concentration of lead (Pb) in the soil due to continuous exposure to vehicle exhaust air pollution, and the lead was extracted from the contaminated soil using the phytoextraction method.
- RhizofiltrationRhizofiltration is used basically in filtering contaminated groundwater. This is the process in which plant roots are used to take up and store contaminants (toxic substances or excess nutrients) from surface water or groundwater [72]. After the plants reach the contaminants’ saturation limit, they are harvested similarly to the phytoextraction method [71]. The successive implementation of this remediation technique requires a better understanding of the plant–water interactions that control the extraction of a targeted metal from polluted water resources.
- PhytodegradationPhytodegradation (also called phytotransformation) is the process of breaking down harmful pollutants in plant tissues, using their enzymes after taking up and storing them for a period [72,74]. The remediation technique utilises plants and associated rhizosphere microorganisms to remove, contain or transform toxic substances or excess nutrients in soils, sediments, and groundwater, among others [74]. The transformation of organic contaminants into more water-soluble molecules enables plants to diminish the toxicity of air pollutants. This is assisted by endocytic bacteria that colonise the plant inner tissues without causing any side effects on their host (plant) [59,75]. Persistent organic pollutants (POPs) can be abated with phytoremediation techniques as reported by Erakhrumen and Agbontalor [76].
- PhytostimulationPhytostimulation (also known as rhizodegradation) is the technique where the plants release certain substances through their roots into the soil or groundwater. The released substances increase the microorganisms’ ability to break down and destroy contaminants at a faster rate [77]. This process is critical for the applied technology of rhizoremediation that combines phytoremediation and bioaugmentation and is effective for the removal of organic contaminants in soils [59].
- PhytovolatisationThis is the technique where pollutants are uptaken by the plants from the soil, and then converted into a volatile form and then released into the atmosphere [68,72]. This means that the contaminants present in the water taken up by the plant pass through the plant or are modified by the plant and are released to the atmosphere (evaporates or vaporises). In the case of air pollution, phytovolatilisation occurs when pollutants are diffused into the phyllosphere of plants, where the toxicity of pollutants may be lowered before being transformed into a volatile component in the atmosphere [78].
- PhytostabilisationPhytostabilisation is defined as the immobilisation of contaminants in the soil through accumulation and absorption by roots, adsorption onto roots, or precipitation within the root zone of plants. This is used in the treatment of soil, sediments, and sludges [77]. Particulate matters as well as carbon dioxide (CO2) are absorbed by plants through their foliage and shoots and accumulate in the phyllosphere, then phytostabilise and immobilise in the wax layers of the plants [59,71].
4. Air pollution Indices
4.1. Air Pollution Tolerance Index (APTI)
4.2. Anticipated Performance Index (API)
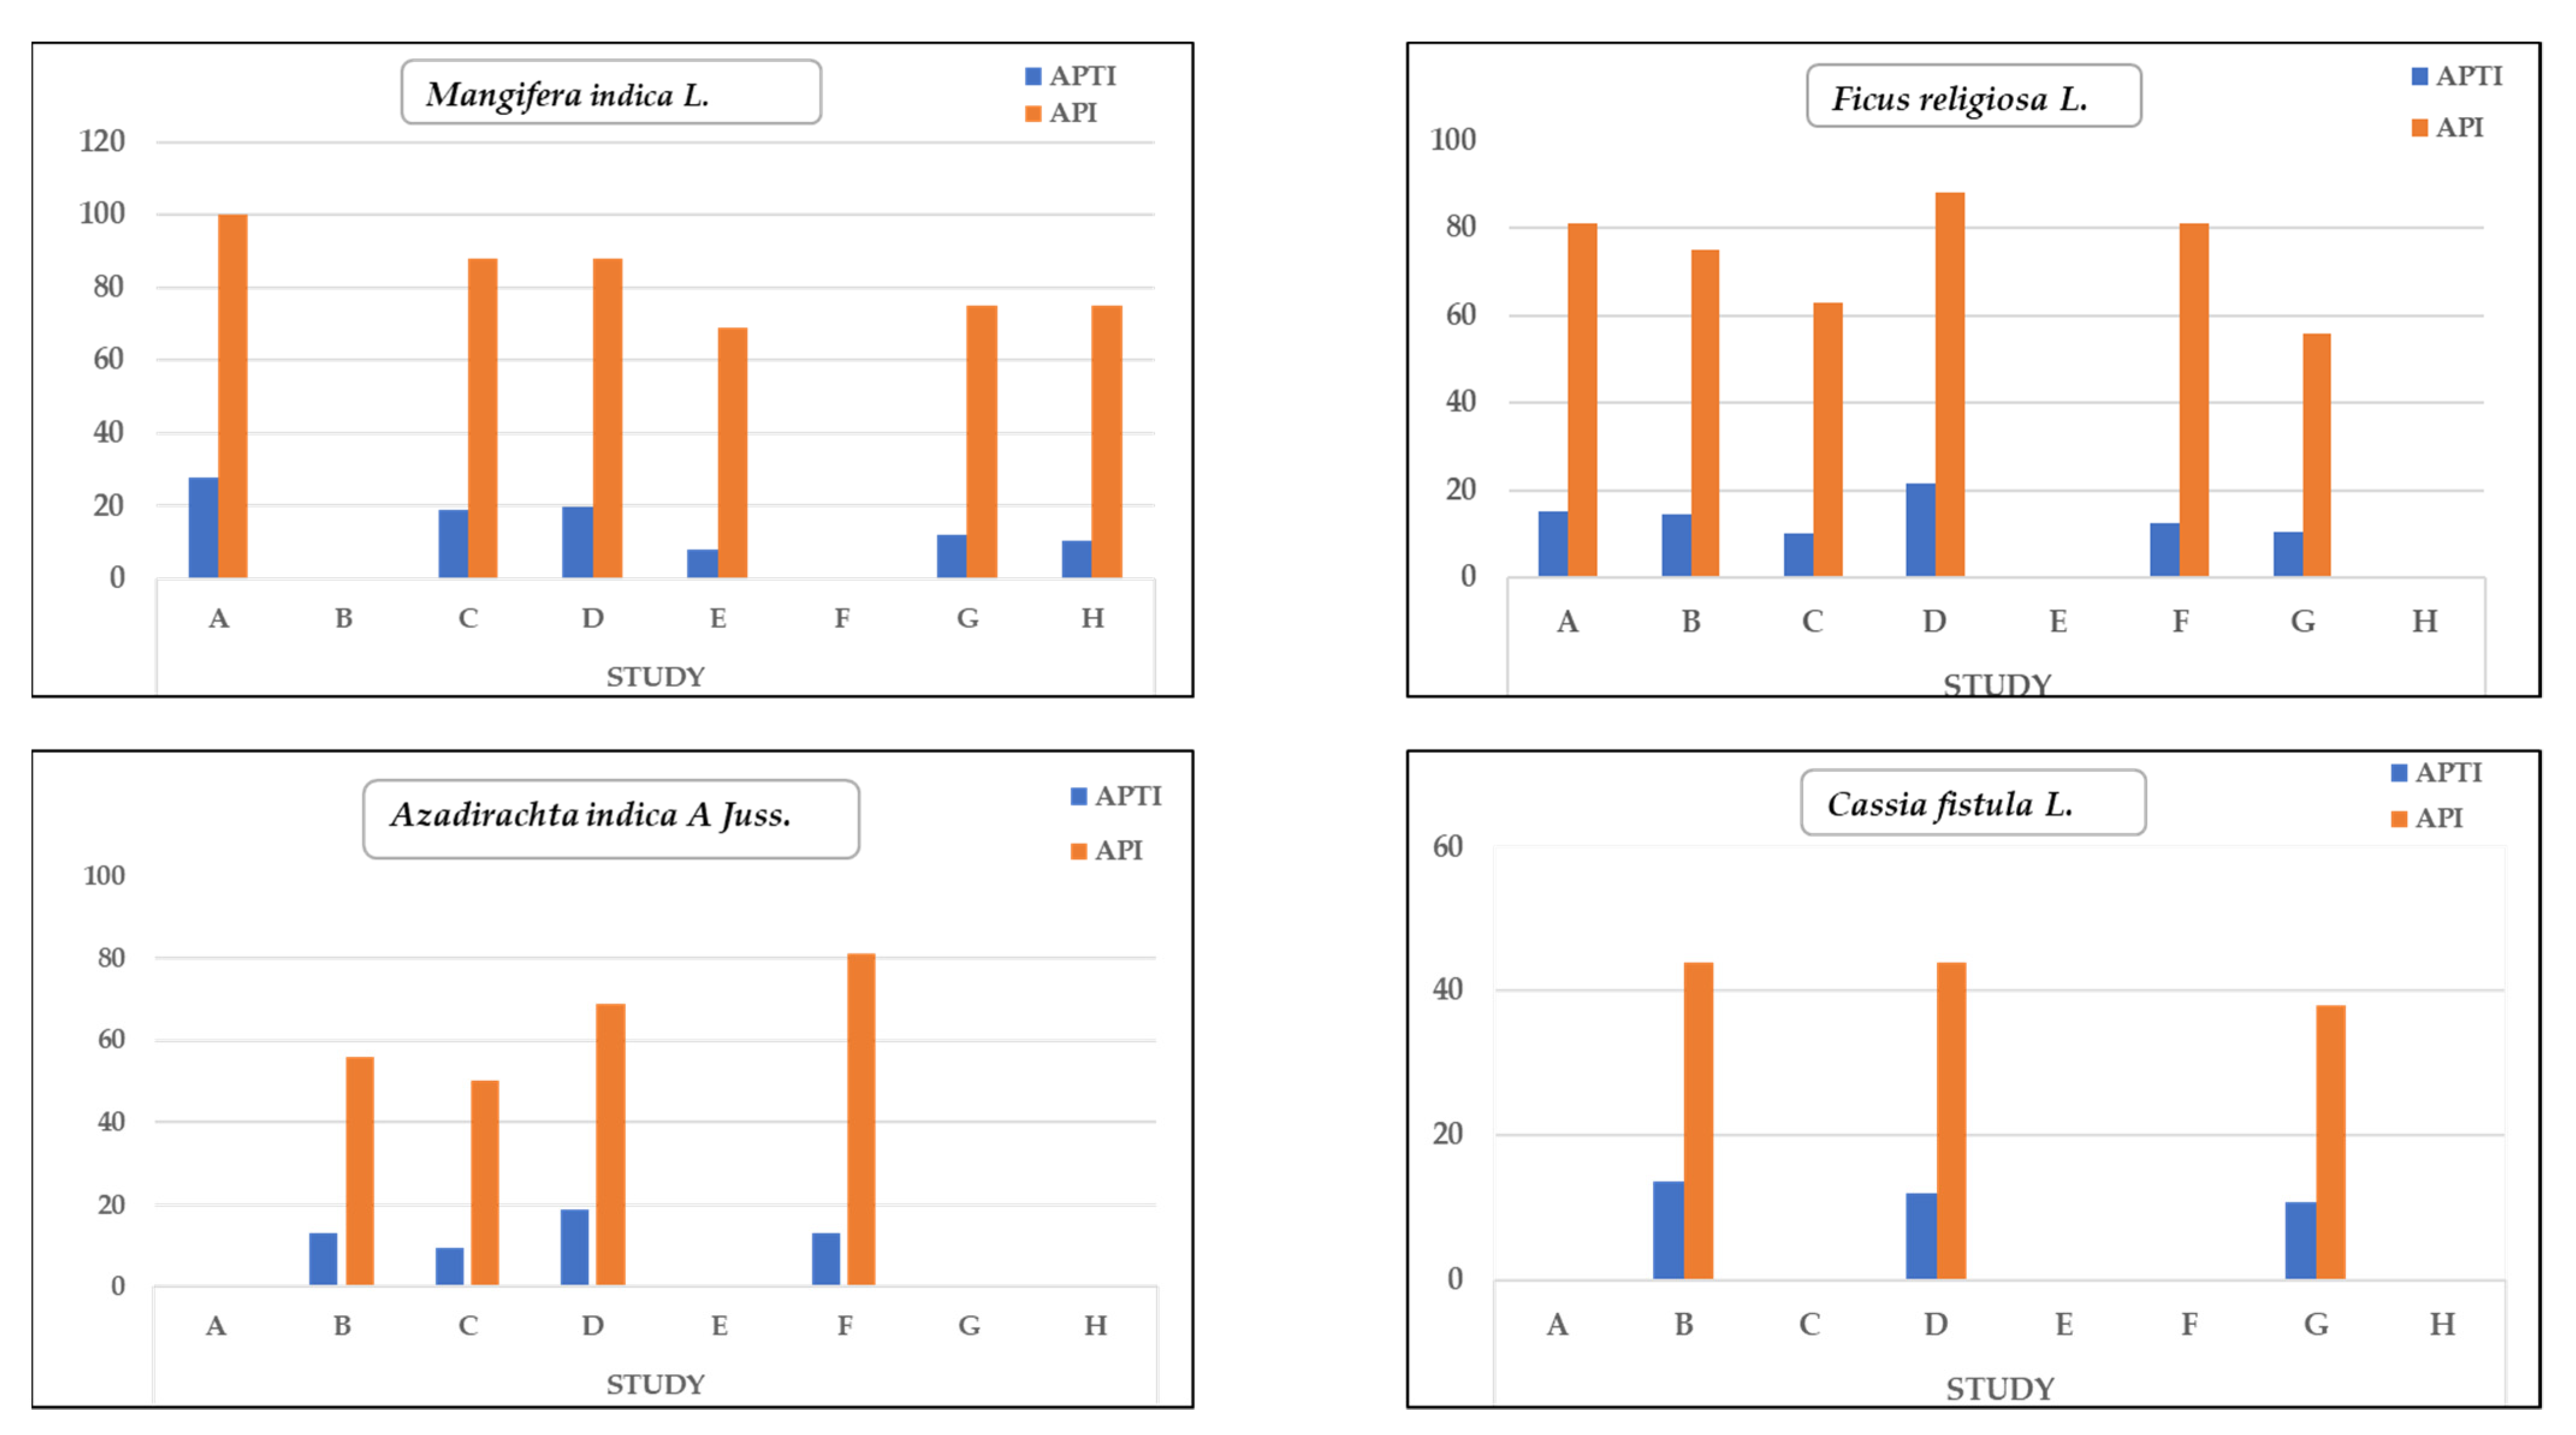
5. Assessment of Air Pollution Using APTI and API
6. Correlation Matrix Analysis
7. Conclusions
Author Contributions
Funding
Institutional Review Board Statement
Informed Consent Statement
Data Availability Statement
Conflicts of Interest
References
- Kampa, M.; Castanas, E. Human health effects of air pollution. Environ. Pollut. 2008, 151, 362–367. [Google Scholar] [CrossRef] [PubMed]
- George, M.P.; Kaur, B.J.; Sharma, A.; Mishra, S. Seasonal variation of air pollutants of Delhi and its health effects. NeBIO J. Environ. Biodivers. 2013, 4, 42–46. [Google Scholar]
- Singh, P.; Saini, R.; Taneja, A. Physicochemical characteristics of PM2.5: Low, middle, and high-income group homes in Agra, India-a case study. Atmos. Pollut. Res. 2014, 25, 352–360. [Google Scholar] [CrossRef]
- Phalen, R.F.; Phalen, R.N. Introduction to Air Pollution Science: A Public Health Perspective; Jones & Bartlett Learning, LLC.: Burlington, MA, USA, 2013. [Google Scholar]
- United States Environmental Protection Agency (US EPA). Six Common Air Pollutants. 2006. Available online: http://www.epa.gov/air/urbanair/index.html (accessed on 14 August 2021).
- Sharma, N.; Agarwal, A.K.; Eastwood, G.T.; Singh, A.P. Introduction to air pollution and its control. In Air Pollution and Control; Springer: Singapore, 2018; pp. 3–7. [Google Scholar]
- Liu, W.; Yang, Z.; Liu, Q. Estimations of ambient fine particle and ozone level at a suburban site of Beijing in winter. Environ. Res. Commun. 2021, 3, 081008. [Google Scholar] [CrossRef]
- Chattopadhyay, S. Spatial and Temporal Variations of Ambient Air Quality in Burdwan Town, West Bengal, India. Ph.D. Thesis, The University of Burdwan, West Bengal, India, 2012. [Google Scholar]
- Rai, K.; Panda, L.L. Dust capturing potential and air pollution tolerance index (APTI) of some roadside tree vegetation in Aizawl, Mizoram, India: An Indo-Burma hot spot region. Air Qual. Atmos. Health 2014, 7, 93–101. [Google Scholar] [CrossRef]
- National Research Council (NRC). International impacts on local and regional air pollution. In Global Sources of Local Pollution: An Assessment of Long-Range Transport of Key Air Pollutants to and from the United States; National Academies Press: Washington, DC, USA, 2010; pp. 11–34. [Google Scholar]
- World Health Organisation (WHO). 7 Million Premature Deaths Annually Linked to Air Pollution. 2014. Available online: http://www.who.int/mediacentre/news/releases/2014/air-pollution/en/ (accessed on 10 July 2021).
- World Health Organisation (WHO). Air Pollution and Child Health: Prescribing Clean Air: Summary; World Health Organization: Geneva, Switzerland, 2018; WHO/CED/PHE/18.01; Available online: https://apps.who.int/iris/bitstream/handle/10665/275545/WHO-CED-PHE-18.01-eng.pdf (accessed on 10 July 2021).
- Health Effects Institute (HEI). State of Global Air 2018. Special Report; Health Effects Institute: Boston, MA, USA, 2018; Available online: https://www.stateofglobalair.org/sites/default/files/soga-2018-report.pdf (accessed on 4 July 2021).
- Koenig, J.Q. Health Effects of Ambient Air Pollution: How Safe Is the Air We Breathe? Springer Science & Business Media: Berlin/Heidelberg, Germany, 2000; Available online: https://books.google.mw/books?id=TZ3VM5dUwnYC&printsec=copyright#v=onepage&q&f=false (accessed on 1 December 2021).
- Pope, C.A., III; Burnett, R.T.; Thun, M.J.; Calle, E.E.; Krewski, D.; Ito, K.; Thurston, G.D. Lung cancer, cardiopulmonary mortality, and long-term exposure to fine particulate air pollution. JAMA 2002, 287, 1132–1141. [Google Scholar] [CrossRef]
- Nkosi, V.; Wichmann, J.; Voyi, K. Chronic respiratory disease among the elderly in South Africa: Any association with proximity to mine dumps? Environ. Health 2015, 14, 33. [Google Scholar] [CrossRef]
- Hamra, G.B.; Guha, N.; Cohen, A.; Laden, F.; Raaschou-Nielsen, O.; Samet, J.M.; Vineis, P.; Forastiere, F.; Saldiva, P.; Yorifuji, T.; et al. Outdoor particulate matter exposure and lung cancer: A systematic review and meta-analysis. Environ. Health Perspect. 2014, 122, 906. [Google Scholar] [CrossRef]
- Franklin, B.A.; Brook, R.; Arden Pope, C. Air pollution and cardiovascular disease. Curr. Probl. Cardiol. 2015, 40, 207–238. [Google Scholar] [CrossRef]
- Lelieveld, J.; Evans, J.S.; Fnais, M.; Giannadaki, D.; Pozzer, A. The contribution of outdoor air pollution sources to premature mortality on a global scale. Nature 2015, 525, 367. [Google Scholar] [CrossRef]
- Nowak, D.J.; Hirabayashi, S.; Doyle, M.; McGovern, M.; Pasher, J. Air pollution removal by urban forests in Canada and its effect on air quality and human health. Urban For. Urban Green. 2018, 29, 40–48. [Google Scholar] [CrossRef]
- Tripathi, A.K.; Gautam, M. Biochemical parameters of plants as indicators of air pollution. J. Environ. Biol. 2007, 28, 127–132. [Google Scholar] [PubMed]
- Joshi, C.; Swami, A. Air pollution induced changes in the photosynthetic pigments of selected plant species. J. Environ. Biol. 2009, 30, 295–298. [Google Scholar] [PubMed]
- Rai, K. Environmental magnetic studies of particulates with special reference to biomagnetic monitoring using roadside plant leaves. Atmos. Environ. 2013, 72, 113–129. [Google Scholar] [CrossRef]
- Sekhar, P.; Sekhar, P. Evaluation of selected plant species as bio-indicators of particulate automobile pollution using Air Pollution Tolerance Index (APTI) approach. Int. J. Res. Appl. Sci. Eng. Technol. 2019, 7, 57–67. [Google Scholar] [CrossRef]
- Roy, A.; Bhattacharya, T.; Kumari, M. Air pollution tolerance, metal accumulation and dust capturing capacity of common tropical trees in commercial and industrial sites. Sci. Total Environ. 2020, 722, 137622. [Google Scholar] [CrossRef]
- Mahecha, G.S.; Bamniya, B.R.; Nair, N.; Saini, D. Air pollution tolerance index of certain plant species—A study of Madri Industrial Area, Udaipur (Raj.), India. Int. J. Innov. Res. Sci. Eng. Technol. 2013, 2, 7927–7929. [Google Scholar]
- Rai, K.; Panda, L.L.; Chutia, B.M.; Singh, M.M. Comparative assessment of air pollution tolerance index (APTI) in the industrial (Rourkela) and non-industrial area (Aizawl) of India: An ecomanagement approach. Afr. J. Environ. Sci. Technol. 2013, 7, 944–948. [Google Scholar]
- Gratao, L.; Prasad, M.N.V.; Cardoso, F.; Lea, J.; Azevedo, R.A. Phytoremediation: Green technology for the clean-up of toxic metals in the environment. Braz. J. Plant Physiol. 2005, 17, 53–64. [Google Scholar] [CrossRef]
- Tundele, S. Eco-Friendly Technology-Key for Sustainable Development. Int. J. Res. Granthaalayah 2015, 3, 371. [Google Scholar] [CrossRef]
- Shannigrahi, A.S.; Fukushima, T.; Sharma, R.C. Anticipated air pollution tolerance of some plant species considered for green belt development in and around an industrial/urban area in India: An overview. Int. J. Environ. Stud. 2004, 61, 125–137. [Google Scholar] [CrossRef]
- Lohe, R.N.; Tyagi, B.; Singh, V.; Kumar, T.P.; Khanna, D.R.; Bhutiani, R. A comparative study for air pollution tolerance index of some terrestrial plant species. Glob. J. Environ. Sci. Manag. 2015, 1, 315–324. [Google Scholar]
- Timilsina, S.; Shakya, S.; Chaudhary, S.; Thapa Magar, G.; Narayan Munankarmi, N. Evaluation of air pollution tolerance index (APTI) of plants growing alongside inner ring road of Kathmandu, Nepal. Int. J. Environ. Stud. 2021, 1–16. [Google Scholar] [CrossRef]
- Chaudhry, S.; Panwar, J. Evaluation of air pollution status and anticipated performance index of some tree species for green belt development in The Holy City of Kurukshetra, India. Int. J. Innov. Res. Sci. Technol. 2016, 2, 26–277. [Google Scholar]
- Venkatesh, A.; Jaramillo, P.; Griffin, W.M.; Matthews, H.S. Implications of near-term coal power plant retirement for SO2 and NOx and life cycle GHG emissions. Environ. Sci. Technol. 2012, 46, 9838–9845. [Google Scholar] [CrossRef] [PubMed]
- Pretorius, I.; Piketh, S.; Burger, R.; Neomagus, H. A perspective on South African coal fired power station emissions. J. Energy South. Afr. 2015, 26, 27–40. [Google Scholar] [CrossRef]
- Wu, X.D.; Guo, J.L.; Chen, G.Q. The striking amount of carbon emissions by the construction stage of coal-fired power generation system in China. Energy Policy 2018, 117, 358–369. [Google Scholar] [CrossRef]
- Housing Development Agency (HAD). South Africa: Informal Settlements Status (2013); Research Report; Housing Development Agency: Johannesburg, South Africa, 2013. [Google Scholar]
- Naidoo, S.; Piketh, S.J.; Curtis, C. Quantification of emissions generated from domestic burning activities from townships in Johannesburg. Clean Air J. 2014, 24, 34–41. [Google Scholar] [CrossRef]
- Rice, G.A.; Vosloo, T. A life cycle assessment of the cradle-to-gate phases of clay brick production in South Africa. Eco-Archit. V Harmon. Archit. Nat. 2014, 142, 471. [Google Scholar]
- Akinshipe, O.; Kornelius, G. Quantification of atmospheric emissions and energy metrics from simulated clamp kiln technology in the clay brick industry. Environ. Pollut. 2018, 236, 580–590. [Google Scholar] [CrossRef]
- Pandey, B.; Agrawal, M.; Singh, S. Assessment of air pollution around coal mining area: Emphasizing on spatial distributions, seasonal variations and heavy metals, using cluster and principal component analysis. Atmos. Pollut. Res. 2014, 5, 79–86. [Google Scholar] [CrossRef]
- Olukanni, D.O.; Adebiyi, S.A. Assessment of vehicular pollution of roadside soils in Ota Metropolis, Ogun State, Nigeria. Int. J. Civ. Environ. Eng. 2012, 12, 40–46. [Google Scholar]
- Wylie, B.J.; Kishashu, Y.; Matechi, E.; Zhou, Z.; Coull, B.; Abioye, A.I.; Dionisio, K.L.; Mugusi, F.; Premji, Z.; Fawzi, W. Maternal exposure to carbon monoxide and fine particulate matter during pregnancy in an urban Tanzanian cohort. Indoor Air 2017, 27, 136–146. [Google Scholar] [CrossRef]
- United States Environmental Protection Agency (US EPA). Particulate Matter (PM) Pollution: Particulate Matter (PM) Basics. May 2021. Available online: https://www.epa.gov/pm-pollution/particulate-matter-pm-basics (accessed on 12 August 2021).
- Rai, K. Multifaceted health impacts of particulate matter (PM) and its management: An overview. Environ. Skept. Crit. 2015, 4, 1. [Google Scholar]
- Krewski, D. Evaluating the effects of ambient air pollution on life expectancy. N. Engl. J. Med. 2009, 360, 413–415. [Google Scholar] [CrossRef] [PubMed]
- Saxena, N.; Bhargava, R. A Review on Air Pollution, Polluting Agents and its Possible Effects in 21st Century. Adv. Bioresearch 2017, 8, 42–50. [Google Scholar]
- Hanna, A.F.; Yeatts, K.B.; Xiu, A.; Zhu, Z.; Smith, R.L.; Davis, N.N.; Talgo, K.D.; Arora, G.; Robinson, J.; Meng, Q.; et al. Associations between ozone and morbidity using the Spatial Synoptic Classification system. Environ. Health 2011, 10, 49. [Google Scholar] [CrossRef]
- Konkani, J.K.; Chaudhari, A.R.; Patel, K.B.; Patel, N.; Nisarta, P.; Motaka, M. Study on Level of Carbon Monoxide in Residential Area of GIDC, Mundra. Int. J. Sci. Res. Sci. Eng. Technol. 2020, 7, 243–247. [Google Scholar] [CrossRef]
- Raub, J.A.; Mathieu-Nolf, M.; Hampson, N.B.; Thom, S.R. Carbon monoxide poisoning—A public health perspective. Toxicology 2000, 145, 1–14. [Google Scholar] [CrossRef]
- Health Effects Institute (HEI). Traffic-Related Air Pollution: A Critical Review of the Literature on Emissions, Exposure, and Health Effects; Health Effects Institute: Boston, MA, USA, 2010. [Google Scholar]
- Mittal, M.L.; Sharma, C.; Singh, R. Estimates of emissions from coal fired thermal power plants in India. In Proceedings of the 2012 International Emission Inventory Conference, Tampa, FL, USA, 13 August 2012; pp. 13–16. [Google Scholar]
- Kamarehie, B.; Ghaderpoori, M.; Jafari, A.; Karami, M.; Mohammadi, A.; Azarshab, K.; Ghaderpoury, A.; Alinejad, A.; Noorizadeh, N. Quantification of health effects related to SO2 and NO2 pollutants by using air quality model. J. Adv. Environ. Health Res. 2017, 5, 44–50. [Google Scholar]
- Walia, K.; Bhardwaj, S.K. Seasonal variations in biochemical parameters of plants and their air pollution tolerance in industrial area of Himachal Pradesh. Curr. World Environ. 2017, 12, 695. [Google Scholar] [CrossRef]
- McPherson, E.G. Trees with Benefits. American Nurseryman, 1 April 2005; pp. 30–40. [Google Scholar]
- Ram, S.S.; Majumder, S.; Chaudhuri, P.; Chanda, S.; Santra, S.C.; Chakraborty, A.; Sudarshan, M. A review on air pollution monitoring and management using plants with special reference to foliar dust adsorption and physiological stress responses. Crit. Rev. Environ. Sci. Technol. 2015, 45, 2489–2522. [Google Scholar] [CrossRef]
- Woo, S.Y.; Je, S.M. Photosynthetic rates and antioxidant enzyme activity of Platanus occidentalis growing under two levels of air pollution along the streets of Seoul. J. Plant Biol. 2006, 49, 315–319. [Google Scholar] [CrossRef]
- Horaginamani, S.M.; Ravichandran, M. Ambient air quality in an urban area and its effects on plants and human beings: A case study of Tiruchirappalli, India. Kathmandu Univ. J. Sci. Eng. Technol. 2010, 6, 13–19. [Google Scholar] [CrossRef]
- Weyens, N.; Thijs, S.; Popek, R.; Witters, N.; Przybysz, A.; Espenshade, J.; Gawronska, H.; Vangronsveld, J.; Gawronski, S.W. The role of plant–microbe interactions and their exploitation for phytoremediation of air pollutants. Int. J. Mol. Sci. 2015, 16, 25576–25604. [Google Scholar] [CrossRef]
- Cunningham, S.D.; Berti, W.R.; Huang, J.W. Phytoremediation of contaminated soils. Trends Biotechnol. 1995, 13, 393–397. [Google Scholar] [CrossRef]
- Kumar, S.R.; Arumugam, T.; Anandakumar, C.; Balakrishnan, S.; Rajavel, D. Use of plant species in controlling environmental pollution. Bull. Environ. Pharmacol. Life Sci. 2013, 2, 52–63. [Google Scholar]
- Joshi, C.; Swami, A. Physiological responses of some tree species under roadside automobile pollution stress around city of Haridwar, India. Environmentalist 2007, 27, 365–374. [Google Scholar] [CrossRef]
- Rai, K. Biodiversity of roadside plants and their response to air pollution in an Indo-Burma hotspot region: Implications for urban ecosystem restoration. J. Asia-Pac. Biodivers. 2016, 9, 47–55. [Google Scholar] [CrossRef]
- Zhang, H.; Zhang, Y.; Wang, Z.; Ding, M.; Jiang, Y.; Xie, Z. Traffic-related metal (loid) status and uptake by dominant plants growing naturally in roadside soils in the Tibetan plateau, China. Sci. Total Environ. 2016, 573, 915–923. [Google Scholar] [CrossRef]
- Nawahwi, M.Z.; Aziz, K.M.; Mohamed, S.M.; Shariff, S.M.; Taib, M.N.A.M.; Abdullah, M.A. Phytoremediation potential of Impatiens balsamina towards naphthalene contaminated soil in different parts of plant. Am.-Eurasian J. Agric. Environ. Sci. 2014, 14, 610–614. [Google Scholar]
- Kapoor, M. Managing ambient air quality using ornamental plants-an alternative approach. Univers. J. Plant Sci. 2017, 5, 1–9. [Google Scholar] [CrossRef]
- Reshma, V.S.; Kumar, P.; Chaitra, G.S. Significant Role of Ornamental Plants as Air Purifiers—A Review. Int. J. Curr. Microbiol. Appl. Sci. 2017, 6, 2591–2606. [Google Scholar] [CrossRef]
- Razzaq, R. Phytoremediation: An environmental friendly technique—A review. J. Environ. Anal. Chem. 2017, 4, 2380–2391. [Google Scholar] [CrossRef]
- Govindaraju, M.; Ganeshkumar, R.S.; Muthukumaran, V.R.; Visvanathan, P. Identification and evaluation of air-pollution-tolerant plants around lignite-based thermal power station for greenbelt development. Environ. Sci. Pollut. Res. 2012, 19, 1210–1223. [Google Scholar] [CrossRef]
- Schwitzguebel, J.-P. Potential of Phytoremediation, an Emerging Green Technology: European Trends and Outlook. Proc. Indian Natl. Sci. Acad. 2004, B70, 131–152. [Google Scholar]
- Lee, B.X.Y.; Hadibarata, T.; Yuniarto, A. Phytoremediation mechanisms in air pollution control: A review. Water Air Soil Pollut. 2020, 231, 1–13. [Google Scholar] [CrossRef]
- United States Environmental Protection Agency (US EPA). Introduction to Phytoremediation: EPA 600/R-99/107; U.S. Environmental Protection Agency, Office of Research and Development: Cincinnati, OH, USA, 2000.
- Kapourchal, S.A.; Kapourchal, S.A.; Pazira, E.; Homaee, M. Assessing radish (Raphanus sativus L.) potential for phytoremediation of lead-polluted soils resulting from air pollution. Plant Soil Environ. 2009, 55, 202–206. [Google Scholar] [CrossRef]
- Favas, J.; Pratas, J.; Varun, M.; D’Souza, R.; Paul, M.S. Phytoremediation of soils contaminated with metals and metalloids at mining areas: Potential of native flora. Environ. Risk Assess. Soil Contam. 2014, 3, 485–516. [Google Scholar]
- Sandermann, H., Jr. Higher plant metabolism of xenobiotics: The ‘green liver’ concept. Pharmacogenetics 1994, 4, 225–241. [Google Scholar] [CrossRef]
- Erakhrumen, A.A.; Agbontalor, A. Phytoremediation: An environmentally sound technology for pollution prevention, control, and remediation in developing countries. Educ. Res. Rev. 2007, 2, 151–156. [Google Scholar]
- Etim, E.E. Phytoremediation and its mechanisms: A review. Int. J. Environ. Bioenergy 2012, 2, 120–136. [Google Scholar]
- Morikawa, H.; Erkin, Ö.C. Basic processes in phytoremediation and some applications to air pollution control. Chemosphere 2003, 52, 1553–1558. [Google Scholar] [CrossRef]
- Singh, S.K.; Rao, D.N. Evaluation of plants for their tolerance to air pollution. In Proceedings of symposium on air pollution. Proc. Symp. Air Pollut. Control. 1983, 1, 218–224. [Google Scholar]
- Agrawal, M. Plant factors as indicators of SO2 and O3 pollutants. In Biological Monitoring of the State of the Environment (Bioindicators); Indian National Science Academy: New Delhi, India, 1985; pp. 225–231. [Google Scholar]
- Arnon, D.I. Copper enzymes in isolated chloroplasts. Polyphenoloxidase in Beta vulgaris. Plant Physiol. 1949, 24, 1. [Google Scholar]
- Leghari, S.K.; Akbar, A.; Qasim, S.; Ullah, S.; Asrar, M.; Rohail, H.; Ahmed, S.; Mehmood, K.; Ali, I. Estimating anticipated performance index and air pollution tolerance index of some trees and ornamental plant species for the construction of green belts. Polish J. Environ. Stud. 2019, 28, 1759–1769. [Google Scholar] [CrossRef]
- Prajapati, S.K.; Tripathi, B.D. Anticipated Performance Index of some tree species considered for green belt development in and around an urban area: A case study of Varanasi city, India. J. Environ. Manag. 2008, 88, 1343–1349. [Google Scholar] [CrossRef]
- Attri, S.D.; Tyagi, A. Climate Profile of India; Environment Monitoring and Research Center, India Meteorology Department: New Delhi, India, 2010. [Google Scholar]
- Geography of Nigeria. Available online: https://en.wikipedia.org/wiki/Geography_of_Nigeria (accessed on 16 June 2020).
- Lima, J.S.; Fernandes, E.B.; Fawcett, W.N. Mangifera indica and Phaseolus vulgaris in the bioindication of air pollution in Bahia, Brazil. Ecotoxicol. Environ. Saf. 2000, 46, 275–278. [Google Scholar] [CrossRef]
- Pandey, J.; Agrawal, M. Evaluation of air pollution phytotoxicity in a seasonally dry tropical urban environment using three woody perennials. New Phytol. 1994, 126, 53–61. [Google Scholar] [CrossRef]
- Chauhan, A. Photosynthetic pigment changes in some selected trees induced by automobile exhaust in Dehradun, Uttarakhand. N. Y. Sci. J. 2010, 3, 45–51. [Google Scholar]
- Allen, L.H., Jr.; Boote, K.J.; Jones, J.W.; Jones, H.; Valle, R.R.; Acock, B.; Rogers, H.H.; Dahlman, R.C. Response of vegetation to rising carbon dioxide: Photosynthesis, biomass, and seed yield of soybean. Glob. Biogeochem. Cycles 1987, 1, 1–14. [Google Scholar] [CrossRef]
- Agrawal, M.; Singh, B.; Rajput, M.; Marshall, F.; Bell, J.N.B. Effect of air pollution on peri-urban agriculture: A case study. Environ. Pollut. 2003, 126, 323–329. [Google Scholar] [CrossRef]
- Khalid, N.; Masood, A.; Noman, A.; Aqeel, M.; Qasim, M. Study of the responses of two biomonitor plant species (Datura alba & Ricinus communis) to roadside air pollution. Chemosphere 2019, 235, 832–841. [Google Scholar]
- Tak, A.A.; Kakde, U.B. Assessment of air pollution tolerance index of plants: A comparative study. Int. J. Pharm. Pharm. Sci. 2017, 9, 83–89. [Google Scholar] [CrossRef]
- Mondal, D.; Gupta, S.; Datta, J.K. Anticipated performance index of some tree species considered for green belt development in an urban area. Int. Res. J. Plant Sci. 2011, 2, 99–106. [Google Scholar]
- Patel, D.; Nirmal Kumar, J.I. An Evaluation of Air Pollution Tolerance Index and Anticipated Performance Index of Some Tree Species Considered for Green Belt Development: A Case Study of Nandesari Industrial Area, Vadodara, Gujarat, India. Open J. Air Pollut. 2018, 7, 1–13. [Google Scholar] [CrossRef]
- Anake, W.U.; Eimanehi, J.E.; Omonhinmin, C.A. Evaluation of air pollution tolerance index and anticipated performance index of selected plant species. Indones. J. Chem. 2019, 19, 239–244. [Google Scholar] [CrossRef]
- Bora, M.; Joshi, N. A study on variation in biochemical aspects of different tree species with tolerance and performance index. Bioscan 2014, 9, 59–63. [Google Scholar]
- Anake, W.U.; Bayode, F.O.; Omonhinmin, C.A.; Williams, A.B. Ambient air pollution control using air pollution tolerance index and anticipated performance index of trees. Int. J. Civ. Eng. Technol. 2018, 9, 417–425. [Google Scholar]
- Panda, L.R.L.; Aggarwal, R.K.; Bhardwaj, D.R. A review on Air Pollution Tolerance Index (APTI) and Anticipated Performance Index (API). Curr. World Environ. 2018, 13, 55–65. [Google Scholar] [CrossRef]
- Jain, S.; Bhattacharya, T.; Chakraborty, S. Comparison of Plant Tolerance Towards Air Pollution of Rural, Urban and Mine Sites of Jharkhand: A Biochemical Approach to Identify Air Pollutant Sink. In Advances in Waste Management; Springer: Singapore, 2019; pp. 123–142. [Google Scholar] [CrossRef]
- Enitan, I.T.; Edokpayi, J.N.; Odiyo, J.O.; Enitan, A.M. Reduction of Vehicular Pollutants Using Phytoremediation Method: A Review. In Proceedings of the ICSMNR2018, Polokwane, South Africa, 15–17 October 2018. [Google Scholar]
- Zhang, Q.; Liu, Y.J.; Chen, X.; Yang, Z.; Zhu, M.H.; Li, Y.P. Pollution resistance assessment of existing landscape plants on Beijing streets based on air pollution tolerance index method. Ecotoxicol. Environ. Saf. 2016, 132, 212–223. [Google Scholar] [CrossRef] [PubMed]
- Shrestha, S.; Baral, B.; Dhital, N.B.; Yang, H.H. Assessing air pollution tolerance of plant species in vegetation traffic barriers in Kathmandu Valley, Nepal. Sustain. Environ. Res. 2021, 31, 3. [Google Scholar] [CrossRef]
- Tsega, Y.C.; Deviprasad, A.G. Variation in air pollution tolerance index and anticipated performance index of roadside plants in Mysore, India. J. Exp. Biol. 2014, 35, 185–190. [Google Scholar]


| Range of APTI | Tolerance Level |
|---|---|
| 30–100 | Tolerance |
| 17–29 | Intermediate |
| 1–16 | Sensitive |
| <1 | Very sensitive |
| Grading | Characters | Pattern of Assessment | Grade Allotted | ||
|---|---|---|---|---|---|
| Tolerance | APTI | 9.0–12.0 | + | ||
| 12.1–15.0 | ++ | ||||
| 15.1–18.0 | +++ | ||||
| 18.1–21.0 | ++++ | ||||
| 21.1–24.0 | +++++ | ||||
| 24.1–27.0 | ++++++ | ||||
| 27.1–30.0 | +++++++ | ||||
| 30.1–33.0 | ++++++++ | ||||
| 33.1–36.0 | +++++++++ | ||||
| Biological and socio-economic | Plant habit | Small Medium Large | − + ++ | ||
| Canopy structure | Sparse/Irregular/globular | − | |||
| Spreading crown/open/semi dense | + | ||||
| Spreading dense | ++ | ||||
| Type of plant | Deciduous Evergreen | − + | |||
| Laminar structure | Size | Small | _ | ||
| Medium | + | ||||
| Large | ++ | ||||
| Texture | Smooth | _ | |||
| Coriaceous | + | ||||
| Hardiness | Delineate | − | |||
| Hardy | + | ||||
| Economic value | Less than three uses | − | |||
| Three or four uses | + | ||||
| Five or more uses | ++ | ||||
| Grade | Score (%) | Assessment Category |
|---|---|---|
| 0 | Up to 30 | Not recommended |
| 1 | 31–40 | Very poor |
| 2 | 41–50 | Poor |
| 3 | 51–60 | Moderate |
| 4 | 61–70 | Good |
| 5 | 71–80 | Very good |
| 6 | 81–90 | Excellent |
| 7 | 91–100 | Best |
| S/No | Plants Species | TC (mg/g) | pH | RWC (%) | AA (mg/g) | APTI | References |
|---|---|---|---|---|---|---|---|
| 1 | Psidium guajava | 2.19 | 6.36 | 77.69 | 28.90 | 31.75 | Study A [93] |
| 2 | Swietenia mahogany | 1.52 | 5.86 | 70.73 | 29.50 | 28.08 | |
| 3 | Mangifera indica L. | 2.13 | 6.33 | 84.66 | 24.50 | 27.97 | |
| 4 | Alstonia scholaris (L.) R.Br. | 1.49 | 5.94 | 79.76 | 13.20 | 16.72 | |
| 5 | Ficus religiosa L. | 2.17 | 6.30 | 73.64 | 9.06 | 15.11 | |
| 6 | Ficus hispida | 1.60 | 6.58 | 69.96 | 8.04 | 13.26 | |
| 7 | Ficus benghalensis L. | 6.54 | 5.93 | 55.65 | 6.65 | 18.65 | Study B [94] |
| 8 | Polyalthia longifolia Sonn. | 5.78 | 6.89 | 60.25 | 6.42 | 15.65 | |
| 9 | Ficus religiosa L. | 9.87 | 6.98 | 60.54 | 6.98 | 14.42 | |
| 10 | Cassia fistula L. | 4.44 | 5.43 | 54.24 | 6.07 | 13.65 | |
| 11 | Azadirachta indica A. Juss. | 3.87 | 6.2 | 54.21 | 6.79 | 12.98 | |
| 12 | Alstonia scholaris (L.) R.Br. | 3.81 | 6.05 | 50.42 | 5.26 | 9.01 | |
| 13 | Nerium odorum Sonnad. | 3.52 | 6.54 | 53.54 | 4.08 | 8.65 | |
| 14 | Mangifera indica L. | 1.73 | 5.54 | 96.04 | 12.98 | 19.03 | Study C [69] |
| 15 | Manikara zapota (L). P. Royen. | 2.25 | 5.69 | 85.62 | 6.54 | 13.76 | |
| 16 | Swietenia macrophylla King. | 3.33 | 6.27 | 86.07 | 2.17 | 10.67 | |
| 17 | Polyalthia longifolia Sonn. | 3.38 | 6.43 | 92.55 | 1.16 | 10.39 | |
| 18 | Ficus religiosa L. | 1.75 | 7.17 | 87.25 | 1.54 | 10.10 | |
| 19 | Azadirachta indica A. Juss. | 1.79 | 6.11 | 77.5 | 2.19 | 9.48 | |
| 20 | Tamarindus indica L. | 1.53 | 3.22 | 77.62 | 1.46 | 8.45 | |
| 21 | Ficus infectoria L. | 12.20 | 7.80 | 81.30 | 7.90 | 23.93 | Study D [83] |
| 22 | Ficus religiosa L. | 11.26 | 6.90 | 76.42 | 7.70 | 21.62 | |
| 23 | Zizyphus Oenoplia Mill. | 8.98 | 7.60 | 72.00 | 7.76 | 20.06 | |
| 24 | Mangifera indica L. | 9.78 | 5.76 | 91.18 | 6.78 | 19.65 | |
| 25 | Azadirachta indica A. Juss. | 6.80 | 6.20 | 76.00 | 8.78 | 19.01 | |
| 26 | Cassia fistula L. | 3.87 | 5.80 | 74.48 | 4.84 | 12.13 | |
| 27 | Nerium odorum Sonnad. | 1.86 | 6.70 | 71.00 | 1.76 | 8.60 | |
| 28 | Acacia auriculiformis | 0.47 | 7.01 | 92.8 | 1.87 | 10.7 | Study E [95] |
| 29 | Chrysophyllum albidum | 0.51 | 6.10 | 89.6 | 2.23 | 10.4 | |
| 30 | Araucaria heterophylla | 0.43 | 6.71 | 98.1 | 0.58 | 10.2 | |
| 31 | Mangifera indica L. | 0.34 | 6.14 | 68.8 | 1.77 | 8.03 | |
| 32 | Elaeis guineensis Jacq. | 0.61 | 7.32 | 70.6 | 1.06 | 7.90 | |
| 33 | Syzygium malaccense | 0.45 | 3.55 | 45.8 | 0.54 | 4.79 | |
| 34 | Saraca indica | 1.80 | 6.31 | 84.32 | 6.49 | 13.71 | Study F [96] |
| 35 | Azadirachta indica A. Juss. | 1.89 | 6.29 | 83.67 | 5.71 | 12.98 | |
| 36 | Shorea robusta | 2.58 | 6.57 | 72.31 | 5.65 | 12.64 | |
| 37 | Ficus religiosa | 2.17 | 6.45 | 75.35 | 5.99 | 12.61 | |
| 38 | Eucalyptus sp. | 1.85 | 6.22 | 79.00 | 5.83 | 12.61 | |
| 39 | Tectona grandis L.f. | 2.54 | 6.63 | 70.36 | 5.83 | 12.43 | |
| 40 | Mangifera indica L. | 4.16 | 5.28 | 92.18 | 3.24 | 12.27 | Study G [30] |
| 41 | Moringa pterygosperma | 2.36 | 5.42 | 84.70 | 4.76 | 12.17 | |
| 42 | Cassia fistula L. | 3.88 | 5.72 | 72.68 | 3.76 | 10.87 | |
| 43 | Acacia auriculiformis | 1.72 | 5.55 | 82.56 | 3.48 | 10.78 | |
| 44 | Ficus religiosa L. | 1.78 | 5.62 | 80.72 | 3.46 | 10.63 | |
| 45 | Ficus benghalensis L. | 1.68 | 8.14 | 82.26 | 2.32 | 10.50 | |
| 46 | Ficus infectoria L. | 1.61 | 7.82 | 86.16 | 1.45 | 9.98 | |
| 47 | Terminalia catappa | 1.09 | 4.51 | 88.90 | 5.16 | 12.0 | Study H [97] |
| 48 | Mangifera indica L. | 1.05 | 4.41 | 94.50 | 2.15 | 10.60 | |
| 49 | Carica papaya | 0.62 | 6.50 | 72.10 | 3.60 | 9.77 | |
| 50 | Syzygium malaccense | 1.09 | 2.88 | 90.80 | 0.38 | 9.23 |
| S/No | Plant Species | APTI | TH | CS | TT | Laminar | EI | H | Grade Allotted | API Assessment | References | ||
|---|---|---|---|---|---|---|---|---|---|---|---|---|---|
| LS | LT | Total Plus | % Score | ||||||||||
| 1 | Psidium guajava | ++++++++ | + | - | - | + | + | ++ | + | 14 | 88 | Excellent | Study A [93] |
| 2 | Swietenia mahogany | +++++++ | ++ | ++ | + | - | + | ++ | + | 16 | 100 | Best | |
| 3 | Mangifera indica L. | +++++++ | ++ | + | + | + | + | ++ | + | 16 | 100 | Best | |
| 4 | Alstonia scholaris (L.) R.Br. | +++ | + | ++ | + | + | + | + | - | 10 | 63 | Good | |
| 5 | Ficus religiosa L. | +++ | ++ | ++ | + | + | + | ++ | + | 13 | 81 | Excellent | |
| 6 | Ficus hispida | ++ | + | - | - | + | + | + | - | 6 | 38 | Very poor | |
| 7 | Ficus benghalensis L. | ++++ | ++ | ++ | + | ++ | + | + | + | 14 | 88 | Excellent | Study B [94] |
| 8 | Polyalthia longifolia Sonn. | +++ | + | + | + | ++ | - | + | + | 10 | 63 | Good | |
| 9 | Ficus religiosa L. | ++ | ++ | ++ | + | ++ | + | + | + | 12 | 75 | Very good | |
| 10 | Cassia fistula L. | ++ | + | + | - | + | - | + | + | 7 | 44 | Poor | |
| 11 | Azadirachta indica A. Juss. | ++ | ++ | ++ | - | - | - | ++ | + | 9 | 56 | Moderate | |
| 12 | Alstonia scholaris (L.) R.Br. | + | + | + | + | - | - | + | + | 6 | 38 | Very poor | |
| 13 | Nerium odorum Sonnad. | - | + | + | - | + | + | - | - | 4 | 25 | Not recommended | |
| 14 | Mangifera indica L. | ++++ | ++ | + | + | ++ | + | ++ | + | 14 | 88 | Excellent | Study C [69] |
| 15 | Manikara zapota (L). P. Royen | ++ | ++ | ++ | + | - | + | ++ | + | 11 | 69 | Good | |
| 16 | Swietenia macrophylla King. | + | ++ | + | - | + | + | ++ | + | 9 | 56 | Moderate | |
| 17 | Polyalthia longifolia Sonn. | + | + | + | + | + | - | + | + | 7 | 44 | Poor | |
| 18 | Ficus religiosa L. | + | ++ | + | + | ++ | + | + | + | 10 | 63 | Good | |
| 19 | Azadirachta indica A. Juss. | + | ++ | ++ | - | - | - | ++ | + | 8 | 50 | Poor | |
| 20 | Tamarindus indica L. | - | + | + | + | - | - | + | + | 5 | 31 | Very poor | |
| 21 | Ficus infectoria L. | +++++ | ++ | + | + | ++ | + | ++ | + | 15 | 94 | Best | Study D [83] |
| 22 | Zizyphus Oenoplia Mill. | +++++ | + | + | - | - | + | + | - | 9 | 56 | Moderate | |
| 23 | Ficus religiosa L. | +++++ | ++ | + | + | ++ | + | + | + | 14 | 88 | Excellent | |
| 24 | Mangifera indica L. | ++++ | ++ | ++ | + | + | + | ++ | + | 14 | 88 | Excellent | |
| 25 | Azadirachta indica A. Juss | ++++ | ++ | ++ | - | - | - | ++ | + | 11 | 69 | Good | |
| 27 | Cassia fistula L. | ++ | + | + | - | + | - | + | + | 7 | 44 | Poor | |
| 26 | Nerium odorum Sonnad. | - | + | + | - | + | + | - | - | 4 | 25 | Not recommended | |
| 27 | Cassia fistula L. | ++ | + | + | - | + | - | + | + | 7 | 44 | Poor | |
| 28 | Acacia auriculiformis | + | + | + | + | - | - | ++ | + | 7 | 44 | Poor | Study E [95] |
| 29 | Chrysophyllum albidum | + | ++ | + | + | + | - | ++ | + | 9 | 56 | Moderate | |
| 30 | Araucaria heterophylla | + | ++ | + | + | + | - | + | + | 8 | 50 | Poor | |
| 31 | Mangifera indica L. | - | ++ | ++ | + | + | ++ | ++ | + | 11 | 69 | Good | |
| 32 | Elaeis guineensis Jacq. | - | ++ | + | + | + | - | ++ | + | 8 | 50 | Poor | |
| 33 | Syzygium malaccense | - | ++ | ++ | + | + | ++ | ++ | + | 11 | 69 | Good | |
| 34 | Saraca indica | ++ | ++ | ++ | + | ++ | + | ++ | + | 13 | 81 | Excellent | Study F [96] |
| 35 | Azadirachta indica A. Juss. | ++ | ++ | ++ | + | ++ | + | ++ | + | 13 | 81 | Excellent | |
| 36 | Shorea robusta | ++ | ++ | ++ | - | ++ | + | ++ | + | 12 | 75 | Very good | |
| 37 | Ficus religiosa L. | ++ | ++ | ++ | + | ++ | + | ++ | + | 13 | 81 | Excellent | |
| 38 | Eucalyptus sp. | ++ | ++ | ++ | + | ++ | + | ++ | + | 13 | 81 | Excellent | |
| 39 | Tectona grandis L.f. | ++ | ++ | ++ | - | ++ | + | ++ | + | 12 | 75 | Very good | |
| 40 | Mangifera indica L. | ++ | ++ | + | + | ++ | + | ++ | + | 12 | 75 | Very good | Study G [30] |
| 41 | Moringa pterygosperma | ++ | + | - | - | + | - | + | + | 6 | 38 | Very poor | |
| 42 | Cassia fistula L. | + | + | + | - | + | - | + | + | 6 | 38 | Very poor | |
| 43 | Acacia auriculiformis | + | ++ | - | + | + | + | - | + | 7 | 44 | Poor | |
| 44 | Ficus religiosa L. | + | ++ | + | - | ++ | + | + | + | 9 | 56 | Moderate | |
| 45 | Ficus benghalensis L. | + | ++ | + | + | ++ | + | ++ | + | 11 | 69 | Good | |
| 46 | Ficus infectoria L. | + | ++ | + | + | ++ | + | ++ | + | 11 | 69 | Good | |
| 47 | Terminalia catappa | + | ++ | ++ | + | - | - | ++ | + | 9 | 56 | Moderate | Study H [97] |
| 48 | Mangifera indica L. | + | ++ | ++ | + | ++ | + | ++ | + | 12 | 75 | Very good | |
| 49 | Carica papaya | + | ++ | + | + | + | - | ++ | + | 9 | 56 | Moderate | |
| 50 | Syzygium malaccense | + | ++ | ++ | + | ++ | + | ++ | + | 12 | 75 | Very good | |
| Variables | TC | pH | RWC | AA | APTI | API |
|---|---|---|---|---|---|---|
| TC | 1.00 | |||||
| pH | 0.30 ** | 1.00 | ||||
| RWC | −0.20 | −0.03 | 1.00 | |||
| AA | 0.11 | 0.09 | −0.06 | 1.00 | ||
| APTI | 0.46 ** | 0.22 | 0.07 | 0.89 * | 1.00 | |
| API | 0.22 | 0.13 | 0.20 | 0.53 * | 0.63 * | 1.00 |
Publisher’s Note: MDPI stays neutral with regard to jurisdictional claims in published maps and institutional affiliations. |
© 2022 by the authors. Licensee MDPI, Basel, Switzerland. This article is an open access article distributed under the terms and conditions of the Creative Commons Attribution (CC BY) license (https://creativecommons.org/licenses/by/4.0/).
Share and Cite
Enitan, I.T.; Durowoju, O.S.; Edokpayi, J.N.; Odiyo, J.O. A Review of Air Pollution Mitigation Approach Using Air Pollution Tolerance Index (APTI) and Anticipated Performance Index (API). Atmosphere 2022, 13, 374. https://doi.org/10.3390/atmos13030374
Enitan IT, Durowoju OS, Edokpayi JN, Odiyo JO. A Review of Air Pollution Mitigation Approach Using Air Pollution Tolerance Index (APTI) and Anticipated Performance Index (API). Atmosphere. 2022; 13(3):374. https://doi.org/10.3390/atmos13030374
Chicago/Turabian StyleEnitan, Ibironke Titilayo, Olatunde Samod Durowoju, Joshua Nosa Edokpayi, and John Ogony Odiyo. 2022. "A Review of Air Pollution Mitigation Approach Using Air Pollution Tolerance Index (APTI) and Anticipated Performance Index (API)" Atmosphere 13, no. 3: 374. https://doi.org/10.3390/atmos13030374
APA StyleEnitan, I. T., Durowoju, O. S., Edokpayi, J. N., & Odiyo, J. O. (2022). A Review of Air Pollution Mitigation Approach Using Air Pollution Tolerance Index (APTI) and Anticipated Performance Index (API). Atmosphere, 13(3), 374. https://doi.org/10.3390/atmos13030374