Article

Assessing the Dynamics of Plant Species Invasion in Eastern-Mediterranean Coastal Dunes Using Cellular Automata Modeling and Satellite Time-Series Analyses

1
School of Plant Sciences & Food Security, The George S. Wise Faculty of Life Sciences, Tel Aviv University, Tel Aviv 69978, Israel
2
Department of Geography and Human Environment, The Porter School of the Environment and Earth Sciences, Tel Aviv University, Tel Aviv 69978, Israel
*
Author to whom correspondence should be addressed.
Remote Sens. 2022, 14(4), 1014; https://doi.org/10.3390/rs14041014
Submission received: 12 January 2022 / Revised: 13 February 2022 / Accepted: 15 February 2022 / Published: 19 February 2022
(This article belongs to the Special Issue Remote Sensing of Invasive Species)

Abstract

:
Biological invasion is a major contributor to local and global biodiversity loss, in particular in dune ecosystems. In this study we evaluated current and future cover expansion of the invasive plant species, Heterotheca subaxillaris, and Acacia saligna, in the Mediterranean coastal plain of Israel. This is the first effort to quantify current surface cover of the focal species in this area. We reconstructed plant cover for 1990–2020 using Landsat time series and modeled future potential expansion using cellular automata (CA) modeling. The overall accuracy of the results varied in the range 85–95% and the simulated plant growth using CA varied between 74% and 84%, for A. saligna and H. subaxillaris, respectively. The surface area covered by H. subaxillaris in 2020, 45 years since its introduction, was approximately 81 km2. Acacia saligna covered an area of 74.6 km2, while the vacant area available for potential spread of these two species was 630 km2. Heterotheca subaxillaris showed a mean expansion rate of 107% per decade from 2000 to 2020, while the mean expansion rate of A. saligna was lower, ranging between 48% and 54% within the same time period. Furthermore, based on the plant expansion model simulation we estimated that A. saligna and H. subaxillaris will continue to spread by 60% per decade, on average, from 2020 to 2070, with a maximum growth rate of 80% per decade during 2040–2050. According to future expansion projections, the species will cover all open vacant areas by 2070 (95% of the total vacant area) and most areas will be shared by both species.

1. Introduction

A rapid colonization capability and fast adaptation to new environmental conditions enable invasive plant species to expand throughout various geographic and climatic regions with negative effects on local biodiversity and ecosystem function [1,2,3,4]. Invasive species plant traits, together with their ability to withstand stress conditions facilitated by global change, have a profound impact on the ecosystems in which these species establish [5,6,7].
Plant communities in coastal zones are highly dynamic and prone to changes due to intensive human disturbance, combined with biotic and abiotic stress factors [8,9]. Exposure to salt sea sprays, as well as wind, sand movement, high temperature regimes, trampling and other environmental drivers, prevent many plant species from establishing in this harsh habitat, leaving open areas with bare soil [10]. Nevertheless, this area is high in species richness with particular presence of rare plants and animals, jointly with endemic plant species, some of them in danger of extinction [11]. A few invasive plant species with particular plant traits are capable of establishing in these open areas and compete with the natural vegetation adapted to this particular environment with mobile sand dunes [12,13,14]. To prevent sand dune movement across roads, environmental planners introduced A. saligna (Labill.) H.L.Wendl. and H. subaxillaris (Lam.) Britton & Rusby in the early and mid-1970s, respectively, to the coastal plain of Israel [5,15]. As a result of this intervention, both introduced species became invasive and are currently strongly integrated into the native flora of the coastal zone.
The expansion of invasive species, whether intentionally introduced [7,16] for specific purposes (i.e., sand stabilization) or unintentionally introduced by human activities (travel, transportation of goods etc.), requires proper monitoring and management during both current and future time frames. A considerable number of studies have examined the impacts of invasive species on the ecosystem [17,18] as well as their economic costs and negative health effects (i.e., allergenic plant species) [19,20,21,22,23]. Furthermore, it is becoming an even greater dilemma to resolve, considering intensifying human activities, urban development, agriculture expansion and climate change that enhance invasion processes [24,25,26,27]. Therefore, land managers and government agencies should prioritize early detection of invasion processes and progression for successful monitoring and management of invasive species.
Technological and methodological advances allow scientific communities and land managers to address the evaluation of invasion processes and model future potential scenarios [19,20,21,22,23]. The various data sources and analytical methods in the scientific literature rely strongly on remote sensing tools, available for spatial information and field observations, followed by linear and nonlinear multivariate analyses, grid-based simulation models such as cellular automata, machine learning methods for species distribution modeling, environmental envelopes and niche modeling [28,29,30,31]. The use of a specific method is strongly related to the available data, the spatial and temporal scales of the obtained information, and the presence of future model projections, such as bio-climatic variables. In this study we selected the cellular automata (CA) modeling approach developed by Stanislav Ulam [32], to evaluate the potential expansion of two invasive plant species based on remote sensing and ancillary data over coastal dunes areas in Israel. The CA is a spatially explicit modeling approach based on reproducing observed patterns of spread in space and time [33,34,35]. It has an advantage in the evaluation of the potential expansion of invasive species in terms of limited data availability. Unlike other species distribution models that are based on current and modeled future environmental predictions. More specifically, in ecological applications CA is built using environmental suitability data, transition probabilities of the spatial patterns between different time periods, and predictions of future changes based on past trends [36,37,38,39].
In this study, we focused on evaluating for the first time the combined ongoing expansion of two invasive species, A. saligna and H. subaxillaris, in the coastal dunes of Israel, by means of modeling and remote sensing. We evaluated the resulting changes in the landscape matrix in terms of the spatial configuration of the coastal dune ecosystem, using satellite time-series analyses and cellular automata (CA) modeling. We asked the following research questions: (a) what are the observed and expected expansion rates of A. saligna and H. subaxillaris and corresponding changes during the active invasion of the plants from 1990 to 2100 in the coastal zone of Israel? (b) What is the time frame for A. saligna and H. subaxillaris to spread across the available vacant areas? (c) What are the potential changes in landscape fragmentation as a result of the future expansion of these invasive plants?

2. Materials and Methods

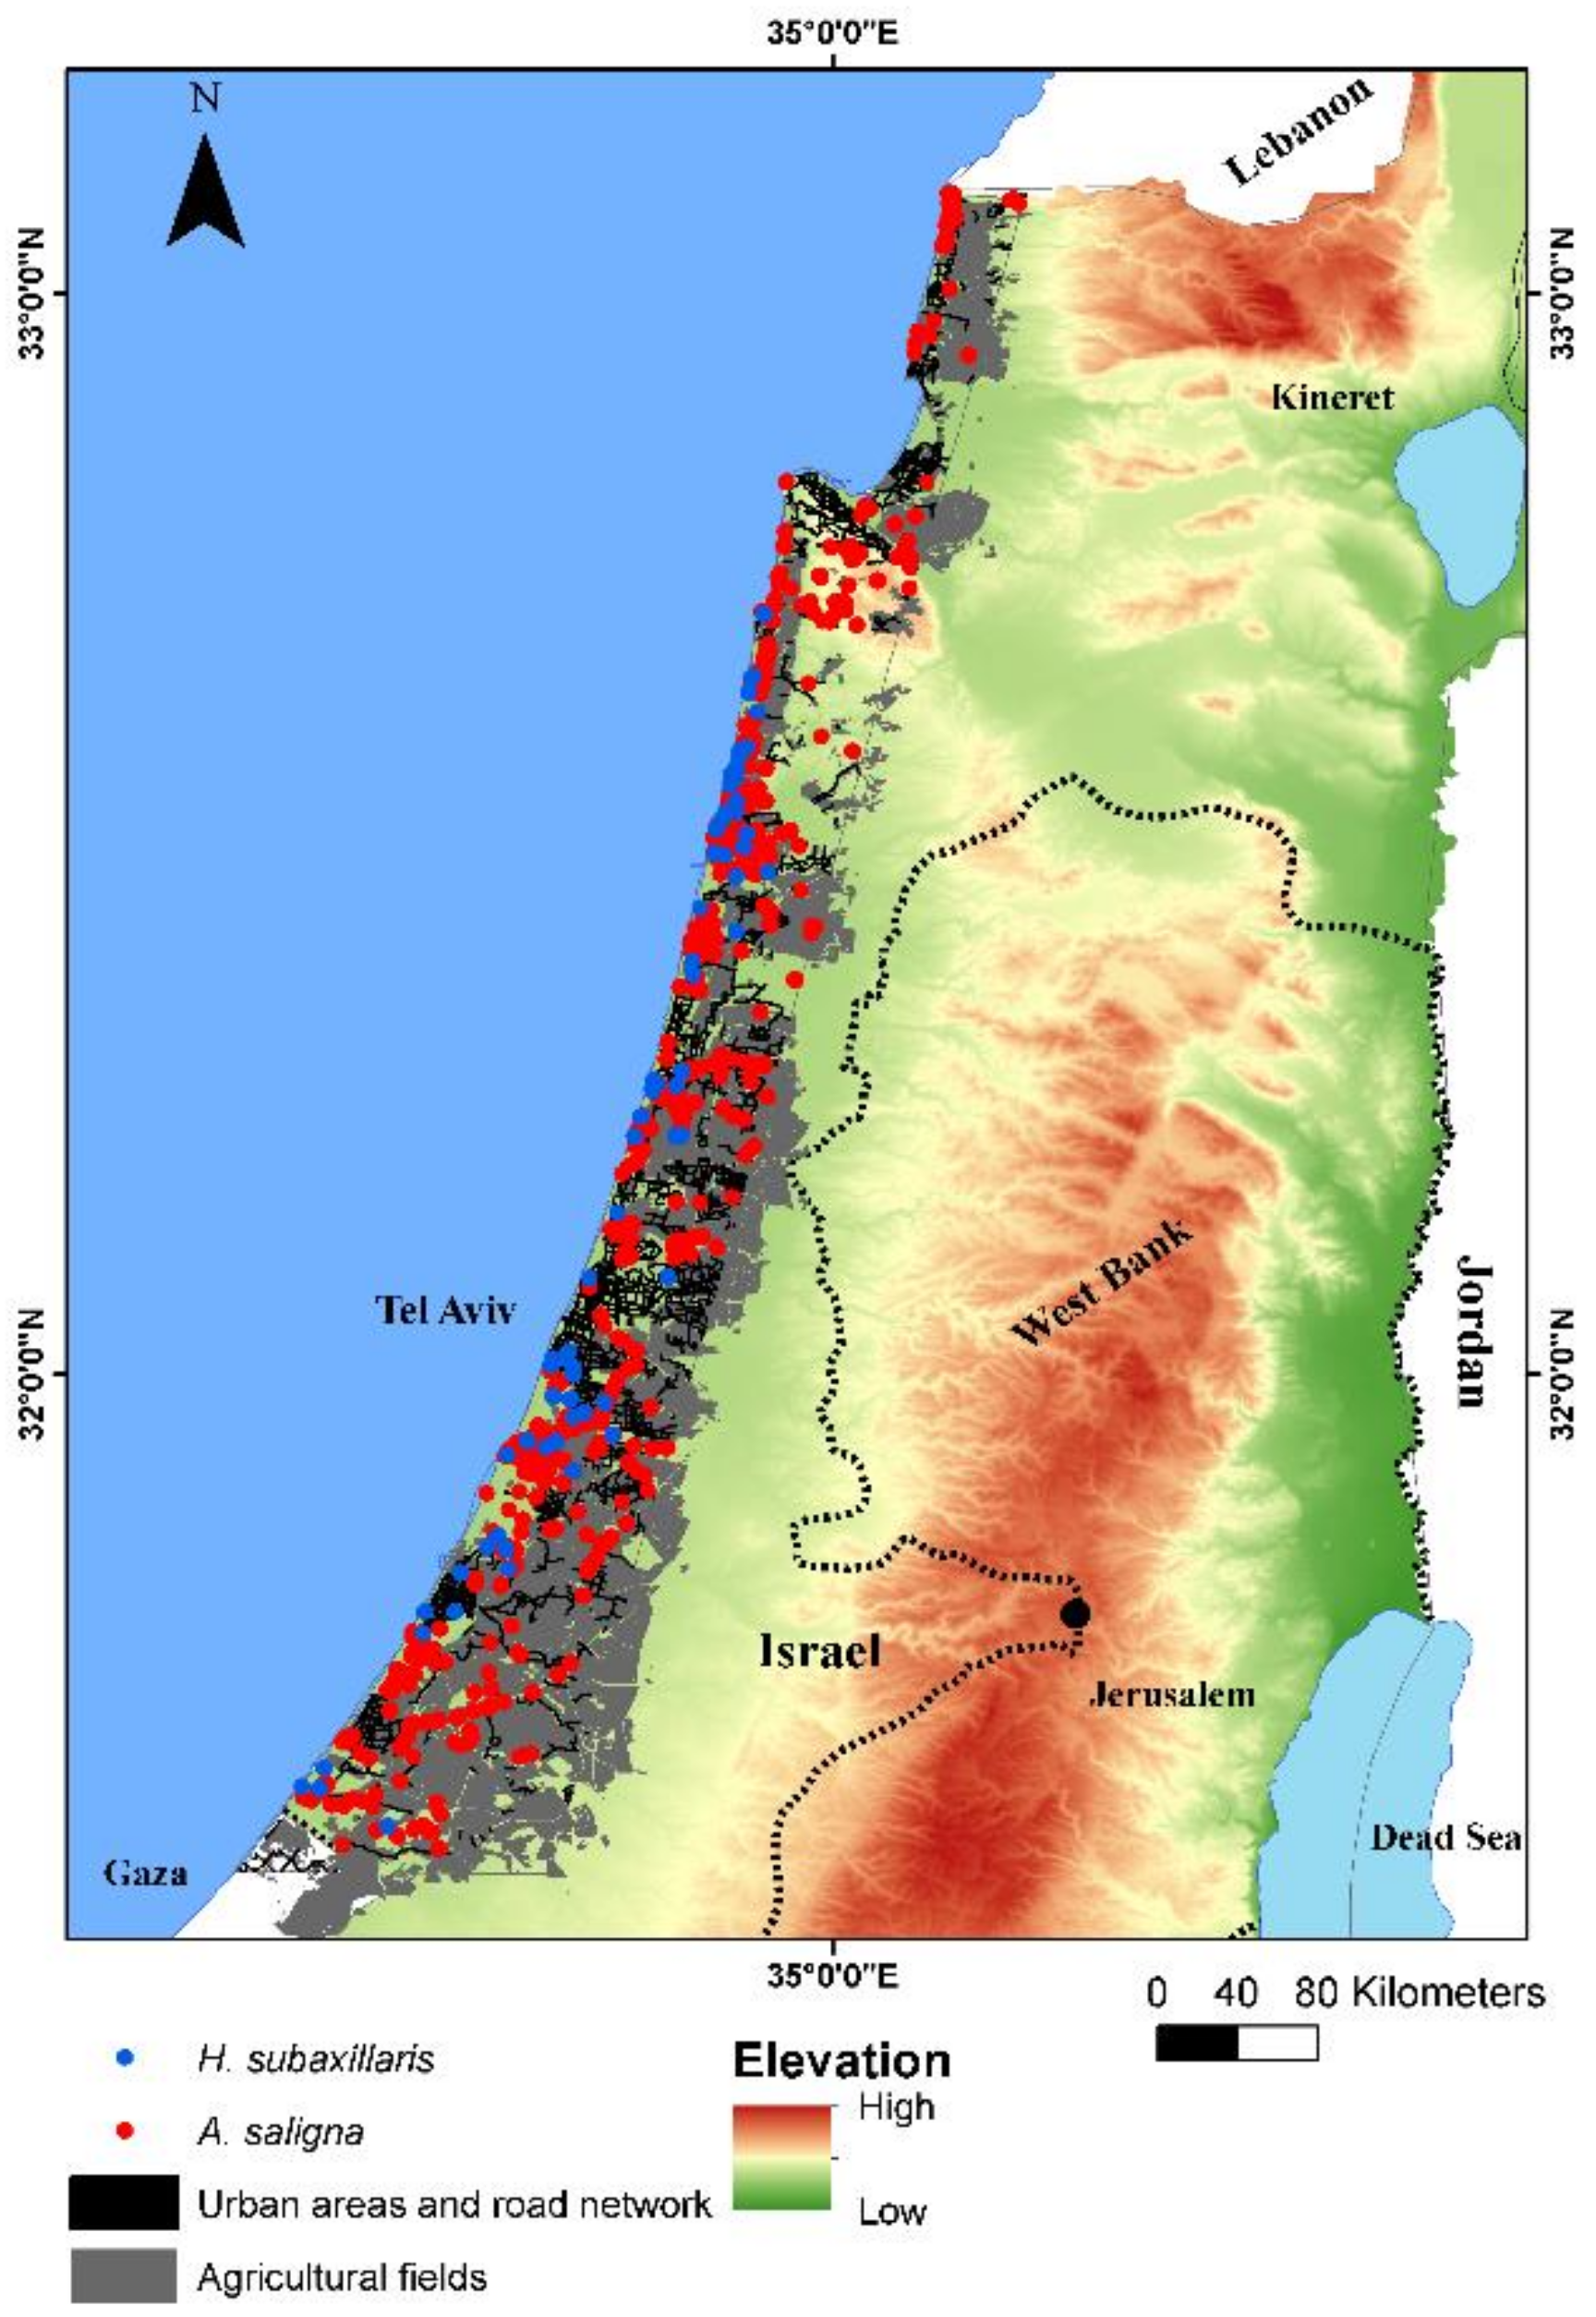
2.1. Research Area and Climate Trends

In this study we focused on the Mediterranean coastal plain of Israel that covers 2500 km2. The length of the coastal plain is ~170 km (south–north), and the width varies from 5 to 20 km (west–east) (Figure 1). The research area is threatened by intense urban and agricultural development. Urban areas cover approximately 540 km2, croplands cover over 1000 km2, and the natural/open areas cover 960 km2. There are two dominant soil types: coastal sand dunes that cover approximately 25%, while loamy sandy soils (Hamra) cover approximately 50% of the research area.
The local climate is the typical Mediterranean, with mild, wet winters and hot, dry summers. The long-term mean annual rainfall in the research area varies from 450 mm in the south to 650 mm in the north. The temperature regime does not vary significantly from south to north. During 1990–2020, the coldest months were January–February, with an absolute minimum temperature of 1.4 °C, and the hottest months were July–August, with an absolute maximum temperature of 42.3 °C. In general, average winter temperature varied from 10.1 ± 2.6 °C to 18.6 ± 2.79 °C and average summer temperature varied from 24.02 ± 1.33 °C to 29.31 ± 1.16 °C (Daily temperature obtained from Israel Meteorological Services (IMS—https://ims.gov.il/en (accessed on 23 June 2021)).
Israel’s Mediterranean coastal plain is continuously connected to the desert sand dunes of the Negev and northern Sinai. This connection provides a corridor for Sahara-Arabian (desert) species to expand through the coastal plain despite that the climatic conditions are the typical Mediterranean. This creates conditions for the development of highly diverse plant communities, with more than 170 plant species occurring on sand (8.2% of the total flora of Israel). The dominant natural woody vegetation is composed of species such as carob trees (Ceratonia siliqua), lentisc shrubs (Pistacia lentiscus), white broom shrubs (Retama raetam), and wormwood shrubs (Artemisia monosperma). Many psammophilic herbaceous species dominate the open areas between the woody vegetation [40]. Additionally, this region is well known for the relative richness of endemic plants. A total of 26% of Israel’s endemic species (31 species, most of them annuals) are concentrated in the coastal plain, mainly in open areas between shrubs and trees [11]. Natural primary succession is wind-driven from the Mediterranean shore to inland areas, as vegetation development leads to a decrease in wind speed allowing plant establishment and development. The expansion of the invasive A. saligna and H. subaxillaris species is threatening these open sandy areas, and the biodiversity in the coastal plain as a whole by over-competing the natural vegetation and affecting the ecosystem functioning. H. subaxillaris plant traits allow them to expand in the open gaps between the woody vegetation during the period that the natural vegetation is dry. The complexity of several traits favors the expansion of this species [41].

2.2. The Focal Plant Species

Acacia saligna is a tree species from the Mimosaceae family, native to Australia [42]. The flowering period of A. saligna in the coastal plain is early spring (March to early April). A. saligna was introduced to the region at the beginning of the 20th century by the British Mandate for Palestine with the aim of stabilizing sand dunes and protecting roads and agricultural lands (report of the British Department of Agriculture and Forests for the years 1927–1946). Heterotheca subaxillaris, is an herbaceous plant species from the Asteraceae family, native to North America. This species was introduced to Israel in the early 1970’s with the same purposes as A. saligna. Its flowering season begins in late September and can last until April [43]. We note that H. subaxillaris is one of the very few herbaceous species that flower in autumn in the coastal plain with the consequent ecological advantages that further promote its expansion [43]. Both plants species are known to be considerably resistant to various stress conditions that allow them to cope with physiological stress such as drought, salinity, limited water, and organic matter availability in the soil [41,43,44,45].

2.3. Spatial Data from Local Archive and Field Campaign

Spatial data of A. saligna and H. subaxillaris occurrences were obtained from the Israel Nature and Parks Authority (INPA—https://www.parks.org.il/en/ (accessed on 10 February 2021)), the Global Biodiversity Information Facility (GBIF: https://www.gbif.org/ (accessed on 21 February 2021)) and a designated field campaign in September 2019. In addition, we used the vector files of urban areas, agricultural fields, road networks, and waterways obtained from a local mapping organization (https://www.mapi.gov.il/en (accessed on 11 January 2022)) and free GIS online databases. Live accessions of A. saligna and H. subaxillaris were filtered for duplicate records and split into datasets of 70%/30% for classification and accuracy assessment of classification maps and validation of expansion models according to a year of collection (See the numbers of live plant accessions per time period in Table A1). All spatial data were transformed into the same geographic coordinate system for further analyses.

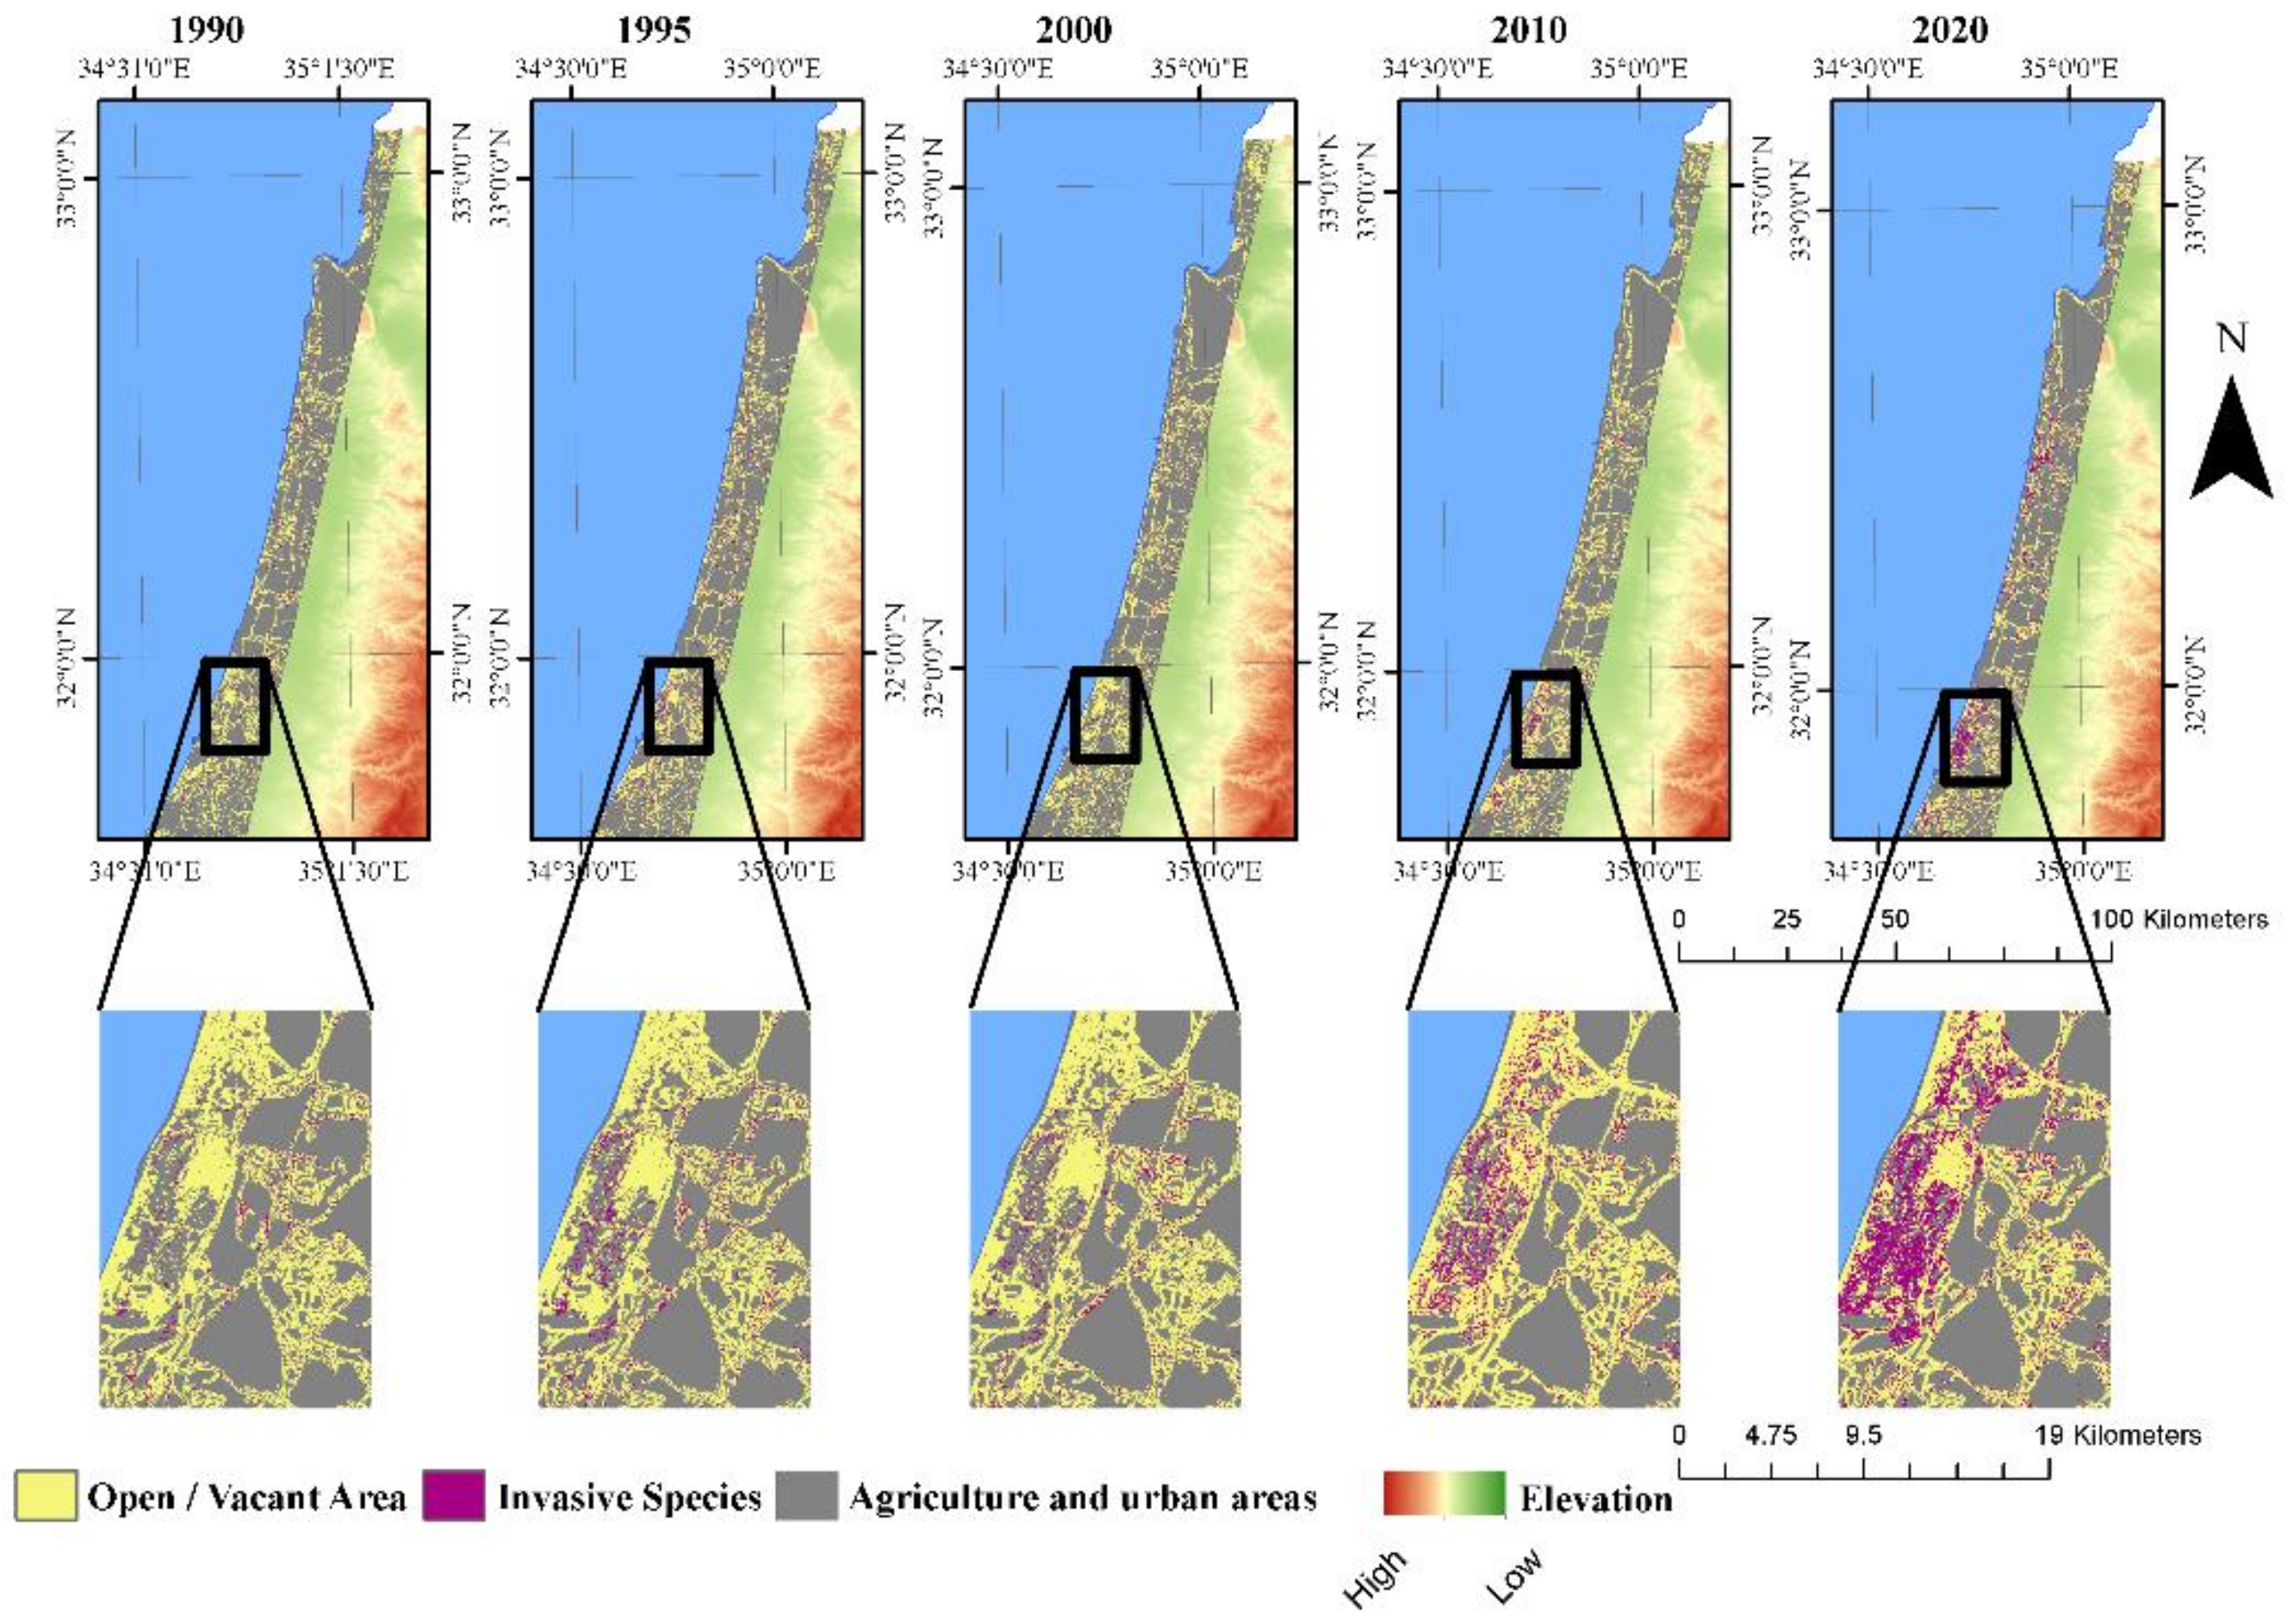
2.4. Spatial Data from Remote Sensing

For classification of the focal species, we used Landsat TM 5 and Landsat 8 OLI images obtained from the public domain of the U.S. Geological Survey (Landsat Collection 1, Level 2—Land Surface Reflectance, i.e., after atmospheric correction). We obtained images for March–April and October–November from 1990 to 2020 (Appendix A Table A2) with the cloud cover less than 5 %. Prior to classification, we applied image to image registration using ESRI ArcGis 10.6 to ensure matching of corresponding pixels in the matrix. We resampled the images at a 15-m spatial resolution using the bilinear transformation method.

2.5. Remote Sensing Classification

The classification and mapping algorithm included the following steps: We masked out the images for the areas that cannot support the vegetation or are out of our research area (cities, agricultural fields, roads, established forests). In the first step we masked out the urban areas, roads and agricultural fields using the spatial data obtained from the local mapping organization and free GIS online databases. In addition, we calculated the Normalized Differential Vegetation Index (NDVI) (Equation (1)) per image to mask out the non-vegetated areas. Based on general knowledge [46,47] about NDVI ranges and related land cover classes, we extracted the following land cover classes: bare soil or sparse vegetation (0–0.1), medium vegetation cover (0.1–0.3) (dense herbaceous vegetation and shrubs) and high vegetation cover (>0.3) (shrubs and trees). NDVI images for March/April (spring) and October/November (autumn) per time period were used to avoid inaccurate masking of bare soil. More specifically, based on the phenology of the flora in the region, if NDVI values for spring and autumn remained <0.1 [47] then the area was considered bare soil and thus masked out of the image.
N D V I = N I R R E D N I R + R E D
Classification of A. saligna and H. subaxillaris was done using 70% (random spatial subset) of the data of live plant accessions obtained from INPA, GBIF, and the field data collection campaign. The live plant accessions were spatially rarified that only one GPS record per species fall per pixel. We used masked satellite images (Blue, Green Red, NIR, SWIR1, and SWIR2 bands) from spring for the classification of A. saligna and satellite images from autumn for H. subaxillaris based on their yellowish flowering period. The classification was performed in ESRI ArcGIS using the Maximum Likelihood Classifier (https://desktop.arcgis.com/en/arcmap/10.3/tools/spatial-analyst-toolbox/how-maximum-likelihood-classification-works.htm (accessed on 11 January 2022)). Maximum Likelihood Classifier appeared to be a better fit than the spectral unmixing approach due to poor representation of the pure end-member pixels in our research area. In the first step, we used live tree accessions with a 15-m buffer for the collection of a spectral reference for A. saligna and H. subaxillaris. The classification was done separately for each species by applying a rejection fraction of 95%. The rejection fraction defines the likelihood of each pixel to be classified into the related class based on the corresponding reference spectra. After individual classification of A. saligna and H. subaxillaris we have combined two layers in one classification map.

2.6. Modeling Expansion and Future Projections of the Plant Distributions

The data analyses were based on the following assumptions: Due to the relatively low diversity of flora in the sand dunes, the alien species have the advantage of rapid expansion and will cover most of the vacant areas. Vacant areas are defined as bare ground and areas with sparse annual vegetation which senesces by midsummer and will not reach built-up areas. Therefore, after senescence, potential vacant areas increase in size, giving the opportunity to the invasive species to take over. Additionally, we assume that expansion of the herbaceous plant, H. subaxillaris, and the tree species, A. saligna, will go through the following phases: domination of H. subaxillaris, increasing shared area of H. subaxillaris and A. saligna and domination of A. saligna.
Based on previous studies on expansion rates of perennial vegetation, we assumed that native trees and shrubs (other than our focal invasive species) will not change significantly between 2020 and 2100 within the research area (with an average change of 20% per 100 years) [48,49]. Furthermore, 2020 is considered the baseline for urban development and abiotic characteristics remain within the range of conditions of the period 1990–2020. In order to comprehend the behavior of each invasive species individually, as well as together, we developed three possible scenarios: Scenario I—expansion of H. subaxillaris while A. saligna remains unchanged; Scenario II—expansion of A. saligna, while H. subaxillaris remains unchanged; and Scenario III—A. saligna and H subaxillaris expand simultaneously creating land covers of exclusively A. saligna or H. subaxillaris, as well as land covered by a mix of both plant species.
Modeling of the potential expansion of the focal species was based on the CA modeling approach of the Simulation of Land-use Change Using R (SIMLANDER) package [37]. This approach simulates the expansion of the invasive species based on past changes in plant occurrences. Suitability and probability analyses of the landscape matrix define the potential of the geographic grid to be occupied by the target species at time point x. The procedure of CA modeling includes several steps: (1) producing the land cover (LC) maps for different time periods: H. subaxillaris, A. saligna, vacant/bare/open areas; (2) constructing suitability maps based on Euclidean distance from the source plant (i.e. H. subaxillaris and A. saligna), distance from the seashore (as salt sprays limit the re-vegetation processes); (3) constructing transition probability maps based on LC changes from time i to time i + x (where i is time zero and x are the coming years) and remaining vacant areas: areas that are vacant and closer to the source plant have high probabilities and rate of plant spread (or how many grids remain vacant) is adjusted after each simulation cycle (from 1990 to 2020, 5 years segments); (4) accuracy assessment of the simulated expansion using the kappa statistic; (5) training and validation of the models for future plant expansion; and (6) producing future projections of focal plant expansion.
Simulation of the expansion was done using neighboring rule nsize = 9 (number of pixels/grids for moving window) r = 1, rules = 100, 50, 0 [50,51]. Post simulation, the results were assessed with the kappa statistic using the live plant accessions obtained from INPA, GBIF, and the field campaign. Simulated maps for the time period 1990–2020 for A. saligna and 2000–2020 for H. subaxillaris were used for training the future forecast of plant expansion. Training the future forecast was based on: 1990–2015 simulation maps (from the previous step) for A. saligna and 2000- 2015 for H. subaxillaris, respectively, and 2015–2020 for validation of the plant spread forecast. The following forecast models were tested using the FORECAST R package for time series analysis: auto regressive integrated moving average (ARIMA), linear exponential smoothing (HOLT) and exponential smoothing state-space model with Box-Cox transformation (TBATS). Model evaluation and validation were based on the Akaike Information Criterion (AIC), root mean square error (RMSE), and mean absolute percentage error (MAPE). The best models with the lowest error were used for the estimation of focal species expansion.

2.7. Accuracy Assessment of Remote Sensing Classification and the Plant Expansion Model

Accuracy assessment of the remote sensing classification of the focal species and simulated plant expansion was done using the kappa statistic [52]. Prior to the classification and the modeling, we divided the live plant accessions (collected from the local archives—INPA, GBIF, and field campaign) into two: 70% and 30% training and testing datasets, respectively. We calculated the accuracy measures (overall accuracy, producer’s accuracy, user’s accuracy, and kappa coefficient) of the results based on 30% of the live plant accessions.

2.8. Landscape Studies

Evaluation of the landscape dynamics was based on the following landscape parameters: Proximity index (Equation (2)), Number of individual patches of the focal species, and Shannon diversity index (Equation (3)) for landscape heterogeneity. Landscape metrics were calculated using Fragstat software (https://www.fs.usda.gov/treesearch/pubs/3064 (accessed on 11 January 2022)).
Proximity = s = 1 n ( a ijs h ijs 2 ) .  
aijs = area (m2) of the patch ijs within the specified neighborhood (m) of patch ij.
h ijs 2 = distance (m) between patch ijs, based on patch edge–to-edge distance, computed from cell center to cell center.
Shannon Diversity Index   ( H ) = j = 1 S p i ln p i
.
p = number of individual land cover class grids divided by the total number of grids in the area.
S = number of land cover classes in the area.

3. Results

3.1. Remote Sensing Classification of A. saligna and H. subaxillaris

The classification results for 1990, 1995, 2000, 2010 and 2020 are shown in Figure 2. The overall accuracy of the classification maps for H. subaxillaris and A. saligna for the selected years varied between 85–86% and 87–94 %; the kappa coefficient varied between 0.64–0.7 and 0.71–0.82, respectively (Table 1). It should be noted that due to the absence of live accession data for H. subaxillaris for 1990 and 1995, we were not able to conduct the classification. Consequently, maps of these years are missing for this plant species.
The surface area (Table 2) covered by A. saligna, obtained from the remote sensing classification results, decreased from 39 km2 in 1990 to 24 km2 in 1995, probably following an eradication attempt, and then increased to 75 km2 in 2020—more than tripling its cover in 25 years. The surface area covered by H. subaxillaris decreased from 17 km2 to 10 km2 in 2005 and then increased to 55 km2 in 2020, increasing its cover by more than five-fold in 20 years. Additionally, the decrease in surface area coverage in both cases was found to be negatively correlated to the number of dry months per year. More specifically, A. saligna cover area was negatively correlated to the number of dry months per year with a 5-year lag (Pearson’s r = −0.6, p < 0.05) while H. subaxillaris was negatively correlated to the number of dry months per year without a lag effect (Pearson’s r = −0.5, p < 0.05). Furthermore, based on layer overlay, the focal species shared about 1 km2 of surface area in 2000; this shared area increased to 25.9 km2 in 2020. The total area covered by both species thus increased from ~49 km2 in 2000 to ~127 km2 in 2020 and the vacant area (bare soil and annual herbaceous vegetation land cover) decreased gradually from 720 km2 (92% of total available open area) to 640 km2 (82% of total available open area).

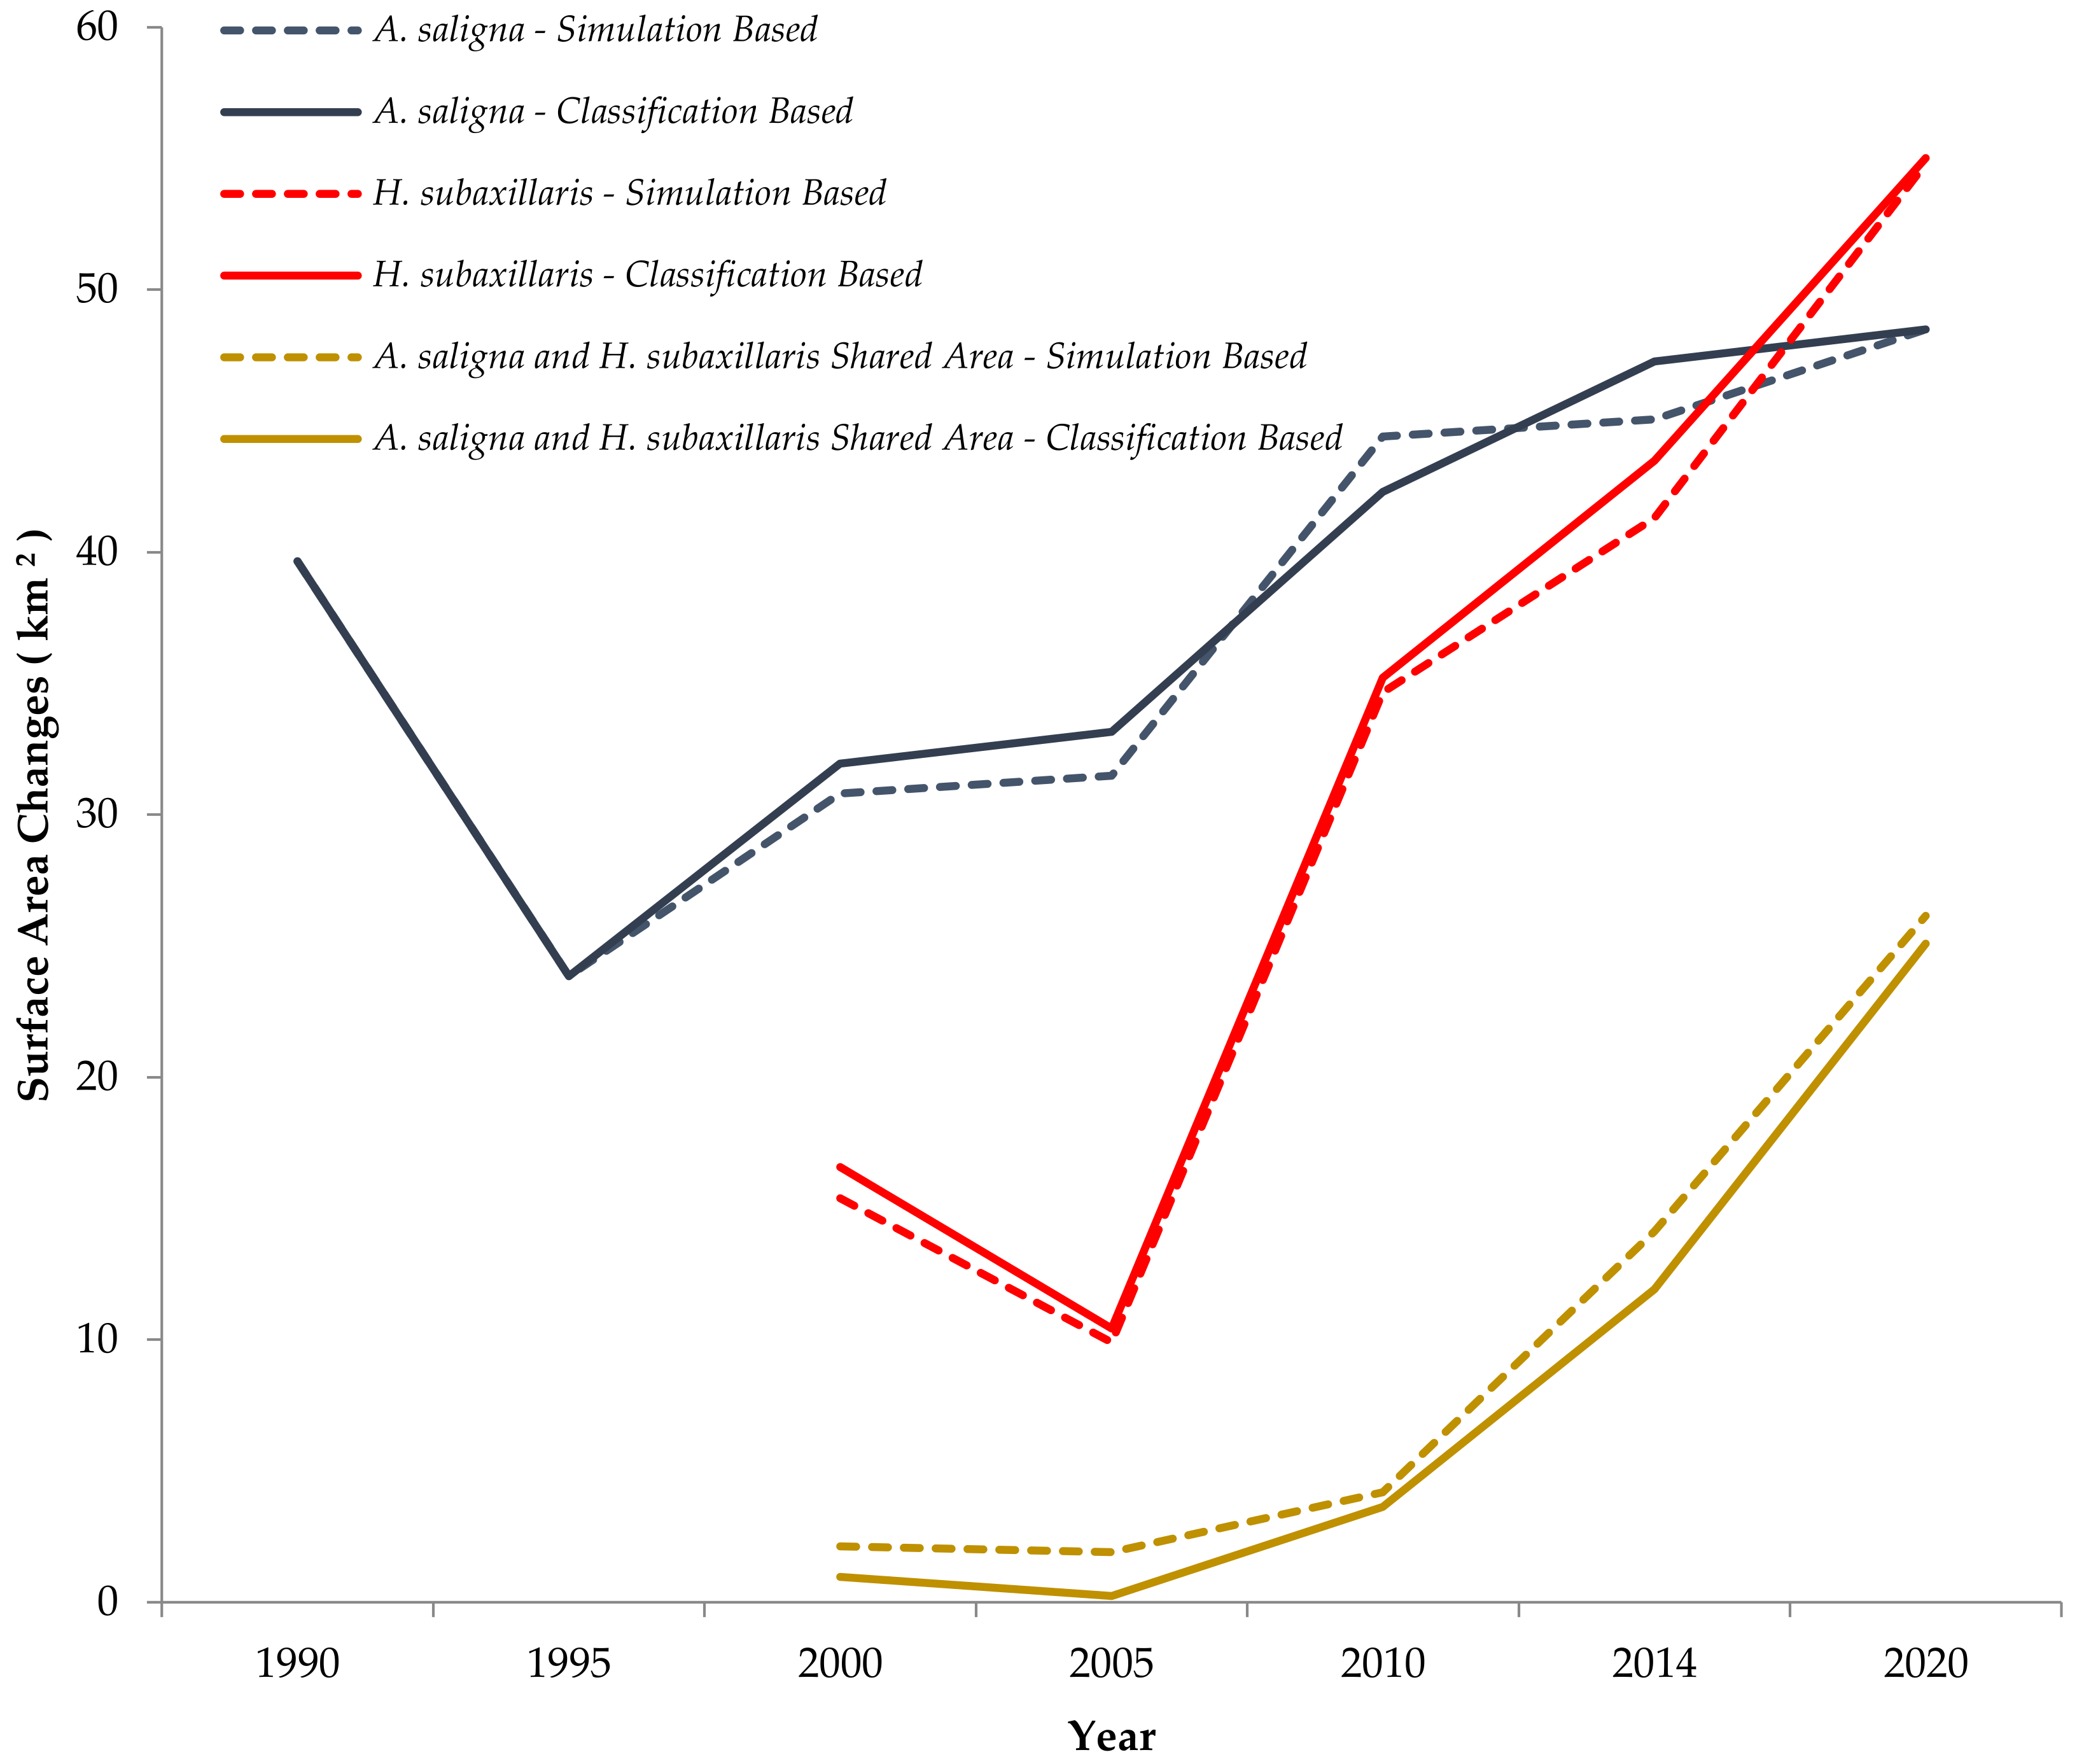
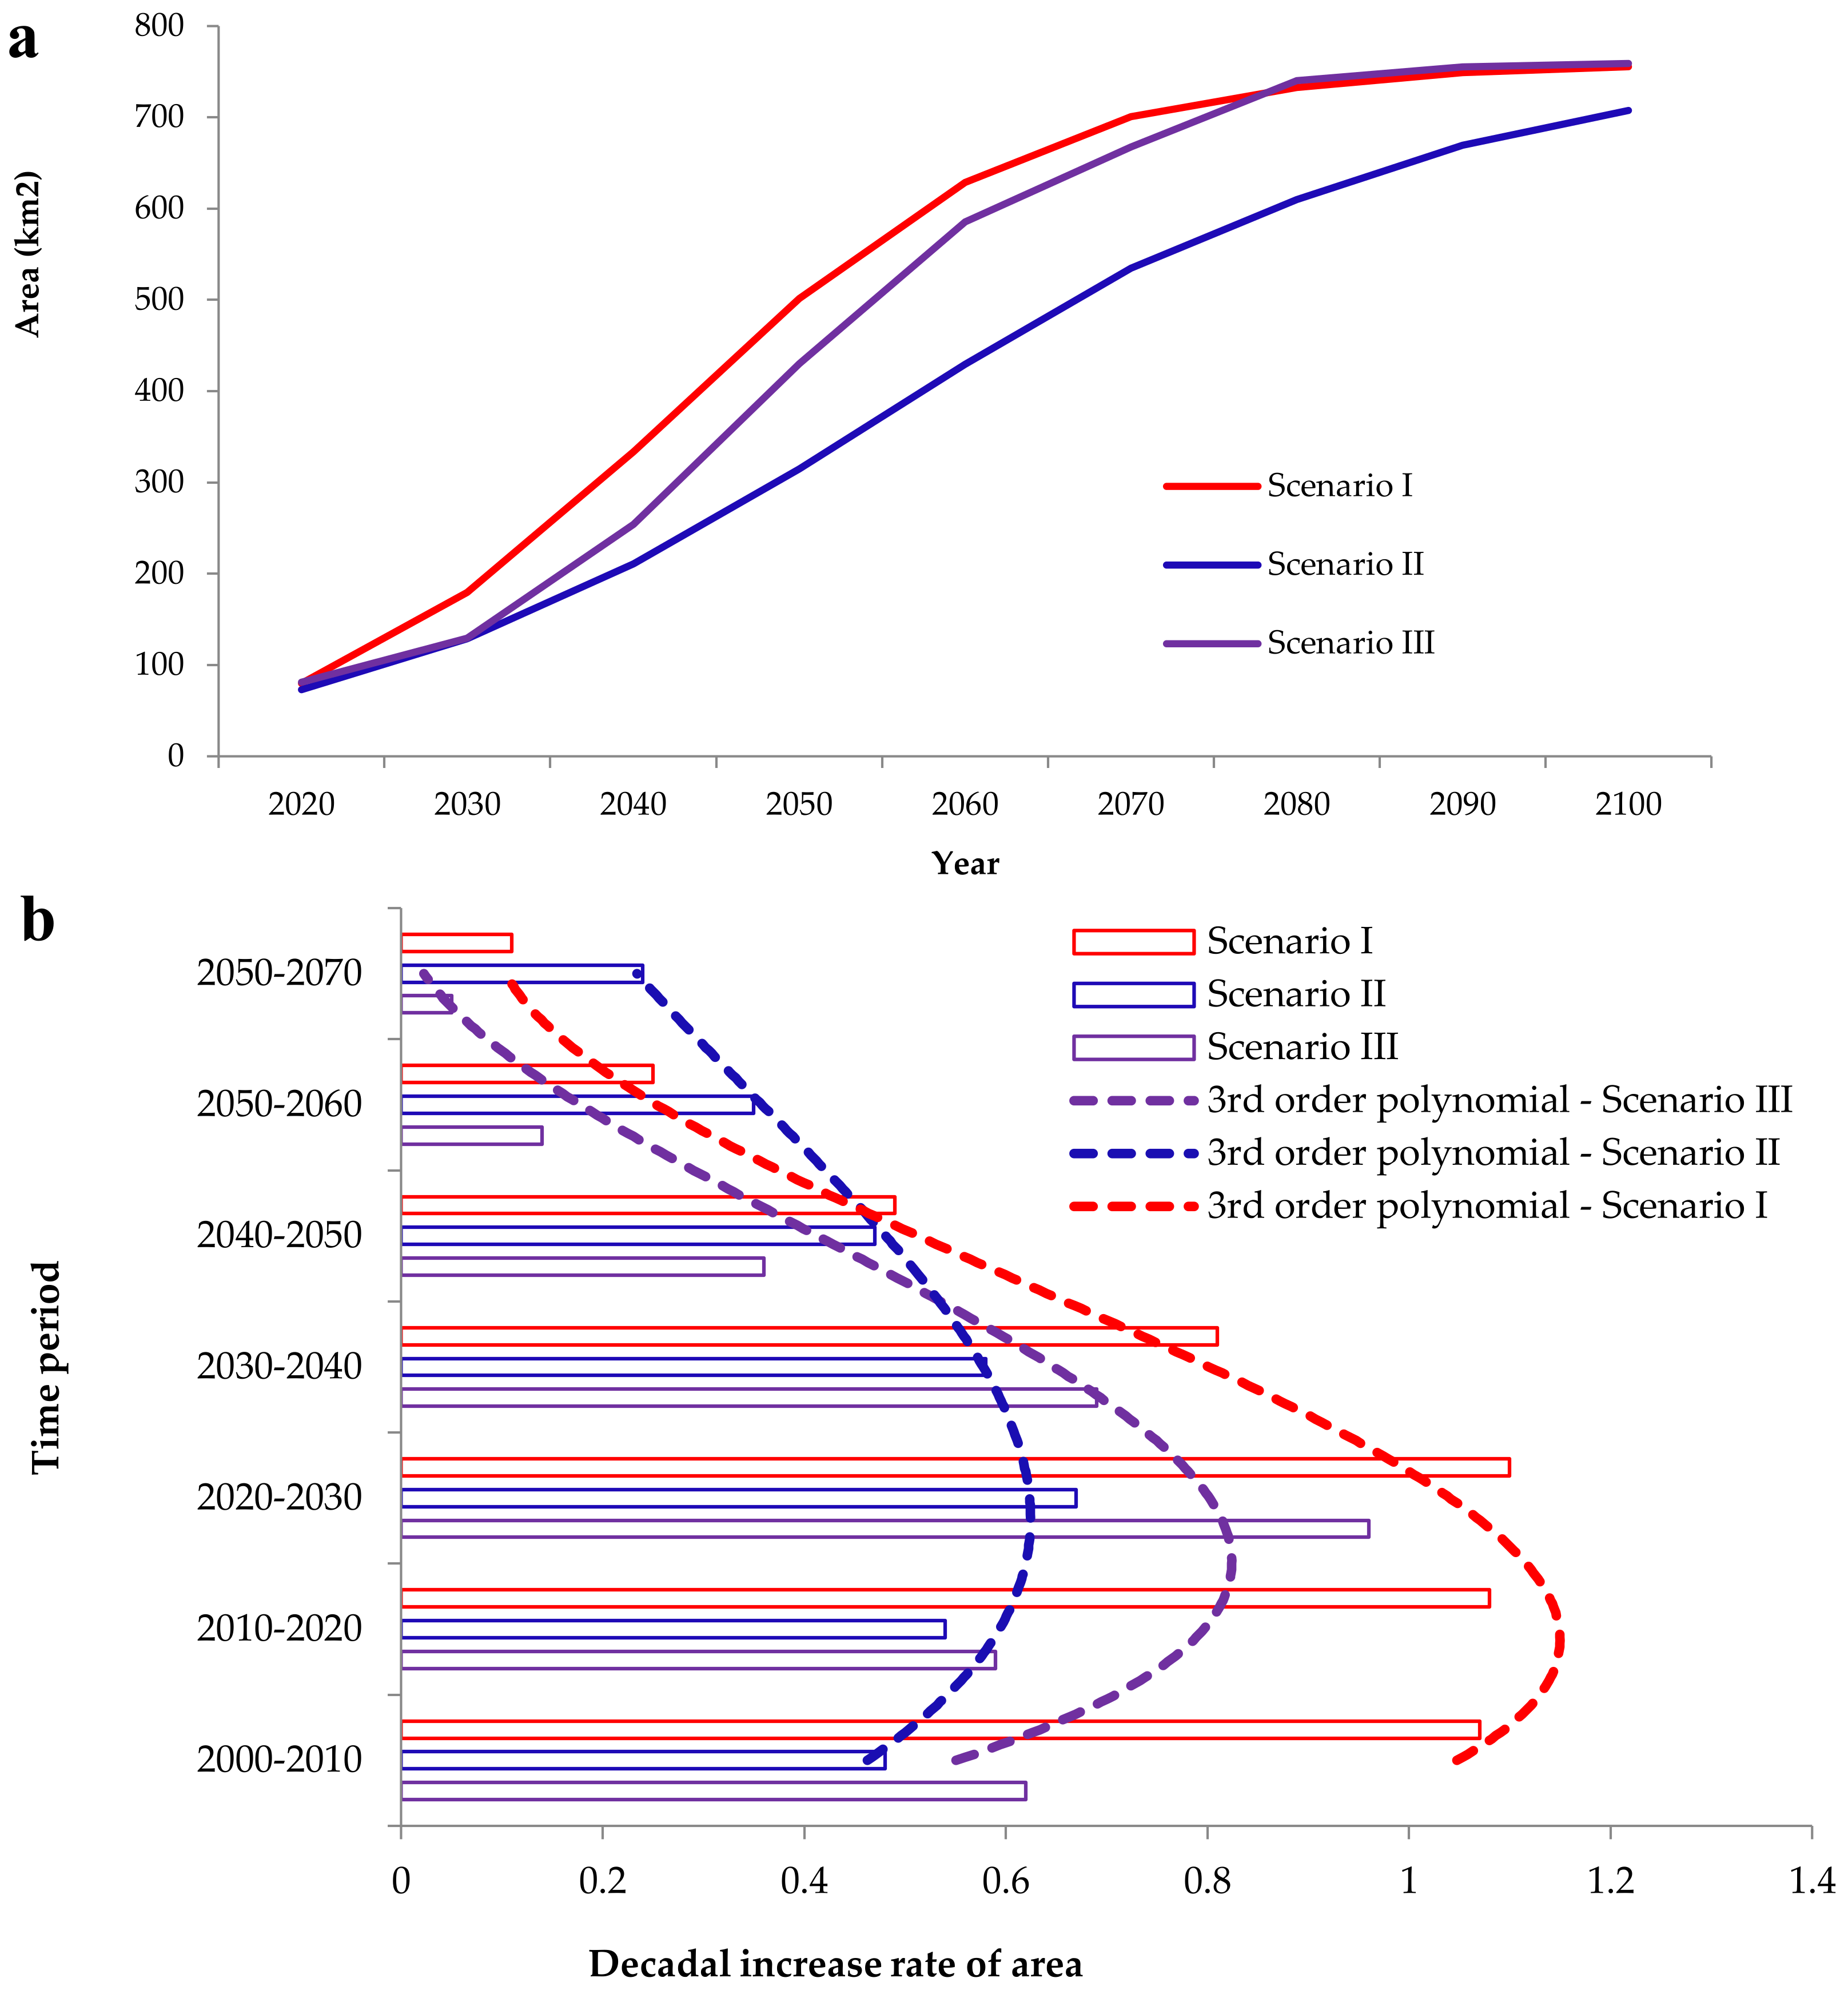
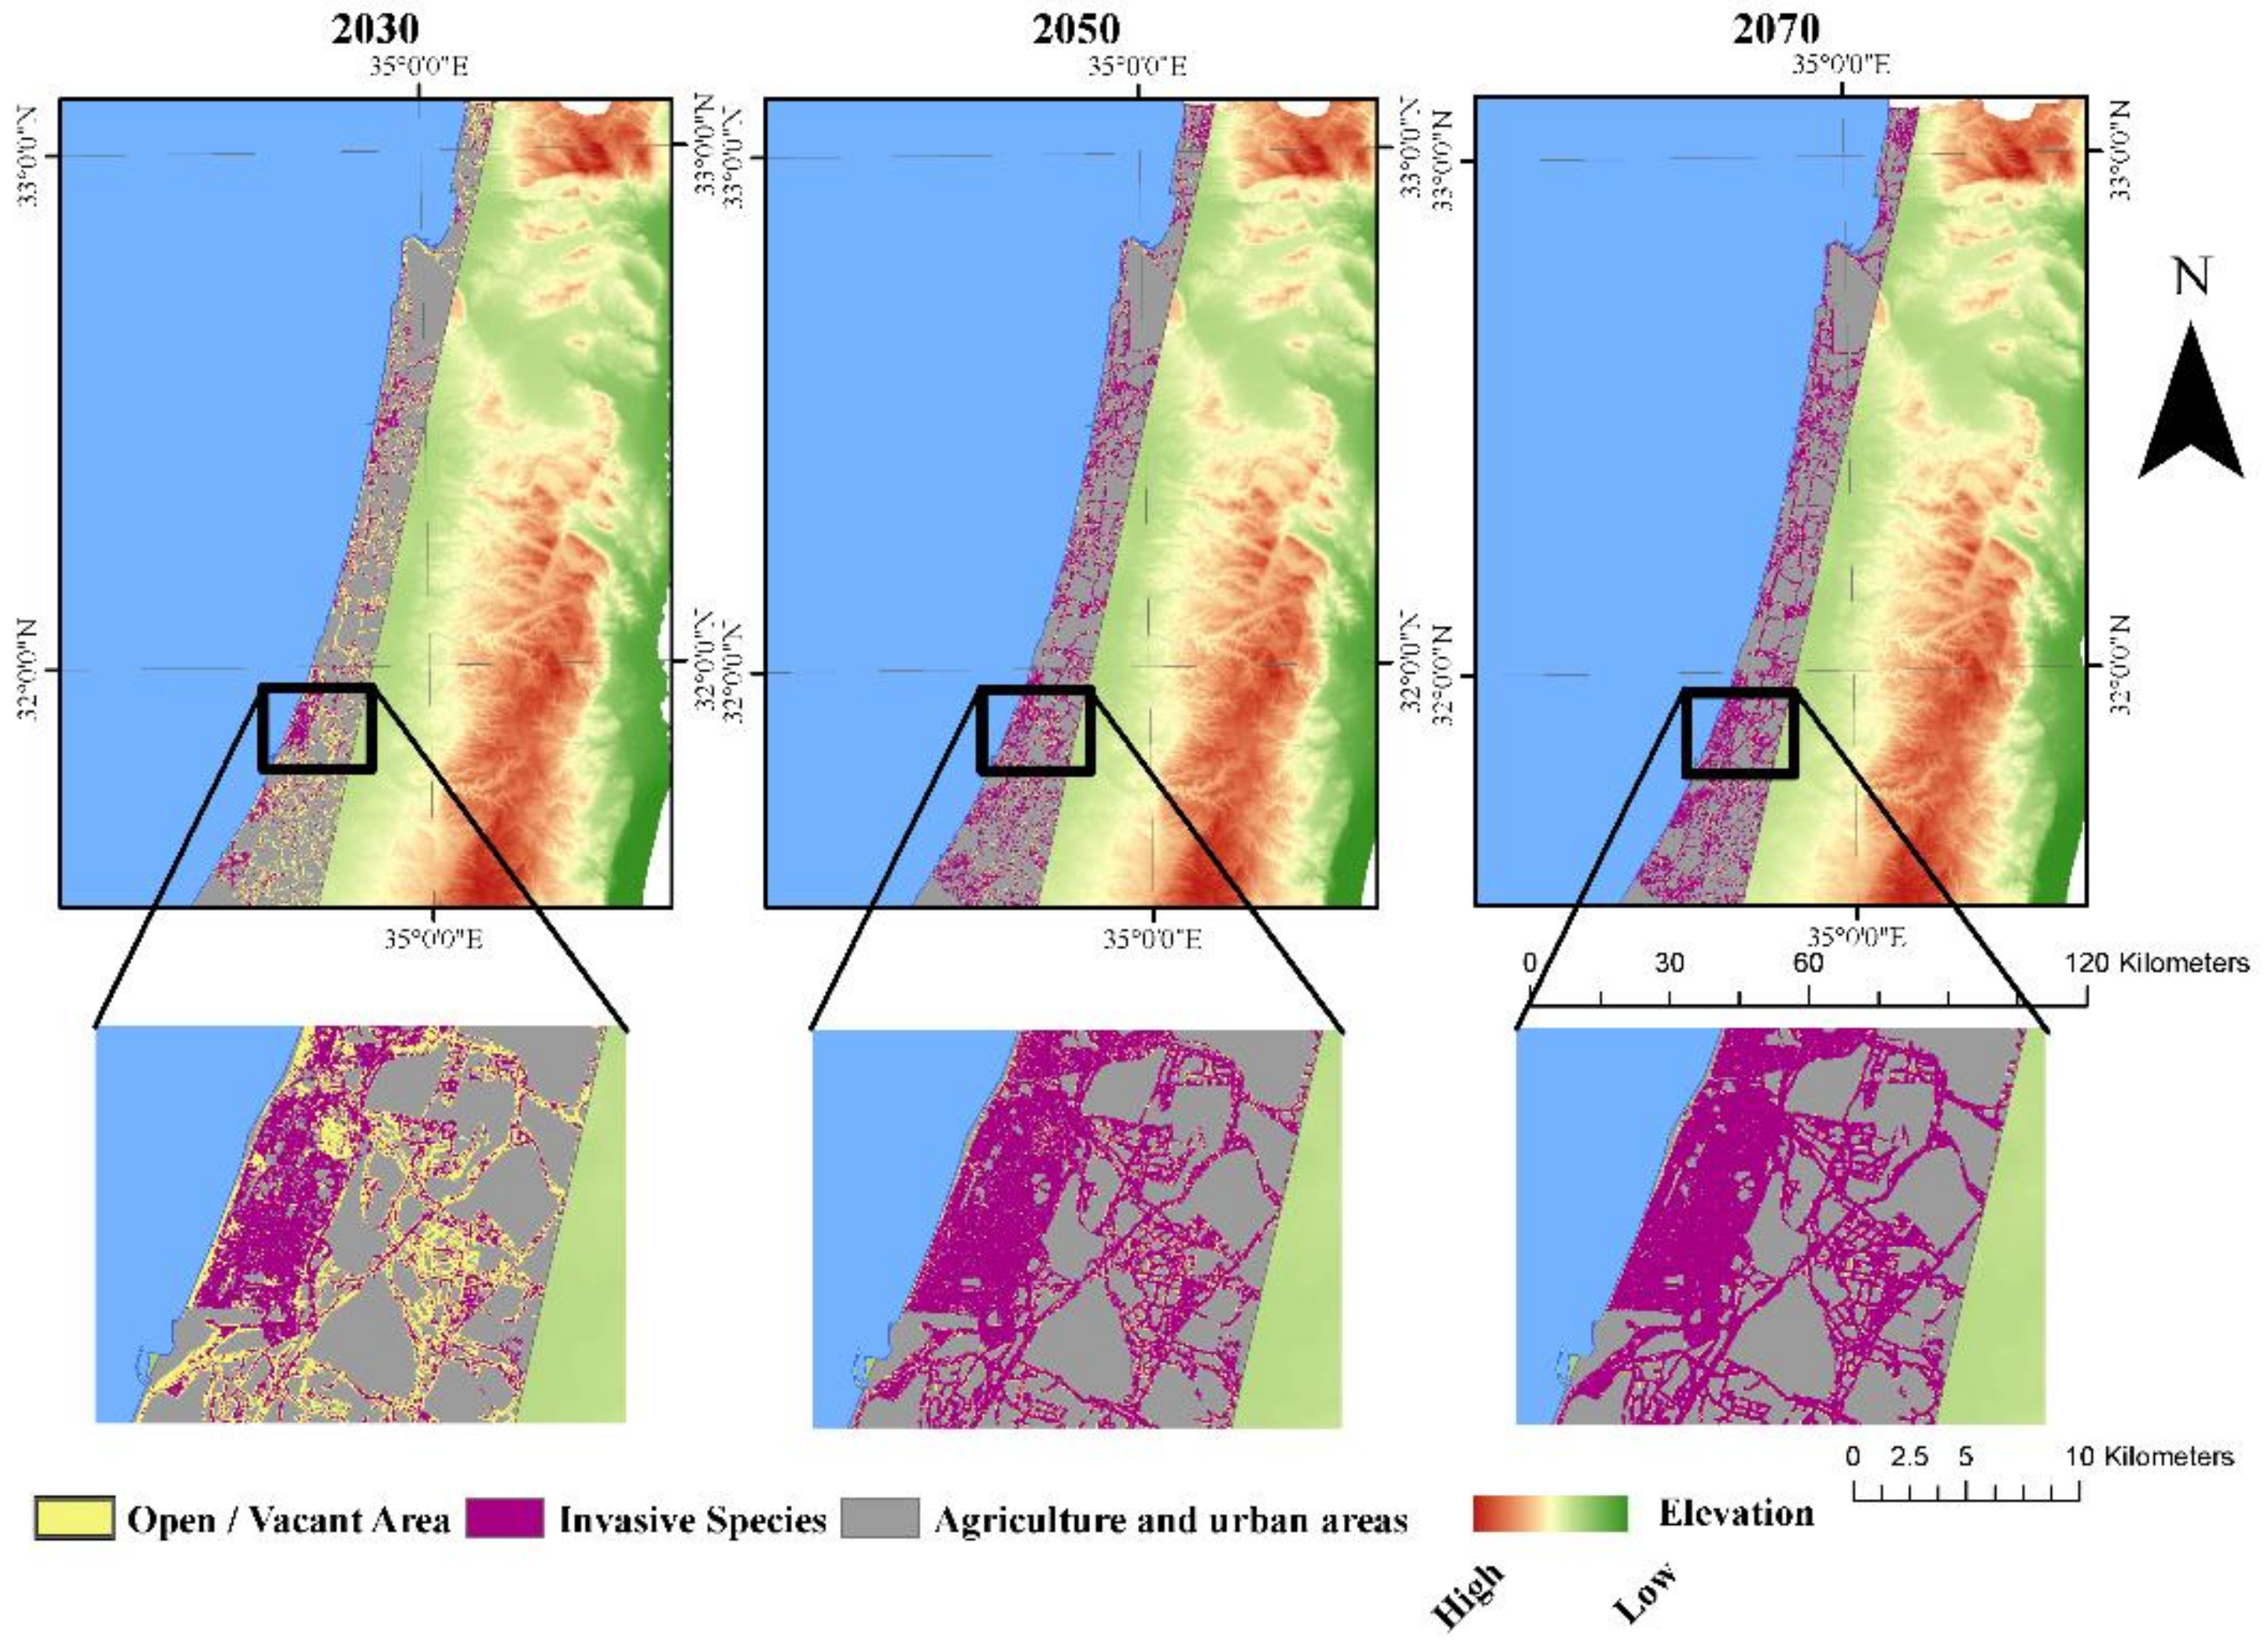
3.2. Simulation of Focal Species Expansion from 1990 to 2020 and Modeling Future Cover for the Period 2020–2100

Remote sensing classification maps and related surface areas (Table 2 and Figure 2) were used to simulate the expansion of A. saligna and H. subaxillaris and train the models for the future forecast. The simulated expansion of A. saligna and H. subaxillaris for the period 1990–2020, based on remote sensing classification maps, resulted in the average overall accuracy of 81.9 ± 1.9% and 81.8 ± 3.7% and kappa coefficients of 0.52 ± 0.06 and 0.53 ± 0.05, respectively (Appendix A Table A3). The simulated surface area shared by A. saligna and H. subaxillaris was slightly higher than the corresponding surface areas extracted from the remote sensing-based classification maps (Figure 3). Overall, the differences between simulated vs classification-based results were 1.63 ± 0.79 km2, 1.01 ± 0.84 km2, and 0.62 ± 1.68 km2 for shared areas of both focal species, H. subaxillaris alone and A. saligna alone, respectively.
We used the simulated expansion results (Figure 3) to train the model for potential species expansion in the future. The best performed model accuracies were AIC = 68.8, RMSE = 1.33 and MAPE = 1.85 for A. saligna and AIC = 58.1, RMSE = 2.32 and MAPE = 3.79 for H. subaxillaris. Validation accuracies of the forecast were RMSE—0.22 and 0.42—and MAPE—0.22 and 0.47—for A. saligna and H. subaxillaris, respectively (Table A4).
The future potential expansion of the focal species was simulated in three different scenarios: Scenario I—expansion of H. subaxillaris while A. saligna remains unchanged, Scenario II—expansion of A. saligna while H. subaxillaris remains unchanged, and Scenario III—both species develop and expand simultaneously (Figure 4).
Scenario I—hypothetical: Based on remote sensing classification maps, H. subaxillaris currently covers 81 km2 and the total available vacant area (i.e., available for further colonization and establishment) is currently estimated at 640 km2. Under conditions of no competition with A. saligna, and assuming the other perennial native vegetation remains constant, H. subaxillaris will fully cover the remaining vacant area by 2070 (Figure 4a). The rate of increase in surface area covered by H. subaxillaris per decade rises from >0.8 to 1.1 from 2000 to 2040 until more than 50% of the open area is colonized by this species, and then drops gradually down to 0.1 by 2060–2070 (Figure 4b).
Scenario II—hypothetical: Based on remote sensing classification maps, A. saligna currently covers approximately 78 km2 and the total available vacant area is currently estimated at 640 km2. Under conditions of no competition with H. subaxillaris, and assuming the other perennial native vegetation remains constant, A. saligna will cover most of the remaining open areas by 2100 (Figure 4a). The rate of increase of A. saligna surface area per decade varies from 0.5 to 0.7 between 2000 and 2050 and then decreases gradually to 0.25 by 2070 (Figure 4b).
Scenario III—realistic: Based on remote sensing classification maps, currently, H. subaxillaris and A. saligna together cover approximately 130 km2, of which 25.9 km2 is shared by both species. The total remaining vacant area within the research area is 640 km2. Under the assumption that the other perennial native vegetation remains constant and both invasive focal species are expanding, the available vacant area will be fully covered by them by 2060–2070 (Figure 4a). The growth rate of both invasive species, taken together, remains generally high, >0.6 from 2000 to 2050, and then drops to 0.08 by 2070 (Figure 4b and Figure 5).

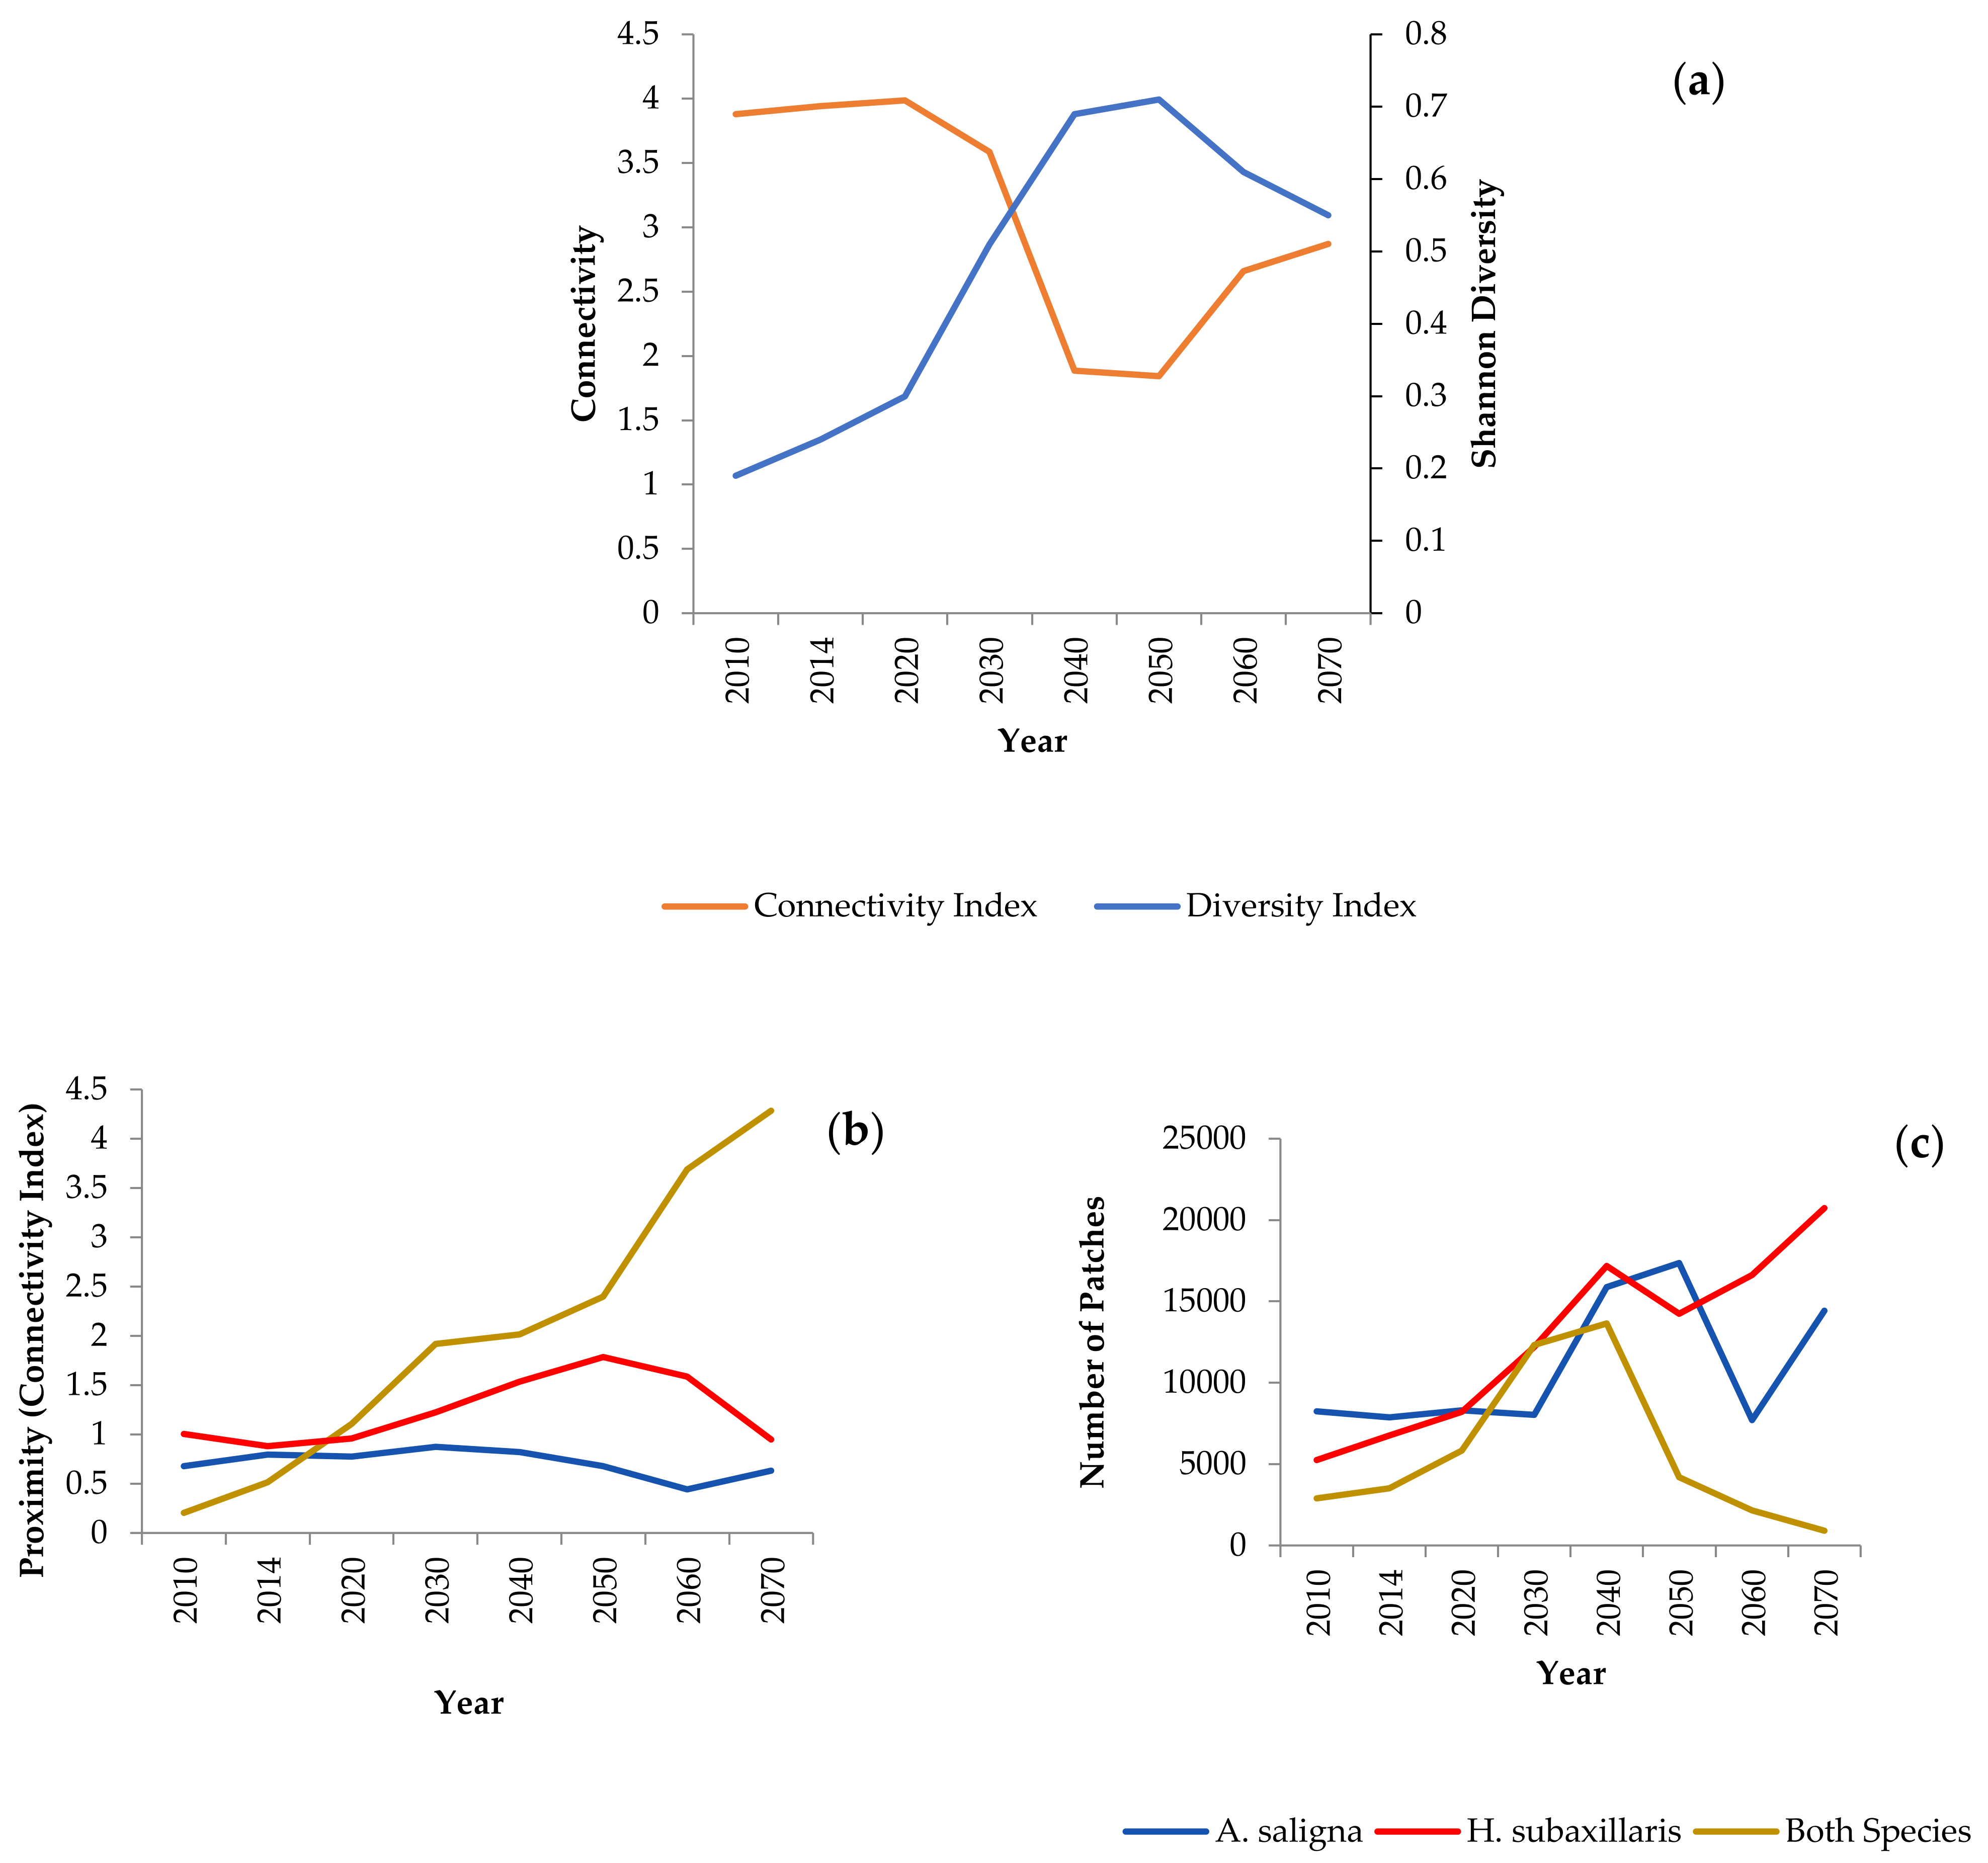
3.3. Landscape Dynamics

For overall analysis of the landscape, we calculated the proximity (connectivity) index and Shannon’s diversity index for past (2010, 2020) and future (2030, 200, 2050, 2060 and 2070) scenarios of plant expansion. The spatial statistical measures were based on the following land cover (LC) classes: open areas, H. subaxillaris, A. saligna, and a mixture of both species. Figure 5 summarizes the trend of spatial dynamics in the research area. Connectivity within the landscape matrix is high from 2010 to 2030 (as more open areas are available) and then gradually decreases from 2040 to 2070 (as vacant areas for plants decrease due to the massive expansion). Diversity of the landscape has an opposite trend to landscape connectivity in the area (Figure 6a).
More detailed analyses of landscape dynamics per land cover class are presented in Figure 6b,c. Connectivity of A. saligna and H. subaxillaris remains relatively stable from 2010 to 2070. It is accompanied by increasing numbers of standalone patches. In contrast, the areas shared by both focal species become highly connected (Figure 6b) as the small standalone patches merge (Figure 6c). This dynamic process creates a strongly patchy landscape matrix dominated by mixed invasive plant clusters.

4. Discussion

4.1. Land Cover Changes of A. saligna and H. subaxillaris and Their Expansion Rate from 2000 to 2020

The importance of monitoring invasive plant species expansion has been broadly highlighted in the scientific literature mostly due to their negative effects on the ecosystems to which they are introduced. However, studies with some background knowledge about their past dynamics and progression, including future projections, are still limited. The results of this study demonstrated a potential solution to studying the dynamics of plant expansion: Landsat time series integrated with a grid-based spatial analysis approach. Additionally, our analyses provide a comprehensive view of the expansion of A. saligna and H. subaxillaris from 1990 to 2020, and future projections using the CA modeling approach. Integration of the Landsat time series with live plant accessions from the field using the maximum likelihood classifier (MLC) enabled us to classify and map A. saligna and H. subaxillaris with considerable overall accuracy (85–94%; Table 1 and Table 2). Other, more complex remote sensing classifiers such as support vector machines or random forests have higher accuracy performances [53,54,55]. However, Li et al., showed non-significant variation in accuracy measures of various classifiers using Landsat thematic mapper for classification of urban, agriculture, water, and several distinctive vegetation classes [56]. Nevertheless, we must acknowledge the limitation of using coarse spatial resolution Landsat images, which may cause misidentification of specific plant species due to high plant species richness within the available grid size [57,58]. However, this satellite product represents the one and only, freely available global data source covering the period since 1980 and allows us to study the long-term expansion of our focal species. Moreover, the global coverage of the Landsat time series makes our work easily reproducible for other invasive plant species in different geographic regions.
Based on our remote sensing analysis, the herbaceous H. subaxillaris showed a higher expansion rate (approximately 107% per decade from 2000 to 2020) and reached ~81 km2 (55.0 km2 H. subaxillaris patches and 25 km2 shared with A. saligna) from 2000 to 2020, compared to the tree species, A. saligna (approximately 50% per decade from 2000 to 2020). The higher expansion rate of the herbaceous species can be explained by several factors, such as rapid development, easily adaptable nature to the environment with limited resources, and most of all, phenology. Flowering by H. subaxillaris begins in late October and may last until April of the following year [43]. During the flowering period and seed development of H. subaxillaris, other annual vegetation has already senesced, giving the invasive species the opportunity to establish not only in open bare soil areas but also to take over the places covered by the dry herbaceous vegetation. In contrast, the flowering period of A. saligna overlaps with the vegetative period of other plant species in the region (late February to mid-April). Despite the natural competition for resources and pollinators with local flora, A. saligna easily manages rapid expansion due to its fast developmental cycle, as it can reach up to 8 m in height in just a 4–5-year period [59]. Although the life cycle of A. saligna is approximately 20 years, there is constant repopulation through the new seedling establishment and vegetative growth that gives very low chances to other plant species to take over [60].

4.2. Future Projections of A. saligna and H. subaxillaris Expansion

The dynamics of the invasive species derived from our analysis generate a concern about their ability to expand quickly and raise the question: can we estimate the pattern and time when both plant species saturate the whole coastal dune area leaving no extra space for the development of native flora?
As a reminder, the future potential expansion of A. saligna and H. subaxillaris was estimated under certain assumptions: that expansion of native tree and shrub species does not exceed 20% of their current coverage [48,49,61] from 2020 to 2100; and that the built-up area remains as of today. In the single species expansion scenarios (Figure 4), which assume that the competing invasive species is kept constant as of 2020, H. subaxillaris remains the most aggressive invader, and depletes the available area by 2070, in comparison to A. saligna, which will potentially cover the entire research area by 2100 (Figure 4). Besides the advantages of its reproductive phase, which overlaps with the beginning of the rainy season and senesced herbaceous vegetation, H. subaxillaris has seeds both with and without a pappus [43]. This may explain the high rate of expansion in general and justify the future simulated trends shown by our analyses, as the duality in seed morphology expedites the dispersal of seeds not only close to the source plant but also at a considerable distance when carried by the wind (seeds with a pappus) [62,63]. Although H. subaxillaris is the faster colonizer, we assume that the tree species, A. saligna, has the potential to gradually take over the places colonized by the herbaceous invader. Acacia saligna is known for its high biomass production (annual yield 1.5–10 m3 ha−1; [59] and considerably long-lived seed bank [64], which may suppress the germination of seeds of co-occurring plant species, therefore hindering the restoration of the flora. Moreover, intensified urban development and the resulting increased disturbance of the area rather favors the focal species by exposing new areas for spread, creating new corridors for seed dispersal, and facilitating expansion. Therefore, based on our analysis we assume that H. subaxillaris will take over the most available areas in the near future until A. saligna claims the areas already colonized by H. subaxillaris. Hence, the areas categorized as shared by both species in the future will become exclusively A. saligna patches (Figure 5).

4.3. Potential Effects of A. saligna and H. subaxillaris on the Landscape Matrix

The increased surface area covered by the invasive plants will affect propagule pressure [65]. One of the model examples of this phenomenon is our research target species, H. subaxillaris, with its current massive coverage of up to approximately 81 km2 (Table 2), which developed from a single population introduced in the north of Israel in the early 1970s [15]. Additionally, future expansion of the focal species will affect landscape heterogeneity as the diversity of the land cover diminishes with time (Figure 6). Although we have not directly tested in this study the heterogeneity–diversity relationships [66,67], nor the projected climate change projections, particularly on rainfall distribution changes [68], we can plausibly assume that the expansion of H. subaxillaris and A. saligna may alter the quality of the landscape matrix and reduce the potential of the area to support the current biodiversity of flora and fauna.

5. Conclusions

Despite the limited availability of historical data, we were able to reconstruct the past cover area of the two focal invasive species using coarse Landsat 5 and OLI time series data with considerable overall accuracy. Reconstruction of the past dynamics of plant expansion enabled us to create future simulation scenarios using a grid-based, spatial modeling approach (Cellular Automata). These findings can be used by environmental decision-makers and land managers to develop an action plan under various scenarios of invasive plant expansion that may affect ecological issues within the coastal plain of Israel. This study represents the first effort to quantify the actual area covered by A. saligna and H. subaxillaris in the region and their potential future expansion trajectories. Yet, questions remain regarding future climate change effects on species abundance and distribution, as well as the ecological costs and consequences of this invasion, which should be addressed in future studies.

Author Contributions

Conceptualization, E.B.D. and M.S.; validation, G.K.; formal analysis, G.K.; investigation, G.K., E.B.D. and M.S.; resources, E.B.D. and M.S.; data curation, G.K.; writing—original draft preparation, G.K.; writing—review, and editing, E.B.D. and M.S.; visualization, G.K.; methodology, E.B.D. and M.S.; funding acquisition, M.S.; project administration, M.S. All authors have read and agreed to the published version of the manuscript.

Funding

This project was carried out within the framework of the: “Developing state-of-the art remote sensing tools for ecological monitoring of invasive plant species in coastal ecosystems in Israel and Italy—DERESEMII”, research project number 3-16014 funded by the Israel Ministry of Science & Technology in cooperation with the Italian Ministry of Foreign Affairs and International Cooperation. Dr. Giorgi Kozhoridze was supported by Tel Aviv University Rector’s post-doctoral fellowship.

Data Availability Statement

Not applicable.

Acknowledgments

We thank Linor Weisman and Ofer Cohen for field work assistance. We are most grateful to three anonymous reviewers and the Editor of the special issue, Sandra Eckert, for helpful comments and suggestions that have improved the original manuscript.

Conflicts of Interest

The authors declare no conflict of interest. The funders had no role in the design of the study; in the collection, analyses, or interpretation of data; in the writing of the manuscript, or in the decision to publish the results.

Appendix A

Table A1. Live accessions obtained from INPA.
YearA. salignaH. subaxillaris
1990–200047N/A
2000–20055667
2005–2010110156
2010–2015159256
2018–2020357393
Table A2. List of images of Landsat 5 TM and Landsat 8 OLI used in this research.
Image IDSensorDateLevel
LT05_L2SP_175037_19901101_20200915_02_T1TM 51 November 1990L2
LT05_L2SP_175038_19901101_20200915_02_T1TM 51 November 1990L2
LT05_L2SP_174037_19900315_20200916_02_T1TM 515 March 1990L2
LT05_L2SP_174038_19900315_20200916_02_T1TM 515 March 1990L2
LT05_L2SP_175038_19951115_20200912_02_T1TM 515 November 1995L2
LT05_L2SP_175037_19951115_20200912_02_T1TM 515 November 1995L2
LT05_L2SP_175038_19950405_20200912_02_T1TM 55 April 1995L2
LT05_L2SP_175037_19950405_20200912_02_T1TM 55 April 1995L2
LT05_L2SP_175037_20001112_20200906_02_T1TM 512 November 2000L2
LT05_L2SP_175038_20001112_20200906_02_T1TM 512 November 2000L2
LT05_L2SP_174037_20000326_20200907_02_T1TM 526 March 2000L2
LT05_L2SP_174038_20000326_20200907_02_T1TM 526 March 2000L2
LT05_L2SP_175038_20050331_20200902_02_T1TM 531 March 2005L2
LT05_L2SP_175037_20050331_20200902_02_T1TM 531 March 2005L2
LT05_L2SP_174038_20061005_20200831_02_T1TM 55 October 2006L2
LT05_L2SP_174037_20061005_20200831_02_T1TM 55 October 2006L2
LT05_L2SP_175038_20090411_20200828_02_T1TM 511 April 2009L2
LT05_L2SP_175037_20090411_20200828_02_T1TM 511 April 2009L2
LT05_L2SP_175038_20101108_20200823_02_T1TM 518 November 2010L2
LT05_L2SP_175037_20101108_20200823_02_T1TM 518 November 2010L2
LC08_L2SP_174037_20140418_20200911_02_T1OLI 818 April 2014L2
LC08_L2SP_174037_20141027_20200910_02_T1OLI 827 October 2014L2
LC08_L2SP_174038_20140418_20200911_02_T1OLI 818 April 2014L2
LC08_L2SP_174038_20141027_20200910_02_T1OLI 827 October 2014L2
LC08_L2SP_175038_20200308_20200822_02_T1OLI 88 March 2020L2
LC08_L2SP_175037_20200308_20200822_02_T1OLI 88 March 2020L2
LC08_L2SP_175037_20201018_20201105_02_T1OLI 818 October 2020L2
LC08_L2SP_175038_20201018_20201105_02_T1OLI 818 October 2020L2
Table A3. Accuracy assessment of simulated surface area expansion of A. saligna and H. subaxillaris.
H. subaxillarisA. saligna
YearOverall
Accuracy
Kappa
Coefficient
Number of
Samples
Overall
Accuracy
Kappa
Coefficient
Number of
Samples
201079%0.5428083%0.62360
201180%0.5728079%0.5354
201281%0.4524079%0.49326
201384%0.5321684%0.43302
201488%0.4520182%0.47306
201584%0.5815082%0.51293
201685%0.5914882%0.47305
201774%0.4821182%0.54316
201881%0.5417685%0.6326
201980%0.5518480%0.55341
202084%0.6125983%0.63369
Table A4. Training and validation results of forecast models of A. saligna and H. subaxillaris spread.
Model Training
A. saligna 1990–2015ArimaHOLTTBATS
RMSE1.331.552.67
MAPE1.852.695.98
AIC68.892.4109.2
H. subaxillaris (2000–2015)ArimaHOLTTBATS
RMSE2.322.323.5
MAPE3.794.0112.86
AIC58.170.5576
Model Validation (2015–2020)
A. salignaARIMAHOLTTBATS
RMSE0.220.4715.8
MAPE0.220.5920.99
H. subaxillarisARIMAHOLTTBATS
RMSE0.420.4617.7
MAPE0.470.4921.52

References

  1. Hejda, M.; Pyšek, P.; Jarošík, V. Impact of Invasive Plants on the Species Richness, Diversity and Composition of Invaded Communities. J. Ecol. 2009, 97, 393–403. [Google Scholar] [CrossRef]
  2. Wardle, D.A.; Peltzer, D.A. Impacts of Invasive Biota in Forest Ecosystems in an Aboveground–Belowground Context. Biol. Invasions 2017, 19, 3301–3316. [Google Scholar] [CrossRef] [Green Version]
  3. Langmaier, M.; Lapin, K. A Systematic Review of the Impact of Invasive Alien Plants on Forest Regeneration in European Temperate Forests. Front. Plant Sci. 2020, 11, 1349. [Google Scholar] [CrossRef] [PubMed]
  4. Kumar Rai, P.; Singh, J.S. Invasive Alien Plant Species: Their Impact on Environment, Ecosystem Services and Human Health. Ecol. Indic. 2020, 111, 106020. [Google Scholar] [CrossRef] [PubMed]
  5. Kutiel, P.B.; Cohen, O.; Shoshany, M. Invasion Rate of the Alien Species Acacia Saligna within Coastal Sand Dune Habitats in Israel. Isr. J. Plant Sci. 2004, 52, 115–124. [Google Scholar] [CrossRef]
  6. Chechina, M.; Hamann, A. Choosing Species for Reforestation in Diverse Forest Communities: Social Preference versus Ecological Suitability. Ecosphere 2015, 6, 1–13. [Google Scholar] [CrossRef]
  7. Makowski, C.; Finkl, C.W. Impacts of Invasive Species on Coastal Environments: Coast in Crisis; Springer Nature: Berlin, Germany, 2018; ISBN 9783319913827. [Google Scholar]
  8. Brown, A.C.; McLachlan, A. Sandy Shore Ecosystems and the Threats Facing Them: Some Predictions for the Year 2025. Environ. Conserv. 2002, 29, 62–77. [Google Scholar] [CrossRef] [Green Version]
  9. Mijović, A.; Popović, Z.; Vukov, T.; Smiljanić, M.; Matić, R.; Bojović, S. Sand Topography Influences the Distribution of Xerohalophytic Vegetation on a Southern Adriatic Beach in Montenegro. Plant Biosyst. 2012, 146, 664–673. [Google Scholar] [CrossRef]
  10. Farris, E.; Pisanu, S.; Ceccherelli, G.; Filigheddu, R. Human Trampling Effects on Mediterranean Coastal Dune Plants. Plant Biosystems 2013, 147, 1043–1051. [Google Scholar] [CrossRef]
  11. Kutiel, P. Conservation and Management of the Mediterranean Coastal Sand Dunes in Israel. J. Coast. Conserv. 2001, 2, 183–192. [Google Scholar] [CrossRef]
  12. Avis, A.M. A Review of Coastal Dune Stabilization in the Cape Province of South Africa. Landsc. Urban Plan. 1989, 18, 55–68. [Google Scholar] [CrossRef]
  13. Kettenring, K.M.; Adams, C.R. Lessons Learned from Invasive Plant Control Experiments: A Systematic Review and Meta-Analysis. J. Appl. Ecol. 2011, 48, 970–979. [Google Scholar] [CrossRef]
  14. Richardson, D.M.; Rejmánek, M. Trees and Shrubs as Invasive Alien Species—A Global Review. Divers. Distrib. 2011, 17, 788–809. [Google Scholar] [CrossRef]
  15. Dafni, A.; Heller, D. Invasions of Adventive Plants in Israel. In Biological Invasions in Europe and the Mediterranean Basin; Springer: Dodrecht, Germany, 1990; pp. 135–160. [Google Scholar] [CrossRef]
  16. Weidlich, E.W.A.; Flórido, F.G.; Sorrini, T.B.; Brancalion, P.H.S. Controlling Invasive Plant Species in Ecological Restoration: A Global Review. J. Appl. Ecol. 2020, 57, 1806–1817. [Google Scholar] [CrossRef]
  17. Stone, C.M.; Witt, A.B.R.; Walsh, G.C.; Foster, W.A.; Murphy, S.T. Would the Control of Invasive Alien Plants Reduce Malaria Transmission? A Review. Parasites Vectors 2018, 11, 76. [Google Scholar] [CrossRef] [Green Version]
  18. Jones, B.A. Tree Shade, Temperature, and Human Health: Evidence from Invasive Species-Induced Deforestation. Ecol. Econ. 2019, 156, 12–23. [Google Scholar] [CrossRef]
  19. Reaser, J.K.; Meyerson, L.A.; Cronk, Q.; De Poorter, M.; Eldrege, L.G.; Green, E.; Kairo, M.; Latasi, P.; Mack, R.N.; Mauremootoo, J.; et al. Ecological and Socioeconomic Impacts of Invasive Alien Species in Island Ecosystems. Environ. Conserv. 2007, 34, 98–111. [Google Scholar] [CrossRef] [Green Version]
  20. Pyšek, P.; Richardson, D.M. Invasive Species, Environmental Change and Management, and Health. Annu. Rev. Environ. Resour. 2010, 35, 25–55. [Google Scholar] [CrossRef] [Green Version]
  21. Young, H.S.; Parker, I.M.; Gilbert, G.S.; Sofia Guerra, A.; Nunn, C.L. Introduced Species, Disease Ecology, and Biodiversity–Disease Relationships. Trends Ecol. Evol. 2017, 32, 41–54. [Google Scholar] [CrossRef]
  22. Jones, B.A.; McDermott, S.M. Health Impacts of Invasive Species Through an Altered Natural Environment: Assessing Air Pollution Sinks as a Causal Pathway. Environ. Resour. Econ. 2018, 71, 23–43. [Google Scholar] [CrossRef]
  23. Bartz, R.; Kowarik, I. Assessing the Environmental Impacts of Invasive Alien Plants: A Review of Assessment Approaches. NeoBiota 2019, 43, 69–99. [Google Scholar] [CrossRef] [Green Version]
  24. Shrestha, U.B.; Shrestha, B.B. Climate Change Amplifies Plant Invasion Hotspots in Nepal. Divers. Distrib. 2019, 25, 1599–1612. [Google Scholar] [CrossRef] [Green Version]
  25. Jesse, W.A.M.; Molleman, J.; Franken, O.; Lammers, M.; Berg, M.P.; Behm, J.E.; Helmus, M.R.; Ellers, J. Disentangling the Effects of Plant Species Invasion and Urban Development on Arthropod Community Composition. Glob. Change Biol. 2020, 26, 3294–3306. [Google Scholar] [CrossRef] [PubMed] [Green Version]
  26. Pellegrini, E.; Buccheri, M.; Martini, F.; Boscutti, F. Agricultural Land Use Curbs Exotic Invasion but Sustains Native Plant Diversity at Intermediate Levels. Sci. Rep. 2021, 11, 8385. [Google Scholar] [CrossRef]
  27. Har-Edom, O.L.; Sternberg, M. Invasive Species and Climate Change: Conyza Canadensis (L.) Cronquist as a Tool for Assessing the Invasibility of Natural Plant Communities along an Aridity Gradient. Biol. Invasions 2010, 12, 1953–1960. [Google Scholar] [CrossRef]
  28. Adams, V.M.; Petty, A.M.; Douglas, M.M.; Buckley, Y.M.; Ferdinands, K.B.; Okazaki, T.; Ko, D.W.; Setterfield, S.A. Distribution, Demography and Dispersal Model of Spatial Spread of Invasive Plant Populations with Limited Data. Methods Ecol. Evol. 2015, 6, 782–794. [Google Scholar] [CrossRef] [Green Version]
  29. Fournier, A.; Barbet-Massin, M.; Rome, Q.; Courchamp, F. Predicting Species Distribution Combining Multi-Scale Drivers. Glob. Ecol. Conserv. 2017, 12, 215–226. [Google Scholar] [CrossRef]
  30. Manzoor, S.A.; Griffiths, G.; Lukac, M. Species Distribution Model Transferability and Model Grain Size-Finer May Not Always Be Better. Sci. Rep. 2018, 8, 7168. [Google Scholar] [CrossRef] [Green Version]
  31. Lake, T.A.; Briscoe Runquist, R.D.; Moeller, D.A. Predicting Range Expansion of Invasive Species: Pitfalls and Best Practices for Obtaining Biologically Realistic Projections. Divers. Distrib. 2020, 26, 1767–1779. [Google Scholar] [CrossRef]
  32. von Neumann, J. Theory of Self-Reproducing Automata; University of Illionois Press: Champain, IL, USA, 1966. [Google Scholar]
  33. Jongejans, E.; Shea, K.; Skarpaas, O.; Kelly, D.; Sheppard, A.W.; Woodburn, T.L. Dispersal and Demography Contributions to Population Spread of Carduus Nutans in Its Native and Invaded Ranges. J. Ecol. 2008, 96, 687–697. [Google Scholar] [CrossRef]
  34. Berger, U.; Piou, C.; Schiffers, K.; Grimm, V. Competition among Plants: Concepts, Individual-Based Modelling Approaches, and a Proposal for a Future Research Strategy. Perspect. Plant Ecol. Evol. Syst. 2008, 9, 121–135. [Google Scholar] [CrossRef]
  35. Merow, C.; Lafleur, N.; Silander, J.A.; Wilson, A.M.; Rubega, M. Developing Dynamic Mechanistic Species Distribution Models: Predicting Bird-Mediated Spread of Invasive Plants across Northeastern North America. Am. Nat. 2011, 178, 30–43. [Google Scholar] [CrossRef] [PubMed] [Green Version]
  36. Maeda, E.E.; de Almeida, C.M.; de Carvalho Ximenes, A.A.; Formaggio, A.R.; Shimabukuro, Y.E.; Pellikka, P. Dynamic Modeling of Forest Conversion: Simulation of Past and Future Scenarios of Rural Activities Expansion in the Fringes of the Xingu National Park, Brazilian Amazon. Int. J. Appl. Earth Obs. Geoinf. 2011, 13, 435–446. [Google Scholar] [CrossRef]
  37. Hewitt, R.; van Delden, H.; Escobar, F. Participatory Land Use Modelling, Pathways to an Integrated Approach. Environ. Model. Softw. 2014, 52, 149–165. [Google Scholar] [CrossRef]
  38. Lopez, S. Modeling Agricultural Change through Logistic Regression and Cellular Automata: A Case Study on Shifting Cultivation. J. Geogr. Inf. Syst. 2014, 6, 220–235. [Google Scholar] [CrossRef] [Green Version]
  39. George, J.S.; Paul, S.K.; Dhawale, R. A Cellular-Automata Model for Assessing the Sensitivity of the Street Network to Natural Terrain. Ann. GIS 2021, 27, 261–272. [Google Scholar] [CrossRef]
  40. Sternberg, M.; Yu, S.L.; Bar, P. Soil Seed Banks, Habitat Heterogeneity, and Regeneration Strategies in a Mediterranean Coastal Sand Dune. Isr. J. Plant Sci. 2004, 52, 213–221. [Google Scholar] [CrossRef] [Green Version]
  41. Stanley, T.D.; Ross, E.M. Flora of South-Eastern Queensland; Queensland Department of Primary Industries: Brisbane, Australia, 1983; Volume 1. [Google Scholar]
  42. Sternberg, M. From America to the Holy Land: Disentangling Plant Traits of the Invasive Heterotheca subaxillaris (Lam.) Britton & Rusby. Plant Ecol. 2016, 217, 1307–1314. [Google Scholar] [CrossRef]
  43. Nativ, R.; Ephrath, J.E.; Berliner, P.R.; Saranga, Y. Drought Resistance and Water Use Efficiency in Acacia saligna. Aust. J. Bot. 1999, 47, 577–586. [Google Scholar] [CrossRef]
  44. Morimoto, M.; Cantrell, C.L.; Libous-Bailey, L.; Duke, S.O. Phytotoxicity of Constituents of Glandular Trichomes and the Leaf Surface of Camphorweed, Heterotheca Subaxillaris. Phytochemistry 2009, 70, 69–74. [Google Scholar] [CrossRef]
  45. El-Gendy, S.A.; Abd Elmoniem, E.M.; Al-Abdulla, M.M.; Eisa, S.S. Morphological and Physiological Responses of Acacia saligna (Labill.) to Water Stress. Aust. J. Basic Appl. Sci. 2012, 6, 90–97. [Google Scholar]
  46. Holben, B.N. Characteristics of Maximum-Value Composite Images from Temporal AVHRR Data. Int. J. Remote Sens. 1986, 7, 1417–1434. [Google Scholar] [CrossRef]
  47. Weier, J.; Herring, D. Measuring Vegetation (NDVI & EVI)—Normalized Difference Vegetation Index (NDVI); NASA Earth Observatory: Greenbelt, MD, USA, 2000. [Google Scholar]
  48. Fone, A.L. A Comparative Demographic Study of Annual and Perennial Hypochoeris (Asteraceae). J. Ecol. 1989, 77, 495–508. [Google Scholar] [CrossRef]
  49. Brodie, J.F.; Roland, C.A.; Stehn, S.E.; Smirnova, E. Variability in the Expansion of Trees and Shrubs in Boreal Alaska. Ecology 2019, 100, e02660. [Google Scholar] [CrossRef]
  50. Hagoort, M.; Geertman, S.; Ottens, H. Spatial Externalities, Neighbourhood Rules and CA Land-Use Modelling. Ann. Reg. Sci. 2008, 42, 39–56. [Google Scholar] [CrossRef]
  51. Liao, J.; Tang, L.; Shao, G.; Su, X.; Chen, D.; Xu, T. Incorporation of Extended Neighborhood Mechanisms and Its Impact on Urban Land-Use Cellular Automata Simulations. Environ. Model. Softw. 2016, 75, 163–175. [Google Scholar] [CrossRef] [Green Version]
  52. Congalton, R.G. A Review of Assessing the Accuracy of Classifications of Remotely Sensed Data. Remote Sens. Environ. 1991, 37, 35–46. [Google Scholar] [CrossRef]
  53. Dabija, A.; Kluczek, M.; Zagajewski, B.; Raczko, E.; Kycko, M.; Al-Sulttani, A.H.; Tardà, A.; Pineda, L.; Corbera, J. Comparison of Support Vector Machines and Random Forests for Corine Land Cover Mapping. Remote Sens. 2021, 13, 777. [Google Scholar] [CrossRef]
  54. Sheykhmousa, M.; Mahdianpari, M.; Ghanbari, H.; Mohammadimanesh, F.; Ghamisi, P.; Homayouni, S. Support Vector Machine Versus Random Forest for Remote Sensing Image Classification: A Meta-Analysis and Systematic Review. IEEE J. Sel. Top. Appl. Earth Observ. Remote Sens. 2020, 13, 6308–6325. [Google Scholar] [CrossRef]
  55. Huang, C.; Davis, L.S.; Townshend, J.R.G. An Assessment of Support Vector Machines for Land Cover Classification. Int. J. Remote Sens. 2002, 23, 725–749. [Google Scholar] [CrossRef]
  56. Li, C.; Wang, J.; Wang, L.; Hu, L.; Gong, P. Comparison of Classification Algorithms and Training Sample Sizes in Urban Land Classification with Landsat Thematic Mapper Imagery. Remote Sens. 2014, 6, 964–983. [Google Scholar] [CrossRef] [Green Version]
  57. Xie, Y.; Sha, Z.; Yu, M. Remote Sensing Imagery in Vegetation Mapping: A Review. J. Plant Ecol. 2008, 1, 9–23. [Google Scholar] [CrossRef]
  58. Xiao, H.; Su, F.; Fu, D.; Lyne, V.; Liu, G.; Pan, T.; Teng, J. Optimal and Robust Vegetation Mapping in Complex Environments Using Multiple Satellite Imagery: Application to Mangroves in Southeast Asia. Int. J. Appl. Earth Obs. Geoinf. 2021, 99, 102320. [Google Scholar] [CrossRef]
  59. National Research Council. Firewood Crops: Shrub and Tree Species for Energy Production. Available online: https://www.nap.edu/catalog/21317/firewood-crops-shrub-and-tree-species-for-energy-production (accessed on 11 January 2022).
  60. Zhu, K.; Woodall, C.W.; Clark, J.S. Failure to Migrate: Lack of Tree Range Expansion in Response to Climate Change. Glob. Change Biol. 2012, 18, 1042–1052. [Google Scholar] [CrossRef]
  61. Cohen, O.; Bar, P. The impact of Acacia saligna invasion on the indigenous vegetation in various coastal habitats in Israel and its implication for nature conservation. Isr. J. Plant Sci. 2017, 45, 1–11. [Google Scholar] [CrossRef]
  62. Baskin, J.M.; Baskin, C.C. Germination Dimorphism in Heterotheca subaxillaris Var. subaxillaris. Bull. Torrey Bot. Club 1976, 103, 201–206. [Google Scholar] [CrossRef]
  63. Lonard, R.I.; Judd, F.W.; Stalter, R. Biological Flora of Coastal Dunes and Wetlands: Heterotheca subaxillaris (J. de Lamarck) N. Britton & H. Rusby. J. Coast. Res. 2011, 27, 1052–1058. [Google Scholar] [CrossRef]
  64. Le Maitre, D.C.; Gaertner, M.; Marchante, E.; Ens, E.J.; Holmes, P.M.; Pauchard, A.; O’Farrell, P.J.; Rogers, A.M.; Blanchard, R.; Blignaut, J.; et al. Impacts of Invasive Australian Acacias: Implications for Management and Restoration. Divers. Distrib. 2011, 17, 1015–1029. [Google Scholar] [CrossRef]
  65. Lockwood, J.L.; Cassey, P.; Blackburn, T. The Role of Propagule Pressure in Explaining Species Invasions. Trends Ecol. Evol. 2005, 20, 223–228. [Google Scholar] [CrossRef]
  66. Oliver, T.; Roy, D.B.; Hill, J.K.; Brereton, T.; Thomas, C.D. Heterogeneous Landscapes Promote Population Stability. Ecol. Lett. 2010, 13, 473–484. [Google Scholar] [CrossRef]
  67. Eilts, J.A.; Mittelbach, G.G.; Reynolds, H.L.; Gross, K.L. Resource Heterogeneity, Soil Fertility, and Species Diversity: Effects of Clonal Species on Plant Communities. Am. Nat. 2011, 177, 574–588. [Google Scholar] [CrossRef] [PubMed]
  68. Hochman, A.; Kunin, P.; Alpert, P.; Harpaz, T.; Saaroni, H.; Rostkier-Edelstein, D. Weather regimes and analogues downscaling of seasonal precipitation: A case study over Israel. Int. J. Climatol. 2020, 40, 2062–2077. [Google Scholar] [CrossRef]
Figure 1. Map of the research area in the coastal plain of Israel. Live accessions of H. subaxillaris and A. saligna were obtained from Israel National Park Authority (INPA), field campaign in 2019 and Global Biodiversity Information Facility (GBIF).
Remotesensing 14 01014 g001
Figure 2. The remote sensing classification demonstrating expansion of invasive species (A. saligna and H. subaxillaris) into open/vacant areas for 1990 and 1995 A. saligna alone, and 2000, 2010, 2020 for A. saligna and H. subaxillaris.
Remotesensing 14 01014 g002
Figure 3. Simulation-based vs remote-sensing classification-based evaluation of cover area changes of A. saligna, H. subaxillaris, and their shared cover area for the period 1990–2020.
Remotesensing 14 01014 g003
Figure 4. A forecast of the future expansion and rate of increase of the focal species in three different scenarios. (a) Scenario I—expansion of H. subaxillaris while A. saligna remains constant; Scenario II—expansion of A. saligna while H. subaxillaris remains constant, Scenario III—expansion of both species together; (b) Scenario I—the rate of area changes of H. subaxillaris while A. saligna remains constant; Scenario II—the rate of area changes of A. saligna while H. subaxillaris remains constant, Scenario III—the rate of area changes of both species together.
Remotesensing 14 01014 g004
Figure 5. The simulated spatial pattern of expansion of invasive species (Scenario III, A. saligna and H. subaxillaris).
Remotesensing 14 01014 g005
Figure 6. The landscape expansion dynamics of A. saligna and H. subaxillaris: (a) connectivity and diversity indices of the landscape at the landscape level; (b) Connectivity of A. saligna, H. subaxillaris and mixed areas with both species; (c) Number of individual patches of A. saligna, H. subaxillaris and both species.
Remotesensing 14 01014 g006
Table 1. Accuracy assessment of remote sensing classification of A. saligna and H. subaxillaris.
A. salignaH. subaxillaris
YearOA (%)PA/UA
(%)
Kappa
Coefficient
Number of
Validation
Samples
OA (%)PA/UA
(%)
Kappa
Coefficient
Number of
Validation
Samples
19907786/630.6830
19958997/740.6930
20009198/870.7308595/740.6525
200594100/780.711588488/810.6925
20109098/830.773608694/780.70280
201494100/840.823068590/810.64216
20208798/770.753698584/890.68259
OA = Overall Accuracy. PA = Producer’s Accuracy. UA = User’s Accuracy.
Table 2. Surface area (km2) of A. saligna, and H. subaxillaris, Mixed Land Cover (cover shared by both focal species) and vacant area are derived from the classification maps.
YearArea Covered
Exclusively by
A. saligna (km2)
Area Covered
Exclusively by
H. subaxillaris (km2)
Mixed Land
Cover Class
(km2)
Vacant
Area (%)
Vacant Area
(km2)
199039.7N/AN/A94730
199523.8N/AN/A96746
200031.217.00.9792720
200633.210.40.2493726
201042.335.23.6488689
201447.343.511.986667
202048.755.025.982640
Publisher’s Note: MDPI stays neutral with regard to jurisdictional claims in published maps and institutional affiliations.

