Article

Impact of Heading Shift of Barley Cultivars on the Weather Patterns around Heading and Yield in Alaska

by
Mingyuan Cheng
1,
Mingchu Zhang
1,*,
Robert M. Van Veldhuizen
1 and
Charles W. Knight
2
1
Agricultural and Forestry Experiment Station, Institute of Agriculture, Natural Resources & Extension, University of Alaska Fairbanks, Fairbanks, AK 99775, USA
2
Division of Agriculture, Alaska Department of Natural Resources, Fairbanks, AK 99709, USA
*
Author to whom correspondence should be addressed.
Atmosphere 2022, 13(2), 310; https://doi.org/10.3390/atmos13020310
Submission received: 18 January 2022 / Revised: 9 February 2022 / Accepted: 10 February 2022 / Published: 12 February 2022

Abstract

:
Barley heading date has advanced in Fairbanks (64.83° N, 147.77° W), Alaska, USA. However, it is unclear if this advance coincidently causes weather pattern changes around heading and leads to yield loss. Using the Variety Trial and weather data in Fairbanks and Delta Junction (64.05° N, 145.60° W) from 1991 to 2018, two barley cultivars were selected to analyze the yield and weather trends, the yield variation explained by weather, and the effect of extreme weather on yield. The results showed that the heading date of ‘Otal’ significantly advanced and yield significantly declined in Fairbanks while there were no heading and yield changes of ‘Otal’ in Delta Junction and of ‘Thual’ in both Fairbanks and Delta Junction. The weather pattern changed around heading due to advanced heading of ‘Otal’ in Fairbanks. The climate factors at 7–10 days around heading explained over 50% of ‘Otal’ yield variation in Fairbanks. The results suggest that ‘Otal’ can still be good to plant in Delta Junction but not in Fairbanks. To cope with the climate change in Alaska, the farmers should increase the diversity of barley cultivars, select non-photoperiod sensitive cultivars and cultivars with longer duration from planting to heading, and sow late to avoid the impact on heading and yield.

1. Introduction

Barley (Hordeum vulgare L.), one of important small grain crops, is cultivated across the world. The yield of barley has been increasing in northern Europe, Asia, and Africa from 1961 to 2010 and in the United States from 1980 to 2012 [1,2]. However, in recent years, the yield has stagnated in several important production regions such as southern and other parts of Europe partly because of climate change [1,3]. In Kazakhstan, climate change is responsible for 4.8% of barley yield loss from 1980 to 2015 [4]. The climate changes, especially the heat stress and drought at sensitive stages of plant development, are responsible for the barley yield loss [5]. The most sensitive stages of barley to weather variation are early in the season, at stages of determination of grain number (0–21 days before heading), and early grain filling (1–21 days after heading) [5]. The yield of barley decreased with high precipitation during early growth stages [5]. High temperature stress combined with drought during later sowing delayed the visible awns, heading, and maturity, resulting in reduction of the plant population, tillers, plant height, and dry matter production per square meter [6]. Drought at pre-anthesis stages reduced grain yield, grain number and thousand kernel weights, and strongly reduced yielding capacity (grain number) [7,8]. The number of kernels and kernel yield per plant of waxy barley was significantly reduced from high temperature (30 °C) at flowering [9]. At post-anthesis stages, high night temperature reduced thousand grain weight by 3% and 4% yield loss per °C increase [10]. Most studies above were conducted under control environment and there are only a few reports on the sensitivity of barley varieties to weather changes based on historical crop and weather data [11].
Heading, one of the important development stages of barley, is highly associated with environment adaptation and yield determination [12]. Heading date is controlled by various genes such as Ppd-H1, HvFT1 and Vrn-H1, and affected by environment [12,13,14]. Elevated temperature has caused the earlier heading date of barley [15,16]. Understanding the effect of weather patterns around heading on barley yield in the climate change scenario will provide better information for breeders and farmers to adapt to the changes. However, the effect of climate on the shift of weather patterns around heading and their impacts on yields of cultivars have not been well documented.
Alaska is one of the most sensitive regions to climate change. The temperature in Alaska has increased 1 °C statewide since 1920 [17], causing earlier spring snowmelt, longer growing season, and quick growth of trees [18]. Meanwhile, the temperature increased 1.9 °C in the summer growing season from 1949 to 2005 [19]. The total average precipitation in the state increased by 17% over periods of 1949–2016 [20]. These changes have significantly affected the agriculture in Alaska, especially heading and maturity of crops [16].
Only a few crops such as spring barley, spring oat (Avena sativa L.), spring wheat (Triticum aestivum L.), and some vegetables can grow in Alaska because of cold weather and a short growing season. The growing areas of barley in Alaska have increased since the 1970s and reached the highest in the 1990s (https://www.quickstats.nass.usda.gov/ accessed on 20 November 2021). The previous report showed that climate change has caused the growing season length extension, and the earlier heading and maturity dates of barley and oat in Fairbanks and Delta Junction, two important agricultural regions in Alaska [16]. However, there is no document on whether these changes affect the temperature and precipitation patterns during heading and how these changes impact the yield. The objectives of this study were: (1) to analyze the cultivar heading and yield data to determine the trends of heading dates and yields of barley cultivars; (2) to analyze temperature and precipitation patterns during the periods of 7–21 days before heading (BH) and after heading (AH); (3) to determine the impacts of weather variables during heading on the yields of two barley cultivars in Fairbanks and Delta Junction.

2. Materials and Methods

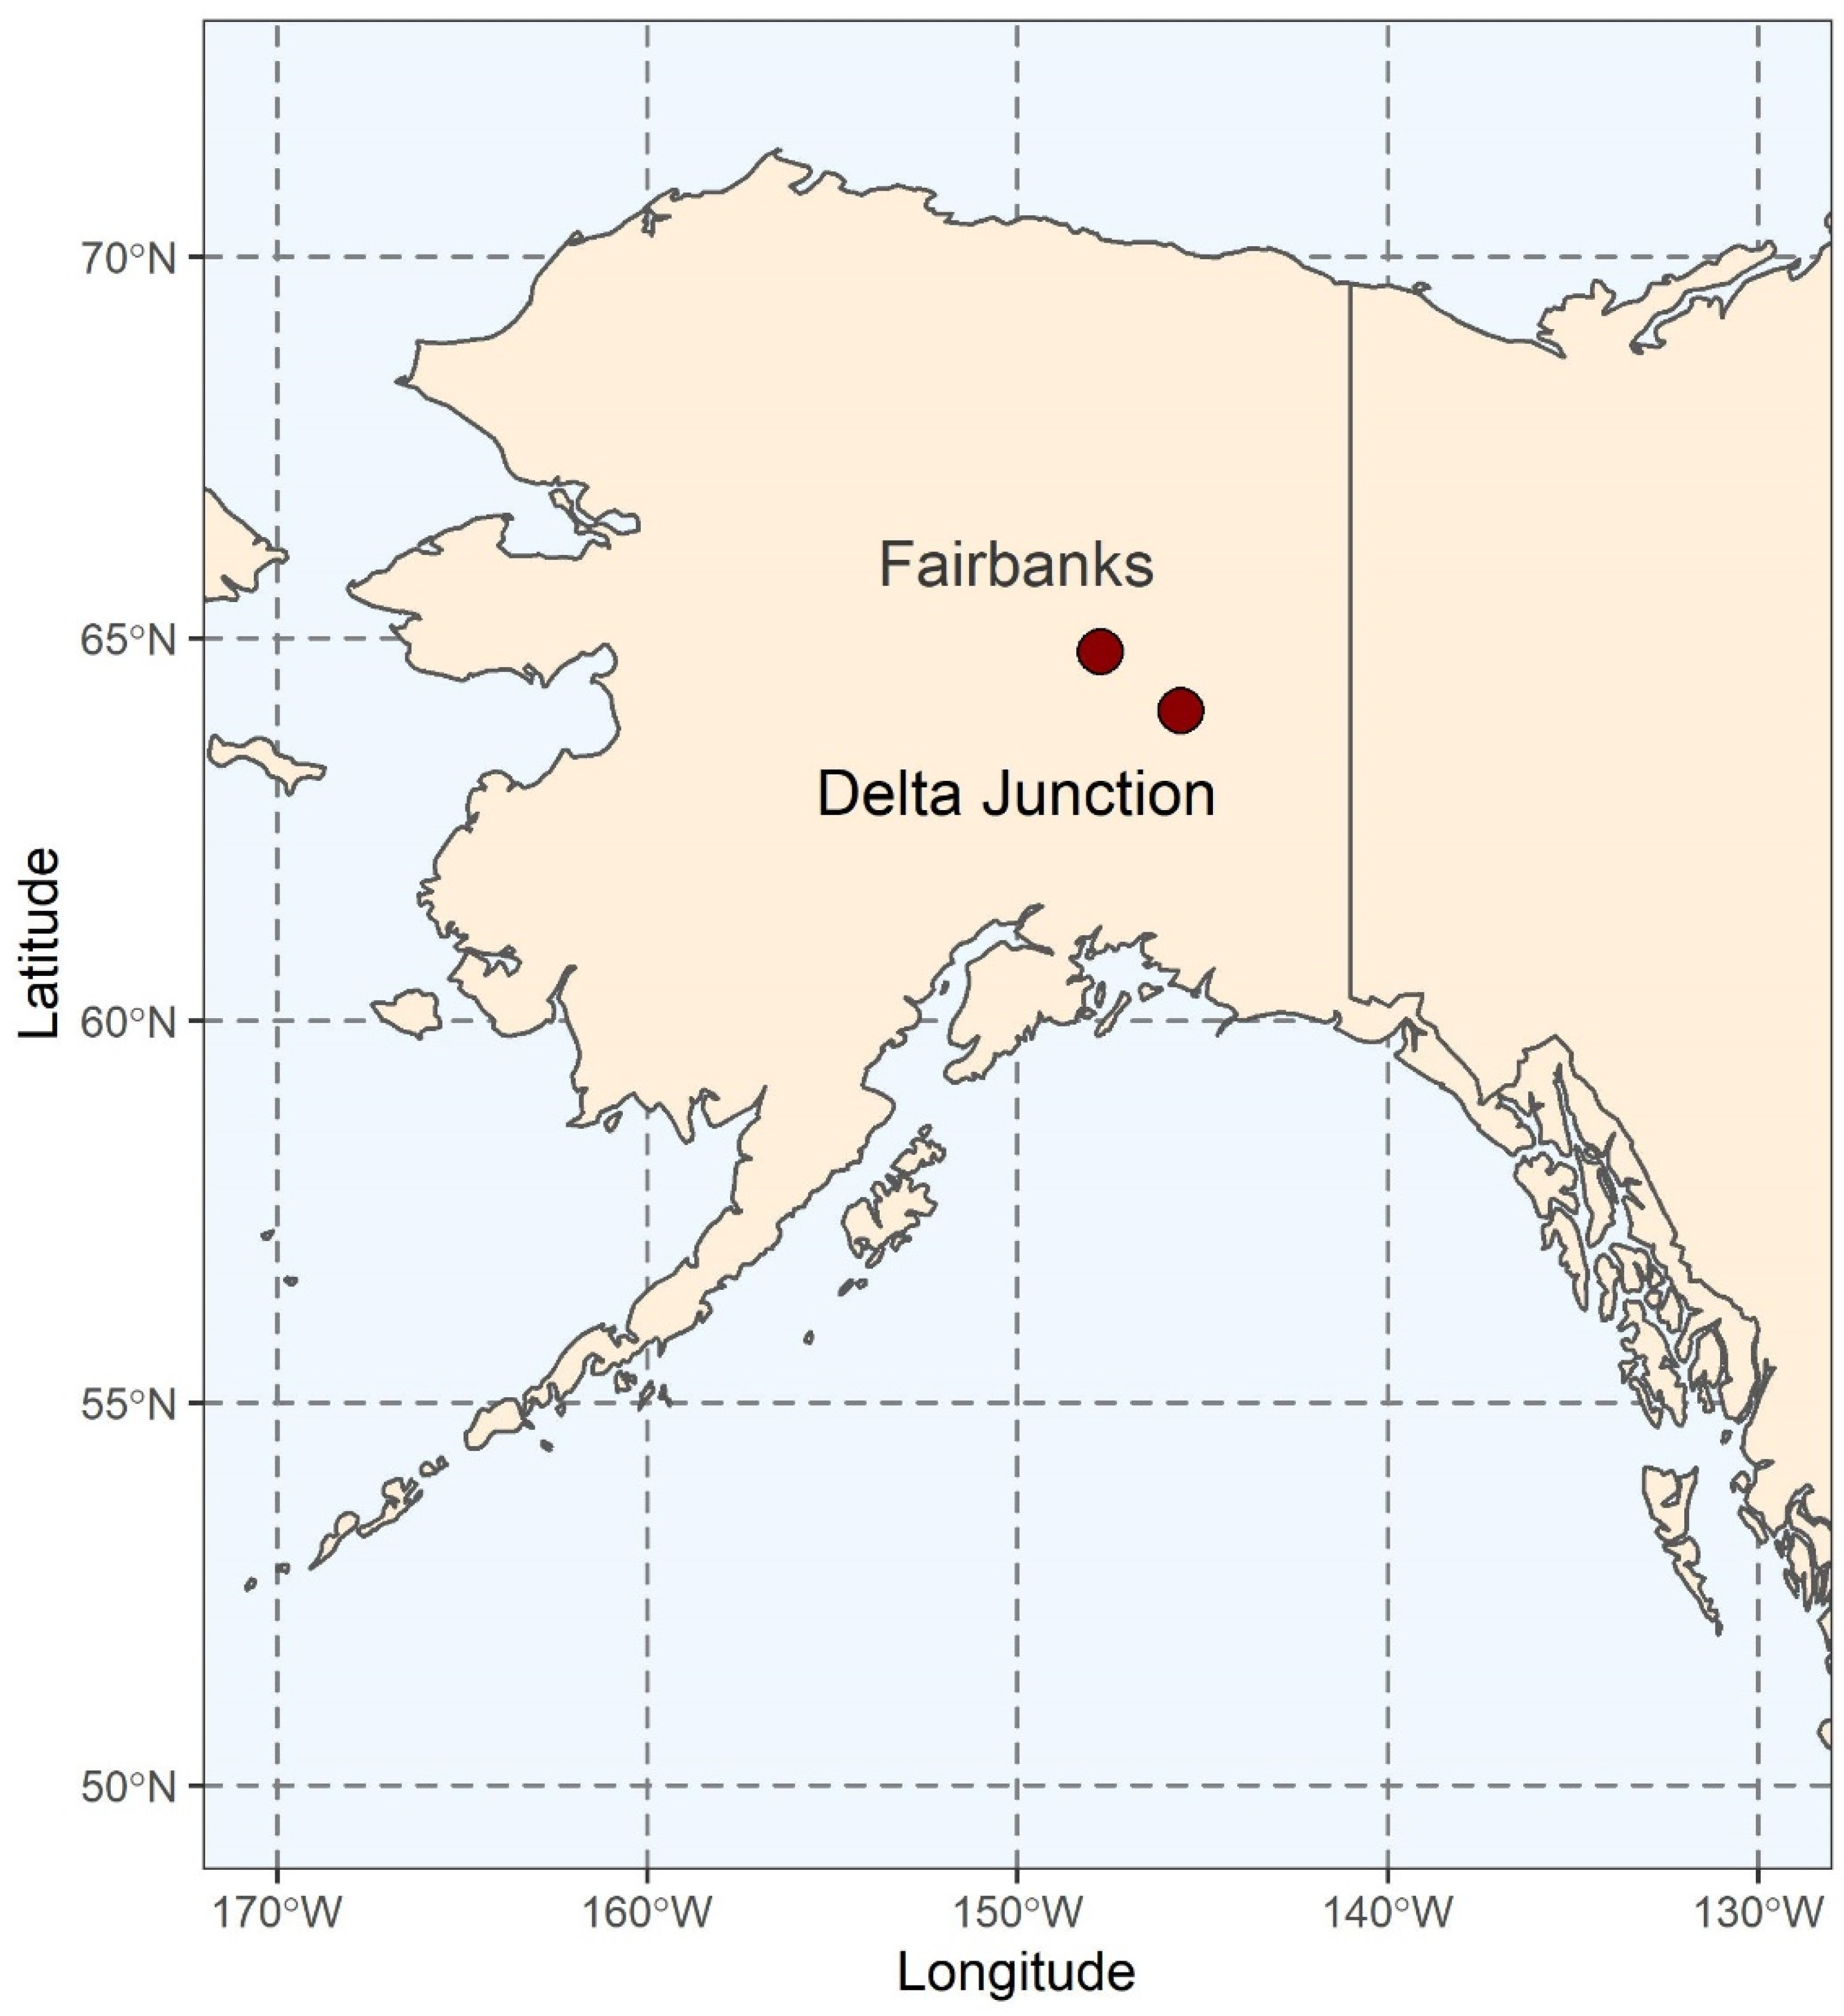
2.1. Locations, Heading Dates, and Yields of Cultivars

Fairbanks (64.83° N, 147.77° W) and Delta Junction (64.05° N, 145.60° W), two main barley growing areas in Alaska and two of three Alaska Small Grain Variety test sites since 1978, were chosen in this study (Figure 1). Two barley cultivars, ‘Otal’ and ‘Thual’, were selected in this study because these two cultivars have been continuously planted in the trials since the 1980s and there were only a few missing data points related to heading and yields since 1991. Heading dates and yields of ‘Otal’ and ‘Thual’ were obtained from the Archives of Alaska Small Grain Variety Trials. The dates of heading (ZS 55) were determined by 50% of spikes that fully emerged from the boot [21]. The heading dates and yields of ‘Otal’ and ‘Thual’ were the average of three plots [22]. In the trials, the experimental design was a randomized complete block with three replications. The area of each plot was 180 square feet or 0.0017 ha. Seed rate was 112 kg ha−1. Planting was completed using an ALMACO tractor mounted cone seeder with double disk openers and a packer wheel following the seed distribution. Fertilization was applied based on a soil analysis and mineral fertilizer (urea, diammonium phosphate, potassium sulfate) to give a final application rate of 60% N, 40% P2O5, 20% K2O, and 10% S. Fertilizer was blended and spread by hand over the study area. Tillage to incorporate the fertilizer and prepare a seedbed was undertaken with a tractor mounted rotary harrow (Roterra). Weed control was completed mostly by hand with a hoe over the growing season. Harvest was undertaken after physiological maturity when all the crops were at the ripening stage.

2.2. Climate Data

Precipitation and minimum temperature in June and July were two important climate factors impacting small grain yield in Fairbanks, Alaska, USA [23]. The most sensitive stages for the yield potential of barley were three weeks before heading and during anthesis (one week before and two weeks after heading) [5,24]. In addition, the previous study showed the heading of barley advancing 3 days per decade, approximately 7–10 days from 1991 to 2018 [16]. Therefore, the climate data during the periods of 7, 10, 14, and 21 days BH and AH were selected in this study. The potential agrometeorological variables affecting barley yields were as follows: (1) mean maximum temperature (Tmax) before heading (TmaxBH) and after heading (TmaxAH), (2) mean minimum temperature (Tmin) before heading (TminBH) and after heading (TminAH), (3) mean diurnal temperature range (Tdtr) before heading (TdtrBH) and after heading (TdtrAH), (4) accumulated precipitation before heading (PBH) and after heading (PAH). The daily minimum, maximum, and precipitation in Fairbanks and Delta Junction were from Data Tools: Local Climatological Data (LCD) of National Center for Environmental Information (https://www.ncdc.noaa.gov/cdo-web/datatools/lcd accessed on 28 October 2021) [25] (Supplementary Materials). The averaged TmaxBH, TmaxAH, TminBH, TminAH, TdtrBH, TdtrAH, PBH, and PAH during the periods of 7, 10, 14, and 21 days BH and AH were computed accordingly.

2.3. Data Processing

2.3.1. Trends of Yield and Climate Parameters

The trends in heading, yield, the climatic factors (TmaxBH, TmaxAH, TminBH, TminAH, TdtrBH, TdtrAH, PBH, and PAH) and the days of drought (precipitation < 0.5 mm d−1) during the periods of 7, 10, 14, and 21 days BH and AH were analyzed using linear regression methods of “lm” function in R (S1) [26]. The coefficient values indicated the trends and the threshold of p-value for the significance was p < 0.05.

2.3.2. The Variation in Yields of ‘Otal’ and ‘Thual’ in Fairbanks and Delta Junction Explained by the Temperature and Precipitation of BH and AH

Yields of ‘Otal’ and ‘Thual’ were transformed using logarithmic function. The first-difference time series of log(yield) (ΔLogY) and climatic parameters (ΔTmaxBH, ΔTmaxAH, ΔTminBH, ΔTminAH, ΔTdtrBH, ΔTdtrAH, ΔPBH, and ΔPAH) at the periods of 7, 10, 14, 21 days BH and AH were computed using the equation Xdiff = X(t) − X(t−1) (where Xdiff is the differences between the test year and previous year, t is the test year, t − 1 is the previous year, and t > 1) to reduce the confounding non-climatic effect (S1) [27]. To determine the variation in yield explained by climatic parameters at different periods (7, 10, 14, and 21 days BH and AH), ΔLogY was used as the dependent variable and ΔTminBH, ΔTdtrBH, ΔPBH, ΔTminAH, ΔTdtrAH, and ΔPAH or ΔPBH and ΔPAH were used as independent variables. Sixteen multiple linear regression models were fitted for each cultivar at each location from Equations (1) or (2) as follows:
ΔYij = β0 + β1ΔX1ijk + β2ΔX2ijk + β3ΔX3ijk + β4ΔX4ijl + β5ΔX5ijl + β6ΔX6ijl + εijkl
ΔYij = β0 + β3ΔX3ijk + β6ΔX6ijl + εijkl
where ΔYij is ΔLogY of ith cultivar (‘Otal’, ‘Thual’) at jth location (Fairbanks, Delta Junction); ΔX1 ijk − ΔX3 ijk represent ΔTminBH, ΔTdtrBH, and ΔPBH at kth day BH of ith cultivar at jth location, respectively; X4 ijl − X6 ijl represent ΔTminAH, ΔTdtrAH, and ΔPAH at lth day AH of ith cultivar at jth location, respectively; k = 7, 10, 14, 21; l = 7, 10, 14, 21; β0 is the intercept; β1–β6 are the coefficients representing the sensitivity of yield to climatic parameters; ε is the error. Equation (1) is used to test the effect of the combination of temperature and precipitation on the yields of cultivars and Equation (2) is used to determine the effect of precipitation on the barley yields. The models were analyzed using linear regression methods of “lm” function in R (S1) [26]. The values of R2ajusted were obtained from summaries of the models.

2.3.3. Cultivar Sensitivity to Climate Parameters at 10 days BH and AH

Based on the results above, the climatic parameters at 10 days BH and AH were selected to determine the effect on cultivar yields. The following model was used to evaluate the sensitivity of cultivar yield (ΔLogY) to year-to-year change in ΔTmin, ΔTmax, ΔTdtr, and ΔP at 10 d BH and AH:
ΔLogYi,j = β0 + β1 ΔXi,j
where ΔLogYi,j is the first difference values of Log(yield) of cultivar i at jth location; ΔXi,j is the first difference of TminBH, TmaxBH, TdtrBH, PBH, TminAH, TmaxAH, TdtrAH, or PAH (ΔTminBH, ΔTmaxBH, ΔTdtrBH, ΔPBH, ΔTminAH, ΔTmaxAH, ΔTdtrAH, or ΔPAH) of ith cultivar at jth location, β0 is the intercept of model, and β1 is the sensitivity of cultivar yield to ΔTminBH, ΔTmaxBH, ΔTdtrBH, ΔPBH, ΔTminAH, ΔTmaxAH, ΔTdtrAH, or ΔPAH. The sensitivity is expressed as the % change of yield per 1 °C temperature or 1 cm precipitation increase. The coefficient β1 was estimated by a Bayesian simulation with n = 500 using the “sim” function in the library “arm” of R (S1) [28].

2.3.4. The Variation in Yield Explained by Climatic Parameters at 10 days BH and AH in Fairbanks and Delta Junction

The climatic parameters at 10 days BH and AH were selected to determine the variations in yields of ‘Otal’ and ‘Thual’ explained by climatic parameters and the importance of climatic parameters in the models in Fairbanks and Delta Junction. To avoid the multicollinearity of the models, ΔTdtrBH, ΔTminBH, ΔPBH, ΔTdtrAH, ΔTminAH, and ΔPAH were selected as independent variables and all the variables were standardized using “scale” function in R in the following interaction models. The coefficients were obtained using linear regression methods of “lm” function in R (S1) [26]. The best models were selected using backward and “stepAIC” function in R from full models as follows:
ΔYi,j = µ + ΔX1i,j × ΔX3i,j + ΔX2i,j × ΔX3i,j + ΔX4i,j × ΔX6i,j + ΔX5i,j × ΔX6i,j + εi,j
ΔYi,j = µ + ΔX4i,j × ΔX6i,j + ΔX5i,j × ΔX6i,j + εi,j
ΔYi,j = µ + ΔX1i,j × ΔX3i,j + ΔX2i,j × ΔX3i,j + εi,j
where ΔYi,j is ΔLog(Yield) of ith cultivar (‘Otal’, ‘Thual’) at jth location (Fairbanks, Delta Junction); X1i,j–X6i,j are ΔTminBH, ΔTdtrBH, ΔPBH, ΔTminAH, ΔTdtrAH, and ΔPAH at 10 days BH and AH of ith cultivar at ith location, respectively; µ is intercept; εi,j is residual error. The Equations (4)–(6) are used to determine the yield variations by the climatic variables from both BH and AH, from AH and from BH, respectively.

2.3.5. Effect of High Temperature and Low Precipitation on the Yields of ‘Otal’ and ‘Thual’ in Fairbanks and Delta Junction

In Alaska, temperatures greater than 25 °C are rare. The temperature and precipitation selected in this section were the period of 10 days BH and AH. The categorical variables were chosen as follows: Tmax two levels (“Yes” for great than 25 °C and “No” otherwise), Tmin three levels but varied with locations (GTA = great than upper limit of 95% confidence interval of Tmin, LTA = less than lower limit of 95% confidence interval of Tmin, Avg = Tmin within 95% confidence interval of Tmin), precipitation two levels (Y = precipitation less than or equal to 5 mm in 10 days and N = precipitation great than 5 mm in 10 days) (S1). The 95% confidence interval of Tmin was (10.8, 12.3) in Fairbanks and (9.9, 11.4) in Delta Junction. The model was fitted as follows:
Yij = µ + X1ij × X3ij + X2ij × X3ij + X4ij × X6ij + X5ij × X6ij + εij
where Yij is the yield of ith cultivar (i = ‘Otal’, ‘Thual’) at jth location (j = Fairbanks, Delta Junction); X1ij–X6ij are TmaxBH, TminBH, PBH, TmaxAH, TminAH, and PAH at 10 days of ith cultivar at jth location, respectively; εij is the residual error. The models were analyzed using linear regression methods of “lm” function in R (S1) [26].

3. Results

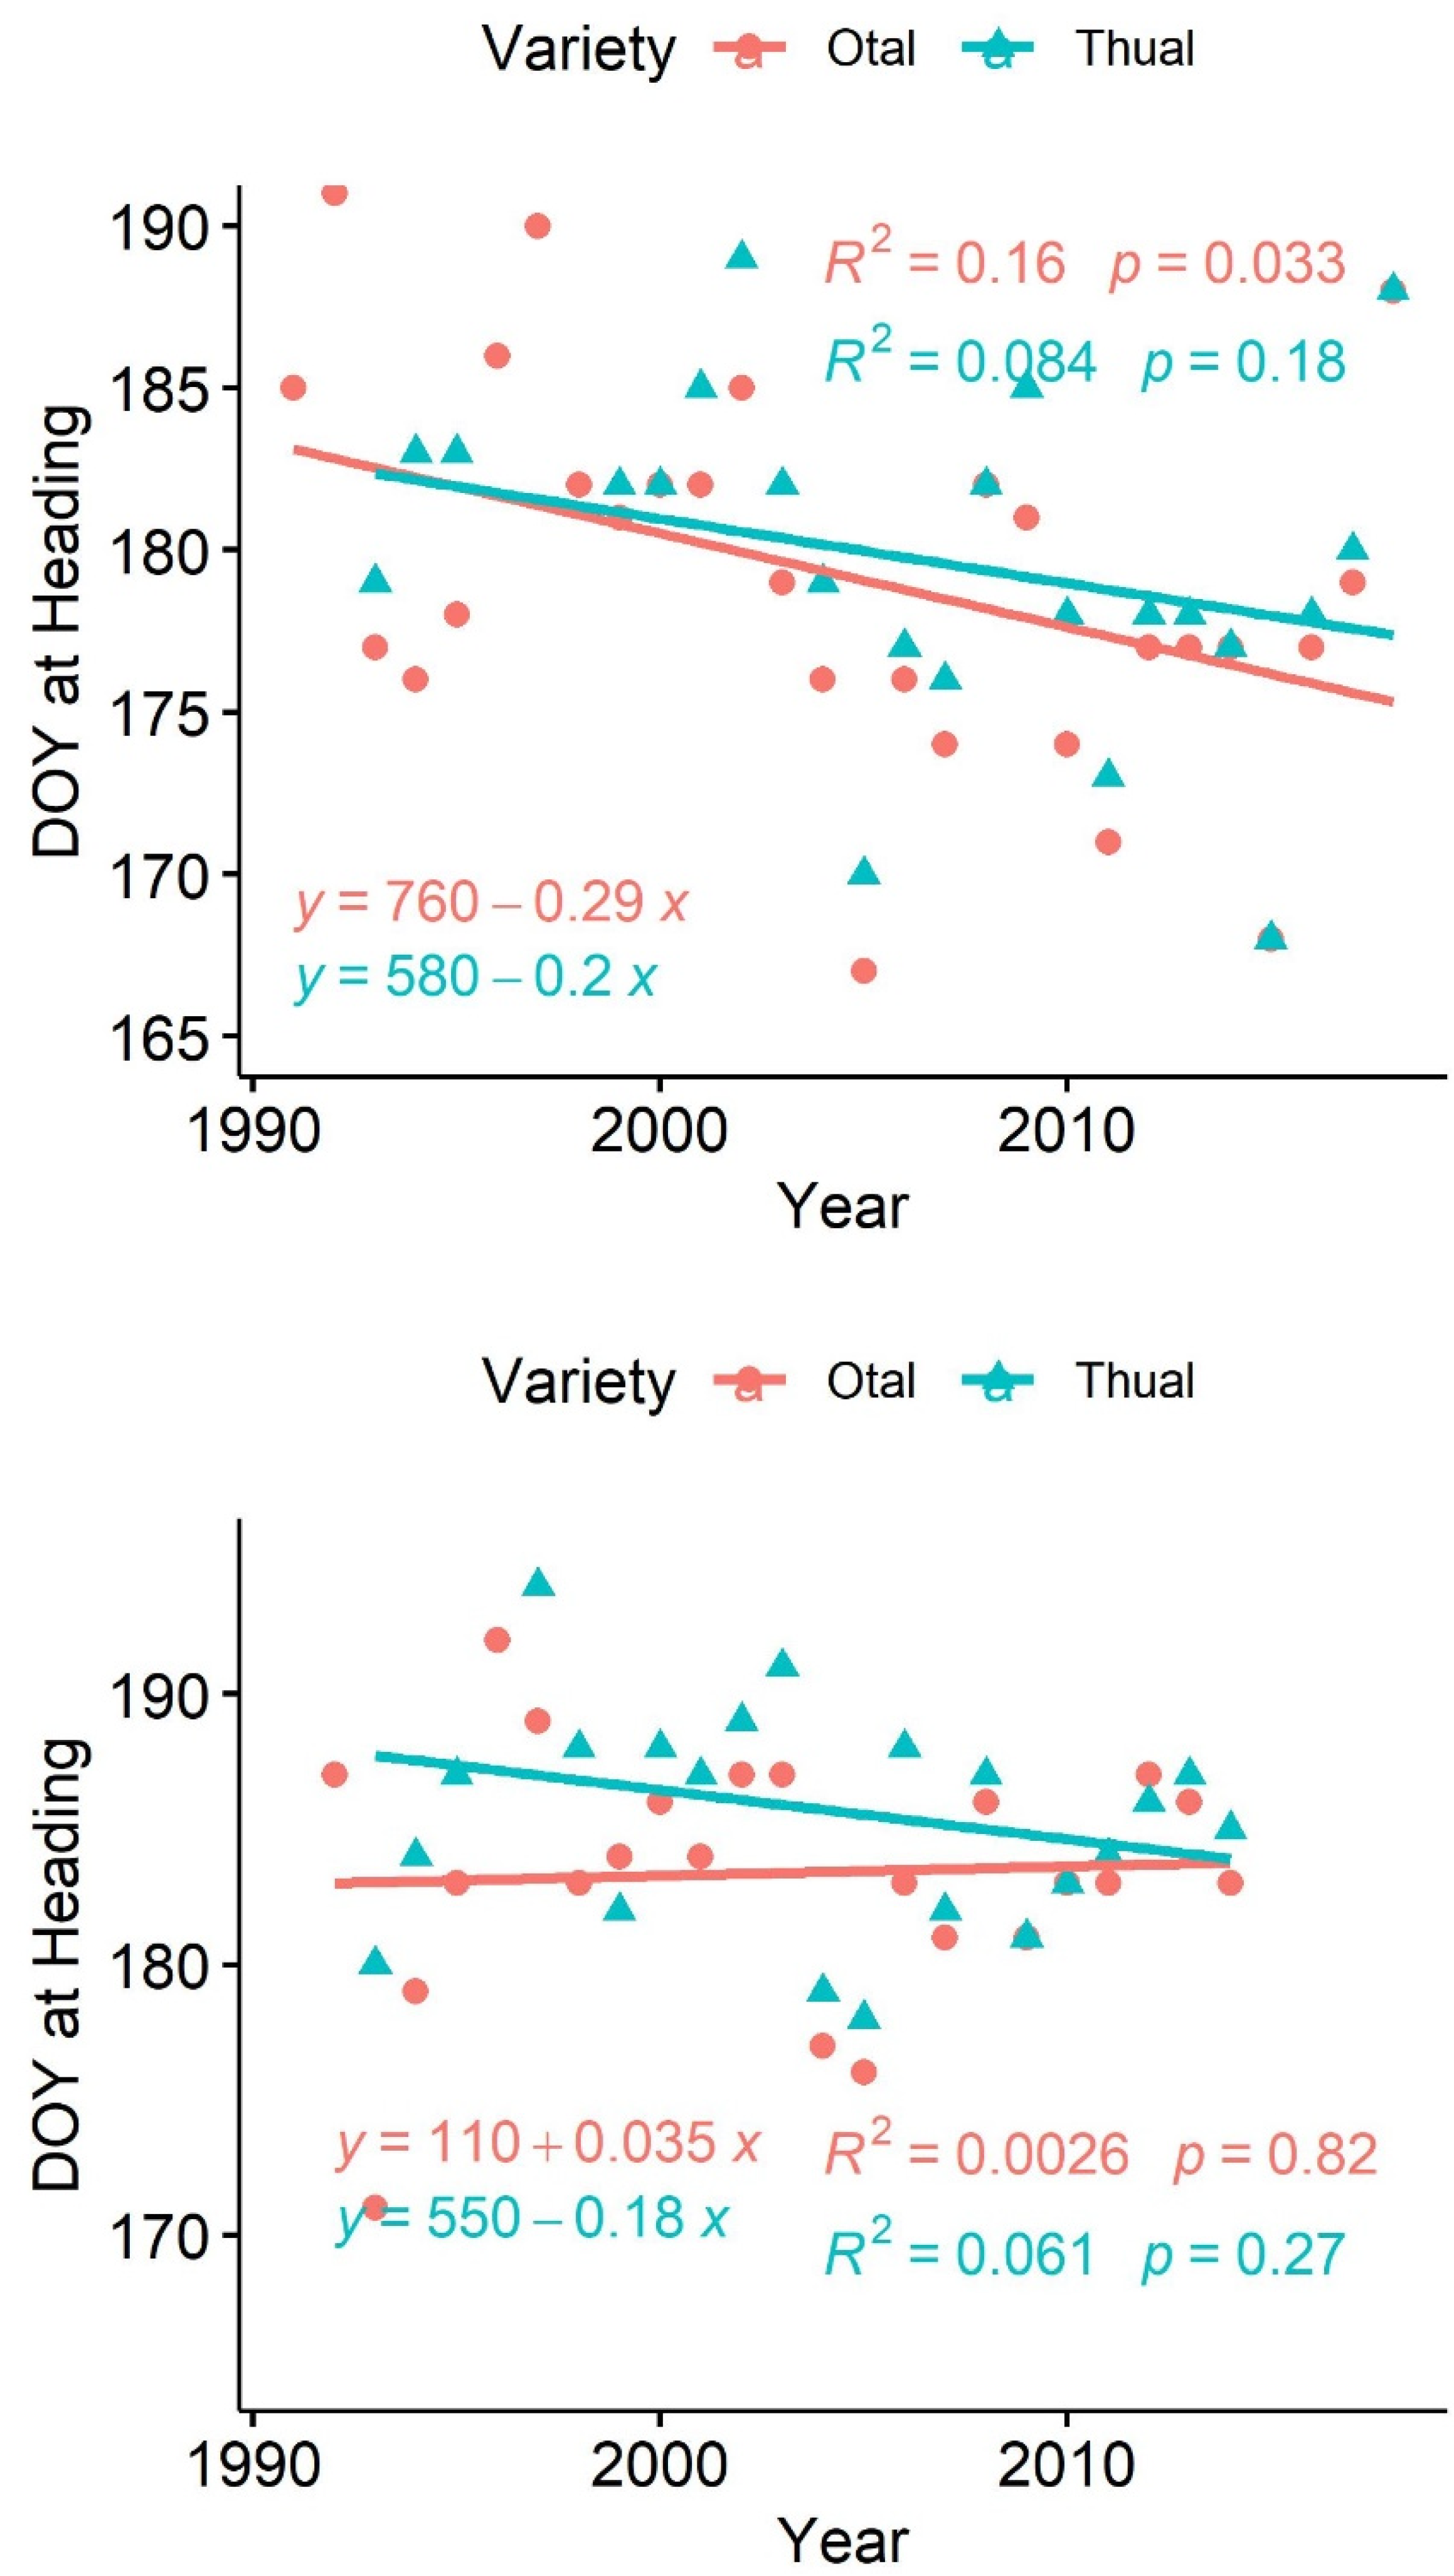
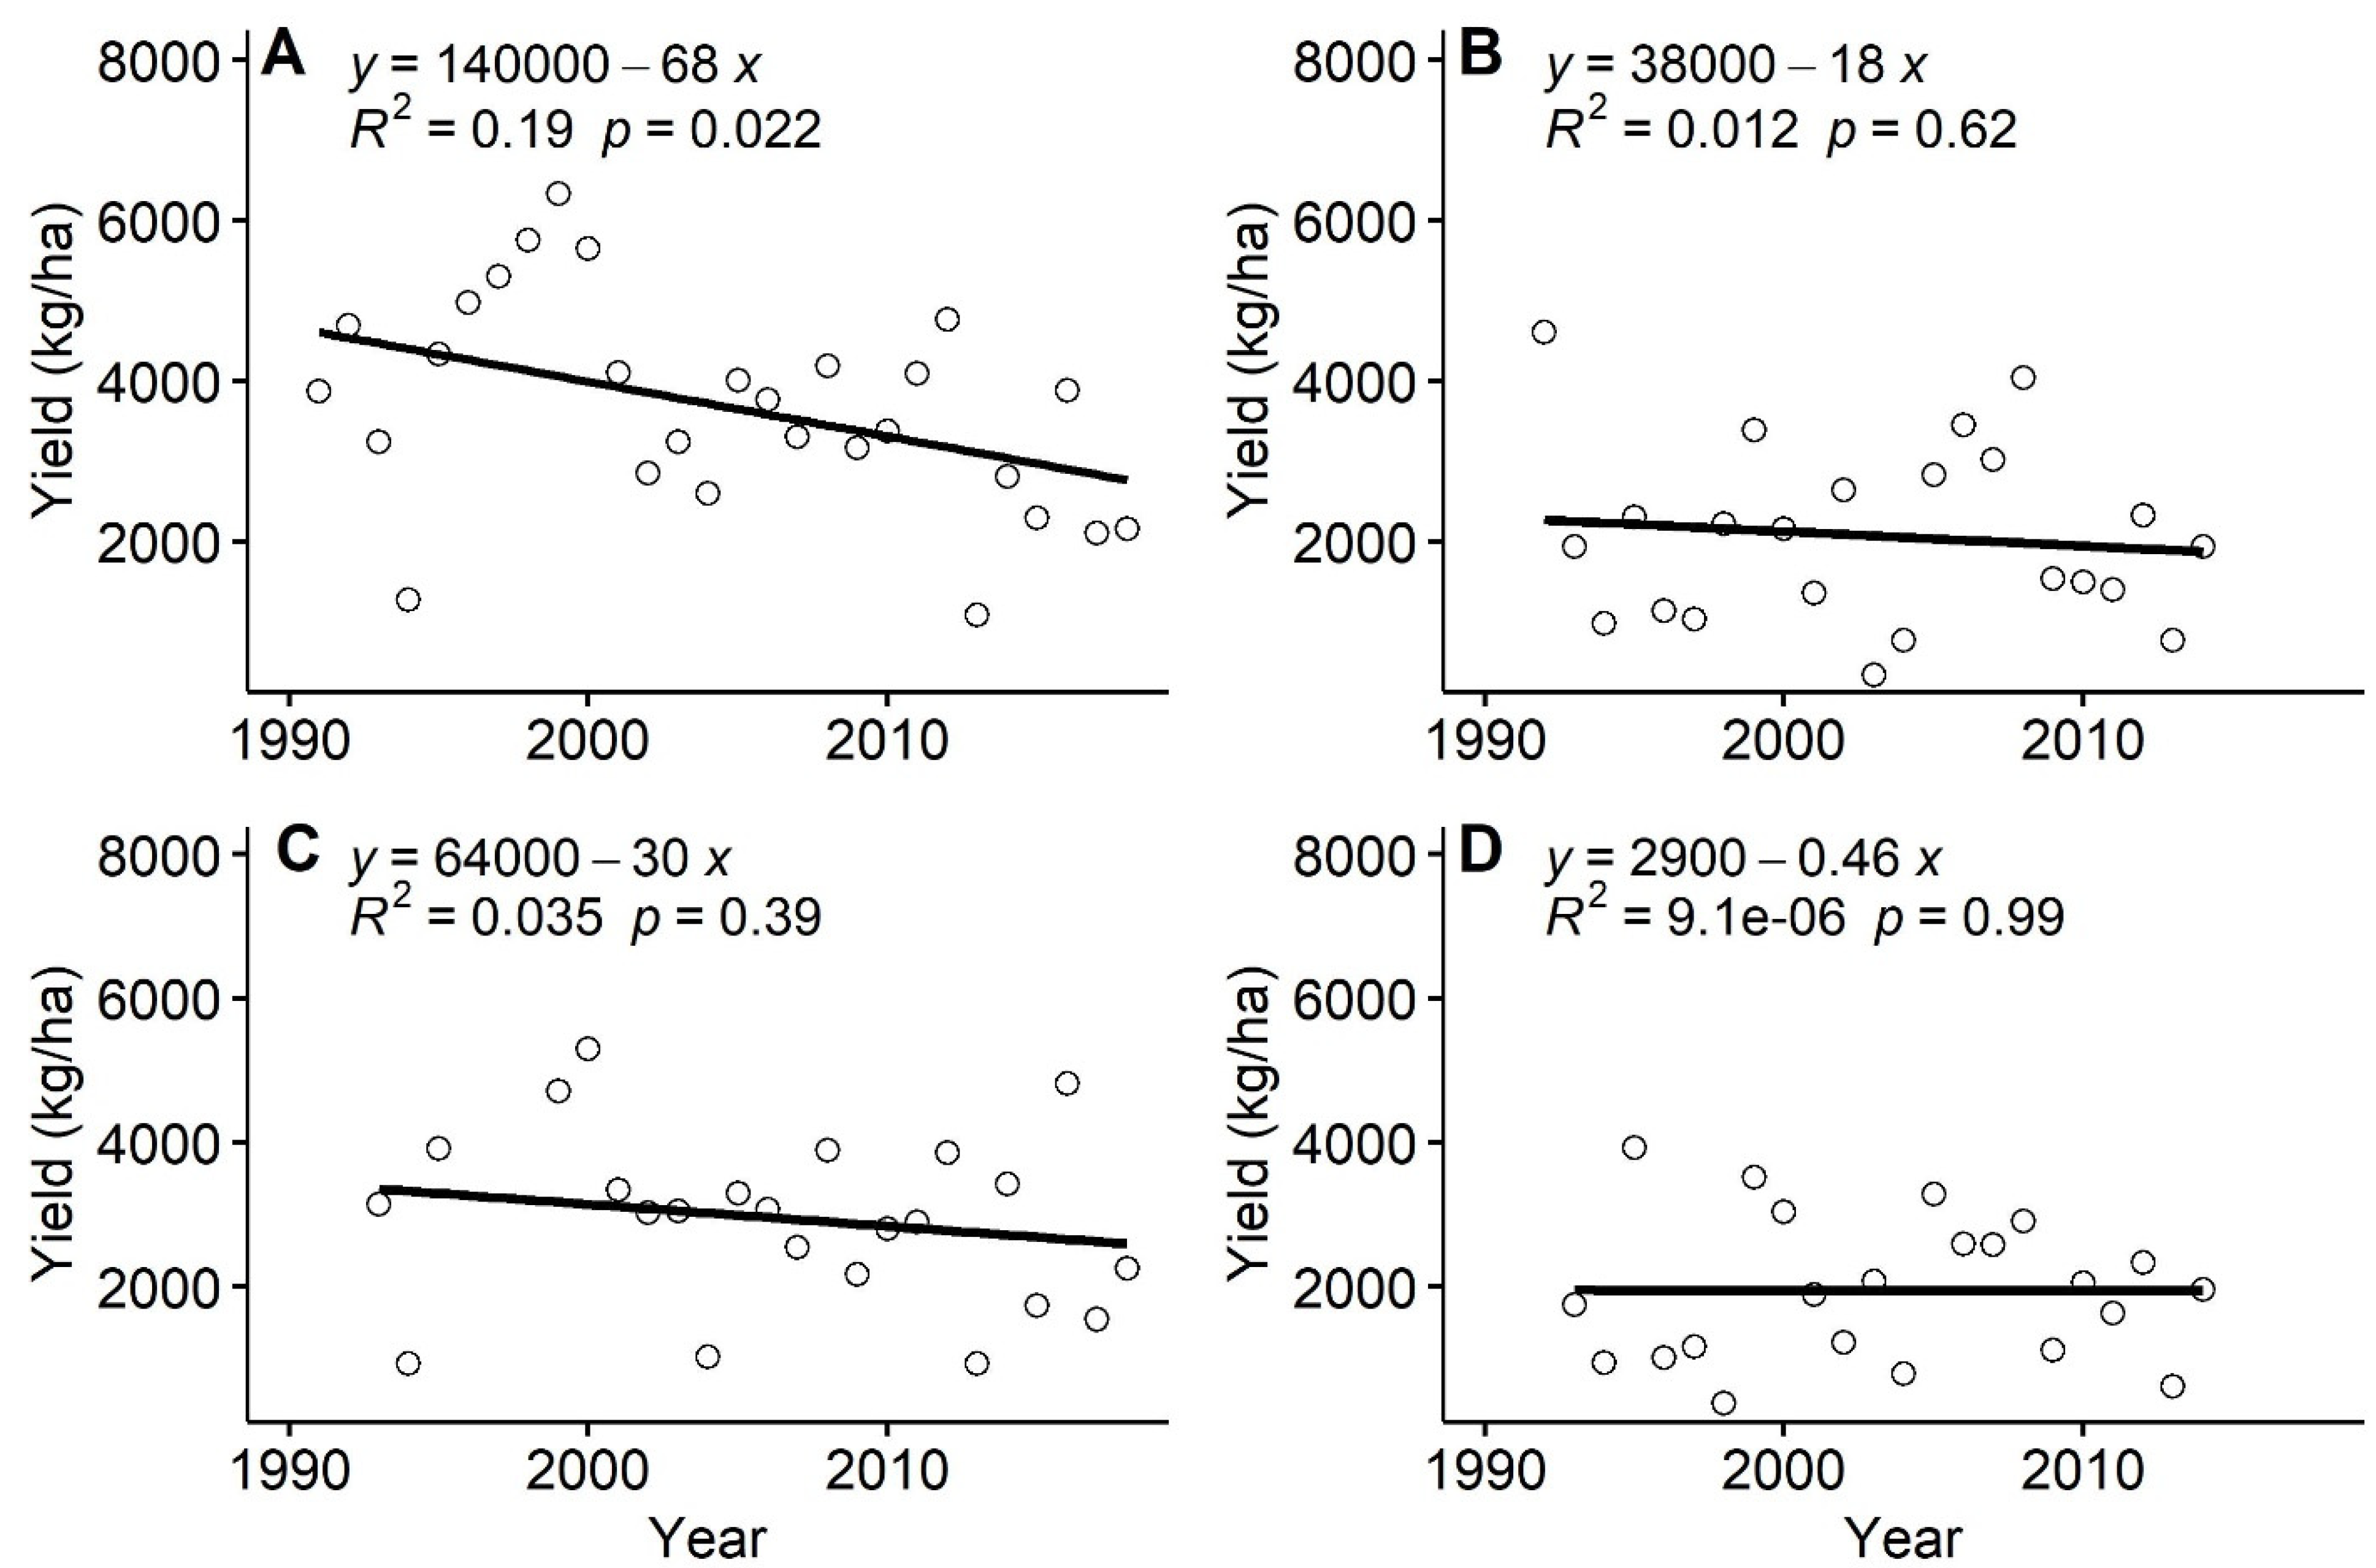
3.1. Heading and Yield Changes of Cultivars ‘Otal’ and ‘Thual’ in Fairbanks from 1991 to 2018 and Delta Junction from 1992 to 2014

The heading of ‘Otal’ significantly advanced by 2.9 days decade−1 in Fairbanks (p < 0.05), whereas the heading dates of ‘Otal’ in Delta Junction and those of ‘Thual’ in both Fairbanks and Delta Junction did not change significantly (p > 0.05) (Figure 2).
The yield of ‘Otal’ was higher than that of ‘Thual’, and the yields of both cultivars in Fairbanks were higher than those in Delta Junction (Figure 3). The yield of ‘Otal’ reduced significantly in Fairbanks from 1991 to 2018, with average reduction of 68 kg ha−1 per year (1.89% per year) (p < 0.05) (Figure 3). The yield of ‘Otal’ in Delta Junction and the yields of ‘Thual’ in both Fairbanks and Delta Junction reduced but not significantly (p > 0.05) (Figure 3).

3.2. Temperature and Precipitation Trends during the Periods of 7–21 days BH and AH of ‘Otal’ and ‘Thual’ in Fairbanks and Delta Junction

In general, more significant trends of temperature and precipitation were observed at the periods of 7–21 days BH and AH of ‘Otal’ than those of ‘Thual’ in both Fairbanks and Delta Junction (Table 1).
In Fairbanks, a decreasing PBH trend (0.05 cm year−1) at 7 days BH and an increasing PAH trend (0.11 cm year−1) at 14 days AH of ‘Otal’ were observed (p < 0.05), while no precipitation significant changes were observed in the periods of 7–21 days BH and AH of ‘Thual’ (p > 0.05) (Table 1). The increasing TminAH trends were observed at 10, 14, and 21 days AH of ‘Otal’ (p < 0.05), while an increasing TminAH trend only at 21 days AH of ‘Thual’ (p < 0.05), which was 14 days earlier in ‘Otal’ than in ‘Thual’. The decreasing TdtrAH trends at 7, 10, 14, and 21 days AH of ‘Otal’ (p < 0.05), but the decreasing trends at 14 and 21 days AH of ‘Thual’ were observed, which was at least 10 days earlier in ‘Otal’ than ‘in Thual’ (p > 0.05) (Table 1).
In Delta Junction, a decreasing TmaxBH trend was observed at 7 days BH of ‘Otal’ (p < 0.05) but not of ‘Thual’ (p > 0.05). The TdtrBH decreasing trends were found at 7, 10, 14, and 21 days BH of both ‘Otal’ and ‘Thual’ (p < 0.05). PBH increased significantly at 7 days BH of ‘Otal’ (p < 0.05) but not of ‘Thual’ (p > 0.05). For the AH periods, a decreasing TmaxAH trend at 7 days of ‘Thual’ and decreasing TdtrAH trends at 14 and 21 days of both ‘Otal’ and ‘Thual’ were observed (p < 0.05) (Table 1).

3.3. Days of Drought at 7, 10, 14, and 21 Days BH and AH of Both Cultivars in Fairbanks and Delta Junction

In Fairbanks, the days of drought increased at BH and decreased at AH, with the trends at 7 days BH and at 14 days AH of ‘Otal’ at the margin of statistical significance (p < 0.1). In Delta Junction, precipitation increased at the periods of 7, 10, 14, and 21 days BH, and 14 and 21 days AH but not significantly (p > 0.05). The precipitation significantly increased at 14 days BH of ‘Thual’ (p < 0.05) (Table 2).

3.4. Variation in Yields Explained by Combination of Climatic Parameters at BH and AH

The combination of temperature and precipitation of 7–21 days BH and AH can better explain the yield variations in Fairbanks than those in Delta Junction. Meanwhile, the precipitation explained more than half of the yield variation than the combination of temperature and precipitation did.
In Fairbanks, the yield of ‘Otal’ was best explained by the combination of temperature and precipitation at 7 and 10 days BH and AH, with the highest R2ajusted 0.56 at 10 days BH and AH. The yield of ‘Thual’ was best explained by the climatic parameters at 7 days BH and 14 days AH, with R2ajusted 0.45. In Delta Junction, all of the combinations of temperature and precipitation at any periods of BH and AH explained less variation in the yield of ‘Otal’, with the highest R2ajusted only 0.16 while the climate parameters at 14 days BH explained 32–40% of variations in ‘Thual’ yield (Table 3).
Precipitation in Fairbanks can explain more than half of the yield variations in ‘Otal’ and ‘Thual’ explained by the combination of temperature and precipitation, but in Delta Junction precipitation performed better for the cultivar yields than most of the combinations of temperature and precipitation (Table 3).

3.5. Sensitivity of the Yields of ‘Otal’ and ‘Thual’ to Climatic Parameters at 10 Days BH and AH

In general, increasing temperatures (Tmax, Tmin, and Tdtr) and decreasing precipitation reduced the cultivar yields but only Tdtr at 10 days AH of ‘Otal’ in Fairbanks, precipitation at 10 days BH of ‘Otal in Delta Junction, precipitation at 10 days AH of ‘Otal’ and ‘Thual’ in both Fairbanks and Delta Junction significantly impacted the yields (Figure 4). The reactions of cultivar yields to the temperature and precipitation varied with cultivars and duration (BH or AH). At BH, the yields of two cultivars declined with increased Tmax and Tmin, and with decreased precipitation in both Fairbanks and Delta Junction except Tdtr for the yield of ‘Otal’ in Fairbanks (Figure 4). At AH, both ‘Otal’ and ‘Thual’ showed the same patterns with Tdtr and precipitation, reducing yields with increased Tdtr and decreased precipitation in Fairbanks but in Delta Junction reducing yield with decreased Tdtr and increased precipitation (Figure 4). When Tmin increased, ‘Otal’ yield increased but the yield of ‘Thual’ decreased in both Fairbanks and Delta Junction (Figure 4). Increased Tmax reduced the yields of both ‘Otal’ and ‘Thual’ in Fairbanks but in Delta Junction the yield of ‘Otal’ increased and the yield of ‘Thual’ decreased (Figure 4).

3.6. Best Models for the Yields of ‘Otal’ and ‘Thual’ Explained by Combination of Climatic Parameters at 10 Days BH and AH or the Climatic Parameters of 10 Days BH or 10 Days AH Alone

For cultivar ‘Otal’, in Fairbanks, the combination of climatic parameters of BH and AH can explain over 50% of the variation in ‘Otal’ yield and the climatic parameters at BH or AH can only explain 23–25% of variation, half of the combination, indicating the climatic parameters at 10 d BH and 10 days AH were equally important (Table 4). In Delta Junction, the same percentage of variation in yield can be explained by the combination of climatic parameters at BH and AH or AH while the climatic parameter at BH can only explain 16% of variation, indicating the climatic parameters at 10 days AH were more important than at 10 days BH (Table 4).
For cultivar ‘Thual’, the combination of climate parameters can only explain 27% of yield variations in Fairbanks and 19% in Delta Junction (Table 5). The climate parameters at BH and AH were equally important for the yield of ‘Thual’ in Fairbanks but only climate parameters at BH were important for the yield variation in Delta Junction (Table 5).
Based on the coefficients of models, the results showed that Tmin and precipitation (both BH and AH) or interaction between TminBH and PBH were important climatic factors to impact the yield of ‘Otal’ in Fairbanks while in Delta Junction only PBH was important for the yield (Table 4). Precipitation was more important than temperatures at both BH and AH (larger coefficient values for precipitation) in Fairbanks (Table 4). For the cultivar ‘Thual’, the important variables for the yield were TdtrBH and PAH in Fairbanks while no variables were important for the yield in Delta Junction (Table 5).

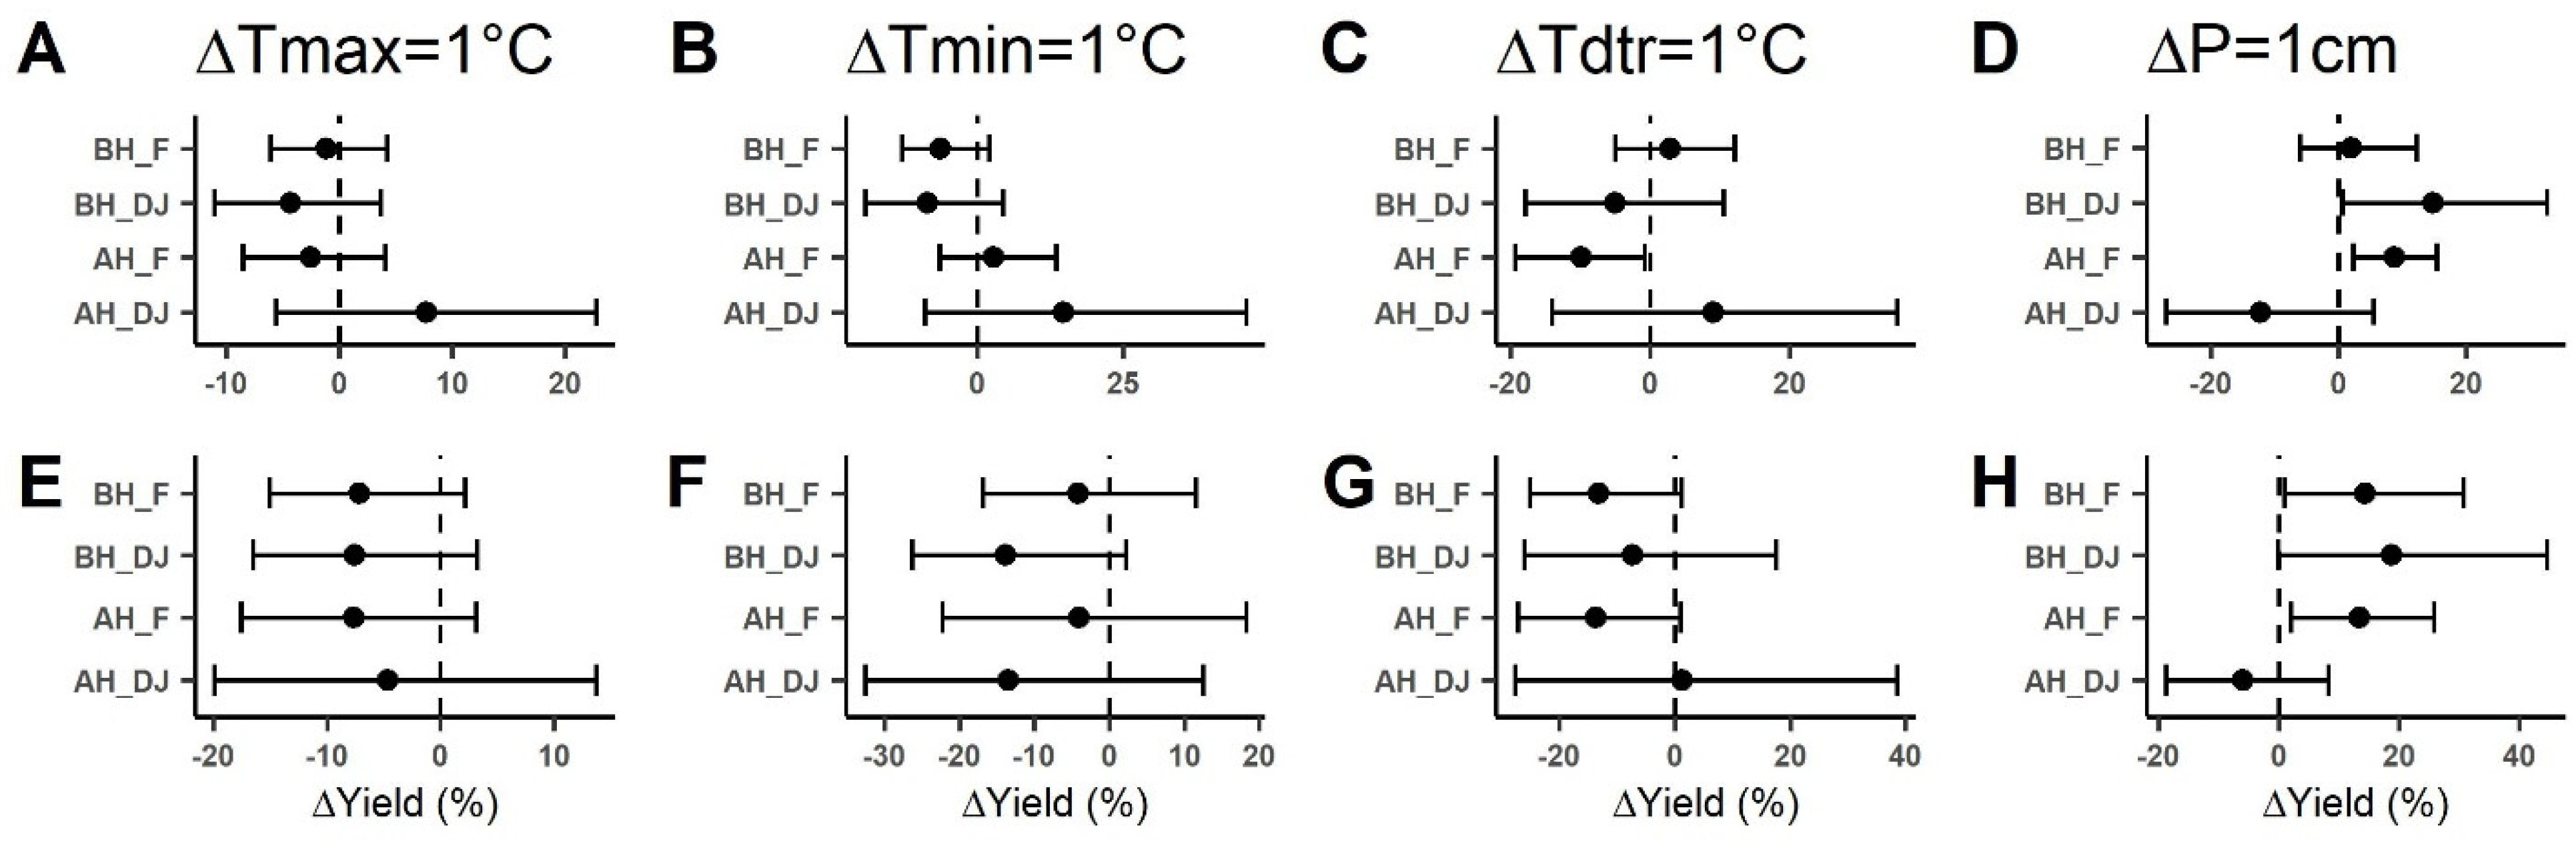
3.7. Effect of Higher Temperature and Drought on the Yields of ‘Otal’ and ‘Thual’

The yield of ‘Otal’ significantly reduced when the lower precipitation (<5 mm in 10 days) at 10 days BH, lower Tmin at 10 days AH, and interaction of lower precipitation and higher Tmin at 10 days AH, whereas higher Tmin at 10 days BH and the interaction between higher Tmax and lower precipitation significantly increased the yield of ‘Otal’ in Fairbanks (Table 6). The yield of ‘Thual’ significantly reduced only with lower precipitation at BH in Fairbanks (Table 6).
In Delta Junction, the yield of ‘Otal’ significantly increased with the higher Tmax combined with lower precipitation (<5 mm in 10 days) but the yield decreased significantly with higher Tmax at 10 days AH (Table 6). The yield of ‘Thual’ decreased significantly with higher Tmin at 10 days BH (Table 6).

4. Discussion

This study highlighted the effect of heading shift on the weather pattern changes and the effect of weather pattern on yields of barley cultivars, ‘Otal’ and ‘Thual’. The heading of ‘Otal’ advanced 2.9 days per decade in Fairbanks in this study, agreeing with the previous report that the heading dates of barley advanced 3 days per decade in Fairbanks, Alaska because of early sowing and climate change from sowing to heading [16]. The shift of heading dates of ‘Otal’ coincidently resulted in significant temperature and precipitation changes around heading, especially drought days increasing at BH. These changes may be the main reasons for the significant yield loss of ‘Otal’ in Fairbanks (p < 0.05).

4.1. The Effect of Temperature and Precipitation Patterns Shift on the Yields of ‘Otal’ and ‘Thual’ in Fairbanks and Delta Junction

Precipitation is the most important climatic factor impacting the yields of barley cultivars ‘Galt’ and ‘Weal’ in Fairbanks, Alaska [23]. Water stress during heading impacted the barley yield [29]. Precipitation pattern during heading changed due to climate change in Fairbanks, Alaska. The periods of 10 days BH and AH are just within the stage of anthesis and the beginning of grain filling stage [30]. The water stress during this period causes the reduction of number of grains per plant, grain weight, and grain quality [7,8,31]. The shift of heading in Fairbanks causes the more drought days at BH than before and the lower precipitation at BH may be one of the reasons for the yield losses of ‘Otal’ and ‘Thual’. The results in this study agree in part that precipitation deficit and distribution events within a growing season (especially during heading, flowering, and kernel formation) were responsible for the yield variation in barley cultivars ‘Galt’ and ‘Weal’ [23]. This also is consistent with the extremely low barley yields in Czech Republic caused by high temperature, low precipitation total, and negative self-calibrated Palmer Drought Severity Index in April to June [32]. However, the results contradict the findings that the barley yield reduced due to high precipitation during early growth and early filling in Poland and increased precipitation over the period from leaf emergence to the booting stages in Canada [5,33]. The reasons for this may be because the precipitation total during heading varies with locations. Moreover, in places like Alaska, the precipitation during heading may not reach its optimal level in the periods of this study or the cultivars studies in Alaska are more sensitive to drought than flooding, suggesting that the breeder in Alaska should focus on selection the cultivars with drought resistance at current stages.
Tmin increased significantly at 10, 14, and 21 days AH of ‘Otal’ in this study in Fairbanks and significantly reduced the yield of ‘Otal’ when combined with drought at AH (Table 6). This result agrees with the report that increased minimum temperatures at BH and AH were associated with barley yield loss across European regions [29]. The higher temperature at night results in reducing the grain filling time, decreasing thousand grain weight, and reducing the final yield [10].
Heat stress combined with drought is one of the major limitations to food production [6,34]. Elevated temperature has a strong influence on the length of grain filling (at AH stages) and decreases the barley yields [5,34]. In this study, the analysis of the effect of higher Tmax on the yields of ‘Otal’ and ‘Thual’ showed that higher Tmax at AH alone caused the yield of ‘Otal’ in Delta Junction to significantly decrease but not in Fairbanks, whereas in Fairbanks, Tmax combined with drought at AH significantly increased the ‘Otal’ yield (Table 6). The different reaction of ‘Otal’ to higher Tmax at grain filling stage in Fairbanks and Delta Junction may be attributed to the fact that the barley ‘Otal’ has adapted to the higher summer temperature in Fairbanks and the lower summer temperature in Delta Junction.
The present study focused on the climate variables around the heading periods of barley cultivars and the effect of climate factors on cultivar yields. Although the climate variables around the heading can explain over 50% of variation in yield in Fairbanks, there are still some other variables such as delayed sowing because of frost, snow melt and rain, drought and flooding after sowing, lodging due to heavy rain, delayed harvest due to the rain, disease outbreak, and pest invasion to be considered in future research [24].

4.2. Implications for Barley Breeding and Cultivar Deployment in the Future

Both ‘Otal’ (a 6-row feed barley) and ‘Thual’ (a 6-row hulless spring barley) were released in 1981 by the USDA-ARS breeding program [22]. Based on the results of this study, these two cultivars showed a different reaction pattern to climate change in Alaska. In Fairbanks, the heading of ‘Otal’ advanced quicker (2.9 days per decade) than that of ‘Thual’ (2 days per decade) (Figure 1), resulting in the heading dates of ‘Otal’ being significantly early and yield of ‘Otal’ declined significantly. In Delta Junction, the heading of ‘Thual’ advanced quicker than that of ‘Otal’ but the advances were not significant (Figure 1). The differences in yield losses of ‘Otal’ and ‘Thual’ in Fairbanks may be attributed to the fact that ‘Thual’ had late maturity and was less sensitive to climate change than ‘Otal’, coincidently resulting in avoiding the unanticipated temperature and precipitation during heading. Therefore, in order to adapt to the climate change and maintain the yield of cultivar, later sowing in Fairbanks would be good for some early maturity cultivars like ‘Otal’ to avoid the high minimum temperature and drought before heading. This late sowing strategy may also be suitable for other barley cultivars in higher latitude regions.
Fairbanks and Delta Junction are two major crop growing areas because of high temperature and enough precipitation in the summer. However, because of higher elevation of Delta Junction compared with Fairbanks, Delta Junction is drier and cooler in May, resulting in barley planting, emergence, heading, and maturing 3–4 days later than the average compared to those in Fairbanks [22]. The results in this study confirmed this trend, with later heading and lower yields for both ‘Otal’ and ‘Thual’ in Delta Junction than those in Fairbanks. Maybe the yields of ‘Otal’ and ‘Thual’ did not change significantly in Delta Junction for the past three decades partly due to no change in heading and maturity dates and weather patterns during heading. It is suggested that the early matured barley cultivars can still be grown in cooler areas like Delta Junction.
In this study, only two barley cultivars were selected to analyze the effect of climate changes during heading on the yields because these two cultivars had a long testing history and these two represent two different types of barley, hull and hulless barley. From this study, it seems that the heading of hull barley ‘Otal’ is more sensitive to climate change than the hulless barley ‘Thual’. It is possible that ‘Otal’ is a photoperiod-sensitive cultivar and ‘Thual’ is a photoperiod-insensitive cultivar. In order to provide more information for breeding systems and better adapt to climate change, further study is needed for currently used cultivars and breeding lines to detect the genes that control the heading such as the photoperiod-sensitive gene (Ppd-H1 and Ppd-H2), FLOWERING LOCUS T 1 (HvFt1), Vrn_H1, HvVrn1, HvVrn2, HvVrn3 and EARLINESS PER SE (EPS) gene [7,12,35].
It has been found that barley yields strongly depend on the number of grains m−2 in Poland and medium early cultivars had the highest number of grains/spike in Serbia [5,36]. The previous report, based on the study in Palmer, Alaska, showed that variation in length of the BH stage affects grain yield more than variation in length of AH (grain filling period) [37]. The results in this study showed that the reduction in ‘Otal’ yield in Fairbanks was partly due to earlier heading. The shift heading may reduce the length from sowing to heading, leading to the ‘Otal’ yield loss in Fairbanks. The results in this study further confirm that in order to achieve the higher yield for early maturity cultivars, the breeding may focus on selecting the cultivars that have early maturity and long BH period in Alaska or medium early cultivars characterized by higher grain numbers per spike [36,37].

5. Conclusions

Climate change causes significantly advancing heading, coincidently changing the temperature and precipitation patterns at the periods of BH and AH which are responsible for reducing the yield of ’Otal’ in Fairbanks. Tmin and precipitation are two major weather factors that impact the yields of ‘Otal’ and ‘Thual’ and precipitation is more important regarding impact on barley yield than temperature. The results in this study indicate that earlier heading cultivars such as ‘Otal’ can still be grown in cooler areas where the heading of cultivar was less affected by climate change. Farmers should use diverse cultivars to avoid yield losses due to climate change. It is necessary to analyze the genomes of cultivars used in production and potential for breeding to identify if these cultivars contain photoperiod sensitive genes. It is better to grow cultivars that contain photoperiod insensitive genes or are used as parents for breeding. The early maturing cultivars or cultivars sensitive to climate change can be grown later to avoid the climate pattern changing at critical heading periods and reduce the effect of weather on heading and yield. Another strategy is to grow and select the cultivars that have a longer growing period from sowing to heading and a shorter growing period from heading to maturity.

Supplementary Materials

The following supporting information can be downloaded at: https://www.mdpi.com/article/10.3390/atmos13020310/s1, WeatherCropData.csv, DeltaYieldWeather.csv and codes.txt.

Author Contributions

Design, weather data, analysis, writing, M.C.; crop data, review and funding acquisition, M.Z.; crop data and review, R.M.V.V.; crop data and review, C.W.K. All authors have read and agreed to the published version of the manuscript.

Funding

This research was made possible by USDA Hatch project ALK 19-04 and Multi state project ALK 15-03.

Institutional Review Board Statement

Not applicable.

Informed Consent Statement

Not applicable.

Data Availability Statement

Data available on request.

Acknowledgments

We appreciate all the researchers, who were not listed as coauthors from the University of Alaska Fairbanks, for their great contributions to Alaska Small Grain Alternative Crop Testing Trials. These researchers include late Frank J. Wooding, Carol Lewis, Jenifer H. McBeath, Stephen M. Dofing, George A. Michel Jr., Brenton Sharratt, S. Frost, J. T. Hanscon, and G. M. Delucchi.

Conflicts of Interest

The authors declare no conflict of interest.

References

  1. Dawson, I.K.; Russell, J.; Powell, W.; Steffenson, B.; Thomas, W.T.B.; Waugh, R. Barley: A translational model for adaption to climate change. New Phytol. 2015, 206, 913–931. [Google Scholar] [CrossRef] [PubMed]
  2. Klink, K.; Wiersma, J.J.; Crawford, C.J.; Stuthman, D.D. Impacts of temperature and precipitation variability in the Northern Plains of the United States and Canada on the productivity of spring barley and oat. Int. J. Clim. 2014, 34, 2805–2818. [Google Scholar] [CrossRef]
  3. Brisson, N.; Gate, P.; Gouache, D.; Charmet, G.; Oury, F.-X.; Huard, F. Why are wheat yields stagnating in Europe? A comprehensive data analysis for France. Field Crops Res. 2010, 119, 201–212. [Google Scholar] [CrossRef]
  4. Schierhorn, F.; Hofmann, M.; Adrian, I.; Bobojonov, H.; Müller, D. Spatially varying impacts of climate change on wheat and barley yields in Kazakhstan. J. Arid. Environ. 2020, 178, 104164. [Google Scholar] [CrossRef]
  5. Hakala, K.; Jauhiainen, L.; Rajala, A.A.; Jalli, M.; Kujala, M.; Laine, A. Different response to weather events may change the cultivation balance of spring barley and oats in the future. Field Crops Res. 2020, 259, 107965. [Google Scholar] [CrossRef]
  6. Hossain, A.; da Silva, J.A.T.; Lozovskaya, M.V.; Zvolinsky, V.P. High temperature combined with drought affect rainfed spring wheat and barley in South-Eastern Russia: I. phenology and growth. Saudi J. Bological Sci. 2012, 19, 473–487. [Google Scholar] [CrossRef] [PubMed] [Green Version]
  7. Al-Ajlouni, Z.; Al-Aballat, A.M.; Al-Ghzawi, A.L.A.; Ayad, J.Y.; Elenein, J.M.A.; Al-Quraan, N.A.; Baenziger, P.S. Impact of pre-anthesis water deficit on yield and yield components in barley (Hordeum vulgare L.) plants grown controlled conditions. Agronomy 2016, 6, 33. [Google Scholar] [CrossRef] [Green Version]
  8. Rajala, A.; Hakala, K.; Mäkelä, P.; Peltonen-Sainio, P. Drought effect on grain number and grain weight at spike and spikelet level in six-row spring barley. J. Agron. Crop Sci. 2011, 197, 103–112. [Google Scholar] [CrossRef]
  9. Reinhardt, D.; Jansen, G.; Seddig, S.; Eichler-Löbermann, B. Temperature stress during flowering time affects yield and quality parameters of waxy barley. Appl. Agric. For. Res. 2013, 63, 79–84. [Google Scholar]
  10. García, G.A.; Serrago, R.A.; Dreccer, M.F.; Miralles, D.J. Post-anthesis warm nights reduce grain weight in field-grown wheat and barley. Field Crops Res. 2016, 195, 50–59. [Google Scholar] [CrossRef]
  11. Hakala, K.; Jauhiainen, L.; Himanen, S.J.; Rötter, R.; Salo, T.; Kahiluoto, H. Sensitivity of barley varieties to weather in Finland. J. Agric. Sci. 2012, 150, 145–160. [Google Scholar] [CrossRef] [PubMed] [Green Version]
  12. Alqudah, A.M.; Schnurbusch, T. Heading date is not flowering time in spring barley. Front. Plant Sci. 2017, 8, 896. [Google Scholar] [CrossRef] [Green Version]
  13. Cammarano, D.; Ronga, D.; Francia, E.; Akar, T.; Al-Yassin, A.; Benbelkacem, A.; Grando, S.; Romagosa, I.; Stanca, A.M.; Pecchioni, N. Genetic and Management Effects on Barley Yield and Phenology in the Mediterranean Basin. Front. Plant Sci. 2021, 12, 578. [Google Scholar] [CrossRef]
  14. Mansour, E.; Moustafa, E.S.; Qabil, N.; Abdelsalam, A.; Wafa, H.A.; El Kenawy, A.; Casas, A.M.; Igartua, E. Assessing different barley growth habits under Egyptian conditions for enhancing resilience to climate change. Field Crops Res. 2018, 224, 67–75. [Google Scholar] [CrossRef]
  15. Inagaki, M.; Masuda, S. Heading responses to temperature and day-length in barley varieties. Jpn. J. Breed. 1984, 34, 423–430. [Google Scholar] [CrossRef]
  16. Cheng, M.; Zhang, M.; Van Veldhuizen, R.M.; Knight, C.W. Growing season and phenological stages of small grain crops in response to climate change in Alaska. Am. J. Clim. Chang. 2021, 10, 490–511. [Google Scholar] [CrossRef]
  17. Bieniek, P.A.; Walsh, J.E. Using climate divisions to analyze variation and trends in Alaska temperature and precipitation. J. Clim. 2014, 27, 2800–2818. [Google Scholar] [CrossRef]
  18. Hinzman, L.D.; Bettez, N.; Bolton, W.R.; Chapin, F.S.; Dyurgerov, M.B.; Fastie, C.L.; Griffith, B.; Hollister, R.; Hope, A.; Huntington, H.P.; et al. Evidence and implications of recent climate change in northern Alaska and other arctic regions. Clim. Chang. 2005, 72, 251–298. [Google Scholar] [CrossRef]
  19. Shulski, M.; Wendler, G. The Climate of Alaska; University of Alaska Press: Fairbanks, AK, USA, 2007. [Google Scholar]
  20. Wendler, G.; Gordon, T.; Stuefer, M. On the Precipitation and Precipitation Change in Alaska. Atmosphere 2017, 8, 253. [Google Scholar] [CrossRef] [Green Version]
  21. Zadoks, J.; Chang, T.; Konzak, C. A decimal code for the growth stages of cereals. Weed Res. 1974, 14, 415–421. [Google Scholar] [CrossRef]
  22. Van Veldhuizen, R.M.; Zhang, M.; Knight, C.W. Performance of Agronomic Crop Cultivars in Alaska 1978–2012; Bulletin 116; Agricultural and Forestry Experiment Station, University of Alaska Fairbanks: Fairbanks, AK, USA, 2014; 252p. [Google Scholar]
  23. Sharratt, B.S.; Knight, C.W.; Wooding, F. Climatic impact on small grain production in the subarctic region of the United States. Arctic 2003, 56, 219–226. [Google Scholar] [CrossRef] [Green Version]
  24. Peltonen-Sainio, P.; Venäläinen, A.; Mäkelä, H.M.; Pirinen, P.; Laapas, M.; Jauhiainen, L.; Kaseva, J.; Ojanen, H.; Korhonen, P.; Huusela-Veistola, E.; et al. Harmfulness of weather events and the adaptive capacity of farmer at high latitudes of Europe. Clim. Res. 2016, 67, 221–240. [Google Scholar] [CrossRef]
  25. Young, A.H.; Knapp, K.R.; Inamdar, A.; Hankins, W.; Rossow, W.B. The International Satellite Cloud Climatology Project H-Series climate data record product. Earth Syst. Sci. Data 2018, 10, 583–593. [Google Scholar] [CrossRef] [Green Version]
  26. R Core Team. R: A Language and Environment for Statistical Computing; R Foundation for Statistical Computing: Vienna, Austria, 2021; Available online: https://www.R-project.org/ (accessed on 10 November 2021).
  27. Lobell, D.B.; Cahill, K.N.; Field, C.B. Historical effects of temperature and precipitation on California crop yield. Clim. Chang. 2007, 81, 187–203. [Google Scholar] [CrossRef]
  28. Korner-Nievergelt, F.; Roth, T.; von Felten, S.; Guélat, J.; Almasi, B.; Korner-Nievergelt, P. Bayesian Data Analysis in Ecology Using Linear Models with R, BUGS, and Stan; Elsevier Science: New York, NY, USA, 2015. [Google Scholar]
  29. Peltonen-Sainio, P.; Jauhiainen, L.; Trnka, M.; Olesen, J.E.; Calanca, P.; Eckersten, H.; Eitzinger, J.; Gobin, A.; Kersebaum, K.C.; Kozyra, J.; et al. Coincidence of variation in yield and climate in Europe. Agric. Ecosyst. Environ. 2010, 139, 483–489. [Google Scholar] [CrossRef]
  30. Högy, P.; Poll, C.; Marhan, S.; Kandeler, E.; Fangmeier, A. Impacts of temperature increase and change in precipitation pattern on crop yield and yield quality of barley. Food Chem. 2013, 136, 1470–1477. [Google Scholar] [CrossRef] [PubMed]
  31. Alqudah, A.M.; Schnurbusch, T. Awn primordium to tipping is the most decisive developmental phase for spikelet survival in barley. Funct. Plant Biol. 2014, 41, 424–436. [Google Scholar] [CrossRef] [Green Version]
  32. Kolář, P.; Trnka, M.; Brázdil, R.; Hlavinka, P. Influence of climatic factors on the low yields of spring barley and winter wheat in Southern Moravia (Czech Republic) during the 1961–2007 period. Theor. Appl. Climatol. 2014, 117, 707–721. [Google Scholar] [CrossRef]
  33. Borrego-Benjumea, A.; Carter, A.; Glenn, A.J.; Badea, A. Impact of excess moisture due to precipitation on barley grain yield in the Canadian Prairies. Can. J. Plant Sci. 2018, 99, 93–96. [Google Scholar] [CrossRef]
  34. Schelling, K.; Born, K.; Weissteiner, C.; Kühbauch, W. Relationships between yield and quality parameters of malting barley (Hordeum vulgare L.) and phenological and meteorological data. J. Agron. Crop Sci. 2003, 189, 113–122. [Google Scholar] [CrossRef]
  35. Borràs-Gelonch, G.; Slafer, G.A.; Casas, A.M.; van Eeuwijk, F.; Romagosa, I. Genetic control of pre-heading phases and other traits related to development in a double-haploid barley (Hordeum vulgare L.) population. Field Crops Res. 2010, 119, 36–47. [Google Scholar] [CrossRef] [Green Version]
  36. Mirosavljević, M.; Momčilović, V.; Denčić, S.; Mikić, S.; Trkulja, D.; Pržulj, N. 2018, Grain number and grain weight as determinants of triticale, wheat, two-rowed and six-rowed barley yield in the Pannonian environment. Span. J. Agric. Res. 2018, 16, e0903. [Google Scholar] [CrossRef] [Green Version]
  37. Dofing, S.M. Phenological development-yield relationships in spring barley in a subarctic environment. Can. J. Plant Sci. 1995, 75, 93–97. [Google Scholar] [CrossRef]
Figure 1. Map with latitude and longitude showing the locations of two testing sites in Alaska, USA.
Atmosphere 13 00310 g001
Figure 2. Linear trends of the heading dates of ‘Otal’ and ‘Thual’ from 1991 to 2018 in Fairbanks (Top) and from 1992 to 2014 in Delta Junction, Alaska (Bottom). DOY = Day of Year.
Atmosphere 13 00310 g002
Figure 3. Linear yield changes of barley cultivar ‘Otal’ and ‘Thual’ in Fairbanks from 1991 to 2018 and Delta Junction from 1992 to 2014. (A) ‘Otal’ in Fairbanks; (B) ‘Otal’ in Delta Junction; (C) ‘Thual’ in Fairbanks; (D) ‘Thual’ in Delta Junction.
Atmosphere 13 00310 g003
Figure 4. Percentage changes of yields of ‘Otal’ (AD) and ‘Thual’ (EH) with 1 °C temperature increase (Tmax, Tmin, and Tdtr) and 1 cm precipitation increase at the periods of 10 days BH and AH in Fairbanks and Delta Junction. BH_F and AH_F represent the periods of 10 days BH and AH in Fairbanks, respectively; BH_DJ and AH_DJ represent the periods of 10 days BH and AH in Delta Junction.
Atmosphere 13 00310 g004
Table 1. The trends of TmaxBH, TminBH, TdtrBH, PBH, TmaxAH, TminAH, TdtrAH, and PAH at 7–21 days of ‘Otal’ and ‘Thual’ heading from 1991 to 2018 in Fairbanks and from 1992 to 2014 in Delta Junction, Alaska.
Climatic ParametersDaysTrend (°C year−1 or cm year−1)
Location
FairbanksDelta Junction
OtalThualOtalThual
TmaxBH70.0370.056−0.215 *−0.142
100.00070.066−0.15−0.14
14−0.070.04−0.09−0.09
21−0.08−0.02−0.11−0.08
TminBH7−0.0140.068−0.015−0.004
10−0.020.0590.0260.01
14−0.050.030.0280.019
21−0.030.0080.030.012
TdtrBH70.049−0.016−0.22 **−0.149 *
100.020.008−0.18 **−0.16 **
14−0.020.02−0.13 **−0.11 *
21−0.054−0.02−0.14 **−0.10 *
PBH7−0.05 *−0.0190.093 **0.055
10−0.009−0.0140.090.09
14−0.022−0.0360.130.087
210.0150.0030.210.17
TmaxAH7−0.015−0.004−0.017−0.007
10−0.005−0.026−0.017−0.036
14−0.004−0.05−0.11−0.12 *
210.0001−0.014−0.086−0.10
TminAH70.0760.0490.0580.021
100.074 *0.050.0680.032
140.06 *0.030.030.012
210.07 **0.05 *0.0130.014
TdtrAH7−0.095 *−0.058−0.078−0.032
10−0.078 *−0.073−0.082−0.069
14−0.07 *−0.08 *−0.12 **−0.12 **
21−0.08 *−0.07−0.1 **−0.11 *
PAH70.0690.097−0.02−0.013
100.0820.104−0.04−0.051
140.11 *0.12−0.007−0.012
210.100.11−0.08−0.04
Note: * indicates trend significant at p < 0.05; ** indicates trend significant at p < 0.01.
Table 2. Trends of drought days during 7, 10, 14, and 21 days BH and AH of ‘Otal’ and ‘Thual’ from 1991 to 2018 in Fairbanks and Delta Junction from 1992 to 2014.
Climate VariablesDaysLocation
FairbanksDelta Junction
OtalThualOtalThual
PBH7 0.060.02−0.07−0.08
10 0.050.02−0.09−0.14 *
14 0.020.04−0.05−0.09
21 0.010.04−0.12−0.06
PAH7 −0.05−0.060.010.002
10 −0.07−0.060.0150.006
14 −0.09−0.06−0.03−0.07
21 −0.04−0.02−0.05−0.02
Note: “+” indicates drought days increase; “-” indicates drought days decrease; bold indicates trend significant at p < 0.1 and * indicates trend significant at p < 0.05.
Table 3. R2ajusted of multiple linear modes from Equations (1) and (2). The dependent variable is ΔLog(Yield) and the independent variables are ΔX1, ΔX2, ΔX3, ΔX4, ΔX5, and ΔX6 which represent first difference values of time series of TminBH, TdtrBH, PAH, TminAH, TdtrAH, and PAH at different days of BH and AH of cultivars (‘Otal’ or ‘Thual’) at locations (Fairbanks or Delta Junction).
ModelsR2ajusted
Location
FairbanksDelta Junction
OtalThualOtalThual
Equation (1)Equation (2)Equation (1)Equation (2)Equation (1)Equation (2)Equation (1)Equation (2)
Model7,7 §0.440.210.160.30−0.21−0.02−0.110.02
Model7,100.510.280.390.34−0.110.03−0.10−0.06
Model7,140.210.180.450.370.160.08−0.05−0.07
Model7,210.330.240.340.37−0.14−0.02−0.07−0.08
Model10,70.510.25−0.030.13−0.070.12−0.020.16
Model10,100.560.310.130.16−0.070.110.0160.11
Model10,140.360.220.100.170.140.140.030.10
Model10,210.420.260.150.220.050.110.120.11
Model14,70.390.210.220.08−0.030.060.400.49
Model14,100.410.260.410.13−0.120.060.320.31
Model14,140.210.170.400.130.040.100.340.32
Model14,210.230.230.430.20−0.070.060.370.32
Model21,70.220.170.240.080.140.160.160.17
Model21,100.320.230.350.13−0.030.120.06−0.001
Model21,140.10.130.330.130.070.140.08−0.007
Model21,210.140.200.350.200.0140.130.22−0.008
§: modelk,l: k = 7, 10, 14, or 21 days BH; l = 7, 10, 14, or 21 days AH.
Table 4. The coefficients, R2, and R2ajusted of the best models for cultivar ‘Otal’ selected from Equations (4)–(6). The climatic factors are ΔX1–ΔX6 which represent ΔTminBH, ΔTdtrBH, ΔPBH, ΔTminAH, ΔTdtrAH, and ΔPAH at 10 days BH and AH, respectively.
FairbanksDelta
Climatic FactorsEquation (4)Equation (5)Equation (6)Equation (4)Equation (5)Equation (6)
Intercept5.8 × 10−174.7 × 10⁻¹⁷−0.13−0.018−0.09−1.3 × 10⁻¹⁸
(0.13)(0.18)(0.26)(0.22)
ΔX1−0.52 ** −0.21−0.17
(0.14)(0.18)(0.38)
ΔX2 0.460.35
(0.27)(0.28)
ΔX3−0.74 ** −0.070.32 0.44 *
(0.22)(0.35)(0.36)(0.20)
ΔX1 × ΔX3 −0.44 *
(0.19)
ΔX2 × ΔX3 0.27
(0.22)
ΔX40.34 *0.26 −0.37−0.14
(0.13)(0.18)(0.29)(0.23)
ΔX5−0.30−0.31 0.390.18
(0.15)(0.18)(0.28)(0.24)
ΔX60.93 ***0.41 * −0.11−0.23
(0.22)(0.18)(0.29)(0.23)
ΔX4 × ΔX6 −1.3 *−0.86
(0.44)(0.30)
ΔX5 × ΔX6 0.420.39
(0.31)(0.26)
R20.660.340.350.590.460.20
R2ajusted0.570.250.230.280.290.16
Note: *, **, and *** indicate the significance of coefficients at p < 0.05, p < 0.01, and p < 0.001, respectively.
Table 5. The coefficients, R2, and R2ajusted of best models for cultivar ‘Thual’ selected from Equations (4)–(6). The climatic factors are ΔX1–ΔX6 which represent ΔTminBH, ΔTdtrBH, ΔPBH, ΔTminAH, ΔTdtrAH, and ΔPAH at 10 days BH and AH, respectively.
FairbanksDelta
Climatic FactorsEquation (4)Equation (5)Equation (6)Equation (4)Equation (5)Equation (6)
Intercept−0.13−0.018−0.03−0.42−0.19−0.029
(0.16)(0.15)(0.15)(0.27)(0.23)(0.20)
ΔX1 0.10
(0.15)
ΔX20.009 −0.16 *
(0.12)(0.07)
ΔX30.14 0.16 0.18
(0.10)(0.16)(0.09)
ΔX1 × ΔX3 −0.05
(0.04)
ΔX2 × ΔX3−0.02
(0.014)
ΔX4 −0.21
(0.16)
ΔX5−0.14 −0.024−0.14
(0.08)(0.19)(0.18)
ΔX6 0.12 * −0.05−0.06
(0.05)(0.10)(0.09)
ΔX4 × ΔX6 −0.10−0.09
(0.06)(0.06)
R20.410.230.210.470.180.17
R2ajusted0.270.190.170.190.040.12
Note: * indicates the significance of coefficients at p < 0.05.
Table 6. The coefficients, R2, R2ajusted of models of yields of ‘Otal’ and ‘Thual’ in Fairbanks and Delta Junction. The independent variables are categorical climatic parameters at 10 days BH and AH based on Equation (7).
FairbanksDelta Junction
OtalThualOtalThual
Intercept4113.4 ***3441.8 ***2229.3 ***2347.8
X1Y−2009.01686.4−1197
X3Y−1987.7 *−1267.9 *−802.61580.7
X2GTA3583.5 *−130.9 −1143.8 *
X2LTA−79.75−701.3 −460.2
X4Y641.3 −3838.4 *
X6Y−792.6395.8−295.4
X5GTA455.5896.6
X5LTA−1607.5 *−12.8
X1Y:X3Y4652.9 4372.9 *
X3Y:X2GTA −2799.8 −2073.7
X3Y:X3LTA−207.7−628.9
X4Y:X6Y5589.6 * 3827.8
X6Y:X5GTA−6174.4 *−1231.2
X6Y:X5LTA112.3−2190.2
R20.680.720.400.48
R2ajusted0.380.450.180.36
Note: * and *** represent the significance at p < 0.05 and p < 0.001, respectively. X1Y = Tmax > 25 °C at BH, X2GTA = Tmin > upper limit of 95% confidence interval of Tmin in Fairbanks or Delta Junction, X2LTA = Tmin < lower limit of 95% confidence interval of Tmin in Fairbanks or Delta Junction, X3Y = precipitation < 5 mm at BH, X4Y = Tmax > 25 °C at AH, X5GTA = Tmin > upper limit of 95% confidence interval of Tmin in Fairbanks or Delta Junction, X5LTA = Tmin < lower limit of 95% confidence interval of Tmin in Fairbanks or Delta Junction, X6Y = precipitation < 5 mm at AH.
Publisher’s Note: MDPI stays neutral with regard to jurisdictional claims in published maps and institutional affiliations.

