Abstract
New polysaccharides are being intensely studied as sources of edible materials, with potential application in food packaging systems, eco-materials and the pharmaceutical industry. This investigation aimed to develop biopolymer films based on the polysaccharides obtained from chañar (CH) fruit (Geoffrea decorticans). The resulting polysaccharides, from hydrothermal extraction (CHT) and acid extraction (CHA) were hydrodynamically characterized, with density, viscosity, and diffusion coefficient measurements to obtain their properties in an aqueous solution (intrinsic viscosity, shape factor, partial specific volume, hydration value, molecular weight, and hydrodynamic radius). The polysaccharides films (CHTF and CHAF) were characterized with SEM/EDX, DSC, TGA-DTG, FTIR, DRX, mechanical tests, water vapor permeation, colorimetry, antioxidant capacity, and biodegradability, to determine potential applications based on these properties. The results indicated that the extraction method affects the hydrodynamic properties of the obtained polysaccharide. They differ in molecular weight, and RH of CHT was greater than CHA. Both gums were quasi-spherical, and the νa/b value of CHT was more than CHA. The films properties did not present significant differences in most cases. SEM micrographs illustrate that CHAF presents a much rougher surface. The results of the mechanical analysis show that CHTF has better mechanical properties, it has higher elongation at break and tensile strength, with a Young Modulus of 2.8 MPa. Thermal analysis indicates good thermal stability of the films until about 150 °C. The degradation study shows that CH films are biodegradable in a 35 day range. The study of this properties is critical to demonstrate the functionality of biopolymers and their application. The obtained results represent an advantage and evidence that chañar is an interesting source for extract polysaccharides with film forming properties.
Keywords:
chañar; Geoffrea decorticans; biopolymer; films; hydrodynamic properties; biodegradability 1. Introduction
New polysaccharides are being intensively studied around the world. The purpose of these new polysaccharides goes from applications such as food (gels, additives, dietetics, thickeners, co-emulsifiers, stabilizers, etc.) [1,2,3,4,5,6,7,8,9,10], packaging (protective and biodegradable films) [11,12,13], eco-materials [14], pharmaceuticals (capsules, patches, excipients [15], anticoagulants, antilipidics, anti glycemic, antioxidants, nutraceuticals, etc.) [16,17].
Each year approximately 400 million tons of plastics are produced, and less than 9% is recycled. The development of biopolymers is of great interest due to the environmental pollution generated by plastics production. In addition, plastics derived from petroleum are disposed of into the environment and remain for hundreds of years without decomposing. Bioplastics are materials derived from renewable sources, generally biodegradable. The use of these biomaterials would reduce environmental pollution and the consumption of fossil resources, making them a much safer alternative [18].
Food waste as a raw material represents one of the most recent applications in the research field of bioplastics production. Different types of food waste, mostly fruits, and vegetables, have been used. This makes it possible to value food waste, and as a result, benefits the economy, providing a new source of circular economy [18]. Agricultural waste is derived from various sources, such as grape marc, tomato, pineapple, orange and lemon peels, sugarcane bagasse, rice husks, wheat straw, and palm oil fibers, are some examples of affordable materials and available. Precursors that are rich in carbon are used for the production of the bio-based polymer through chemical, microbial, and biopolymer blending methods [18,19]. Despite the development of advanced synthetic methods and the application of biofilms in smart/intelligent food packaging, construction, exclusion nets, and medicine, commercial production is limited by costs, helpful life, biodegradation concerns, and availability of adequate agro-wastes [19]. Gheorghita et al. 2021 [20] highlight polysaccharides in the pharmaceutical industries and as encapsulation materials for controlled drug delivery systems, including probiotics, focusing on their development and benefits. Bioplastic materials have several weaknesses in terms of their mechanical and barrier properties that have resulted in several studies on composite systems [21]. Hong et al. in 2021 [22] present a review of bioplastics materials applied for food packaging, other possible materials, such as plastics, paper, metal, and glass, are also discussed. Lavudi et al. in 2020 [23] study galactomannans extracted from legume seed endosperm and their multipurpose applications. Their modified structure, sulfated and carboxymethylated, could be used in nanotechnology for drug delivery and carriers.
The extraction of new polysaccharides can be achieved through different hydrolysis or complex methodologies. For example, goji gum (Lycium barbarum) is extracted by thermal, acidic, and basic hydrolysis [24]. Khaya gum is a purified exudate of Khaya ivonensis, which is dissolved, filtered, and then precipitated with ethanol [25]. Ficus glumosa gum is an exudate purified in a solution of pH 2 with HCl and then precipitated with ethanol [26]. Other more complex extractions, such as Dictyophora indusiata gum, use hot water, or microwave-assisted, pressurized assisted, and ultrasonic-assisted extraction [27].
Novel sources of edible materials and novel processing techniques are a subject of great interest due to their promising potential as innovative food packaging systems [28,29]. Galus et al. work in 2020 [28], presents the concept and potential application of new film-forming materials and management of food wastes from the fruit and vegetable industry, which can encounter problems at appropriate disposal. More recently, biodegradable packaging materials, sometimes edible, are also used to deliver functional ingredients, which reveals their potential for drug delivery to counter the nutrient deficiency problems. Amin et al. 2021 [29], highlights the potentials of bio-based materials, i.e., proteins, polysaccharides, lipids, etc., to develop biodegradable packaging materials. Active packaging is a way of packaging in which the food product, the packaging material, and the environment interact positively to extend the shelf life of food [30]. When food products are stored by an active packaging system, the system’s chemical, physical, and biological activities alter the condition of food, leading to an increase in its shelf life and without affecting its quality [31]. Apart from packaging, edible films can also be used for the protection of food products from oxidation and microbial growth [32].
Polysaccharides obtained from plants have been investigated to develop packaging materials with a non-petrochemical base. Films prepared from alcayota gum (AlcOH) present strong hydrophilicity, an interesting property. By crosslinking with glutaraldehyde (Glu), the modified films exhibit water resistance and low O2 permeation, which make them very useful films [33]. Tara gum (TG) films were evaluated as barriers for agricultural and food industries. The crosslinked films exhibit better mechanical properties [34]. Additionally, polysaccharides from Melia azedarach (MA) were extracted to be used, e.g., in the agricultural industry [35]. Locust bean gum has been used alone or combined with other biopolymers (e.g., polysaccharides, proteins, and lipids) to develop films due to its superior biodegradable, rheological, and film-forming properties. These films are not only used as active packaging and edible coating in the food industry, also used in the pharmaceutical industry [36]. Capsosiphon fulvescens (CF) is an underutilized green alga; packaging materials have been developed using Capsosiphon fulvescens polysaccharides, which could be used as packaging materials as a natural antioxidant to develop a food usable antioxidant film [37]. Sargassum pallidum polysaccharides were incorporated into chitosan to develop a novel edible active film via ultrasonication. The results show that combined ultrasonic treatment and the addition of sargassum polysaccharide could significantly enhance the films’ tensile strength, elongation, and transparency, whereas the water vapor permeability was decreased. In addition, antioxidant effect evaluation showed that the Chitosan films with sargassum exhibited better antioxidant activity than chitosan films [38]. Novel biodegradable noni (Morinda citrifolia) fruit polysaccharides films containing blueberry (Vaccinium corymbosum) were made. The prepared films had good mechanical properties. The addition of blueberry polysaccharides enhanced the antioxidant activities of the films [39]. Films using carboxymethyl cellulose, hydroxypropyl methylcellulose, high-methoxyl pectin, low-methoxyl pectin, sodium alginate, and locust bean gum were prepared using like source polysaccharide extracted from jambolan and grape juices. The films exhibited good mechanical properties [40]. Citrus peel is a valuable source of pectin since it was found in the internal and external parts. Pectin is used as a film in packaging, thickener, and gelling agent in the manufacture of jellies and preserves, in wines as dehydrating plant tissues, in milk to precipitate casein, etc. [41]. Lemon and fennel wastes were recovered and used as secondary-raw polysaccharide sources. The extracted polysaccharides were used as eco-friendly and cost-effective plasticizers of sodium alginate films [42].
Currently, there is a growing interest in sustainably using natural resources. Finding the chañar tree (Geoffroea decorticans) is a good objective to cover this interest since it is currently not cultivated or harvested and is little exploited in its natural habitat. The chañar develops in dry areas and on the banks of streams, growing in clay, brackish soils, or even in dunes, sometimes forming small groves called chañarales. The species is characterized by forming islets or groves of rounded shape, which as a result of its asexual reproduction expands along its edges, progressively occupying more and more surface area. The spread of this species constitutes an excellent problem for farmers since their fields, originally pastures, end up being invaded with chañares. Therefore, chañar is considered a pest due to its ability to colonize the lands used for grazing [43]. All of the above ratifies the attractiveness of chañar as a raw material for obtaining polysaccharides in our study and allows revaluation of the tree that is considered as a pest that is deforested. Chañar blooms from September to October and bears fruit from November to January. The fruit is a drupe, very fleshy, sweet, and edible. The fruit of Chañar is globose or ovoid, reddish in color, and its size is from 1.5–3 cm. It is edible, with a sweet and pleasant taste [44]. The fruit could be used to get food, flour-based, with considerable fiber content, gluten-free, satisfying population health needs, and taking advantage of a nutritional resource with economic potential. In turn, its sustainable exploitation would generate a vast work and production area with innovative and straightforward processes [45]. For a long time, its safety has been made known thanks to the consumption of fruits by humans and animals in many semi-arid places in Argentina, especially in aboriginal and rural communities [46].
This work’s aim was to obtain polysaccharides from chañar fruit. Two different extraction methods were used: thermal (CHT) and acid hydrolysis (CHA). A whole study of the hydrodynamic properties in solution of the obtained polysaccharides was carried out; the technique used was intrinsic viscosity. The polysaccharides films (CHTF, CHAF) were properly characterized using different physical-chemical methods. Mechanical tests, water vapor permeation, colorimetry, antioxidant capacity, and biodegradability properties were also studied to determine potential applications of chañar films.
2. Materials and Methods
2.1. Chañar Gum Extraction Procedure
Chañar fruits were collected from Merlo, San Luis, Latitude −32.3711 and Longitude 65.0176 (Argentina). The process begins with the flour obtained from the fruit, in this case, the chañar peel and pomace. For the extraction of polysaccharides from Chañar, the chañar flour is pretreated with a hydroalcoholic solution, in a 50/50 proportion, under agitation at 50 °C for 30 min. Next, the previously treated flour is agitated with water (100 /mL 10 g flour), at a temperature between 70–80 °C, for 6 h. This process was repeated twice. The filtered solutions were heated to decrease the volume and precipitated from the concentrated solution with ethanol (96% vol) (Bialcohol, Cordoba, Argentina), added in a 70/30 ratio (alcohol/filtrate). The dispersion was adequately mixed and cooled for 12 h. The polymer obtained was dry at 60 °C in an oven for 48 h (CHT) [46]. For acid extraction (CHA) the procedure was the same as the previous one, except that 100 mL of HCl-Ascorbic Acid solution was used per 10 g of chañar flour. The HCl-Ac solution with concentration 0.01 M of HCl (Ciccarelli, San Lorenzo, Argentina) and 0.1 M ascorbic acid (Anhedra, Bahia Blanca, Argentina). The chañar gums were completely dry and macerated to store.
2.2. Characterization of Chañar Polysaccharide in Solution
Polysaccharide properties in water solution were measured, such as density, viscosity, and diffusion coefficient. The CHT and CHA solutions were prepared with distilled water at 25 °C under constant stirring until total dissolution. The concentrations used were 0.1, 0.2, 0.3, 0.4, 0.5, 0.75 and 1% wt.
2.2.1. Viscosity and Density
A Ubbelohde glass capillary viscometer 1B (IVA, Gral. Artigas, Argentina) with a 30-second run-off time was used, partially submerged in an Ultraterm (Barcelona, Spain) S-383 thermostatic bath at 25 °C. A digital chronometer was used to measure the run-off time of the solutions. An Anton Paar DMA 35N (Graz, Austria) densimeter was also used to determine the density of water and solutions [47].
Viscometry
Viscosity is one of the most important properties of polymer solutions. The viscosity depends on the chemical structure of the polymer, the interactions with the solvent, and molecular weight. Usually, a molecule of high molecular weight in a good solvent acquires a large hydrodynamic volume, and the viscosity of the solution increases [41,48].
The viscometry of dilute solutions is related to the measurement of the intrinsic ability of a polymer to increase the viscosity of a solvent at a given temperature and is helpful in obtaining information related to the size and shape of the polymer molecules in solution and the polymer-solvent interactions. In the diluted regime, the viscosity of a polymer solution (for very low polymer concentrations) is determined relative to the viscosity of the solvent. The following terms are defined in these cases:
where η is the viscosity of the polymer solution and ηo is the viscosity of the pure solvent.
where C is the concentration of the polymer. This is a measure of the ability of the polymer to increase the viscosity of a solvent. Even in highly diluted solutions, polymer molecules can form intermolecular interactions. The two contributions to reduced viscosity are the movement of the isolated molecules in the solvent and the interaction between the polymer molecules in the solution. To eliminate the interactions, it is necessary to extrapolate to zero concentration to obtain the inherent and reduced viscosities commonly known as intrinsic viscosity.
specific viscosity, ηsp = ηr − 1
The intrinsic viscosity has the units of volume/mass (cm3/g); it is a measure of the size of a molecule in solution, based on the ability of a polymer molecule to increase the viscosity of a solvent in the absence of intermolecular interactions [48]. The Huggins and Kraemer equations are the most common equations for evaluating the intrinsic viscosity, given by Equations (5) and (6), respectively. The usual procedure for determining the intrinsic viscosity is to determine the relative viscosity for different concentrations of polymer and to represent the data using Equation (3), then calculate the value at zero concentration [48].
Mark and Houwink (M–H), independently correlated the intrinsic viscosity with molecular weight, and this equation applies to many polymers and biopolymers and is used to determine molecular weight. The “k” and “a” parameters vary with the polymer’s nature, temperature, and solvents. The calculation of M–H parameters is carried out by the plot representation of the following equation:
The exponent “a” is a function of polymer geometry and varies from 0.5 to 2.0. These constants can be determined experimentally by measuring the intrinsic viscosity of several polymer samples. An independent method has determined the molecular weight (e.g., diffusion, osmotic pressure, sedimentation equilibrium, and light scattering) [41]. The Mark–Houwink parameters are calibrated against the T series of dextrans (Fluka, Germany) from 8.8–2000 g/mol.
The νa/b is calculated from the next equation:
where Vs is the specific volume (cm3/g).
Partial specific volume, ῡ (cm3/g), can be calculated with density measurements according to the following equation:
where hydration value, δ(gsolvent/gsolute), can be determined with the following equation:
2.2.2. Diffusion Coefficient
Viscosity is determined using the following equation:
where A is a viscometer constant (A = 3.0954 × 10⁻⁵ cm2/s2), 𝜌 is the density (g/cm3), and t is the drainage time (s).
The diffusion coefficient is determined by the following equation:
where KB is the Boltzmann constant (1.381 × 10⁻¹⁶ erg/K) and T, the temperature (298 K), the RH (nm) is given by:
M is the molecular weight (g/mol), NA is the number of Avogadro (6.023 × 10²³ mol−1).
The relative diffusion:
Hence D is the diffusion coefficient of the solution and solvent (subindex 0). Hence Dsp* is the modified diffusion coefficient for a better calculation:
Then the intrinsic diffusion will be given by:
For the calculation of the molecular weight, the following equation is used:
kD is a constant for polymer-solvent, whose value is 0.02834 cm3/g. Whereas aD is a form factor (aD = 0.5109).
2.3. Films Preparation
Aqueous solutions of polysaccharides at 4% wt. (50 mL) were stirred for 2 h at 50 °C, next 2% v/v of glycerin was added to the solution as a plasticizer. Then the solution was cast on a Petri-plate (13 cm) and dried at 60 °C in an oven for 48 h. The film was peeled from the Petri plate. The templates for different characterizations were then cut.
2.4. Films Characterization
2.4.1. SEM/EDX
Morphology of films was observed using a scanning electron microscope (SEM) LEO 1450VP (Los Altos, CA, USA) and energy dispersion X-ray analysis was carried out using an EDS Genesis 2000 (EDAX, Los Altos, CA, USA). For the SEM morphological surface analysis, samples were prepared by immersion in liquid nitrogen and afterward coated with gold. They were observed under high vacuum, and EDAX spectrums were obtained applying an acceleration voltage of 120 kV [33]. For the determination of particles’ average diameter distribution, the program ImageJ (NIH, Chicago, Illinois, USA) was used.
2.4.2. FTIR
FTIR spectra were determined using diffuse reflectance (DRIFTS) and the transmission mode using a Nicolet PROTEGE 460 Spectrometer (Praga, R. Checa) in the operational range was 700–4000 cm−1. The number of scans for each sample was 64 [35].
2.4.3. TGA/DTG
Thermogravimetric analysis (TGA) was performed to estimate the thermal stability of chañar films. TGA measurements were recorded on TG 2950 analyzers (TA Instruments, Inc., New Castle, DE, USA), respectively. The operating conditions were as follows: heating rate 10° min−1, and atmosphere static air or dynamic N2 (99.99%, flow rate 50 mL/min, microfiltration). The thermogravimetric temperature axes were calibrated with indium (99.99%, melting point of 156.60 °C) and the Curie point of Ni (353 °C), respectively. Empty aluminum pans (40 mL) were used as references. Polysaccharide samples of about 8 mg were employed [33].
2.4.4. DSC
Differential Scanning Calorimetry (DSC) was obtained in STA 449F3-Jupiter equipment (Selb, Germany). Approximately 5 mg of material in an alumina crucible, the samples being subjected to heating from 25 to 400 °C, with a ratio of heating at 5 °C min−1 under dynamic nitrogen atmosphere with a flow of 25 mL min−1.
2.4.5. XRD
X-ray diffractions (XRD) studies were carried out using an equipment Rigaku model ULTIMA IV type II (Tokio, Japan), a lamp of Cupper, and a filter of Nickel. The 2θ operational range was from 3° to 60°, operated at 30 kV, 20 mA, 3° per minute sweep rate, 0.02° reading step, continuous mode. The d-spacing was determined by Bragg’s equation.
where d is the average intercatenary distance, n is the integer determined, λ is the wavelength of the X-ray (nm), and θ is Bragg’s angle [33].
2.4.6. Mechanical Properties
Mechanical properties were measured with a Comten Industries Series 94 VC instrument (USA) at a constant traction speed of 0.1 mm/min following the ASTM D882 requirements. To standardize the experimental procedure, the mechanical properties were measured at room temperature (25 °C) and relative humidity of 40%. The test was carried out for triplicate. The test samples used were 40 mm long by 10 mm wide, and the thickness was measured with a micrometer for every membrane. The data of force (F) and deformation (Δl) were recorded until the breaking point. Tensile strength (σ) was calculated by dividing the maximum load by the specimen’s initial cross-sectional area (A). Percentage elongation at break (% ) was calculated as the change percentage of the initial length of specimen (l0 = 40 mm) at the point of sample failure. Finally, the elastic module, or Young’s modulus (E) was calculated from the slope of the stress–strain curve (σ vs. ε) in the elastic region (the linear portion of the curve) [33,35]. The following equation gives the stress–strain relationship:
where: and
2.4.7. Colorimetry
The equipment used was MiniScan EZ colorimeter (Reston, Virginia, USA) model MSEZ-4500L with illuminant D65, observer 10°, and geometry 45°/0°. The equipment allows measurements of the color index and opacity, the values obtained by the equipment are given in the coordinates of the CIELAB color space. The color measurements were made on each film (diameter of 2.5 cm) with the intermediate viewing area accessory. Three measurements were taken at different points of the samples, the average values were recorded as the color parameters L*, a*, and b* [33]. Were L* indicates luminosity from 0 (black) to 100 (white), a* and b* are chromatographic coordinates, a* from green (−60) to red (+60) and b* from blue (−60) to yellow (+60) [49]. The film’s opacity was evaluated following the Hunterlab method in reflectance mode, using the same equipment.
2.4.8. Water Vapour Permeability
The equipment has a hermetically closed chamber that has an automatic humidity and temperature controller, both variables controlled by sensors (Electrotech Systems, Chicago, Illinois, USA). The humidity range that this sensor can detect is from 0 to 100%, and the accuracy in the measurement is 90% at 30 °C. The temperature and humidity are regulated by turning on or off the controllers of both variables: a focus and a humidifier. In addition, a RADWAG balance (Radom, Poland) with a precision of 0.1 mg and a Kölfe thickness micrometer (Munchen, Germany) with an accuracy of 0.1 μm was used. From the formed films, samples of 25 mm in diameter were cut, their thickness was taken, and they were placed in the perforated caps of the bottles with 20 g of silica gel inside each one. Before starting the experiment, each bottle with silica gel was weighed and put on the cap. Then, they enter the equipment, which must be at 30 °C and 85% humidity, and every 5 min, the weights of each were taken for 1 h. Then, they were weighed every 15 min, until the 3 h. of experiment and then every hour until 24 h. ASTM E96 standard.
The mechanism can be described for a homogeneous polymer film of thickness λ, permeant pressure p (with p1 > p2), and permeant concentrations c through the film (with c1 > c2):
where τ is the transmission speed (ng/m2s); Q, the permeating mass (ng); λ, the thickness of the film (m); A, the area of the cell (m2); t, the measurement time (s); and ΔP, the pure water vapor pressure, in the case of calculating water vapor permeability (4238.605 Pa), or high pressure in the case of calculating gas permeation [33,41].
2.4.9. Antioxidant Activity Assays
It is known that reactive oxygen species (ROS), such as superoxide anion radicals (O2−•), hydroxyl radicals (•OH), DPPH radicals, are considered to be the cause of liver-damaging oxidation and loss of bodily functions. Therefore, its determination is key in the study of novel polysaccharides [50].
Reducing Power
The reducing power was determined by the method described by Deng et al. [50]. In brief, 1 mL of polysaccharide solution (0.1–1 mg/mL), 0.2 mL of phosphate buffer (2 M, pH 6.6) and 0.5 mL of potassium ferricyanide (1% w/v) were incubated at 50 °C for 20 min. After the incubation, the reaction was stopped by adding 2.5 mL of trichloroacetic acid (TCA, 10% w/v) and centrifugated at 3000 g for 10 min. 1.5 mL of the supernatant was diluted in 3 mL of distilled water, and 0.2 mL of ferric chloride was added. The mix was properly stirred, and the absorbance was measured at 700 nm against the blank. The procedure was performed in triplicate as a positive control was used ascorbic acid in the same concentration of polysaccharide solutions.
Hydroxyl Radical Scavenging
The hydroxyl radical assay was measured according to the salicylic method described by Du et al. [51], with some modifications. In a test tube, 2 mL of polysaccharide solution (0.1–1 mg/mL) were added, followed by 2 mL of FeSO4 (4 mM), 2 mL of salicylic acid hydroalcoholic solution (4 mM), and 2 mL of H2O2 (4 mM), shaken and incubated at 37 °C for 30 min, and then centrifugated at 3000 g for 5 min. The absorbance of the supernatant was read at 510 nm. The hydroxyl scavenging rate (r) was calculated as follow:
where Ac, is the absorbance of the control, prepared with 2 mL of H2O replacing the sample. Where Am is the sample absorbance, and Ab is the blank absorbance, prepared for every sample with 2 mL of H2O replacing H2O2. The procedure was performed in duplicate. As a positive control, ascorbic acid was used. The results were expressed in mg/L equivalents of ascorbic acid.
DPPH Scavenging Activity
The DPPH radical scavenging activity was measured according to the method reported by Deng et al. [50], with some modifications. Briefly, 0.5 mL of polysaccharide solution (0.1–1 mg/mL) was added to 3 mL of a 90% ethanolic solution of DPPH (0.15 mM). The mixture was shaken and incubated for 30 min in total darkness. Absorbance was measured at 517 nm. The content of total antioxidants was expressed as the percentage of antioxidant activity (% AA), calculated as follow:
where Ac, is the absorbance of the control, prepared with 0.5 mL of H2O replacing the sample. Where Am is the sample absorbance. Ab is the absorbance of the blank, prepared for every sample, with 0.5 mL of sample and 3 mL of ethanol (90%). The procedure was performed in triplicated. As a positive control, ascorbic acid was used. For the ascorbic acid calibration curve, solutions of 16.08, 30.16, 60.3, and 80.4 mg/L were prepared and measured. The results were expressed in mg/L equivalents of ascorbic acid.
Total Polyphenol Content
This determination was carried out following the Folin–Ciocalteu method [52,53], with some modifications. To a 5 mL aliquot of sample was added 1.5 mL of F-C reagent (2 N) and 15 mL of Na2CO3 (15%), for a final volume of 25 mL completed with distilled water. The mixture was let stand in a place protected from light, at room temperature for 2 h. Once the reaction was complete, absorbance was measured at 760 nm. The amount of total phenolic compounds was expressed as gallic acid equivalents. Six concentrations of 1–6 mg/L of the gallic acid standard were prepared. The procedure was performed in duplicate.
Biodegradability
Approximately 200 g of humidified soil sample (70% RH) was placed in a covered container. Samples 10 mm wide by 40 mm long were cut and buried 2 cm deep. A metal mesh cell was used to contain the membrane, with approximately 50 × 20 mm2 dimensions. The closed system was brought to a temperature-controlled oven at 40 °C (mesophilic conditions). The weight and size of the samples were monitored periodically over a 35 day incubation period [33].
3. Results
3.1. Characterization of Chañar Gum Solution
3.1.1. Viscosimetry
From the intrinsic viscosity data, it can be concluded that both macromolecules, produced by different extraction techniques, differ in their relation to molecular weight, size, and shape. The intrinsic viscosity in function of concentration is observed in Figure 1a. Both gums are quasi-spherical where the νa/b CHA is less than CHT, and the Mv and RH of CHT are greater than CHA. These data are corroborated with the intrinsic diffusion coefficient data. This phenomenon can be explained by the nature of hydrolysis. Thermal hydrolysis only extracts the gum; whereas that acid/ascorbic hydrolysis, in addition to removing the gum, oxidizes and deacetylates, which causes a significant decrease in molecular weight. The partial specific volume where a slightly higher CHA water affinity concerning CHT can be observed, although its hydration value is affected by the intrinsic viscosity (see Table 1). The values of the Mark–Houwink parameters of CHA are spheroidal and similar to other macromolecules such as dextrans [54], chañar brea [55], Arabic gum [56], Acacia caven gum [57], alcayota gum [47].
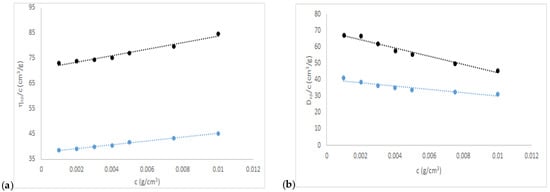
Figure 1.
(a) Intrinsic viscosity and (b) diffusion coefficient of chañar gum solutions; the blue line is CHA and the black line is CHT.

Table 1.
Hydrodynamic data.
Regarding the Mark–Houwink parameters, a small change can be observed in their values for CHT and CHA. CHA presents values of k = 0.01810 cm3/g, a = 0.5522, which affirms its quasi-spherical shape (νa/b of 2.80). Where CHT with k = 0.00611 cm3/g and a = 0.6249 which is the boundary between spheroid and ellipsoid shape (νa/b of 3.42), see Table 1. Which shows a substantial difference in the extraction methods for both biopolymers.
3.1.2. Diffusion Coefficient
The specific diffusion coefficient decreases with increasing concentration, the ordinate to the origin shows that CHT > CHA, the slopes of both present a small difference and also CHT > CHA (Figure 1b). This difference in slopes accounts for the interactions between solvent and solute related to solubility where CHT is less soluble than CHA.
Intrinsic diffusion is a novel value and is another way to calculate and corroborate intrinsic viscosity data.
3.2. Characterization of Chañar Gum Films
3.2.1. SEM/EDX
SEM analysis evaluated surface film characteristics like homogeneity, structure, porosity, cracks, and smoothness and the relationship with film properties (tensile strength, elongation, and water vapor permeability) [49]. Micrographs of the surface of the films (Figure 2a,d) showed an irregular and granular surface. The surface of CHA film had a much rougher surface, and the size of particle agglomerates was bigger at first sight. The study of the average diameter particle size using the program ImageJ® (Version 1.8.0_172, 30 November 2021) (Figure 3) reveals an average diameter of 3.2 and 2.5 µm for CHA and CHT particles. The micrographs of fractured films (Figure 2b,e) were homogeneous, with compacted structure, free of air bubbles, despite some irregularities observed [58]. No porosity of the matrix is observed with this increase. The discontinuities in the structure of the film could help in the formation of preferential pathways for the diffusion of water vapor, which would explain the permeability to water vapor [49]. Additionally, EDX analysis of the samples (Figure 2c,f) shows the presence of some alkali and alkaline earth metals, no significant differences were observed in the contents, for the gum that was extracted with acid. The absence of elements like nitrogen, sulfur, and phosphorus (characteristic elements of proteins) suggests low protein content [33].
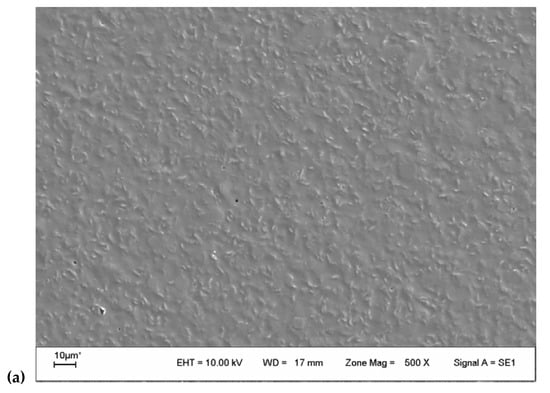
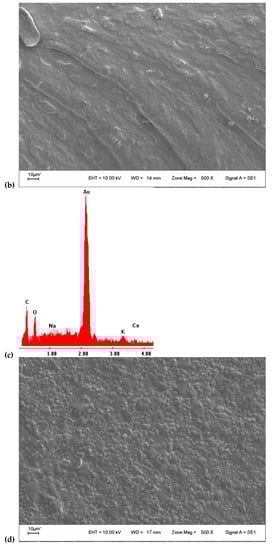
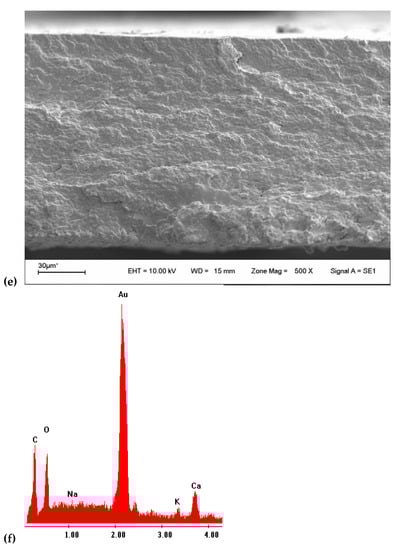
Figure 2.
(a) SEM 500× surface image of CHT film; (b) SEM 500× transversal image of CHT film; (c) EDX analysis of CHT film; (d) SEM 500× surface image of CHA film; (e) SEM 500× transversal image of CHA film; (f) EDX analysis of CHA film.
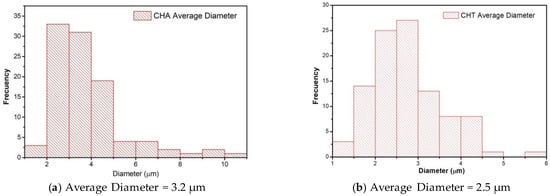
Figure 3.
Particle size distribution: (a) CHT, and (b) CHA film (Programa ImageJ®). Frequency: number of particles of the same size that are repeated.
3.2.2. Fourier Transform Infrared
The absorption spectra of chañar films are observed from 4000 to 700 cm−1 (Figure 4). Comparing the spectra obtained from CHT (obtained through a thermal extraction) and CHA (obtained through extraction with HCl/Ascorbic acid) did not reveal significant differences. The location of the characteristic absorption peaks was the same, indicating that the intra and intermolecular interactions do not change despite the differences in the extraction method.
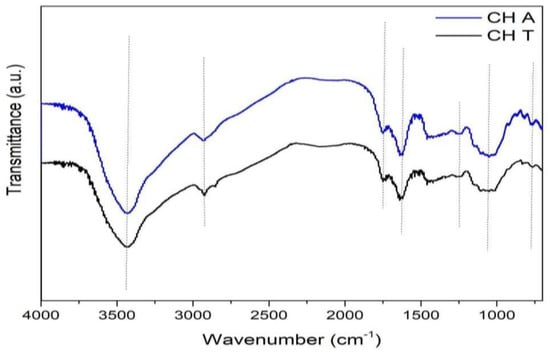
Figure 4.
FTIR spectra of chañar Gums.
The vibrations near 1650 and 1550 cm−1 are characteristics of amide I and II bands, respectively. However, some polysaccharides’ spectrum containing uronic acids also produce bands in this wavenumber region [59]. The band near 1620 cm−1 can move depending on the biochemical composition and particularly the content of uronic acid. Therefore, absorbance bands, at 1635 and 1428 cm−1 in the Chañar gum spectrum are assigned to the deprotonated carboxyl function of uronic acids [60], see Table 2. Other works report the contribution of proteins, phenolic esters, and methyl esters groups attached to polysaccharides in this region [46,59,60,61,62].
Table 2.
Principal absorbance bands of FTIR spectra of CHT and CHA gums [46,58,59,60,61,62,63].
3.2.3. Thermogravimetric Analysis
The thermogravimetric analysis was performed to study the thermal stability of the obtained polysaccharides (CHT and CHA), shown in Figure 5. The thermograms show two events of mass loss for both biopolymers. For the CHT, the first mass loss, with a peak centered at 70 °C in the DTG curve, is attributed to the loss of absorbed and/or structural water [33]. The second mass loss occurs in three steps, observed in the DTG curve as centered peaks in 200, 245, and 290 °C, the first and third much more pronounced than the second, corresponding to a 45% mass loss approximately. This final mass loss is attributed to the polysaccharide decomposition. The result for CHA was similar, a peak with center in 75 °C in the DTG curve, also attributed to the loss of water. A second mass loss occurs in four steps. As a result, two more pronounced peaks were observed in the DTG curve, with center in 195 and 216 °C, and two others with center in 260 and 300 °C, less pronounced. They correspond to an approximately 47% mass loss attributed to the polysaccharide decomposition. The behavior observed in the decomposition process (in several steps), could be due to the polysaccharides’ molecular weight distribution. The thermal stability of polymers depends on the constituents’ characteristics and the macromolecules’ interaction [64]. The second stage is the main degradation zone, predominantly due to the dehydration of hydroxyl groups and low molecular weight species formation until the final carbonization [64].
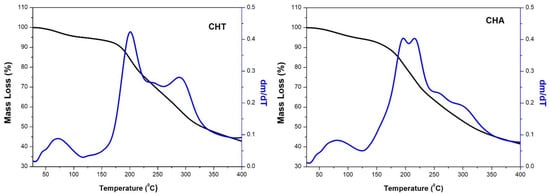
Figure 5.
TGA and DTG thermograms of CHT and CHA.
3.2.4. Differential Scanning Calorimetry (DCS)
This technique measures temperatures and heat flow associated with material transitions as a function of temperature and time, as well as information on physical and chemical changes involving endothermic processes, such as phase transitions, dehydration, some decomposition, and exothermic reactions, including crystallization, oxidation, decomposition reactions or changes in heat capacity [49]. According to Figure 6, an endothermic peak appears in the range of 26–130 °C, with center of 75 °C for CHT and 80 °C for CHA. TGA thermograms of the samples have registered a weight loss in this temperature range. It indicated that these endothermic peaks were generated due to the vaporization of sorbed water from the polymer. The endothermic peak area, as well as peak position, were different for CHT and CHA, which indicated different water holding capacities of chañar samples [65,66,67]. The glassy temperature (Tg) can be observed at 42.5 °C for CHT and CHA; while the melting point (Tm) was 144 °C for CHT and 148 °C for CHA. The thermal events registered above 200 °C are attributed to the polysaccharide decomposition [49,65,66,67].
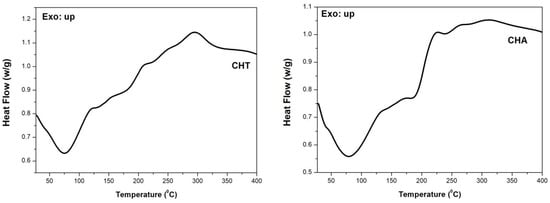
Figure 6.
DSC thermogram of CHT and CHA.
3.2.5. DRX
The CHT and CHA films were structurally studied through X-ray diffraction and are shown in Figure 7. Bragg’s equation is used to estimate the d-spacing (inter-chain distance), taking the 2θ angle from the maximum broadband. 2θ angle and d-spacing values are shown in Table 3. The diffractograms evidence predominant of amorphous regions but also ordered ones. This is due to the molecular interactions between polysaccharide functional groups. As a result, a secondary structure is formed [35].
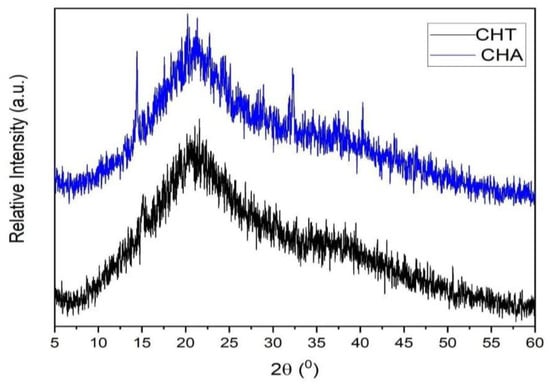
Figure 7.
X-ray diffraction of CH films.
Table 3.
2θ angle and d-spacing of chañar films bands.
Considering the d-spacing values, it can be inferred that the structure of CHA is a little more packed than that of CHT, where these data are observable in Figure 3.
3.2.6. Mechanical Properties
Tensile strength (σ) is one of the most important properties of materials used as films and represents the ability of a material to resist mechanical stress until it breaks. Maximum elongation (ε max %), is the increasing percentage in length before the breaking point. The Young’s modulus (E) represents the material rigidity [35]. The results of this test are presented in Table 4. CHT film showed better mechanical properties, it has a smaller Young’s modulus (CHA is a more rigid membrane), and it showed higher elongation at break and tensile strength. The tensile strength of the films depends on the characteristics of the film-forming material and the cohesion of the polymeric matrix structure [68]. For example, films with heterogeneous characteristics present a discontinuity in the network structure, which causes a greater fragility of the film due to points more susceptible to breaking, reducing the tensile strength, which may have influenced the results of this work [49]. The mechanical properties values obtained are similar to other novel materials used in the preparation of edible films and coatings such as quinoa starch (7.56 MPa and 58.14%), eggplant flour (5.33 MPa and 65.09%), and others [28].
Table 4.
Mechanical properties of chañar films.
3.2.7. Colorimetry
The color and opacity of the Chañar films were determined and the results are shown in Table 5. Chañar films presented reddish tones, obtaining positive values in the red-green and yellow-blue planes. They tended to be reddish-yellow colors, respectively, as can be seen in the image in Table 5. The opacity results show values of 48 and 36, for CHT and CHA, respectively, indicating that they are opaque films. CHA was less opaque. The film’s opacity is a result of the morphology or chemical structure associated with the molecular mass of the material [49]. A possible explanation for the obtained differences would be the different molecular weights obtained previously. The color and opacity of the films as packaging may influence the acceptance of the edible, given that the transparency of the films is an essential aspect for consumer acceptance [69]. The opaquer films inhibit light transmission, which may be a desired feature when packaged products are photosensitive [49]. It was reported the use of films based on hydrocolloids, with dark coloration, as a coating for light-sensitive foods such as chocolate or coffee beans [28].
Table 5.
CieLab data of the chañar films.
3.2.8. Water Vapor Permeation
Water vapor permeability is an attribute used to recognize possible forms of mass transfer and interactions between solutes and polymers in the films [70]. This property allows evaluating the material’s ability as a barrier and the type of food it can be used as a coating [33]. The results in Figure 8 were very similar for both polysaccharides, see Table 6. The values obtained were compared with those reported for other novel polysaccharides. Some foods are more suitable materials that prevent the food from becoming dehydrated, as well as protect the packaged food from environmental humidity, case of synthetic polymers, as the low-density polyethylene (LDP), with a very low value of WVP. On the contrary, other foods need very permeable packages to reduce the water activity inside the container and prevent the growth of microorganisms [33]. Taking this into account, the WVP properties of these CH films will be adequate or not, depending on the type of food that will be packaged.
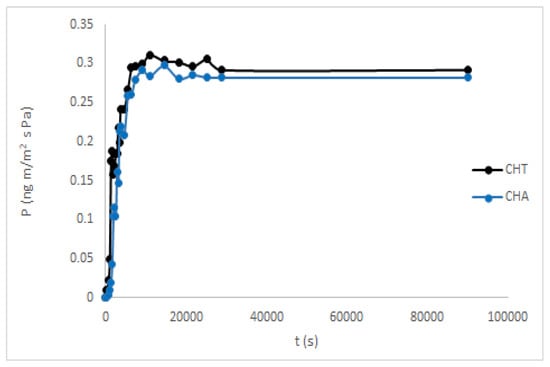
Figure 8.
Water vapor permeability of CHT and CHA films.
Table 6.
Water vapor permeability of some novel biopolymers and low-density polyethylene [28].
3.2.9. Antioxidant Activity
Reducing Power
The reducing power is a property generally associated with the presence of hydrogen atoms or electron-donating groups, which react with the free radicals to block radical chain reactions [51]. For the measurement, the potassium ferricyanide method was used. The results (Figure 9A) show that the reducing capacity of CH was concentration-dependent. The reducing power at a maximum concentration of 1 mg/mL for CHA, had a despicable value and 0.14 for CHT. The obtained values were lower than the reducing capacity of ascorbic acid, in the same concentration range.
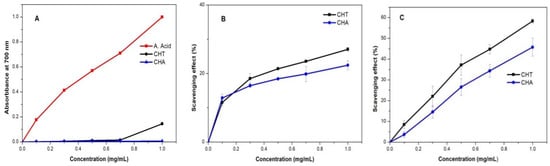
Figure 9.
Antioxidant Activity of CHT and CHA: (A) reducing power; (B) scavenging of hydroxyl radical; (C) scavenging of DPPH radical.
Hydroxyl Radical Scavenging
Hydroxyl free radical is generated when H2O2 and Fe2+ are mixed in the salicylic method. The free radical could be captured for salicylic acid. As a result, the solution is discolorated. A greater scavenging rate indicates that the antioxidant properties of the material are good [51]. The hydroxyl radical is the most reactive among the reactive oxygen species and could induce severe damage in living cells [50]. Therefore, removing the hydroxyl radical is an important antioxidant defense. As shown in Figure 9B, CH polysaccharides exhibited scavenging activity of hydroxyl radicals in a concentration-dependent manner. At the concentration range 0.1 mg/mL to 1 mg/mL, the scavenging rate increased until 27% for CHT and 22.4% for CHA. Equivalent to 46 and 34.6 mg/L of ascorbic acid respectively.
DPPH Scavenging Activity
DPPH is a free radical with an absorption peak at 517 nm, widely used to evaluate antioxidant activity. DPPH can capture electrons and/or hydrogen atoms and pairs with its free radical [50,51], and as a result, the absorbance is reduced. The results shown in Figure 9C indicate that the scavenging activity of CH increases with concentration. The scavenging rate of CHT at 1 mg/mL was 58.3%, equivalent to a concentration of ascorbic acid of 83.02 mg/L. For CHA the obtained rate was 45.8%, equivalent to 66.3 mg/L of ascorbic acid, see Table 7. The scavenging ability of polysaccharides may be due to the presence of hydrogen from the specific monosaccharide compositions and their side-chain linkages [77].
Table 7.
Resume of antioxidant activity properties of CHT and CHA.
3.2.10. Polyphenols Total Concentration
This determination was carried out through the FC method, which is based on the ability of phenols to react with oxidizing agents. Electron transfer at basic pH reduces the phosphomolybdic and phosphotungstic complexes into oxides, deep blue chromogens. The color is proportional to the presence of hydroxyl groups in the molecule. The total phenol content of the polysaccharide extracts was equivalent to 8.65 mg/L and 5.72 mg/L of gallic acid for CHT and CHA, respectively (see Figure 10). The concentration of polyphenols was high. This shows that the previous wash with 50/50 EtOH/ H2O was not enough to eliminate the polyphenols from the polymeric extract. The results may suggest that the polyphenols were complex to the polysaccharides. Regarding the scavenging ability of DPPH radicals, the polysaccharide extracts demonstrated very good scavenging ability. Klaus et al. in 2011 [78] had found a very strong and significant correlation between scavenging ability (determined by DPPH scavenging) and total phenol content of polysaccharide extracts. The DPPH scavenging was not correlated with their polysaccharide content. Factors affecting and/or attributing to antioxidant effects need further study.
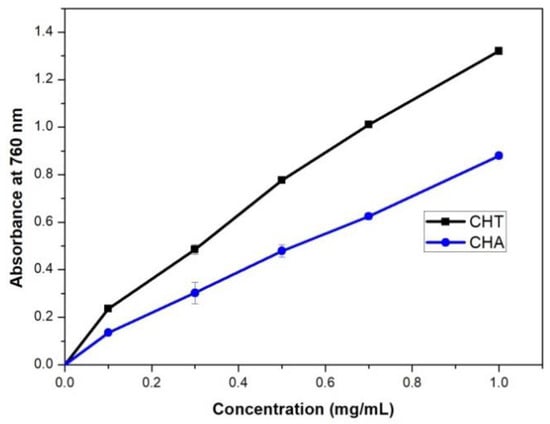
Figure 10.
Phenols total concentration of CHT and CHA.
3.2.11. Biodegradability
The degradability of biopolymers is critical functionality for their application and represents an advantage over synthetic polymers. The experiment exposes the film to extremely realistic environmental conditions. The biodegradability of samples is measured by evaluating the weight loss over time. The weight loss could not be used in this work, the weight measured was higher than the initial. This could be related to the film absorbing water, and/or, in our case, the type of experiment used because it was very difficult to remove all the dirt from the mesh. Accordingly, we use this as a qualitative measure, observing the decomposition of the film over time. The obtained data is shown in Figure 11A,B. It was observed that the CHAF was degraded in 25 days, while the CHTF took several more days. In the case of CHT, the degradation time was 35 days. Taking into account the results obtained and literature reports, it could be said that the degradation occurs in two steps: in the first instance, the diffusion of water in the samples, resulting in the swelling of the films, which allows the growth of microorganisms on the films (this was evidenced in the CHT film), and as a second step, enzymatic or other degradation, which causes loss of mass and the integrity of the film [33,64].
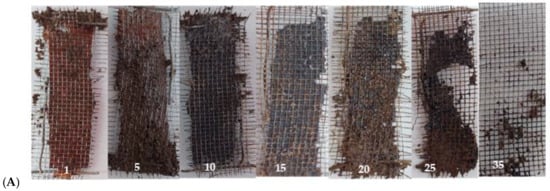
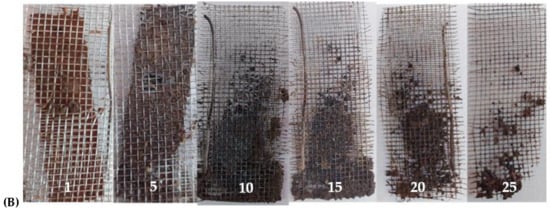
Figure 11.
(A) Biodegradation process of CHT film, picture of day 1, 5, 10, 15, 20, 25 and 35. (B) Biodegradation process of CHA film, picture of day 1, 5, 10, 15, 20 and 25.
4. Conclusions
The proposed extraction methods made it possible to obtain polysaccharides from chañar, with the ability to form films. The hydrodynamic properties of CHT and CHA were affected by the extraction conditions. The molecular weight of CHT was approximately twice of the CHA. However, the physical-chemical characterization yielded little difference in results for both. The obtained films were flexible, with a rugose surface and dark coloration, which can be desirable when used as a protective coating for light-sensitive foods, such as chocolate or coffee beans. The water vapor permeation values obtained were similar to those reported for other novel polysaccharides. Higher than the value reported for LDP, the applicability of these films then depends on the type of food to be packaged. The thermal analysis showed that the obtained polysaccharides were stable up to approximately 150 °C, and allowed to determine approximately the Tg and Tm, which were similar, regardless of their differences in terms of molecular weight. It also confirms differences in their hydrophobicity. The total antioxidant activity was 83 and 66% for CHT and CHA, although this high value may be related to the presence of polyphenols in the sample. The films were biodegraded in a 35 day time frame. This is critical functionality for biopolymers application and represents an advantage over synthetic polymers.
Author Contributions
Conceptualization, L.L. and M.A.M.; methodology, L.L.; software, L.L.; validation, G.M.M.; formal analysis, L.L.; investigation, L.L.; resources, M.F.; writing—original draft preparation, L.L.; writing—review and editing, L.L and M.L.A. and M.A.M.; supervision, M.L.A. and M.A.M. All authors have read and agreed to the published version of the manuscript.
Funding
This research received no external funding.
Data Availability Statement
Not applicable.
Acknowledgments
The authors thank the following institutions in Argentina: Instituto de Física Aplicada-CONICET-Universidad Nacional de San Luis, Laboratorio de Investigación y Servicios de Química Física (LISeQF-UNSL), and Instituto Multidisciplinario de Investigaciones Biológicas (IMIBIO-SL), Javier Rigau Instituto de Investigación en Tecnología Quimica (FTIR), Karim Sapag and José Arroyo Gomez-INFAP (TGA-DSC).
Conflicts of Interest
The authors declare no conflict of interest.
References
- Izydorczyk, M.; Cui, S.W.; Wang, Q. Food Carbohydrates: Chemistry, Physical Properties, and Applications; Cui, S.W., Wang, Q., Eds.; CRC Press: Boca Raton, FL, USA, 2005. [Google Scholar]
- Stephen, A.M.; Phillips, G.O. Food Polysaccharides and Their Applications; CRC press: Boca Raton, FL, USA, 2016; pp. 263–307. [Google Scholar]
- Morris, E.R. Physico-Chemical Properties of Food Polysaccharides, Dietary Fibre—A Component of Food; Springer: London, UK, 1992; pp. 41–56. [Google Scholar]
- Yang, X.; Li, A.; Li, X.; Sun, L.; Guo, Y. Technology, an overview of classifications, properties of food polysaccharides and their links to applications in improving food textures. Trends Food Sci. Technol. 2020, 102, 1–15. [Google Scholar] [CrossRef]
- Blanshard, J.M.; Mitchell, J.R. Polysaccharides in Food; Elsevier: Amsterdam, The Nederlands, 2013. [Google Scholar]
- Lovegrove, A.; Edwards, C.; De Noni, I.; Patel, H.; El, S.; Grassby, T.; Zielke, C.; Ulmius, M.; Nilsson, L.; Crifs, P.J. Role of polysaccharides in food, digestion, and health. Crit. Rev. Food Sci. Nutr. 2017, 57, 237–253. [Google Scholar] [PubMed]
- Venugopal, V. Marine Polysaccharides: Food Applications; CRC Press: Boca Raton, FL, USA, 2016. [Google Scholar]
- Jindal, N.; Khattar, J.S. Microbial Polysaccharides in Food Industry. In Handbook of Food Bioengineering, Biopolymers for Food Design; Grumezescu, A.M., Holban, A.M., Eds.; Academic Press: London, UK, 2018; pp. 95–123. [Google Scholar]
- Guo, M.Q.; Hu, X.; Wang, C.; Ai, L. Polysaccharides: Structure and Solubility. In Solubility of Polysaccharides; Xu, Z., Ed.; INTECH: Rijeka, Croatia, 2017; pp. 7–21. [Google Scholar]
- Wijaya, W.; Patel, A.; Setiowati, A.D.; Van der Meeren, P. Functional colloids from proteins and polysaccharides for food applications. Trends Food Sci. Technol. 2017, 68, 56–69. [Google Scholar] [CrossRef]
- Reichert, C.L.; Bugnicourt, E.; Coltelli, M.-B.; Cinelli, P.; Lazzeri, A.; Canesi, I.; Braca, F.; Martínez, B.M.; Alonso, R.; Agostinis, L.; et al. Agostinis, Bio-based packaging: Materials, modifications, industrial applications and sustainability. Polymers 2020, 12, 1558. [Google Scholar] [CrossRef]
- Motelica, L.; Ficai, D.; Ficai, A.; Oprea, O.C.; Kaya, D.A.; Andronescu, E. Biodegradable antimicrobial food packaging: Trends and perspectives. Foods 2020, 9, 1438. [Google Scholar]
- Kontominas, M.G. Use of alginates as food packaging materials. Foods 2020, 9, 1440. [Google Scholar] [CrossRef]
- Song, Y.; Zheng, Q. Ecomaterials based on food proteins and polysaccharides. Polym. Rev. 2014, 54, 514–571. [Google Scholar] [CrossRef]
- Bamiro, O.A.; Odeku, O.A.; Sinha, V.R.; Kumar, R. Terminalia gum as a directly compressible excipient for controlled drug delivery. AAPS PharmSciTech 2012, 13, 16–23. [Google Scholar] [CrossRef][Green Version]
- Hasnain, S.M.; Hasnain, M.S.; Nayak, A.K. Natural polysaccharides: Sources and extraction methodologies. In Natural Polysaccharides in Drug Delivery and Biomedical Applications; Academic Press: Amsterdam, The Netherlands, 2019; pp. 1–14. [Google Scholar]
- Mogoşanu, G.D.; Grumezescu, A.M. Pharmaceutical Natural Polymers: Structure and Chemistry. In Handbook of Polymers for Pharmaceutical Technologies; Wiley: Hoboken, NJ, USA, 2015; Volume 1, 477p. [Google Scholar]
- Sharma, P.; Gaur, V.K.; Sirohi, R.; Varjani, S.; Kim, S.H.; Wong, J.W. Sustainable processing of food waste for production of bio-based products for circular bioeconomy. Bioresour. Technol. 2021, 325, 124684. [Google Scholar] [CrossRef]
- Maraveas, C. Production of sustainable and biodegradable polymers from agricultural waste. Polymers 2020, 12, 1127. [Google Scholar] [CrossRef]
- Gheorghita, R.; Anchidin-Norocel, L.; Filip, R.; Dimian, M.; Covasa, M. Applications of biopolymers for drugs and probiotics delivery. Polymers 2021, 13, 2729. [Google Scholar] [CrossRef]
- do Nascimento Marques, N.; dos Santos Alves, K.; Vidal, R.R.L.; da Silva Maia, A.M.; Madruga, L.Y.C.; Curti, P.S.; de Carvalho Balaban, R. Chemical Modification of Polysaccharides and Applications in Strategic Areas, Emerging Research. In Science and Engineering Based on Advanced Experimental and Computational Strategies; Springer: Berlin/Heidelberg, Germany, 2020; pp. 433–472. [Google Scholar]
- Hong, L.G.; Yuhana, N.Y.; Zawawi, E.Z.E. Review of bioplastics as food packaging materials. AIMS Mater. Sci. 2021, 8, 166–184. [Google Scholar] [CrossRef]
- Lavudi, H.N.; Suthari, S. Application of Legume Seed Galactomannan Polysaccharides. In Sustainable Agriculture Reviews 45; Springer: Berlin/Heidelberg, Germany, 2020; pp. 97–113. [Google Scholar]
- [Zhou, S.; Rahman, A.; Li, J.; Wei, C.; Chen, J.; Linhardt, R.J.; Ye, X.; Chen, S. Extraction methods affect the structure of Goji (Lycium barbarum) polysaccharides. Molecules 2020, 25, 936. [Google Scholar]
- Isreal, O.K.; Innocent, E.; Ammeh, P.O. Physicochemical characterization of exudates from Khaya ivorensys. Int. J. Mod. Chem. 2013, 5, 1–21. [Google Scholar]
- Ameh, P.O. Chemistry, physicochemical properties and rheological behaviour of Ficus glumosa gum in aqueous solution. Afr. J. Pure Appl. Chem. 2013, 7, 35–43. [Google Scholar]
- Wu, D.-T.; Zhao, Y.-X.; Guo, H.; Gan, R.-Y.; Peng, L.-X.; Zhao, G.; Zou, L. Physicochemical and biological properties of polysaccharides from Dictyophora Indusiata prepared by different extraction techniques. Polymers 2021, 13, 2357. [Google Scholar] [CrossRef]
- Galus, S.; Kibar, E.A.A.; Gniewosz, M.; Kraśniewska, K. Novel materials in the preparation of edible films and coatings—A review. Coatings 2020, 10, 674. [Google Scholar] [CrossRef]
- Amin, U.; Khan, M.U.; Majeed, Y.; Rebezov, M.; Khayrullin, M.; Bobkova, E.; Shariati, M.A.; Chung, I.M.; Thiruvengadam, M. Potentials of polysaccharides, lipids and proteins in biodegradable food packaging applications. Int. J. Biol. Macromol. 2021, 183, 2184–2198. [Google Scholar] [CrossRef]
- Vilela, C.; Kurek, M.; Hayouka, Z.; Röcker, B.; Yildirim, S.; Antunes, M.D.C.; Nilsen-Nygaard, J.; Pettersen, M.K.; Freire, C.S.R. A concise guide to active agents for active food packaging. Trends Food Sci. Technol. 2018, 80, 212–222. [Google Scholar] [CrossRef]
- Pavli, F.; Tassou, C.; Nychas, G.-J.E.; Chorianopoulos, N. Chorianopoulos, Probiotic incorporation in edible films and coatings: Bioactive solution for functional foods. Int. J. Mol. Sci. 2018, 19, 150. [Google Scholar] [CrossRef]
- Dubey, N.K.; Dubey, R. Edible Films and Coatings: An Update on Recent Advances. In Biopolymer-Based Formulations; Elsevier: Amsterdam, The Netherlands, 2020; pp. 675–695. [Google Scholar]
- Zanon, M.; Masuelli, M.A. Alcayota gum films: Experimental reviews. J. Mater. Sci. Chem. Eng. 2018, 6, 11–58. [Google Scholar] [CrossRef]
- Masuelli, M.; Renard, D. Advances in Physicochemical Properties of Biopolymers (Part 2); Bentham Science Publishers: Abu Dhabi, United Arab Emirates, 2017. [Google Scholar]
- Masuelli, M.A.; García, M.G.; Marchese, J.; Ochoa, N.A. Development of dense films from Melia azedarach polysaccharides. J. Appl. Polym. Sci. 2015, 132, 41624. [Google Scholar]
- Yuan, L.; Wu, Y.; Qin, Y.; Yong, H.; Liu, J. Recent advances in the preparation, characterization and applications of locust bean gum-based films. J. Renew. Mater. 2020, 8, 1565–1579. [Google Scholar] [CrossRef]
- Go, E.-J.; Song, K.B. Capsosiphon fulvescens films containing persimmon (Diospyros kaki L.) leaf extract. Food Biosci. 2020, 37, 100723. [Google Scholar] [CrossRef]
- Yuan, D.; Meng, H.; Huang, Q.; Li, C.; Fu, X. Preparation and characterization of chitosan-based edible active films incorporated with Sargassum pallidum polysaccharides by ultrasound treatment. Int. J. Biol. Macromol. 2021, 183, 473–480. [Google Scholar] [CrossRef]
- Han, H.-S.; Song, K.B. Noni (Morinda citrifolia) fruit polysaccharide films containing blueberry (Vaccinium corymbosum) leaf extract as an antioxidant packaging material. Food Hydrocoll. 2021, 112, 106372. [Google Scholar] [CrossRef]
- Chambi, H.N.M.; da Costa, B.S.; de Lima, W.C.; Kassardjian, D.C. Fruit juices in polysaccharides edible films. Afr. J. Food Sci. 2020, 14, 53–62. [Google Scholar]
- Ruano, P.; Delgado, L.L.; Picco, S.; Villegas, L.; Tonelli, F.; Merlo, M.E.A.; Rigau, J.; Diaz, D.; Masuelli, M. Extraction and Characterization of Pectins from Peels of Criolla Oranges (Citrus sinensis): Experimental Reviews. In Pectins-Extraction, Purification, Characterization and Applications; INTECH Publishing: Rijeka, Croatia, 2020; pp. 1–45. [Google Scholar]
- Di Donato, P.; Taurisano, V.; Poli, A.; d’Ayala, G.G.; Nicolaus, B.; Malinconinco, M.; Santagata, G. Vegetable wastes derived polysaccharides as natural eco-friendly plasticizers of sodium alginate. Carbohydr. Polym. 2020, 229, 115427. [Google Scholar] [CrossRef]
- Eynard, C.; Galetto, L. Estructura floral y variabilidad intraespecífica de Geoffroea decorticans (Fabaceae). Darwiniana 1999, 37, 219–228. [Google Scholar]
- Eynard, C.; Galetto, L. Pollination ecology of Geoffroea decorticans (Fabaceae) in central Argentine dry forest. J. Arid Environ. 2002, 51, 79–88. [Google Scholar] [CrossRef]
- Orrabalis, C.J. Aprovechamiento Integral de los Frutos de Geoffroea decorticans (chañar), de la Región Fitogeográfica de la Provincia de Formosa. Ph.D. Thesis, Universidad Nacional de Cordoba, Cordoba, Argentina, 2014. [Google Scholar]
- Lismet Lazo, R.C.; Ciancia, M.; Matulewicz, C.; Auad, M.L.; Orrabalis, C.J.; Filippa, M.; Masuelli, M. Chañar gum (Geoffrea decorticans), in Gums, Resins and Latexes of Plant Origin; Murthy, H.N., Ed.; Springer: Berlin/Heidelberg, Germany, 2022. (in press)
- Zanon, M.; Masuelli, M. Purification and characterization of alcayota gum. Biopolym. Res. 2018, 2, 105. [Google Scholar]
- Stepto, R.; Chang, T.; Kratochvíl, P.; Hess, M.; Horie, K.; Sato, T.; Vohlidal, J. Definitions of terms relating to individual macromolecules, macromolecular assemblies, polymer solutions, and amorphous bulk polymers (IUPAC Recommendations 2014). Pure Appl. Chem. 2015, 87, 71–120. [Google Scholar] [CrossRef]
- Scudeler, C.G.D.S.; Costa, T.D.L.; Cortez-Vega, W.R.; Prentice, C.; Fonseca, G.G. Development and characterization of Nile tilapia (Oreochromis niloticus) protein isolate-based biopolymer films incorporated with essential oils and nanoclay. Food Packag. Shelf Life 2020, 25, 100542. [Google Scholar] [CrossRef]
- Deng, C.; Hu, Z.; Fu, H.; Hu, M.; Xu, X.; Chen, J. Chen, Chemical analysis and antioxidant activity in vitro of a β-D-glucan isolated from Dictyophora indusiate. Int. J. Biol. Macromol. 2012, 51, 70–75. [Google Scholar] [CrossRef]
- Du, X.; Mu, H.; Zhou, S.; Zhang, Y.; Zhu, X. Chemical analysis and antioxidant activity of polysaccharides extracted from Inonotus obliquus sclerotia. Int. J. Biol. Macromol. 2013, 62, 691–696. [Google Scholar] [CrossRef]
- Kaur, R.; Arora, S.; Singh, B. Antioxidant activity of the phenol rich fractions of leaves of Chukrasia tabularis A. Juss. Bioresour. Technol. 2008, 99, 7692–7698. [Google Scholar] [CrossRef]
- Ainsworth, E.A.; Gillespie, K.M.J.N.P. Estimation of total phenolic content and other oxidation substrates in plant tissues using Folin–Ciocalteu reagent. Nat. Protoc. 2007, 2, 875–877. [Google Scholar] [CrossRef]
- Masuelli, M.A. Dextrans in aqueous solution. Experimental review on intrinsic viscosity measurements and temperature effect. J. Polym. Biopolym. Phys. Chem. 2014, 1, 13–21. [Google Scholar]
- Torres, M.F.; Lazo Delgado, L.; Filippa, M.A.; Masuelli, M.A. Effect of temperature on Mark-Houwink-Kuhn-Sakurada (MHKS) parameters of chañar brea gum solutions. J. Polym. Biopolym. Phys. Chem. 2020, 8, 28–30. [Google Scholar]
- Masuelli, M.A. Hydrodynamic properties of whole arabic gum. Am. J. Food Sci. Technol. 2013, 1, 60–66. [Google Scholar]
- Tonelli, F.; Masuelli, M.A. Acacia caven gum studies of hydrodynamic parameters. Evol. Polym. Technol. J. 2019, 2, 180007. [Google Scholar]
- He, L.; Yan, X.; Liang, J.; Li, S.; He, H.; Xiong, Q.; Lai, X.; Hou, S.; Huang, S. Comparison of different extraction methods for polysaccharides from Dendrobium officinale stem. Carbohydr. Polym. 2018, 198, 101–108. [Google Scholar] [CrossRef]
- Lopez-Torrez, L.; Nigen, M.; Williams, P.; Doco, T.; Sanchez, C. Acacia senegal vs. Acacia seyal gums–Part 1: Composition and structure of hyperbranched plant exudates. Food Hydrocoll. 2015, 51, 41–53. [Google Scholar] [CrossRef]
- Boulet, J.; Williams, P.; Doco, T. A Fourier transform infrared spectroscopy study of wine polysaccharides. Carbohydr. Polym. 2007, 69, 79–85. [Google Scholar] [CrossRef]
- Bath, A.; Zscherp, C. What vibrations tell about proteins. Q. Rev. Biophys. 2002, 35, 369–430. [Google Scholar]
- Sene, C.; McCann, M.C.; Wilson, R.H.; Grinter, R. Grinter, Fourier-transform Raman and Fourier-transform infrared spectroscopy (an investigation of five higher plant cell walls and their components). Plant Physiol. 1994, 106, 1623–1631. [Google Scholar] [CrossRef]
- Kacurakova, M.; Capek, P.; Sasinkova, V.; Wellner, N.; Ebringerova, A. FT-IR study of plant cell wall model compounds: Pectic polysaccharides and hemicelluloses. Carbohydr. Polym. 2000, 43, 195–203. [Google Scholar] [CrossRef]
- Hejri, Z.; Seifkordi, A.A.; Ahmadpour, A.; Zebarjad, S.M.; Maskooki, A. Biodegradable starch/poly (vinyl alcohol) film reinforced with titanium dioxide nanoparticles. Int. J. Miner. Met. Mater. 2013, 20, 1001–1011. [Google Scholar] [CrossRef]
- Chatterjee, S.; Guha, A.K.; Chatterjee, B.P. Evaluation of quantity and quality of chitosan produce from Rhizopus oryzae by utilizing food product processing waste whey and molasses. J. Environ. Manag. 2019, 251, 109565. [Google Scholar] [CrossRef]
- Szóda, K.; Zsoldos, G.; Kollár, M.; Szabo, T. Biopolymer foil materials examination with DSC and TSD methods. Int. J. Environ. Agric. Res. 2016, 2, 21–28. [Google Scholar]
- Kaloustian, J.; El-Moselhy, T.; Portugal, H. Chemical and thermal analysis of the biopolymers in thyme (Thymus vulgaris). Thermochim. Acta 2003, 401, 77–86. [Google Scholar] [CrossRef]
- Gontard, N.; Duchez, C.; Cuq, J.-L.; Guilbert, S. Edible composite films of wheat gluten and lipids: Water vapour permeability and other physical properties. Int. J. Food Sci. Technol. 1994, 29, 39–50. [Google Scholar] [CrossRef]
- Chen, H.J. Functional properties and applications of edible films made of milk proteins. J. Dairy Sci. 1995, 78, 2563–2583. [Google Scholar] [CrossRef]
- Souza, V.C.; Monte, M.L.; de Pinto, L. Preparation of biopolymer film from chitosan modified with lipid fraction. Int. J. Food Sci. Technol. 2011, 46, 1856–1862. [Google Scholar] [CrossRef]
- Kurek, M.; Guinault, A.; Voilley, A.; Galić, K.; Debeaufort, F. Effect of relative humidity on carvacrol release and permeation properties of chitosan based films and coatings. Food Chem. 2014, 144, 9–17. [Google Scholar] [CrossRef]
- Aydogdu, A.; Kirtil, E.; Sumnu, G.; Oztop, M.H.; Aydogdu, Y. Utilization of lentil flour as a biopolymer source for the development of edible films. J. Appl. Polym. Sci. 2018, 135, 46356. [Google Scholar] [CrossRef]
- Pelissari, F.M.; Andrade-Mahecha, M.M.; do Amaral Sobral, P.J.; Menegalli, F.C. Comparative study on the properties of flour and starch films of plantain bananas (Musa paradisiaca). Food Hydrocoll. 2013, 30, 681–690. [Google Scholar] [CrossRef]
- Andrade, R.M.; Ferreira, M.S.; Gonçalves, É.C. Development and characterization of edible films based on fruit and vegetable residues. J. Food Sci. 2016, 81, E412–E418. [Google Scholar] [CrossRef]
- Yepes, O.O.; Jaramillo, C.M.; Guz, L.; Famá, L. Biodegradable and edible starch composites with fiber-rich lentil flour to use as food packaging. Starch-Stärke 2018, 70, 1700222. [Google Scholar] [CrossRef]
- Smith, S.A. Polyethylene, Low Density. In The Wiley Encyclopedia of Packaging Technology; Wiley: Hoboken, NJ, USA, 1986; pp. 514–523. [Google Scholar]
- Kozarski, M.; Klaus, A.; Nikšić, M.; Vrvic, M.; Todorović, N.; Jakovljević, D.; Van Griensven, L. Antioxidative activities and chemical characterization of polysaccharide extracts from the widely used mushrooms Ganoderma applanatum, Ganoderma lucidum, Lentinus edodes and Trametes versicolor. J. Food Compos. Anal. 2012, 26, 144–153. [Google Scholar] [CrossRef]
- Klaus, A.; Kozarski, M.; Niksic, M.; Jakovljevic, D.; Todorovic, N.; Van Griensven, L. Antioxidative activities and chemical characterization of polysaccharides extracted from the basidiomycete Schizophyllum commune. LWT-Food Sci. Technol. 2011, 44, 2005–2011. [Google Scholar] [CrossRef]


Publisher’s Note: MDPI stays neutral with regard to jurisdictional claims in published maps and institutional affiliations. |
© 2022 by the authors. Licensee MDPI, Basel, Switzerland. This article is an open access article distributed under the terms and conditions of the Creative Commons Attribution (CC BY) license (https://creativecommons.org/licenses/by/4.0/).