Article

Spatial-Temporal Variations for Pollution Assessment of Heavy Metals in Hengshui Lake of China

1
Beijing Key Laboratory of Wetland Ecological Function and Restoration, Institute of Wetland Research, Chinese Academy of Forestry, Beijing 100091, China
2
National Ecosystem Research Station of Hengshui Wetland, Hengshui 053000, China
*
Authors to whom correspondence should be addressed.
Water 2022, 14(3), 458; https://doi.org/10.3390/w14030458
Submission received: 7 December 2021 / Revised: 29 January 2022 / Accepted: 31 January 2022 / Published: 2 February 2022
(This article belongs to the Section Water Quality and Contamination)

Abstract

:
A comprehensive analysis of the spatial and temporal variations of heavy metals in wetland sediment can delineate the changes in possible contamination sources, providing valuable conservation strategies for further wetland management. Using the pollution index, enrichment factors, and potential ecological risk index, the spatial and temporal variations in heavy metals (Cd, Hg, As, Pb, Cr, Cu, and Zn) were evaluated in Hengshui Lake in north China in 2005 and 2020. The results demonstrated that the concentrations and assessment index for most heavy metals all decreased, with that of As decreasing the most (−54.3%), which mainly benefited from the implementation of a series of ecological conservation and restoration projects. Although the assessment indexes for most heavy metals indicated non-pollution status, Hg and Cd exhibited medium enrichment and moderate potential ecological risk. Especially for Cd, the related indexes increased by 860.0%, mainly influenced by anthropogenic activities. Furthermore, the high pollution was mainly distributed nearby the regions of dense enterprises and wastewater overflow zone (i.e., Wangkou sluice, the Jizhou Small Lake and its causeway). This was primarily attributed to the discharge of industrial wastewater and Cd-polluted ecological diversion water. These findings demonstrated the necessity of the continued and targeted implementation of wetland conservation and restoration projects and identified possible contamination sources and important pollution regions that could provide insights into contamination control options and targeted management strategies for Hengshui Lake.

1. Introduction

Heavy-metals pollution in wetland ecosystems is a worldwide environmental issue that has attracted increased attention because of the ecological and human health risks it poses [1,2,3], particularly in sediment, which more easily accumulates heavy metals and facilitates their biomagnification via food chains [1,4,5,6]. Therefore, wetland sediments act as sinks of heavy metals, and may in turn act as sources [1]. In view of the significant roles that sediment-bound metals play in water quality and wetland ecosystem health [4,7], heavy metals contamination and the degree of pollution and ecological risk have been extensively researched, and the results might have had significant implications in more effective management of wetland ecosystems.
The contamination of sediments by heavy metals is strongly influenced by anthropogenic activities [2,4,8], such as the discharge of waste from industrial and residential activities [9,10]. With the rapid development of economy and industrialization, heavy-metals contamination of wetland sediment in China has become increasingly serious, especially in the southeast coastal rivers and the Zhu River of China [1]. Since the implementation of multiple government-dominated wetland conservation and restoration policies in recent years, wetland ecosystem health in China has improved significantly [7], and these policies have also likely contributed to the mitigation of wetland heavy-metals contamination. Determining the temporal and spatial variations of heavy metals is critical for delineating the tendency of temporal changes and the reasons of spatial variability, deducing the dual influence of anthropogenic activities and wetland conservation on heavy metals pollution, and providing valuable conservation strategies for further wetland management [11].
Hengshui Lake is not only the water source of life and production for Hengshui city and Jizhou city but also plays an important role in China’s “South-to-North Water Diversion” Project [12]. As it is located in the highly populated north China plain, high-intensity agricultural reclamation and urban construction activities together with the discharge of industrial and agricultural wastewater induced a great risk of heavy metals contamination. Since the establishment of Hengshui Lake National Nature Reserve, a series of wetland conservation and restoration policies have been implemented and might have also influenced the condition of heavy-metals contamination. Although progress has been made in assessing heavy-metals contamination in Hengshui Lake [12,13,14], the studies conducted have mainly focused on specific times. Indeed, there is a lack of clear understanding about temporal and spatial variations of heavy metals in Hengshui Lake, despite its potential contribution to illustrating the influence of anthropogenic activities and wetland conservation and restoration measures on heavy-metals contamination.
In this study, we analyzed heavy-metals (Cd, Hg, As, Pb, Cr, Cu, and Zn) concentrations in the sediments of Hengshui Lake in 2005 and 2020, and then evaluated its pollution status. The main goals of this study were to: (1) investigate the spatial and temporal changes in heavy metals concentrations in sediments; (2) assess the pollution degree by the single factor and composite pollution indices, identify possible contamination sources using enrichment factors, and determine the ecological risk by potential ecological risk index; and (3) provide insights into pollution-mitigation options and valuable wetland management strategies.

2. Materials and Methods
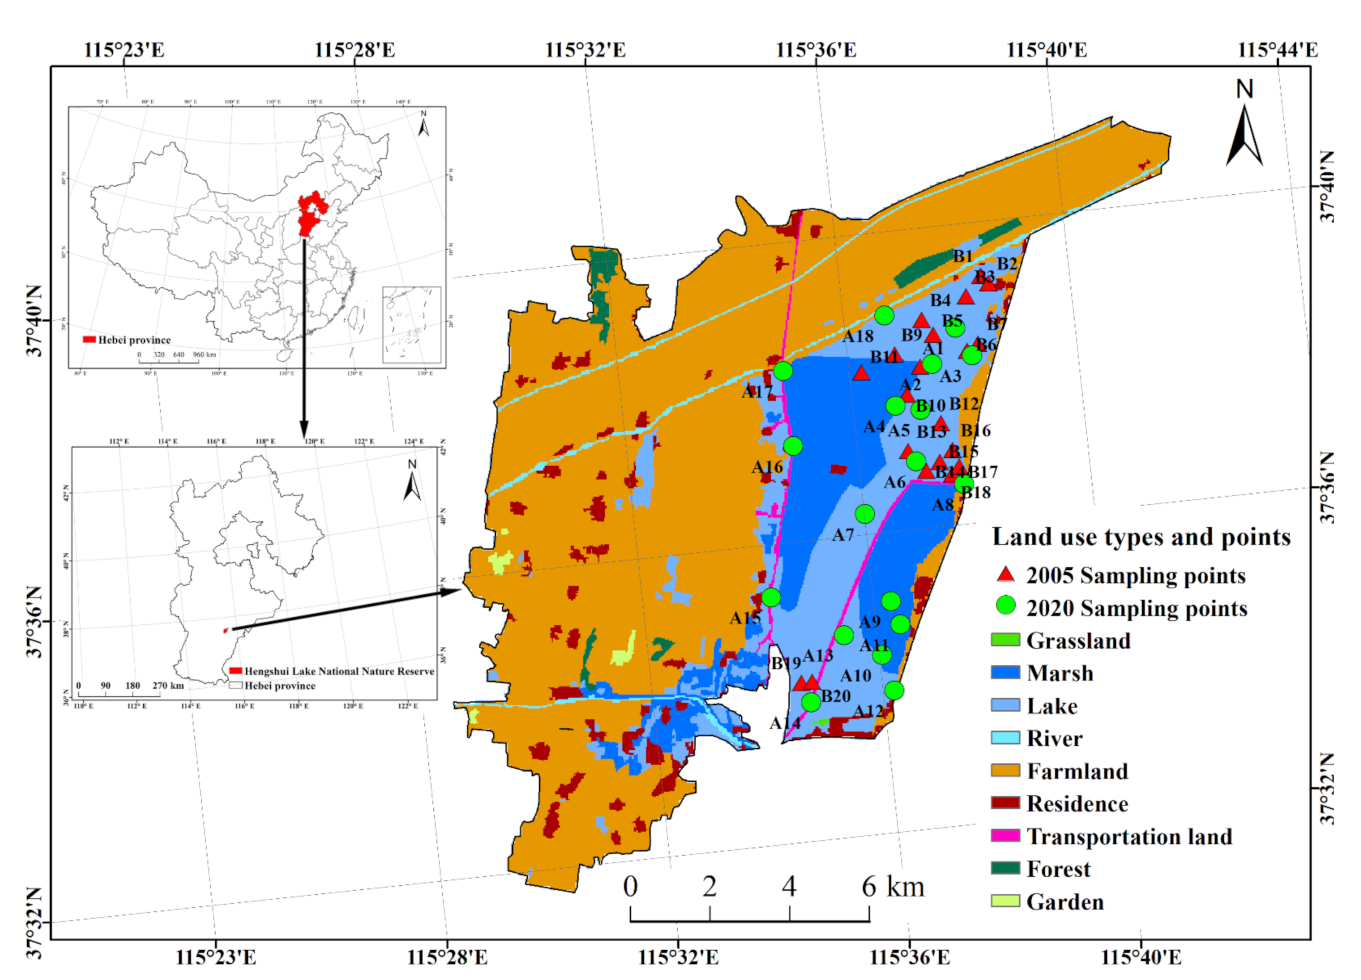
2.1. Study Area

Hengshui Lake Wetland Nature Reserve (115°28′–115°42′ E, 37°31′–37°41′ N) is located in Hengshui city, Hebei province, China. The wetland nature reserve is composed of a marsh, water area, forest, and grassland with a total area of 16.4 × 10³ ha, which includes two parts, an east lake and a West Lake. At present, water storage is mainly concentrated in the East Lake, which occupies an area of 1.0 × 10³ ha and is separated into a Big Lake and Jizhou Small Lake by a man-made hard bank dike [15]. There is no water in the West Lake, which is mainly used for crop cultivation and livestock farms [16] (Figure 1).

2.2. Data Collection

We set 18 sampling points in Hengshui Lake in 2020 (Figure 1 and Table 1), based on 20 sampling points in our previous study conducted in 2005 [12]. The sampling points in the present study were distributed more evenly than those in 2005 to reflect the pollution condition of the whole lake. Sediment samples were collected from a depth of 50 cm during May of 2020 using a TC-600 gravity grab bottom mud sampler. Upon collection, samples were loaded into polyethylene plastic bags and taken to the laboratory. After being air-dried at room temperature, the samples were ground into finer powders to pass through a nylon filter (150 μm). Subsequently, the sediment samples were digested with HNO3-HClO4, and the concentration of Cd, Pb, Cr, Cu, Zn, Hg, and As was determined by graphite furnace or flame in an atomic absorption spectrophotometry, or atomic fluorescence spectrometry. The standards materials (Research Center for Standard Reference Materials of China: GSS-7 and GSS-22) and duplicate samples were utilized for quality assurance and quality control. The recovery rate was between 90% and 110%. The data of 2005 were mainly acquired from our former research [12]. Redundancy analysis (RDA) and hierarchical cluster analysis were performed using R version 3.6.2. The other data analyses were performed using PASW Statistics 17.0 for Windows (SPSS Inc., 2009, Chicago, IL, USA) and Excel 2010. The figures in this paper were completed using SigmaPlot version 12.5 and inverse distance weighted (IDW) interpolation of ArcGIS 10.2.

2.3. Assessment Method

2.3.1. Contamination Indices of Heavy Metals

The single factor pollution index (Pi) and Nemero comprehensive pollution index (Pn) were used to estimate the pollution degree of heavy metals [17] (Equations (1) and (2)):
P i = C i S i
P n = max ( P i ) 2 + ave ( P i ) 2 2
where Ci is the measured concentration of heavy metals in the soil and sediment of Hengshui wetland; and Si is the standard value of heavy metals evaluation, which referred to MEEPRC [18]. Pn can be divided into four levels (Table S1).

2.3.2. Enrichment Degree and Possible Contamination Sources Assessment of Heavy Metals

The enrichment factor (EF) was used to estimate the degree of heavy metals enrichment, indicate the influence of human activities on heavy metals, and roughly identify their sources [19] (Equation (3)):
E F = ( C i / C n ) S ( C i / C n ) B
where Ci/Cn is the concentration ratio of measured heavy metal i and reference heavy metal n. S and B represent sample and background values, respectively. Element Al, which is less affected by human activities and has relatively stable chemical properties, was selected as the reference element. The background values of heavy metals were based on surface soil from Hebei Province. The degree of enrichment based on the EF value was divided into five levels (Table S2).

2.3.3. Ecological Risk Assessment of Heavy Metals

The potential ecological risk index (PRI) was used to estimate the ecological risk posed by heavy metals to the environment [20] (Equation (4)):
P R I = i = 1 m E r i = i = 1 m T r i × C i C i B
where PRI is the potential ecological risk index of multiple heavy metals; Eri is the risk factor of heavy metal i; Tri is the toxic coefficient of heavy metal i (i.e., Cd = 30, Hg = 40, As = 10, Pb = Cu = 5, Cr = 2, and Zn = 1) [4,15,21,22]; Ci is the same as in Equation (1); CiB is the geochemical background value of i, which was used the average value of surface soil in Hebei province [23]. According to the value of Eri and PRI, the degree of potential ecological risk can be divided into different levels (Table S3).

3. Results and Discussion

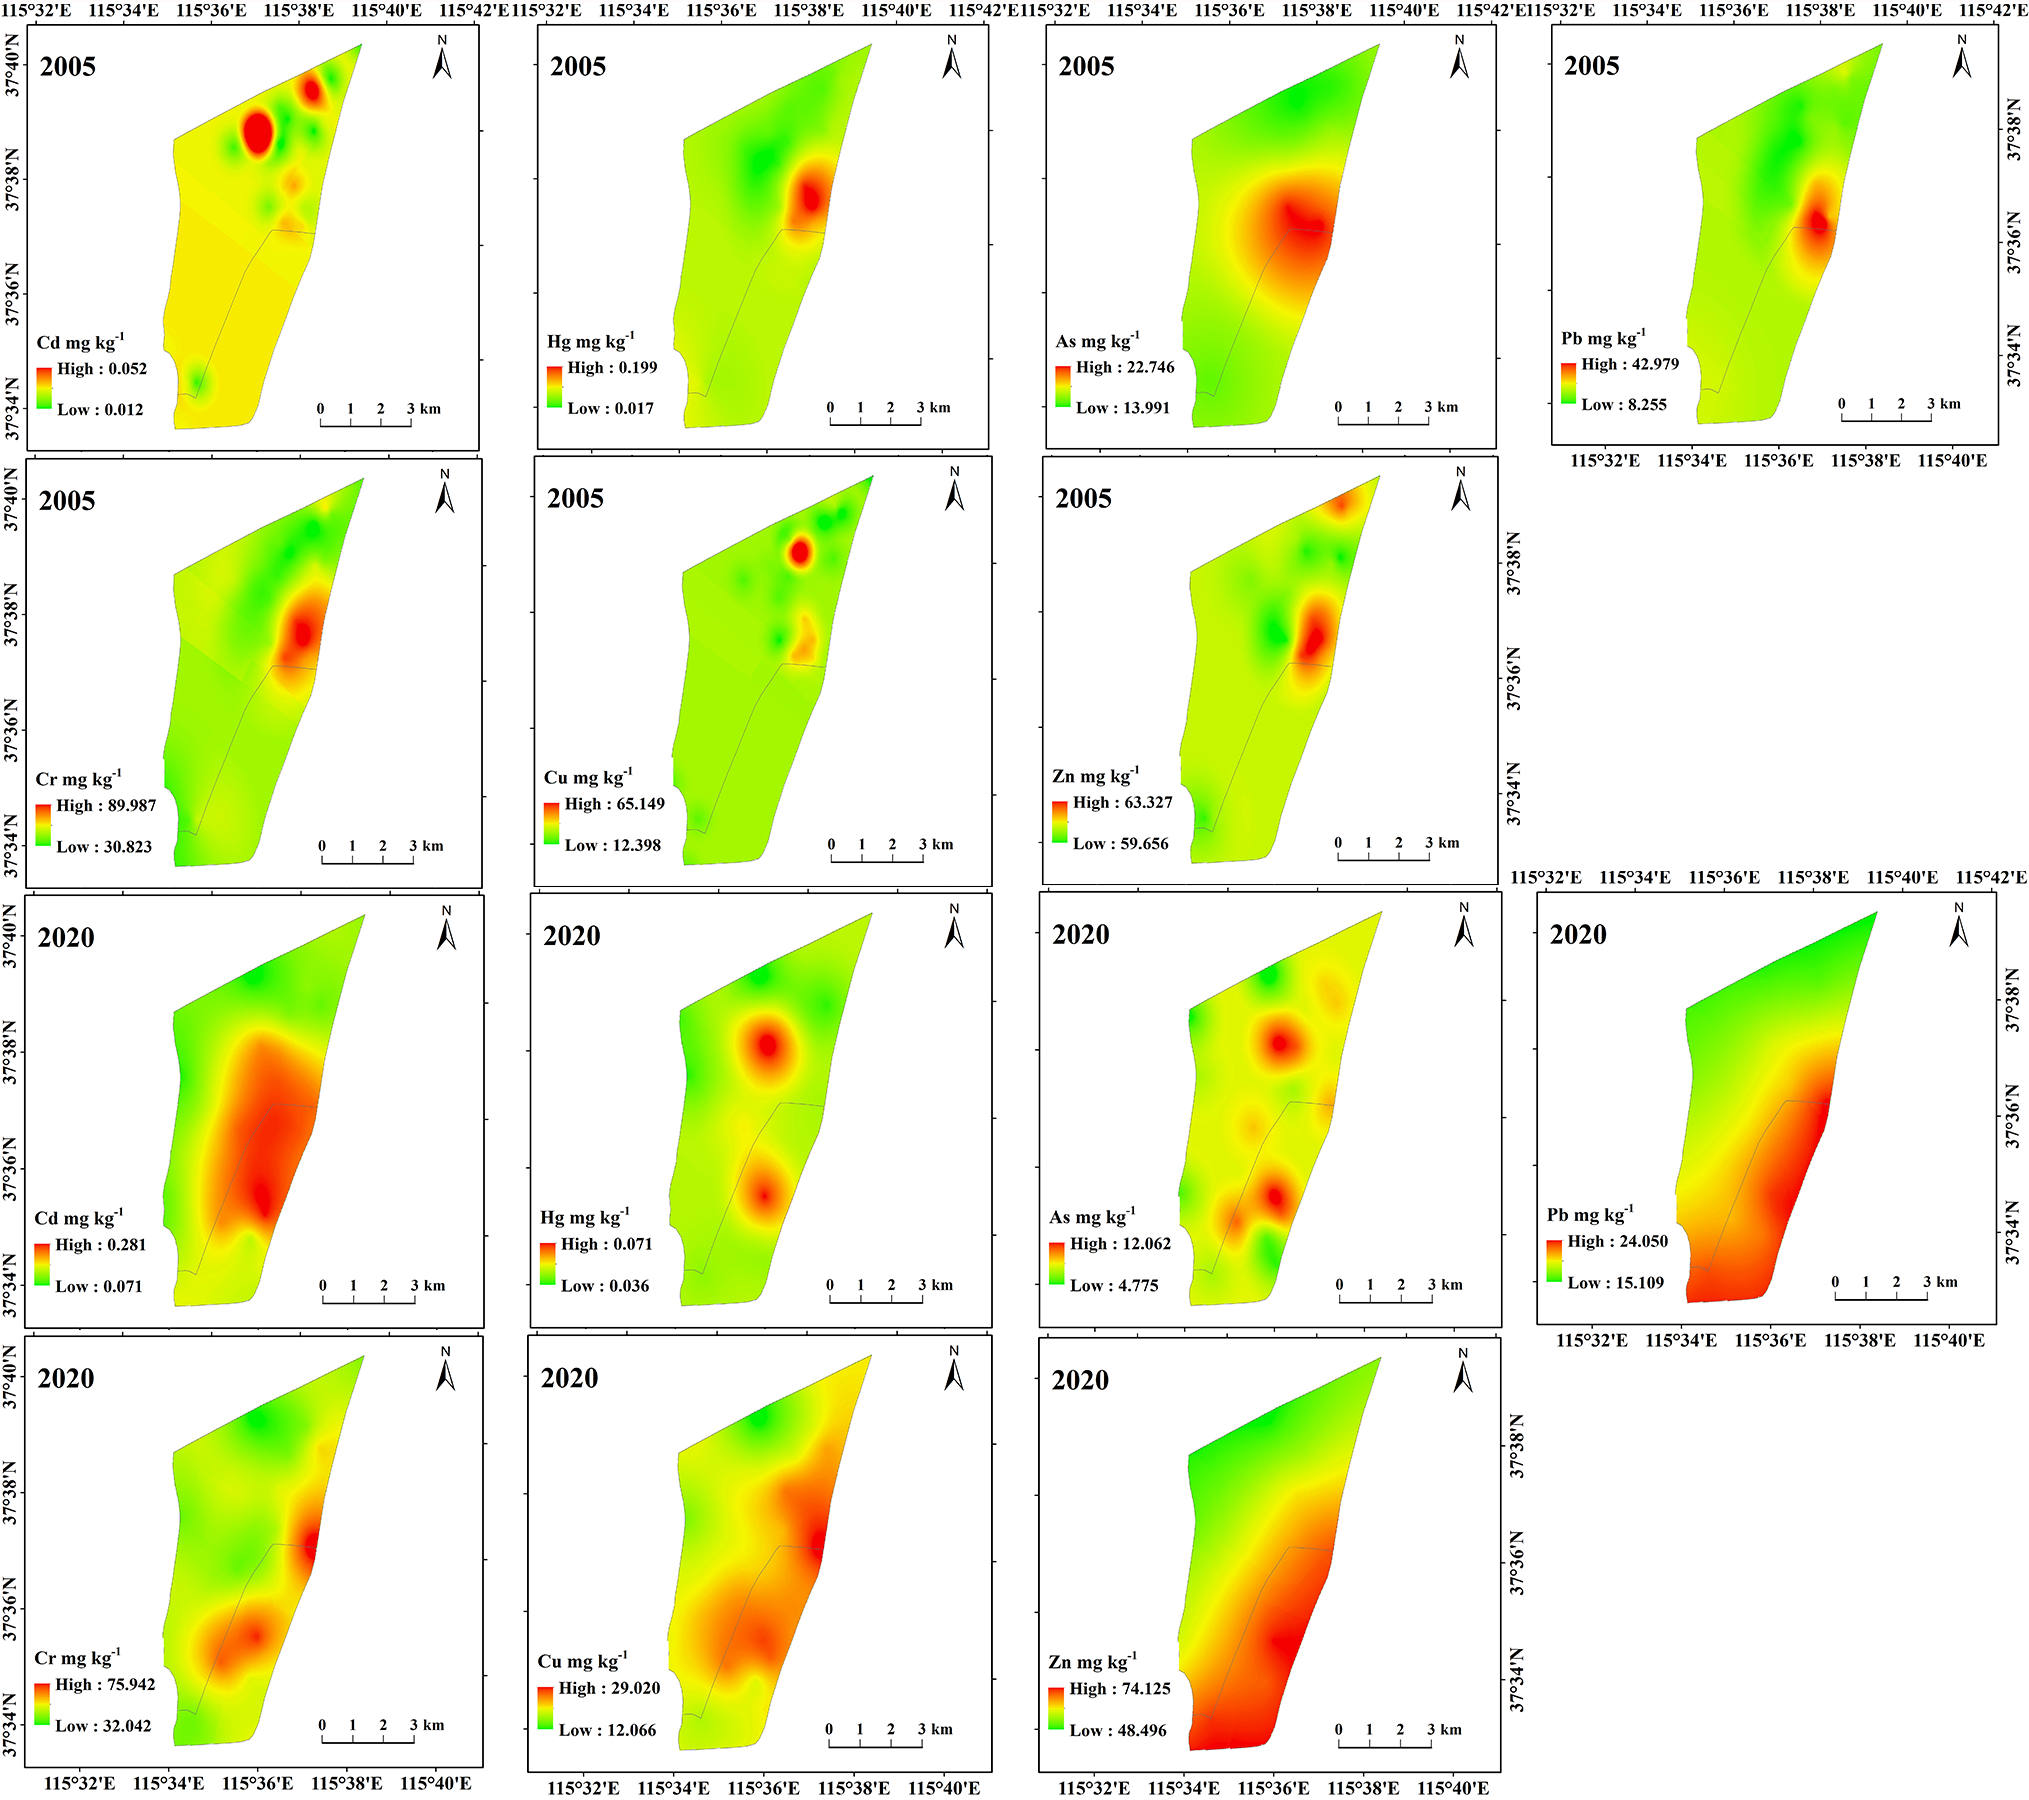
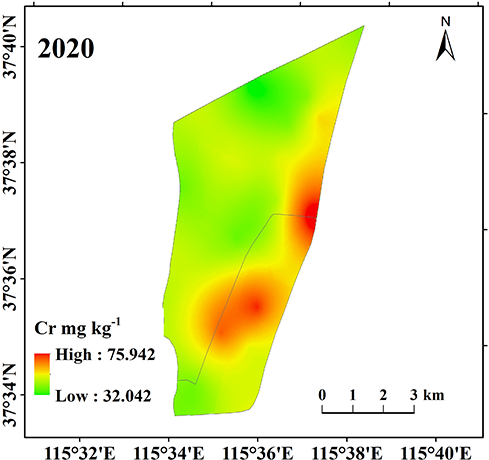
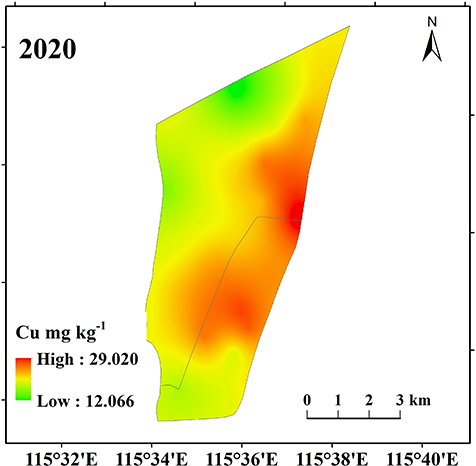
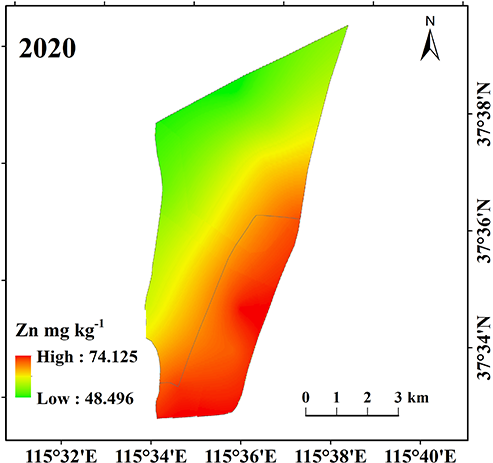
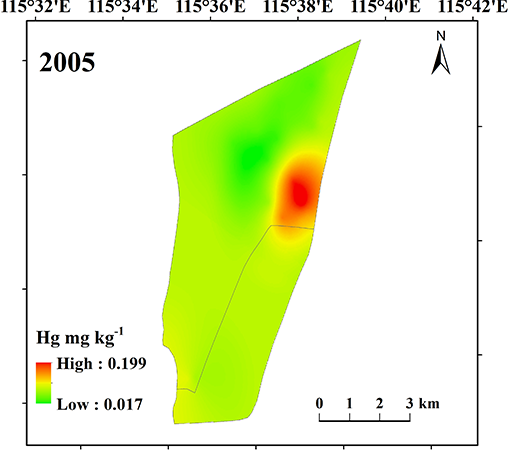
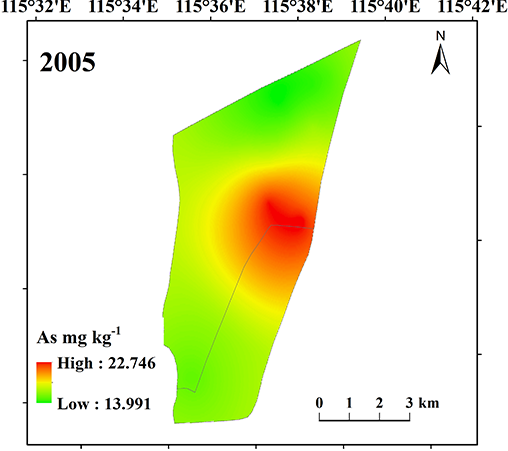
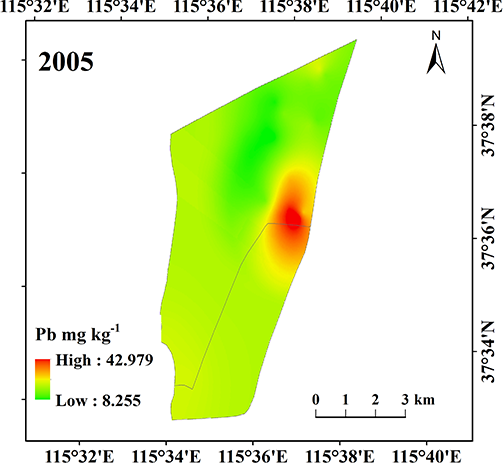
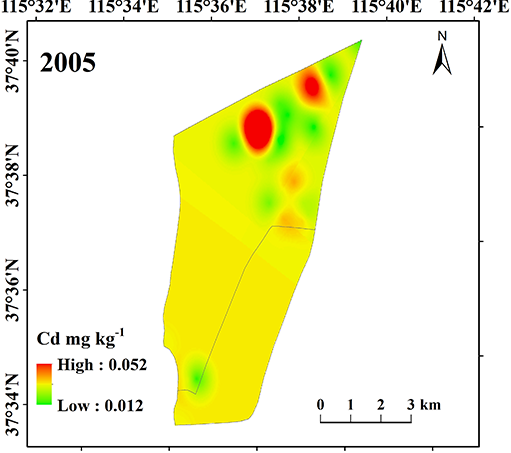
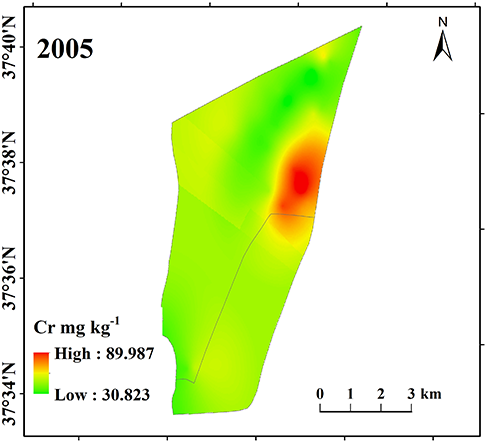
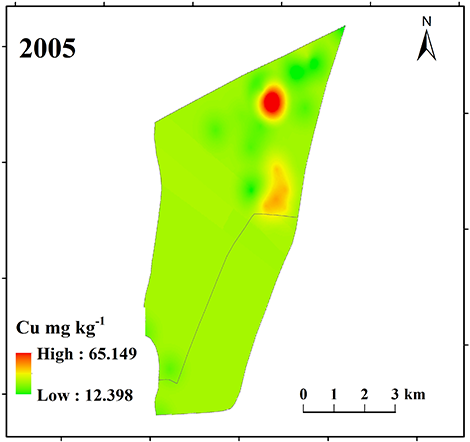
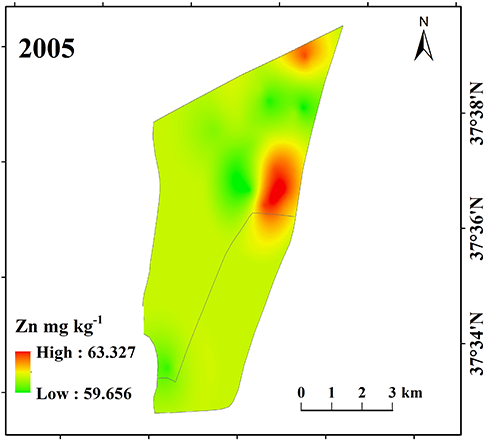
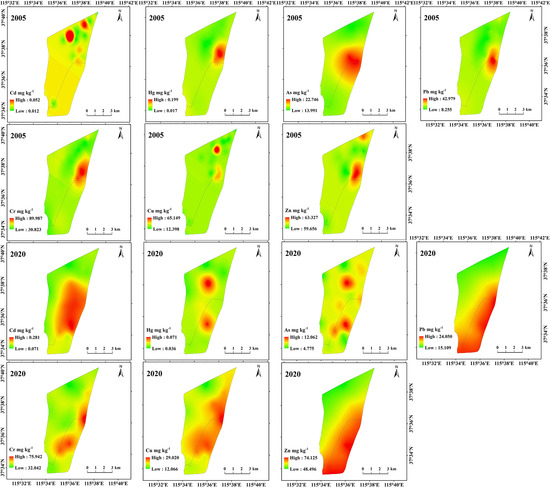
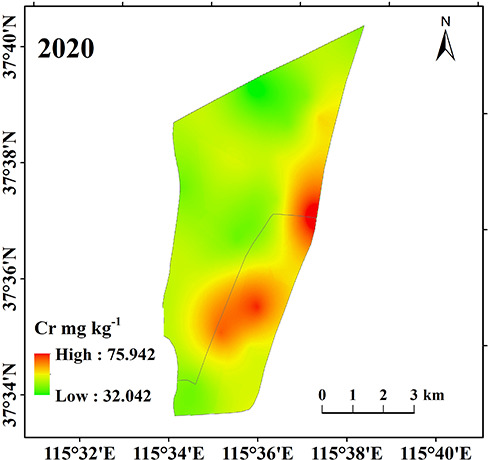
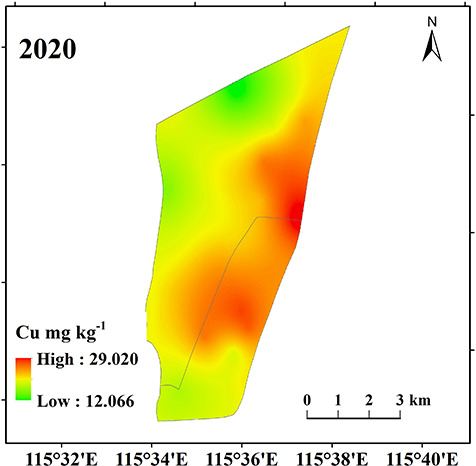
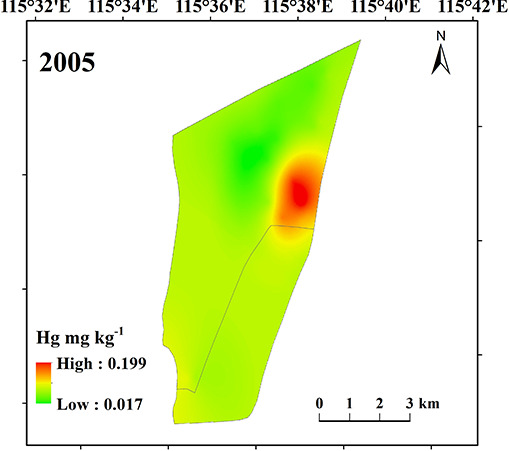
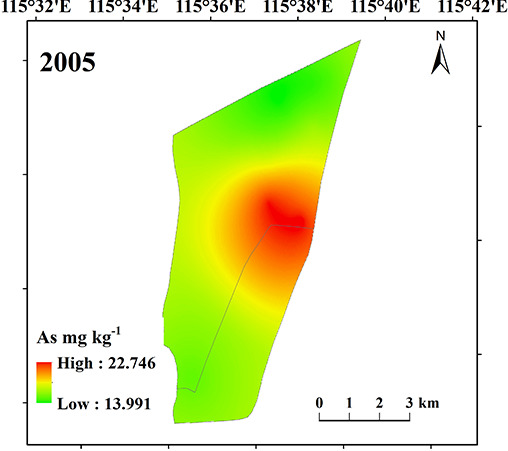
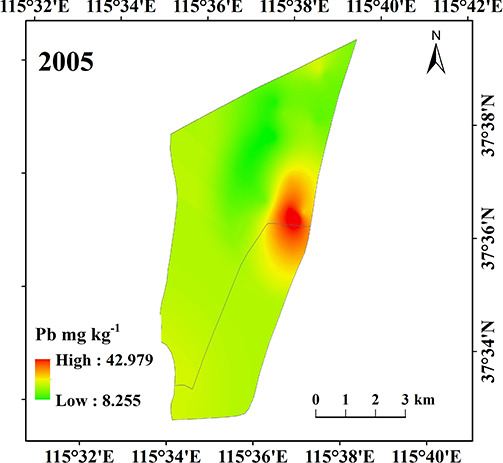
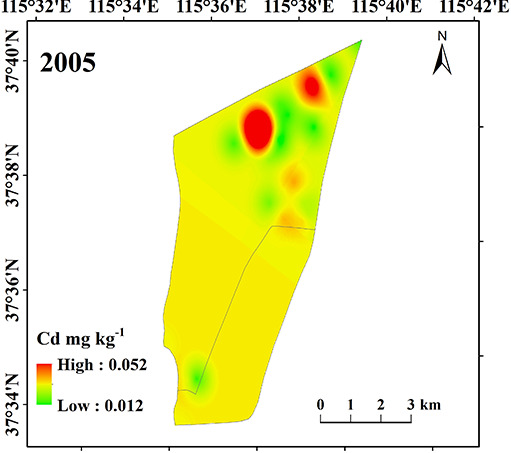
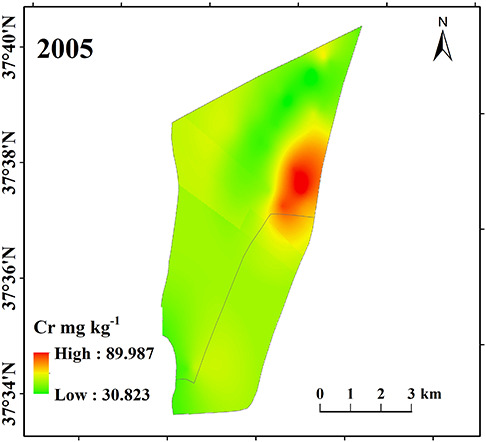
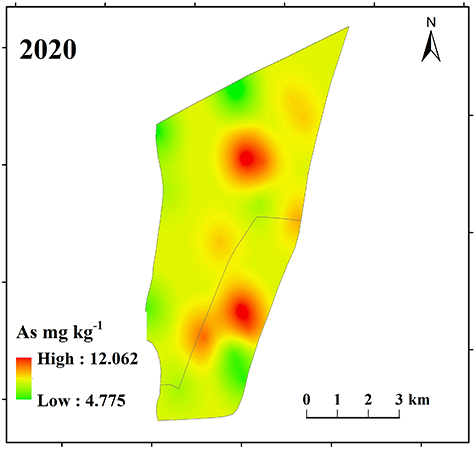
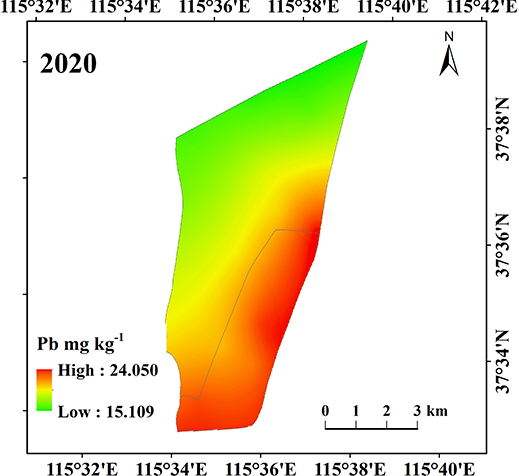
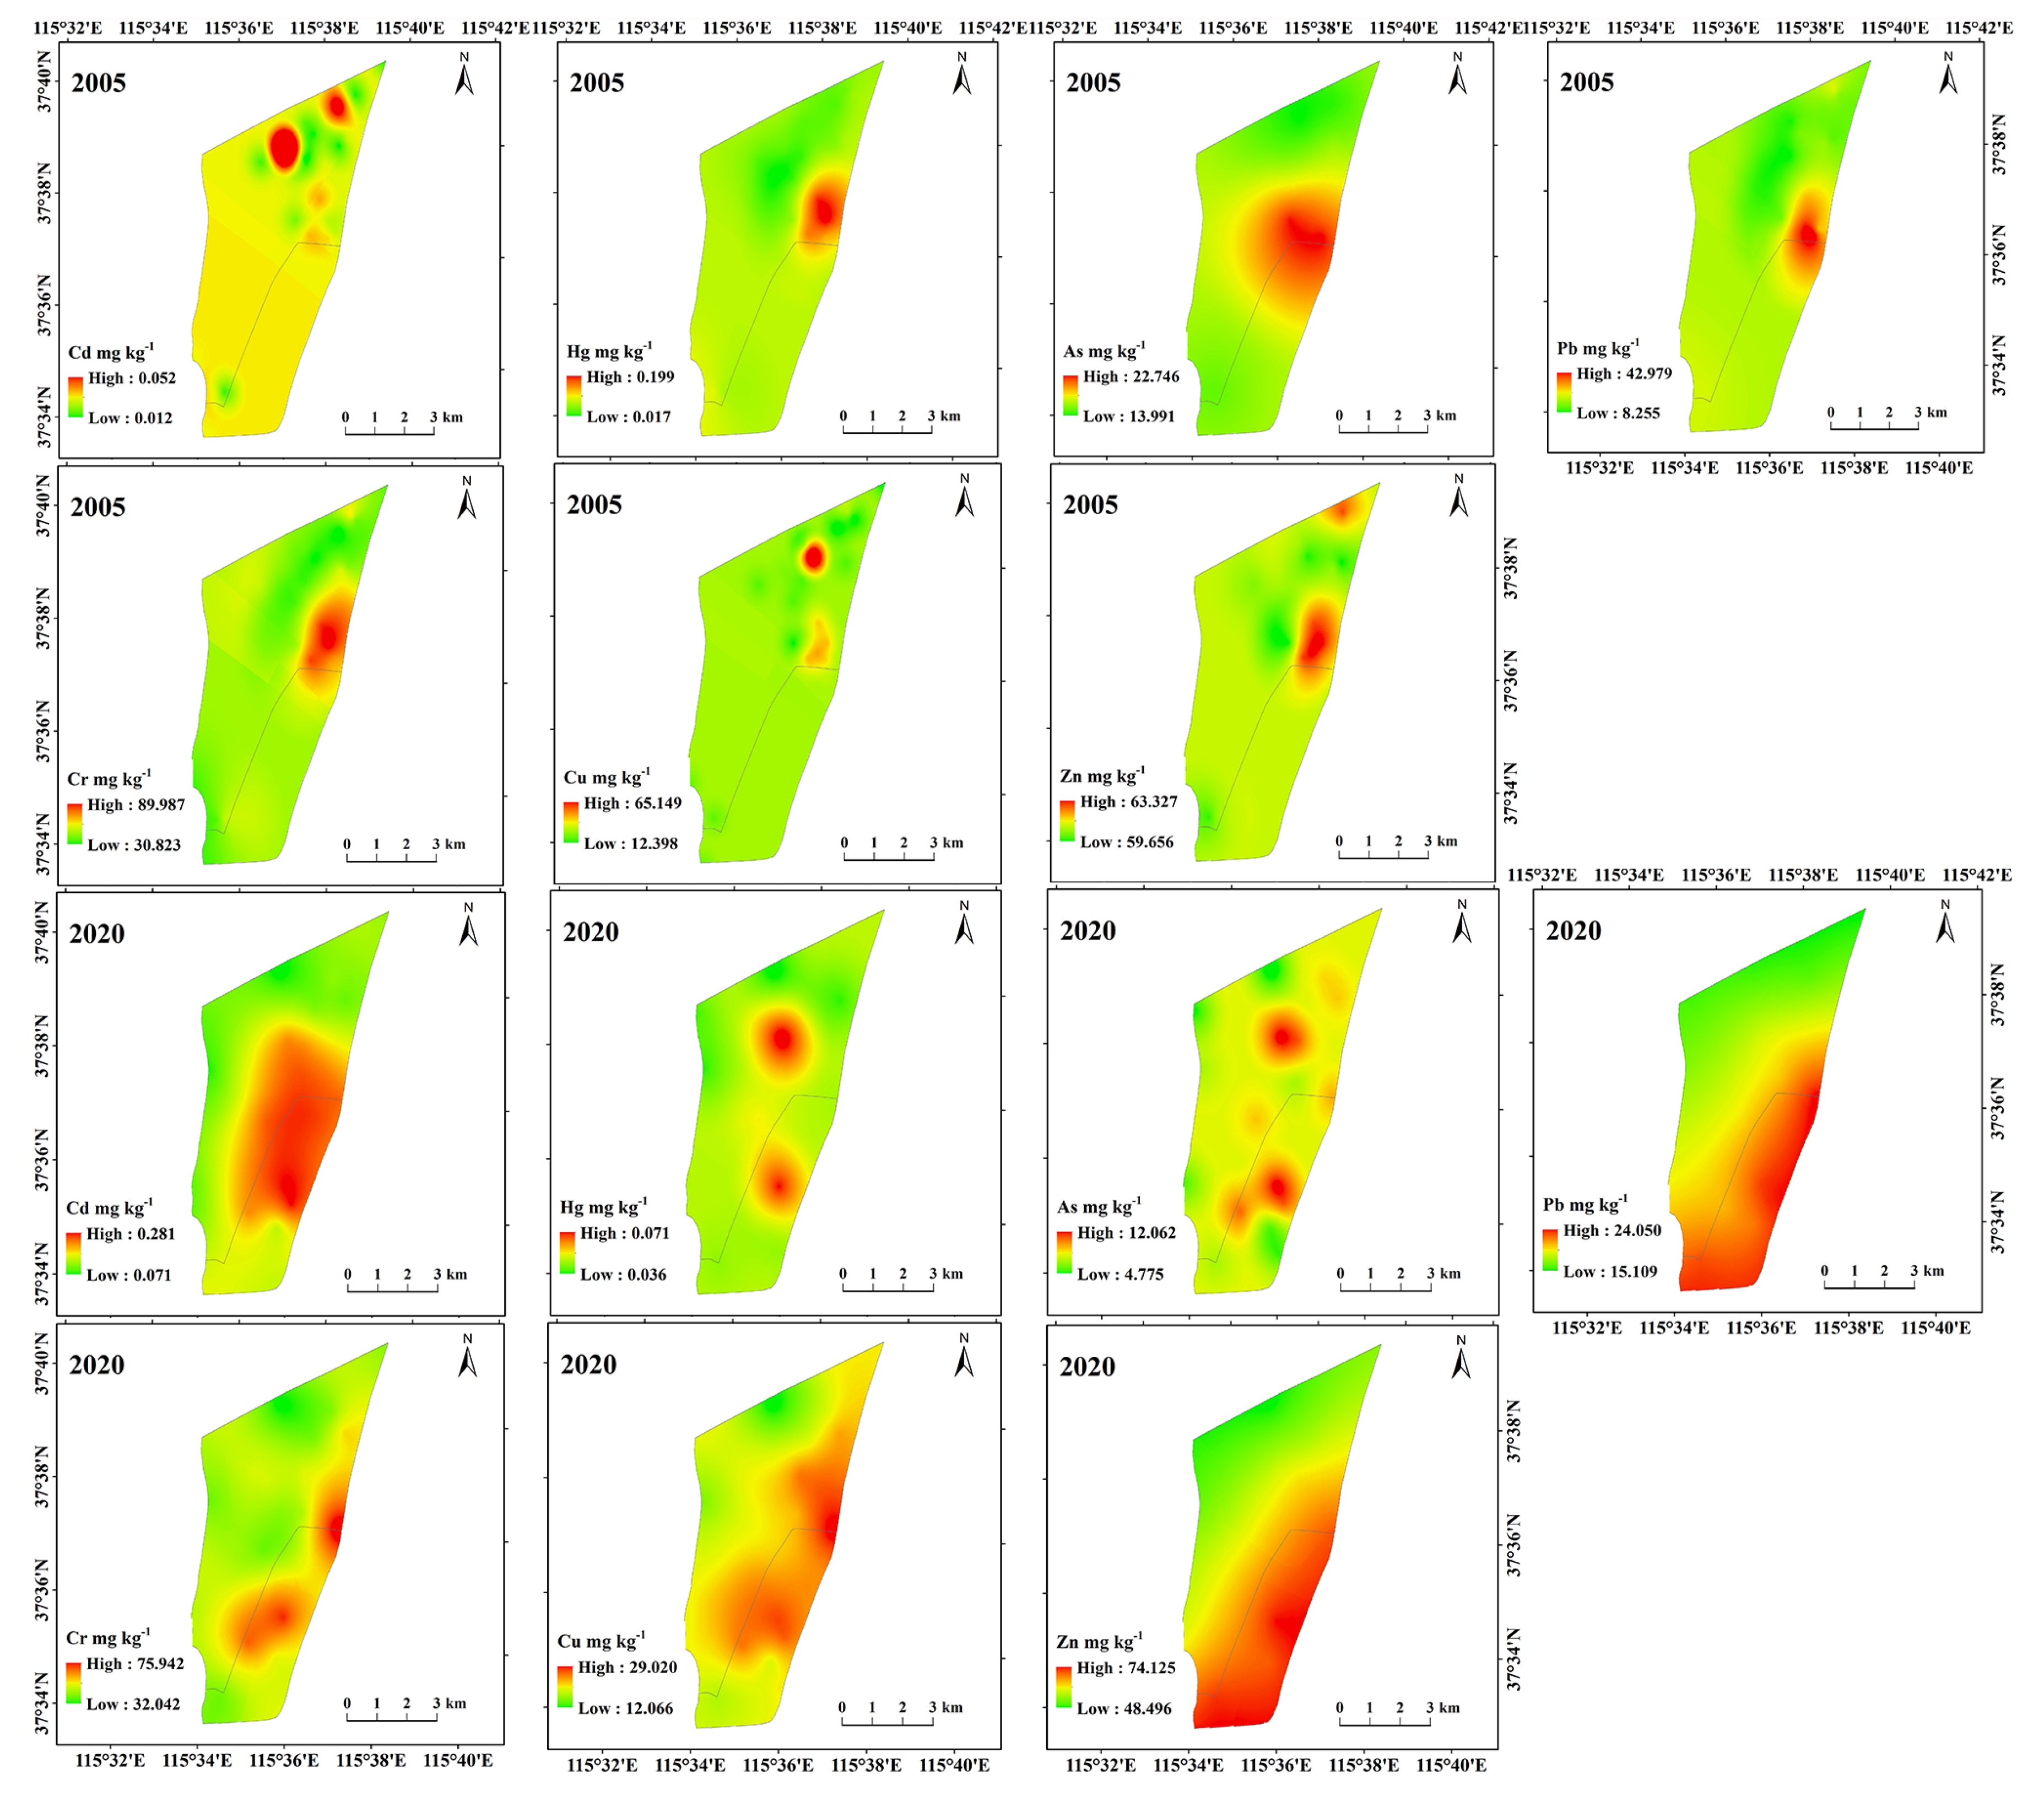
3.1. Change Characteristics of Heavy Metals Concentrations

The temporal and spatial change characteristics of heavy metals concentrations are shown in Table 2 and Figure 2. In 2005, the average concentrations of Hg, As, and Cu exceeded the background value of Hebei province by 2.3, 1.4, and 1.2 times, respectively. In 2020, the average concentrations of Cd and Hg exceeded the background value of Hebei province by 1.9 and 1.4 times, respectively. The coefficient of variation (CV) reflects the dispersion of data and spatial changes in heavy metals [16,24]. In 2005, the CV of Zn reached 1.30, indicating that there might be significant spatial changes. Compared with 2005, the concentration of most heavy metals decreased in 2020, with the concentration of As decreasing the most (−54.3%), followed by Hg (−41.5%), Cu (−27.9%), Cr (−10.4%), and Pb (−2.4%). However, the concentration of Cd increased the most (860.0%), followed by Zn (1.4%) (Table 2).
In 2005, high concentrations of Hg, As, Pb, Cr, and Zn were mainly distributed in Wangkou sluice and nearby the causeway, while high concentrations of Cd and Cu were mainly distributed in the northern portion of the Big Lake. In 2020, high concentrations of Cd, Pb, Cr, Cu, and Zn were mainly distributed in the Jizhou Small Lake and near its causeway, while high concentrations of Hg and As were mainly distributed in the Jizhou Small Lake and in the middle-northern portion of the Big Lake (Figure 2). Our result was comparable in spatial distributions to the results of Wang et al. [14], who studied the distribution of heavy metals for Hengshui Lake in 2018.

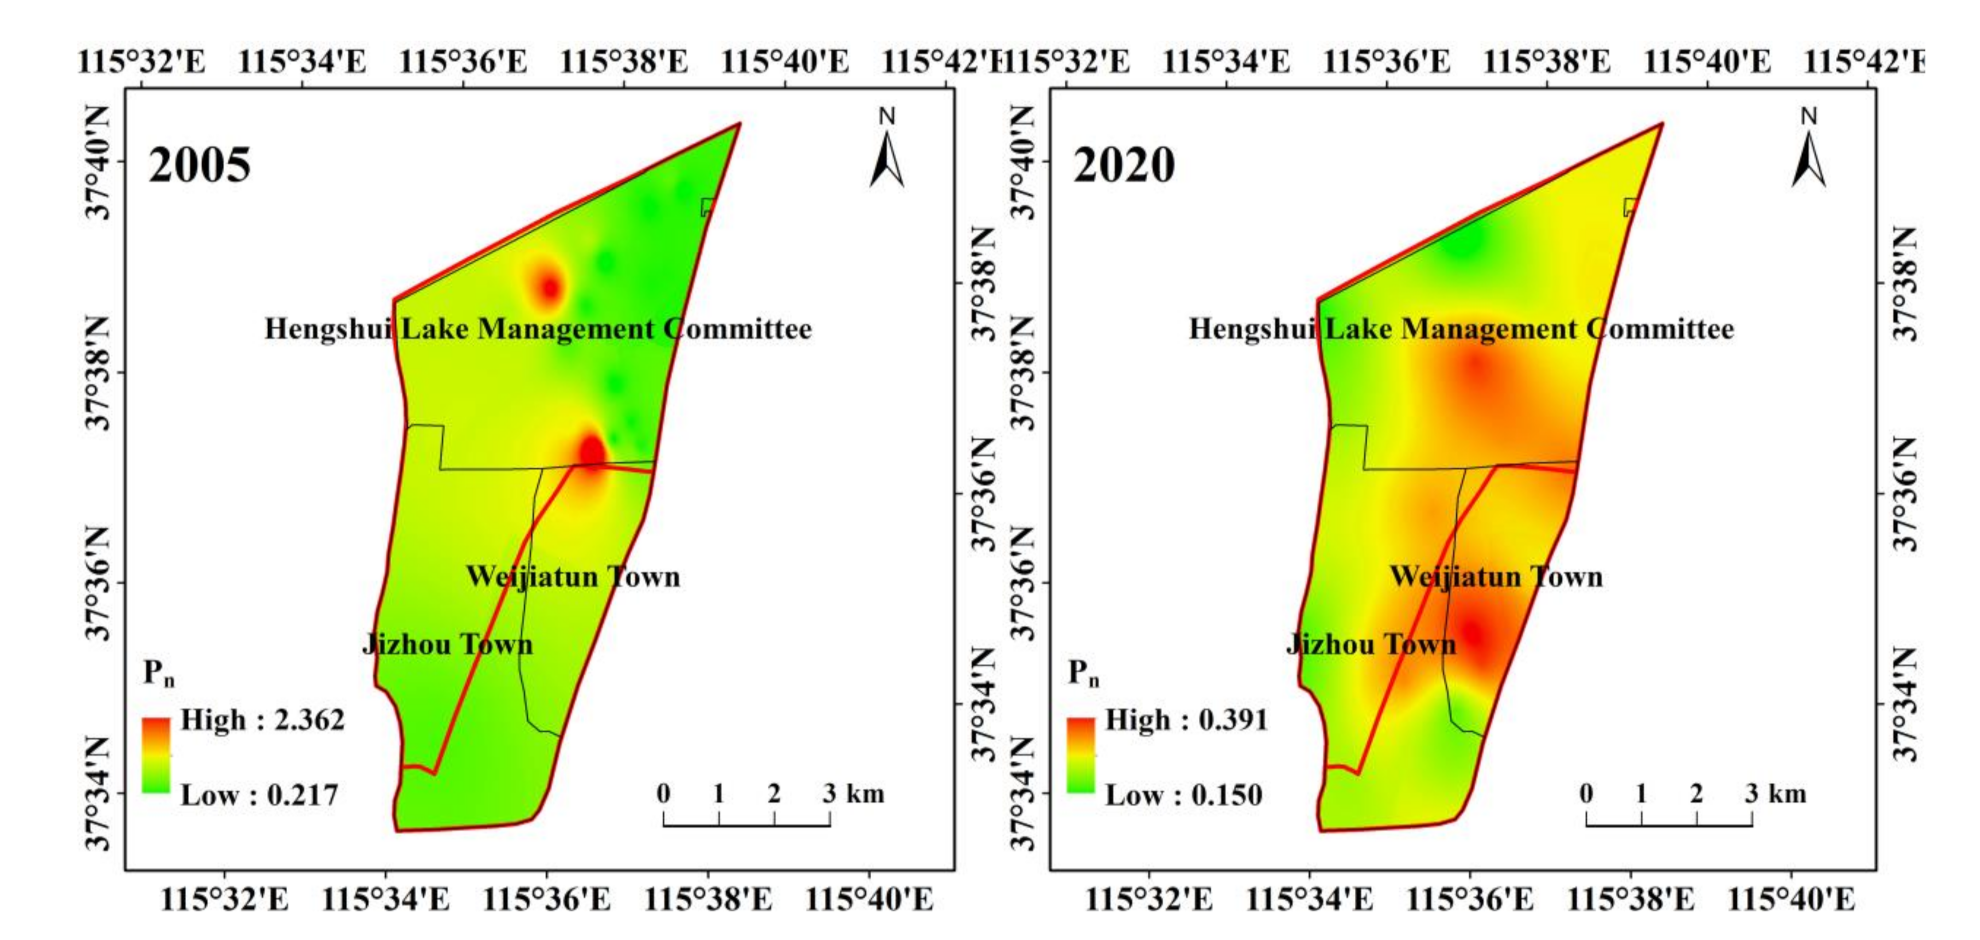
3.2. Changes in Contamination Degree of Heavy Metals

The single-factor pollution index (Pi) was used to show the pollution level of individual heavy metals. The results showed that, with the exception of As and Zn, the Pi of the other heavy metals in 2005 were all less than 1.0, indicating a non-pollution status except for As and Zn. In 2020, the Pi of all heavy metals were less than 1.0, indicating non-pollution (Figure 3).
The Nemero comprehensive pollution index (Pn) reflects the average pollution level and the maximum pollution situation. The results of Pn are shown in Figure 4. In 2005, with the exception of the Wangkou sluice and the northern portion of the Big Lake, the Pn was below 1.0 in the other regions, indicating non-pollution. Areas with high values mainly distributed in the Wangkou sluice and nearby the causeway (Figure 2). This is because these regions are located near the dam separating Big Lake from Jizhou Small Lake, where all wastewater has been dumped in from the nearby Jizhou city [25]. Since the wastewater in Jizhou Small Lake can leak into Big Lake through the underground soil, heavy metal may easily accumulate in these regions and resulted in high concentrations [12].
In 2020, the Pn indicated non-pollution for all sites. Areas with high Pn values were mainly distributed in the Jizhou Small Lake and near its causeway, as well as in the middle-northern portion of the Big Lake (Figure 2). These high values might have been related to the greatest number of industrial enterprises (such as medical equipment production and rubber industry facilities) in Weijiatun town, which has an industrial enterprises density of 6.5 individuals 100 ha−1 [26] and might have resulted in large quantities of wastewater containing heavy metals being discharged. Overall, the average Pn decreased from 0.56 in 2005 to 0.28 in 2020.

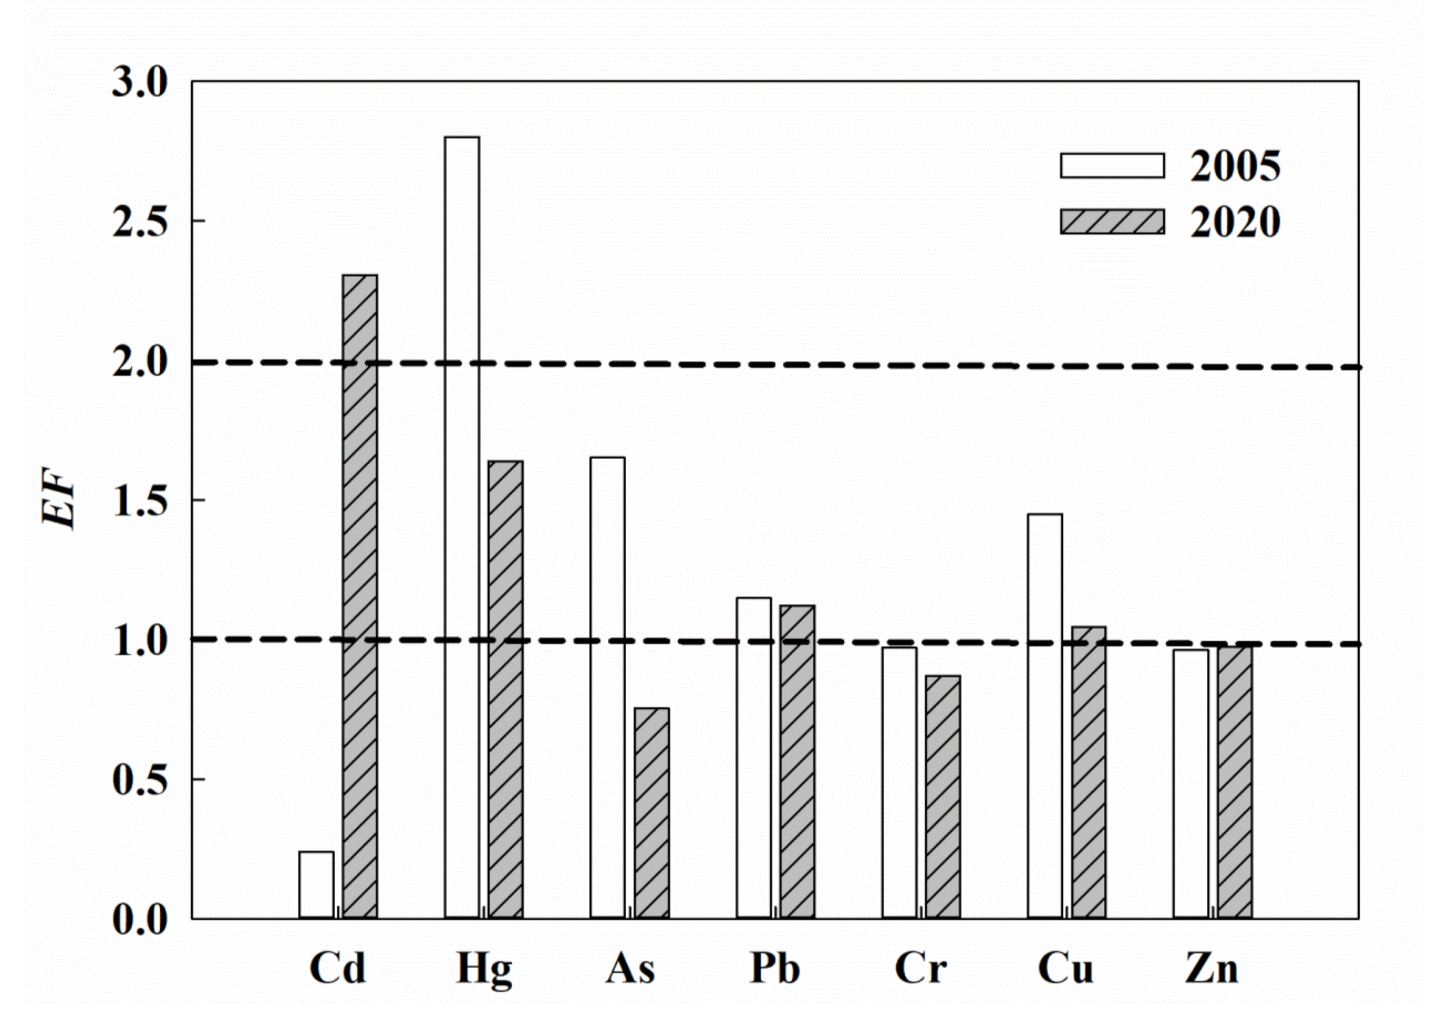
3.3. Enrichment Degree and Possible Contamination Sources of Heavy Metals

The enrichment factor (EF) can be used to evaluate the degree of heavy metals enrichment, as well as the influence of human activities on heavy metals and to identify probable sources [19]. In 2005, the EF values for Cd, Hg, As, Pb, Cr, Cu, and Zn were 0.1–0.8, 0.9–6.7, 0.6–7.3, 0.4–2.5, 0.5–1.6, 0.4–4.1, and 0.4–6.2, respectively. The maximum EF values of Zn and As were 16.0 and 11.5 times their minimal values. The average EF values for the seven investigated heavy metals were as follows: Hg (2.8) > As (1.7) > Cu (1.4) > Pb (1.1) > Cr (1.0) = Zn (1.0) > Cd (0.2). Hg was moderately enriched, while As, Cu, and Pb was lightly enriched and sediments were not enriched with Cr, Zn, and Cd (Figure 5). These results indicated that Cr, Zn, and Cd were not heavily influenced by human activities and were instead likely affected by soil elements, while Hg, As, Cu, and Pb were mainly influenced by human activities. Spatial evaluation revealed that high EF values for most heavy metals were mainly distributed in the Wangkou sluice and nearby the causeway (Figure S1), which were consistent with the high distributed of the concentrations (Figure 2) and the Nemero comprehensive pollution index (Figure 4).
In 2020, the variations in EF for Cd, Hg, As, Pb, Cr, Cu, and Zn were 0.9–3.6, 0.2–5.6, 0.4–1.1, 0.7–1.9, 0.6–1.3, 0.4–1.8, and 0.5–1.6, respectively. The maximum EF of Hg was 23.7 times its minimum value. The average EF values for the seven investigated heavy metals were Cd (2.3) > Hg (1.6) > Pb (1.1) > Cu (1.0) = Zn (1.0) > Cr (0.9) > As (0.8). Cd was moderately enriched, while Hg, Pb, Cu, and Zn showed light enrichment, and sediments were not enriched with Cr and As (Figure 5). These results indicated that Cr and As are not heavily influenced by human activities, while Cd, Hg, Pb, Cu, and Zn enrichment might be increased by anthropogenic activities. Spatial analysis revealed that areas of high EF values for most heavy metals were mainly distributed in the Jizhou Small Lake and near its causeway (Figure S1).
Compared with 2005, the EF values of Hg, As, Pb, Cr, and Cu in 2020 all decreased, with that of As decreasing the most (−54.3%), followed by Hg (−41.5%), Cu (−27.9%), Cr (−10.4%), and Pb (−2.4%). The decreases in concentration (Table 2), Nemero comprehensive pollution index (Figure 4), and enrichment factor (Figure 5) of these heavy metals might have been associated with implementation of a series of ecological conservation and restoration projects in the Hengshui Lake wetland, such as blocking all wastewater outlets into the lake, relocating polluting enterprises along the lake, diverting water from the Yellow River, banning all oil-fueled motor vessels, and canceling illegal blocking aquaculture [15,16]. Since the establishment of the Hengshui Binhu New Area Management Committee in 2011, the implementation of these conservation and restoration projects has greatly strengthened in administrative management [16], which has led to the effective control of the input of most heavy metals into Hengshui Lake. These decreases might also be associated with the degradation, migration, and transformation of heavy metals over the past 15 years. Although the EF for most of the heavy metals decreased, the EF of Cd and Zn increased, with the values of 860.0% and 1.4% (Figure 5), indicating that there was still considerable Cd input into Hengshui Lake during the past 15 years. Previous studies also indicated that Cd was currently the main pollution of sediment in Hengshui Lake [13,17]. This is probable because, although all forms of wastewater discharge have been strictly prohibited in Hengshui Lake in recent years, there are still 11 wastewater outlets from chemical industries in the Jima Canal, which is in the upper reaches of the Jizhou Small Lake. Normally, the sluice gate in this canal is closed and wastewater cannot enter the lake. However, once upstream water arrives, water with high Cd levels from the canal spills into the lake [16]. In addition, Liu et al. [13] reported that the ecological diversion water from the Yellow River into Hengshui Lake might result in the input of Cd. All of the factors mentioned above contributed to seriously increase the concentration and EF of Cd in the lake (Table 2 and Figure 5).

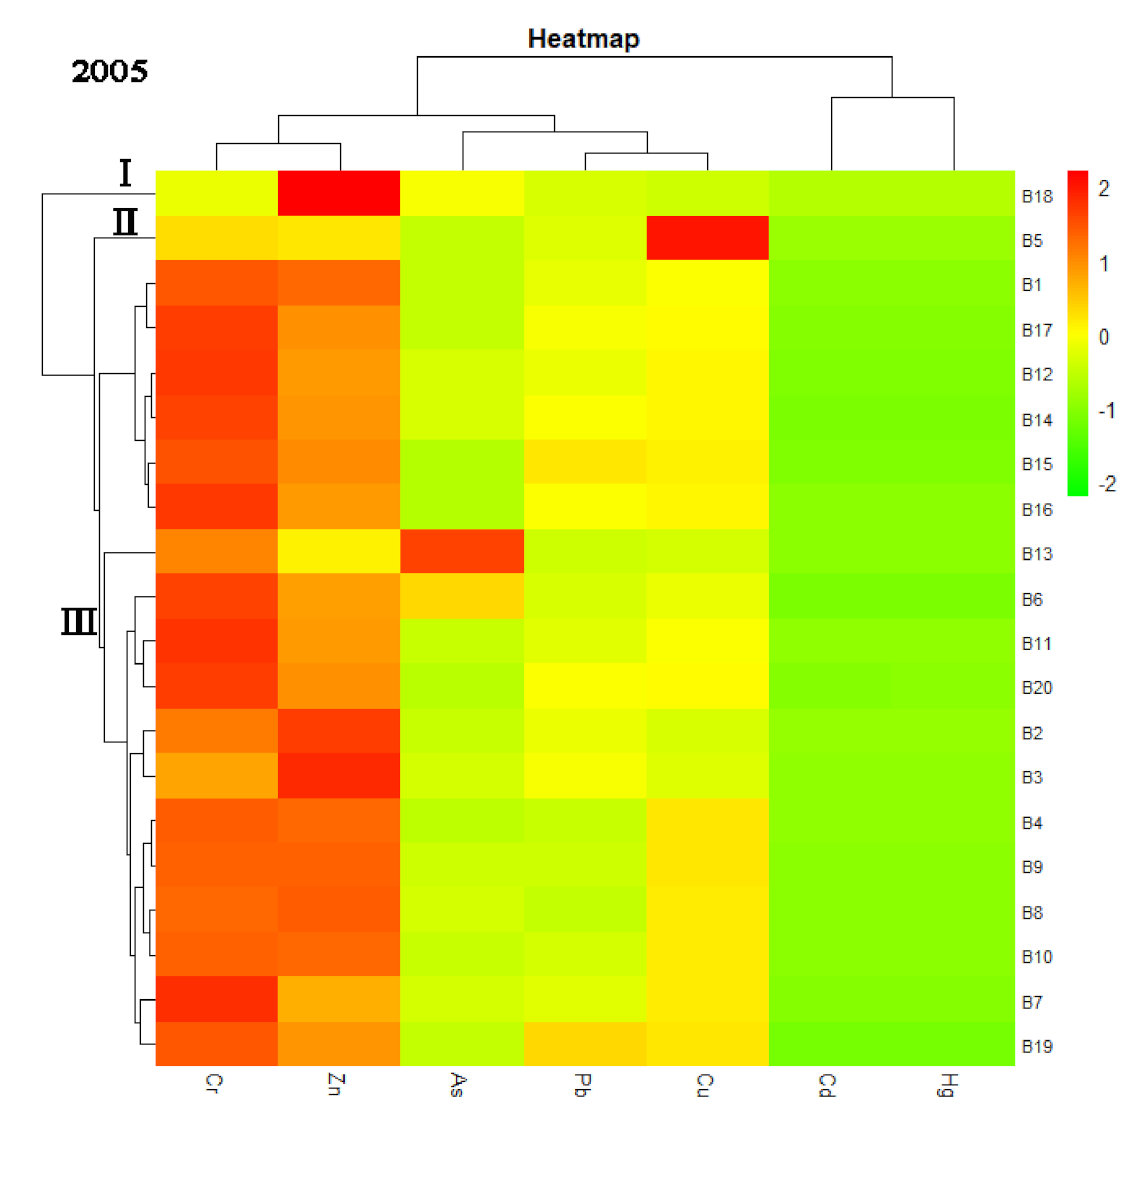
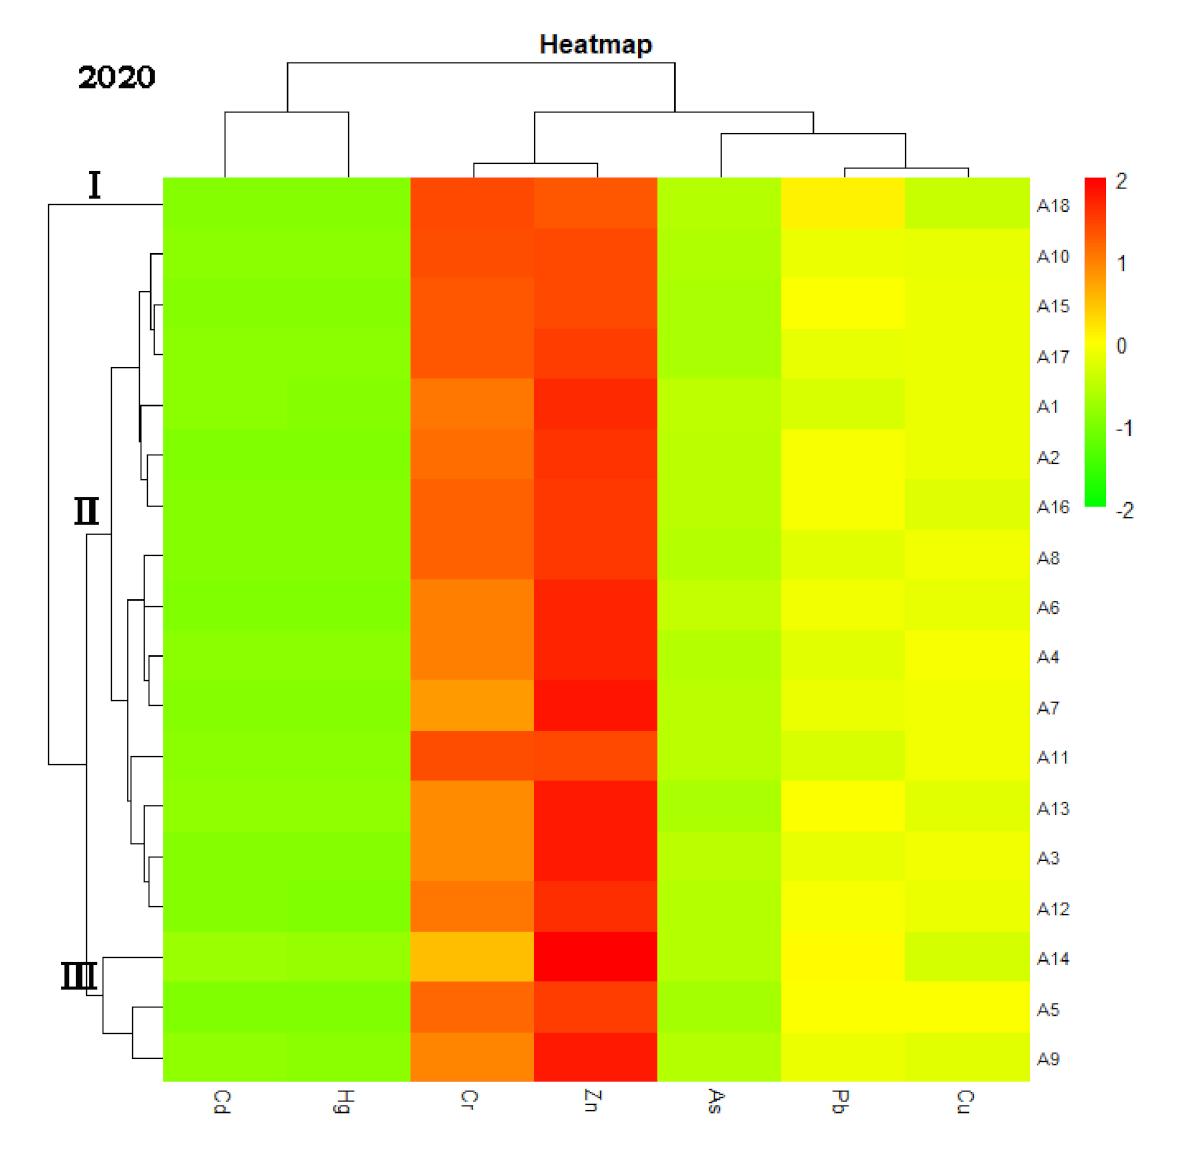
3.4. Hierarchical Cluster Analysis

A heatmap with hierarchical cluster analysis is shown in Figure 6. The X-axis shows that the seven studied heavy metals were classed into two groups. Cd and Hg were in the same group, indicating that these two heavy metals were homologue. Cr, Zn, As, Pb, and Cu belonged to another group. The Y-axis shows that the studied points were divided into three groups. In 2005, group I merely had 1 point, accounting for 5.0% of the total points. Group II also had 1 point, accounting for 5.0% of the total points, which were lightly colored and indicated light pollution. Group III had 18 points, accounting for 90.0% of the total points, indicating the strong correlation of these points. In 2020, the group I merely had 1 point, accounting for 5.6% of total points, which indicated relatively light pollution; group II had 14 points, accounting for 77.8% of the total points; group III had 3 points, accounting for 16.7% of the total points, which indicated relatively heavy pollution, mainly located in the Jizhou Small Lake and near its causeway. This result was in consistent with the spatial distribution of high concentrations of heavy metals (Figure 2), high Nemero comprehensive pollution index (Figure 4), and high EF values for most heavy metals (Figure S1).

3.5. Correlation Analysis

Correlation analysis is a common method for analysis of the homology between different heavy metals. Indicators with high correlations have similar pollution sources or migration characteristics. In 2005, there were significant positive correlations among Hg, Pb and Cr; As and Zn; and Pb, Cr, and Zn (p < 0.01) (Table 3), combined with similar spatial distributions of Pb, Cr, and Zn and the hierarchical cluster analysis (Figure 2 and Figure 6), indicating that these heavy metals might have the same pollution sources or migration characteristics. In 2020, there were significant positive correlations between Cd, Pb, Cr, Cu, and Zn (p < 0.01). When combined with the similar spatial distribution of Pb, Cr, Cu, and Zn and the hierarchical cluster analysis (Figure 2 and Figure 6), these findings indicated that Pb, Cr, Cu, and Zn might have similar pollution sources or migration characteristics.

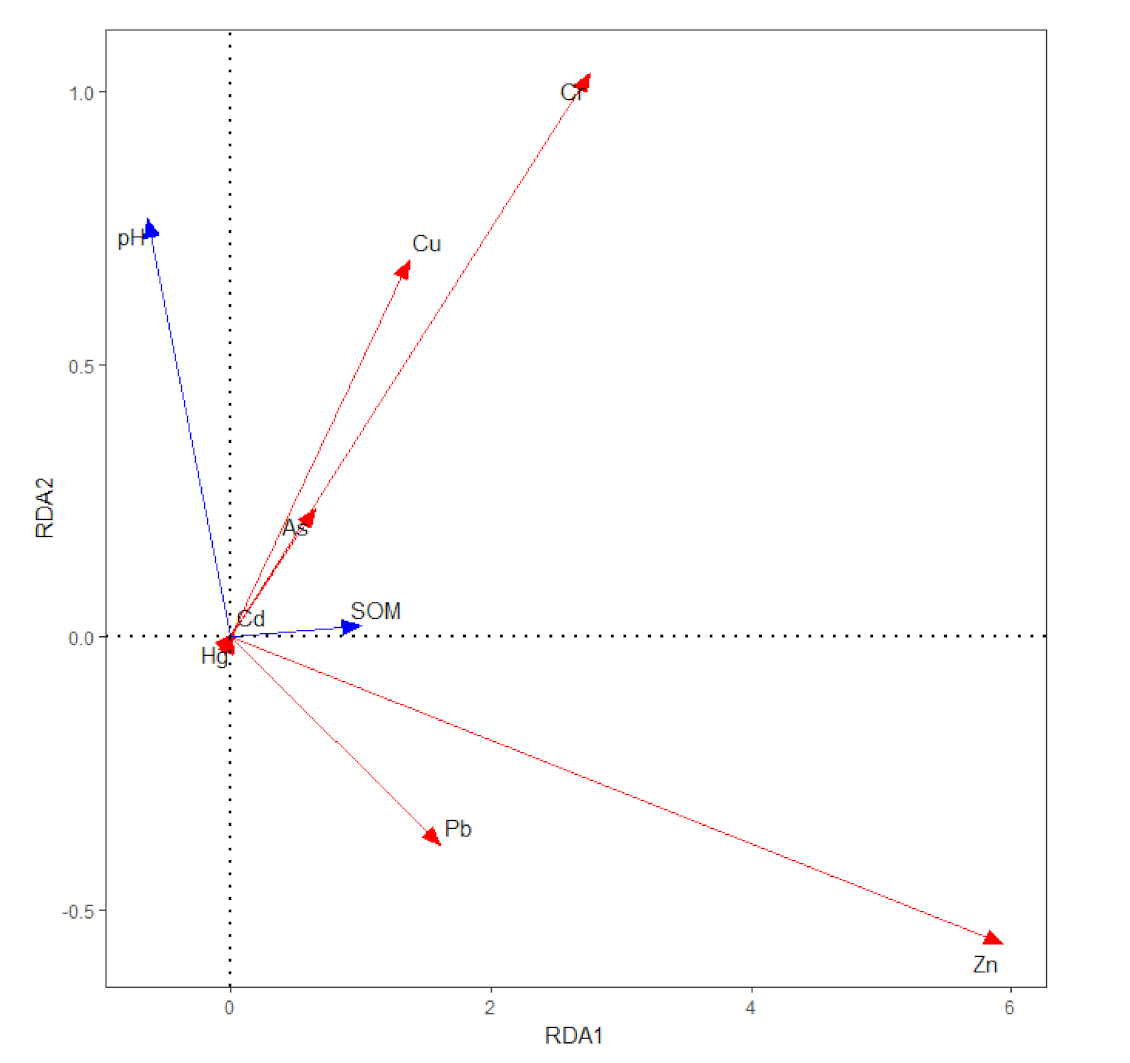
3.6. Redundancy Analysis

The relationships between pH, organic matter content, and heavy-metals values were explored by using the biplot of the redundancy analysis (RDA) (Figure 7). The pH and organic matter content were designated as the explanatory variables, and heavy-metals values were designated as the response variables. The variance inflation factors (VIFs) of the explanatory variables were <10, indicating that the explanatory variables of this study were not collinear. The coefficient of determination (R2) of the model was 0.477, suggesting that 47.7% of the total variance of response variables can be explained by explanatory variables. The results of RDA showed that there were significantly positive relationships between organic matter and Zn, Cr, Cu and Pb, indicating that it was the main factor that influenced the sorptive properties of the sediments and heavy-metals accumulation.

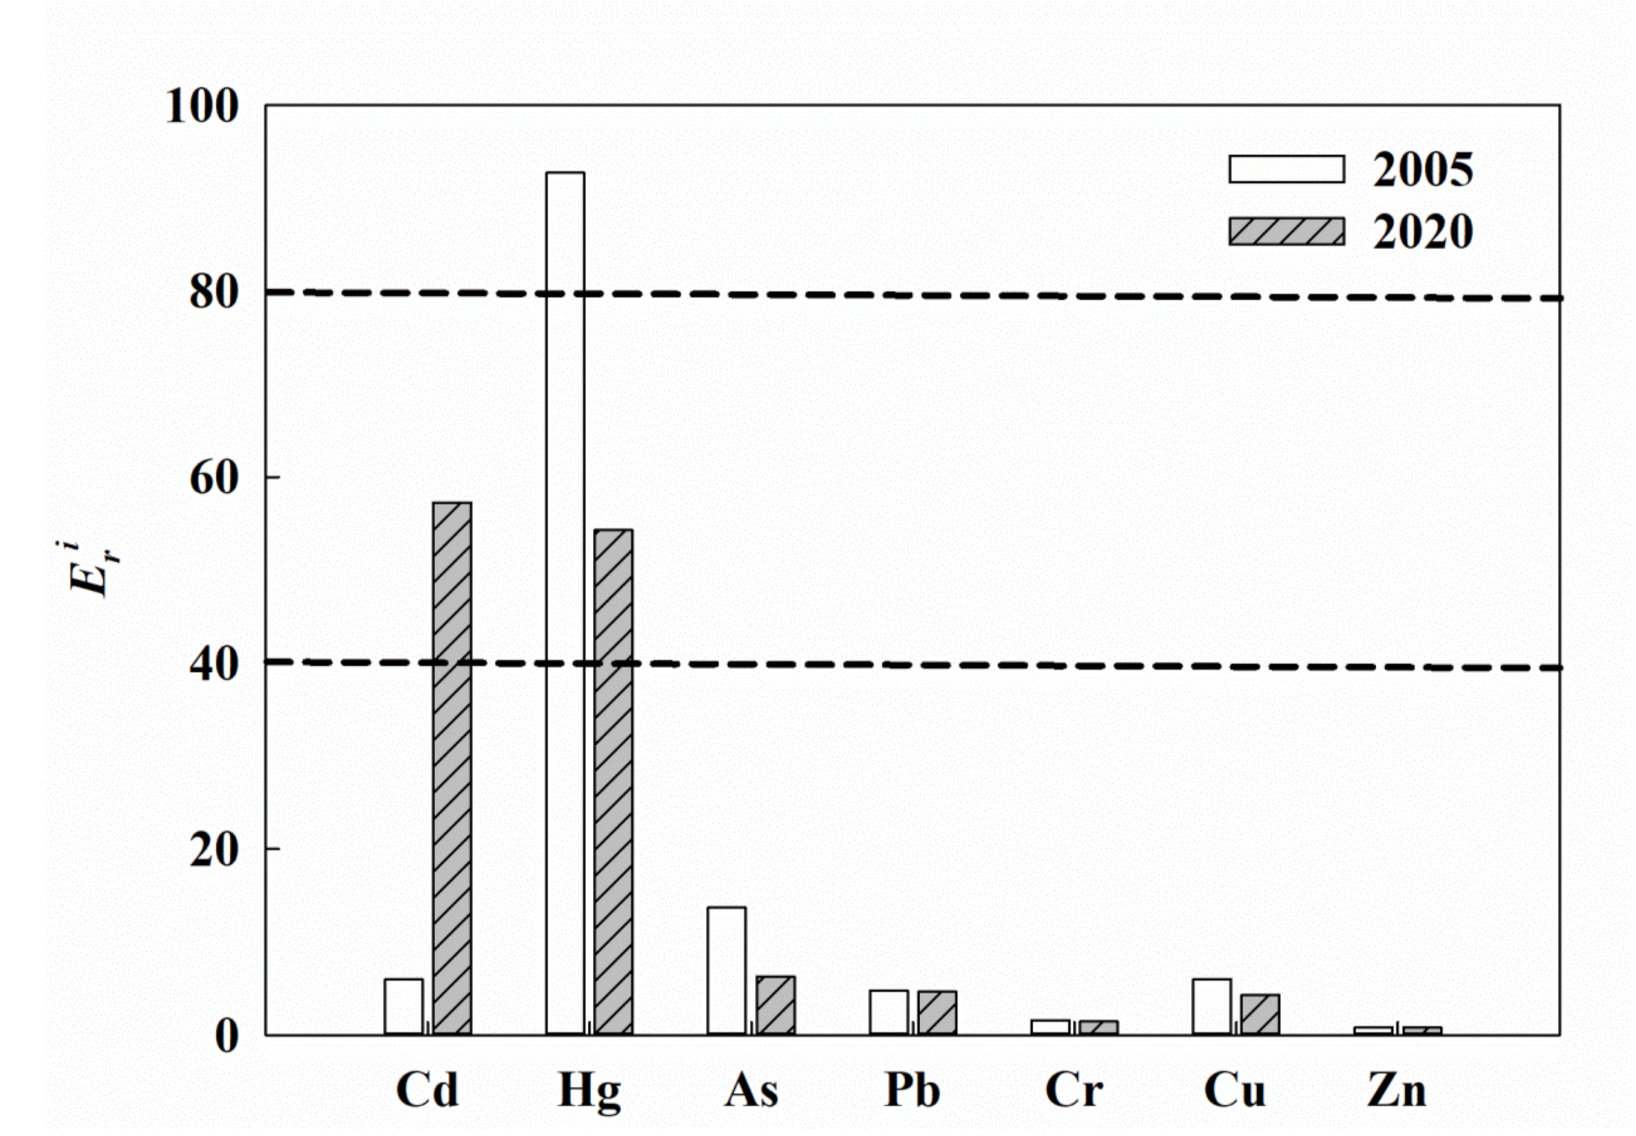
3.7. Ecological Risk of Heavy Metals

The potential ecological risk index (PRI) represents the sensitivity of the biological community to heavy metals and illustrates the risk posed by contamination [22]. The ecological risks posed by heavy metals are shown in Figure 8 and Figure 9. In 2005, the sequence of risk factor (Eir) was Hg > As > Cu > Cd > Pb > Cr > Zn. All of the studied heavy metals had low potential ecological risk, with the exception of Hg, which posed a considerable potential ecological risk. In 2020, the sequence of Eir was Cd > Hg > As > Pb > Cu > Cr > Zn. Cd and Hg showed moderate potential ecological risk, while the other studied heavy metals showed low potential ecological risk. Compared with 2005, the Eir for most of the heavy metals decreased in 2020, with that of As showing the greatest decrease (−54.3%), followed by Hg (−41.5%), Cu (−27.9%), Cr (−10.4%), and Pb (−2.4%); however, the Eir of Cd and Zn increased by 860.0% and 1.4%, respectively (Figure 8). These results were consistent with the results obtained for the temporal changes in the concentration (Table 2) and EF (Figure 5) and also indicated that the increase in Cd contamination warrants particular attention. In 2005, high Eir values of Hg, As, Pb, Cr, and Zn were mainly distributed in Wangkou sluice, while high Eir values of Cd and Cu were mainly distributed in the northern portion of the Big Lake. In 2020, high Eir values of Cd, As, Pb, Cr, Cu, and Zn were mainly distributed in the Jizhou Small Lake and near its causeway (Figure S2).
The average values of PRI in 2005 and 2020 were all below 150, indicating low ecological risk. However, the PRI of some points showed moderate ecological risk. These points were mainly distributed near Wangkou sluice and the northern portion of the Jizhou Small Lake in 2005, as well as in the Jizhou Small Lake and the middle regions of the Big Lake in 2020 (Figure 9). These high station distributions were largely consistent with the high station distributions of the concentrations (Figure 2), Nemero comprehensive pollution index (Figure 4), and enrichment factors (Figure S1). The spatial distribution of high concentration and correlation assessment indexes in the present study could be useful in identifying stations in Hengshui Lake that most need pollution control and treatment.

3.8. Implications

With the government-dominated wetland conservation and restoration efforts [7], the concentrations of most heavy metals in Hengshui Lake have decreased (Table 2), resulting in decreases in the single factor pollution index, composite pollution index, enrichment factors, and the potential ecological risk index values during the study periods (Figure 3, Figure 4, Figure 5 and Figure 9). Despite the positive impacts of wetland conservation and restoration projects on heavy metals contamination, the Cd levels still tended to increase, particularly in the related regions of dense enterprises and wastewater overflow zone (i.e., Wangkou sluice, the Jizhou Small Lake and its causeway). This was primarily a result of the spilled into of industrial wastewater and Cd-pollution ecological diversion water. Therefore, wetland conservation and restoration projects for Hengshui Lake should continue to be implement, especially in the Jizhou Small Lake, where it is important to strictly restrict the discharge of wastewater from medical equipment and rubber industry facilities, as well as by practically controlling the pollution caused by ecological diversion water. The findings in this study might have implications for the management of other lake wetlands in China.

3.9. Limitations and Uncertainty

Due to the paucity of the scale and time to dredge the sediment, we could not estimate the influence of sediment dredging on the spatial and temporal changes of heavy metals in the study region. Further research should include this factor into by tracking its scale and effectiveness. Due to a lack of intermediate sampling (i.e., 15 sampling campaigns from 2005 to 2020), this study mainly emphasized the spatial change of heavy metal in 2005 and 2020. In addition, the sedimentation rates, specifically the age of core sediment samples about the long-term temporal evolution, were not taken into consideration. Although the measured values were interpolated into the study area using inverse distance weighted (IDW) interpolation of ArcGIS 10.2 software, the incomplete consistency of the sampling points in 2005 and in 2020 was an important factor that caused uncertainty.

4. Conclusions

Our study indicated that the concentration of As, Hg, Cu, Cr, and Pb decreased in Hengshui Lake, while the concentrations of Cd and Zn increased by 860.0% and 1.4%, respectively. Furthermore, the related assessment indexes of most heavy metals tended to decrease during the study periods, which was mainly associated with implementation of a series of ecological conservation and restoration projects in Hengshui Lake. Despite the single-factor pollution index and composite pollution index for most heavy metals indicating no pollution, the enrichment factors and ecological risk index values of Hg and Cd exhibited medium enrichment and moderate potential ecological risk. Especially for Cd, the pollution degree gradually increased, mainly influenced by anthropogenic activities. The spatial distribution, Nemero comprehensive pollution index, enrichment factors, and ecological risk assessment all indicated that the high pollution region was mainly distributed nearby the regions of dense enterprises and wastewater overflow zone (i.e., Wangkou sluice, the Jizhou Small Lake and its causeway), which was primarily attributed to inflows of industry wastewater and Cd-polluted ecological diversion water. These findings indicated that the necessity of continued to strengthen the implementation of wetland conservation and restoration projects and identified the possible contamination origins and the important region of pollution control that could contribute to the targeted management of lake wetland.

Supplementary Materials

The following Supporting Information can be downloaded at: https://www.mdpi.com/article/10.3390/w14030458/s1, Table S1. Standards for single-factor pollution index and composite pollution index; Table S2. Classes of enrichment factors; Table S3. Classes of potential ecological risk indices of heavy metals; Table S4. Index of the variables; Figure S1. Distribution of enrichment factor for different heavy metal in Hengshui Lake; Figure S2. Distribution of risk factor for different heavy metal in Hengshui Lake.

Author Contributions

W.L.: conceptualization, data curation, formal analysis, funding acquisition, investigation, methodology, writing—original draft, and writing—review. Z.G.: formal analysis, writing—review and editing. H.W.: investigation and data curation. D.W.: investigation, formal analysis and data curation. M.Z.: designed and corrected of the manuscript. All authors have read and agreed to the published version of the manuscript.

Funding

This work was supported by the Fundamental Research Funds of Chinese Academy of Forestry (CAFYBB2019MA010), and the National Natural Science Foundation of China (72104236 and 31700409).

Institutional Review Board Statement

Not applicable.

Informed Consent Statement

Not applicable.

Data Availability Statement

The datasets used and analyzed during the current study are available from the corresponding author on reasonable request.

Acknowledgments

The authors thank Yuguang Zhang for the support of investigation during this research.

Conflicts of Interest

These authors declare that they have no conflicts of interest.

References

  1. Tang, W.Z.; Shan, B.Q.; Zhang, H.; Zhang, W.Q.; Zhao, Y.; Ding, Y.K.; Rong, N.; Zhu, X. L Heavy metal contamination in the surface sediments of representative limnetic ecosystems in eastern China. Sci. Rep. 2014, 4, 7152. [Google Scholar] [CrossRef] [PubMed] [Green Version]
  2. Yang, S.Y.; He, M.J.; Zhi, Y.Y.; Chang, S.X.; Gu, B.J.; Liu, X.M.; Xu, J.M. An integrated analysis on source-exposure risk of heavy metals in agricultural soils near intense electronic waste recycling activities. Environ. Int. 2019, 133, 105239. [Google Scholar] [CrossRef] [PubMed]
  3. Ma, J.F.; Chen, Y.P.; Antoniadis, V.; Wang, K.B.; Huang, Y.Z.; Tian, H.W. Assessment of heavy metal (loid)s contamination risk and grain nutritional quality in organic waste-amended soil. J. Hazard. Mater. 2020, 399, 123095. [Google Scholar] [CrossRef] [PubMed]
  4. Hsu, L.C.; Huang, C.Y.; Chuang, Y.H.; Chen, H.W.; Chan, Y.T.; Teah, H.Y.; Chen, T.Y.; Chang, C.F.; Liu, Y.T.; Tzou, Y.M. Accumulation of heavy metals and trace elements in fluvial sediments received effluents from traditional and semiconductor industries. Sci. Rep. 2016, 6, 34250. [Google Scholar] [CrossRef]
  5. Liu, W.W.; Li, M.J.; Zhang, M.Y.; Wang, D.A.; Guo, Z.L.; Long, S.Y.; Yang, S.; Wang, H.N.; Li, W.; Hu, Y.K.; et al. Estimating leaf mercury content in Phragmites australis based on leaf hyperspectral reflectance. Ecosyst. Health Sustain. 2020, 6, 1726211. [Google Scholar] [CrossRef] [Green Version]
  6. Liu, W.W.; Li, M.J.; Zhang, M.Y.; Long, S.Y.; Guo, Z.L.; Wang, H.N.; Li, W.; Wang, D.A.; Hu, Y.K.; Wei, Y.Y.; et al. Hyperspectral inversion of mercury in reed leaves under different levels of soil mercury contamination. Environ. Sci. Pollut. Res. 2020, 27, 22935–22945. [Google Scholar] [CrossRef]
  7. Liu, W.W.; Guo, Z.L.; Jiang, B.; Lu, F.; Wang, H.N.; Wang, D.A.; Zhang, M.Y.; Cui, L.J. Improving wetland ecosystem health in China. Ecol. Indic. 2020, 113, 106184. [Google Scholar] [CrossRef]
  8. Liang, J.; Feng, C.T.; Zeng, G.M.; Gao, X.; Zhong, M.Z.; Li, X.D.; Li, X.; He, X.Y.; Fang, Y.L. Spatial distribution and source identification of heavy metals in surface soils in a typical coal mine city, Lianyuan, China. Environ. Pollut. 2017, 225, 681–690. [Google Scholar] [CrossRef]
  9. Türker, O.C.; Vymazal, J. Heavy Metals in Wetlands in Turkey. In Southern Iraq’s Marshes; Jawad, L.A., Ed.; Springer: Cham, Switzerland, 2021; pp. 527–549. [Google Scholar]
  10. Laha, F.; Gashi, F.; Frančišković-Bilinski, S.; Bilinski, H.; Çadraku, H. Geospatial distribution of heavy metals in sediments of water sources in the Drini i Bardhë river basin (Kosovo) using XRF technique. Sustain. Water Resour. Manag. 2022, 8, 31. [Google Scholar] [CrossRef]
  11. Al-Mutairi, K.A.; Yap, C.K. A review of heavy metals in coastal surface sediments from the red sea: Health-ecological risk assessments. Int. J. Environ. Res. Public Health 2021, 18, 2798. [Google Scholar] [CrossRef]
  12. Zhang, M.Y.; Cui, L.J.; Sheng, L.X.; Wang, L.F. Distribution and enrichment of heavy metals among sediments, water body and plants in Hengshuihu Wetland of Northern China. Ecol. Eng. 2009, 35, 563–569. [Google Scholar] [CrossRef]
  13. Liu, L.; Zhang, J.W.; Chen, F.F.; Sheng, S.; Tian, Z.Q.; Wang, J. Pollution characteristics and ecological risk assessment of heavy metals in the sediment of Hengshui Lake. J. Environ. Eng. Technol. 2020, 10, 205–211. (In Chinese) [Google Scholar]
  14. Wang, H.N.; Zhang, M.Y.; Guo, Z.L.; Wang, D.A.; Liu, W.W. Distribution of contents of 7 kinds of heavy metal elements in the sediments of Hengshui Lake and their ecological risk assessment. Wetland Sci. 2020, 18, 191–199. (In Chinese) [Google Scholar]
  15. Wang, N.S.; Zhang, M.Y.; Cui, L.J.; Ma, M.Y.; Yan, L.; Mu, Y.L.; Qin, P. Contamination and ecological risk assessment of mercury in Hengshuihu wetland, Hebei province. Environ. Sci. 2016, 37, 1754–1762. (In Chinese) [Google Scholar]
  16. Liu, W.W.; Guo, Z.L.; Wang, D.A.; Zhang, M.Y.; Zhang, Y.G. Spatial-temporal variation of water environment quality and pollution source analysis in the Hengshui Lake. Environ. Sci. 2021, 42, 1361–1371. (In Chinese) [Google Scholar]
  17. Wang, L.; Wang, W.D.; Liu, D.; Li, G.; Yu, H.M.; Huang, S.; Xu, Y.Y. Risk assessment and source analysis of heavy metals in the river of a typical Bay watershed. Environ. Sci. 2020, 41, 3194–3203. (In Chinese) [Google Scholar]
  18. Ministry of Ecology and Environment of the People’s Republic of China (MEEPRC). Soil Environmental Quality-Risk Control Standard for Soil Contamination of Agricultural Land (GB 15618-2018); China Standards Publishing House: Beijing, China, 2018.
  19. Adeyemi, M.; Olusola, J.; Akpobasah, O.; Adidi, N.; Shelle, R. Assessment of heavy metals pollution in sediments from Ologe Lagoon, Agbara, Lagos, Nigeria. J. Geosci. Environ. Prot. 2019, 7, 61–73. [Google Scholar]
  20. Hakanson, L. An ecological risk index for aquatic pollution control-A sedimentological approach. Water Res. 1980, 14, 975–1001. [Google Scholar] [CrossRef]
  21. Nkinda, M.S.; Rwiza, M.J.; Ijumba, J.N.; Njau, K.N. Heavy metals risk assessment of water and sediments collected from selected river tributaries of the Mara River in Tanzania. Discov. Water 2021, 1, 3. [Google Scholar] [CrossRef]
  22. Acharjee, A.; Ahmed, Z.; Kumar, P.; Alam, R.; Rahman, M.S.; Simal-Gandara, J. Assessment of the ecological risk from heavy metals in the surface sediment of River Surma, Bangladesh: Coupled approach of Monte Carlo simulation and multi-component statistical analysis. Water 2022, 14, 180. [Google Scholar] [CrossRef]
  23. China National Environmental Monitoring Centre (CNEMC). Background Values of Soil Elements in China; China Environmental Science Press: Beijing, China, 1990. [Google Scholar]
  24. Fan, X.Y.; Lu, X.W.; Liu, H.M.; Qing, Q. Pollution and source analysis of heavy metal in surface dust from Xi’an university campuses. Environ. Sci. 2020, 41, 3556–3562. [Google Scholar]
  25. Liu, Z.J. The Analysis and Integrated Protection Countermeasure of Water Environment of Hengshui Lake Wetland. Master’s Thesis, China Agriculture University, Beijing, China, 2004. [Google Scholar]
  26. Rural Socio-economic Survey Division, National Bureau of Statistics (RSSDNBS). China Statistical Yearbook (Township); China Statistics Press: Beijing, China, 2019. [Google Scholar]
Figure 1. Location of Hengshui Lake wetland nature reserve, land use types, and sampling points.
Water 14 00458 g001
Figure 2. Temporal and spatial distribution of heavy metals in Hengshui Lake.
Water 14 00458 g002
Figure 3. Single-factor pollution index of heavy metals in Hengshui Lake.
Water 14 00458 g003
Figure 4. Distribution of Nemero comprehensive pollution index in Hengshui Lake.
Water 14 00458 g004
Figure 5. Average enrichment factors of heavy metals in Hengshui Lake.
Water 14 00458 g005
Figure 6. Heatmap with hierarchical cluster analysis.
Water 14 00458 g006aWater 14 00458 g006b
Figure 7. Biplot of RDA. The blue arrows represent the explanatory variables, and the red arrows represent the response variables. Explanatory variables: pH; SOM, organic matter. Response variables: Cd, Pb, Cr, Cu, Zn, Hg, and As.
Water 14 00458 g007
Figure 8. Risk factors of different heavy metals in Hengshui Lake.
Water 14 00458 g008
Figure 9. Distribution of potential ecological risk index in Hengshui Lake.
Water 14 00458 g009
Table 1. Location of additional sampling sites in Hengshui Lake.
20052020
Sampling pointsLocationSampling pointsLocation
B1Dazhao sluice-1A1Meihua island
B2Dazhao sluice-2A2New island
B3Dazhao sluice-3A3Eastern Big Lake
B4Meihua island-1A4Open area of Big Lake-1
B5Meihua island-2A5Open area of Big Lake-2
B6Eastern Big Lake-1A6Open area of Big Lake-3
B7Eastern Big Lake-2A7Open area of Big Lake-4
B8New islandA8Weitun sluice
B9Bird watching islandA9Open area of Jizhou Small Lake-1
B10Open area of Big Lake-1A10Open area of Jizhou Small Lake-2
B11Open area of Big Lake-2A11Open area of Jizhou Small Lake-3
B12Open area of Big Lake-3A12Eastern Jizhou Small Lake
B13Open area of Big Lake-4A13Jizhou Small Lake causeway-1
B14Wangkou sluice-1A14Jizhou Small Lake causeway-2
B15Wangkou sluice-2A15Western Big Lake-1
B16Weitun sluice-1A16Western Big Lake-2
B17Weitun sluice-2A17Western Big Lake-3
B18Weitun sluice-3A18Northern Big Lake
B19Nanguan sluice-1
B20Nanguan sluice-2
Table 2. Descriptive statistics of heavy metals concentrations in Hengshui Lake.
TimeItemCd mg kg−1Hg mg kg−1As mg kg−1Pb mg kg−1Cr mg kg−1Cu mg kg−1Zn mg kg−1
2005Maximum0.060.2082.0344.9593.1374.03401.20
Minimum0.010.037.147.8027.0210.1225.01
Average0.020.0818.5820.4354.8726.1462.37
Standard deviation0.010.0619.0710.9720.6014.2680.86
Variation coefficient0.610.661.030.540.380.551.30
2020Maximum0.280.1712.1033.0076.0033.00101.00
Minimum0.070.014.7313.0032.007.0030.00
Average0.180.058.4919.9449.1718.8363.22
Standard deviation0.070.042.265.4311.515.7017.50
Variation coefficient0.390.740.270.270.230.300.28
Background Value of Hebei *0.090.0413.6021.5068.3021.8078.40
2005~2020Change %860.0−41.5−54.3−2.4−10.4−27.91.4
* Data from CNEMC [22].
Table 3. Correlation matrix of different heavy metals in Hengshui Lake.
CdHgAsPbCrCuZn
Cd1.0000.603 **0.711 **0.596 **0.609 **0.753 **0.748 **
Hg0.0261.0000.697 **0.3270.2600.3430.427
As−0.0310.2511.0000.4230.565 **0.669 **0.610 **
Pb0.0020.846 **0.467 *1.0000.690 **0.695 **0.849 **
Cr−0.0370.861 **0.2690.822 **1.0000.899 **0.697 **
Cu−0.0970.3690.0580.4280.3251.0000.728 **
Zn0.0670.3030.764 **0.629 **0.3040.1631.000
* Mean significance at the level of 0.05; ** mean significance at the level of 0.01. The value in the lower-left triangle (black) represents the correlation coefficient of different heavy metals in 2005; the value in the upper-right triangle (red) represents the correlation coefficient of different heavy metals in 2020.
Publisher’s Note: MDPI stays neutral with regard to jurisdictional claims in published maps and institutional affiliations.

