Article

Poor Air Quality in Urban Settings: A Comparison of Perceptual Indicators, Causes and Management in Two Cities

Centre for Environment and Sustainability, Faculty of Physical Sciences and Engineering, University of Surrey, Guildford GU2 7XH, UK
*
Author to whom correspondence should be addressed.
Sustainability 2022, 14(3), 1438; https://doi.org/10.3390/su14031438
Submission received: 15 December 2021 / Revised: 18 January 2022 / Accepted: 19 January 2022 / Published: 27 January 2022
(This article belongs to the Special Issue Social Sustainability)

Abstract

:
Poor air quality (PAQ) is a global concern, especially in urban areas, and is often seen as an important element of social sustainability given its negative impact on health and quality of life. However, little research has been undertaken in cities of the developing world to explore how residents perceive poor air quality, its main causes, what control measures should be used to address PAQ and where the main responsibility rests for implementing control measures. The research described in this paper sought to address these points, using a questionnaire-based survey (n = 262) in Nigeria’s federal capital city of Abuja (n = 137) and the state-capital city of Enugu (n = 125). The survey took place during the COVID-19 pandemic (October 2020 to March 2021), and was stratified to ensure representation across a number of demographic groups such as gender, age, education and income. The results were analysed using the Kruskal–Wallis non-parametric test and Hochberg’s post hoc test available in SPSS version 28. The study found that the ranking of perceptual indicators and the main causes of PAQ had much agreement between respondents from both cities and between demographic groups. Smoke, odour and dust particles were perceived to be the most important indicators of PAQ, while the main sources of PAQ were waste and bush burning, vehicle use and power generators. The two most preferred control measures were proper waste management and the avoidance of bush burning. However, there was a significant difference between the two cities in terms of the main organisations responsible for addressing PAQ, with respondents from Abuja citing the federal government, while those from Enugu cited the state government. Interestingly, younger people in Enugu noted that the government should take more responsibility in controlling PAQ than did the older demographic in that city, but this difference was not seen in Abuja. Overall, this study reveals that residents in these two Nigerian cities clearly recognise their exposure to PAQ and it suggests that these perceptual indicators, and views on sources and interventions should be central to designing policies to control this important issue.

1. Introduction

The steady upsurge in urban populations, particularly in developing nations, has led to increases in poor air quality (PAQ) [1,2,3,4,5]. Air pollutants such as oxides of nitrogen (NOx), sulphur dioxide (SO2), carbon monoxide (CO), ozone (O3), ammonia (NH3), volatile organic compounds (VOCs), particulate matter (PM), lead (Pb) and so on contribute to adverse effects on human and ecosystem health, and this can in turn impact negatively on social sustainability [5]. The World Health Organization (WHO) reported that approximately 7 million premature deaths recorded globally each year can be attributed to PAQ [6], and the majority of the deaths occur in areas that have worse air quality than the WHO’s guideline limits on pollutants such as SO2, O3, CO, NO2, PM [7]. In addition to the impacts of PAQ on human health, it can reduce visibility [8], lead to climate change [9,10], and damage buildings [11,12].
According to [13], air quality is better in rural areas compared with urban areas, and they attributed this to the likelihood of fewer emission sources such as traffic and industry in rural settlements. In the same vein, the morphology (buildings and developments) of urban areas, urban constituents, differences in vegetation and anthropogenic activities modify the tropospheric part of the atmosphere over cities and can exacerbate PAQ [14]. However, it should be noted that PAQ may not always be attributed to the emission of pollutants into the atmosphere through human activities. According to [15] noted that contributors to PAQ can be grouped into four main categories: natural, area, mobile and major sources. ‘Natural’ sources include physical disasters such as forest fires, volcanic erosion, dust storms and agricultural burning. ‘Area’ sources include domestic and commercial cleaning activities, printing shops, and petrol stations. ‘Mobile’ sources comprise automobiles, cars, railways, airways, and other types of vehicles. ‘Major’ sources contain the emission of pollutants from power stations and refineries as well as petrochemical, chemical, fertilizer, metallurgical and other industrial plants, and incineration.
Due to the significant health and environmental problems created by PAQ, the need for its mitigation has become clear [16,17]. The Sustainable Development Goals (SDGs) include goals, targets and indicators (goals 3, 7 and 11, especially) to address air pollution and improve air quality. Indeed, the United Nations has asserted that clean air is one of the necessities for human health and wellbeing [18,19]. There have been several studies on the assessment of air quality in urban environments in the developing world [20,21,22,23,24,25,26,27,28,29,30] and approaches include the use of automated monitoring stations, computer models and, more recently, earth observation (EO) via satellites [31,32,33]. However, these are often expensive and require technical skills to operate, maintain and interpret [34,35] and the cost and need for expertise and equipment can restrict their use in an urban environment in the developing world [34,36,37,38]. Therefore, for many people living in urban areas in developing countries, there may not be adequate measuring instruments available to use on a routine basis [39] and obtaining and sustaining the supply of high-grade air quality data to help identify places at risk and inform interventions to reduce the risk of PAQ remains a major challenge [40,41].
There have been calls to embrace the perceptions of local people regarding PAQ, its causes and mitigation as an additional approach to help in assessing the problem and in decision-making [42,43]. The assumption here is that people who live and work in urban environments may have a ‘sense’ about the quality of the air they breathe, how it changes over space and time, the main causes and impacts of PAQ and what can be done both by themselves and others to help address the issue [3,43,44]. This includes the kind of ‘perceived’ (i.e., perceptual) indicators (or ‘signals’) that people may use or find meaningful and based on these, how they feel that PAQ varies over space and time [43,45]. People’s attitudes towards PAQ, including the factors that influence their awareness of it and the kind of ‘signals’ that they use to know whether air is of poor quality, have been explored in the literature [46,47,48] along with people’s views on the impacts of PAQ [49,50,51] but there has been little work undertaken in cities of the developing world [52]. In particular, little is known about:
i.
What are the main perceptual indicators of PAQ employed by city residents?
ii.
What people think are the main causes of PAQ?
iii.
What people think can be done to address PAQ?
iv.
Who should be primarily responsible for addressing PAQ, including changes in behaviour?
In addition to these questions, little is known from the developing world about how the answers to these questions may differ between social groups (i.e., groups based on gender, age, income, education) [53,54]. For example, regarding point i, the work of [53] found that younger people have more awareness of PAQ than older people, while men have lower awareness than women. In addition, Ref. [55] noted that women were more aware of PAQ before and during the COVID-19 pandemic than were men. In terms of what people think are the main causes of PAQ (point ii), what can be done about PAQ (point iii) and who should be the primary agents for implementing the changes (point iv) it is not inconceivable that these may vary between cities depending on a number of factors. For example, in terms of point iv, some countries have strong centralised models of governance while others have a federal system, where power, at least in theory, is devolved to smaller administrative units such as states. In Nigeria, for example, there is a federal capital city (Abuja) and 36 state capital cities. Individual states do have some degree of power to monitor air quality and implement change, but legislations for monitoring and controlling air quality are set at the federal level and the key agencies that are tasked to deal with the issue are those funded and mandated by the federal government. However, states can also play a role, and Table 1 sets out some of the interventions to reduce short-lived climate pollutants in Nigeria [56].
However, in such a multi-tiered governance structure, are people’s views about suitable interventions and primary responsibilities framed by their location within the structure? It is known, for example, that people can often have more trust in local governance structures and agencies compared to national ones [57,58], although there are notable exceptions to this, for example in China [59]. Over-laying this sense of distance to decision-making, Nigeria also has hundreds of ethnic groups each with their own language, history and culture. Hence, it seems reasonable to ask whether people living in Abuja have a different view as to the assessment and control of PAQ compared to those living in a state capital? Do residents in Abuja have more trust in the federal government and its agencies than do those living in a state capital city?
The research reported here was designed to investigate residents’ perceptions of PAQ in Nigeria’s capital city Abuja (one of the world’s fastest-growing cities [60]) and Enugu the state capital of Enugu State, Nigeria. The latter was chosen as being one of the oldest state capitals in the country, and indeed was originally the capital of the Eastern Region when Nigeria gained its independence from Britain in 1960 and was also the de facto capital city of Biafra; the name adopted by the Eastern Region (now South East and South-South) when the nation tried to secede from Nigeria in the late 1960s and which spurred the Civil War in the country. Abuja is a city inhabited by peoples from all over the country and thus is multi-ethnic, while Enugu is less ethnically diverse with the population largely comprising the Igbo ethnic group.
The research employed a questionnaire-based survey which aimed to explore the perceptual indicators of PAQ used by residents in the two cities, their perceptions of the sources of PAQ, views on what should be the control measures for PAQ and who should take foremost responsibility for implementing such control measures. In addition, the research sought to explore whether these views were also influenced by demographic factors such as gender, age, income, education, primary occupation and main mode of transport of respondents.

2. Materials and Methods

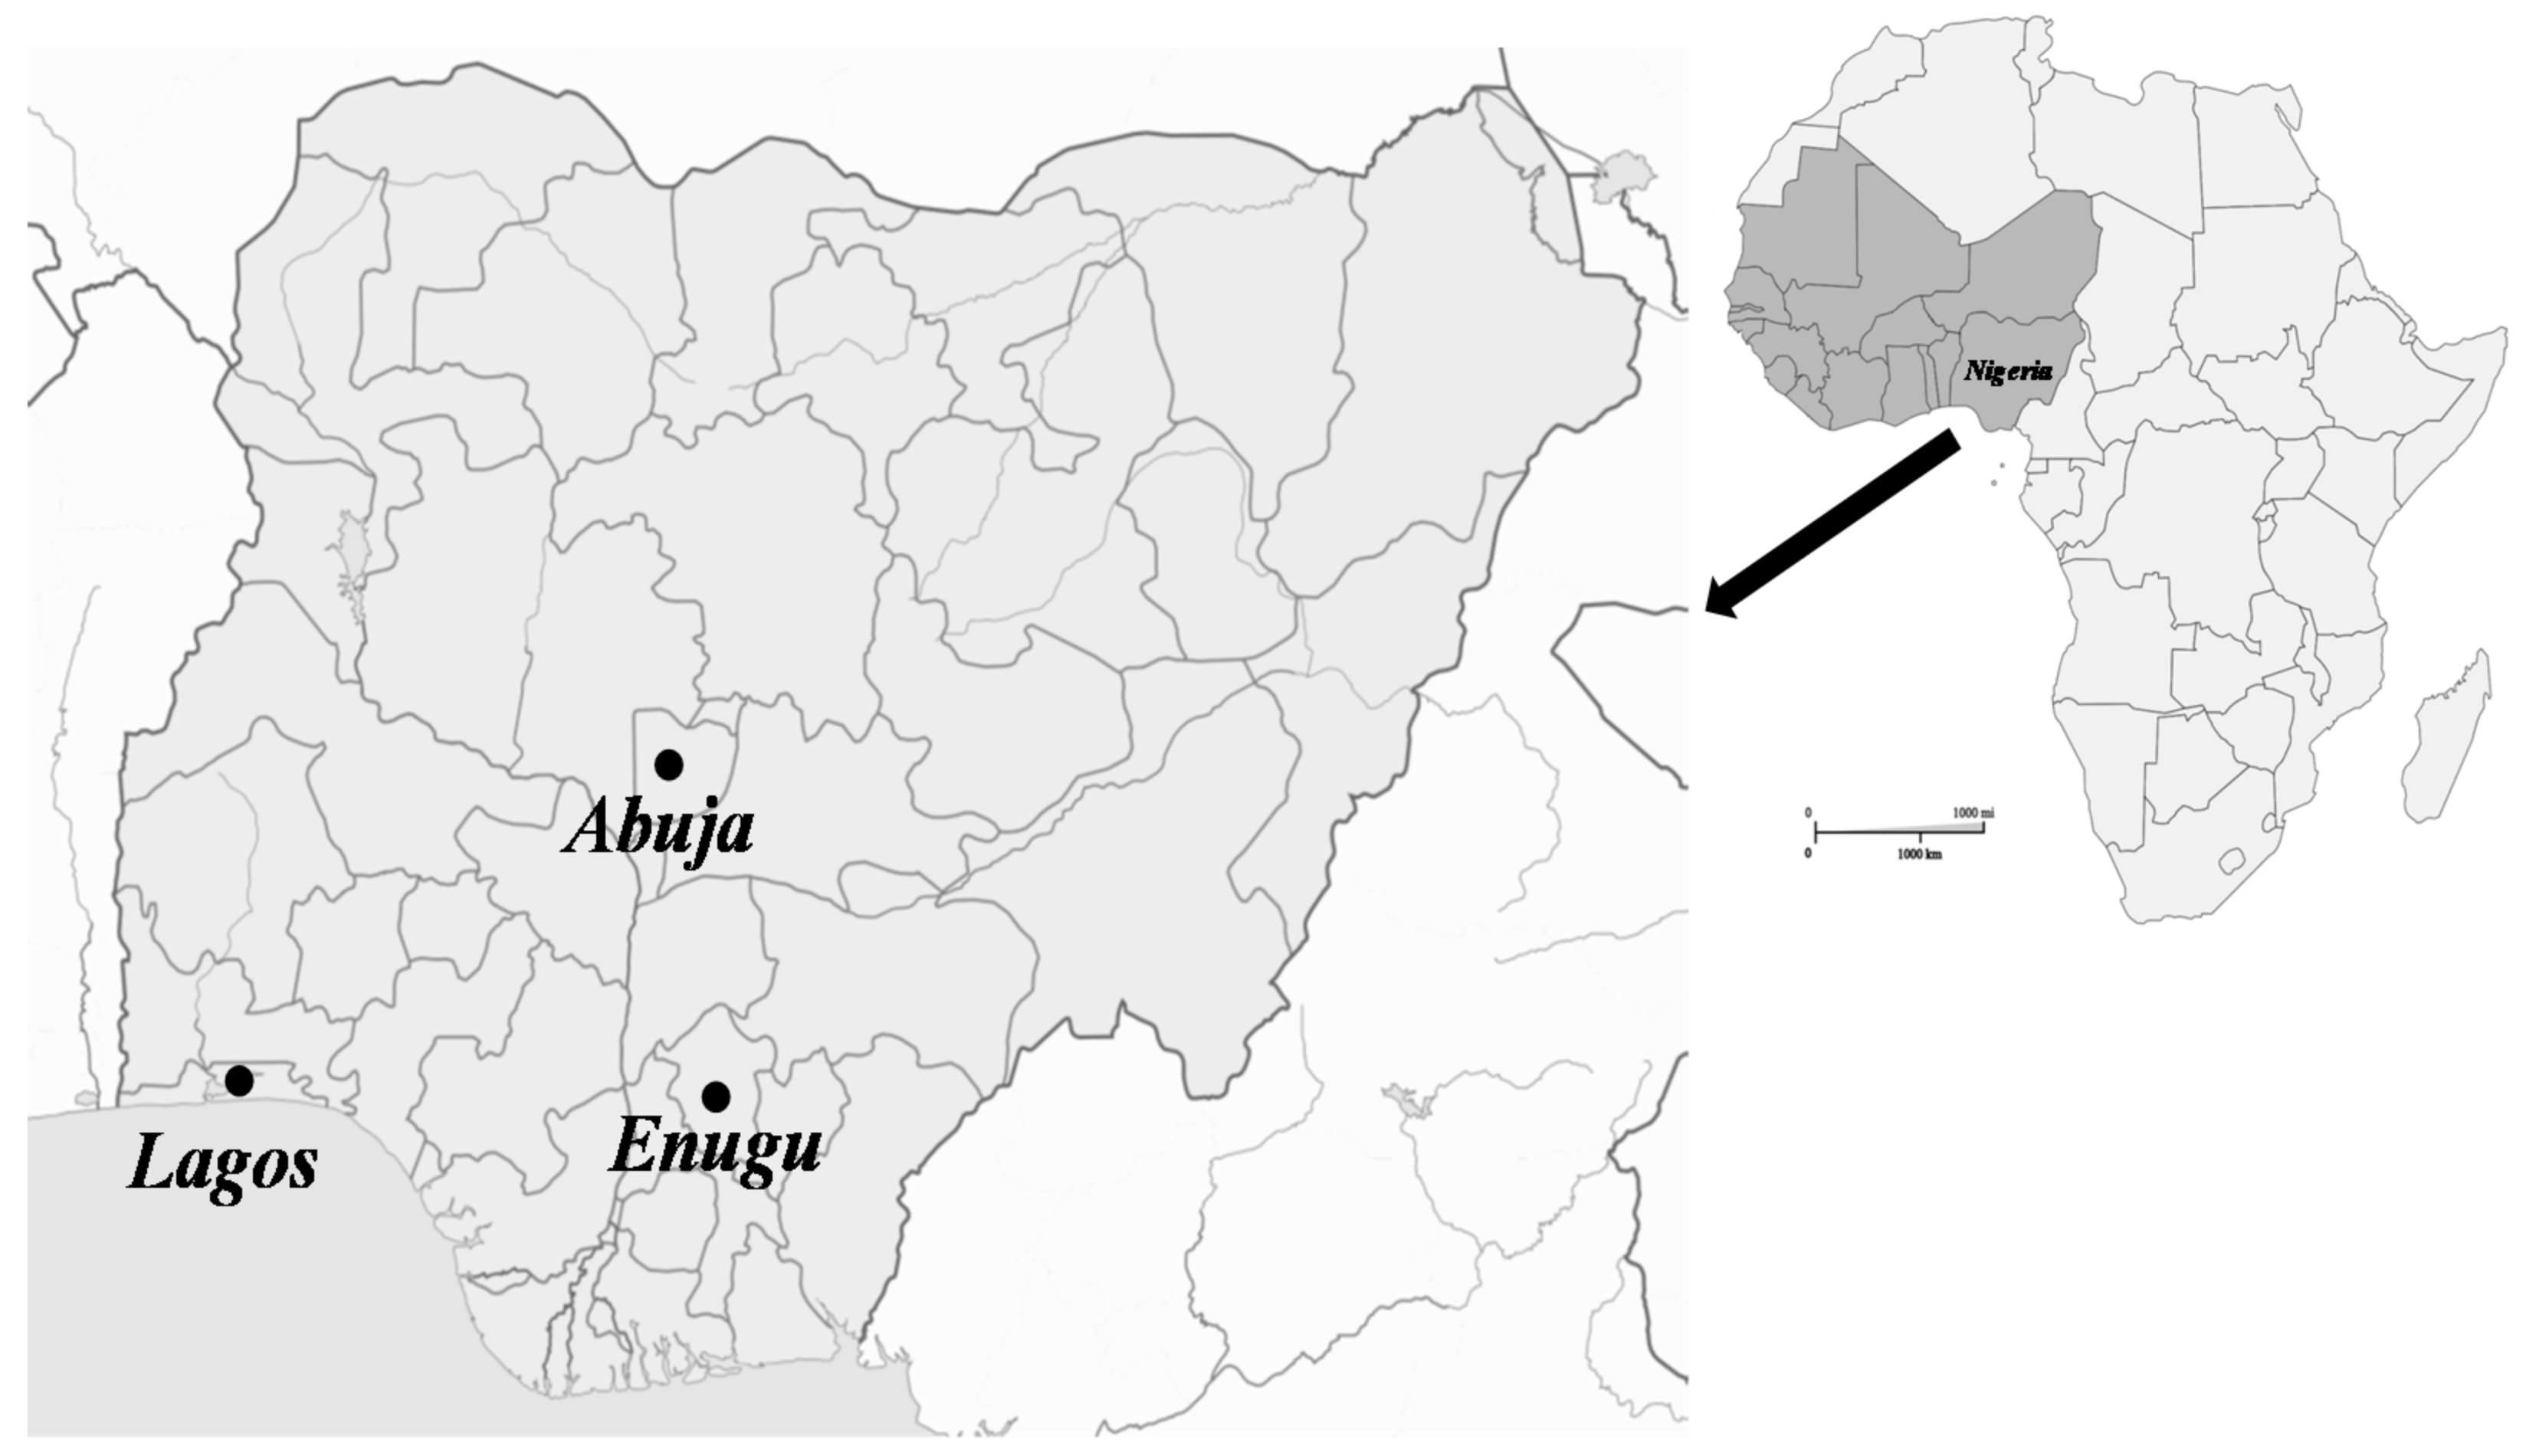
2.1. Research Locations

2.1.1. Nigeria

Nigeria is located on the West African coast bordered by Benin, Niger, Chad and Cameroon (Figure 1). The country is a federation comprising 36 autonomous states, with the capital city, Abuja, located in the Federal Capital Territory (FCT) at the geographical center of the country. Each of the 36 states has its own capital city, elected governor, and assembly while the FCT is governed by a minister appointed by the President. The population of Nigeria is estimated to be 211.4 million people [61] and Nigeria has the third-largest youth population in the world [62]. The average age of Nigerian citizens is low for both males and females; the median age is 18.4 years, with just over half of the population being under 35. The country is culturally and ethnically diverse, comprising some 250 different ethnic groups and 500 different languages. The most populous groups include the Hausa in the north (23%), Yoruba in the south west (21%) and Igbo (Ibo) in the south-east (18%). The remainder is largely made up of the Ijaw (10%), Fulani (6%), Kanuri (4%), Ibibio (3.5%), Tiv (2.5%), and others (12%). In general, urban dwellers have higher levels of education than those who live in rural areas; 69% of urban dwellers have secondary or higher levels of education while only 37% of rural dwellers do [63]. In Nigeria, 63% of people living in the rural areas are poor compared with 42% for urban areas, and because of this disparity, there has been significant and sustained migration from rural areas to the cities [64].

2.1.2. Abuja and Enugu

Abuja is in the Federal Capital Territory (FCT) which is geographically located in the middle of Nigeria (Figure 1). Abuja was regarded by the United Nations in 2010 as the fastest growing city in the world, with an increase in the 10 years between 2000 and 2010 of 140% [65]. More recently, the country’s National Bureau for Statistics in 2016 estimated the population of FCT to be 3,564,126 using the annual growth rate of 9.3% from the 2006 population census with Abuja city having a projected population of approximately 1,967,500 [66]. Abuja officially became Nigeria’s capital in December 1991 and was designed to replace the densely populated city of Lagos in the southwest as the administrative and political hub of the country. The development of Abuja began in the 1970s and it is a planned city with wide, parallel roads and districts specifically set aside for housing, government, commercial activities, etc. The economy of Abuja is dominated by financial services, retail and real estate, and the city has little in the way of manufacturing although, the Seven-Up Bottling Company and the Nigerian Bottling Company makers of Coca Cola are situated in Idu industrial area. As Abuja is the federal capital, the population tends to be ethnically diverse; indeed, the central location of the city in Nigeria was meant to help promote such diversity [67].
Enugu is the capital of Enugu State, located in the south-eastern part of Nigeria (Figure 1). Enugu sits at an altitude of approximately 223 m on the Udi escarpment, and is situated in the tropical rain forest zone with a derived savannah [68,69]. The population of Enugu was estimated to be 773,000 in 2019 [70], and it is an ancient city, existing long before Nigeria became independent in 1960, and is not a ‘planned’ city in the same way as Abuja. There is no formal zoning, and the road system has evolved as the city has grown and industrial and commercial activities are typically mixed within residential areas. The result is that many roads are narrow, some are unpaved and lack adequate drainage, and they wind their way through the city. This has resulted in traffic jams that commonly occur in some areas of the city mostly during peak periods between Monday and Saturday. Furthermore, Enugu has many markets and manufacturing plants, including Ogbete Main market, New Market, many retail shops, ANAMMCO (Anambra Motor Manufacturing Company), Innoson Group, Juhel Pharmaceutical, Nigeria Breweries, Dalex Paints. Emene industrial layout houses many manufacturing industries in Enugu. In contrast to Abuja, the population of Enugu is less ethnically diverse and dominated by the Igbo ethnic group [71].
As with most Nigerian cities, both Abuja and Enugu have high levels of traffic (cars, buses, trucks) and neither have public transport systems in the form of a train or metro [72,73]. There are no official statistics about traffic density in the two cities, but according to a [74] report, 25,415 driving licenses were produced in Abuja and only 9073 in Enugu in the first quarter of 2018. Both cities have the same issues of intermittent power supply seen throughout the country, and many private dwellings and companies own generators (typically diesel-powered) which are used to support lighting and air conditioning as well as manufacturing. The consumptions of energy in Abuja and Enugu are 955,224,978.33 kWh and 594,915,911.00 kWh, respectively, in July 2018 [75]. In Abuja, 26% and 66% of residents manage their waste by burning and dumping in their vicinity, respectively [76] while in Enugu it is 28% and 67% [77]. As with all urban areas in Nigeria, both cities can be subjected to smoke from bush-burning especially at the start of the dry season as farmers clear their land for planting [78,79]. In addition to the human-made sources of PAQ, there is a natural contributor that arises because of the Harmattan or dry season dust which normally lasts between November and January as the prevailing winds change and bring dust from the Sahel and Sahara further south [5]. As Abuja is further north than Enugu the Harmattan is often claimed to be heavier in Abuja due to its more northerly location than Enugu.
The federal nature of government in Nigeria means that Enugu will have some level of control over assessing and monitoring air quality, but federal agencies are also involved, and while these are headquartered in Abuja, they will have offices in all state capitals. According to [80], the government has mandated the organizations in Table 2 for monitoring and regulating air quality in the country.

2.2. Sample Participants and Demographics

The research involved a questionnaire-based study of participants in Abuja (137 respondents) and Enugu (125 respondents). Respondents had to be a resident of the city as well as work there, and the sample was stratified to ensure that it had adequate representation in terms of gender, age and education that reflected the wider population profile in the two cities. All respondents were at least 18 years old to comply with the ethical requirement of the University of Surrey. The demographic profiles of respondents in the two cities are shown in Table 3. The result of the stratification was an approximately 50:50 gender balance in Enugu and 55.5% and 44.5% in Abuja. Young adults (youth) from 25–34 years old (note: at the time of the research the term ‘youth’ was used by the Nigerian government for the 25–34 years old demographic [81] were the most represented age group in the study. The largest single groups of income earners were those earning more than $245 (N100,000) per month in Abuja (41% of respondents) whereas it was more than $125 (N51,000) per month income earners in Enugu (31% of respondents). Respondents with bachelor’s degrees or equivalent were the largest groups in terms of highest education qualification, 43% and 62% in Abuja and Enugu, respectively, although a further 35% of Abuja respondents have a master’s degree or its equivalent compared to 14% in Enugu. Most of the participants’ employment was based on a monthly salary (84% and 76%, respectively). The main mode of transport for the participants in Abuja is by personal car (41%) and car taxi (23%), while in Enugu it was by public bus (42%) and bike (tricycle) taxi (26%).

2.3. Data Collection

Data collection took place between 28 October 2020 and 31 March 2021, covering a period that spans the end of the rainy season (October), the dry season, and the beginning of the rainy season (March) in the study areas. Due to the pandemic, which was at its peak during the early period of data collection, the survey was conducted online using the Qualtrics-XM Platform. In the later stages of the timeframe (when social distancing was reduced) hard copies of the questionnaire were also distributed to help those who did not have access to an electronic device. The study involved the recruitment and briefing of eight field assistants (four per city) to serve as helpers in carrying out the study. Monetary incentives were provided to the assistants (approx. ₦5600 (US$14) per assistant over the data gathering time) and respondents (₦1400 (US$3) per correctly completed survey form) to secure and reflect thanks for their participation.
Respondents were selected by the field assistants under the guidance of the research team, and careful monitoring ensured that the respondents matched the stratification noted above. The pandemic created some limitations on the choice of respondents within the various demographic categories set out in Table 3. The respondents who responded online were called regularly or visited to ensure that they completed the questionnaires. Those who are not familiar with the internet were helped to get internet access. Those respondents using hard copies of the questionnaire were allowed to complete them at a convenient time and an agreed collection time was scheduled. All the respondents in Enugu (100%) are of the Igbo ethnic group while the respondents in Abuja are more ethnically diverse (Tiv 16%, Yoruba 17%, Igbo 20%, Hausa 13%, Fulani 7%, Edo 7%, Idoma 6%, Igala 5%, Efik 4%, Ibibio 2%, Gbagyi 1%, Ijaw 1%, Eggon 1%, Berom 1%) which is not surprising given the status of Abuja as the country’s capital city and the location at the centre of Nigeria was chosen to encourage the development of a more diverse population.

2.4. Questionnaire Design and Statistical Analysis

The questionnaire (Appendix A) was structured to assess the responses of six demographics (gender, age, income, education, occupation, and transportation) to the perceived indicators of PAQ, sources of PAQ, interventions to control PAQ, and who should take primary responsibility for interventions. Responses to the questions were based on the use of the Likert scales (scores from 1 to 5) shown in Table 4. Statistical analysis was carried out using the software SPSS® version 28.0. Descriptive statistics (counts) were used to present the characteristics of the participants, and the Kruskal–Wallis and Hochberg post hoc tests (all non-parametric) were used to assess differences between groups [82,83]. To compare responses from Abuja with those from Enugu, the mean scores for indicators, sources, control measures and primary responsibility for the two cities were tested for association using the Spearman Rank Correlation Coefficient.

3. Results

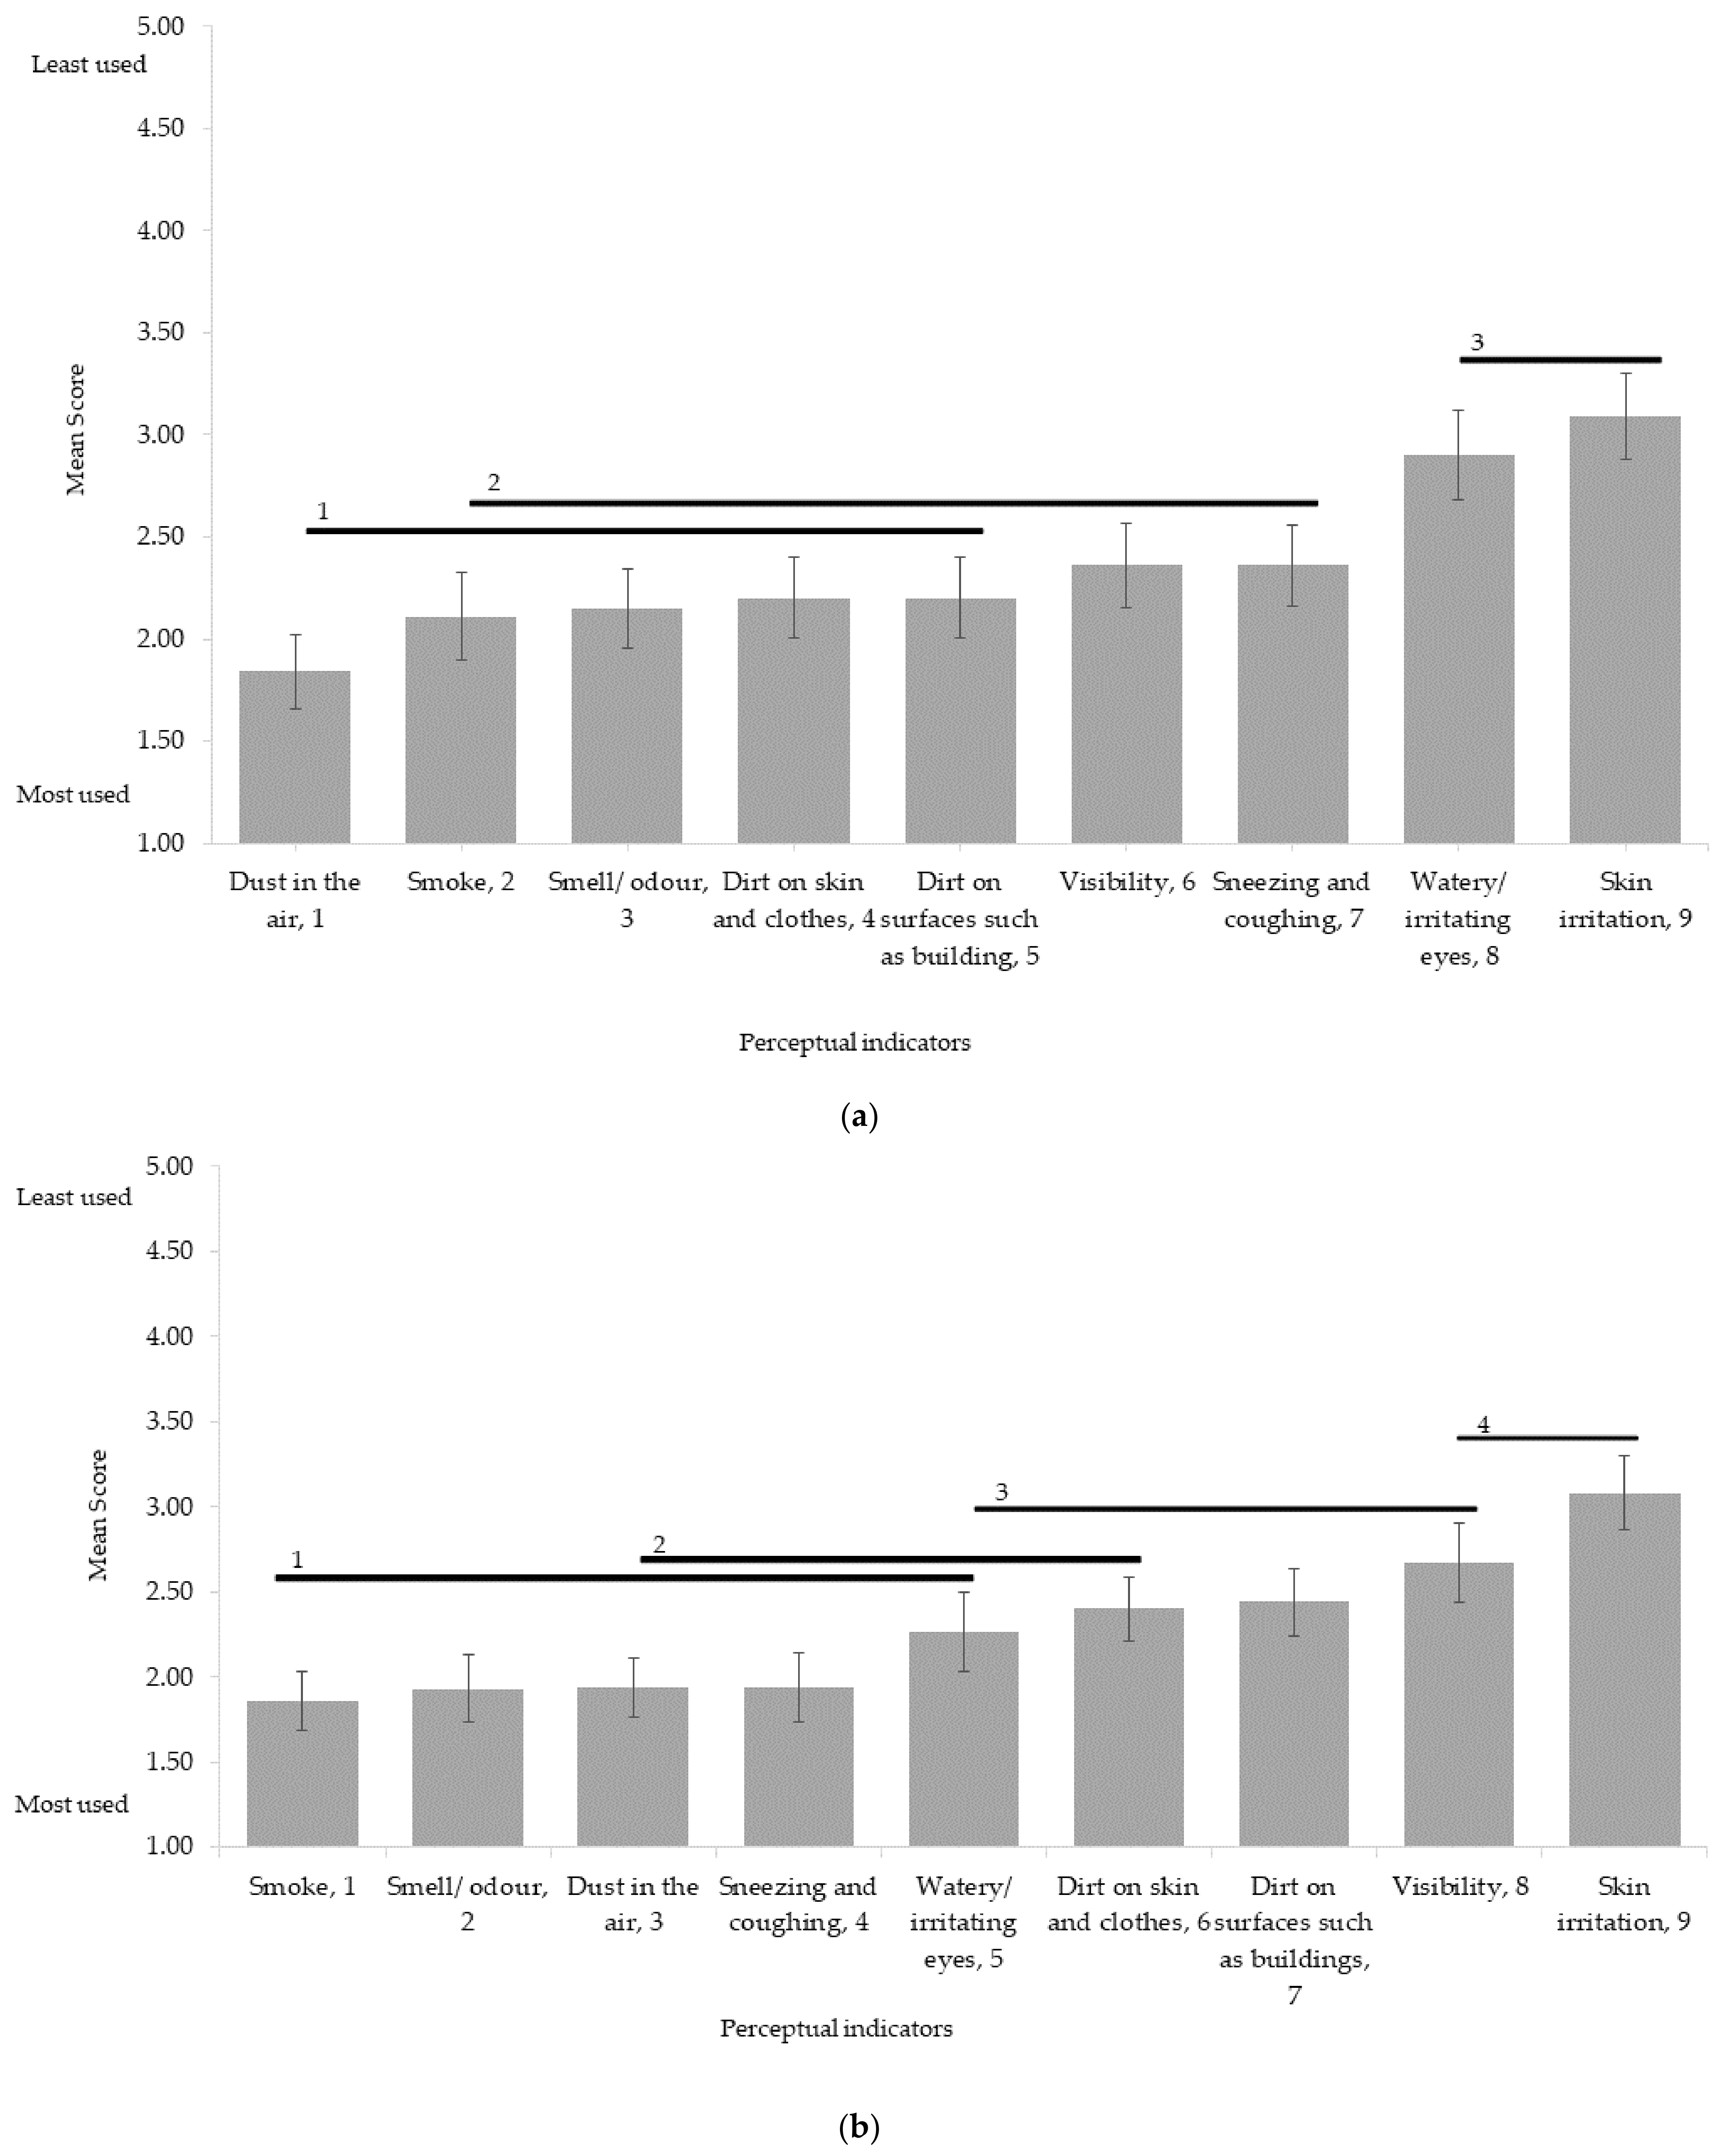
3.1. Perceptual Indicators of PAQ
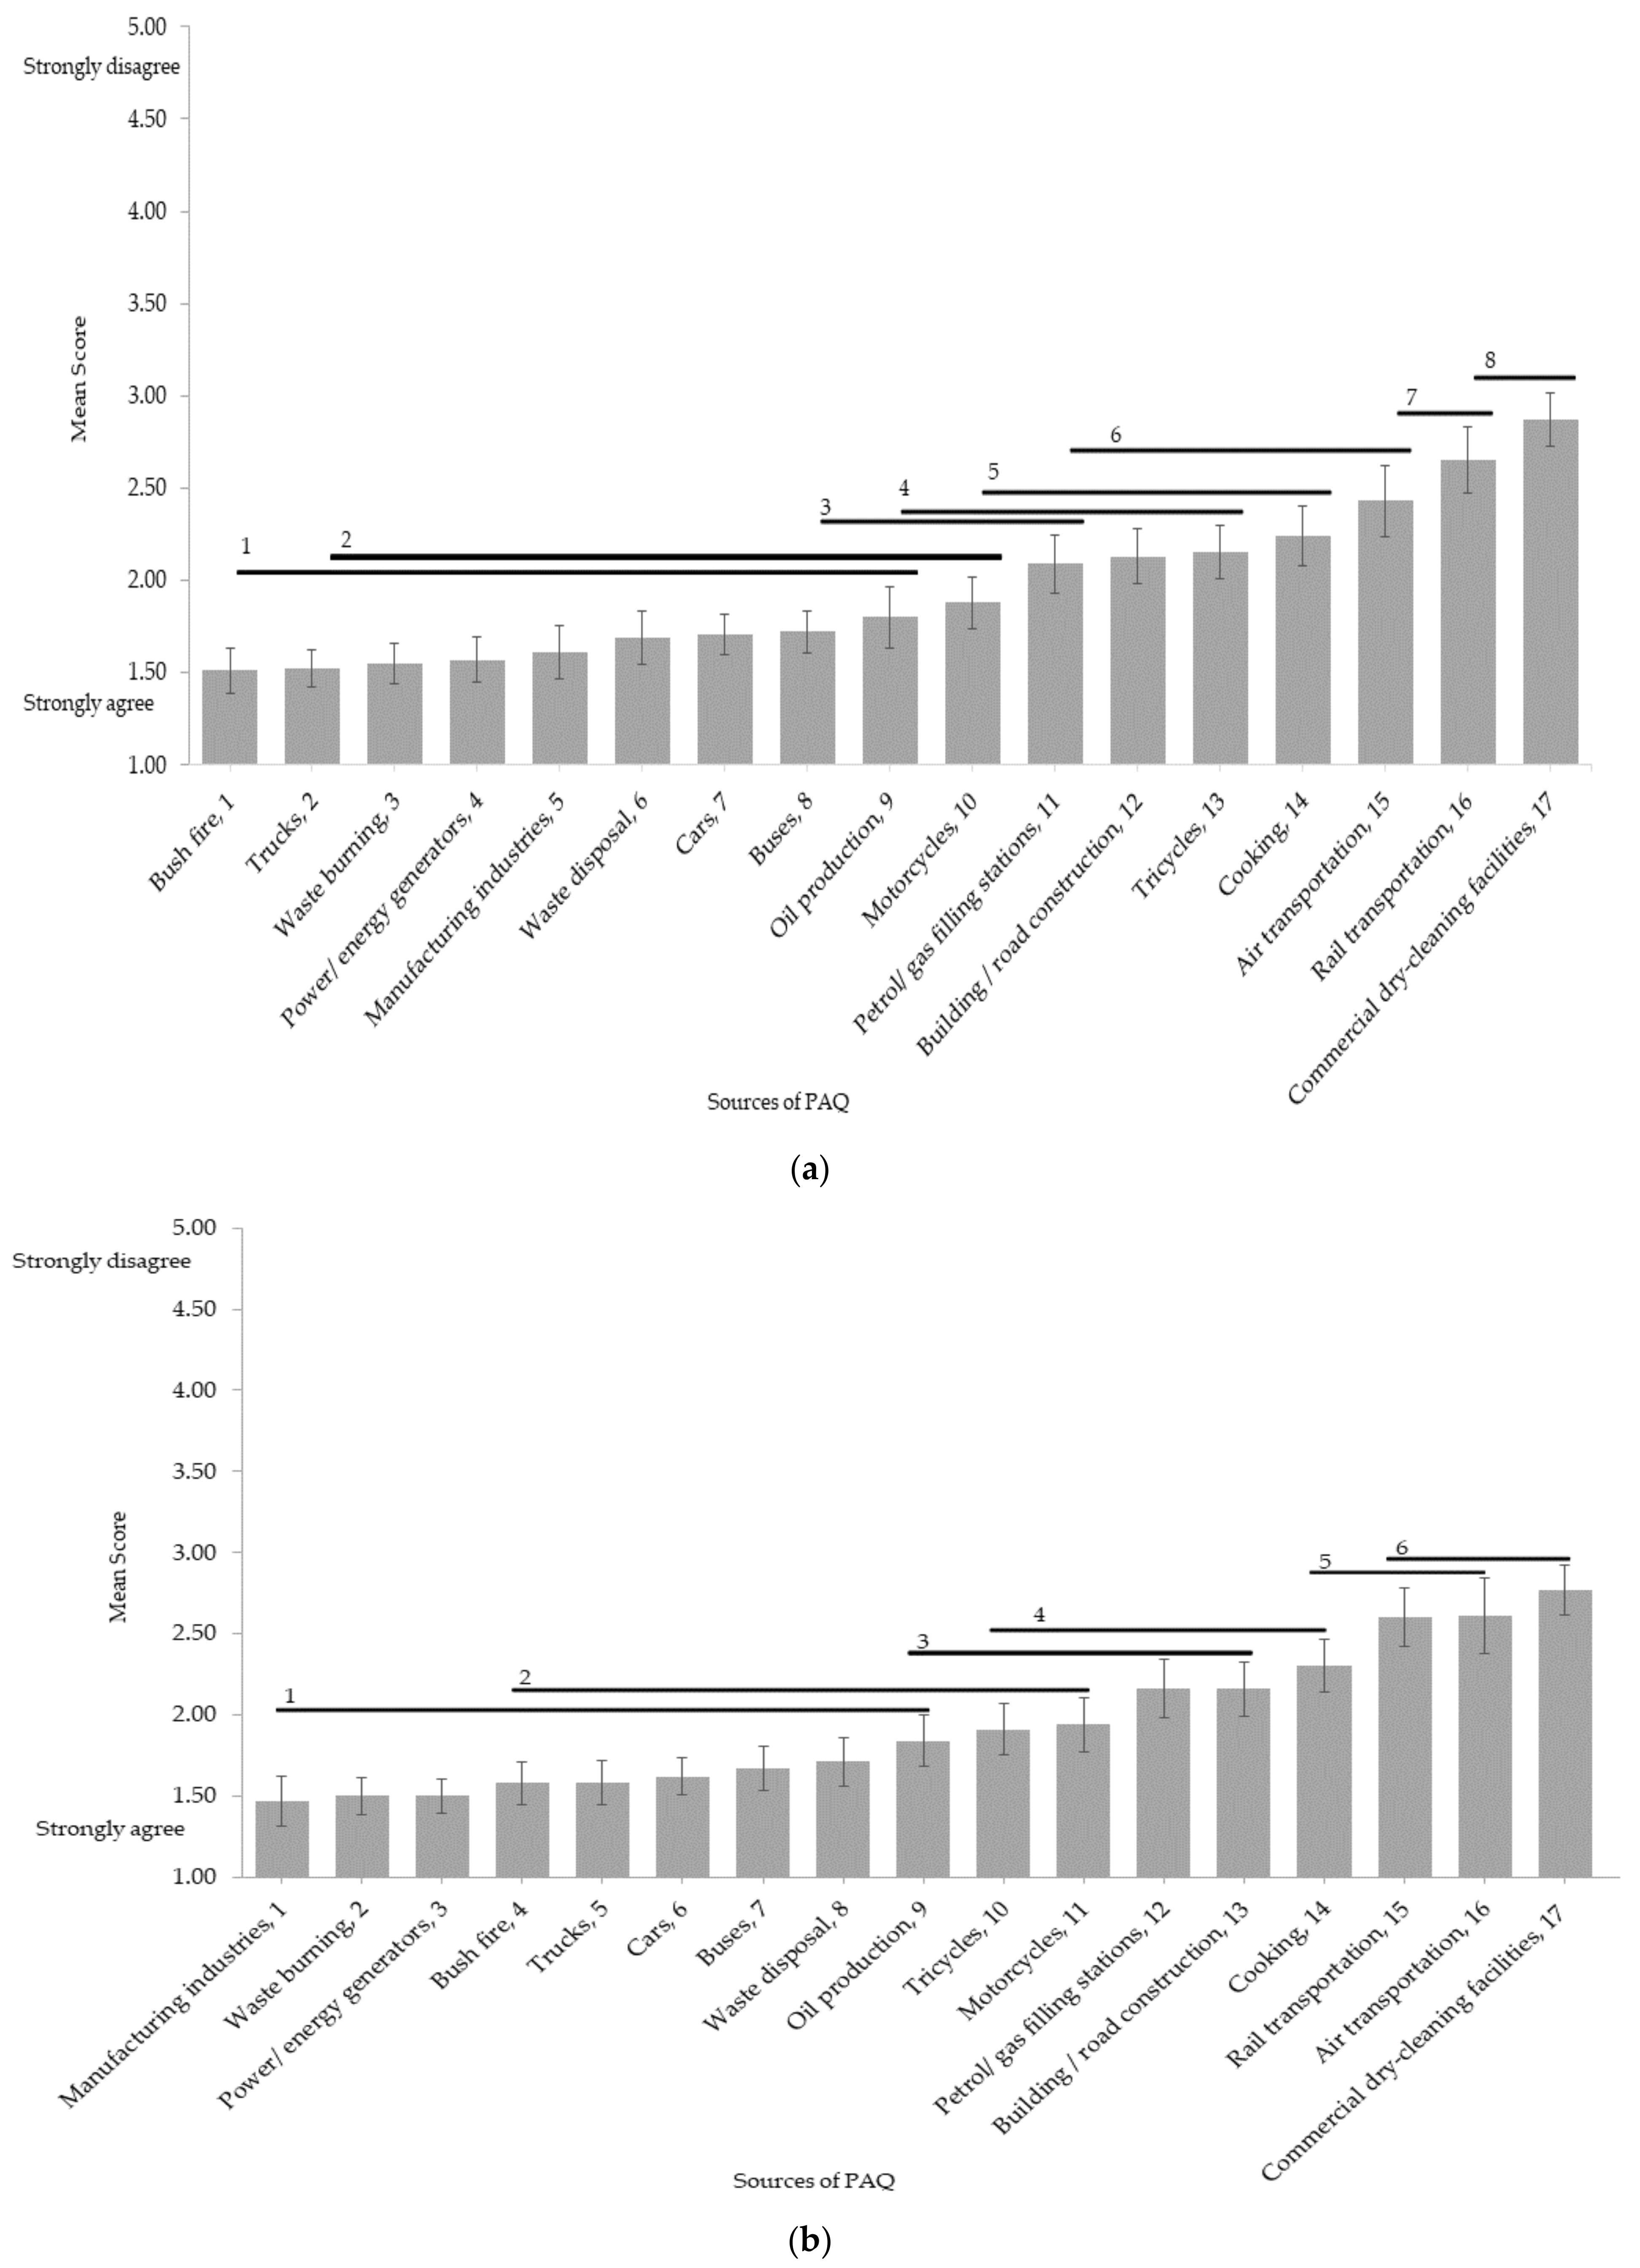
The results for the use of perceptual indicators of PAQ in Abuja and Enugu are shown in Figure 2a,b. The Spearman rank correlation for the mean indicator scores from Abuja and Enugu is 0.7 (p < 0.05). This similarity in the respondents’ overall mean scores (both ranging between approx. 1.8 and 3) suggest that there is little difference between respondents from the two cities in the overall strength of views regarding the importance given to the range of indicators. The mean ratings indicate that most of the indicators were of some use in the perception of PAQ in both Abuja and Enugu, with only a couple of indicators in both cities rated as ‘neutral’ and no indicators rated as rarely used or not used at all. In Abuja, the post hoc test identified three groups (horizontal lines in Figure 2a) of indicators without a significant difference between them. Group 1 comprises the most frequently used indicators namely dust in the air, smoke, odour, dirt on skin and clothes and dirt on surfaces such as buildings. Group 2 comprised the indicators of smoke, odour and dirt on skin and clothes, dirt on surfaces such as buildings, visibility, and sneezing/coughing; and Group 3 comprised of watery/irritated eyes and skin irritation. Dust in the air is the most commonly employed means by which people perceive the quality of air in Abuja, but Group 1 in Figure 2a comprises some indicators closely related to dust in the air (i.e., smoke, dust on skin/clothes, dust on surfaces). Skin irritation is ranked as the least used indicator of PAQ in Abuja. In Figure 2b, the indicators for Enugu fell into four groups but, interestingly, the three most commonly used indicators (dust in the air, smell/odour and smoke) are the same in both cities, albeit in a slightly different order between the cities. As in Abuja, the least used indicator in Enugu was skin irritation. Therefore, the results show that respondents from the two cities most frequently employed dust particles in the air, smoke and odour as their main means of perceiving PAQ. In the ‘middle ground’ indicators, there are differences between the two cities in their specific ranking order, although these are usually only of two places in the order suggesting relatively minor local nuances.
Table 5 presents the results of Kruskal–Wallis tests for differences in scoring the indicators across the various demographic characteristics. Only 4 out of 108 tests in the table yielded significant differences between the scoring of the indicators within the demographic groups. A few significant differences were found with the ‘Smell/odour’ and the ‘Dust particles in the air’ indicators within the income demographic in Abuja and ‘Dirt on skin and clothes’ for gender in Enugu. However, this small and dispersed number of significant associations between the scoring of indicators within the demographic groupings for any of the PAQ indicators in both cities suggests that demographic factors do not have any appreciable influence on the relative scoring of the indicators, i.e., the indicators are perceived to have much the same usage across all the demographics in both cities.

3.2. Sources of PAQ

The results for the perceived sources of PAQ in Abuja and Enugu are shown in Figure 3a,b. The Spearman rank correlation for the mean scores of PAQ sources from Abuja and Enugu is 0.931 (p < 0.001), which suggests that the broad pattern in the ranking of PAQ sources is the same for the two cities. In both cities, the biggest contributors (Group 1) to PAQ are broadly the same and comprise bush fires, manufacturing, waste burning, generators and manufacturing, although the order is slightly different. Similarly, the least important sources are also alike and comprise cooking, rail and air transport and dry cleaning.
The results of the Kruskal–Wallis tests designed to explore differences between demographic groups in their tanking of the sources of PAQ are shown in Table 6. As with the indicators in Table 5, the results in Table 6 show the majority of tests for differences in perceived PAQ sources between demographics to be non-significant. This suggests that most of the demographic groups have a similar scoring for the various sources of PAQ. However, there were some 20 significant differences in Table 6 and the largest number of these were found in Enugu (16 out of the 20 significant associations), especially with gender, age and income. In both cities, differences in education, occupation and main transportation used by respondents had little effect on their scoring of sources. Of the 20 results in Table 6 that were significant, the pattern is a complex one with no clear match between respondents from the two cities. For example, 7 of the 20 statistically significant results were associated with gender differences but the pattern was not the same for the two cities. In Abuja, the results suggest that while males perceive power generators as PAQ sources more than do females, females perceived waste disposal to be a bigger source of PAQ than did males. In Enugu, four of the sources (cars, buses, trucks and manufacturing industries) are mainly seen by men as sources of PAQ while more women perceive motorcycles as an important PAQ source than do men. Nonetheless, it would seem that there is more agreement between the views of the demographic groups with regard to sources of PAQ than there are differences.

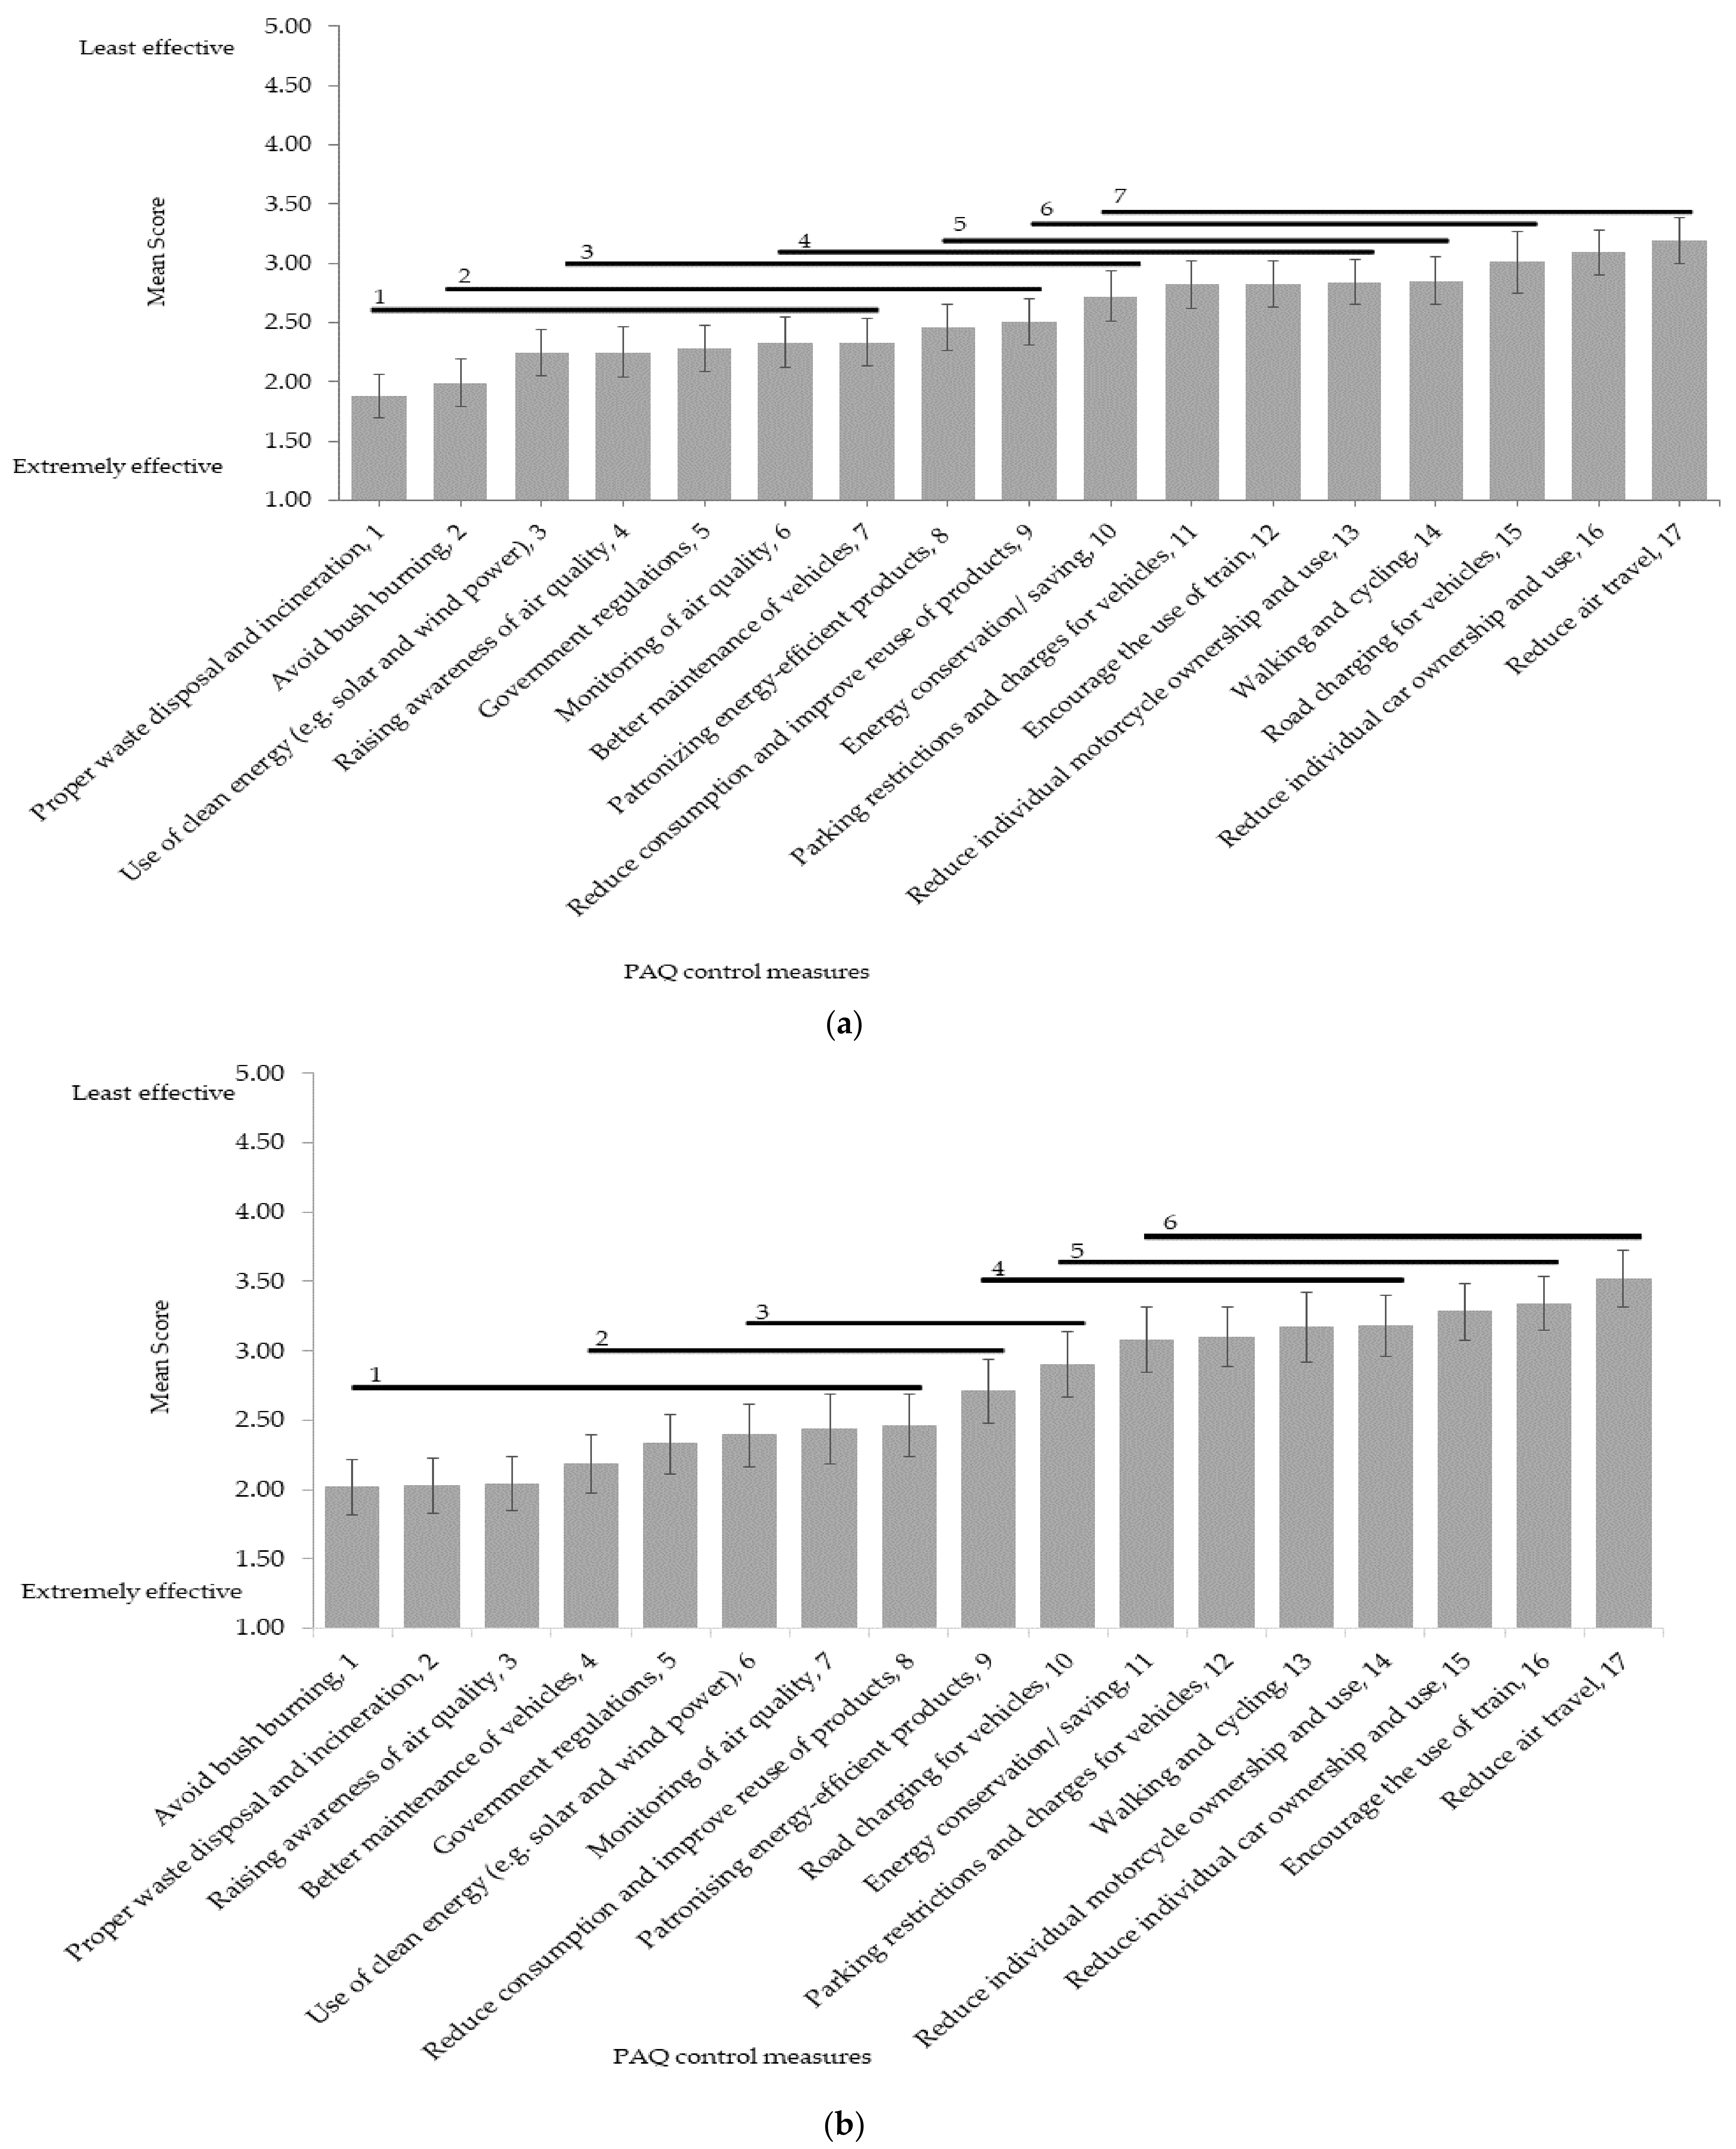
3.3. Control Measures for PAQ

The results for the control measures that should be adopted to address PAQ in Abuja and Enugu are shown in Figure 4a,b. The Spearman rank correlation for the mean scores of PAQ control measures PAQ from Abuja and Enugu is 0.914 (p < 0.001), which suggest many similarities in scoring between the respondents of the two cities. The top two control measures rated most highly by Abuja respondents (Figure 4a)-proper waste disposal and incineration and avoiding bush burning—are the same as those identified by the Enugu sample (Figure 4b), while the least important control measure in both cities is the reduction in air travel. In between these extremes, the scoring of various control measures does vary across the two cities, but the broad pattern is similar.
In terms of differences in control measures between the demographic groups (Table 7), there were relatively few (8) significant differences regarding gender, income, occupation and main mode of transport, and there was no clear pattern in these between the two cities. This suggests that, in terms of these demographic factors, there was much more agreement than difference in view. However, the one notable exception was with age in Enugu and these results are set out in more detail in Table 8. For almost all the control measures the younger demographic rated their importance higher than did the older demographic. The only control measures that did not have a statistically significant difference between the age groups in Enugu were a parking charge for vehicles and a reduction in air travel. The same pattern in terms of age was not seen in Abuja. Indeed, in that city, none of the control measures had a statistically significant difference between the age groups.

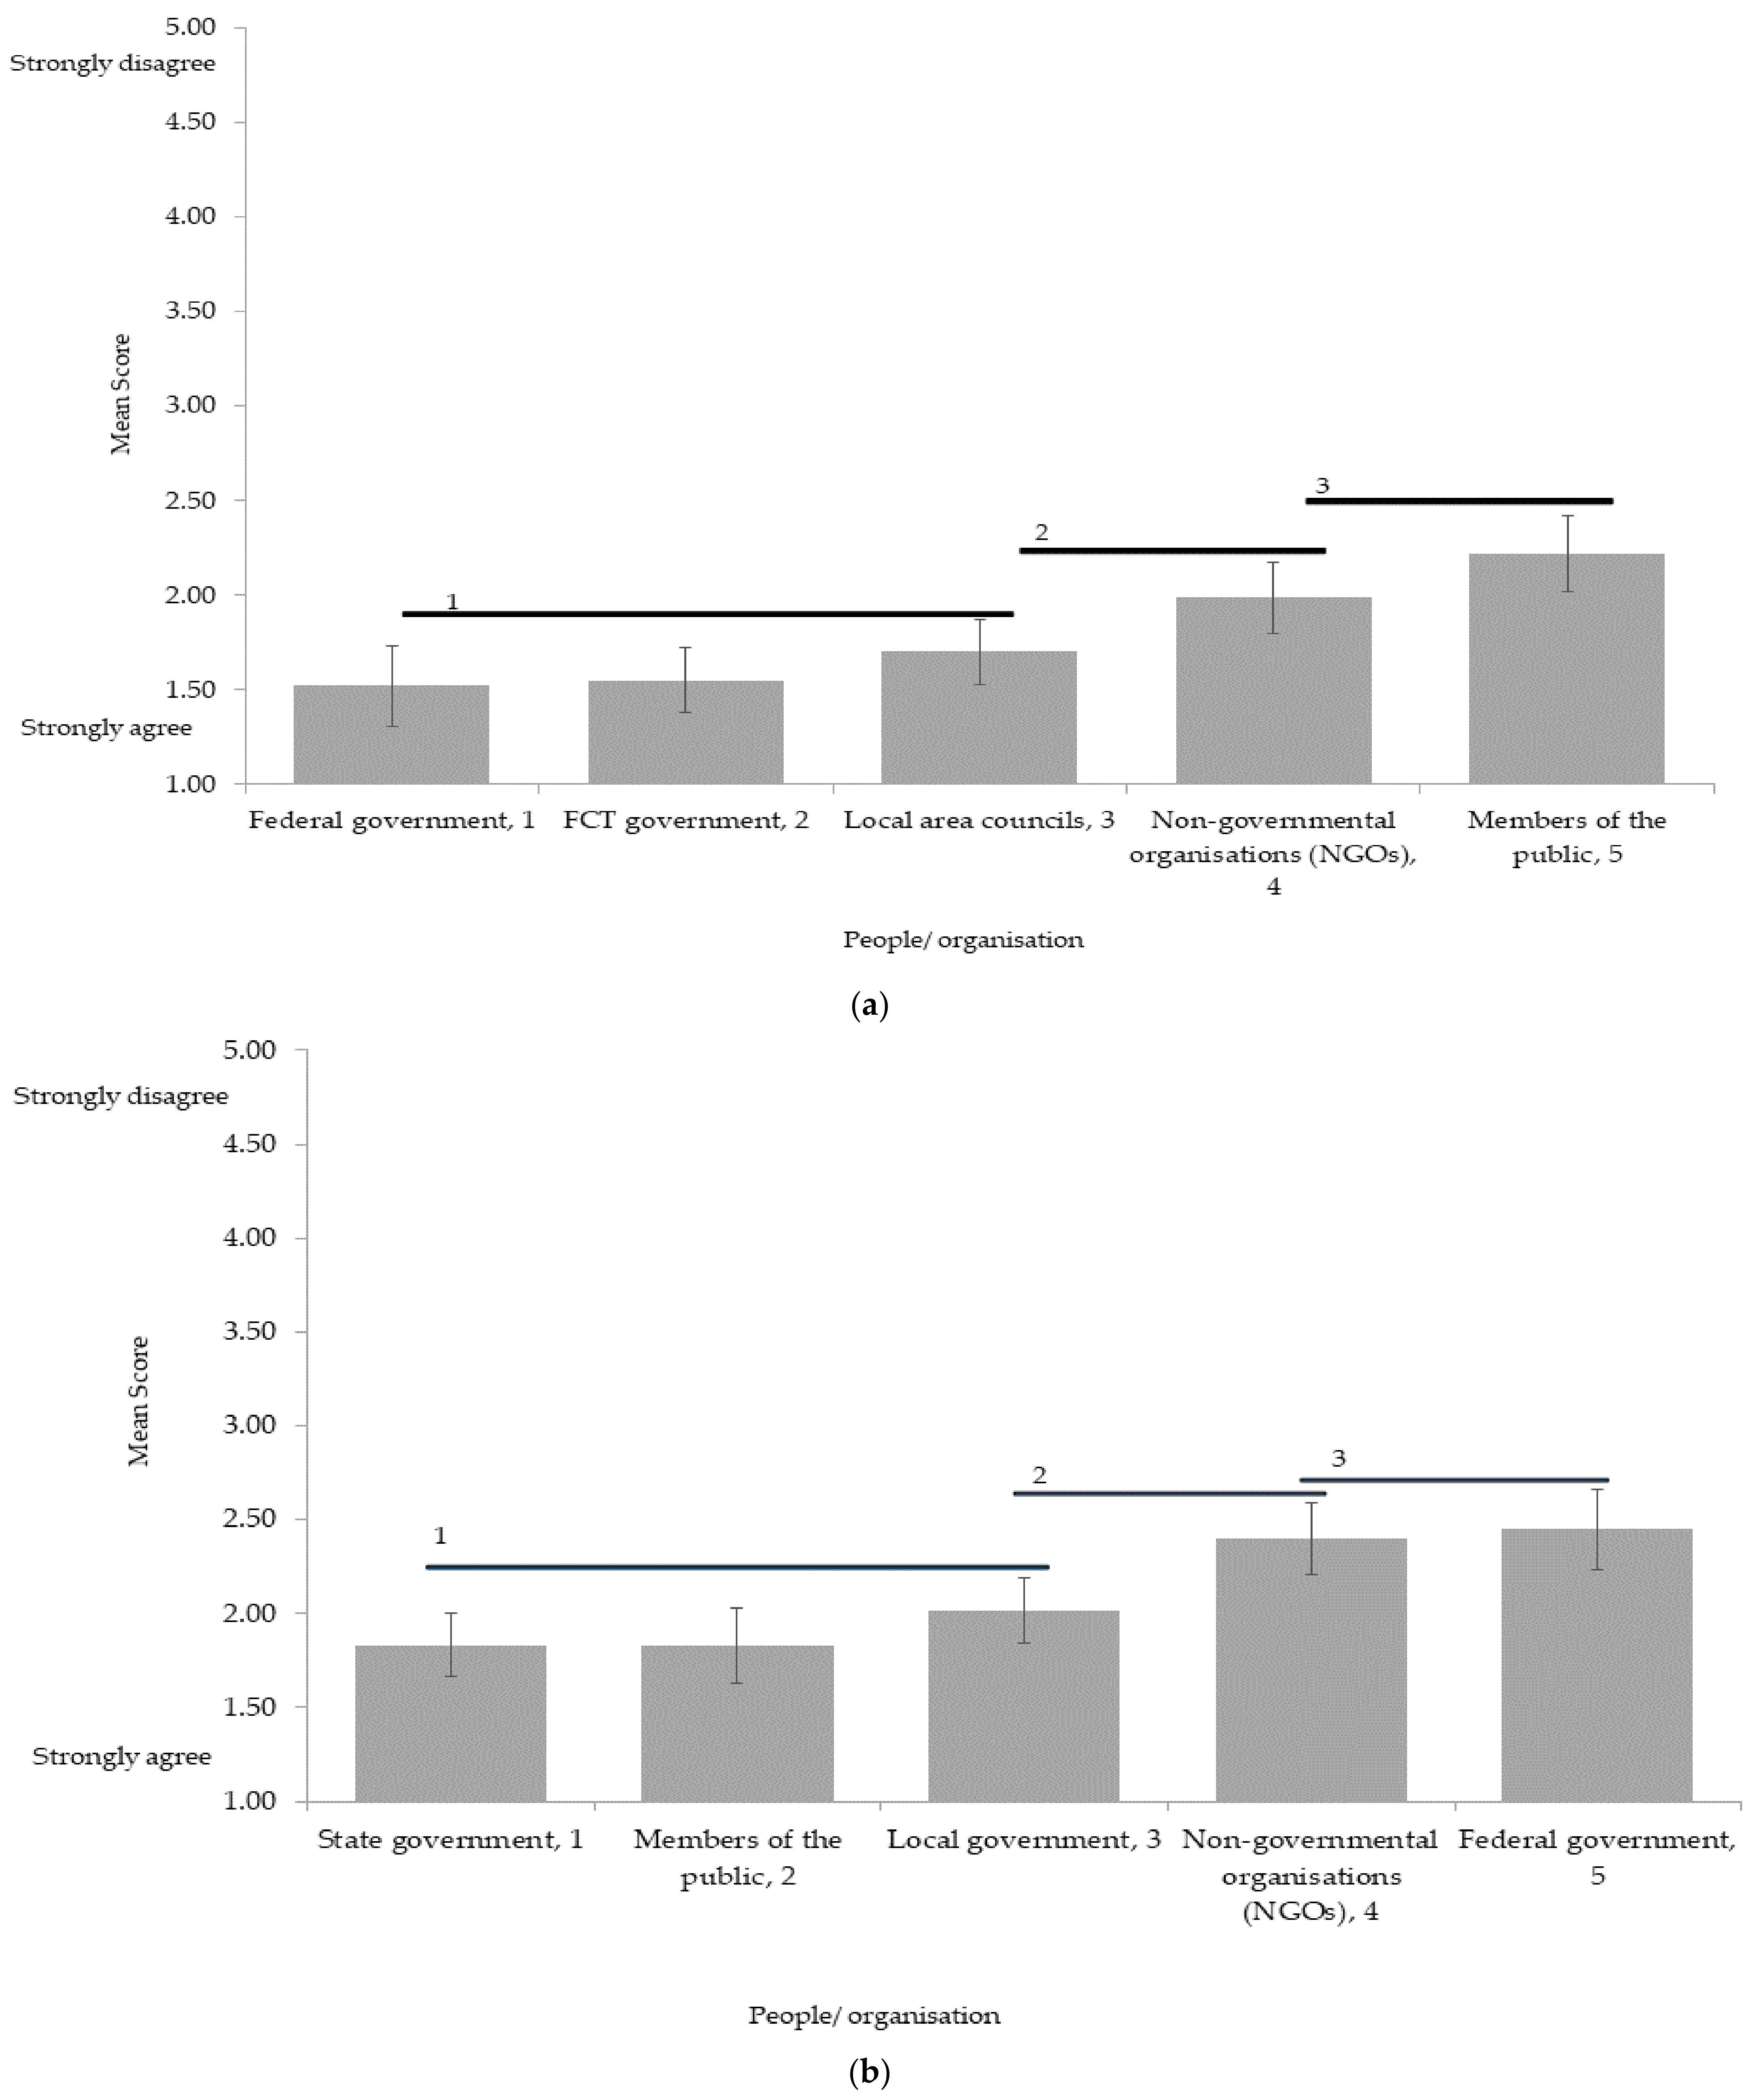
3.4. Primary Responsibility of Implementing PAQ Control Measures

Figure 5a,b illustrates the viewpoints of the residents of Abuja and Enugu on who should take the lead in ensuring improved AQ in both cities. The Spearman rank correlation for the mean scores of organisations having primary responsibility for addressing PAQ from Abuja and Enugu is 0.1 (p > 0.05), suggesting that the respondents from the two cities do take very different views. In Abuja, the people believe that the federal government should be in the primary position to tackle PAQ, and they see NGOs as the least expected to implement control measures against PAQ. Conversely, participants in Enugu see the federal government as the least important when it comes to implementing such measures and would rather take the lead themselves as members of the public in conjunction with the state government.
Table 9 shows that in most cases (53 out of 60 Kruskal–Wallis tests), there were no significant differences within the demographic groups based on gender, income, education and main mode of transport in how the people or organisations who should take primary responsibility for tackling PAQ were scored. A few statistically significant differences were found among the education and occupation demographic groups in Abuja and the income group in Enugu. For example, those with more advanced educational qualifications in Abuja believed that members of the public should take the principal responsibility for implementing control of PAQ, as indeed did the self-employed and housewives. However, the age demographic in Enugu showed consistent significant differences for four organisations in terms of the principal responsibility in managing PAQ (Table 10). For all four of these organisations—federal government, FCT/state government, local area council/government and non-governmental organisations—the younger demographic (18 to 34 years) saw them as more important than did the older (>35 years) demographic.

4. Discussion

This research represents the first work on the views of people from the cities of Abuja and Enugu in Nigeria regarding their perceived indicators of PAQ, causes of PAQ, and what should be done about it and by whom. Seeking the views of those who are most affected by PAQ is a logical move, although to date the emphasis has tended to be on the use of hardware such as monitoring stations and models to assess changes in air quality. When seeking the views of people on their perception of PAQ, its causes and potential solutions, however, it is likely that there will be diversity. Hence, in the research reported here, the emphasis was on exploring potential (i) differences in the perspectives of respondents between the two cities and (ii) for differences between several demographic groups (gender, age, education, income, occupation and main modes of transport). The two cities (Abuja and Enugu) were chosen as their geographical, social and historical contexts are quite different. Abuja is the federal capital of the country, established in the 1970s, and was planned in the sense of having distinct zones as well as wide and parallel roads. Enugu is a much older city and is a state capital, although it briefly was the de facto capital of the short-lived Biafran republic during the Nigerian civil war of the late 1960s.
The results obtained demonstrate that respondents in both cities clearly recognise that they experience PAQ. Indeed, their views over perceptual indicators, causes and controls were broadly similar with little evidence of a clear pattern of significant differences between the demographic groups. The indicators that respondents from the two cities said they used the most were smoke and dust, and odour, and there is some overlap here with the findings of previously published research. For example, studies such as [49,84,85,86] noted that odour was identified as the main perceived indicator of PAQ. However, it is interesting to note that visibility and factors such as skin and eye irritation and coughing did not score so high as the presence of odour, smoke and dust, and this does contrast to some extent with the results of previous studies. For example, studies by [8,47,87,88] highlighted visual experience or visibility as a widely used indicator, and coughing and sneezing are also used by people who are especially sensitive to PAQ such as those suffering from asthma [88]. Others such as [89,90,91] have reported that skin and eye irritation are often mentioned as indicators of PAQ. There may be some reasons for this difference in findings compared to the study reported here. For example, in the present research, no attempt was made to stratify the sample based on health conditions, thus, it is possible that many of the respondents were not unduly affected in health terms by PAQ.
When it comes to the perceived main causes of PAQ there was also a high degree of agreement between the two cities and indeed between demographic groups. While some significant differences were noted between some of the demographic groups these were relatively few and there was no clear and consistent pattern of difference. Respondents perceived that combustion-based human activities are the main sources of PAQ, and these include vehicular movement, manufacturing, the use of generators, bush fire (although these tend to happen more in the dry season and at the start of the growing season) and waste incineration. These findings are broadly in line with the results of other published studies. For example, incineration and vehicles as the main sources of PAQ in New Zealand [92], and vehicular emissions and bush burning are perceived by residents as major sources of PAQ in Mathare, a slum in Nairobi, Kenya [49], and the major contribution of vehicles to PAQ was also identified by [93], Ref. [53] in Nanchang, China, and [50] in Columbian cities. These perceptual findings are related to the measuring equipment findings of [94,95] which found that vehicle emissions were the chief cause of air pollution in Enugu city, while the works of [96,97,98] identified pollution from trucks as one of the top two main sources of PAQ.
The respondents from both cities also broadly agreed about the main control measures of PAQ that should be put in place. Proper waste disposal and incineration, and the avoidance of bush burning were scored highly by respondents, and this agrees with the findings of [53] who noted that control and reduction of waste burning is one of the most important means of solving PAQ problems in China. At the other end of the scale, respondents were not so positive about methods for controlling vehicle use or indeed the use of walking, cycling and mass transit systems such as train, and this is somewhat at odds with recommendations that are often espoused by international agencies such as the World Health Organization [99]. Reducing air travel was seen as the least effective of all measures for controlling PAQ in both cities. Allied to this point about control measures was the question asked in the survey about who be the agency that is primarily responsible for implementation of the measures. Here, there were some divergences between the responses of Abuja and Enugu respondents, with the former emphasising the role of the federal government while the latter focused more on the role of the state government. Indeed, Enugu respondents regarded the federal government as the least relevant when it comes to implementing PAQ control measures. In part, this may be due to the points made earlier in the paper about people generally having greater trust in more local agencies compared to national ones [57,58], but there could be other and more intriguing factors at play, clues to which can be found in the results of the demographic-based analyses.
Generally, and in line with points made above for indicators and causes of PAQ, there were very few statistically significant differences in how the various demographic groups perceived PAQ control measures and who are the main agencies for implementation in this study. There were some statistical differences for gender, income, education, occupation and main means of transport, but these were few in number and with no clear pattern. However, a striking exception to this was in Enugu, where a pattern of statistically significant differences within the age demographic occurred for many of the control measures and for who should be the main agents for their implementation. The results suggest that the younger demographic, those classified as ‘youth’, 18–34 years old, by the Nigerian Government, scored the control measures consistently higher than did the older (>35 years old) demographic (Table 7) and were also more positive about the role of most agencies for implementing the measures (Table 10). This significant and striking difference between age groups in the Enugu sample was not seen in Abuja, and indeed did not appear in the results of the Kruskal–Wallis tests for perceived indicators and main causes of PAQ. It must first be noted that the questions in the survey which looked at control measures and agency are intrinsically different from those questions that ask about indicators and causes of PAQ as the former questions have an inherent sense of responsibility, governance and power within them—they are about ‘someone doing something’ rather than the arguably more neutral questions about indicators and causes of PAQ. Indeed, and following on from this point, one interesting possibility is linked to the more multi-ethnic and multi-cultural nature of the Abuja sample which has respondents from Tiv, Yoruba, Igbo, Hausa, Fulani, Edo, Idoma, Igala, Efik, Ibibio, Gbagyi, Ijaw, Eggon, and Berom.
Indeed, the geographical location of the city in the centre of Nigeria was designed in part to enhance that diversity, compared to Enugu which is still largely an Igbo city or at least a city primarily inhabited by peoples from the South-East of the country. There are some intriguing dynamics at play in Igbo culture, including some that are deeply rooted in Igbo youth identity and activism and in particular the sense of difference between youth and their elders when it comes to power and decision-making, all of which are said to be finding new voices in more recent years especially while linked to the latest re-emergence of a desire to separate from the Nigerian state [100,101]. The Igbos are highly democratic and always inculcate democratic values [102] in everything which most times commence from the traditional ‘age grades’; a group that usually mark the onset of youthful years. In many societies within Nigeria, power rests with the elders rather than the youth, and there has always been some tension here, with a growing literature pointing to restiveness and calls from the youth to be more involved in decision-making [103] and indeed politics [104]. However, in the south-east of the country, there has arguably been an especial rise in youth-led environmental activism as a result of degradation caused by the extractive (i.e., oil and gas) industry and Igbo society in particular has been seeing the emergence of youth activism, including with environmental matters, and the youth have been finding their voices especially within urban contexts. Maybe the significant differences between the age groups in Enugu are linked to a sense of urgency and importance to address PAQ amongst the youth when compared to the older segment in the sample is in part a reflection of this confidence and voice. This is an intriguing possibility that would need to be followed up with further research.
A point that needs to be noted in the context of this study is the potential influence of the COVID-19 pandemic lockdown on respondents’ views of urban air quality. After all, the research took place during a peak of the COVID-19 pandemic (October 2020 and March 2021) and many of the respondents identified vehicular movement and other anthropogenic activities as the main causes of PAQ in their urban environment. On a global scale, air travel and shipping were affected and, in many countries, road transport was significantly reduced. As a result of these and other changes, such as a reduction in industrial activity, there are many reports that the concentration of pollutants in the atmosphere reduced during the lockdown period [105,106,107,108,109]. However, while there is no evidence as yet that vehicle movement was significantly reduced in Nigerian cities at the time of the research [110], it is not inconceivable that respondents’ perception of the causes of air quality and the best ways to address them could have been influenced via press reporting and social media.
Decision-making on the environment and urban development should be a participatory process, employing public perceptions of the environment including air quality, and giving members of the public the chance to convey their views and concerns. Ensuring a smart and clean city will undoubtedly profit from incorporating study of the perceptions of residents as a means to better understand their views about their locale and reducing environmental risks. This approach to assessing PAQ and its management offers considerable scope for further development in both study areas and beyond, and should be explored further in relation to meeting the SDGs targets and creating a better environment.

5. Conclusions

This study has investigated the views of respondents across a wide range of demographic groups to the indicators, sources and responses to PAQ in two structurally different cities in Nigeria. The findings have shed important light onto the potential value of such perceptual indicators to reveal the ways in which citizens recognise the problem of PAQ and how they perceive possible responses to and responsibilities for action on the issue. The following specific conclusions have been drawn from our analysis:
  • Respondents in both Abuja and Enugu have clear and very similar perceptions that they are exposed to PAQ.
  • Odour, dust and smoke are the most frequently used perceptual indicators of PAQ in the Nigerian cities of Abuja and Enugu. This mirrors similar findings in studies in other parts of the world.
  • Combustion-based human activities such as vehicular movement, manufacturing, the use of generators, bush fires and waste-related activities are the main perceived sources of PAQ in both cities. These were also reflected in the views expressed in both cities on the main control measures being proper waste disposal and incineration and the avoidance of bush burning. Respondents were less positive about methods for controlling vehicle use or indeed the use of walking, cycling and mass transit systems. Statistically significant differences in views within the age demographic for the majority of the control measures were observed in Enugu but not Abuja.
  • Views on the preferred agencies for implementing control measured diverged between Abuja and Enugu, with residents in the former favouring the federal government and those in the latter favouring local government. An interesting focus for this divergence that applied to both the control measures and the agencies occurred in the age demographic in Enugu where the ‘youth’ (18–34 years) scored the control measures significantly more highly and were significantly more positive about the responsibilities for implementing the controls than the older demographic (>35 years). This finding may reflect youth activism in Enugu and warrants further research in relation to the PAQ issue.
This work suggests that enhanced study and knowledge of people’s perceptions of PAQ, its causes, interventions to address it and main agencies responsible for controlling PAQ are important areas for future research and will be vital in decision and policymaking to ensure improved air quality in urban areas. There is scope to introduce a more participatory approach to addressing these points and indeed further exploration of the role of youth activism in cities of the global south when it comes to environmental issues.

Author Contributions

Conceptualization, T.M.C., S.M., R.M.; methodology, T.M.C., S.M., R.M.; formal analysis, T.M.C., S.M., R.M.; investigation, T.M.C.; resources, T.M.C., S.M., R.M.; data curation, T.M.C.; writing—original draft preparation, T.M.C.; writing—review and editing, T.M.C., S.M., R.M.; supervision, S.M., R.M.; project administration, S.M.; funding acquisition, T.M.C., S.M., R.M. All authors have read and agreed to the published version of the manuscript.

Funding

The authors are grateful for financial and related support provided to the PhD programme of the first author by the Faculty of Engineering & Physical Sciences and the University of Surrey.

Institutional Review Board Statement

Not applicable.

Informed Consent Statement

Not applicable.

Data Availability Statement

Data presented in this study are available on request from the corresponding author.

Acknowledgments

The authors are grateful to our assistants for their help with data collection.

Conflicts of Interest

The authors declare no conflict of interest.

Appendix A

Survey Questionnaire
SECTION A: DEMOGRAPHICS
What is your gender?
MaleFemale
What is your age?
18–3435 or older
Which one of the following categories best describes your monthly income in Naira?
No incomeUnder 10,00011,000–30,00031,000–50,00051,000–100,000Over 100,000
What is the highest level of education you achieved?
NonePrimarySecondaryBachelor/Diploma or equivalentMaster or equivalentPhD or equivalent
What is your occupation?
StudentUnemployedEmployed (daily wage)Employed (weekly wage)Employed (monthly wage)Employed (monthly wage)Self-employedHousewifeRetired
What is your main mode of daily transport?
WalkingBicycleMotorcycleCar taxiTricycle taxi (Keke)Motorcycle taxi (Okada)Public busTrainPersonal car
SECTION B: AIR QUALITY PERCEPTUAL INDICATORS
How do you use these indicators to know when the air quality is poor or good?
Most UsedUsedNeutralRarely UsedLeast Used
Visibility.
Smell/odour.
Dust in the air.
Dirt on skin and clothes.
Dirt on surfaces such as buildings.
Smoke.
Sneezing and coughing.
Skin irritation.
Watery/irritating eyes.
SECTION C: SOURCES OF POOR AIR QUALITY
In general, do you agree that these sources of air pollution contribute to poor air quality?
Strongly AgreeAgreeNeutralDisagreeStrongly Disagree
Air transportation.
Cars.
Trucks.
Buses.
Motorcycles.
Tricycles.
Power/energy generators.
Petrol/gas filling stations.
Manufacturing industries.
Oil production.
Cooking.
Bush fire.
Waste burning.
Waste disposal.
Building and road construction.
Rail transportation.
SECTION D: AIR QUALITY CONTROL MEASURES
How do you rate these poor air quality control measures in terms of effectiveness?
Extremely EffectiveVery EffectiveModerately EffectiveSlightly EffectiveLeast Effective
Energy conservation/saving.
Reduce individual car ownership.
Reduce individual motorcycle ownership.
Walking and cycling.
Patronising energy-efficient products.
Use of clean energy (e.g., solar and wind power).
Proper waste disposal and incineration.
Government regulations.
Monitoring of air quality.
Raising awareness of air quality.
Reduce consumption and improve reuse of products.
Avoid bush burning.
Road charging for vehicles.
Parking restrictions and charge for vehicles.
Reduce air travel.
Encourage the use of train/mass transit.
Better maintenance of vehicles.
Who should take primary responsibility for improving air quality?
Strongly AgreeAgreeNeutralDisagreeStrongly Disagree
Federal government.
FCT/state government.
Local government area councils.
Non-governmental organisations (NGOs)
Members of the public.

References

  1. Xie, X.; Semanjski, I.; Gautama, S.; Tsiligianni, E.; Deligiannis, N.; Rajan, R.; Philips, W. A Review of Urban Air Pollution Monitoring and Exposure Assessment Methods. ISPRS Int. J. Geo Inf. 2017, 6, 389. [Google Scholar] [CrossRef] [Green Version]
  2. Avtar, R.; Saurabh, T.; Aggarwal, A.K.; Kumar, P. Population-Urbanization-Energy Nexus: A Review. Resources 2019, 8, 136. [Google Scholar] [CrossRef] [Green Version]
  3. Odonkor, S.T.; Mahami, T. Knowledge, Attitudes, and Perceptions of Air Pollution in Accra, Ghana: A Critical Survey. J. Environ. Public. Health 2020, 2020, 3657161. [Google Scholar] [CrossRef]
  4. Mafizur, R.M.; Vu, X.B. Are Energy Consumption, Population Density and Exports Causing Environmental Damage in China? Autoregressive Distributed Lag and Vector Error Correction Model Approaches. Sustainability 2021, 13, 3749. [Google Scholar] [CrossRef]
  5. Agbo, K.E.; Walgraeve, C.; Eze, J.I.; Ugwoke, P.E.; Ukoha, P.O.; Van Langenhove, H. A review on ambient and indoor air pollution status in Africa. Atmos. Pollut. Res. 2021, 12, 243–260. [Google Scholar] [CrossRef]
  6. World Health Organization. New WHO Global Air Quality Guidelines Aim to Save Millions of Lives from Air Pollution. 2021. Available online: https://www.who.int/news/item/22-09-2021-new-who-global-air-quality-guidelines-aim-to-save-millions-of-lives-from-air-pollution (accessed on 20 October 2021).
  7. World Health Organization. WHO Global Air Quality Guidelines. Particulate Matter (PM 2.5 and PM 10), Ozone, Nitrogen Dioxide, Sulphur Dioxide and Carbon Monoxide. 2021. Available online: https://www.who.int/publications/i/item/9789240034433 (accessed on 20 October 2021).
  8. Brimblecombe, P. Visibility Driven Perception and Regulation of Air Pollution in Hong Kong, 1968–2020. Environments 2021, 8, 51. [Google Scholar] [CrossRef]
  9. Perera, F.P. Multiple Threats to Child Health from Fossil Fuel Combustion: Impacts of Air Pollution and Climate Change. Environ. Health Perspect. 2017, 125, 141–148. [Google Scholar] [CrossRef]
  10. Eguiluz-Gracia, I.; Mathioudakis, A.G.; Bartel, S.; Vijverberg, S.J.H.; Fuertes, E.; Comberiati, P.; Cai, Y.S.; Tomazic, P.V.; Diamant, Z.; Vestbo, J.; et al. The need for clean air: The way air pollution and climate change affect allergic rhinitis and asthma. Allergy 2020, 75, 2170–2184. [Google Scholar] [CrossRef]
  11. Scotland’s Environment. Air Quality. 2011. Available online: https://www.environment.gov.scot/media/1241/air-and-climate-air-quality.pdf (accessed on 22 October 2021).
  12. Rao, N.V.; Rajasekhar, M.; Rao, G.C. Detrimental Effect of Air Pollution, Corrosion on Building Materials and Historical Structures. Am. J. Eng. Res. 2014, 3, 359–364. [Google Scholar]
  13. Strosnider, H.; Kennedy, C.; Monti, M.; Yip, F. Rural and Urban Differences in Air Quality, 2008–2012, and Community Drinking Water Quality, 2010–2015—United States. Morbidity and mortality weekly report. Surveill. Summ. 2017, 66, 1–10. [Google Scholar] [CrossRef] [PubMed]
  14. Grimmond, C.S.B.; Roth, M.; Oke, T.R.; Au, Y.C.; Best, M.; Betts, R.; Carmichael, G.; Cleugh, H.; Dabberdt, W.; Emmanuel, R.; et al. Climate and more sustainable cities: Climate information for improved planning and management of cities (Producers/Capabilities Perspective). Procedia Environ. Sci. 2010, 1, 247–274. [Google Scholar] [CrossRef] [Green Version]
  15. Manisalidis, I.; Stavropoulou, E.; Stavropoulos, A.; Bezirtzoglou, E. Environmental and Health Impacts of Air Pollution: A Review. Front. Public Health 2020, 8, 14. [Google Scholar] [CrossRef] [PubMed] [Green Version]
  16. Quarmby, S.; Santos, G.; Mathias, M. Air quality strategies and technologies: A rapid review of the international evidence. Sustainability 2019, 11, 2757. [Google Scholar] [CrossRef] [Green Version]
  17. Amann, M.; Kiesewetter, G.; Schpp, W.; Klimont, Z.; Winiwarter, W.; Cofala, J.; Rafaj, P.; Hglund-Isaksson, L.; Gomez-Sabriana, A.; Heyes, C.; et al. Reducing global air pollution: The scope for further policy interventions. Philos. Trans. R. Soc. A 2020, 378, 20190331. [Google Scholar] [CrossRef]
  18. Unece.org. Clean Air for Life | UNECE. 2016. Available online: http://unece.org/environment-policy/publications/clean-air-life (accessed on 23 October 2021).
  19. Borrego, C.; Costa, A.M.; Ginja, J.; Amorim, M.; Coutinho, M.; Karatzas, K.; Penza, M. Assessment of air quality microsensors versus reference methods: The EuNetAir joint exercise. Atmos. Environ. 2016, 147, 246–263. [Google Scholar] [CrossRef] [Green Version]
  20. Schwela, D. Review of Urban Air Quality in Sub-Saharan Africa Region. 2012. Available online: https://openknowledge.worldbank.org/handle/10986/26864 (accessed on 23 October 2021).
  21. Zhang, J.; Day, D. Urban Air Pollution and Health in Developing Countries. In Air Pollution and Health Effects. Molecular and Integrative Toxicology; Nadadur, S., Hollingsworth, J., Eds.; Springer: London, UK, 2015. [Google Scholar] [CrossRef]
  22. Karimi, H.; Soffianian, A.; Mirghaffari, N.; Soltani, S. Determining Air Pollution Potential Using Geographic Information Systems and Multi-criteria Evaluation: A Case Study in Isfahan Province in Iran. Environ. Process. 2016, 3, 229–246. [Google Scholar] [CrossRef]
  23. Zhou, C.; Li, S.; Wang, S. Examining the impacts of urban form on air pollution in developing countries: A case study of China’s megacities. Int. J. Environ. Res. Public Health 2018, 15, 1565. [Google Scholar] [CrossRef] [Green Version]
  24. Kumar, P.; Druckman, A.; Gallagher, J.; Gatersleben, B.; Allison, S.; Eisenman, T.S.; Hoang, U.; Hama, S.; Tiwari, A.; Sharma, A.; et al. The nexus between air pollution, green infrastructure and human health. Environ. Int. 2019, 133, 105181. [Google Scholar] [CrossRef]
  25. Abulude, F.O.; Damodharan, U.; Acha, S.; Adamu, A.; Arifalo, K.M. Preliminary Assessment of Air Pollution Quality Levels of Lagos, Nigeria. Environ. Sci. Proc. 2020, 5, 20. [Google Scholar] [CrossRef]
  26. De Souza, P.; Anjomshoaa, A.; Duarte, F.; Kahn, R.; Kumar, P.; Ratti, C. Air quality monitoring using mobile low-cost sensors mounted on trash-trucks: Methods development and lessons learned. Sustain. Cities Soc. 2020, 60, 102239. [Google Scholar] [CrossRef]
  27. Mahajan, S.; Kumar, P.; Pinto, J.A.; Riccetti, A.; Schaaf, K.; Camprodon, G.; Smári, V.; Passani, A.; Forino, G. A citizen science approach for enhancing public understanding of air pollution. Sustain. Cities Soc. 2020, 52, 101800. [Google Scholar] [CrossRef]
  28. Abera, A.; Friberg, J.; Isaxon, C.; Jerrett, M.; Malmqvist, E.; Sjöström, C.; Taj, T.; Vargas, A.M. Air Quality in Africa: Public Health Implications. Annu. Rev. Public Health 2021, 42, 193–210. [Google Scholar] [CrossRef]
  29. Singh, A.; Ng’ang’a, D.; Gatari, M.J.; Kidane, A.W.; Alemu, Z.A.; Derrick, N.; Webster, M.J.; Bartington, S.E.; Thomas, G.N.; Avis, W.; et al. Air quality assessment in three East African cities using calibrated low-cost sensors with a focus on road-based hotspots. Environ. Res. Commun. 2021, 3, 075007. [Google Scholar] [CrossRef]
  30. Squizzato, R.; Nogueira, T.; Martins, L.D.; Martins, J.A.; Astolfo, R.; Machado, C.B.; Andrade, M.F.; Freitas, E.D. Beyond megacities: Tracking air pollution from urban areas and biomass burning in Brazil. NPJ Clim. Atmos. Sci. 2021, 4, 17. [Google Scholar] [CrossRef]
  31. Rohde, R.A.; Muller, R.A. Air pollution in China: Mapping of concentrations and sources. PLoS ONE 2015, 10, e0135749. [Google Scholar] [CrossRef]
  32. Akram, M.; Amrani, M.; El, C. Air2Day: An Air Quality Monitoring Adviser in Morocco. Int. J. Comput. Appl. 2018, 181, 1–6. [Google Scholar] [CrossRef]
  33. Semlali, B.E.B.; Amrani, C.; Ortiz, G.; Boubeta-Puig, J.; Garcia-de-Prado, A. SAT-CEP-monitor: An air quality monitoring software architecture combining complex event processing with satellite remote sensing. Comput. Electr. Eng. 2021, 93, 107257. [Google Scholar] [CrossRef]
  34. Castell, N.; Dauge, F.R.; Schneider, P.; Vogt, M.; Lerner, U.; Fishbain, B.; Broday, D.; Bartonova, A. Can commercial low-cost sensor platforms contribute to air quality monitoring and exposure estimates? Environ. Int. 2017, 99, 293–302. [Google Scholar] [CrossRef]
  35. Greater London Authority. Guide for Monitoring Air Quality in London. 2018. Available online: https://www.london.gov.uk/sites/default/files/air_quality_monitoring_guidance_january_2018.pdf (accessed on 23 October 2021).
  36. Hertel, O. Integrated Monitoring and Assessment of Air Pollution. 2009. Available online: https://www.researchgate.net/publication/233379382 (accessed on 24 October 2021).
  37. Lewis, A.; Edwards, P. Validate personal air-pollution sensors. Nature 2016, 535, 29–31. [Google Scholar] [CrossRef] [Green Version]
  38. Lassman, W.; Pierce, J.R.; Bangs, E.J.; Sullivan, A.P.; Ford, B.; Tsidu, G.M.; Sherman, J.P.; Collett, J.L.; Bililign, S. Using low-cost measurement systems to investigate air quality: A case study in Palapye, Botswana. Atmosphere 2020, 11, 583. [Google Scholar] [CrossRef]
  39. Ikram, J.; Tahir, A.; Kazmi, H.; Khan, Z.; Javed, R.; Masood, U. View: Implementing low cos air quality monitoring solution for urban areas. Environ. Syst. Res. 2012, 1, 10. [Google Scholar] [CrossRef] [Green Version]
  40. Snyder, E.G.; Watkins, T.H.; Solomon, P.A.; Thoma, E.D.; Williams, R.W.; Hagler, G.S.W.; Shelow, D.; Hindin, D.A.; Kilaru, V.J.; Preuss, P.W. The Changing Paradigm of Air Pollution Monitoring. Environ. Sci. Technol. 2013, 47, 11369–11377. [Google Scholar] [CrossRef] [PubMed]
  41. Pinder, R.W.; Klopp, J.M.; Kleiman, G.; Hagler, G.S.W.; Awe, Y.; Terry, S. Opportunities and Challenges for Filling the Air Quality Data Gap in Low- and Middle-Income Countries. Atmos. Environ. 2019, 215, 116794. [Google Scholar] [CrossRef]
  42. Schmitz, S.; Weiand, L.; Becker, S.; Niehoff, N.; Schwartzbach, F.; von Schneidemesser, E. An assessment of perceptions of air quality surrounding the implementation of a traffic-reduction measure in a local urban environment. Sustain. Cities Soc. 2018, 41, 525–537. [Google Scholar] [CrossRef]
  43. Cori, L.; Donzelli, G.; Gorini, F.; Bianchi, F.; Curzio, O. Risk perception of air pollution: A systematic review focused on particulate matter exposure. Int. J. Environ. Res. Public Health 2020, 17, 6424. [Google Scholar] [CrossRef] [PubMed]
  44. Wang, Y.; Sun, M.; Yang, X.; Yuan, X. Public awareness and willingness to pay for tackling smog pollution in China: A case study. J. Clean. Prod. 2016, 112, 1627–1634. [Google Scholar] [CrossRef]
  45. Kondo, M.C.; Mizes, C.; Lee, J.; McGady-Saier, J.; O’Malley, L.; Diliberto, A.; Burstyn, I. Towards Participatory Air Pollution Exposure Assessment in a Goods Movement Community. Prog. Community Health Partnersh. Res. Educ. Action 2014, 8, 291–304. [Google Scholar] [CrossRef]
  46. Laws, M.B.; Yeh, Y.; Reisner, E.; Stone, K.; Wang, T.; Brugge, D. Gender, Ethnicity and Environmental Risk Perception Revisited: The Importance of Residential Location. J. Community Health 2015, 40, 948–955. [Google Scholar] [CrossRef] [Green Version]
  47. Malm, W.C.; Schichtel, B.; Molenar, J.; Prenni, A.; Peters, M. Which visibility indicators best represent a population’s preference for a level of visual air quality? J. Air Waste Manag. Assoc. 2018, 69, 145–161. [Google Scholar] [CrossRef]
  48. Ryu, Y.-H.; Min, S.-K. What matters in public perception and awareness of air quality? Quantitative assessment using internet search volume data. Environ. Res. Lett. 2020, 15, 0940b4. [Google Scholar] [CrossRef]
  49. Ngo, N.; Kokoyo, S.; Klopp, J. Why participation matters for air quality studies: Risk perceptions, understandings of air pollution and mobilization in a poor neighborhood in Nairobi, Kenya. Public Health 2017, 142, 177–185. [Google Scholar] [CrossRef] [PubMed]
  50. Ramírez, O.; Mura, I.; Franco, J.F. How Do People Understand Urban Air Pollution? Exploring Citizens’ Perception on Air Quality, Its Causes and Impacts in Colombian Cities. Open J. Air Pollut. 2017, 6, 1–17. [Google Scholar] [CrossRef] [Green Version]
  51. Dandotiya, B. Air Pollution, Health and Perception. 2021. Available online: https://www.intechopen.com/chapters/75552 (accessed on 30 October 2021).
  52. Peng, M.; Zhang, H.; Evans, R.; Zhong, X.; Yang, K. Actual Air Pollution, Environmental Transparency, and the Perception of Air Pollution in China. J. Environ. Dev. 2019, 28, 78–105. [Google Scholar] [CrossRef] [Green Version]
  53. Liao, X.; Tu, H.; Maddock, J.E.; Fan, S.; Lan, G.; Wu, Y.; Lu, Y. Residents’ perception of air quality, pollution sources, and air pollution control in Nanchang, China. Atmos. Pollut. Res. 2015, 6, 835–841. [Google Scholar] [CrossRef]
  54. Maione, M.; Mocca, E.; Eisfeld, K.; Kazepov, Y.; Fuzzi, S. Public perception of air pollution sources across Europe. Ambio 2020, 50, 1150–1158. [Google Scholar] [CrossRef]
  55. Luo, L.; Wu, Y.; Hsu, K.-W.; Ting, P.-H. Public Risk Perception and Response to Air Pollution. IOP Conf. Ser. Earth Environ. Sci. 2020, 581, 012029. [Google Scholar] [CrossRef]
  56. Nigeria, Climate and Clean Air Coalition & United Nations Environment Programme. Highlights of the National Action Plan to Reduce Short-lived Climate Pollutants in Nigeria/Climate & Clean Air Coalition. 2018. Available online: https://www.ccacoalition.org/en/resources/highlights-national-action-plan-reduce-short-lived-climate-pollutants-nigeria (accessed on 3 November 2021).
  57. Christensen, T.; Lægreid, P. Trust in Government: The relative importance of service satisfaction, political factors, and demography. Public Perform. Manag. Rev. 2005, 28, 487–511. [Google Scholar]
  58. Fitzgerald, J.; Wolak, J. The roots of trust in local government in Western Europe. Int. Political Sci. Rev. 2016, 37, 130–146. [Google Scholar] [CrossRef]
  59. Wu, C.; Wilkes, R. Local–national political trust patterns: Why China is an exception. Int. Political Sci. Rev. 2018, 39, 436–454. [Google Scholar] [CrossRef]
  60. Enoguanbhor, E.C.; Gollnow, F.; Nielsen, J.O.; Lakes, T.; Walker, B.B. Land cover change in the Abuja City-Region, Nigeria: Integrating GIS and remotely sensed data to support land use planning. Sustainability 2019, 11, 1313. [Google Scholar] [CrossRef] [Green Version]
  61. United Nations Population Fund. World Population Dashboard Nigeria. 2021. Available online: https://www.unfpa.org/data/world-population/NG (accessed on 30 November 2021).
  62. Jimenez, E.; Pate, M. Reaping a dividend in Africa’s largest country: Nigeria. In Africa’s Population: In Search of a Demographic Dividend; Groth, H., May, J.F., Eds.; Springer: Dordrecht, The Netherlands, 2017; pp. 33–51. [Google Scholar]
  63. Etebong, P. Demography in Nigeria: Problems and prospects. Biostat. Biom. Open Access J. 2018, 5, 1–6. [Google Scholar]
  64. Oduwole, T. Youth unemployment and poverty in Nigeria. Int. J. Sociol. Anthropol. Res. 2015, 1, 23–39. [Google Scholar]
  65. Boumphery, S. World’s fastest growing cities in Asia and Africa. Euromonitor International. 2010. Available online: https://www.euromonitor.com/article/special-report-worlds-fastest-growing-cities-are-in-asia-and-africa (accessed on 3 November 2021).
  66. National Bureau for Statistics. Population 2006–2016. 2016. Available online: https://nigerianstat.gov.ng/elibrary?queries[search]=population (accessed on 29 October 2021).
  67. Abubakar, I.R. Abuja city profile. Cities 2014, 41, 81–91. [Google Scholar] [CrossRef]
  68. Okwu-Delunzu, V.U.; Oweifighe, W.J.; Ugochukwu, U.C. Assessment of Air Quality Levels in Heavy Traffic Areas in Enugu urban, Nigeria. In Monograph of Atmospheric Research 2018; Centre for Atmospheric Research: Anyigba, Nigeria, 2018; Available online: https://carnasrda.com/wp-content/uploads/2019/06/Okwu-et-al.pdf (accessed on 30 October 2021).
  69. Agu, C.C.; Ikwuka, A.; Tukur, K.; Omede, H.; Nwadike, B.K. An Assessment of Heatwave Impact in Enugu Metropolis of Enugu State. 2020. Available online: https://assets.researchsquare.com/files/rs-36863/v3/4ab6cf24-a963-451d-bb77-ec15f11fcff9.pdf?c=1631861464 (accessed on 20 November 2021).
  70. Metrotrends. Enugu, Nigeria Metro Area Population 1950–2020. 2020. Available online: https://www.macrotrends.net/cities/21986/enugu/population (accessed on 25 October 2021).
  71. Odoemena, A.; Olaoba, O. Explaining inter-ethnic harmony in Enugu city, South-eastern Nigeria, 1970–2003. Afr. J. Confl. Resolut. 2010, 10, 111–136. [Google Scholar] [CrossRef]
  72. Sunday, O.M. Critical factors determining public transport access level in Abuja federal capital territory of Nigeria. J. Geogr. Reg. Plan. 2017, 10, 298–308. [Google Scholar] [CrossRef] [Green Version]
  73. Ashara, A.; Saleh, S.; Hassan, U.; Kaura, M. Traffic Management System in Abuja City Center, using Geographic Information Systems (GIS) and Global Positioning System (GPS). A case study of FCT, Nigeria. J. Phys. Conf. Ser. 2020, 1529, 052068. [Google Scholar] [CrossRef]
  74. National Bureau of Statistics. Road Transport Data. 2018. Available online: https://www.nigerianstat.gov.ng/pdfuploads/Road_Transport_Data_-_Q2_2018.pdf (accessed on 28 October 2021).
  75. National Bureau of Statistics. Power Sector Report: Energy Generated and Sent Out and Consumed and Load Allocation. 2019. Available online: https://www.nigerianstat.gov.ng/pdfuploads/Power_Generation_-_Q4_2018.pdf (accessed on 5 November 2021).
  76. Kadafa, A.A. Solid Waste Management Practice of Residents in Abuja Municipalities (Nigeria). IOSR J. Environ. Sci. 2017, 11, 87–106. [Google Scholar] [CrossRef]
  77. Amalu, T.E.; Ajake, A.O. Appraisal of Solid Waste Management Practices in Enugu City, Nigeria. 2014, Volume 4. Available online: www.iiste.org (accessed on 20 October 2021).
  78. Hamid, A.A.; Usman, L.A.; Elaigwu, S.E.; Zubair, M.F. Environmental and Health Risk of Bush Burning. Adv. Environ. Biol. 2010, 4, 241–249. [Google Scholar]
  79. Abaje, I.B.; Bello, Y.; Ahmad, S.A. A Review of Air Quality and Concentrations of Air Pollutants in Nigeria. J. Appl. Sci. Environ. Manag. 2020, 24, 373–379. [Google Scholar] [CrossRef]
  80. Fagbeja, M.; Olumide, O.; Rabiu, B. An Overview of AQ Monitoring and Prediction in Nigeria. 2017. Available online: https://docplayer.net/88477418-An-overview-of-aq-monitoring-and-prediction-in-nigeria.html (accessed on 7 November 2021).
  81. Federal Ministry of Youths and Sports. National Youth Policy. Enhancing Youth Development and Participation in the Context of Sustainable Development. 2019. Available online: https://www.prb.org/wp-content/uploads/2020/06/Nigeria-National-Youth-Policy-2019-2023.pdf (accessed on 7 November 2021).
  82. Wiedmaier, B. Post Hoc Tests. In The SAGE Encyclopedia of Communication Research Methods; SAGE Publications: Thousand Oaks, CA, USA, 2017. [Google Scholar] [CrossRef]
  83. Xia, Y. Correlation, and association analyses in microbiome study integrating multiomics in health and disease. Prog. Mol. Biol. Transl. Sci. 2020, 171, 309–491. [Google Scholar] [CrossRef]
  84. Oltra, C.; Sala, R. A Review of the Social Research on Public Perception and Engagement Practices in Urban Air Pollution; CIEMAT/Departamento de Medio Ambiente: Madrid, Spain, 2014. [Google Scholar]
  85. Bickerstaff, K.; Walker, G. Public understandings of air pollution: The ‘localisation’ of environmental risk. Glob. Environ. Chang. 2001, 11, 133–145. [Google Scholar] [CrossRef]
  86. Conti, C.; Guarino, M.; Bacenetti, J. Measurements techniques and models to assess odour annoyance: A review. Environ. Int. 2020, 134, 105261. [Google Scholar] [CrossRef] [PubMed]
  87. Bickerstaff, K. Risk perception research: Socio-cultural perspectives on the public experience of air pollution. Environ. Int. 2004, 30, 827–840. [Google Scholar] [CrossRef] [PubMed]
  88. Smallbone, K. Individuals’ Interpretation of Air Quality Information. 2019. Available online: https://research.brighton.ac.uk/files/336785/1210261047_Individuals_interpretation_of_air_quality_information_customer_insight_and_awareness_study.pdf (accessed on 6 October 2021).
  89. Cometto-Muñiz, J.; Cain, W. Part iii. Assessing irritation: Sensory irritation: Relation to indoor air pollution. Ann. N. Y. Acad. Sci. 1992, 641, 137–151. [Google Scholar] [CrossRef] [PubMed]
  90. Golden, R.; Holm, S. Indoor Air Quality and Asthma: Has Unrecognized Exposure to Acrolein Confounded Results of Previous Studies? Dose Response 2017, 48, 314–315. [Google Scholar] [CrossRef] [Green Version]
  91. Nielsen, G.D.; Wolkoff, P. Evaluation of airborne sensory irritants for setting exposure limits or guidelines: A systematic approach. Regul. Toxicol. Pharmacol. 2017, 90, 308–317. [Google Scholar] [CrossRef]
  92. Ancelet, T.; Davy, P.K.; Trompetter, W.J.; Markwitz, A. Sources of particulate matter pollution in a small New Zealand city. Atmos. Pollut. Res. 2014, 5, 572–580. [Google Scholar] [CrossRef] [Green Version]
  93. Jacobi, P.R. Households and Environment in the City of Sao-Paulo—Problems, Perceptions and Solutions. Environ. Urban. 1994, 6, 87–110. [Google Scholar] [CrossRef] [Green Version]
  94. Emodi, E.E. Environmental degradations, strategies and effective management practices in Enugu, Nigeria. Merit Res. J. 2017, 5, 35–45. [Google Scholar]
  95. Eze, C.T.; Ugwoke, J.L.; Ugwoke, J.J. Road traffic congestion and vehicular emission in Enugu urban Nigeria. Environ. Biotechnol. J. 2019, 38, 1–8. [Google Scholar]
  96. Ndoke, P.N.; Akpan, U.G.; Kato, M. Contributions of Vehicular Traffic to Carbon Dioxide Emissions in Kaduna and Abuja, Northern Nigeria. 2006. Available online: https://www.semanticscholar.org/paper/Contributions-of-Vehicular-Traffic-to-Carbon-in-and-Ndoke-Akpan/7b30e54f4ba1a5d2851460a0e460af583f91bd40 (accessed on 12 October 2021).
  97. Hassan, S.; Okobia, L. Survey of ambient air quality in some parts of the Federal Capital Territory, Abuja, Nigeria. J. Geogr. Dev. 2008, 2, 3–17. [Google Scholar]
  98. Wambebe, N.; Xiaoli, D. Ambient Air Quality Assessment within Abuja Municipal Area, Nigeria. Environ. Epidemiol. 2019, 3, 421. [Google Scholar] [CrossRef]
  99. World Health Organization. Promoting Walking and Cycling. Available online: https://www.who.int/activities/promoting-walking-and-cycling (accessed on 4 December 2021).
  100. Ukiwo, U. Violence, Identity Mobilization and the Reimagining of Biafra. Afr. Dev. 2009, 34, 9–30. [Google Scholar] [CrossRef] [Green Version]
  101. Onuoha, G. The presence of the past: Youth, memory making and the politics of self-determination in Southeastern Nigeria. Ethn. Racial Stud. 2013, 36, 2182–2199. [Google Scholar] [CrossRef]
  102. Njoku, R. African Cultural Values; Taylor and Francis: London, UK, 2013. [Google Scholar]
  103. Agbaji, D.; Akhabue, G.; Duruaku, D.; Egor, F.; Ogban, K.; Pepple, U. Combating Youth Restiveness in Nigeria: Proferring Workable Solutions. Am. J. Humanit. Soc. Sci. Res. 2018, 2, 65–73. [Google Scholar]
  104. Bello, D.T.T. The Role of the Youth in the Electoral Process in Nigeria Politics: From Historical Appraisal. IOSR J. Humanit. Soc. Sci. IOSR-JHSS 2019, 24, 18–29. [Google Scholar] [CrossRef]
  105. Venter, Z.S.; Aunan, K.; Chowdhury, S.; Lelieveld, J. COVID-19 lockdowns cause global air pollution declines. Proc. Natl. Acad. Sci. USA 2020, 117, 18984–18990. [Google Scholar] [CrossRef]
  106. Agarwal, A.; Kaushik, A.; Kumar, S.; Mishra, R.K. Comparative study on air quality status in Indian and Chinese cities before and during the COVID-19 lockdown period. Air Qual. Atmos. Health 2020, 13, 1167–1178. [Google Scholar] [CrossRef]
  107. Sharma, S.; Zhang, M.; Anshika; Gao, J.; Zhang, H.; Kota, S.H. Effect of restricted emissions during COVID-19 on air quality in India. Sci. Total. Environ. 2020, 728, 138878. [Google Scholar] [CrossRef]
  108. Anil, I.; Alagha, O. The impact of COVID-19 lockdown on the air quality of Eastern Province, Saudi Arabia. Air Qual. Atmos. Health 2021, 14, 117–128. [Google Scholar] [CrossRef] [PubMed]
  109. Olusola, J.A.; Shote, A.A.; Isaifan, R.J.; Ouigmane, A. The impact of COVID-19 pandemic on nitrogen dioxide levels in Nigeria. PeerJ 2021, 9, e11387. [Google Scholar] [CrossRef] [PubMed]
  110. Mogaji, E. Impact of COVID-19 on transportation in Lagos, Nigeria. Transp. Res. Interdiscip. Perspect. 2020, 6, 100154. [Google Scholar] [CrossRef] [PubMed]
Figure 1. Locations of Abuja (federal capital) and Enugu (state capital of Enugu State) in Nigeria, West Africa.
Sustainability 14 01438 g001
Figure 2. (a) Perceptual Indicators of PAQ in Abuja. (b) Perceptual Indicators of PAQ in Enugu. Numbers on the horizontal axis are the ranks for the perceptual indicators. Error bars are the 95% confidence interval for the means. Horizontal bars (and numbers) are the groups identified via the Hochberg post hoc test as significant at p < 0.05.
Sustainability 14 01438 g002
Figure 3. (a) Residents’ perception of sources of PAQ in Abuja. (b) Residents’ perception of sources of PAQ in Enugu. Numbers on the horizontal axis are the ranks for the perceptual indicators. Error bars are the 95% confidence interval for the means. Horizontal bars (and numbers) are the groups identified via the Hochberg post hoc test as significant at p < 0.05.
Sustainability 14 01438 g003
Figure 4. (a). Residents’ perception of control measures for PAQ in Abuja. (b). Residents’ perception of control measures for PAQ in Enugu. Numbers on the horizontal axis are the ranks for the perceptual indicators. Error bars are the 95% confidence interval for the means. Horizontal bars (and numbers) are the groups identified via the Hochberg post hoc test as significant at p < 0.05.
Sustainability 14 01438 g004
Figure 5. (a). Residents’ perception of primary responsibility for PAQ control in Abuja. (b). Residents’ perception of primary responsibility for PAQ control in Enugu. Numbers on the horizontal axis are the ranks for the perceptual indicators. Error bars are the 95% confidence interval for the means. Horizonal bars (and numbers) are the groups identified via the Hochberg post hoc test as significant at p < 0.05.
Sustainability 14 01438 g005
Table 1. Focal points of the national action plan to reduce short-lived climate pollutants (SLCP) in Nigeria.
Source SectorSLCP Abatement Measures
Transport
  • Renewal of urban bus fleet in Lagos.
  • Adoption of CNG Buses in Nigeria.
  • Introduction of low Sulphur Diesel and Petrol.
  • Elimination of high emitting vehicles that do not meet vehicle emission standards.
  • Reduction of vehicle journeys by car through transport modal shifts.
Residential
  • Increase in population using modern fuels for cooking (LPG, electricity, kerosene, biogas, solar cookers).
  • Replacement of traditional biomass cookstoves with more efficient improved biomass stoves.
  • Elimination of kerosene lamps.
Oil and Gas
  • Elimination of gas flaring.
  • Fugitive emissions/leakages control.
  • Methane leakage reduction.
Industry
  • Improved energy efficiency in industrial sector
Waste Management
  • Reduction of methane emissions and open burning of waste at open dumpsites through the adoption of digesters at dumpsites.
  • Septic sludge collection.
  • Sewerage systems and municipal wastewater treatment plants.
Agriculture
  • Increased adoption of intermittent aeration of rice paddy fields (AWD).
  • Reduce open-field burning of crop residues.
  • Reduce methane emissions from enteric fermentation.
Power (Energy)
  • Expansion of national electricity coverage.
  • Increase share of electricity generated in Nigeria from renewables.
HFCs
  • Elimination of HFC consumption.
Source: CCAC and UNEP (2018).
Table 2. Organisations responsible for the monitoring and control of air quality in Nigeria.
OrganisationMissionDate of Establishment
Federal Ministry of Environment
  • NESREA (National Environmental Standards Regulations and Enforcement Agency).
Established to ensure environmental protection, natural resources conservation and sustainable development. These include responsibilities for environmental and air quality monitoring and regulatory activities.FMEnv (June 1999)
NESREA (30 July 2007)
NIMET (Nigerian Meteorological Agency).To observe, collate, collect, process and disseminate all meteorological data and information within and outside Nigeria.23 May 2003
State ministries of environment.Subsidiaries of the federal ministry of environment in the 36 states including the FCT that monitor and ensure a better environment including cleaner air.
Research institutions.
  • Universities
Research on the environment including air quality.
National Space Research and Development Agency (NASRDA).
  • Centre for Atmospheric Research (CAR).
Monitoring the environment using satellite. CAR is the Research and Development activity Centre of NASRDA that is committed to research and capacity building in atmospheric sciences.5 May 1999
Table 3. Demographic characteristics of the participants including the number of respondents in the groups (percentage of the sample in parentheses).
CharacteristicsAbuja (N = 137)Enugu (N = 125)
Gender of respondents
Male76 (55%)63 (50%)
Female61 (45%)62 (50%)
Age of respondents (cohort)
18–3461 (45%)60 (45%)
35 and over76 (55%)65 (55%)
Average monthly income (₦) of respondents
No income12 (9%)13 (10%)
Under 10,0007 (5%)5 (4%)
11,000–30,00015 (11%)21 (17%)
31,000–50,00023 (17%)29 (23%)
51,000–100,00024 (18%)39 (31%)
Over 100,00056 (40%)18 (15%)
Highest education qualification of respondents
None0 (0%)0 (0%)
Primary1 (1%)0 (0%)
Secondary27 (20%)25 (20%)
Bachelor/Diploma or equivalent59 (43%)78 (62%)
Master or equivalent48 (35%)18 (15%)
PhD or equivalent2 (1%)4 (3%)
Main occupation of respondents
Student15 (1%)13 (10%)
Unemployed4 (3%)7 (6%)
Employed (daily wage)7 (5%)2 (2%)
Employed (weekly wage)2 (1%)1 (1%)
Employed (monthly wage)84 (63%)76 (60%)
Self-employed17 (12%)25 (20%)
Housewife5 (3%)0 (0%)
Retired3 (2%)1 (1%)
Main modes of transportation used by respondents
Walking16 (12%)5 (4%)
Bicycle2 (1%)0 (0%)
Motorcycle11 (8%)2 (2%)
Car taxi31 (23%)10 (8%)
Tricycle taxi (Keke)6 (4%)33 (26%)
Motorcycle taxi (Okada)7 (5%)1 (1%)
Public bus8 (6%)52 (41%)
Train0 (0%)0 (0%)
Personal car56 (41%)22 (18%)
Table 4. Summary of the main survey questions and the Likert scale answers.
Likert Scale Scores
Questions12345
Perceived Indicators of PAQmost usedusedneutralrarely usedleast used
Sources of PAQstrongly agreeagreeneutraldisagreestrongly disagree
Effectiveness of control measures for PAQextremely effectivevery effectivemoderately effectiveslightly effectiveleast effective
Organisation/group who should take primary responsibility for controlling PAQstrongly agreeagreeneutraldisagreestrongly disagree
Table 5. Results of the Kruskal–Wallis tests for significant differences within the demographic groups in Abuja and Enugu for the scoring of perceptual indicators of PAQ.
Perceptual
Indicators
Sample Demographic Characteristics
CitiesGenderAgeIncomeEducationOccupationTransportation
VisibilityAbuja0.15 ns7.29 ns4.24 ns5.15 ns13.70 ns4.27 ns
Enugu0.27 ns10.22 ns5.53 ns4.75 ns4.96 ns6.02 ns
Smell/odourAbuja0.06 ns5.76 ns16.30 **9.10 ns7.50 ns6.16 ns
Enugu0.83 ns7.85 ns4.12 ns1.66 ns5.97 ns3.51 ns
Dust particles in the airAbuja1.17 ns4.16 ns13.07 *7.16 ns5.33 ns6.98 ns
Enugu0.00 ns10.22 ns5.94 ns5.74 ns7.48 ns5.07 ns
Dirt on skin/clothesAbuja1.28 ns8.04 ns5.61 ns4.42 ns8.63 ns4.09 ns
Enugu5.13 *8.89 ns4.64 ns0.88 ns5.16 ns13.57 *
Dirt on surfaces e.g., cars, buildingsAbuja1.51 ns3.77 ns5.40 ns8.02 ns12.09 ns11.97 ns
Enugu2.96 ns8.99 ns5.93 ns1.80 ns5.01 ns10.98 ns
SmokeAbuja0.85 ns4.85 ns8.27 ns4.76 ns11.87 ns7.48 ns
Enugu0.58 ns7.37 ns3.58 ns0.88 ns9.02 ns10.94 ns
Sneezing/coughingAbuja1.22 ns8.48 ns4.26 ns5.69 ns3.21 ns2.64 ns
Enugu0.02 ns7.69 ns2.91 ns3.83 ns10.85 ns4.83 ns
Skin irritationAbuja0.29 ns2.577 ns3.38 ns2.82 ns3.93 ns4.45 ns
Enugu1.35 ns8.04 ns1.41 ns1.39 ns7.20 ns7.49 ns
Watery and itching eyesAbuja1.58 ns11.01 ns3.97 ns3.35 ns3.27 ns8.27 ns
Enugu2.93 ns3.99 ns1.16 ns4.62 ns3.02 ns6.57 ns
* p ≤ 0.05; ** p ≤ 0.01; ns = not significant (p > 0.05). Highlighted cells indicate the presence of statistically significant differences in the scoring of the perceptual indicator.
Table 6. Kruskal–Wallis test results for demographics and sources of poor air quality (PAQ) for Abuja and Enugu.
Sources of PAQCitiesGenderAgeIncomeEducationOccupationTransportation
Air transportationAbuja3.37 ns1.486 ns6.211 ns5.772 ns7.701 ns7.729 ns
Enugu2.580 ns2.725 ns15.887 **8.347 *2.816 ns9.393 ns
CarsAbuja1.172 ns6.804 ns3.696 ns1.042 ns6.092 ns8.464 ns
Enugu8.415 **5.942 ns7.383 ns2.622 ns5.661 ns8.512 ns
BusesAbuja0.784 ns14.992 *4.543 ns0.569 ns4.785 ns9.180 ns
Enugu6.435 *8.372 ns5.905 ns3.03 ns3.278 ns3.411 ns
TrucksAbuja0.326 ns9.128 ns2.618 ns1.831 ns7.196 ns9.918 ns
Enugu4.969 *5.478 ns8.516 ns0.964 ns5.805 ns4.305 ns
MotorcyclesAbuja0.192 ns3.657 ns6.692 ns2.292 ns7.038 ns1.840 ns
Enugu10.004 **12.842 *9.582 ns1.892 ns3.548 ns4.956 ns
TricyclesAbuja0.053 ns7.858 ns4.389 ns2.778 ns10.196 ns9.880 ns
Enugu2.597 ns3.992 ns6.332 ns1.456 ns6.177 ns5.031 ns
Power/energy generatorsAbuja5.548 *6.094 ns3.895 ns3.084 ns6.045 ns9.459 ns
Enugu1.174 ns4.327 ns12.426 *7.020 ns11.955 ns3.104 ns
Petrol/gas stationsAbuja0.052 ns5.209 ns1.728 ns2.991 ns3.52 ns10.863 ns
Enugu0.196 ns7.732 ns5.163 ns1.783 ns7.238 ns8.532 ns
Manufacturing industriesAbuja1.923 ns4.004 ns0.652 ns3.201 ns9.514 ns5.253 ns
Enugu8.842 **12.591 *1.298 ns0.703 ns12.646 *8.785 ns
Oil productionAbuja1.217 ns7.143 ns0.414 ns4.204 ns9.684 ns7.362 ns
Enugu3.961 ns7.358 ns11.003 ns5.628 ns8.559 ns6.575 ns
CookingAbuja0.042 ns5.513 ns5.451 ns4.255 ns8.049 ns3.760 ns
Enugu0.142 ns16.798 **5.734 ns3.808 ns5.831 ns5.482 ns
Bush fireAbuja0.069 ns5.754 ns4.258 ns1.796 ns4.529 ns8.672 ns
Enugu3.014 ns10.147 ns14.971 *6.488 ns9.348 ns6.603 ns
Building/road constructionAbuja0.460 ns3.784 ns8.784 ns2.194 ns7.106 ns6.427 ns
Enugu2.947 ns2.398 ns5.125 ns0.477 ns5.651 ns9.623 ns
Rail transportationAbuja0.186 ns5.172 ns4.188 ns2.658 ns3.129 ns9.384 ns
Enugu0.419 ns6.26 ns2.3731.618 ns5.192 ns1.525 ns
Dry-cleaning facilitiesAbuja0.186 ns4.060 ns11.903 *6.455 ns3.003 ns9.071 ns
Enugu0.065 ns5.908 ns4.246 ns4.859 ns9.94 ns4.023 ns
Waste disposalAbuja4.075 *2.288 ns5.368 ns1.205 ns7.069 ns8.680 ns
Enugu2.196 ns10.184 ns11.774 *5.894 ns12.964 *11.843 ns
Waste burningAbuja0.017 ns1.294 ns7.369 ns2.010 ns6.665 ns7.659 ns
Enugu3.752 ns14.999 *7.77 ns7.741 ns5.406 ns7.089 ns
Figures in the table are the Kruskal–Wallis statistic. * p ≤ 0.05; ** p ≤ 0.01; ns = not significant. Highlighted cells indicate the presence of significant differences within the demographic group by the source of PAQ at p 0.05 or greater.
Table 7. Kruskal–Wallis test for Demographics (except age) and Control Measures for poor air quality (PAQ) in Abuja and Enugu.
Control MeasuresCitiesGenderIncomeEducationOccupationTransportation
Energy savingAbuja0.299 ns6.566 ns5.074 ns6.995 ns10.885 ns
Enugu2.112 ns6.602 ns4.835 ns10.895 ns10.423 ns
Reduce car useAbuja1.952 ns1.142 ns3.751 ns4.192 ns3.629 ns
Enugu0.265 ns4.649 ns0.354 ns10.072 ns8.017 ns
Reduce motorcycle useAbuja4.036 *3.686 ns2.598 ns3.653 ns5.439 ns
Enugu0.042 ns5.043 ns3.620 ns8.645 ns5.590 ns
Walking/cyclingAbuja0.177 ns6.784 ns5.129 ns6.717 ns3.126 ns
Enugu2.943 ns1.342 ns3.679 ns11.063 ns13.105 ns
Use of energy efficient productsAbuja1.216 ns1.233 ns5.194 ns4.173 ns4.704 ns
Enugu1.918 ns4.914 ns3.098 ns9.263 ns10.778 ns
Use of clean energyAbuja0.075 ns4.486 ns3.104 ns13.864 ns7.393 ns
Enugu0.298 ns7.016 ns6.427 ns14.945 *4.433 ns
Proper waste managementAbuja0.454 ns0.788 ns1.285 ns11.049 ns2.279 ns
Enugu0.935 ns5.103 ns4.491 ns5.690 ns7.665 ns
RegulationsAbuja0.098 ns2.038 ns2.402 ns11.884 ns1.066 ns
Enugu0.368 ns3.053 ns4.570 ns8.901 ns2.414 ns
Monitoring of AQAbuja0.017 ns4.404 ns4.760 ns9.775 ns3.155 ns
Enugu0.325 ns11.348 *4.600 ns13.385 *5.264 ns
Public awarenessAbuja0.243 ns1.811 ns5.776 ns12.98 ns3.540 ns
Enugu0.528 ns9.076 ns1.392 ns8.918 ns3.127 ns
Reduce and reuse productsAbuja1.862 ns0.494 ns2.878 ns5.870 ns2.753 ns
Enugu0.888 ns3.896 ns9.302 *7.678 ns4.824 ns
Avoid bush burningAbuja0.000 ns1.839 ns2.184 ns6.182 ns5.183 ns
Enugu0.618 ns1.544 ns5.605 ns4.307 ns7.631 ns
Tolls for vehiclesAbuja0.058 ns0.655 ns0.145 ns5.690 ns1.762 ns
Enugu0.052 ns5.218 ns4.074 ns7.213 ns5.203 ns
Parking charge for vehiclesAbuja2.360 ns12.883 *1.354 ns3.600 ns5.639 ns
Enugu2.185 ns1.569 ns0.581 ns8.760 ns5.690 ns
Reduce air travelAbuja4.142 *5.454 ns1.132 ns4.347 ns8.723 ns
Enugu0.710 ns3.391 ns1.784 ns11.287 ns7.437 ns
Use mass transitAbuja1.125 ns3.532 ns2.369 ns3.807 ns3.562 ns
Enugu1.696 ns6.984 ns3.119 ns9.053 ns15.114 *
Better vehicle maintenanceAbuja0.057 ns6.039 ns3.876 ns9.342 ns8.324 ns
Enugu0.153 ns4.984 ns2.354 ns8.542 ns5.742 ns
Figures in the table are the Kruskal–Wallis statistic * p ≤ 0.05; ns = not significant. Highlighted cells indicate the presence of significant differences within the demographic group by PAQ control measure at p 0.05 or greater.
Table 8. Mean scores, standard deviations (SD) and Kruskal–Wallis (KW) test results for age groups and control measures of PAQ for Abuja and Enugu.
AbujaEnugu
Control MeasuresAge GroupMean (SD)KWMean (SD)KW
Energy saving18–34 years3.16 (2.88)2.44 ns2.63 (1.24)13.04 ***
35 years and above4.04 (3.57)3.49 (1.30)
Reduce car use18–34 years4.28 (3.18)0.91 ns2.95 (1.14)8.19 **
35 years and above4.04 (3.17)3.58 (1.07)
Reduce motorcycle use18–34 years3.44 (2.56)0.00 ns2.78 (1.17)11.89 ***
35 years and above3.68 (3.03)3.54 (1.15)
Walking/cycling18–34 years3.79 (2.82)1.12 ns2.90 (1.37)4.54 *
35 years and above3.47 (2.71)3.42 (1.40)
Use of Energy efficient products18–34 years3.43 (3.14)2.10 ns2.20 (1.27)20.12 ***
35 years and above2.71 (2.38)3.18 (1.14)
Use of clean energy18–34 years2.75 (2.60)0.25 ns1.95 (1.13)14.77 ***
35 years and above2.72 (2.71)2.80 (1.29)
Proper waste management18–34 years2.31 (2.34)0.20 ns1.72 (1.11)14.66 ***
35 years and above2.09 (2.08)2.32 (1.09)
Regulations18–34 years2.56 (2.31)0.61 ns2.10 (1.18)4.87 *
35 years and above2.86 (2.69)2.54 (1.21)
Monitoring of AQ18–34 years2.93 (2.93)0.00 ns1.88 (1.17)18.72 ***
35 years and above3.01 (2.99)2.95 (1.45)
Public awareness18–34 years2.69 (2.67)0.15 ns1.85 (1.10)6.58 **
35 years and above2.97 (3.00)2.22 (1.07)
Reduce and reuse products18–34 years3.07 (2.93)1.12 ns2.18 (1.14)5.16 *
35 years and above3.14 (2.64)2.71 (1.31)
Avoid bush burning18–34 years2.03 (1.75)0.45 ns1.77 (1.05)7.07 **
35 years and above2.75 (3.03)2.25 (1.15)
Tolls for vehicles18–34 years4.15 (3.71)0.08 ns2.62 (1.30)5.71 *
35 years and above4.32 (3.80)3.15 (1.28)
Parking charge for vehicles18–34 years3.59 (3.12)0.23 ns3.02 (1.28)0.87 ns
35 years and above3.68 (3.02)3.18 (1.21)
Reduce air travel18–34 years4.48 (3.39)0.06 ns3.32 (1.19)3.54 ns
35 years and above4.41 (3.42)3.71 (1.09)
Use mass transit18–34 years3.93 (3.30)1.32 ns3.05 (1.19)7.57 **
35 years and above3.58 (3.21)3.62 (0.96)
Better vehicle maintenance18–34 years2.98 (2.91)1.18 ns1.95 (1.17)6.30 *
35 years and above2.79 (2.69)2.38 (1.16)
* p ≤ 0.05; ** p ≤ 0.01; *** p ≤ 0.001; ns = not significant. Highlighted cells indicate the presence of significant differences within the demographic group by PAQ control measure at p 0.05 or greater.
Table 9. Results of Kruskal–Wallis tests for a series of demographic groups (other than age) on the scores of agencies responsible for controlling poor air quality (PAQ) in Abuja and Enugu.
OrganizationCitiesGenderIncomeEducationOccupationTransportation
Federal GovernmentAbuja0.246 ns7.196 ns3.722 ns3.863 ns9.402 ns
Enugu0.252 ns11.970 *3.666 ns8.915 ns3.183 ns
FCT/State GovernmentAbuja0.973 ns5.817 ns4.729 ns9.587 ns8.261 ns
Enugu0.392 ns5.895 ns1.166 ns4.647 ns4.221 ns
Local Area Council/GovernmentAbuja2.112 ns5.378 ns0.702 ns4.949 ns5.164 ns
Enugu0.114 ns8.754 ns4.918 ns8.668 ns6.470 ns
Non-governmental OrganizationsAbuja0.000 ns3.842 ns2.947 ns2.730 ns6.532 ns
Enugu1.094 ns9.305 ns0.656 ns7.415 ns7.611 ns
Members of the PublicAbuja0.816 ns4.025 ns9.836 *15.573 *3.882 ns
Enugu0.173 ns2.399 ns7.763 ns9.107 ns7.970 ns
Figures in the table are the Kruskal–Wallis statistic * p ≤ 0.05; ns = not significant. Highlighted cells indicate the presence of significant differences within the demographic groups per organisation/people responsible for PAQ control measure at p 0.05 or greater.
Table 10. Means, standard deviations (SD) and Kruskal–Wallis test results for the age demographic group and primary responsibility for control of poor air quality (PAQ) in Abuja and Enugu.
AbujaEnugu
Organisation/AgencyAge GroupsMean (SD)KWMean (SD)KW
Federal Government18–34 years1.56 (0.79)0.37 ns2.02 (1.13)14.94 ***
35 years and above1.49 (0.72)2.85 (1.16)
FCT/State Government18–34 years1.62 (0.76)0.70 ns1.57 (0.93)10.86 ***
35 years and above1.49 (0.60)2.08 (0.94)
Local Area Council/Government18–34 years1.67 (0.77)0.30 ns1.72 (0.90)12.93 ***
35 years and above1.74 (0.82)2.31 (0.97)
Non–governmental Organizations18–34 years2.20 (1.09)0.12 ns1.98 (0.98)19.47 ***
35 years and above2.24 (1.02)2.78 (0.99)
Members of the Public18–34 years2.02 (1.20)0.08 ns1.68 (0.97)1.11 ns
35 years and above1.96 (1.16)1.97 (1.25)
** p ≤ 0.01; *** p ≤ 0.001; ns = not significant. Highlighted cells indicate the presence of significant differences within the age groups per organisation/people responsible for PAQ control measure at p 0.05 or greater.
Publisher’s Note: MDPI stays neutral with regard to jurisdictional claims in published maps and institutional affiliations.

