
Optimization of Eugenol, Camphor, and Terpineol Mixture Using Simplex-Centroid Design for Targeted Inhibition of Key Antidiabetic Enzymes

 ,
,  , , , ,
  , ,
, ,
Abstract
1. Introduction
2. Materials and Methods
2.1. Molecules and Enzymes
2.2. Antioxidant Activity
2.2.1. ABTS
2.2.2. Ferric-Reducing Antioxidant Power (FRAP)
2.2.3. Cupric Ion-Reducing Antioxidant Capacity Assay (CUPRAC)
2.3. Diabetes Enzymes Inhibitory Activities
2.3.1. α-Amylase Inhibition Assay
2.3.2. α-Glucosidase Inhibition Assay
2.3.3. Lipase Inhibition Assay
2.3.4. Aldose Reductase Activity
2.4. Experimental Design
2.4.1. Mixture Design
2.4.2. Experimental Matrix and Mathematical Model
2.5. Statistical Analysis
2.6. Optimization Tools
3. Results and Discussion
3.1. Antioxidant Activity of Eugenol, Camphor, and Terpineol
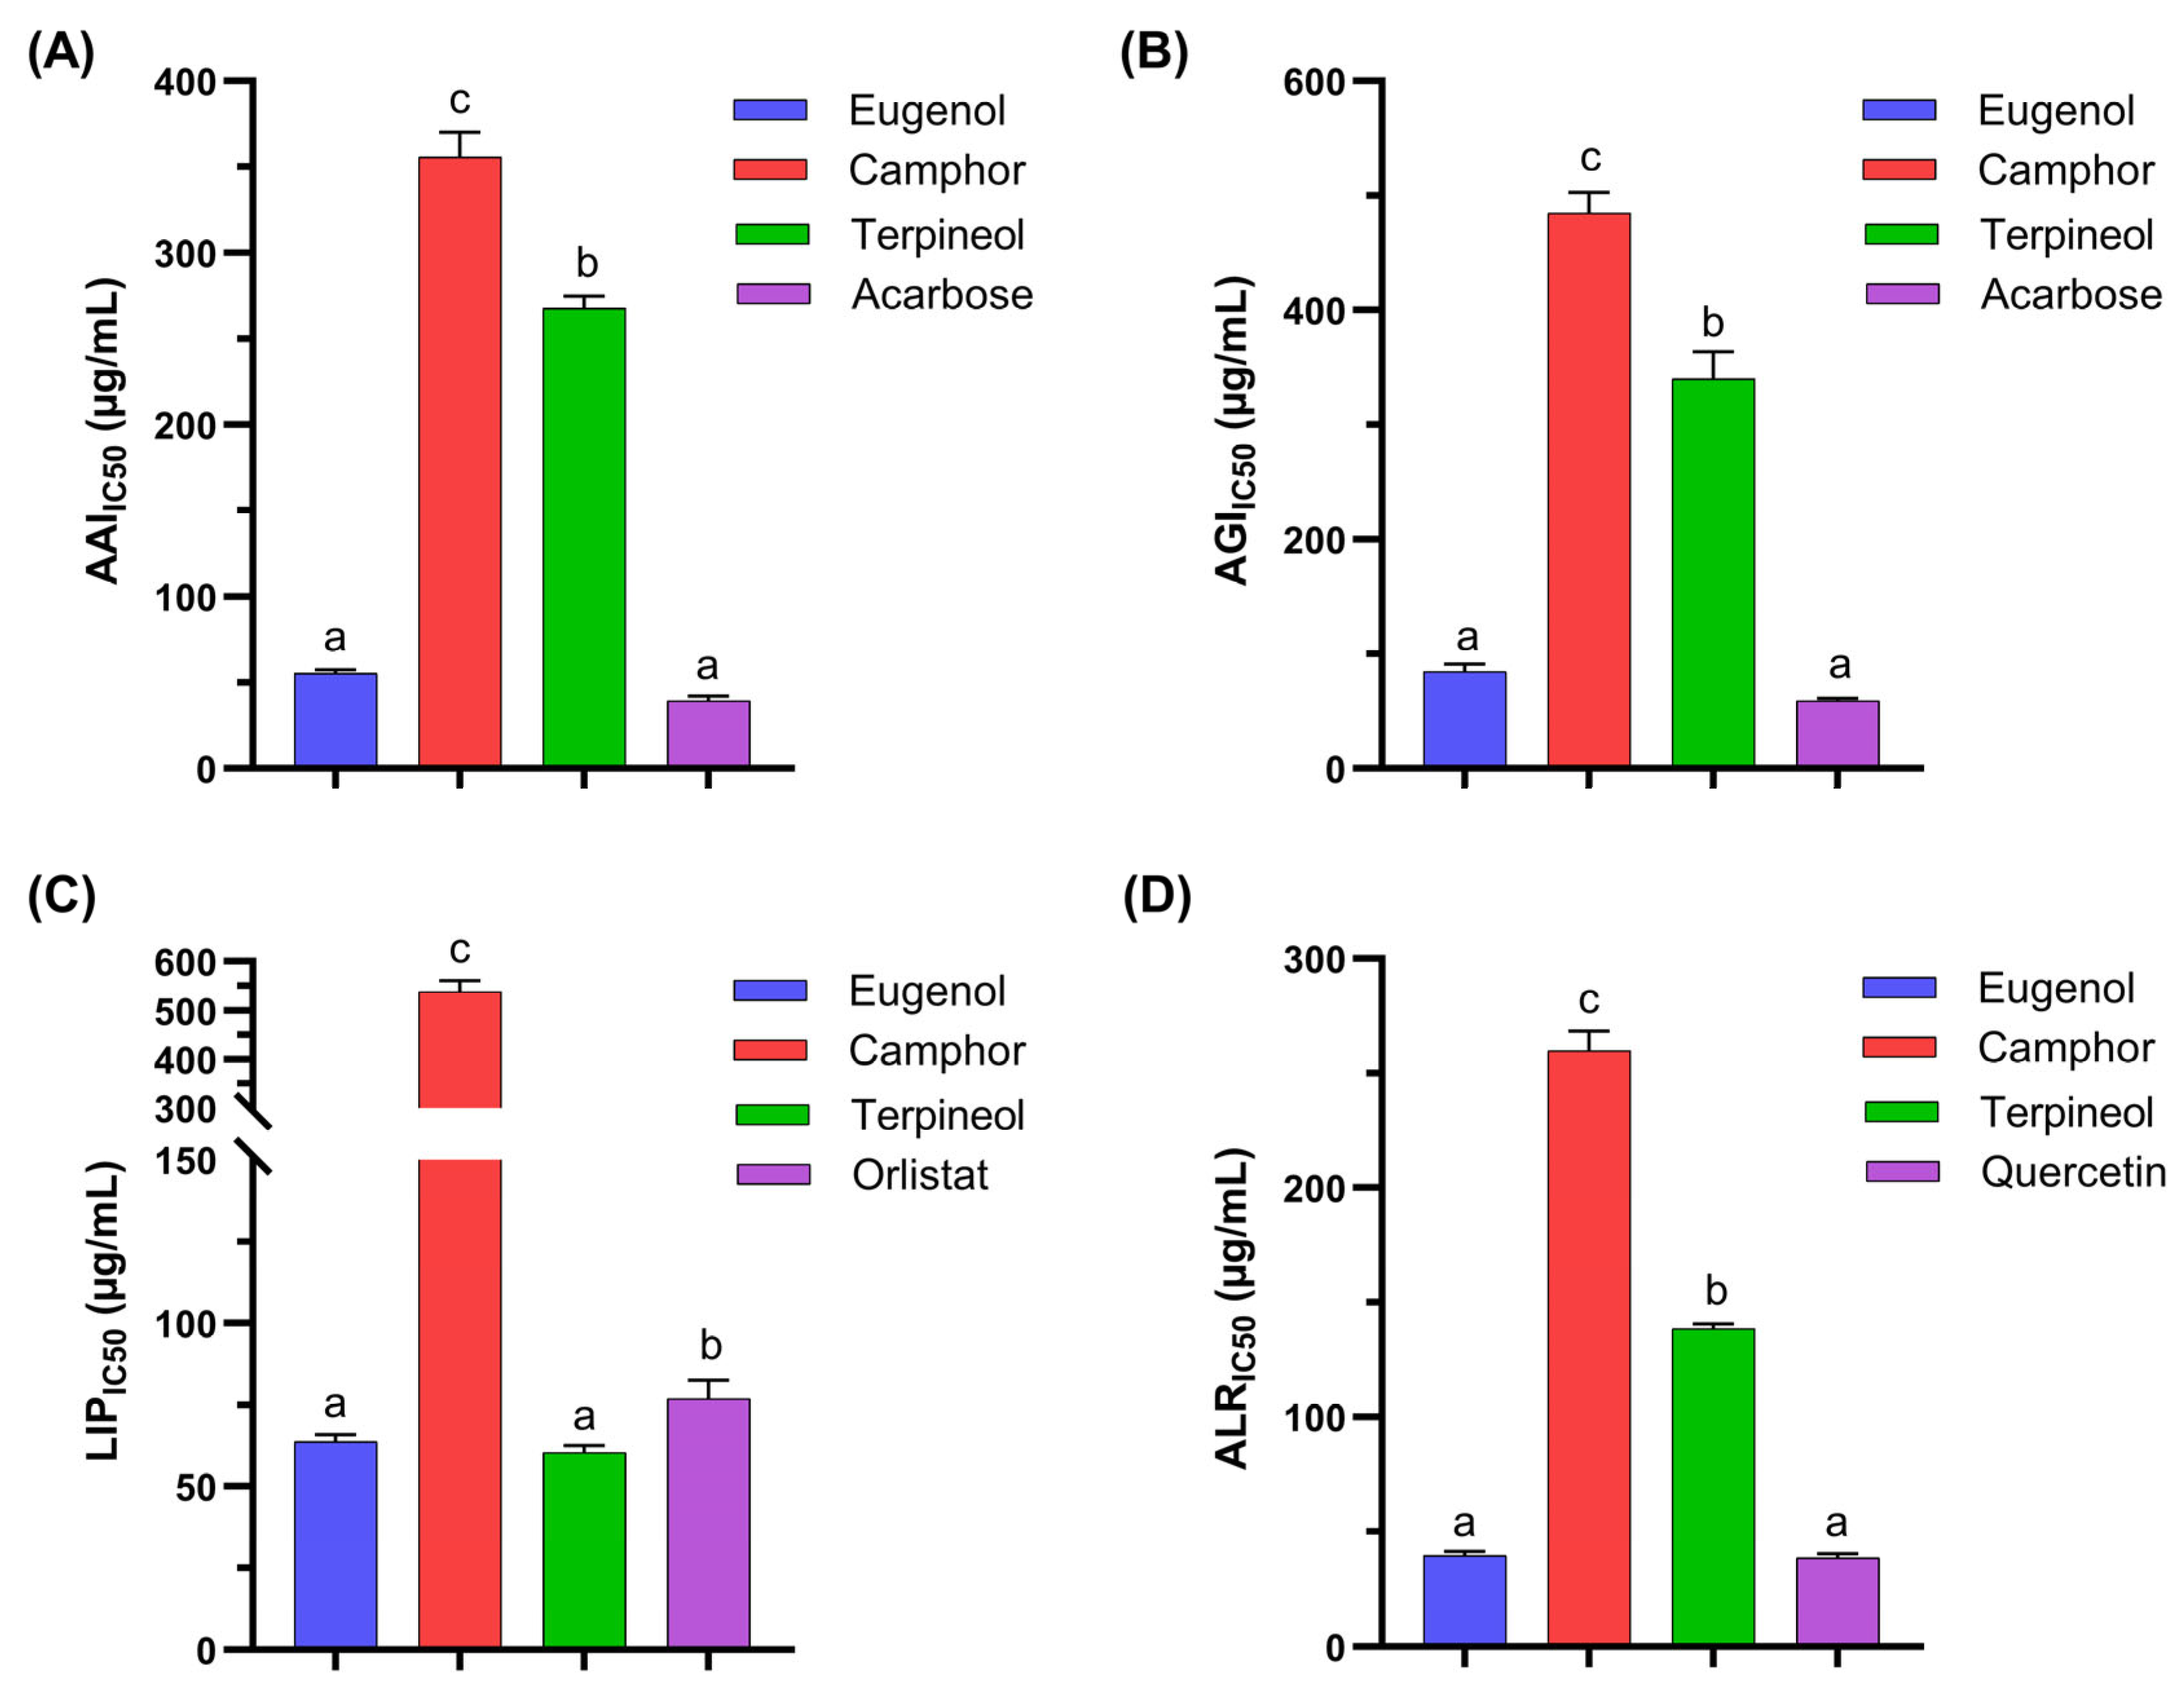
3.2. Antidiabetic Activity of Individual Molecules
3.3. Simplex-Centroid Design
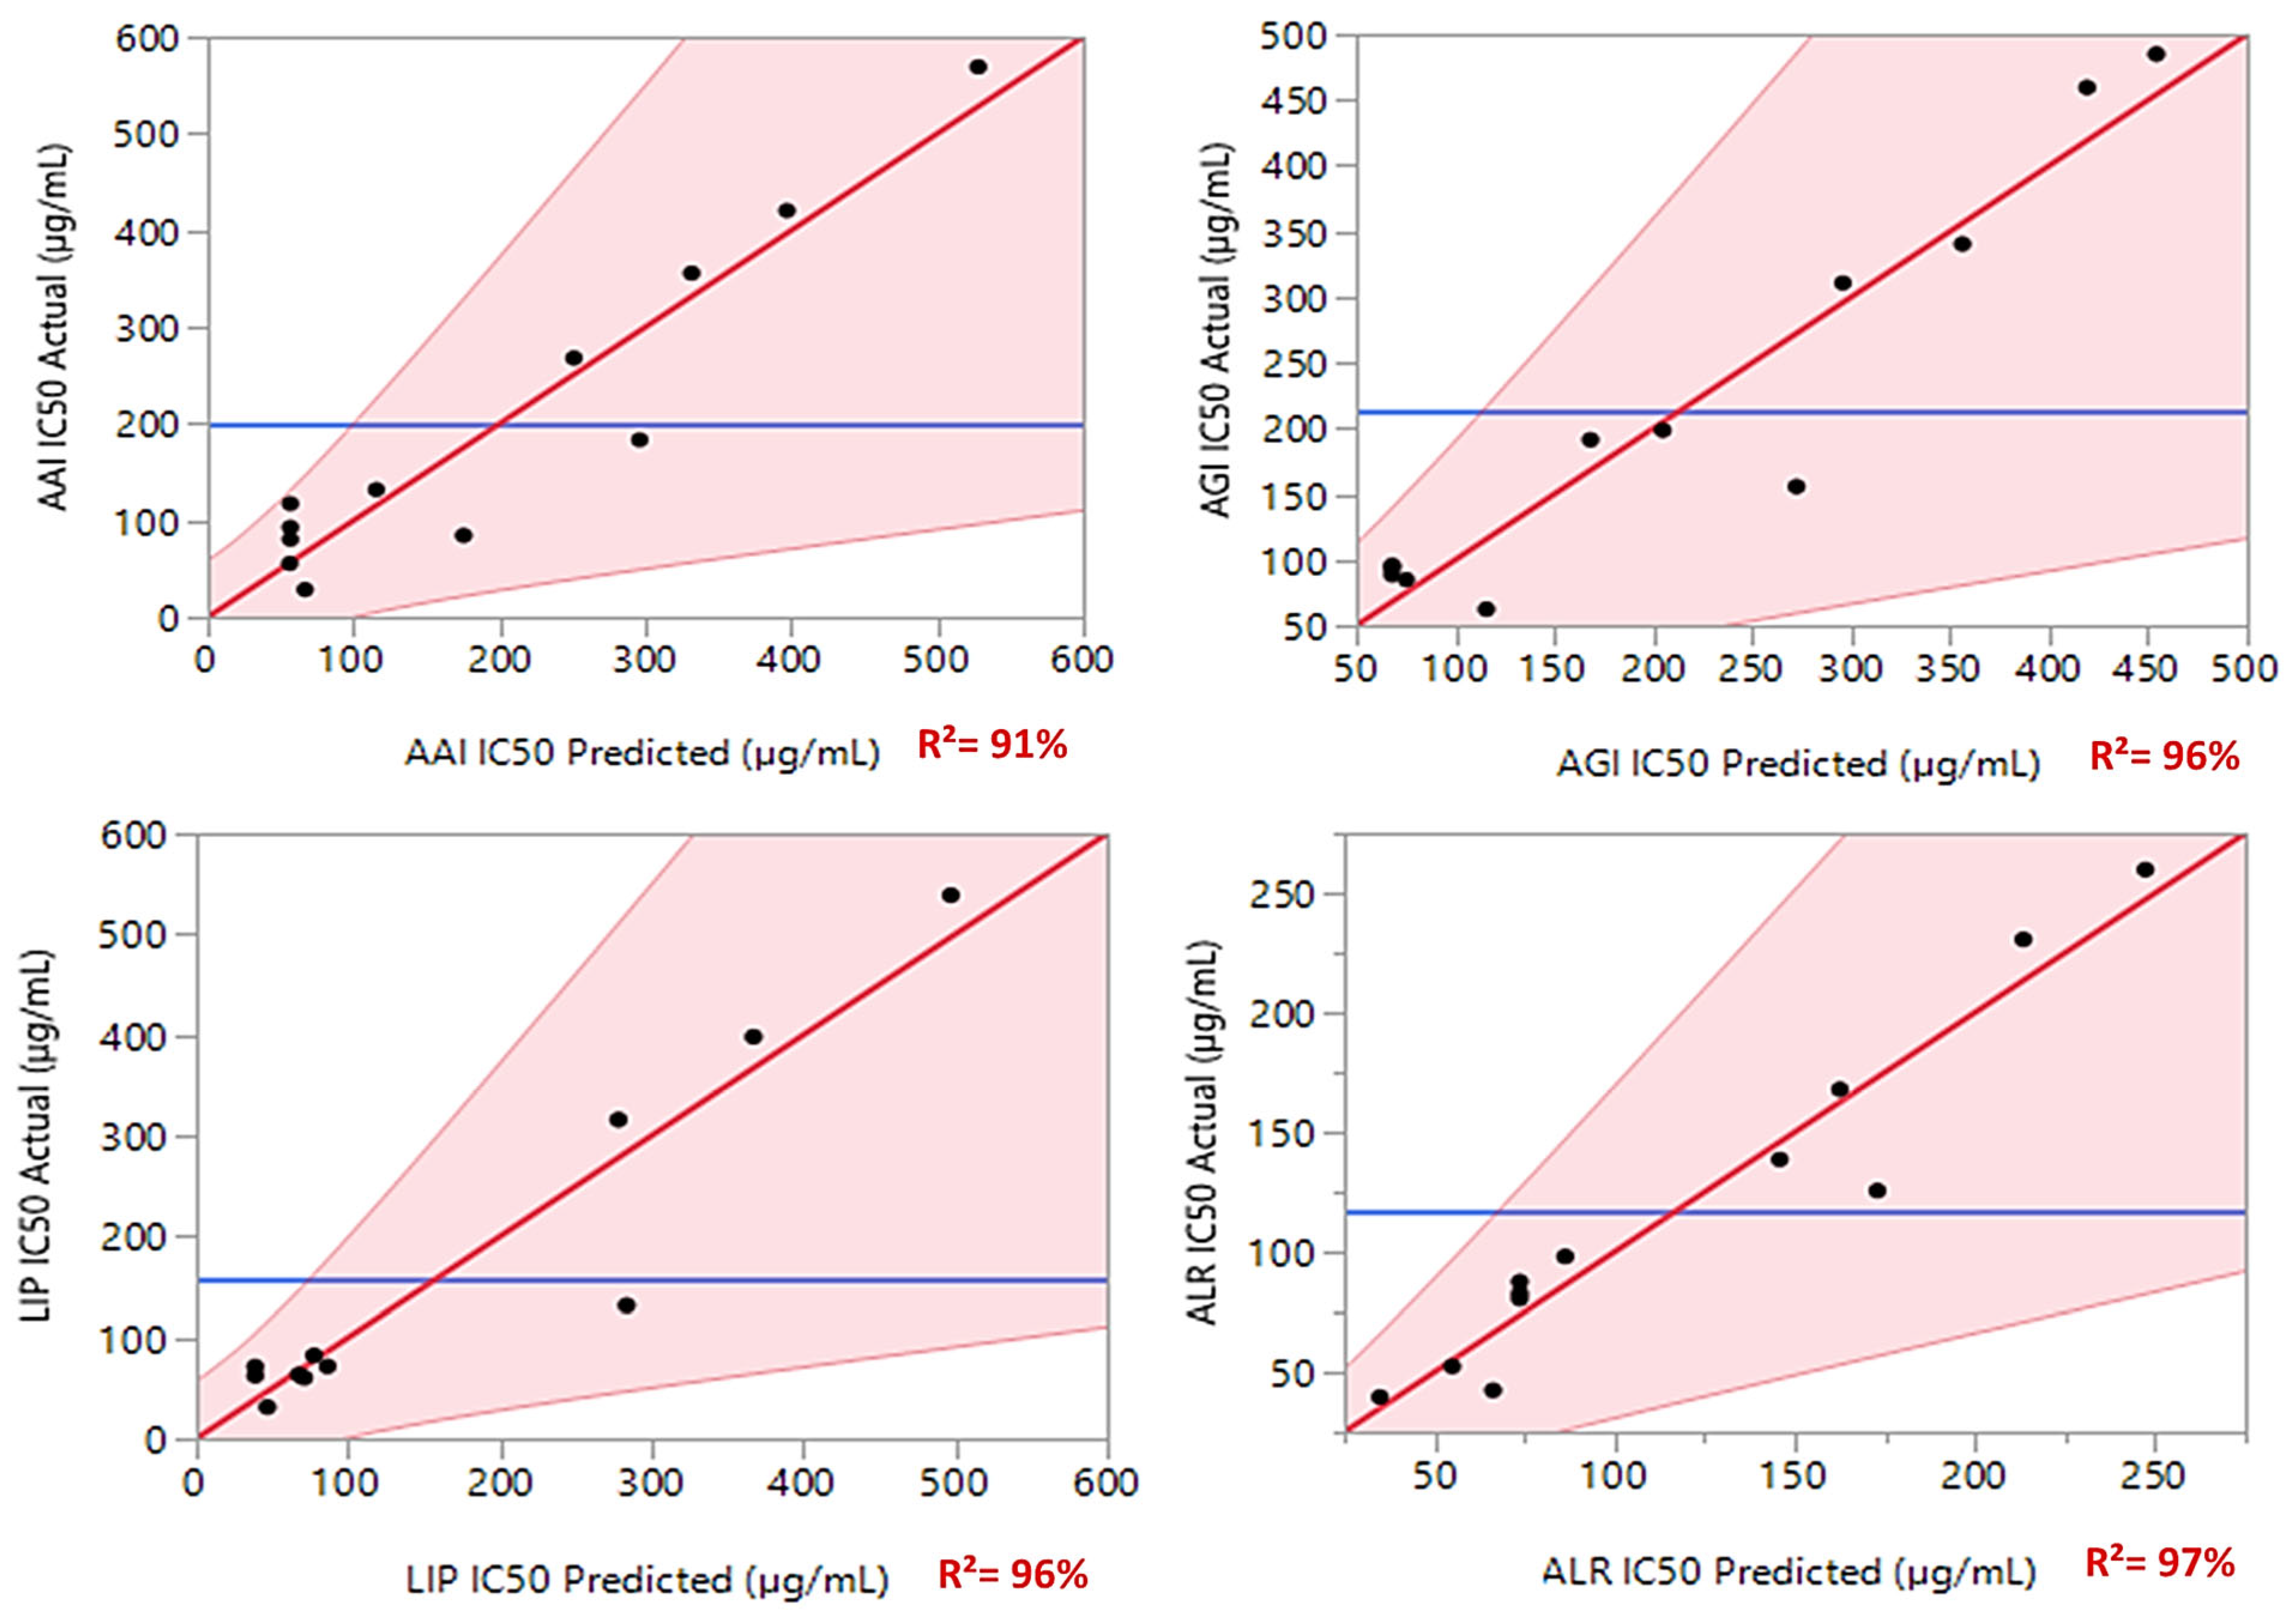
3.4. Variance Analysis of the Fitted Models
3.5. Components Effects and Adjusted Models
3.6. Optimization of Diabetes-Linked Enzymes Inhibition
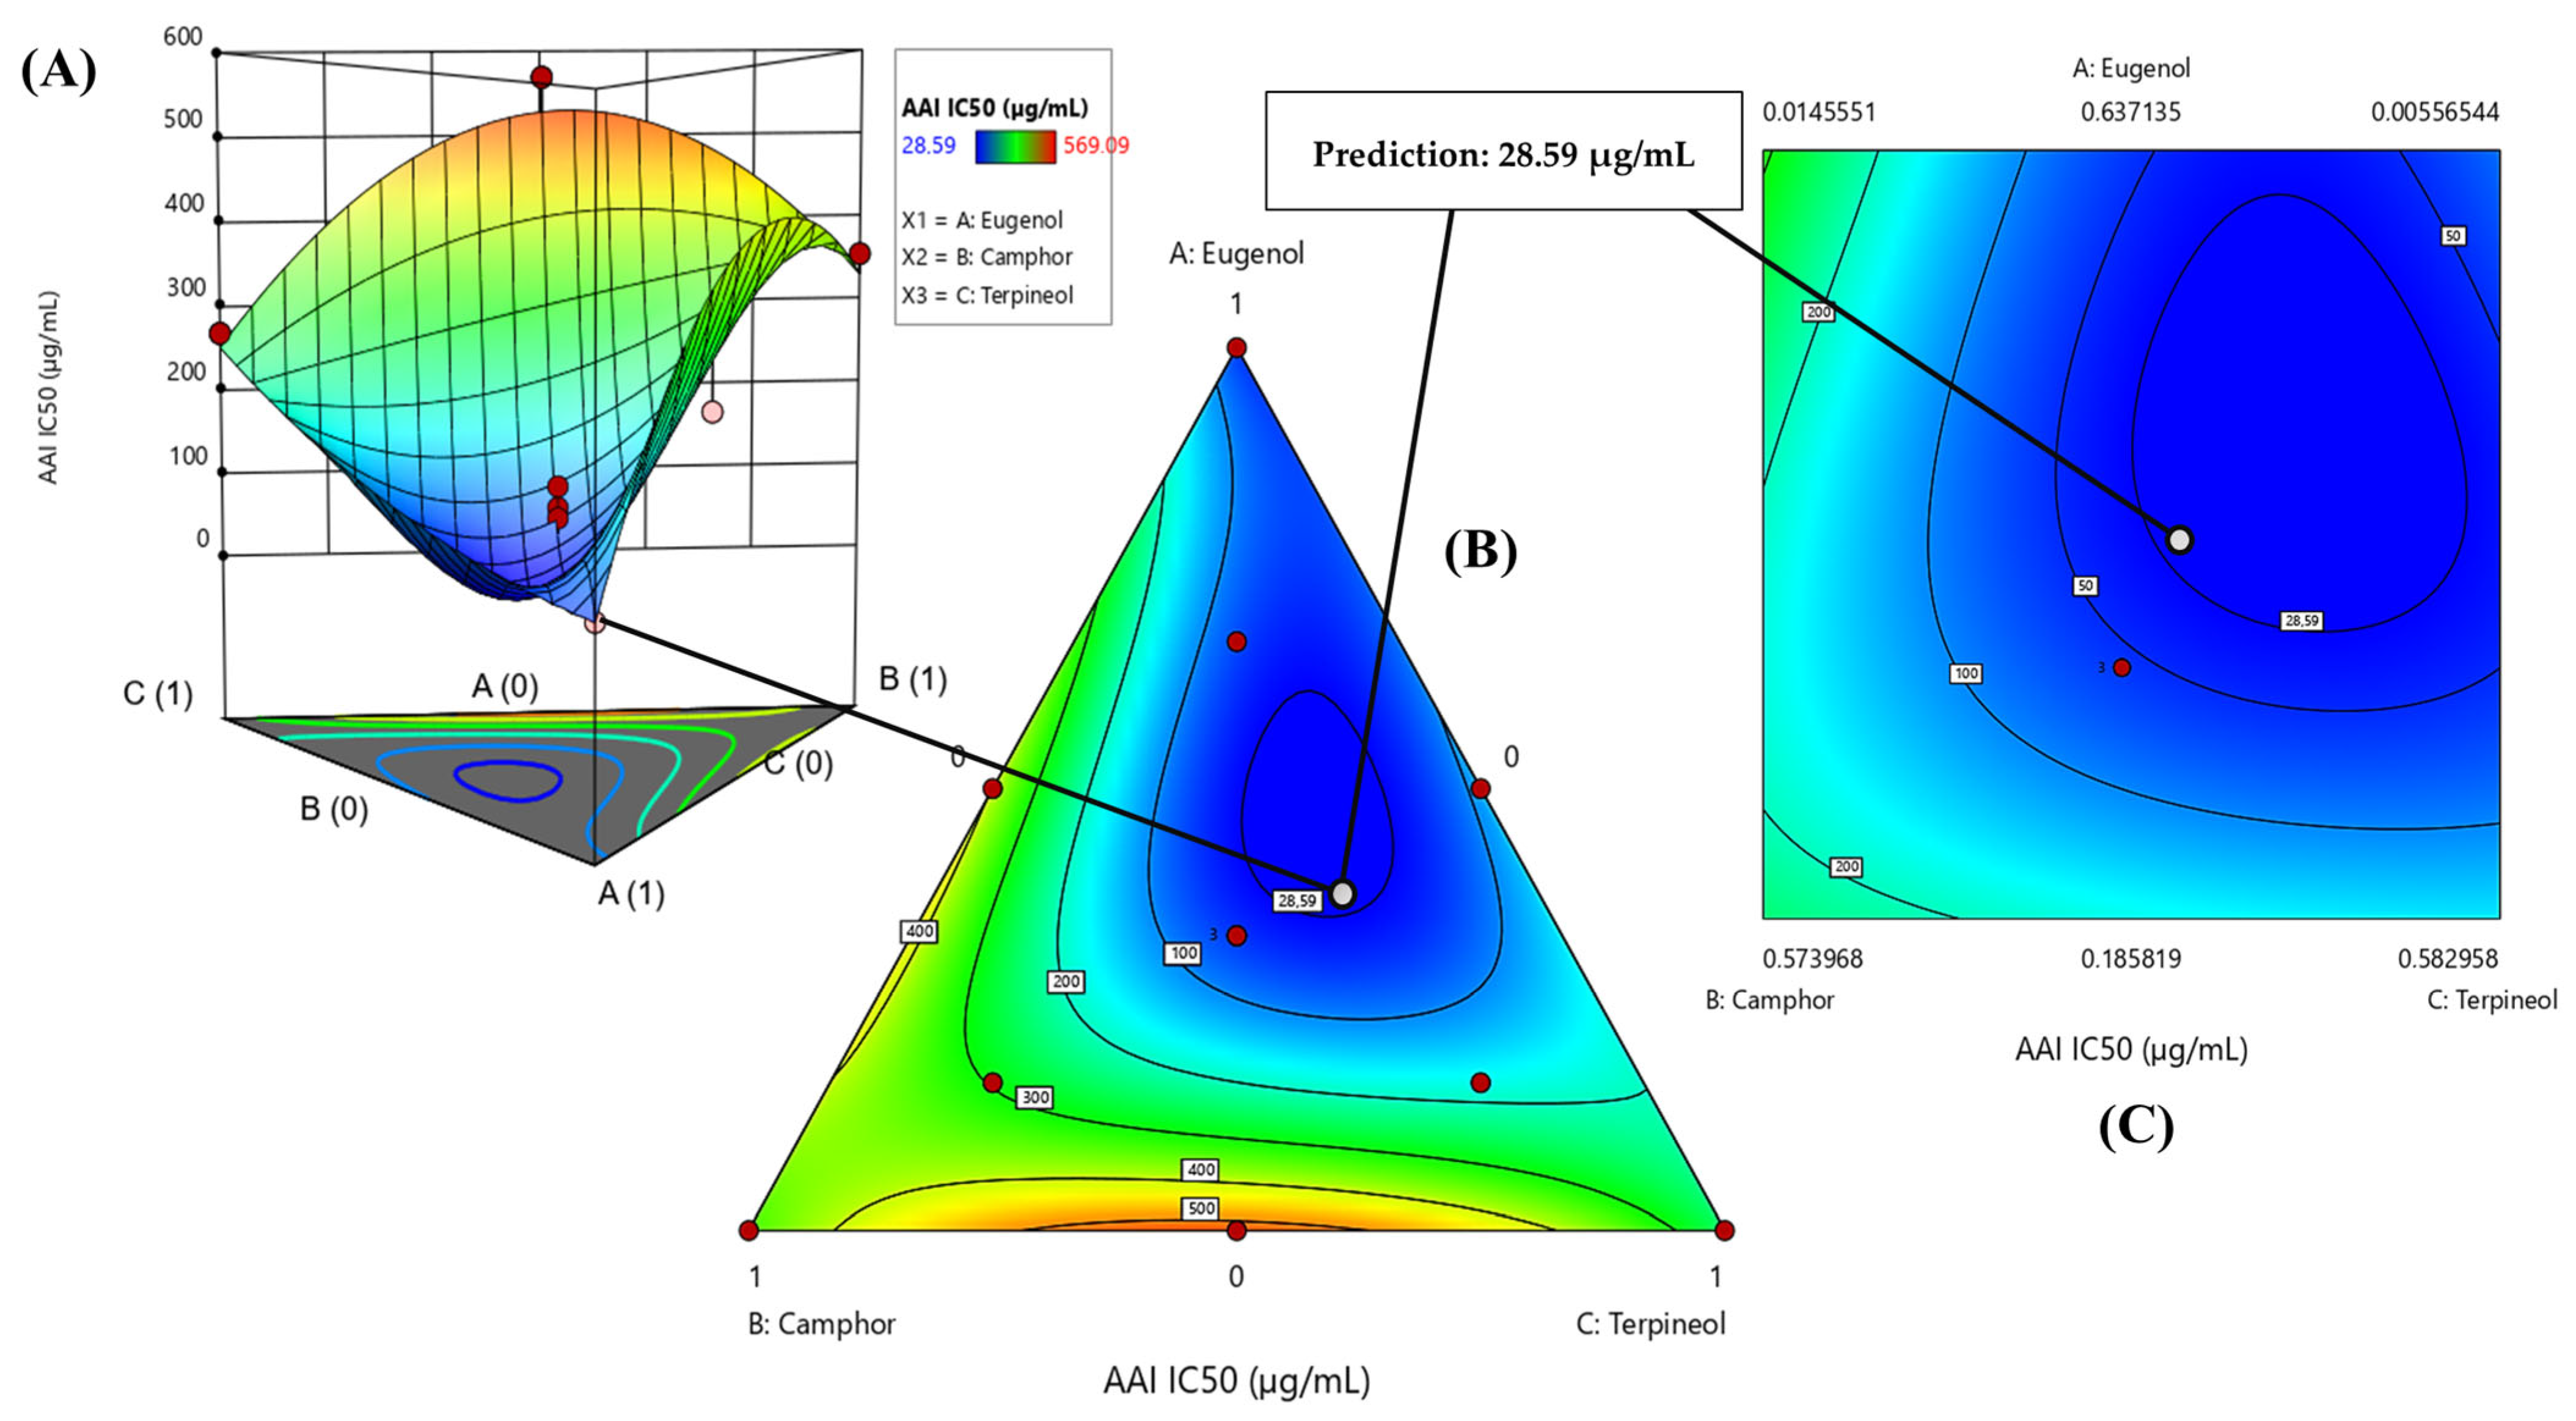
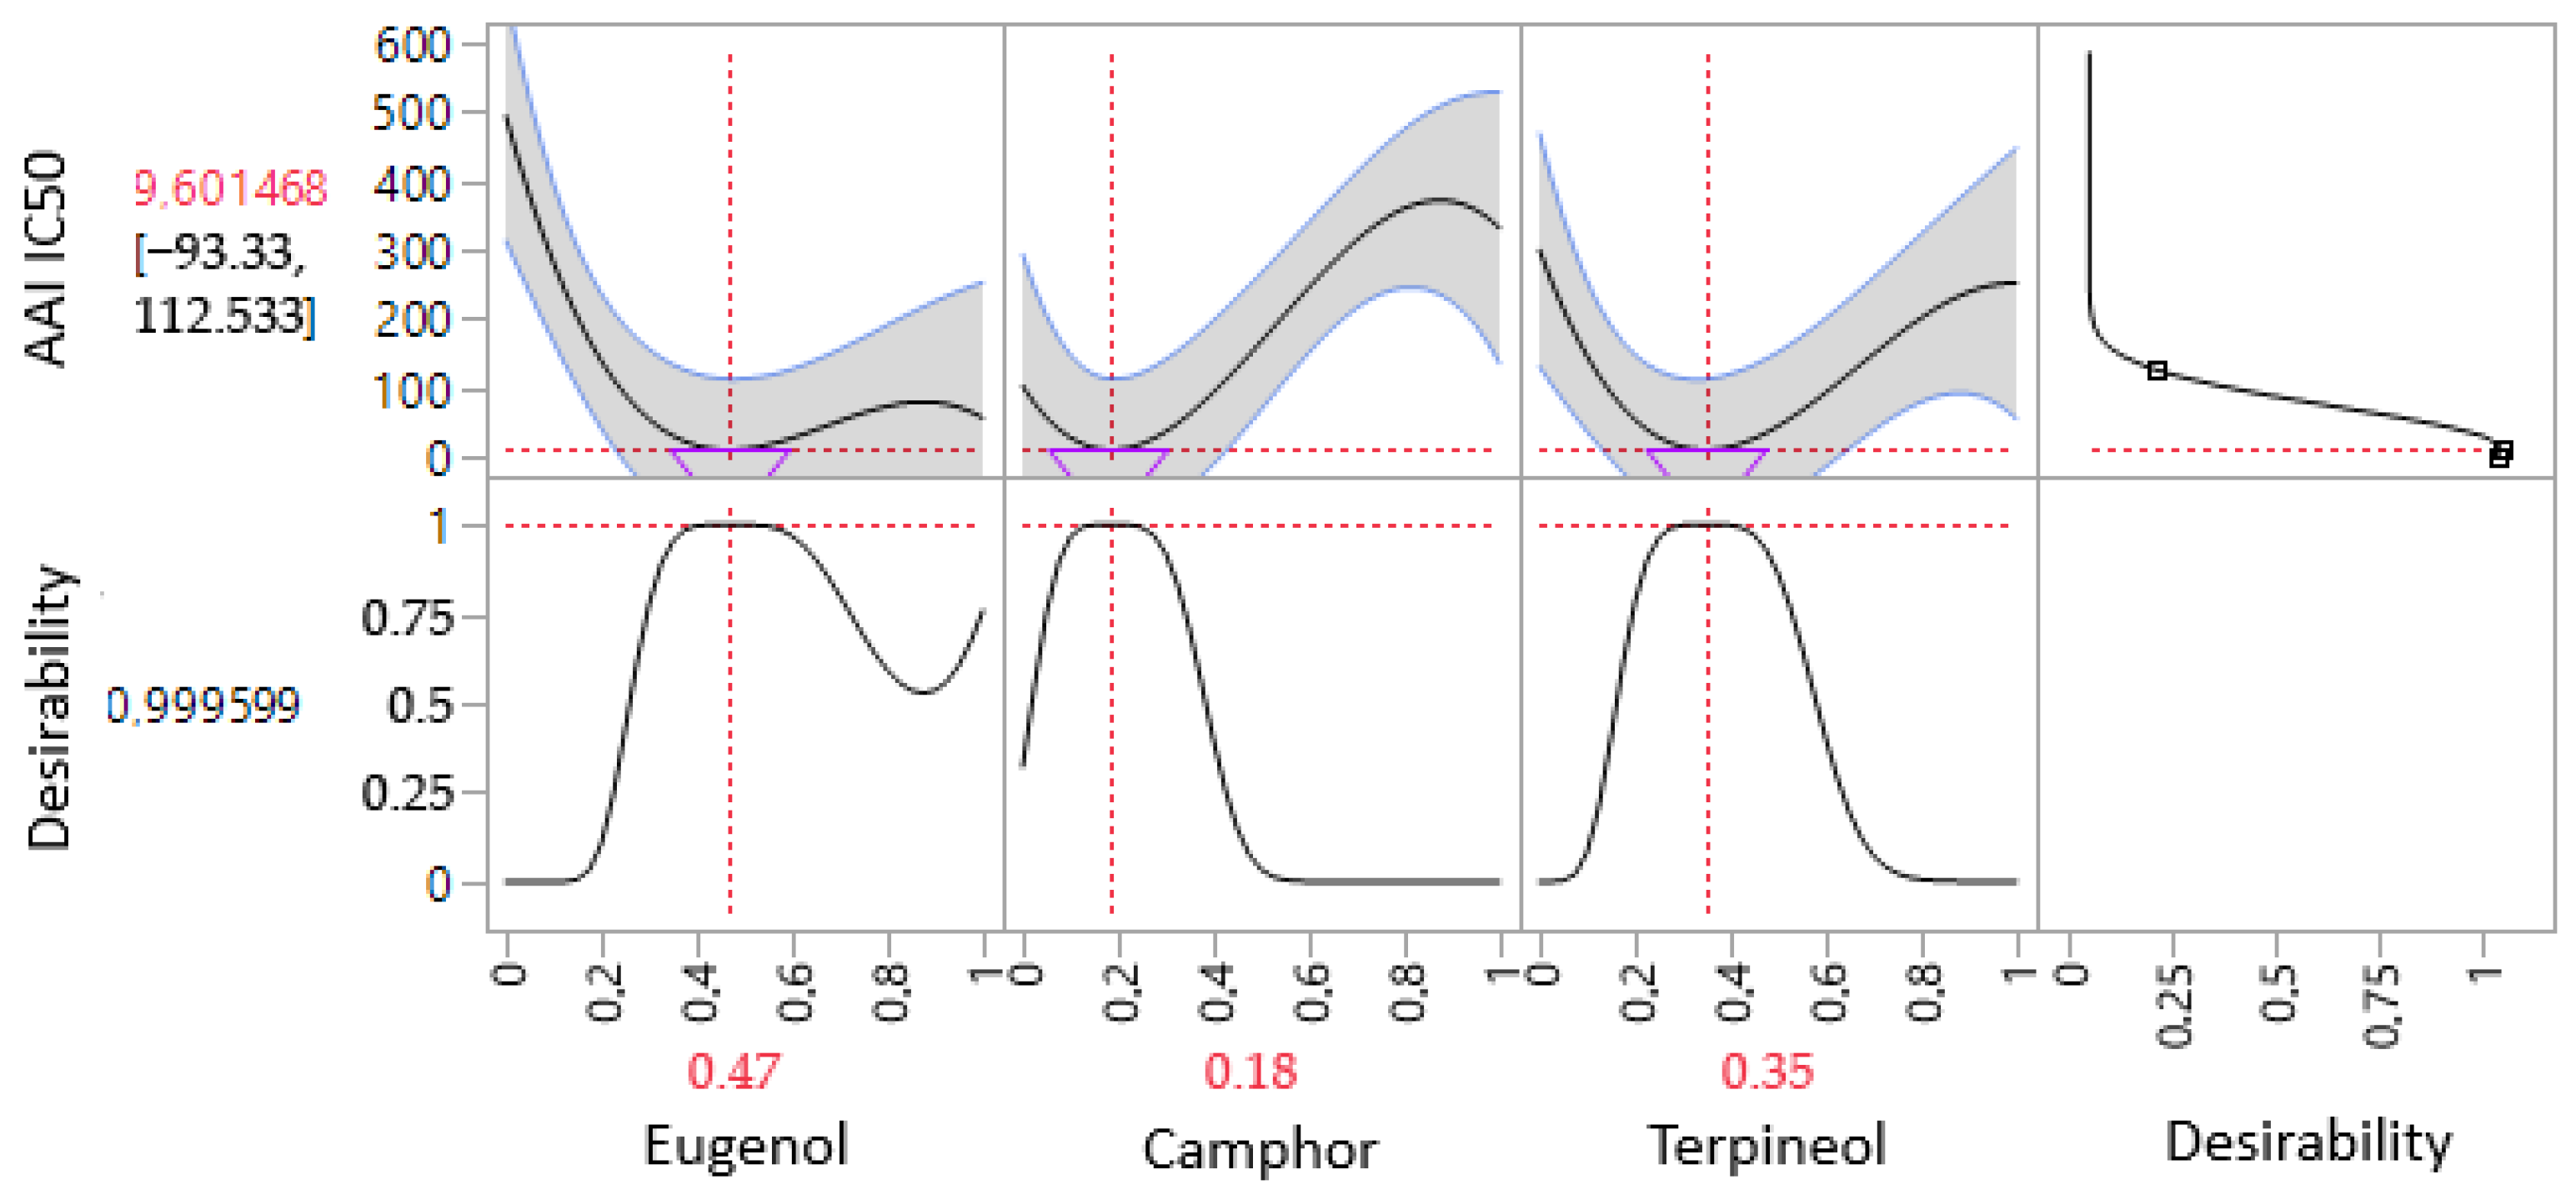
3.6.1. Optimization of AAI IC50 Response
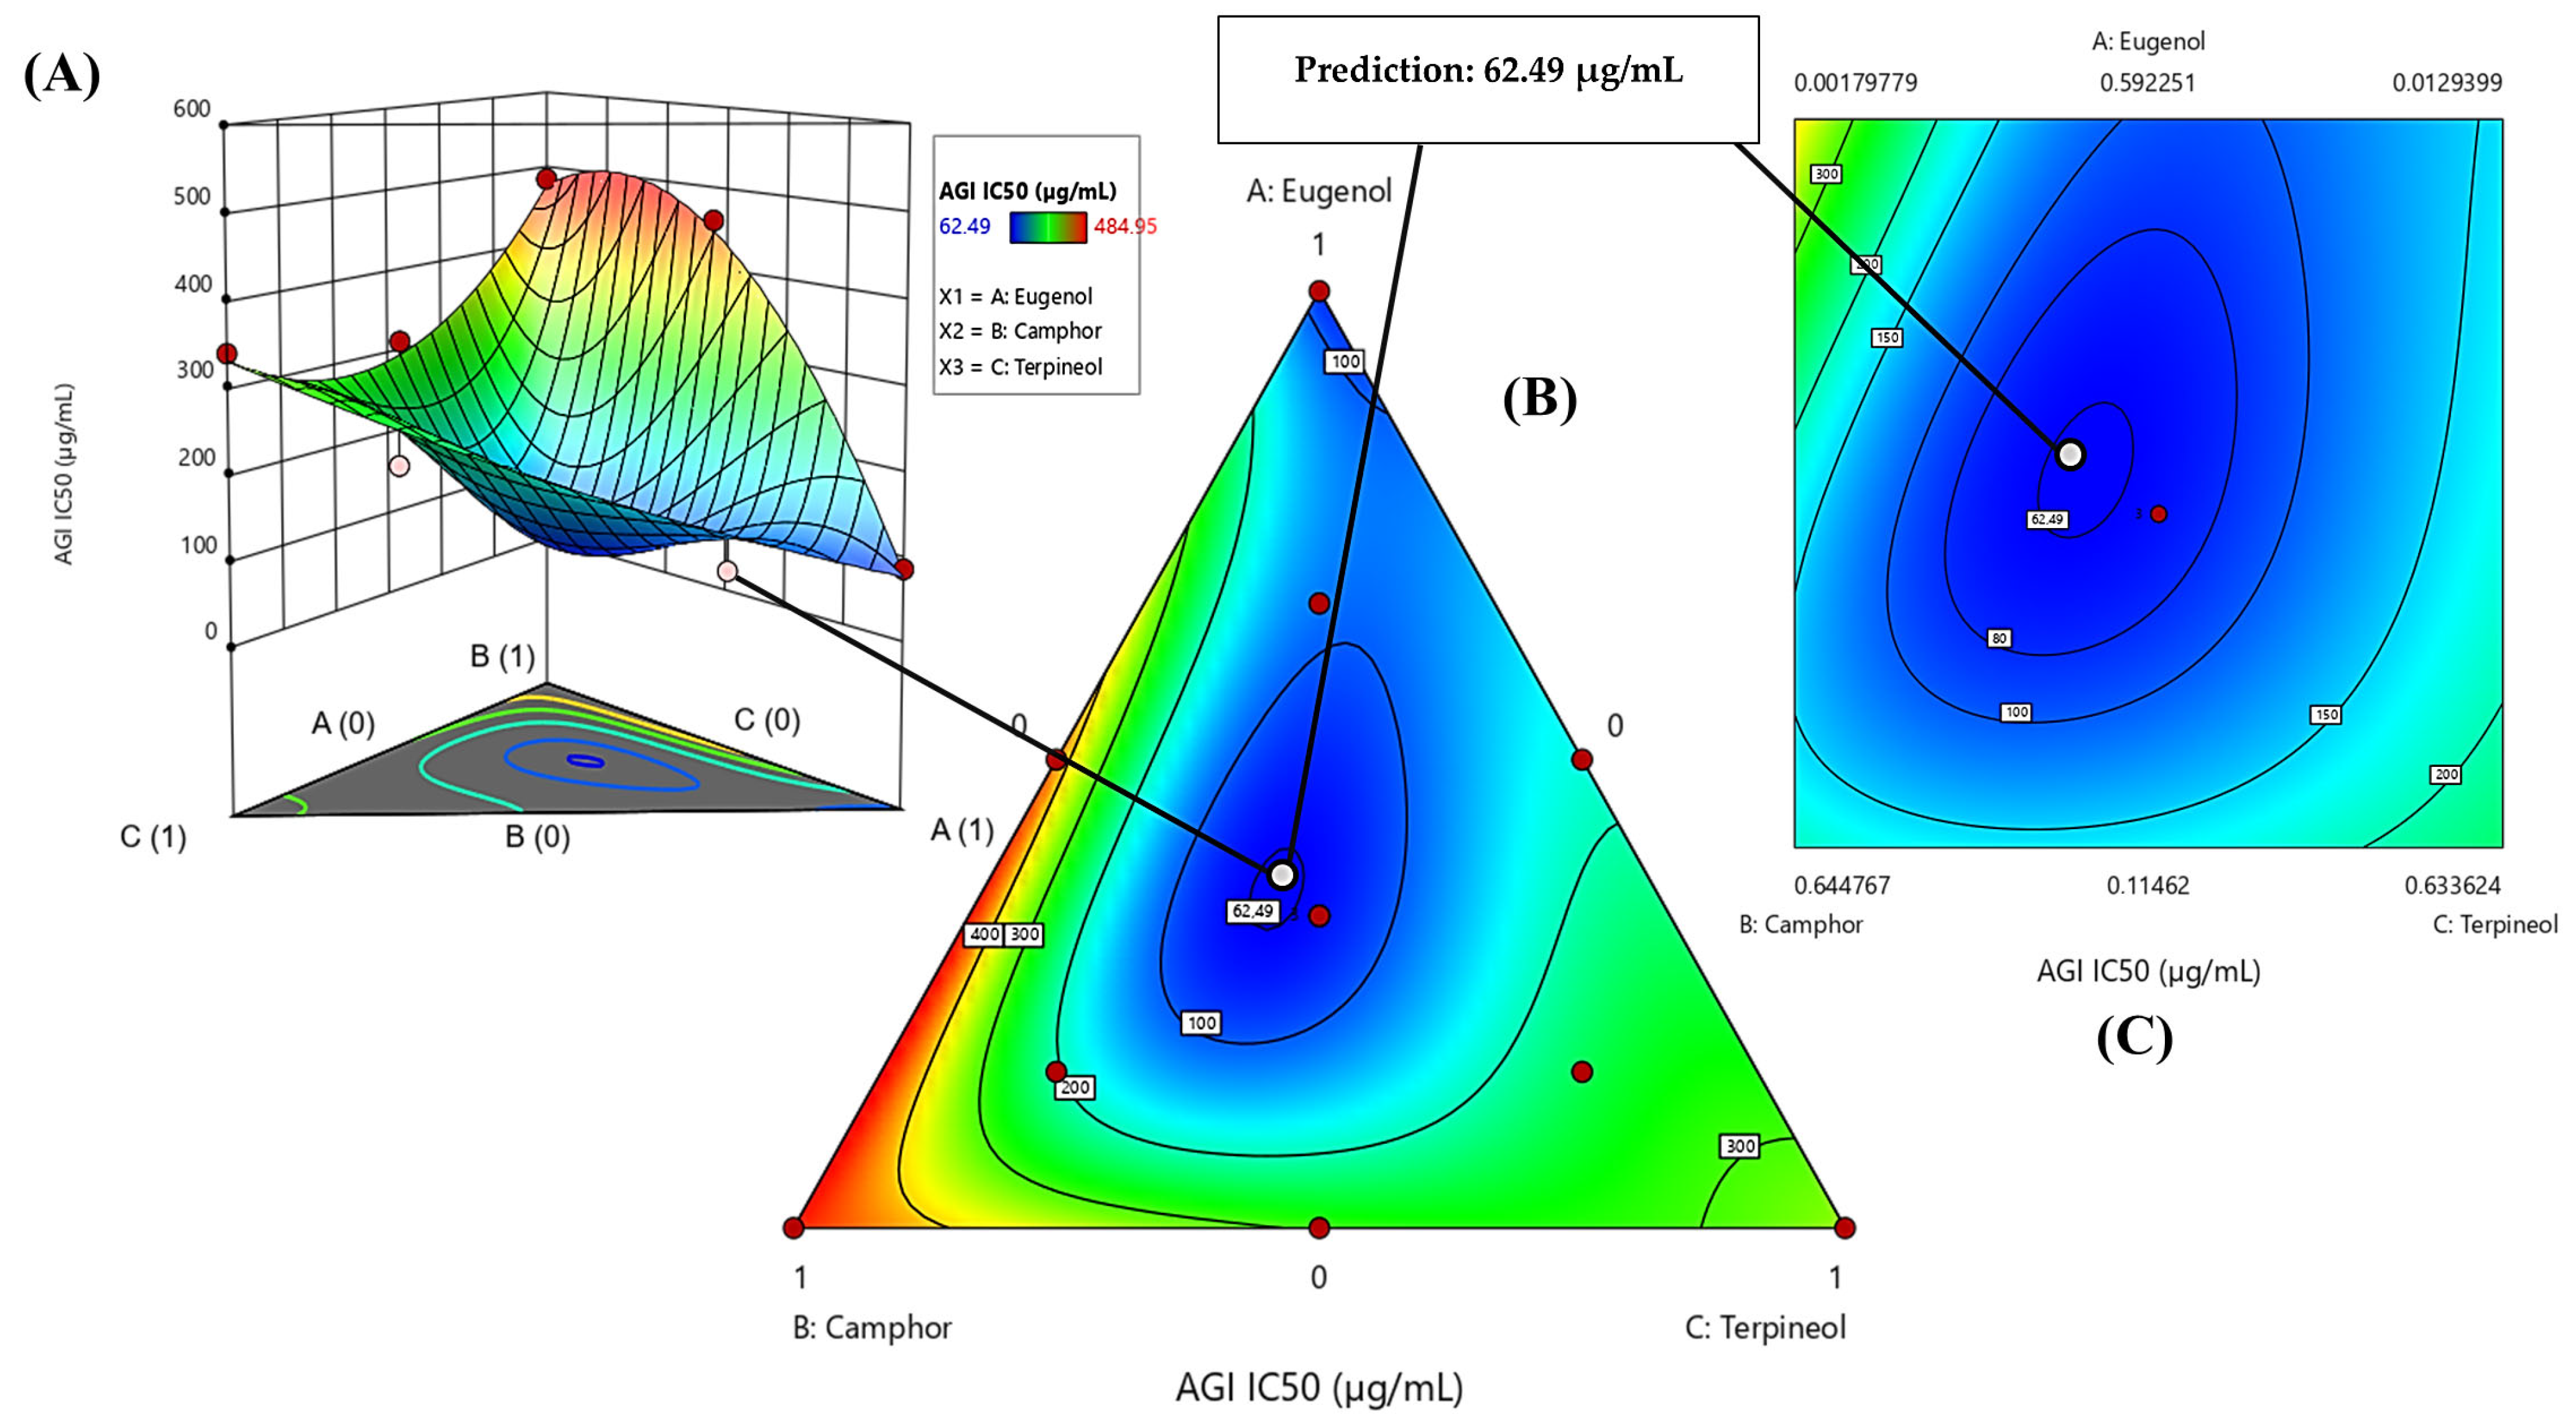
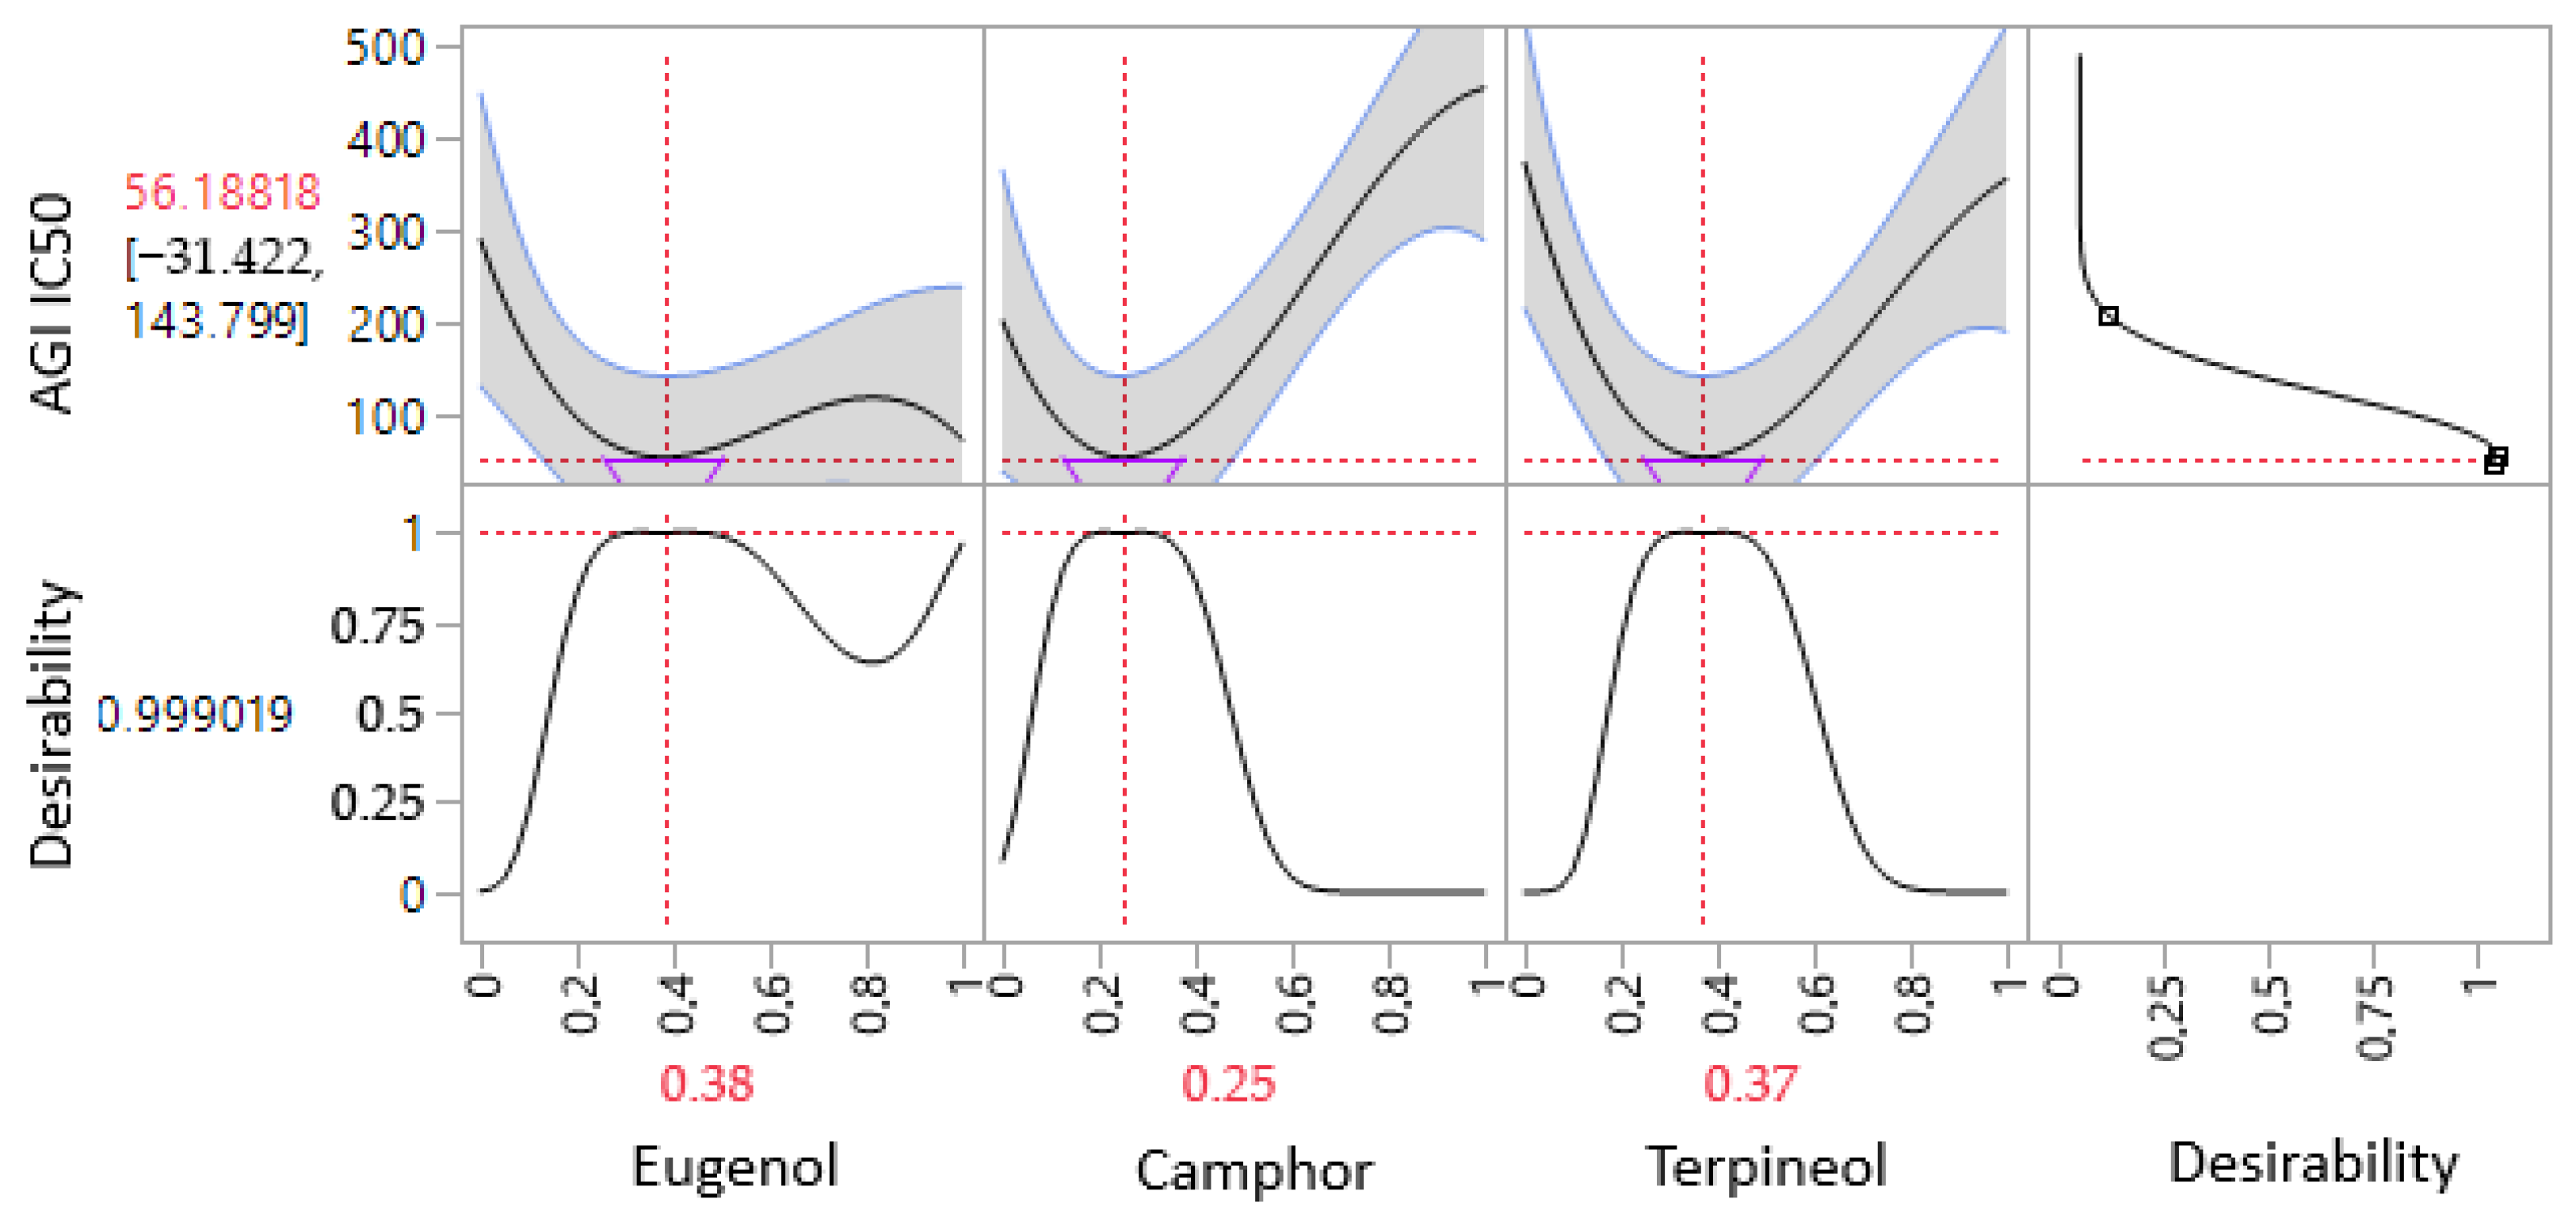
3.6.2. Optimization of AGI IC50 Response
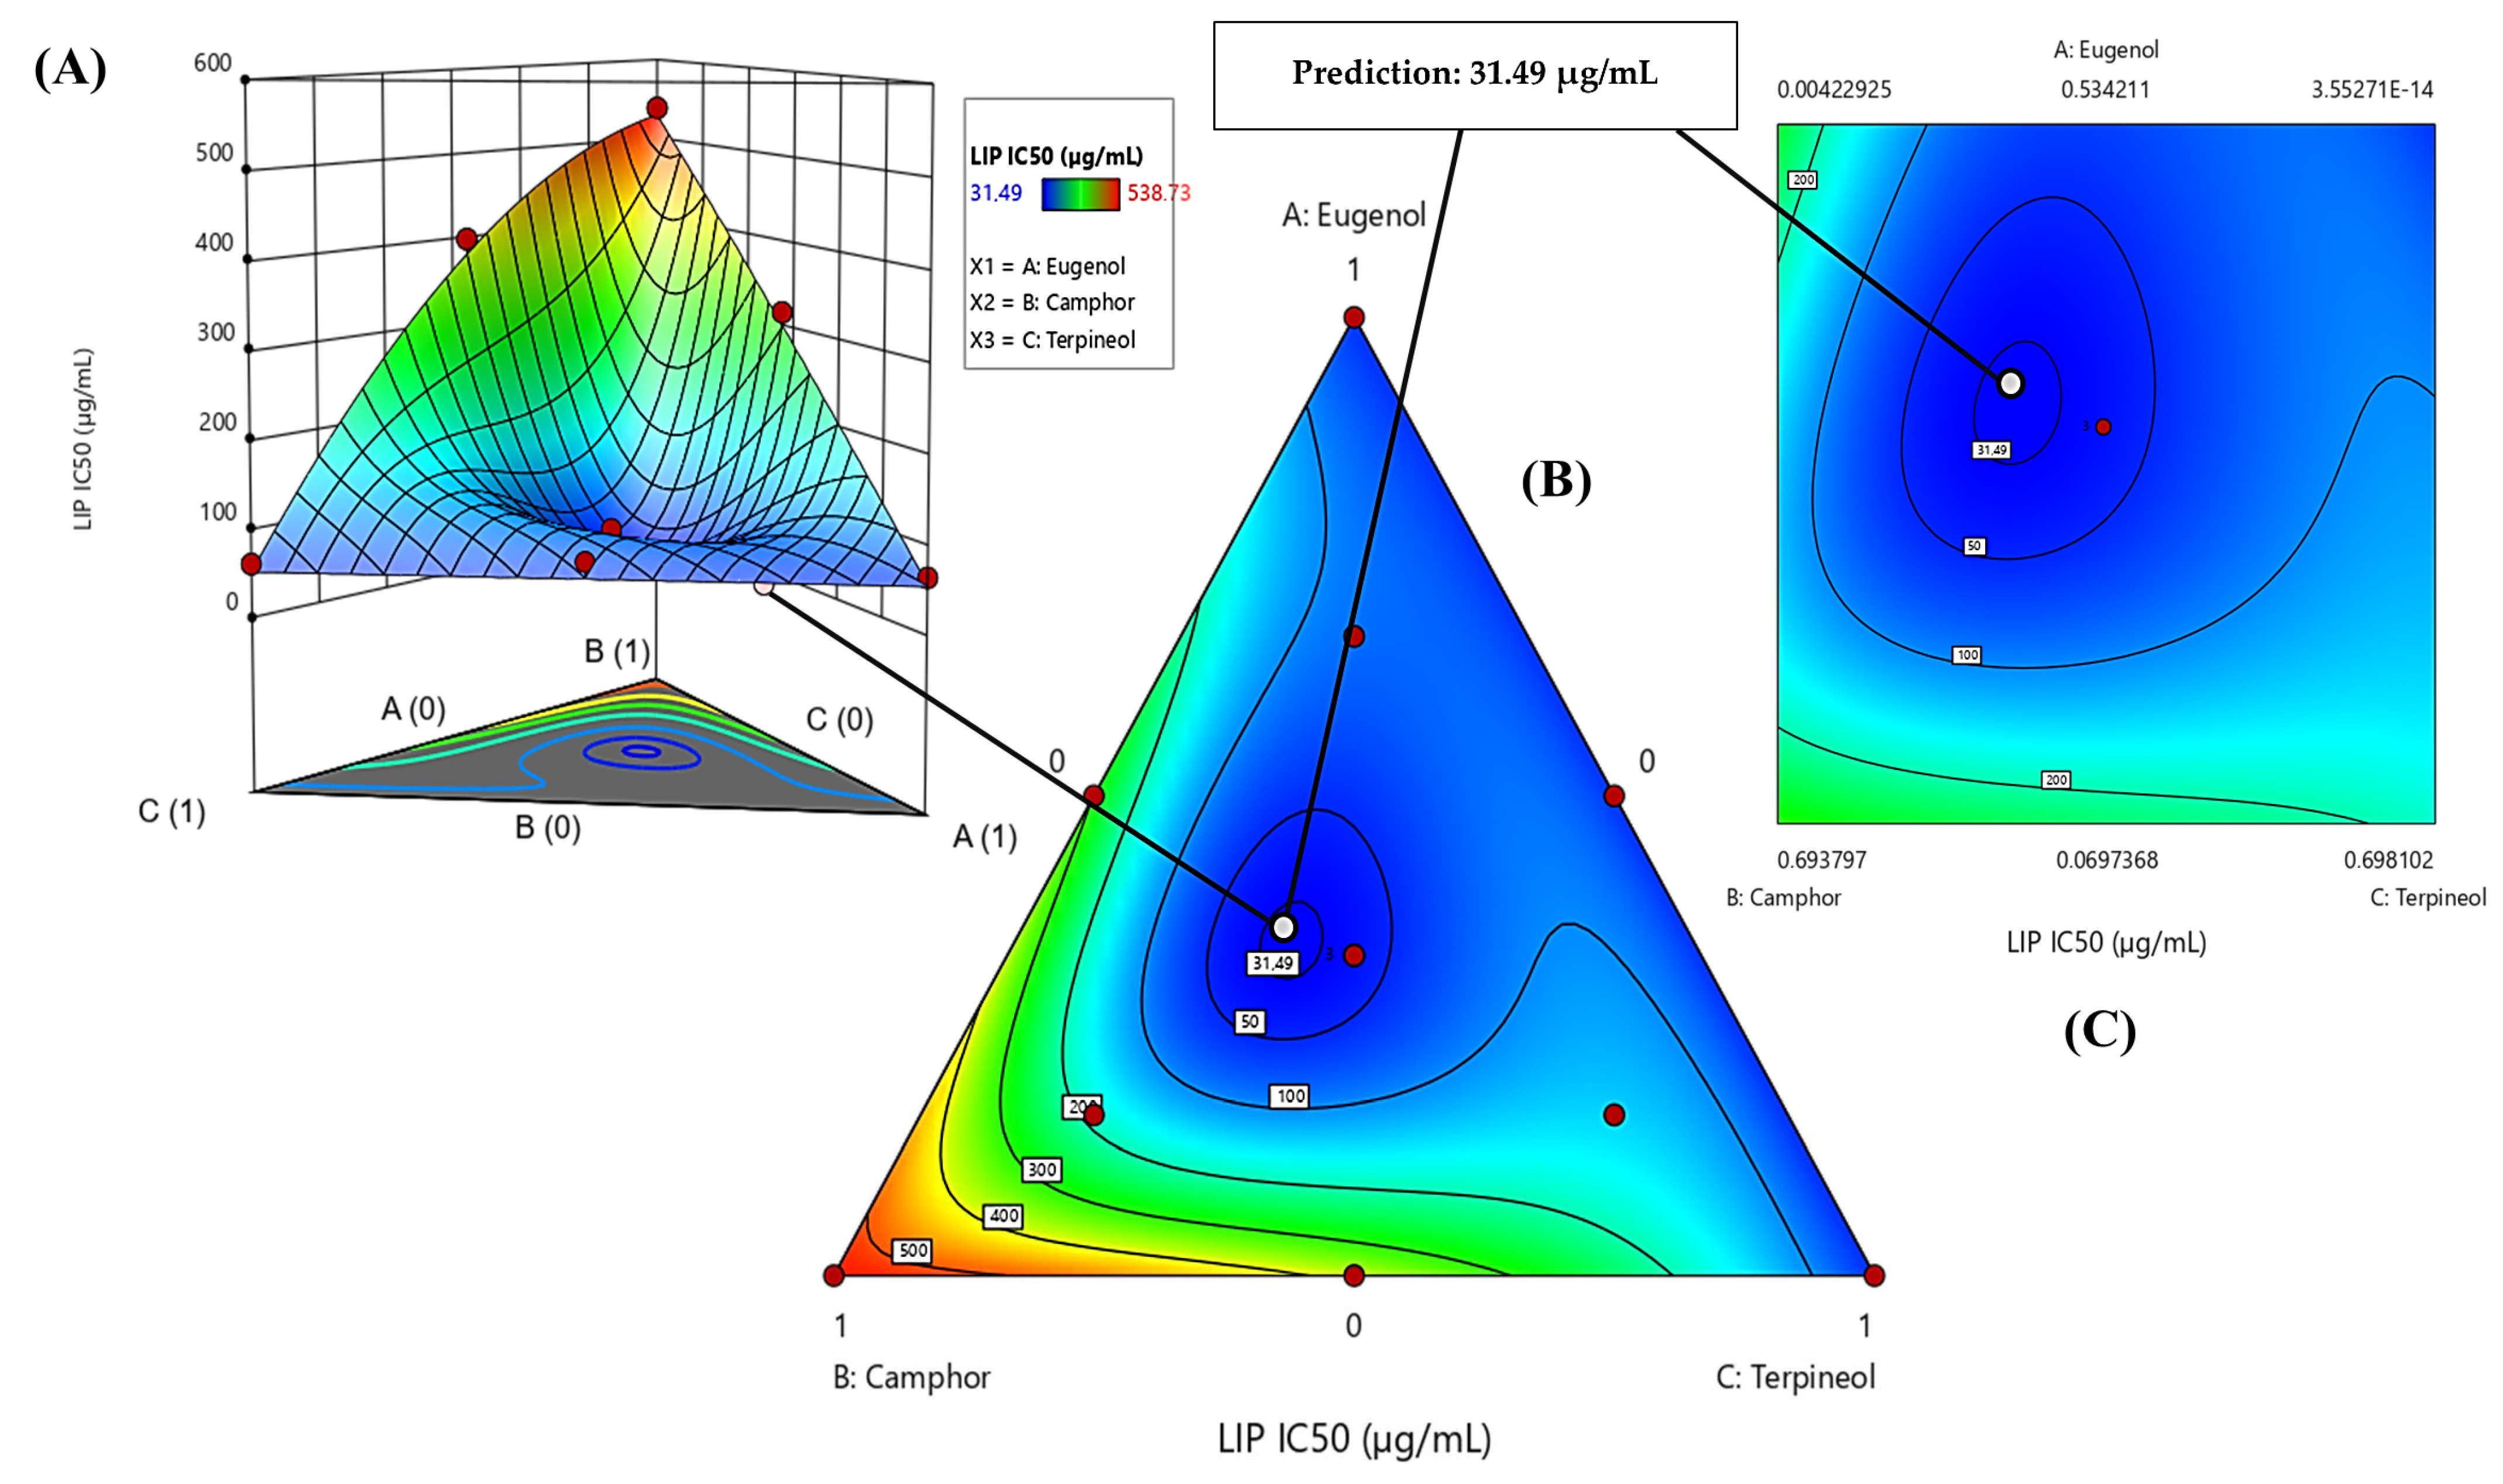
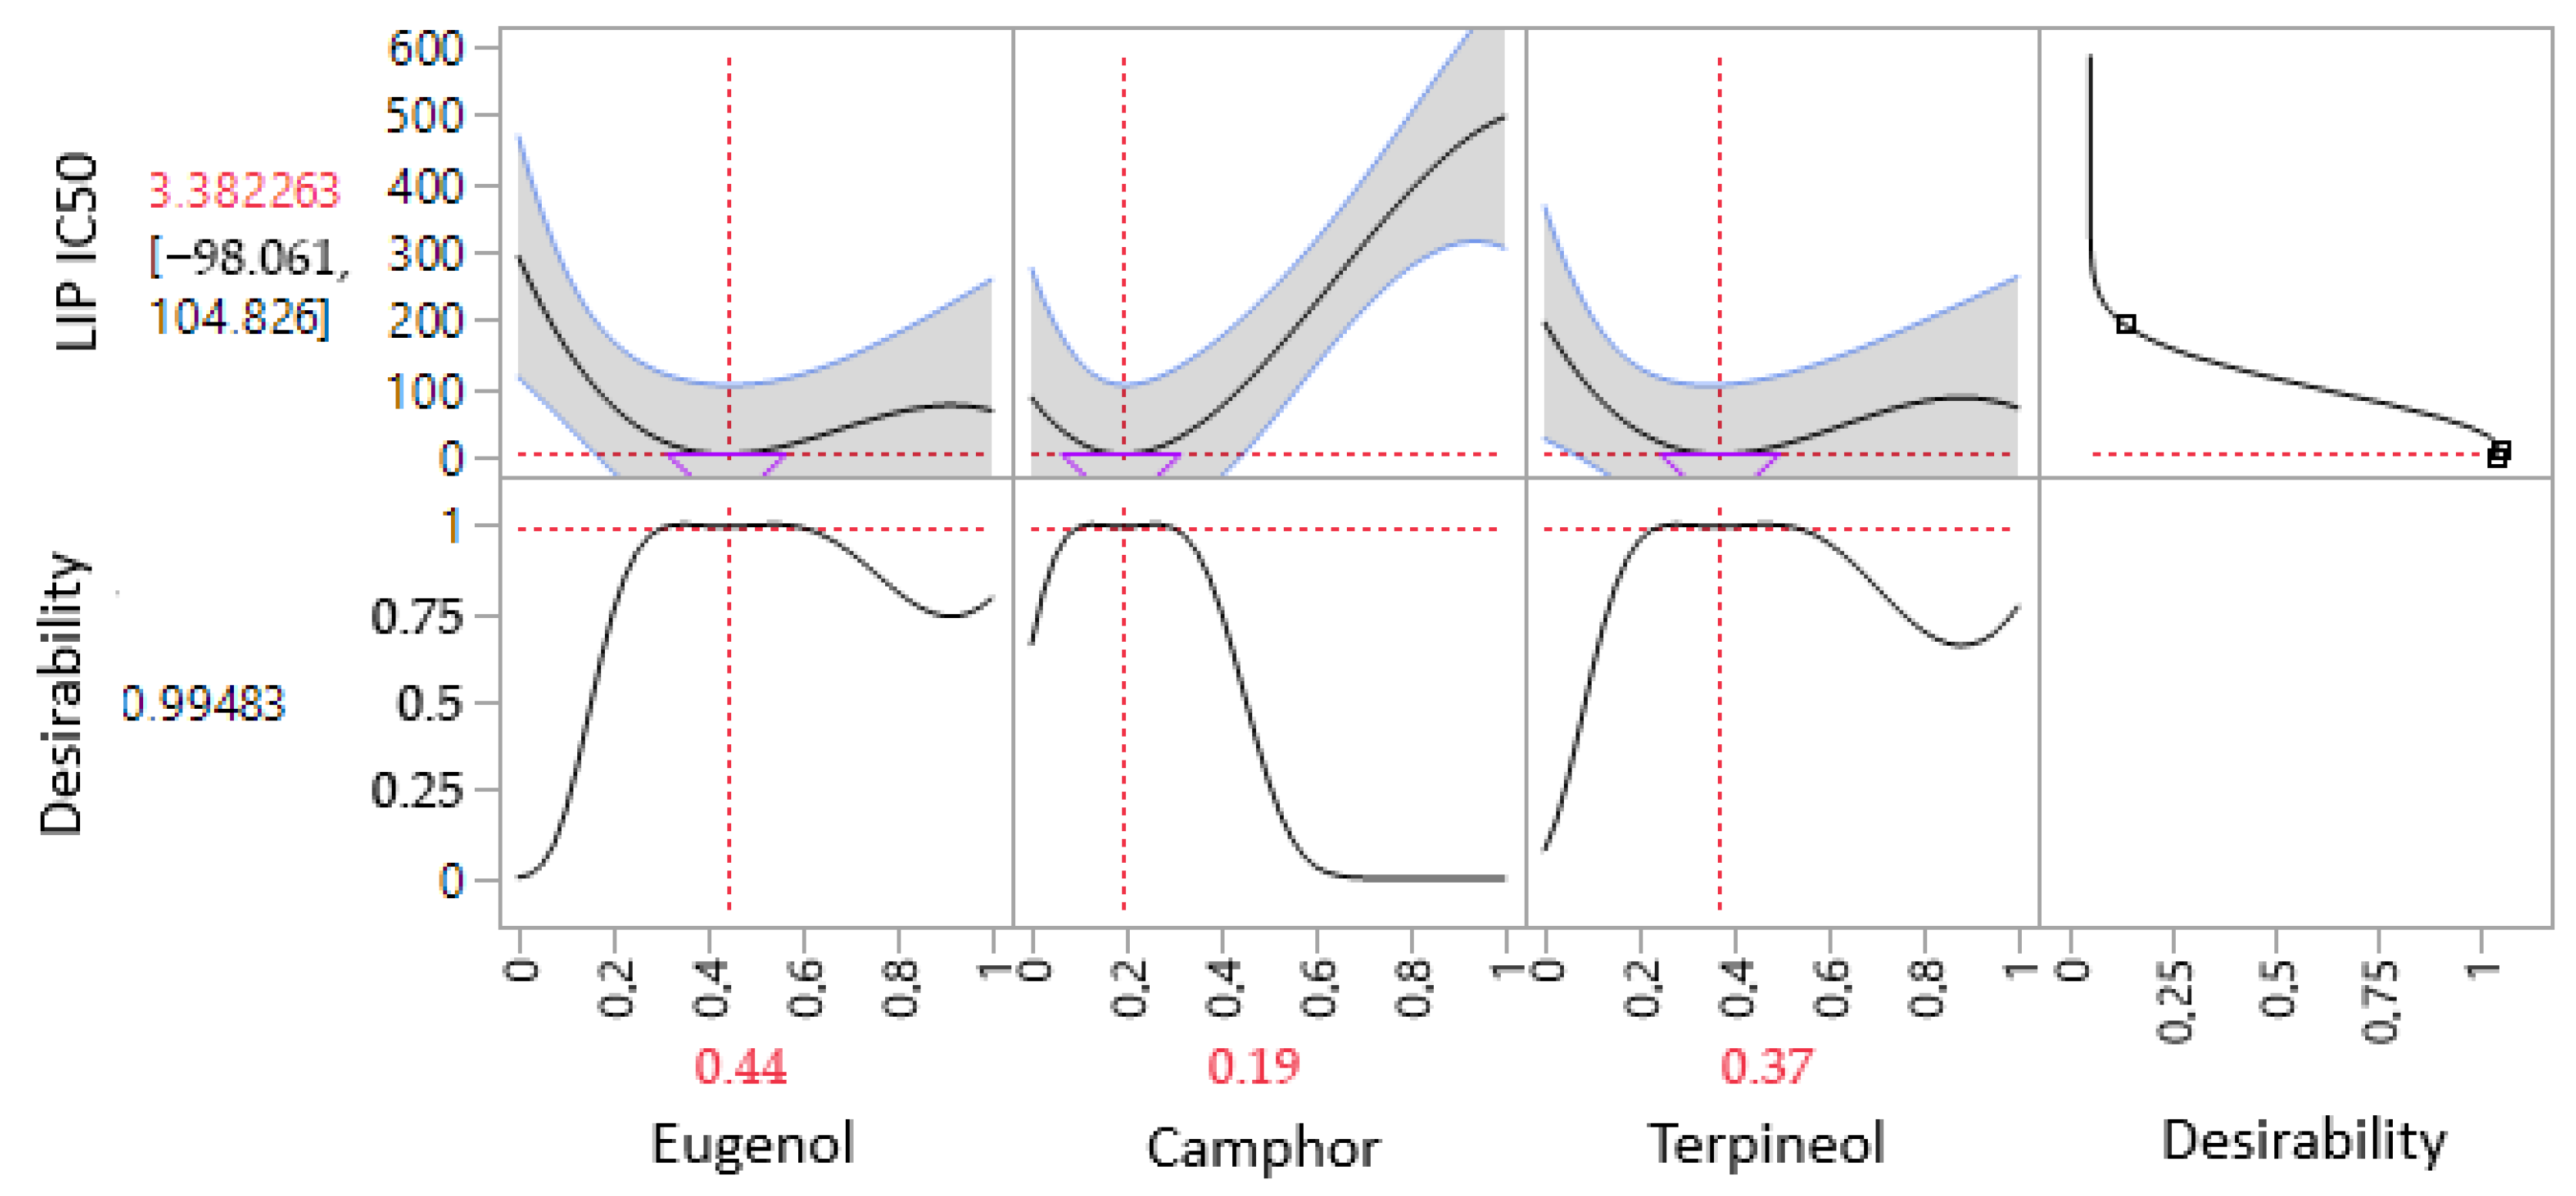
3.6.3. Optimization of LIP IC50 Response
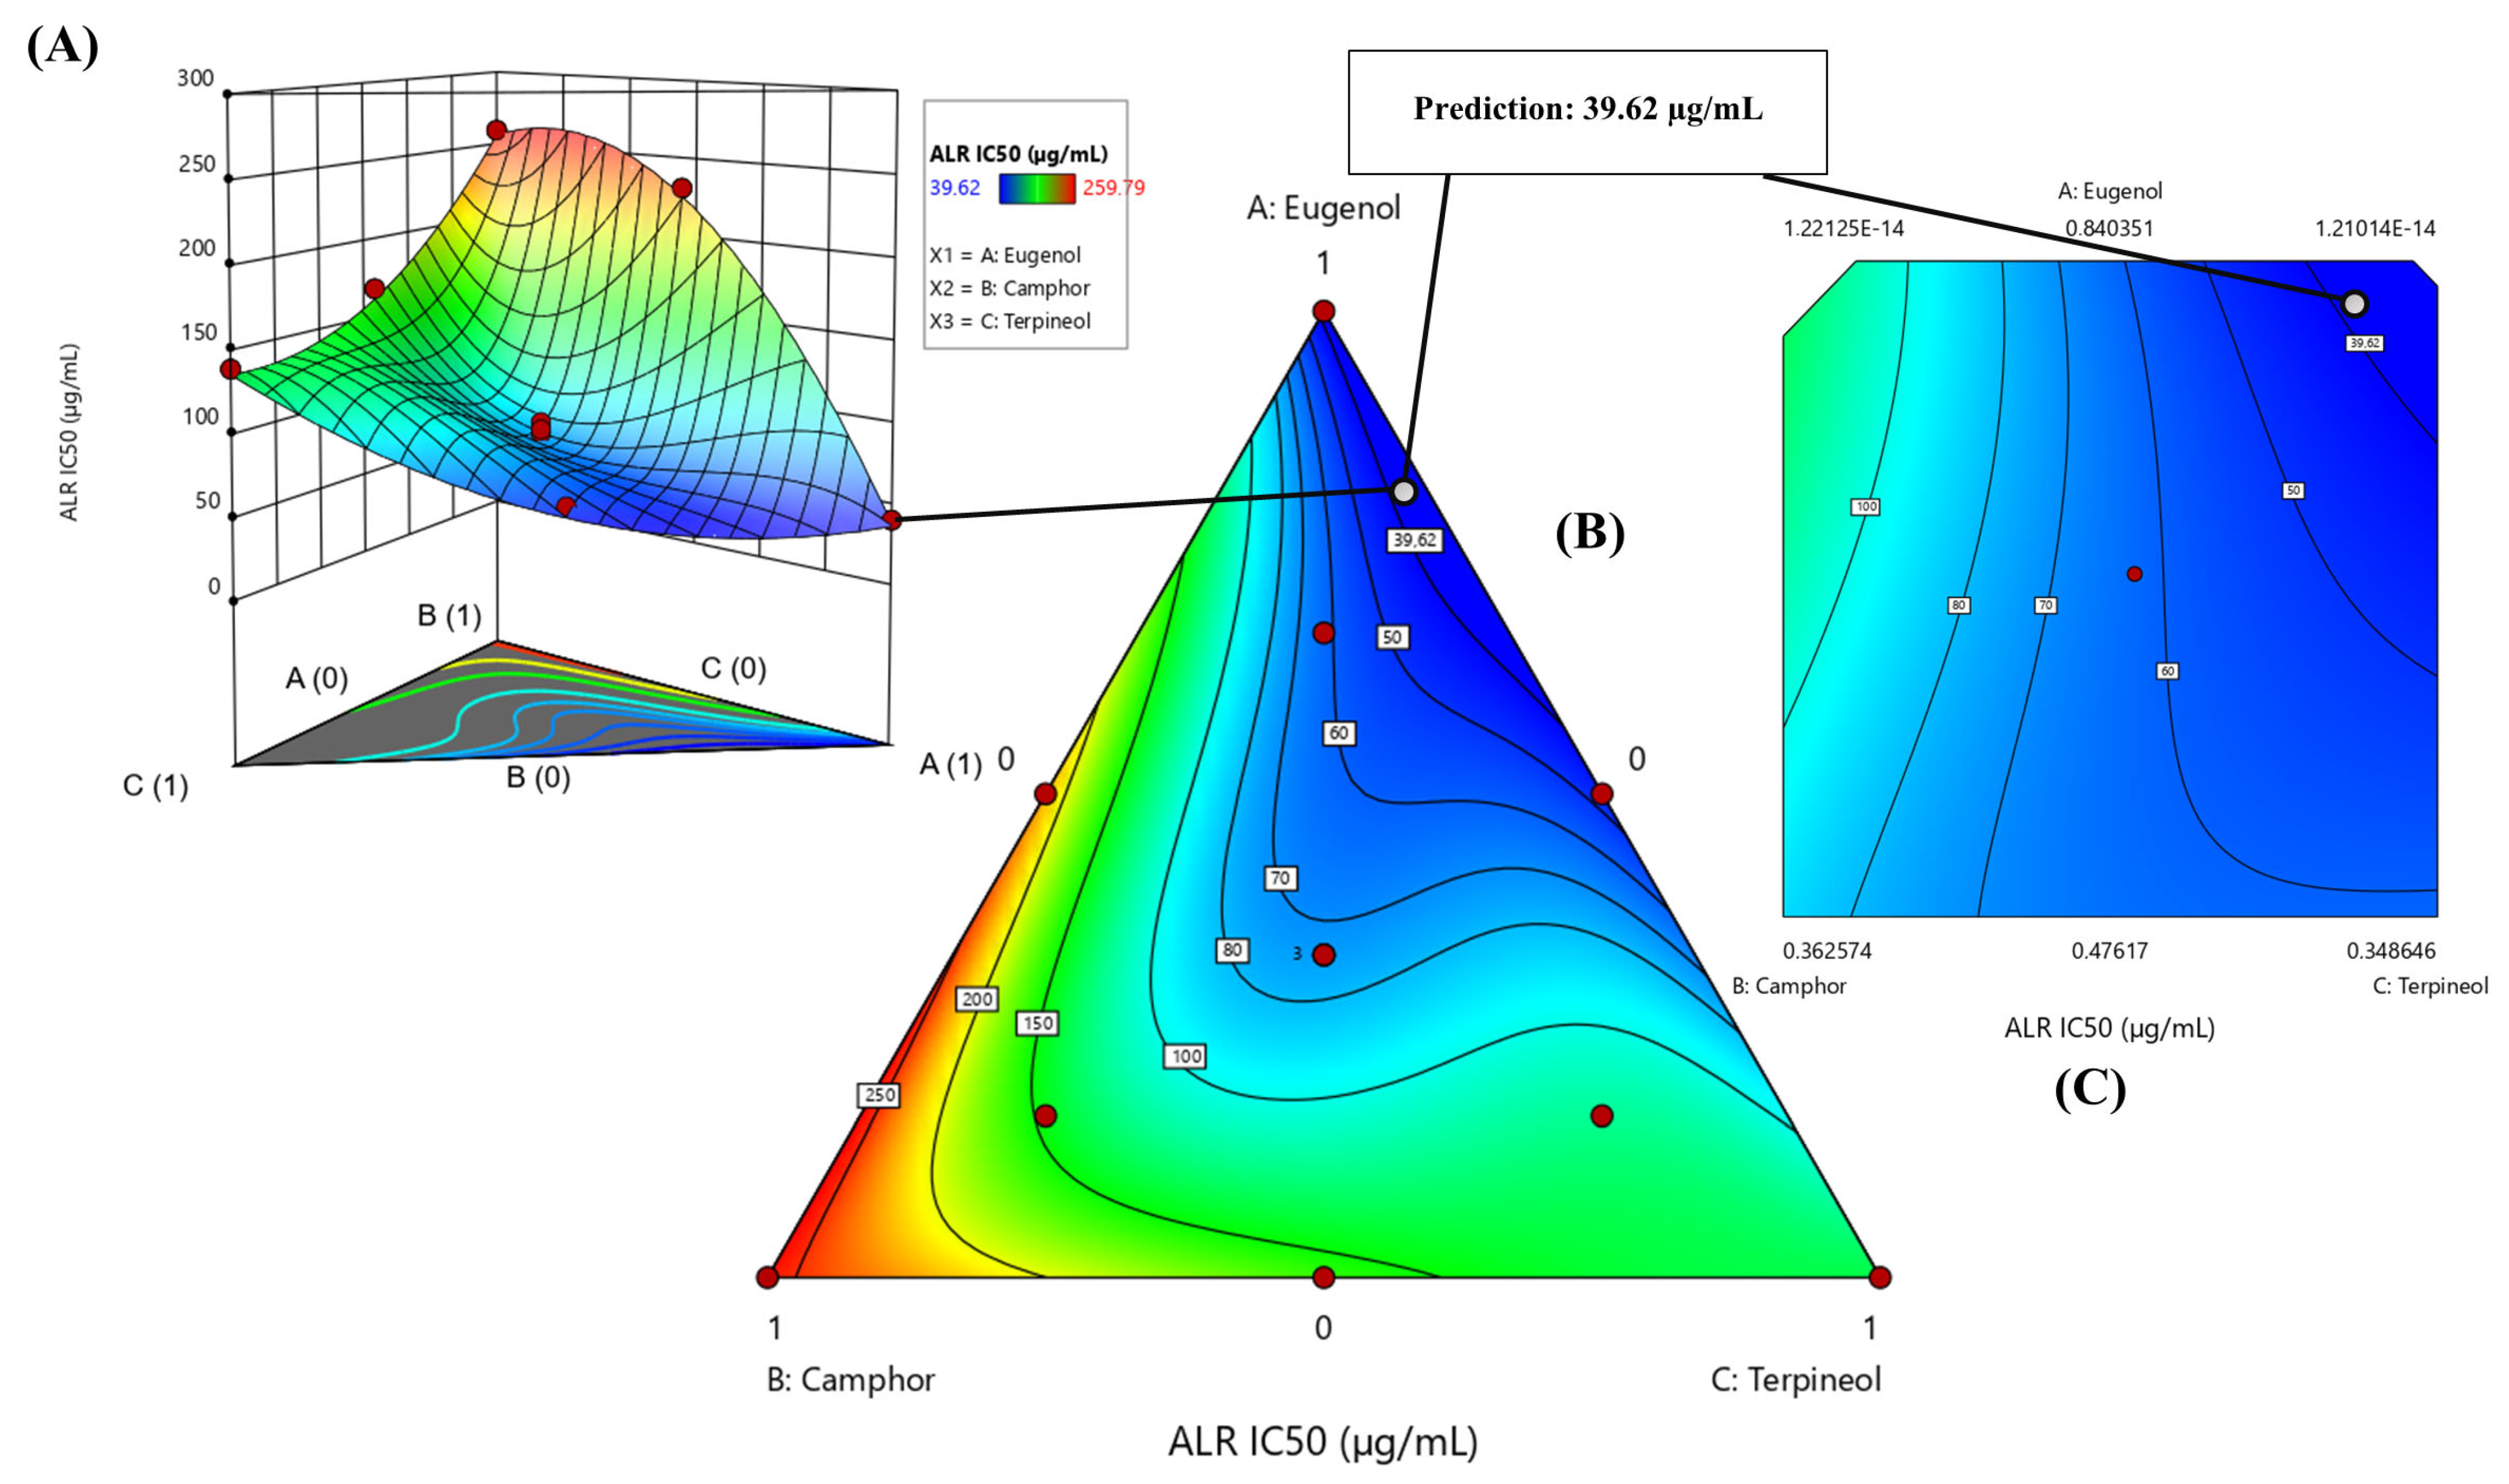
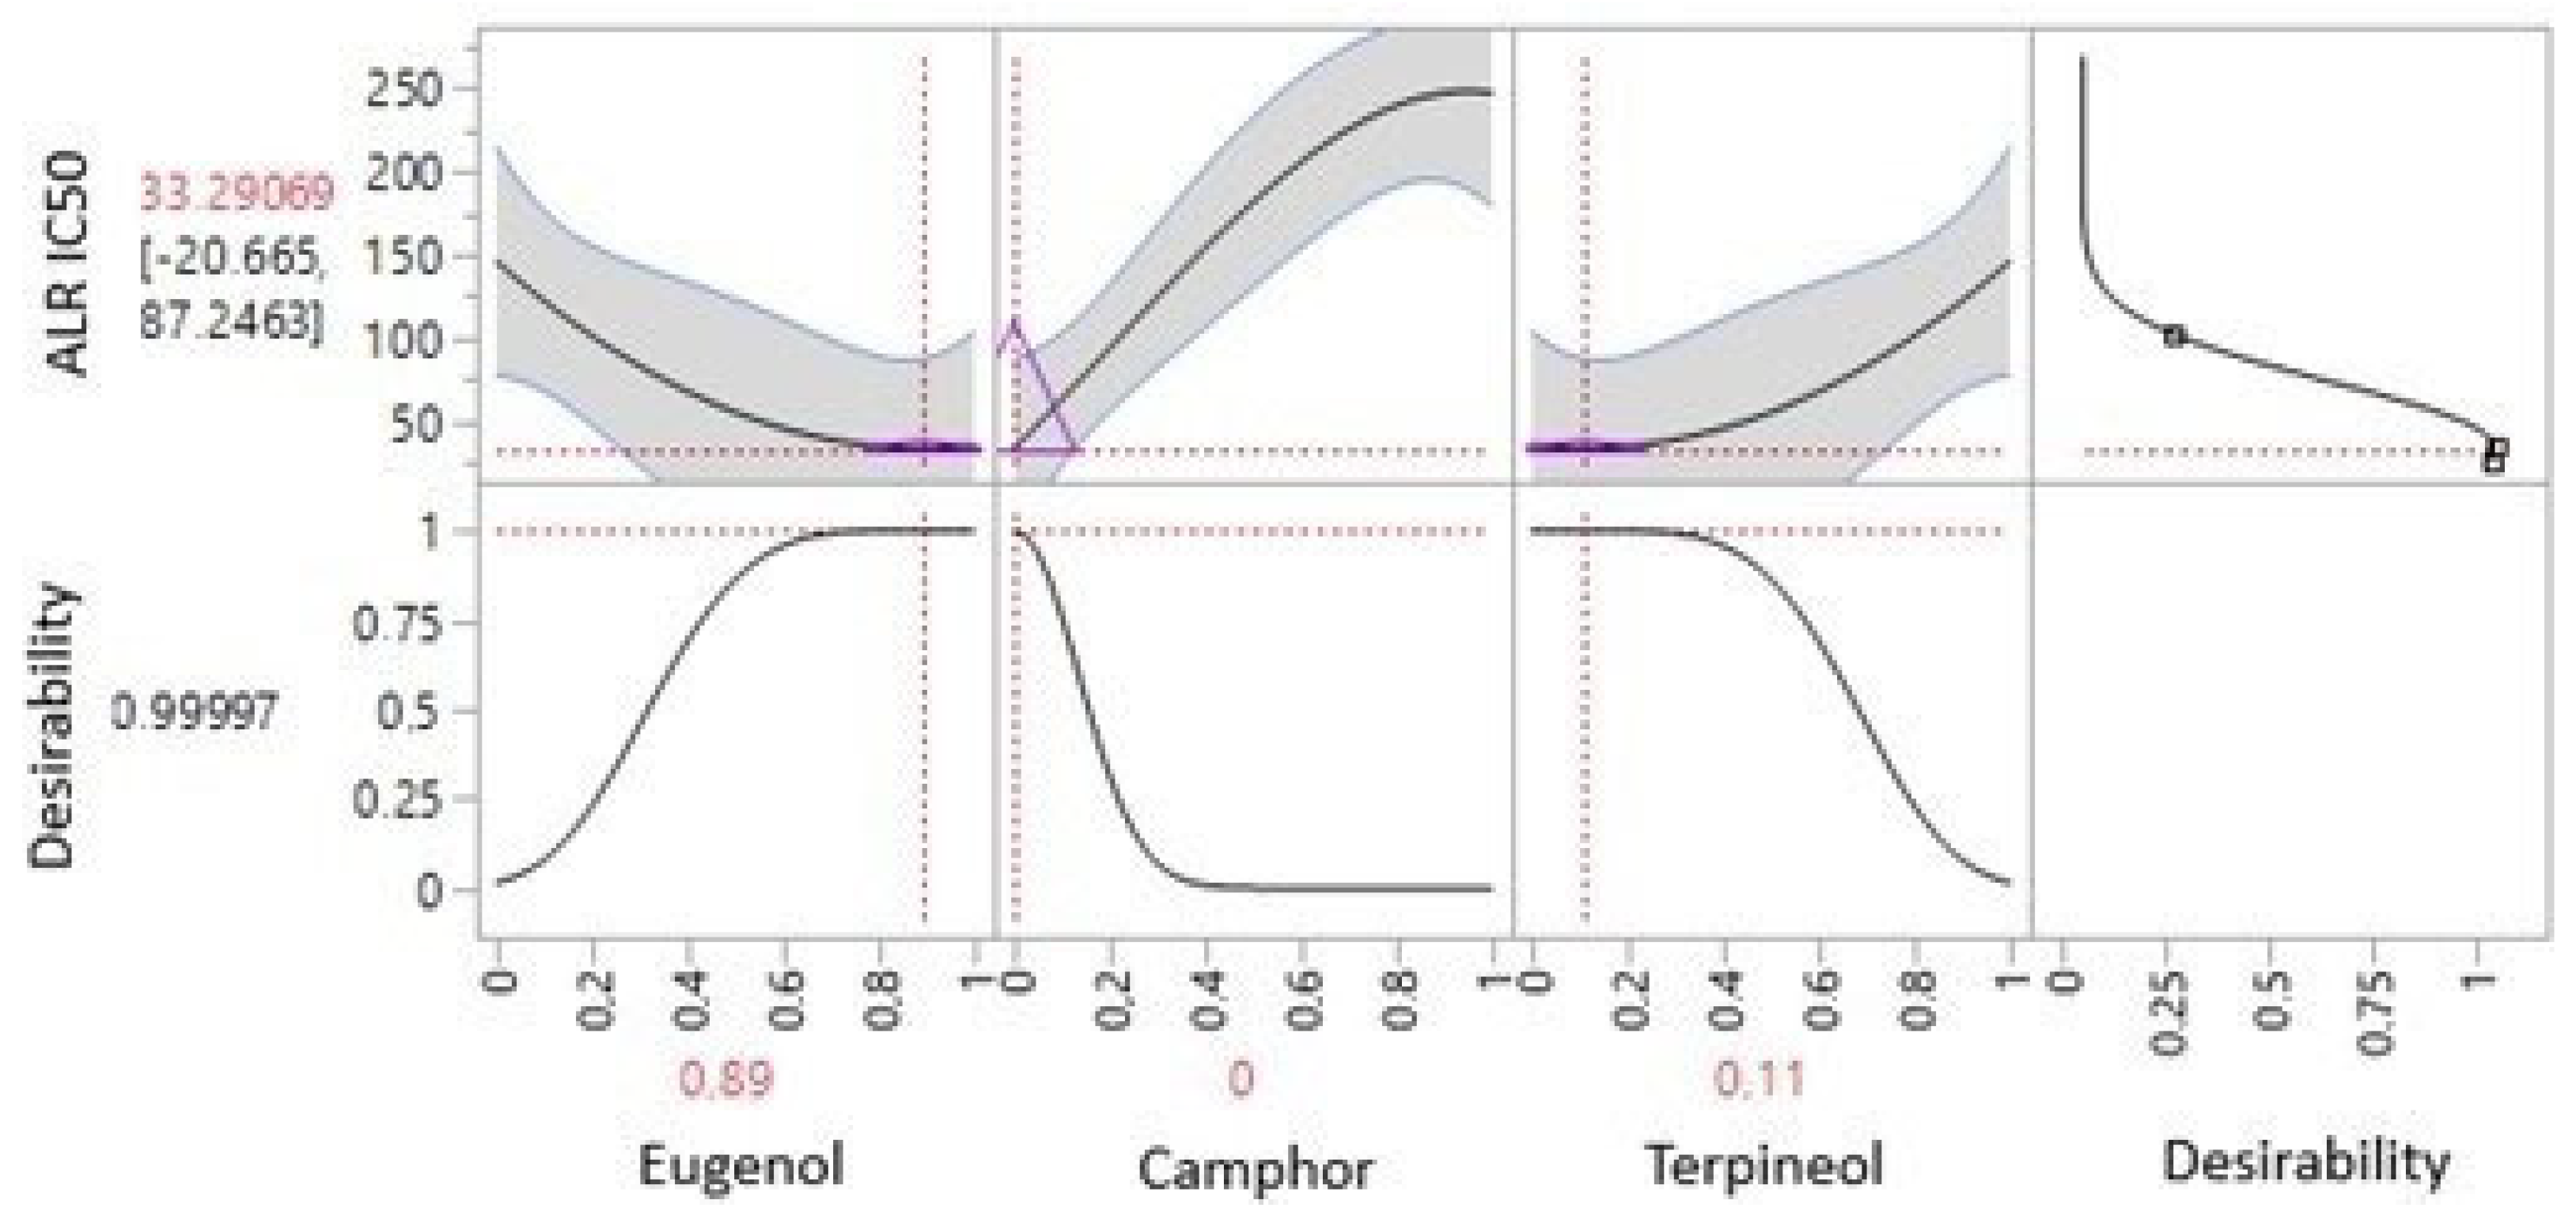
3.6.4. Optimization of ALR IC50 Response
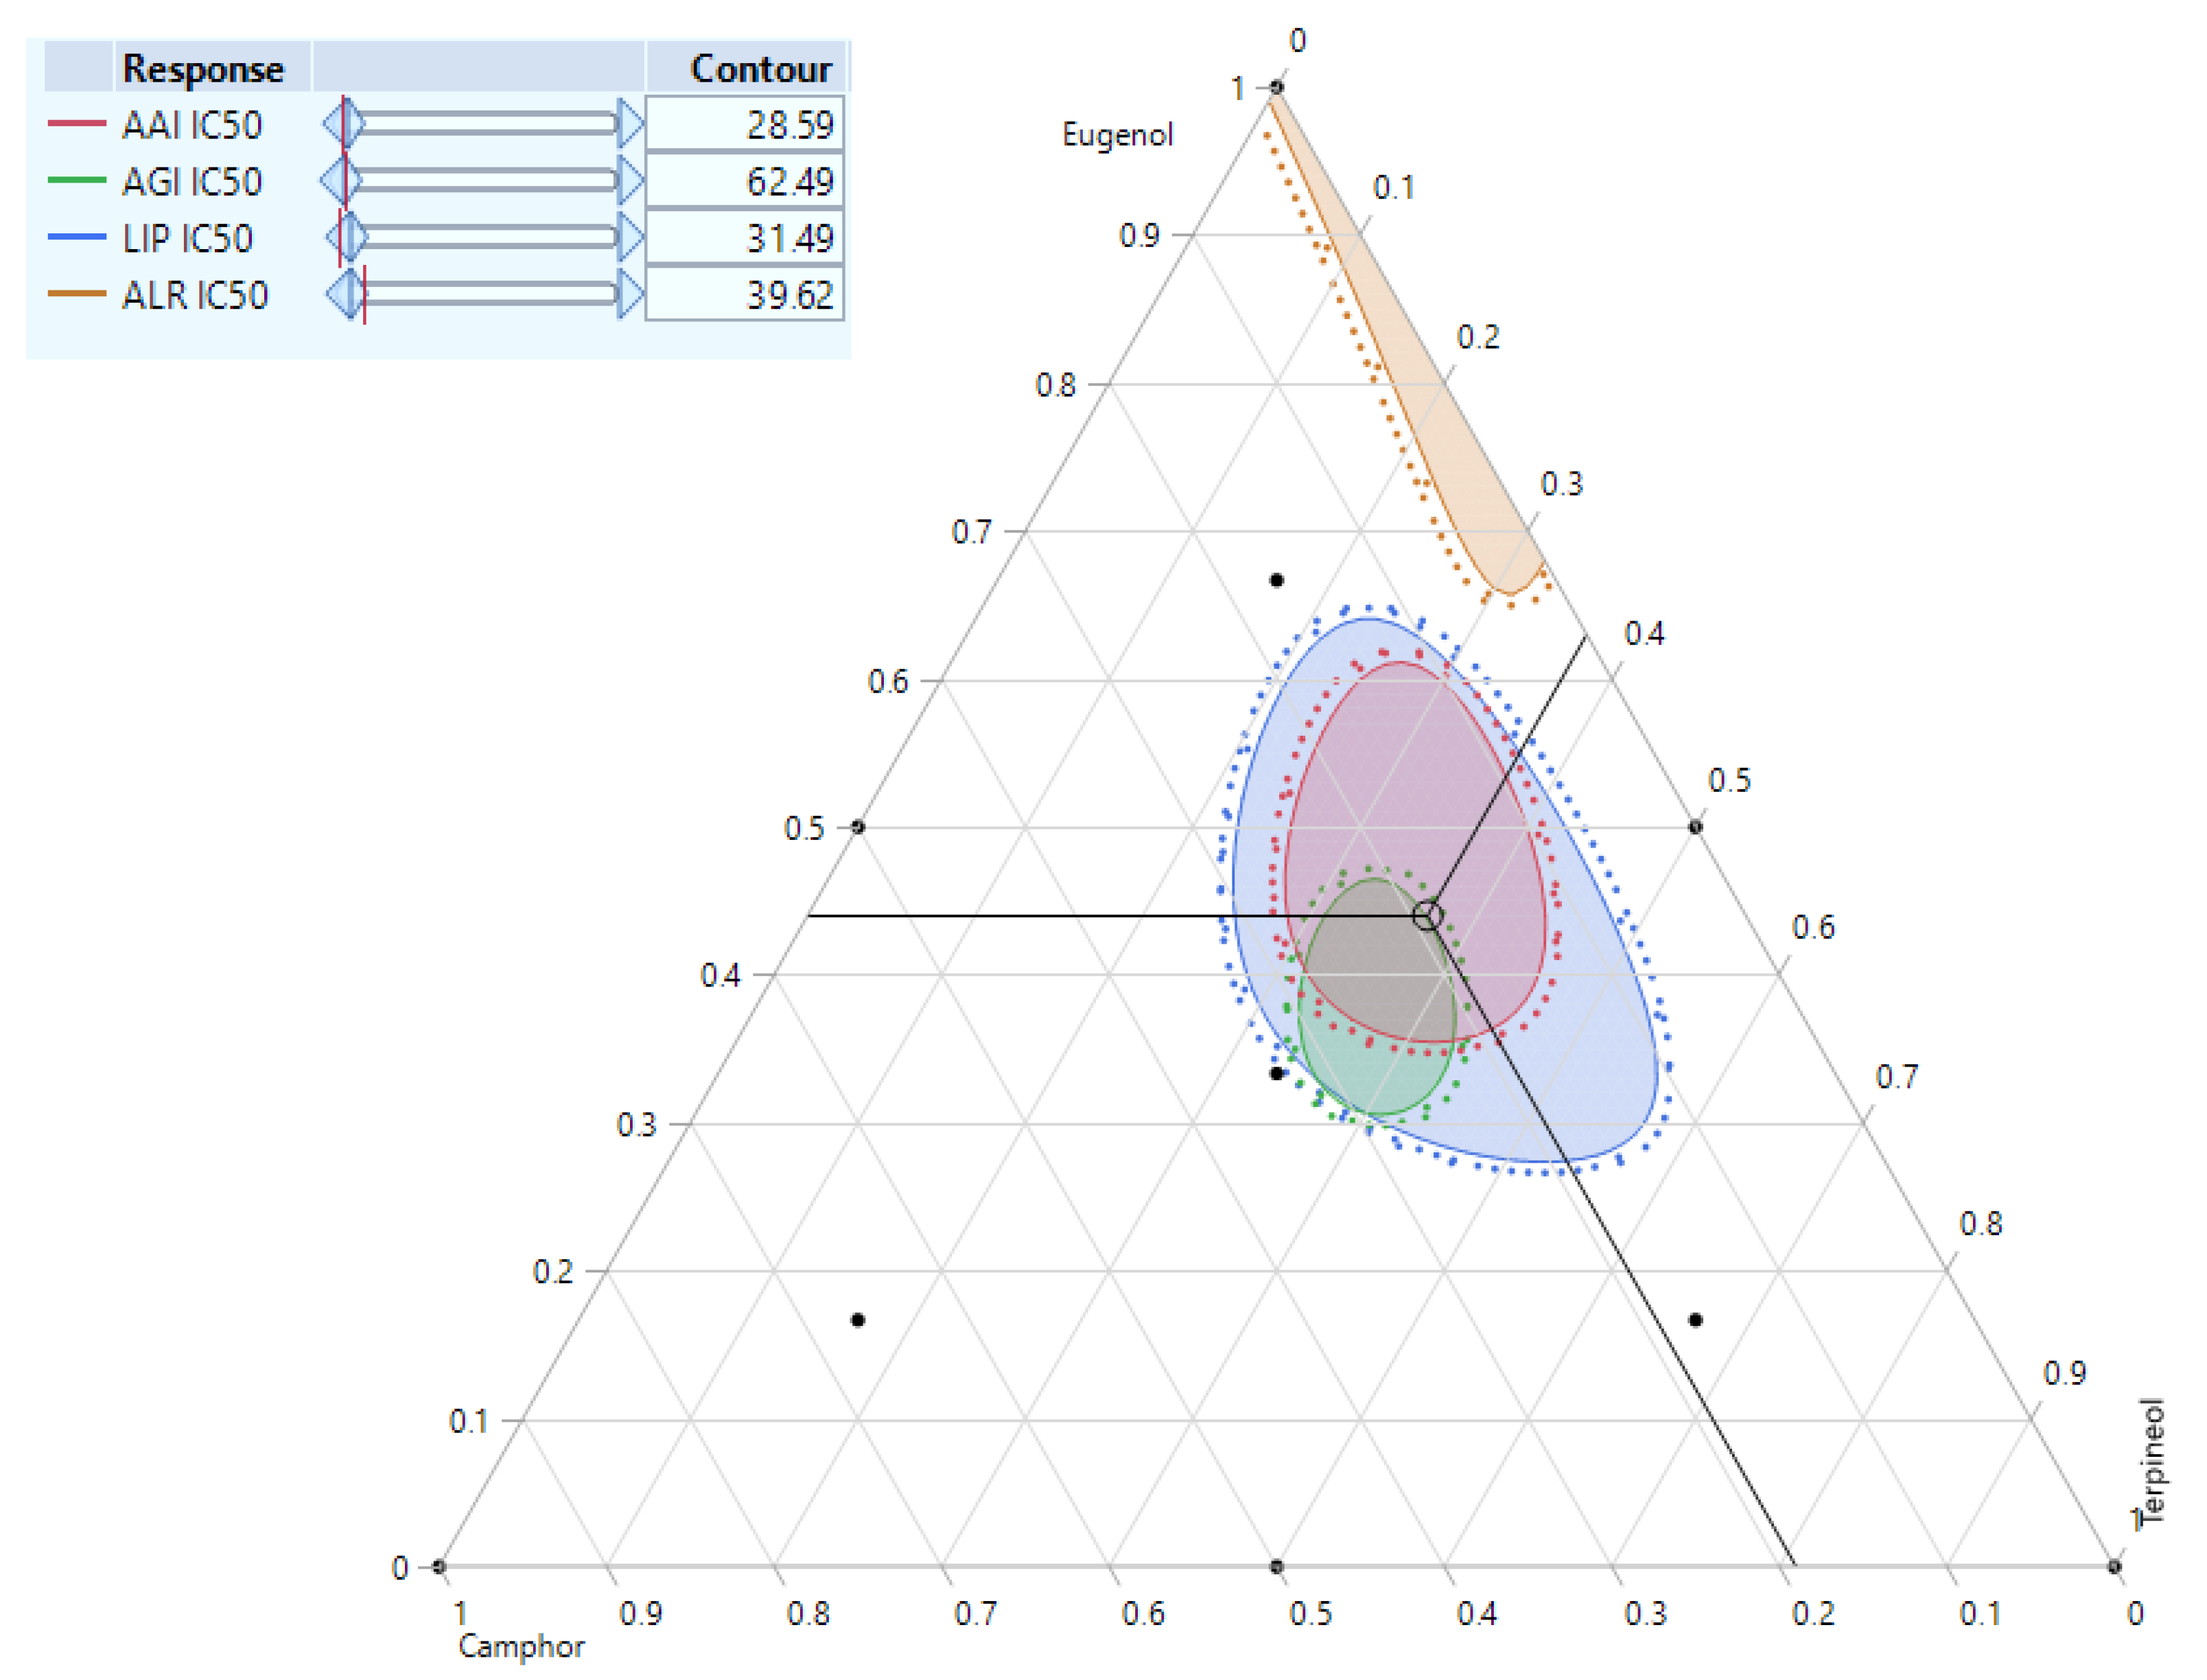
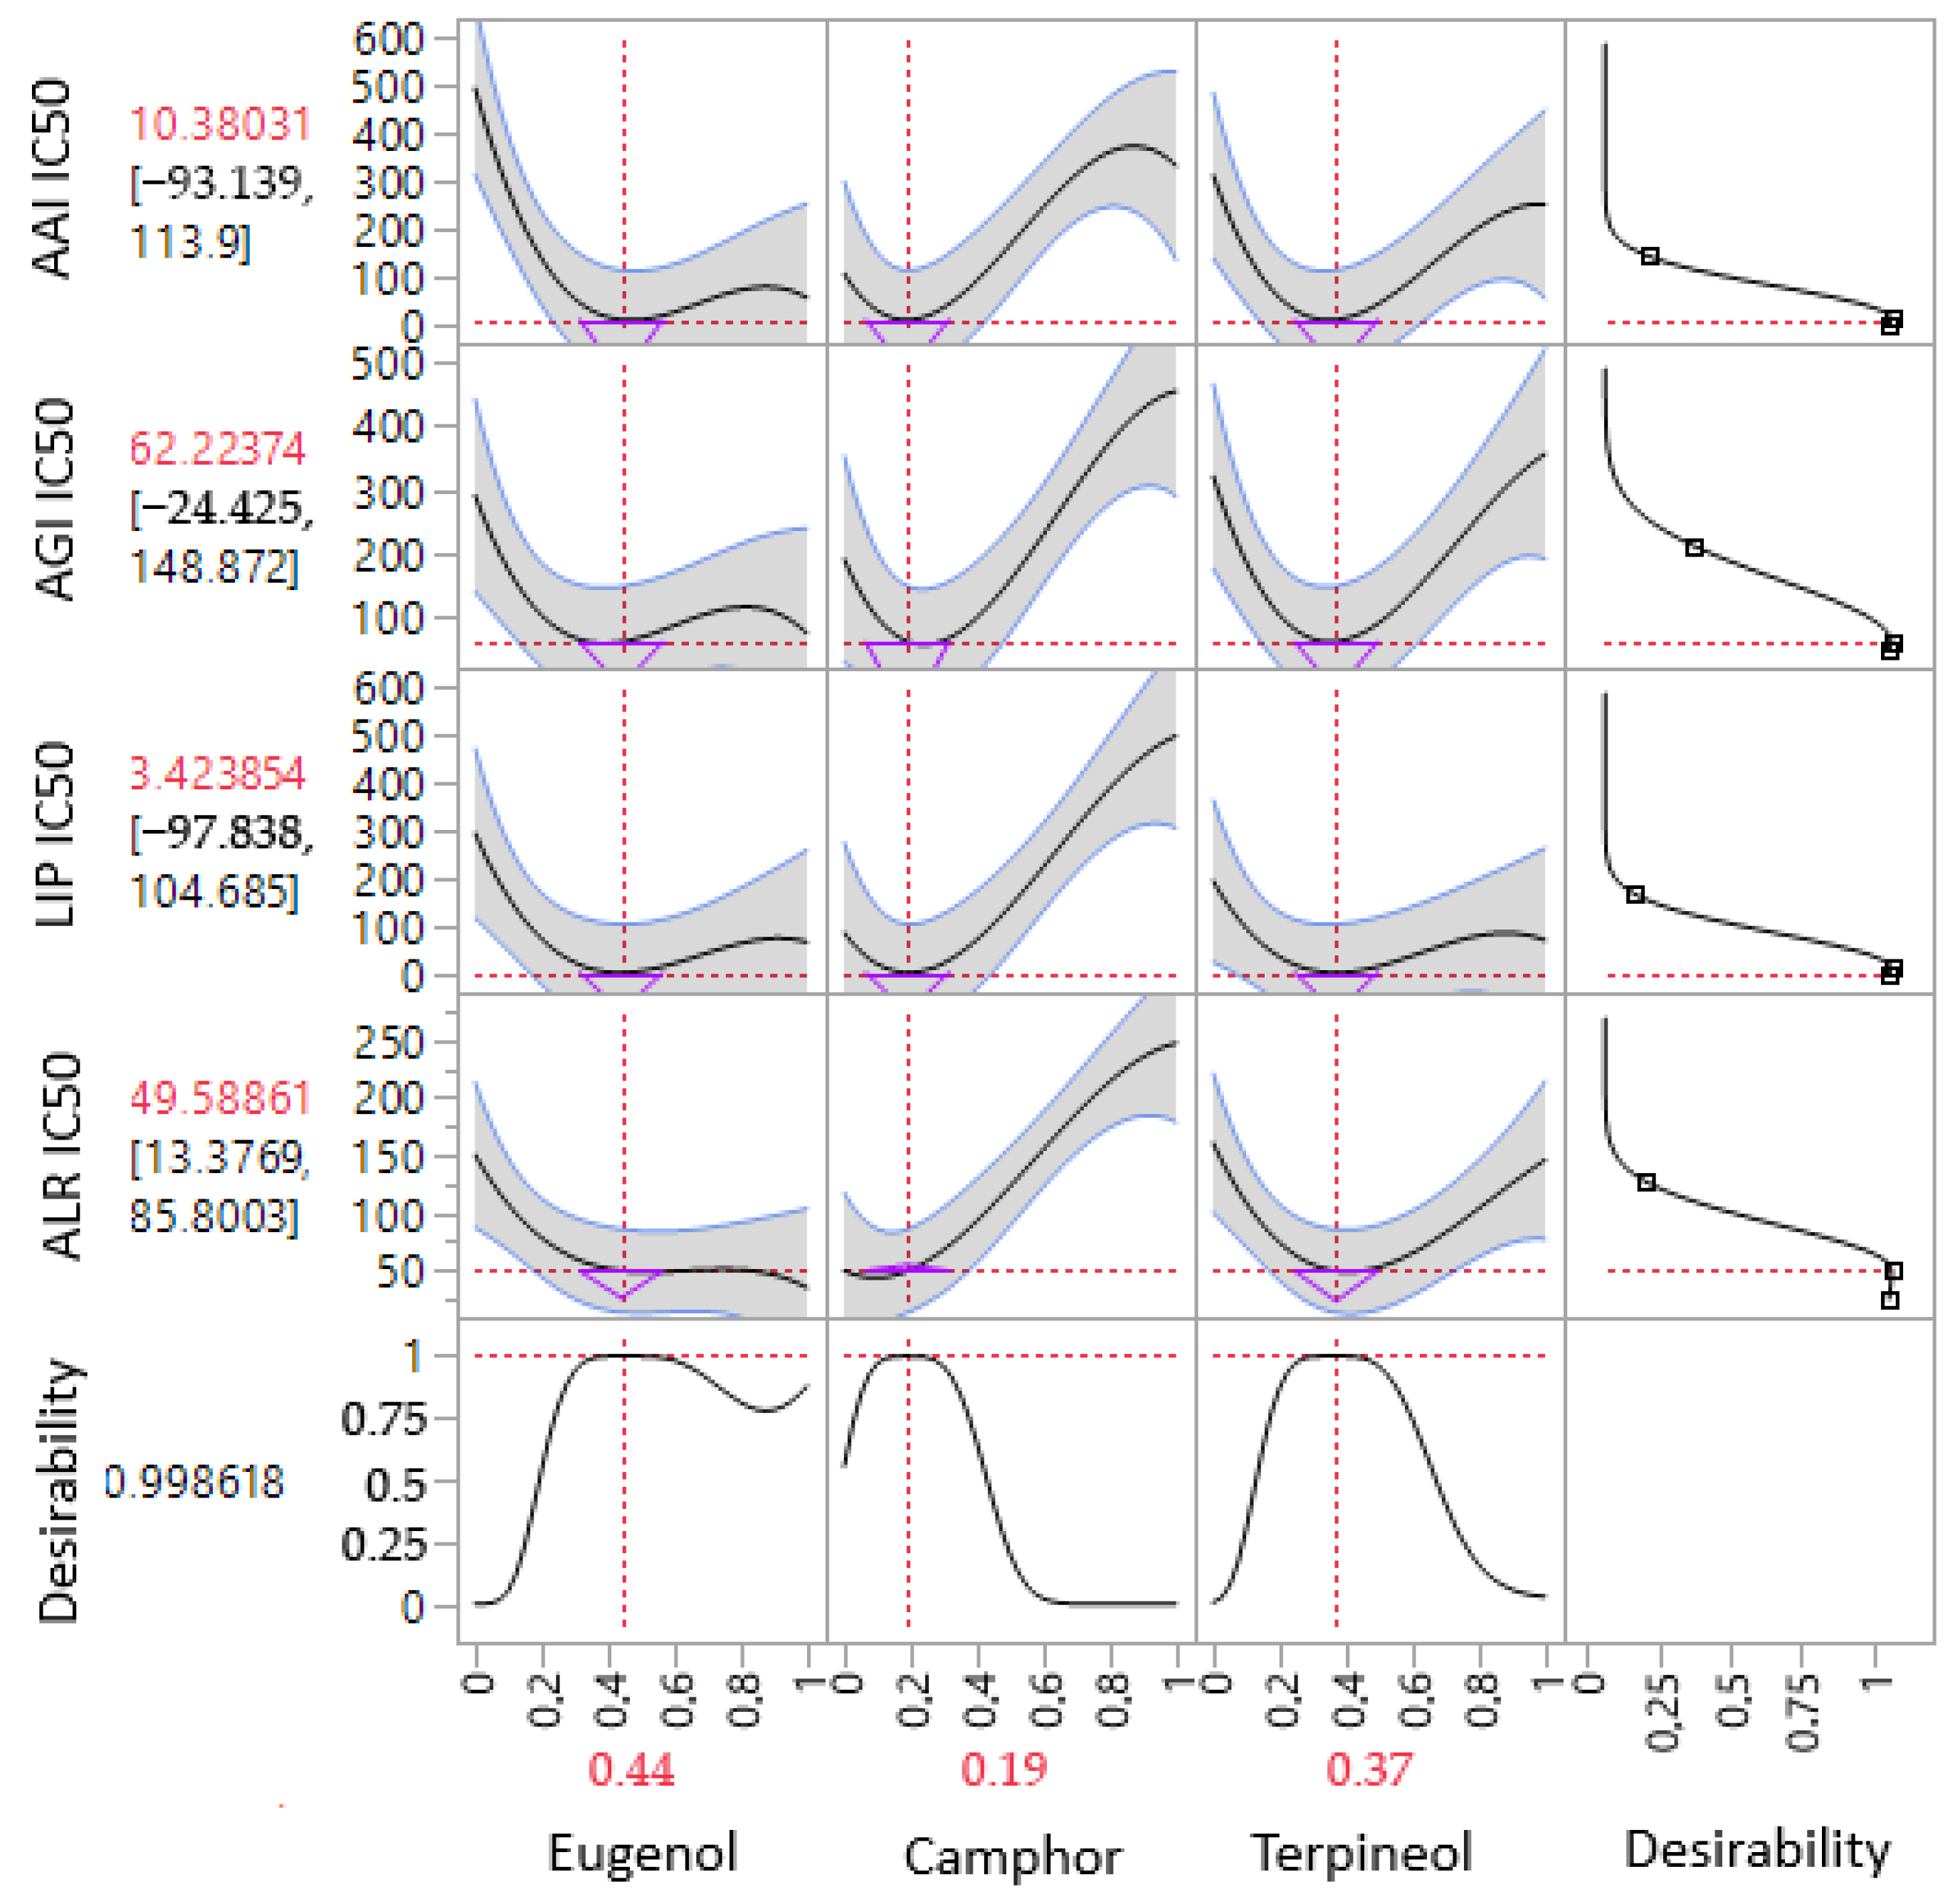
3.7. Simultaneous Response of the Compounds’ Mixture
3.8. Experimental Verification of the Assumed Model
3.9. Physico-Chemical Properties, Bioavailability, and Toxicity of Eugenol, Camphor, and Terpineol
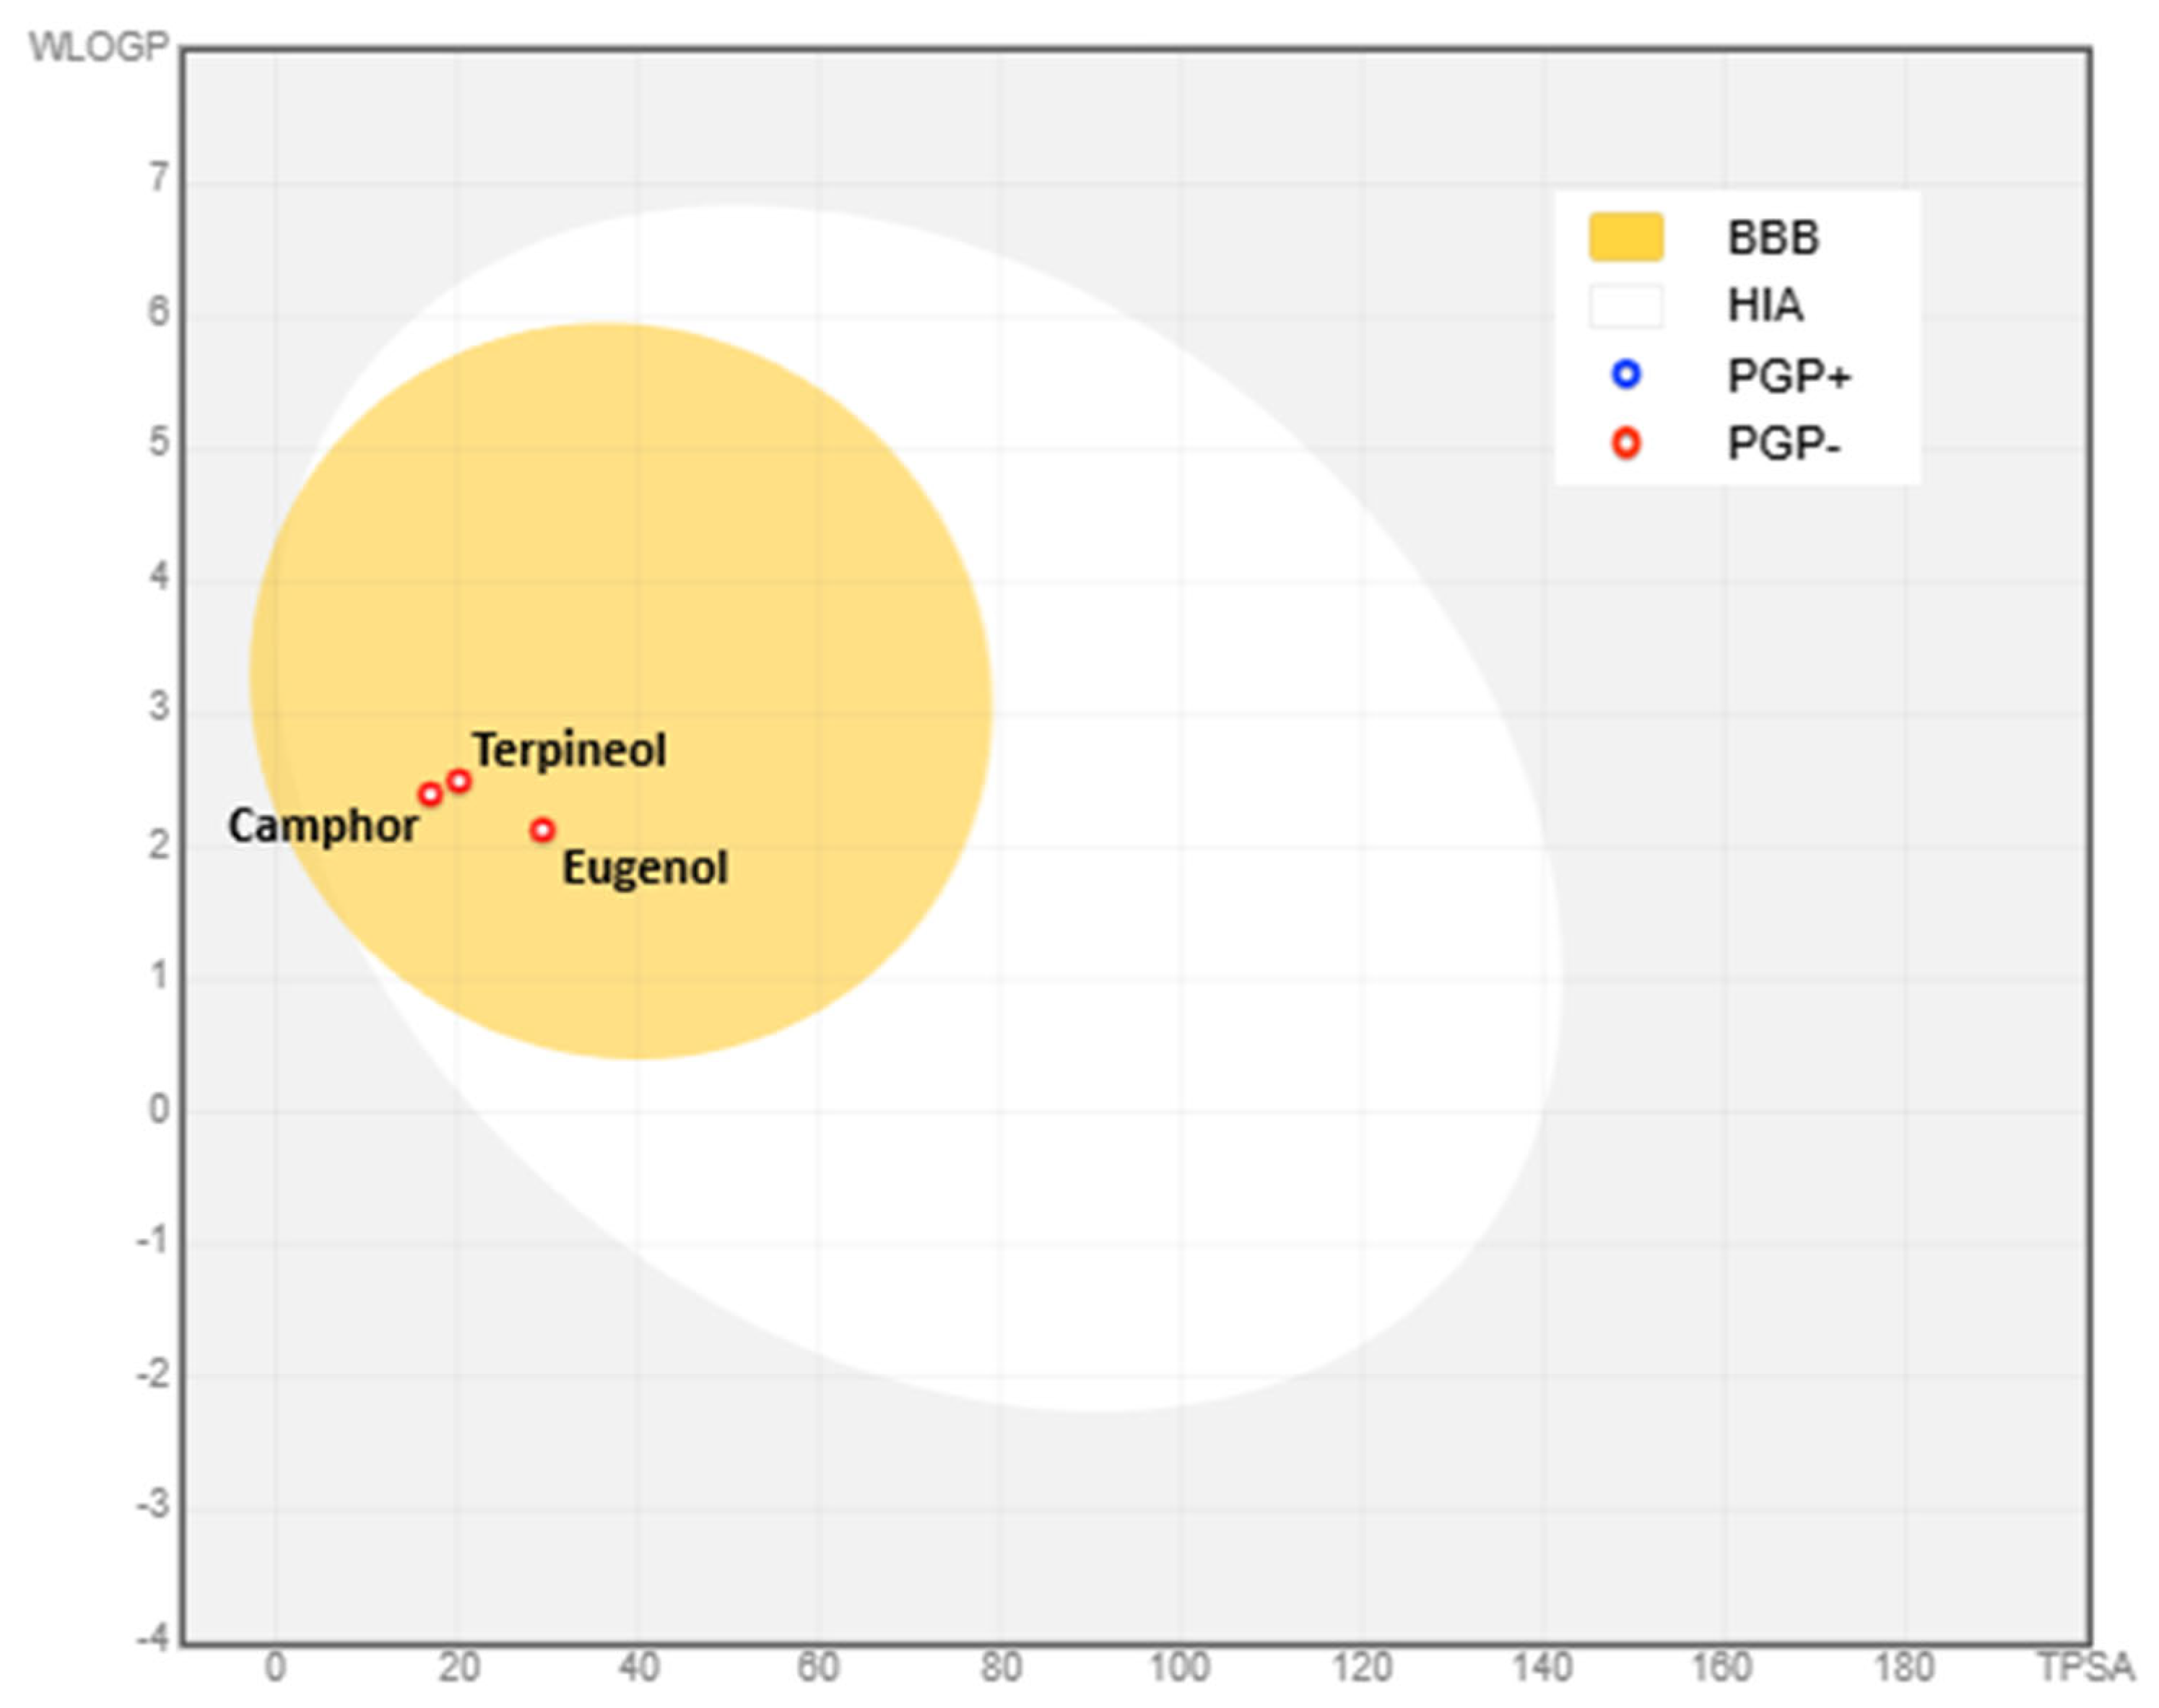
3.9.1. Physico-Chemical Properties and Bioavailability
3.9.2. In Silico Toxicity of the Compounds
4. Conclusions
Supplementary Materials
Author Contributions
Funding
Institutional Review Board Statement
Informed Consent Statement
Data Availability Statement
Conflicts of Interest
References
- Galicia-Garcia, U.; Benito-Vicente, A.; Jebari, S.; Larrea-Sebal, A.; Siddiqi, H.; Uribe, K.; Ostolaza, H.; Martín, C. Pathophysiology of Type 2 Diabetes Mellitus. Int. J. Mol. Sci. 2020, 21, 6275. [Google Scholar] [CrossRef] [PubMed]
- Demir, Y.; Durmaz, L.; Taslimi, P.; Gulcin, I. Antidiabetic Properties of Dietary Phenolic Compounds: Inhibition Effects on A-amylase, Aldose Reductase, and A-glycosidase. Biotechnol. Appl. Biochem. 2019, 66, 781–786. [Google Scholar] [CrossRef]
- Spínola, V.; Llorent-Martínez, E.; Castilho, P. Inhibition of α-Amylase, α-Glucosidase and Pancreatic Lipase by Phenolic Compounds of Rumex maderensis (Madeira Sorrel). Influence of Simulated Gastrointestinal Digestion on Hyperglycaemia-Related Damage Linked with Aldose Reductase Activity and Protein Glycation. LWT-Food Sci. Technol. 2020, 118, 108727. [Google Scholar] [CrossRef]
- Cho, N.; Cho, N.; Shaw, J.; Karuranga, S.; Huang, Y.; Fernandes, J.; Ohlrogge, A.; Malanda, B. IDF Diabetes Atlas: Global Estimates of Diabetes Prevalence for 2017 and Projections for 2045. Diabetes Res. Clin. Pract. 2018, 138, 271–281. [Google Scholar] [CrossRef]
- Alam, F.; Shafique, Z.; Amjad, S.T.; Asad, M.H.H. Bin Enzymes Inhibitors from Natural Sources with Antidiabetic Activity: A Review. Phytother. Res. 2018, 33, 41–54. [Google Scholar] [CrossRef] [PubMed]
- Carvalho, R.P.R.; Lima, G.; Machado-Neves, M. Effect of Eugenol Treatment in Hyperglycemic Murine Models: A Meta-Analysis. Pharmacol. Res. 2021, 165, 105315. [Google Scholar] [CrossRef]
- Al-Trad, B.; Alkhateeb, H.; Alsmadi, W.; Al-Zoubi, M. Eugenol Ameliorates Insulin Resistance, Oxidative Stress and Inflammation in High Fat-diet/Streptozotocin-induced Diabetic Rat. Life Sci. 2019, 216, 183. [Google Scholar] [CrossRef]
- Drikvandi, P.; Bahramikia, S.; Alirezaei, M. Modulation of the Antioxidant Defense System in Liver, Kidney, and Pancreas Tissues of Alloxan-induced Diabetic Rats by Camphor. J. Food Biochem. 2020, 44, e13527. [Google Scholar] [CrossRef]
- Adefegha, S.A.; Olasehinde, T.; Oboh, G. Essential Oil Composition, Antioxidant, Antidiabetic and Antihypertensive Properties of Two Afromomum Species. J. Oleo Sci. 2017, 66, 51–63. [Google Scholar] [CrossRef]
- Elbouzidi, A.; Taibi, M.; El Hachlafi, N.; Haddou, M.; Jeddi, M.; Baraich, A.; Bougrine, S.; Mothana, R.A.; Hawwal, M.F.; Alobaid, W.A. Optimization of the Antibacterial Activity of a Three-Component Essential Oil Mixture from Moroccan Thymus satureioides, Lavandula angustifolia, and Origanum majorana Using a Simplex–Centroid Design. Pharmaceuticals 2025, 18, 57. [Google Scholar] [CrossRef]
- Elbouzidi, A.; Taibi, M.; El Hachlafi, N.; Haddou, M.; Jeddi, M.; Baraich, A.; Aouraghe, A.; Bellaouchi, R.; Mothana, R.A.; Hawwal, M.F.; et al. Formulation of a Three-Component Essential Oil Mixture from Lavandula dentata, Rosmarinus officinalis, and Myrtus communis for Improved Antioxidant Activity. Pharmaceuticals 2024, 17, 1071. [Google Scholar] [CrossRef] [PubMed]
- Elbouzidi, A.; Taibi, M.; Baraich, A.; Haddou, M.; Loukili, E.H.; Asehraou, A.; Mesnard, F.; Addi, M. Enhancing Secondary Metabolite Production in Pelargonium graveolens Hort. Cell Cultures: Eliciting Effects of Chitosan and Jasmonic Acid on Bioactive Compound Production. Horticulturae 2024, 10, 521. [Google Scholar] [CrossRef]
- Benzie, I.F.F.; Strain, J.J. The Ferric Reducing Ability of Plasma (FRAP) as a Measure of “Antioxidant Power”: The FRAP Assay. Anal. Biochem. 1996, 239, 70–76. [Google Scholar] [CrossRef] [PubMed]
- Rodrigues, M.J.; Soszynski, A.; Martins, A.; Rauter, A.P.; Neng, N.R.; Nogueira, J.M.F.; Varela, J.; Barreira, L.; Custódio, L. Unravelling the Antioxidant Potential and the Phenolic Composition of Different Anatomical Organs of the Marine Halophyte Limonium algarvense. Ind. Crops Prod. 2015, 77, 315–322. [Google Scholar] [CrossRef]
- Salem, Y.; Rajha, H.N.; Franjieh, D.; Hoss, I.; Manca, M.L.; Manconi, M.; Castangia, I.; Perra, M.; Maroun, R.G.; Louka, N. Stability and Antioxidant Activity of Hydro-Glyceric Extracts Obtained from Different Grape Seed Varieties Incorporated in Cosmetic Creams. Antioxidants 2022, 11, 1348. [Google Scholar] [CrossRef]
- Gad, M.Z.; El-Sawalhi, M.M.; Ismail, M.F.; El-Tanbouly, N.D. Biochemical Study of the Anti-Diabetic Action of the Egyptian Plants Fenugreek and Balanites. Mol. Cell. Biochem. 2006, 281, 173–183. [Google Scholar] [CrossRef]
- Taibi, M.; Elbouzidi, A.; Haddou, M.; Baraich, A.; Loukili, E.H.; Moubchir, T.; Allali, A.; khoulati, A.; Bellaouchi, R.; Asehraou, A.; et al. Phytochemical Characterization and Multifaceted Bioactivity Assessment of Essential Oil from Ptychotis verticillata Duby: Anti-Diabetic, Anti-Tyrosinase, and Anti-Inflammatory Activity. Heliyon 2024, 10, e29459. [Google Scholar] [CrossRef] [PubMed]
- Li, H.; Song, F.; Xing, J.; Tsao, R.; Liu, Z.; Liu, S. Screening and Structural Characterization of α-Glucosidase Inhibitors from Hawthorn Leaf Flavonoids Extract by Ultrafiltration LC-DAD-MS n and SORI-CID FTICR MS. J. Am. Soc. Mass. Spectrom. 2009, 20, 1496–1503. [Google Scholar] [CrossRef]
- Bustanji, Y.; Issa, A.; Mohammad, M.; Hudaib, M.; Tawah, K.; Alkhatib, H.; Almasri, I.; Al-Khalidi, B. Inhibition of Hormone Sensitive Lipase and Pancreatic Lipase by Rosmarinus officinalis Extract and Selected Phenolic Constituents. J. Med. Plants Res. 2010, 4, 2235–2242. [Google Scholar]
- Jaradat, N.; Al-Maharik, N.; Hawash, M.; Qadi, M.; Issa, L.; Anaya, R.; Daraghmeh, A.; Hijleh, L.; Daraghmeh, T.; Alyat, A.; et al. Eucalyptus camaldulensis Dehnh Leaf Essential Oil from Palestine Exhibits Antimicrobial and Antioxidant Activity but No Effect on Porcine Pancreatic Lipase and α-Amylase. Plants 2023, 12, 3805. [Google Scholar] [CrossRef]
- Nishimura, C.; Yamaoka, T.; Mizutani, M.; Yamashita, K.; Akera, T.; Tanimoto, T. Purification and Characterization of the Recombinant Human Aldose Reductase Expressed in Baculovirus System. Biochim. Biophys. Acta 1991, 1078, 171–178. [Google Scholar] [CrossRef]
- Benkhaira, N.; Zouine, N.; Fadil, M.; Ibnsouda Koraichi, S.; El Hachlafi, N.; Jeddi, M.; Lachkar, M.; Fikri-Benbrahim, K. Application of Mixture Design for the Optimum Antibacterial Action of Chemically-Analyzed Essential Oils and Investigation of the Antiadhesion Ability of Their Optimal Mixtures on 3D Printing Material. Bioprinting 2023, 34, e00299. [Google Scholar] [CrossRef]
- Ogata, M.; Hoshi, M.; Urano, S.; Endō, T. Antioxidant Activity of Eugenol and Related Monomeric and Dimeric Compounds. Chem. Pharm. Bull. 2000, 48, 1467–1469. [Google Scholar] [CrossRef]
- Ferreira, R.; Greco, S.; Delarmelina, M.; Weber, K. Electrochemical Quantification of the Structure/Antioxidant Activity Relationship of Flavonoids. Electrochim. Acta 2015, 163, 161–166. [Google Scholar] [CrossRef]
- Sharopov, F.; Wink, M.; Setzer, W. Radical Scavenging and Antioxidant Activities of Essential Oil Components—An Experimental and Computational Investigation. Nat. Prod. Commun. 2015, 10, 1934578X1501000135. [Google Scholar] [CrossRef]
- Sharma, P.; Singh, V.; Baldi, A. Allo-Polyherbal Approaches for Managing Metabolic Syndrome: A Narrative Review. Nat. Prod. J. 2024, 14, e121023222118. [Google Scholar] [CrossRef]
- Grewal, A.; Bhardwaj, S.; Pandita, D.; Lather, V.; Sekhon, B. Updates on Aldose Reductase Inhibitors for Management of Diabetic Complications and Non-Diabetic Diseases. Mini Rev. Med. Chem. 2015, 16, 120–162. [Google Scholar] [CrossRef]
- Bedekar, A.; Shah, K.; Koffas, M. Natural Products for Type II Diabetes Treatment. Adv. Appl. Microbiol. 2010, 71, 21–73. [Google Scholar]
- Yamagishi, S.; Nakamura, K.; Takeuchi, M. Inhibition of Postprandial Hyperglycemia by Acarbose Is a Promising Therapeutic Strategy for the Treatment of Patients with the Metabolic Syndrome. Med. Hypotheses 2005, 65, 152–154. [Google Scholar] [CrossRef]
- Stevens, N.; Allred, K. Antidiabetic Potential of Volatile Cinnamon Oil: A Review and Exploration of Mechanisms Using in Silico Molecular Docking Simulations. Molecules 2022, 27, 853. [Google Scholar] [CrossRef]
- Hossain, U.; Das, A.K.; Ghosh, S.; Sil, P.C. An Overview on the Role of Bioactive α-Glucosidase Inhibitors in Ameliorating Diabetic Complications. Food Chem. Toxicol. 2020, 145, 111738. [Google Scholar] [CrossRef] [PubMed]
- Heck, A.M.; Yanovski, J.A.; Calis, K.A. Orlistat, a New Lipase Inhibitor for the Management of Obesity. Pharmacother. J. Hum. Pharmacol. Drug Ther. 2000, 20, 270–279. [Google Scholar] [CrossRef]
- Testa, R.; Bonfigli, A.R.; Genovese, S.; De Nigris, V.; Ceriello, A. The Possible Role of Flavonoids in the Prevention of Diabetic Complications. Nutrients 2016, 8, 310. [Google Scholar] [CrossRef] [PubMed]
- Kachkoul, R.; Benjelloun Touimi, G.; Bennani, B.; El Habbani, R.; El Mouhri, G.; Mohim, M.; Sqalli Houssaini, T.; Chebaibi, M.; Koulou, A.; Lahrichi, A. The Synergistic Effect of Three Essential Oils against Bacteria Responsible for the Development of Lithiasis Infection: An Optimization by the Mixture Design. Evid.-Based Complement. Altern. Med. 2021, 2021, 1305264. [Google Scholar] [CrossRef] [PubMed]
- Bassolé, I.H.N.; Juliani, H.R. Essential Oils in Combination and Their Antimicrobial Properties. Molecules 2012, 17, 3989–4006. [Google Scholar] [CrossRef]
- Loukili, E.H.; Fadil, M.; Elrherabi, A.; Er-Rajy, M.; Taibi, M.; Azzaoui, K.; Salghi, R.; Sabbahi, R.; Alanazi, M.M.; Rhazi, L. Inhibition of Carbohydrate Digestive Enzymes by a Complementary Essential Oil Blend: In Silico and Mixture Design Approaches. Front. Pharmacol. 2025, 16, 1522124. [Google Scholar] [CrossRef]
- de Almeida, A.L.; Caleffi-Ferracioli, K.R.; de L Scodro, R.B.; Baldin, V.P.; Montaholi, D.C.; Spricigo, L.F.; Nakamura-Vasconcelos, S.S.; Hegeto, L.A.; Sampiron, E.G.; Costacurta, G.F. Eugenol and Derivatives Activity against Mycobacterium tuberculosis, Nontuberculous Mycobacteria and Other Bacteria. Future Microbiol. 2019, 14, 331–344. [Google Scholar] [CrossRef]
- Pérez-Flores, J.G.; García-Curiel, L.; Pérez-Escalante, E.; Contreras-López, E.; Aguilar-Lira, G.Y.; Ángel-Jijón, C.; González-Olivares, L.G.; Baena-Santillán, E.S.; Ocampo-Salinas, I.O.; Guerrero-Solano, J.A. Plant Antimicrobial Compounds and Their Mechanisms of Action on Spoilage and Pathogenic Bacteria: A Bibliometric Study and Literature Review. Appl. Sci. 2025, 15, 3516. [Google Scholar] [CrossRef]
- Gülçin, İ. Antioxidant Activity of Eugenol: A Structure–Activity Relationship Study. J. Med. Food 2011, 14, 975–985. [Google Scholar] [CrossRef]
- Sales, A.; Felipe, L.d.O.; Bicas, J.L. Production, Properties, and Applications of α-Terpineol. Food Bioproc. Technol. 2020, 13, 1261–1279. [Google Scholar] [CrossRef]
- Khaleel, C.; Tabanca, N.; Buchbauer, G. α-Terpineol, a Natural Monoterpene: A Review of Its Biological Properties. Open Chem. 2018, 16, 349–361. [Google Scholar] [CrossRef]
- Barbosa, L.N.; Alves, F.C.B.; Andrade, B.F.M.T.; Albano, M.; Rall, V.L.M.; Fernandes, A.A.H.; Buzalaf, M.A.R.; de Lima Leite, A.; de Pontes, L.G.; Dos Santos, L.D. Proteomic Analysis and Antibacterial Resistance Mechanisms of Salmonella enteritidis Submitted to the Inhibitory Effect of Origanum vulgare Essential Oil, Thymol and Carvacrol. J. Proteom. 2020, 214, 103625. [Google Scholar] [CrossRef] [PubMed]
- Aksoy, C.S. Evaluation of Thymol and Carvacrol as Efflux Pumps Inhibitors in Staphylococcus aureus. Master’s Thesis, Marmara University, Istanbul, Türkiye, 2019. [Google Scholar]
- Jia, C.-Y.; Li, J.-Y.; Hao, G.-F.; Yang, G.-F. A Drug-Likeness Toolbox Facilitates ADMET Study in Drug Discovery. Drug Discov. Today 2020, 25, 248–258. [Google Scholar] [CrossRef] [PubMed]
- Ursu, O.; Rayan, A.; Goldblum, A.; Oprea, T.I. Understanding Drug-likeness. Wiley Interdiscip. Rev. Comput. Mol. Sci. 2011, 1, 760–781. [Google Scholar] [CrossRef]
- Tian, S.; Wang, J.; Li, Y.; Li, D.; Xu, L.; Hou, T. The Application of in Silico Drug-Likeness Predictions in Pharmaceutical Research. Adv. Drug Deliv. Rev. 2015, 86, 2–10. [Google Scholar] [CrossRef]
- Martin, Y.C. A Bioavailability Score. J. Med. Chem. 2005, 48, 3164–3170. [Google Scholar] [CrossRef]
- Santos, C.D.; Cabot, J.C. Persistent Effects after Camphor Ingestion: A Case Report and Literature Review. J. Emerg. Med. 2015, 48, 298–304. [Google Scholar] [CrossRef]
- Afrin, S.; Haneefa, S.M.; Fernandez-Cabezudo, M.J.; Giampieri, F.; Al-Ramadi, B.K.; Battino, M. Therapeutic and Preventive Properties of Honey and Its Bioactive Compounds in Cancer: An Evidence-Based Review. Nutr. Res. Rev. 2020, 33, 50–76. [Google Scholar] [CrossRef]


| Components | Coded Variables | Level − | Level + |
|---|---|---|---|
| Eugenol | M1 | 0 | 1 |
| Camphor | M2 | 0 | 1 |
| Terpineol | M3 | 0 | 1 |
| Sum of proportions | 1 | ||
| No. a | Eugenol | Camphor | Terpineol | Enzymatic Inhibition—IC50 (µg/mL) b | |||
|---|---|---|---|---|---|---|---|
| AAIIC50 | AGIIC50 | LIPIC50 | ALRIC50 | ||||
| 1 | 1 | 0 | 0 | 55.63 ± 1.95 | 84.93 ± 6.14 | 63.69 ± 2.11 | 39.62 ± 1.78 |
| 2 | 0 | 1 | 0 | 355.82 ± 14.30 | 484.95 ± 17.65 | 538.73 ± 21.57 | 259.79 ± 8.65 |
| 3 | 0 | 0 | 1 | 267.97 ± 6.75 | 340.42 ± 23.19 | 60.42 ± 1.98 | 138.63 ± 2.09 |
| 4 | 0.50 | 0.50 | 0 | 420.49 ± 18.80 | 459.53 ± 26.98 | 315.85 ± 5.81 | 230.59 ± 5.60 |
| 5 | 0.50 | 0 | 0.50 | 131.85 ± 13.04 | 198.69 ± 8.48 | 71.93 ± 3.40 | 52.42 ± 3.21 |
| 6 | 0 | 0.50 | 0.50 | 569.09 ± 30.98 | 310.76 ± 13.63 | 398.12 ± 18.04 | 167.83 ± 2.58 |
| 7 | 0.333 | 0.333 | 0.333 | 92.85 ± 8.45 | 93.67 ± 3.47 | 62.55 ± 3.13 | 87.52 ± 1.29 |
| 8 | 0.333 | 0.333 | 0.333 | 80.69 ± 5.37 | 88.57 ± 9.85 | 71.42 ± 4.59 | 82.94 ± 4.08 |
| 9 | 0.333 | 0.333 | 0.333 | 117.50 ± 9.84 | 95.84 ± 5.09 | 63.74 ± 3.96 | 80.47 ± 6.86 |
| 10 | 0.667 | 0.167 | 0.167 | 28.59 ± 0.42 | 62.49 ± 2.18 | 31.49 ± 1.30 | 42.42 ± 2.09 |
| 11 | 0.167 | 0.667 | 0.167 | 183.49 ± 6.19 | 155.85 ± 3.13 | 131.78 ± 2.34 | 125.53 ± 7.65 |
| 12 | 0.167 | 0.167 | 0.667 | 84.59 ± 2.58 | 191.42 ± 1.34 | 82.53 ± 5.22 | 98.04 ± 2.13 |
| Acarbose | - | - | - | 39.63 ± 2.41 | 59.22 ± 1.94 | - | - |
| Orlistat | - | - | - | - | - | 76.89 ± 5.52 | - |
| Quercetin | - | - | - | - | - | - | 38.63 ± 1.63 |
| AAIIC50 | Model | DF | SS | MS | F | p-value |
| R | 6 | 283,358.31 | 47,226.4 | 7.5305 | 0.0213 * | |
| r | 5 | 31,356.65 | 6271.3 | |||
| PE | 2 | 703.488 | 351.7 | |||
| Total | 11 | 314,714.96 | ||||
| R2 | 0.91 | |||||
| R2 adj | 0.78 | |||||
| AGIIC50 | Model | DF | SS | MS | F | p-value |
| R | 6 | 224,988.16 | 37,498.0 | 8.5343 | 0.0163 * | |
| r | 5 | 21,968.97 | 4393.8 | |||
| PE | 2 | 27.857 | 13.93 | |||
| Total | 11 | 246,957.13 | ||||
| R2 | 0.96 | |||||
| R2 adj | 0.85 | |||||
| LIPIC50 | Model | DF | SS | MS | F | p-value |
| R | 6 | 271,228.68 | 45,204.8 | 7.5332 | 0.0213 * | |
| r | 5 | 30,003.74 | 6000.7 | |||
| PE | 2 | 46.358 | 23.18 | |||
| Total | 11 | 301,232.41 | ||||
| R2 | 0.96 | |||||
| R2 adj | 0.85 | |||||
| ALRIC50 | Model | DF | SS | MS | F | p-value |
| R | 6 | 52,022.268 | 8670.38 | 11.2986 | 0.0088 * | |
| r | 5 | 3836.934 | 767.39 | |||
| PE | 2 | 25.5933 | 12.80 | |||
| Total | 11 | 55,859.203 | ||||
| R2 | 0.97 | |||||
| R2 adj | 0.89 | |||||
| Term | Coefficients | AAI IC50 | AGIIC50 | LIPIC50 | ALRIC50 | ||||
|---|---|---|---|---|---|---|---|---|---|
| Estimation | p-Value | Estimation | p-Value | Estimation | p-Value | Estimation | p-Value | ||
| Eugenol (Mixture) | δ1 | 56.3055 | 0.4947 | 75.31413 | 0.2924 | 67.58667 | 0.4077 | 34.965319 | 0.2481 |
| Camphor (Mixture) | δ2 | 331.7018 | 0.0074 * | 454.2423 | 0.0009 * | 497.1394 | 0.0012 * | 247.29442 | 0.0002 * |
| Terpineol (Mixture) | δ3 | 251.1055 | 0.0219 * | 356.2650 | 0.0026 * | 71.05483 | 0.3858 | 145.84896 | 0.0028 * |
| Eugenol × Camphor | δ12 | 812.1742 | 0.0888 | 617.7124 | 0.1135 | −16.8283 | 0.9661 | 289.23923 | 0.0846 |
| Eugenol × Terpineol | δ13 | −152.178 | 0.7090 | −43.4816 | 0.8980 | 68.56309 | 0.8627 | −141.6914 | 0.3411 |
| Camphor × Terpineol | δ23 | 946.8141 | 0.0573 | −437.425 | 0.2328 | 332.2680 | 0.4182 | −136.0733 | 0.3588 |
| Eugenol × Camphor × Terpineol | δ123 | −9041.406 | 0.0076 * | −6541.029 | 0.0136 * | −5825.262 | 0.0361 * | −1897.183 | 0.0489 * |
| Enzymes. | IC50 (µg/mL) | t-Statistic | p-Value | Proportions of Each Compound (%) | |||
|---|---|---|---|---|---|---|---|
| Eugenol | Camphor | Terpineol | |||||
| α-amylase (AAI) | Predi. a | 9.60 ± 0.00 | −2.5207 | 0.0653 | 47% | 18% | 35% |
| Exp. b | 11.23 ± 1.12 | ||||||
| α-glucosidase (AGI) | Predi. | 56.18 ± 0.00 | 2.7429 | 0.0517 | 38% | 25% | 37% |
| Exp. | 51.73 ± 2.81 | ||||||
| Lipase (LIP) | Predi. | 3.38 ± 0.00 | −2.3316 | 0.0801 | 44% | 19% | 37% |
| Exp. | 3.73 ± 0.26 | ||||||
| Aldose reductase (ALR) | Predi. | 33.29 ± 0.00 | −1.8759 | 0.1339 | 89% | 0 | 11% |
| Exp. | 36.94 ± 3.37 | ||||||
| Characteristics | Eugenol | Camphor | Terpineol |
|---|---|---|---|
| Structure | 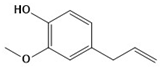 |  | 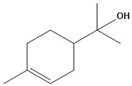 |
| Molecular formula | C10H12O2 | C10H16O | C10H18O |
| Physico-chemical properties and drug-likeness | |||
| MW (g/mol) | 164.20 | 152.23 | 154.25 |
| TPSA (Å2) | 29.46 | 17.07 | 20.23 |
| Num. H-Bond acceptors | 2 | 1 | 1 |
| Num. H-Bond donors | 1 | 0 | 1 |
| Rotatable bonds | 3 | 0 | 1 |
| LogP | 2.13 | 2.40 | 2.50 |
| Lipinski * | Yes, no violation | Yes, no violation | Yes, no violation |
| Egan ** | Yes | Yes | Yes |
| Veber *** | Yes | Yes | Yes |
| Bioavailability score | 0.55 | 0.55 | 0.55 |
| Bioavailability radars | 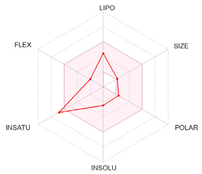 | 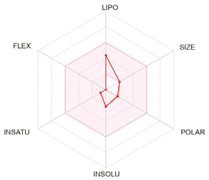 | 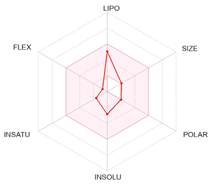 |
| Compound | Predicted LD50 (mg/kg) | Class | Nephrotoxicity | Hepatotoxicity | Carcinogenicity | Immunotoxicity | Mutagenicity | Cytotoxicity |
|---|---|---|---|---|---|---|---|---|
| Eugenol | 1930 | IV | Ina. (0.63) | Ina. (0.67) | Ina. (0.73) | Ina. (0.83) | Ina. (0.97) | Ina. (0.90) |
| Camphor | 775 | IV | Ina. (0.89) | Ina. (0.72) | Ina. (0.68) | Ina. (0.96) | Ina. (0.94) | Ina. (0.61) |
| Terpineol | 2830 | V | Ina. (0.89) | Ina. (0.72) | Ina. (0.76) | Ina. (0.99) | Ina. (0.90) | Ina. (0.64) |
Disclaimer/Publisher’s Note: The statements, opinions and data contained in all publications are solely those of the individual author(s) and contributor(s) and not of MDPI and/or the editor(s). MDPI and/or the editor(s) disclaim responsibility for any injury to people or property resulting from any ideas, methods, instructions or products referred to in the content. |
© 2025 by the authors. Licensee MDPI, Basel, Switzerland. This article is an open access article distributed under the terms and conditions of the Creative Commons Attribution (CC BY) license (https://creativecommons.org/licenses/by/4.0/).
Share and Cite
Elbouzidi, A.; Jeddi, M.; Baraich, A.; Taibi, M.; Haddou, M.; El Hachlafi, N.; Yahyaoui, M.I.; Bellaouchi, R.; El Guerrouj, B.; Chaabane, K.; et al. Optimization of Eugenol, Camphor, and Terpineol Mixture Using Simplex-Centroid Design for Targeted Inhibition of Key Antidiabetic Enzymes. Curr. Issues Mol. Biol. 2025, 47, 512. https://doi.org/10.3390/cimb47070512
Elbouzidi A, Jeddi M, Baraich A, Taibi M, Haddou M, El Hachlafi N, Yahyaoui MI, Bellaouchi R, El Guerrouj B, Chaabane K, et al. Optimization of Eugenol, Camphor, and Terpineol Mixture Using Simplex-Centroid Design for Targeted Inhibition of Key Antidiabetic Enzymes. Current Issues in Molecular Biology. 2025; 47(7):512. https://doi.org/10.3390/cimb47070512
Chicago/Turabian StyleElbouzidi, Amine, Mohamed Jeddi, Abdellah Baraich, Mohamed Taibi, Mounir Haddou, Naoufal El Hachlafi, Meryem Idrissi Yahyaoui, Reda Bellaouchi, Bouchra El Guerrouj, Khalid Chaabane, and et al. 2025. "Optimization of Eugenol, Camphor, and Terpineol Mixture Using Simplex-Centroid Design for Targeted Inhibition of Key Antidiabetic Enzymes" Current Issues in Molecular Biology 47, no. 7: 512. https://doi.org/10.3390/cimb47070512
APA StyleElbouzidi, A., Jeddi, M., Baraich, A., Taibi, M., Haddou, M., El Hachlafi, N., Yahyaoui, M. I., Bellaouchi, R., El Guerrouj, B., Chaabane, K., & Addi, M. (2025). Optimization of Eugenol, Camphor, and Terpineol Mixture Using Simplex-Centroid Design for Targeted Inhibition of Key Antidiabetic Enzymes. Current Issues in Molecular Biology, 47(7), 512. https://doi.org/10.3390/cimb47070512