Article

Genomic Fabrics of the Excretory System’s Functional Pathways Remodeled in Clear Cell Renal Cell Carcinoma

by
Dumitru Andrei Iacobas
1,*,
Ehiguese Alade Obiomon
1 and
Sanda Iacobas
2
1
Personalized Genomics Laboratory, Undergraduate Medical Academy, Prairie View A&M University, Prairie View, TX 77446, USA
2
Department of Pathology, New York Medical College, Valhalla, NY 10595, USA
*
Author to whom correspondence should be addressed.
Curr. Issues Mol. Biol. 2023, 45(12), 9471-9499; https://doi.org/10.3390/cimb45120594
Submission received: 19 October 2023 / Revised: 18 November 2023 / Accepted: 21 November 2023 / Published: 24 November 2023
(This article belongs to the Special Issue Advanced Molecular Solutions for Cancer Therapy)

Abstract

:
Clear cell renal cell carcinoma (ccRCC) is the most frequent form of kidney cancer. Metastatic stages of ccRCC reduce the five-year survival rate to 15%. In this report, we analyze the ccRCC-induced remodeling of the five KEGG-constructed excretory functional pathways in a surgically removed right kidney and its metastasis in the chest wall from the perspective of the Genomic Fabric Paradigm (GFP). The GFP characterizes every single gene in each region by these independent variables: the average expression level (AVE), relative expression variability (REV), and expression correlation (COR) with each other gene. While the traditional approach is limited to only AVE analysis, the novel REV analysis identifies the genes whose correct expression level is critical for cell survival and proliferation. The COR analysis determines the real gene networks responsible for functional pathways. The analyses covered the pathways for aldosterone-regulated sodium reabsorption, collecting duct acid secretion, endocrine and other factor-regulated sodium reabsorption, proximal tubule bicarbonate reclamation, and vasopressin-regulated water reabsorption. The present study confirms the conclusion of our previously published articles on prostate and kidney cancers that even equally graded cancer nodules from the same tumor have different transcriptomic topologies. Therefore, the personalization of anti-cancer therapy should go beyond the individual, to his/her major cancer nodules.

1. Introduction

Limits of the Gene Biomarker Paradigm in Cancer Diagnostics and Therapy

Cancer is a major cause of death worldwide and is likely the most funded and researched group of lethal diseases. Depending on the tumor localization, size, and metastatic stage, treatment options in specialized clinics may include surgery, chemotherapy, radiation therapy, hormone therapy, bone marrow transplantation, targeted therapy, and immunotherapy [1]. For smaller tumors, at early stages, thermal ablation offers a low-risk and minimally invasive solution [2,3]. Nevertheless, despite all the academic and industry efforts, we still do not have an efficient answer to cancer, suggesting the need for a novel approach.
According to the American Cancer Society, 52,360 men and 29,440 women are expected to be diagnosed with kidney and pelvis cancer in 2023, out of whom 9920 men and 4970 women may die from this disease [4]. The prevalence of kidney cancer is strongly dependent on age (most diagnosed people are over 65 years old), sex (twice more frequent in men than in women), and race (African Americans, American Indians, and Alaska Natives are affected in higher percentages than other races). When the cancer is localized only in the kidney, the 5-year survival rate is good (93%), however, it declines rapidly (15%) when the cancer spreads to the lungs, brain, or bones [4]. The vast majority of kidney cancers are clear cell subtypes of Renal Cell Carcinoma (ccRCC), characterized by high inter- and intra-tumor heterogeneity and strong crosstalk with the cellular microenvironment [5].
A very dynamic and promising avenue is provided by gene therapy as an alternative to kidney transplantation [6]. As of 5 October 2023, PubMed lists 143,107 articles for “cancer gene therapy” published from 1966 onward, of which 12,818 were published in 2021 alone. The majority of these articles looked for gene biomarkers whose altered sequence and expression level were supposedly responsible for triggering cancerization and whose restoration allegedly provides the cure. In most publications, the biomarkers were identified by comparing sequencing (e.g., [7,8,9] and/or transcription (e.g., [10,11,12]) data in tissues collected from cancer-stricken and healthy people.
A potentially effective yet insufficiently exploited tool for both diagnostics and therapy is quantifying and managing the amount of cancer cell-secreted microRNAs in blood and urine. Certain miRNAs have been shown to alter the expression of oncogenic or tumor-suppressive genes, thus regulating the proliferation of cancer cells. Owing to accessibility, the dosing and manipulation of the amounts of selected types of urine miRNAs was proposed as an excellent non-invasive instrument for cancer detection and management [13].
The potency of gene therapy was also tested on standard human cancer cell cultures (e.g., [14,15,16,17]), but the relevance of the experimental results from the cell culture to the cancer reality is disputable. Nonetheless, as recently summarized [18], the non-malignant cells and molecular factors from the tumor microenvironment play “crucial roles” in the development of ccRCC. Thus, when taken from their natural environment and plated in a homo-cellular culture, the cancer cells will adapt their gene expression profiles to the new conditions. Therefore, interpreting the results from homo-cellular culture as valid for the hetero-cellular tissue is disputable. We have proven that the transcriptome of one cell type changes significantly in the proximity of another cell type by profiling mouse cortical astrocytes and immortalized precursor oligodendrocytes when plated separately or co-cultured in insert systems [19].
However, what are the real predictive values of the gene biomarkers for cancer diagnosis and therapy? The 38.0 release (31 August 2023) of the NIH-National Cancer Institute GDC Data Portal [20] containing genomic data collected from 88,991 cancer cases in 68 primary sites, reported a total of 2,903,037 mutations located in 22,588 genes. Importantly, the Portal reported mutations in almost all genes affecting each of the 68 primary sites. Table 1 summarizes the GDC data for 14 primary sites by presenting the number of mutated genes found in the investigated cases, how many of the mutated genes are protein coding, and the total number of mutations detected thus far for each site.
Moreover, almost every single gene was found to be mutated in at least one case from each of the 68 primary sites. For instance, with respect to the reported cancer cases from Table 1, the titin (TTN) appeared to be mutated in the following percentages of reported cases: 12.41 of bladder cases, 2.75 of bone marrow, 14.47 of brain, 2.99 of breast, 5.05 of colorectal, 10.28 of head and neck, 5.71 of kidneys, 6.88 of lungs, 2.17 of pancreas, 2.60 of prostate, 13.46 of skin, 15.51 of stomach, and 12.21 of uterus cases. The percentages include all 13,073 distinct somatic mutations observed for this gene in 4512 out of the 88,991 cases included in the portal database. Thus, not only do none of the distinct mutations, but all kinds of altered sequences of TTN as a whole do not exhibit statistically significant sensitivity and/or specificity for a particular form of cancer. The same lack of significance is carried by all other “regular suspects”, like tumor protein p53 (TP53), with 1341 mutations identified in 4934 cases across 47 out of 82 projects, or KRAS (1500 cases, 125 distinct mutations identified in 43 projects), or PTEN (1228 cases, 846 mutations across 38 projects). The most frequently mutated gene in kidney cancer is the von Hippel-Lindau tumor suppressor (VHL) which was detected in 342 (9.77%) out of 3501 cases. However, the VHL was also found to be mutated in 50 cases of cancer in other organs.
An excellent recent review indicated that one possible explanation for the unsatisfactory conventional anti-cancer therapy is its targeting of the somatic tumor cells instead of the cancer stem cells (CSC), “assumed to be responsible for tumor recurrence and metastasis” [21]. Therefore, targeting the CSC-signaling pathways might offer a much better alternative than attacking the cancer-specific surface proteins.
Mimicking a human cancer phenotype in genetically engineered animals (e.g., [22,23,24,25]) provides disputable etiologies showing that together with the manipulated gene, hundreds of other genes are regulated, as reported in many studies, ours included (e.g., [26]). The set of significantly regulated genes in the tissues of genetically engineered animals, with respect to their wild-type counterparts, depends on the profiled tissue (e.g., [27]), silencing method used (e.g., [28]), and the genetic background (e.g., [29]).
Owing to the unrepeatable combination of favoring factors (some of them changing in time) of race, sex, age, medical history, diet, climate, exposure to toxins, stress, and other external stimuli, each human is a DYNAMIC UNIQUE. This dynamic unicity requires a time-sensitive personalized therapeutic approach.
Some very important factors, as of yet still neglected in many published papers and public repositories, include the tumor’s genomic, transcriptomic, and proteomic heterogeneity [30,31,32,33]. Thus, histopathologically distinct cancer nodules from the same tumor most frequently have different characteristics. Therefore, the best REFERENCE for cancer-related genomic alterations of an individual is not the tissue of the average healthy person of the same race, sex, and age group, but rather the quasi-normal tissue surrounding his/her cancer nodules [34]. With this reference in mind, the true goal of anti-cancer therapy is to restore what is considered normal for that person, hence the need for a personalized approach.
While the diagnostic value of the gene biomarkers is disputable, let us see whether the restoration of the correct sequence and/or expression level of the biomarkers can provide the therapeutic answer for cancer. Since the biomarkers are selected from the most frequently altered genes in cancer patients, it means that their sequences and/or expression levels are poorly protected by cellular homeostatic mechanisms like the minor players in cell life. Therefore, their restoration might be of little consequence.
It is very surprising (and disappointing) that almost all gene expression studies neglect about 99.99% of the information provided by the high throughput transcriptomic platforms (RNA-sequencing, Agilent microarray, Affimetrix, Illumina BeadChip arrays, etc.), which will be presented in the Results section below. The traditional analysis considers ONLY the expression levels of the quantified genes whose comparison between conditions tells what gene was significantly up-/down-regulated (according to the arbitrarily introduced cut-off for the absolute fold change) or turned on/off. The genes are eventually clustered according to their similar behaviors across conditions (e.g., [35,36]), but similar regulation does not necessarily mean that the clustered genes are interacting with each other (they may have an upstream common regulator or transcription factor).
Using publicly available software (based on text mining the peer-reviewed literature) such as Ingenuity [37], DAVID [38], and KEGG [39], the regulated genes might be organized into functional pathways. However, the topology of the pathways constructed by such software has three major flaws: universality, rigidity, and unicity. They are universal in that they do not discriminate with respect to the strain/race, sex, age, hormonal activity, etc., and even with respect to the tissue, such as those of the Ca2+- and other signaling pathways. They are considered to be rigid for not changing in response to aging, medical treatment, external stimuli, and the progressions of a disease or other dynamic influencing factors. Finally, each constructed pathway has unique wiring for the genes and not a spectrum of several possible gene circuits. If two simple elements like hydrogen and carbon can combine in so many ways to form an unlimited variety of hydrocarbons, how could one assume that tens of much more complicated units (the genes) network in only a single way to accomplish a particular task? Therefore, we have used KEGG-constructed pathways only for illustrative purposes and the coordination analysis to determine the real gene networking.
Because of the above-discussed deficiencies of the biomarker approach, we switched our research from the biomarker to the Genomic Fabric Paradigm (GFP, [40]) approach. The GFP incorporates the traditional analysis of gene expression regulation while considering two additional classes of independent descriptors, and so offers the most theoretically possible comprehensive characterization of the transcriptome and personalized solutions for cancer gene therapy. The two additional transcriptomic descriptors of individual genes, the Relative Expression Variation and the Expression Correlation with each other gene, can be determined using the gene expression profiles of biological replicas without supplementary experimental costs. Through the use of the two additional groups of descriptors, the GFP approach increases by four orders of magnitude the amount of transcriptomic information extracted from a high throughput (ng RNA-sequencing or microarray) gene expression platform.
The present study complements a previously published article [40], with GFP analyses of the remodeling of the five KEGG-constructed excretion system’s functional pathways in the kidney and chest wall regions of a 74-year-old man affected by metastatic clear cell renal cell carcinoma (ccRCC).

2. Materials and Methods

2.1. The Best Choice of Tissue Samples

Nevertheless, for statistical significance, a transcriptomic study should profile several biological replicas of the compared conditions. Most authors use three biological replicas, but four is (in our view) the best compromise between getting enough statistical relevance and the errors resulting from the inherent technical noise of the profiling method. In the case of solid tumors, the most reasonable choice is to take a point biopsy from the center of a cancer nodule (or each cancer nodule, if there are more) and another one from the surrounding (almost normal) tissue, split each biopsy into four parts, and profile separately the resulted quarters. Thus, the reference for the patient’s cancer and the aim of the therapy is no longer the abstract, racially blind, ageless, and sexless model of the human body but rather his/her own normal tissue for his/her race, age, and sex. This procedure is standard in our lab and was used in investigations of surgically removed tumors from kidney [40], thyroid [41], and prostate [42] cancer patients.
In this study, we re-analyzed transcriptomic data from the surgically removed right kidney affected by ccRCC Fuhrman grade 3 (two primary cancer nodules, denoted as PTA and PTB in the renal medula) and its metastasis in the chest wall (CWM). The gene expression profiles of the three cancer nodules were compared to those of the quasi-normal surrounding kidney tissue (NOR). Data were obtained using Agilent-026652 Whole Human Genome Microarrays 4 × 44K v2 and are publicly accessible [43].

2.2. Data Filtering and Normalization

The hybridized microarray spots with a foreground fluorescence less than twice the background in one biological replica profiled with microarrays are eliminated from the analysis of all samples to be compared owing to the non-negligible technical noise. With this filtering, every profiled sample from all conditions to be compared was reduced to the same number of distinct transcripts, here “N = 13,314”. The background-subtracted forward fluorescence of the microarray hybridized spot(s) with transcript “i” from the biological replica “k” (k = 1, 2, 3, 4) of condition “c”, “ai(c;k)” were normalized to the expression of the median gene for that profiled sample. This normalization strategy makes comparable the expression profiles of all samples, with ai(c;k) > 1 indicating genes with a higher than median expression level and ai(c;k) < 1 genes with a lower than median expression level. For the analyzed microarray experiment, ai(c;k) was the sum of the net fluorescence of all spots probing redundantly transcript “i” in the biological replica “k” of condition “c” (see Equation (A1) in Appendix A).

2.3. Independent Characteristics of Gene Expression

2.3.1. Normalized Average Expression Level

The filtered and normalized expression values of each transcript “i” were averaged over the biological replicas of each condition “c” resulting in A V E i ( c ) . A V E i ( c ) is the genomic measure that everybody in the field uses to determine whether that transcript abundance was up-/down-regulated or turned on/off when comparing cancer with healthy samples. Thus, the GFP includes but is not reduced to the traditional gene expression analysis.

2.3.2. Relative Expression Variability

When properly selected (as quarters of point biopsies), the biological replicas may be considered as different instances of the same system subjected to distinct local (not significantly regulating) conditions. This applies to ccRCC samples owing to the strong crosstalk of cancer cells within the non-uniform microenvironment [5,18]. Thus, we can add as an independent feature of the transcript “i” in condition “c” the Relative Expression Variability, “REVi(c)”, computed as the mid-chi-square (χ2) interval estimate of the coefficient of variation for “n = 4” biological replicas and “υi” spots probing redundantly the transcript “i” (Equation (A2) in Appendix A). The REV provides an indirect estimate of the strength of the cellular homeostatic mechanisms to control the transcript abundances, with the smallest REV indicating the most stably expressed (i.e., the most controlled) gene and the largest REV pointing to the most variably expressed (i.e., the least controlled) gene. Since more control means more energy spent by the cell, it is natural to assume that the right expressions of the most controlled genes were more important for the cell’s survival and/or proliferation in the multicellular tissue. As such, the REV analysis tells the investigator firsthand about the cell priorities.

2.3.3. Expression Coordination

Genes are not single but team players in cell life. Considering the high efficiency of the cellular phenomena, we have introduced the Postulate of the Transcriptomic Stoichiometry (PTS) [44] as an extension to gene networking in functional pathways of Proust’s Law of Definite Proportions from chemistry [45]. The PTS states that: in any steady-state condition, expressions of genes whose encoded products are part of a functional pathway are coordinated to ensure the maximum efficiency of that functional pathway. This means that the involved genes are set to produce the transcripts at the right abundance proportions. The PTS and the coordination analysis can be used to determine the real gene network responsible for a particular pathway in a given condition.
The most difficult question is how the genes are networked: in pairs (e.g., agonist-antagonist), in “ménage à trois” (e.g., agonist, antagonist, and a modulator of both), or in more complex gene inter-coordination clusters? To answer this question, we adopted a formalism of correlation functions similar to that used to describe the structure of simple liquids (like liquid argon) [46]. Thus, the configuration function “F” of “N” distinct genes is considered as a superposition of virtual configurations in which the genes are: independently expressed (“f1”), coordinately expressed in pairs (“f2”), coordinately expressed in triplets (“f3”), and so on until all “N” genes are coordinately expressed in a cluster of all genes (“fN”). As shown in Appendix A, the contributions of the distribution functions of higher than pair-correlated genes can be neglected, so that the configuration function can be approximated with a distribution of independently expressed genes and a distribution of coordinately expressed gene pairs (Equation (A3) in Appendix A).
The problem is now to select the suitable algorithm for gene pairing. There are several weighted and unweighted types of correlation algorithms (e.g., [47,48,49,50]) aiming to identify the interconnected genes based on their co-regulation determined from the meta-analysis of genomic data on healthy and cancer-affected populations. By contrast, our aim is to determine the gene network in a particular condition (normal or cancerous) of only one individual, so none of these cluster analyses are suitable for our endeavor.
The simplest gene pairing is completed using the Pearson pair-wise correlation coefficient (hereafter denoted as “COR” instead of the traditional “r”) between the log2 of the normalized expressions of two genes (“i” and “j”) in the four replicas of the same condition “c” (shown in Equation (A4) in Appendix A). Although Marbach et al. [51] have shown that Pearson’s correlation coefficient is not the strongest way to determine gene networks, it is accurate enough when taking into account the technical noise of the gene expression platform. With four biological replicas, two genes are (p < 0.05) significantly synergistically expressed (i.e., a positive correlation) if COR ≥ 0.951, antagonistically expressed (negative correlation) if COR ≤ −0.95, and independently expressed (null correlation) if |COR| ≤ 0.05. For microarrays probing the same transcript with two spots (i.e., 8 paired values), the p < 0.05 significance cut-off for synergism/antagonism is |COR| ≥ 0.71, for three spots (12 paired values) it is |COR| ≥ 0.58, and so on, with the Pearson cut-off decreasing when the number of probing spots increases [52].
In [53], we defined the coordination score “COORD” with p-value “p” of a pathway “Γ” in condition “c = NOR, PTA, PTB, CWM” as:
C O O R D Γ c p S Y N Γ ( c ) + A N T Γ ( c ) I N D Γ ( c )
where “SYN/ANT/IND” are the percentages of all gene pairs from the pathway “Γ” that are synergistically/antagonistically/independently expressed with a statistical significance (p-value) “p” in condition “c”.
The COORD score indicates the (p > 0.05) statistically significant influence of that gene on all other genes.

2.3.4. Topology of the Transcriptome and the Gene Master Regulator

The “REV” and “COR” can be used to determine the Gene Commanding Height (GCH) that establishes the importance hierarchy of the genes in each region. The top gene (highest GCH) is termed the Gene Master Regulator (GMR) of that region. The GMR is the highly protected gene (i.e., low REV, meaning it is critical for cell survival) that also has the strongest influence on the expression of other genes through expression coordination [54,55] (Equation (A5) in Appendix A). In all our cancer genomics studies to date ([34,40,41,42,54,55]), we found that cancer and normal cells from the same tumor are controlled by different GMRs. Moreover, the GMR gene of the cancer cells has low GCH in the normal cells. Therefore, silencing the GMR of the cancer cells is expected to selectively kill the cancer cells from the tissue with very little influence on the normal cells.
Note: For the GFP users, the transcriptome is no longer a chaotic collection of transcripts, but a multi-dimensional hierarchized mathematical entity subjected to dynamic sets of expression variability and expression correlations of its components.

2.4. Transcriptome Alteration in Cancer

2.4.1. Measures of Expression Regulation

We use the GFP to compare the transcriptome of a cancer nodule with that of the surrounding normal tissue in a tumor. Thus, in addition to identifying what genes were significantly up-/down regulated in cancer, we determine also how much of the homeostatic control of the transcript abundance was altered for each gene or group of genes, and how the gene networks were remodeled.
The traditional analysis considers a gene as significantly regulated in cancerous tissue compared to normal tissue if the expression ratio “x” (negative for down-regulation) has an absolute fold-change |x| larger than an arbitrarily introduced cut-off (most frequently 1.5). In most cases, it also adds the condition that the p-value of the heteroscedastic t-test of mean expressions is less than 0.05. However, the cut-off fold-change could be too stringent for very stably expressed genes (leading to false negatives) or too lax for very unstably expressed ones (introducing false positives). Therefore, we use for each gene the cut-off of the absolute fold-change, “CUT”, considering the combined contributions of its biological variability and the technical noises of the platform in the two profiled conditions. Thus, the gene “i” is considered significantly regulated in “cancer” with respect to the normal tissue (NOR), if the absolute fold-change exceeds the respective “CUT” and the p-value is less than 0.05 (Equation (A6) in Appendix A).
In many studies, transcriptome alteration is presented as percentages of the significantly up- and down-regulated genes. Nonetheless, the percentage of presentation implicitly assumes that all regulated genes are uniform (+1 or −1) contributors to the overall transcriptome alteration while neglecting the contributions of the not significantly regulated genes. A more accurate measure of the expression regulation is the Weighted Individual (gene) Regulation “WIR”, whose absolute values can be averaged for the genes included in a functional pathway “Γ” as the Weighted Pathway Regulation “WPR”. In addition to being applied to all genes (including those not significantly regulated), WIR takes also into account the absolute expression change and the statistical significance of the regulation (as shown in Equations (A7) and (A8) in Appendix A).

2.4.2. Regulation of the Control of Transcript Abundance

In a previous paper [56], we defined the Relative Expression Control, “REC,” of gene “i” in condition (here region) “c” so that positive RECs indicate more than the median-controlled genes and negative values indicate less than the median-controlled genes in that condition (shown as Equation (A9) in Appendix A). As shown below (Figure 1), the ccRCC altered the REVs of individual genes and as a consequence, their hierarchy (illustrated in Figure 2 below). The difference between the REV inverses in a cancer nodule and those in the surrounding normal tissue (Equation (A10) in Appendix A) indicates how much the ccRCC altered the transcript abundance control.

2.4.3. Regulation of Expression Coordination

The regulation of expression coordination can be computed with regard to a single gene, a group of genes (like those involved in a particular pathway), or all quantified genes. In this report, the regulation of the expression coordination is limited to the five KEGG-constructed excretory system pathways (shown in Equation (A11) in Appendix A). Positive regulation values indicate an overall increase in the expression coordination while negative values indicate an overall decrease in the expression coordination of gene “i” with expressions of all genes from the reference pathway “Γ”.

2.4.4. The Transcriptomic Distance

Nonetheless, the most comprehensive measure of the transcriptome alteration should include all changes: in expression level, expression control, and expression coordination with all other genes. The Transcriptomic Distance of an Individual gene, “TDI”, is the Euclidian distance from the origin of the 3D space whose orthogonal axes are: WIR, the regulation of the expression control, and the regulation of expression coordination (shown in Equation (A12) in Appendix A).

2.5. Functional Pathways

In this report, we used our experimental data from the profiled samples of a man with metastatic ccRCC [43] to determine the topology and the ccRCC-induced remodeling of the transcriptomes associated with the five KEGG-constructed functional pathways of the excretory system. The analyzed pathways were: (ALDO) hsa04960 Aldosterone-regulated sodium reabsorption [57], (COLL) hsa04966 Collecting duct acid secretion [58], (ENDO) hsa04961 Endocrine and other factor-regulated calcium reabsorption [59], (PROX) hsa04964 Proximal tubule bicarbonate reclamation [60], and (VASO) hsa04962 Vasopressin-regulated water reabsorption [61].

3. Results

3.1. The Global Picture

Expressions of 13,314 unigenes were adequately quantified, normalized, and organized in functional pathways in all 16 samples. However, not all excretory genes identified by the KEGG were analyzed. The missing genes were the ones that: (i) were not expressed in one of the four profiled regions, (ii) had no microarray spot to be probed by, or (iii) were probed by spots excluded from the analysis because of corrupted pixels.
Nonetheless, the functional pathways of the excretory system were not mutually exclusive, some genes being counted in two (e.g., ADCY9 in ENDO and VASO) or even three excretory pathways (e.g., ATP1A1 in ALDO, ENDO, and PROX). Therefore, the total number of the quantified distinct excretory genes was 108.

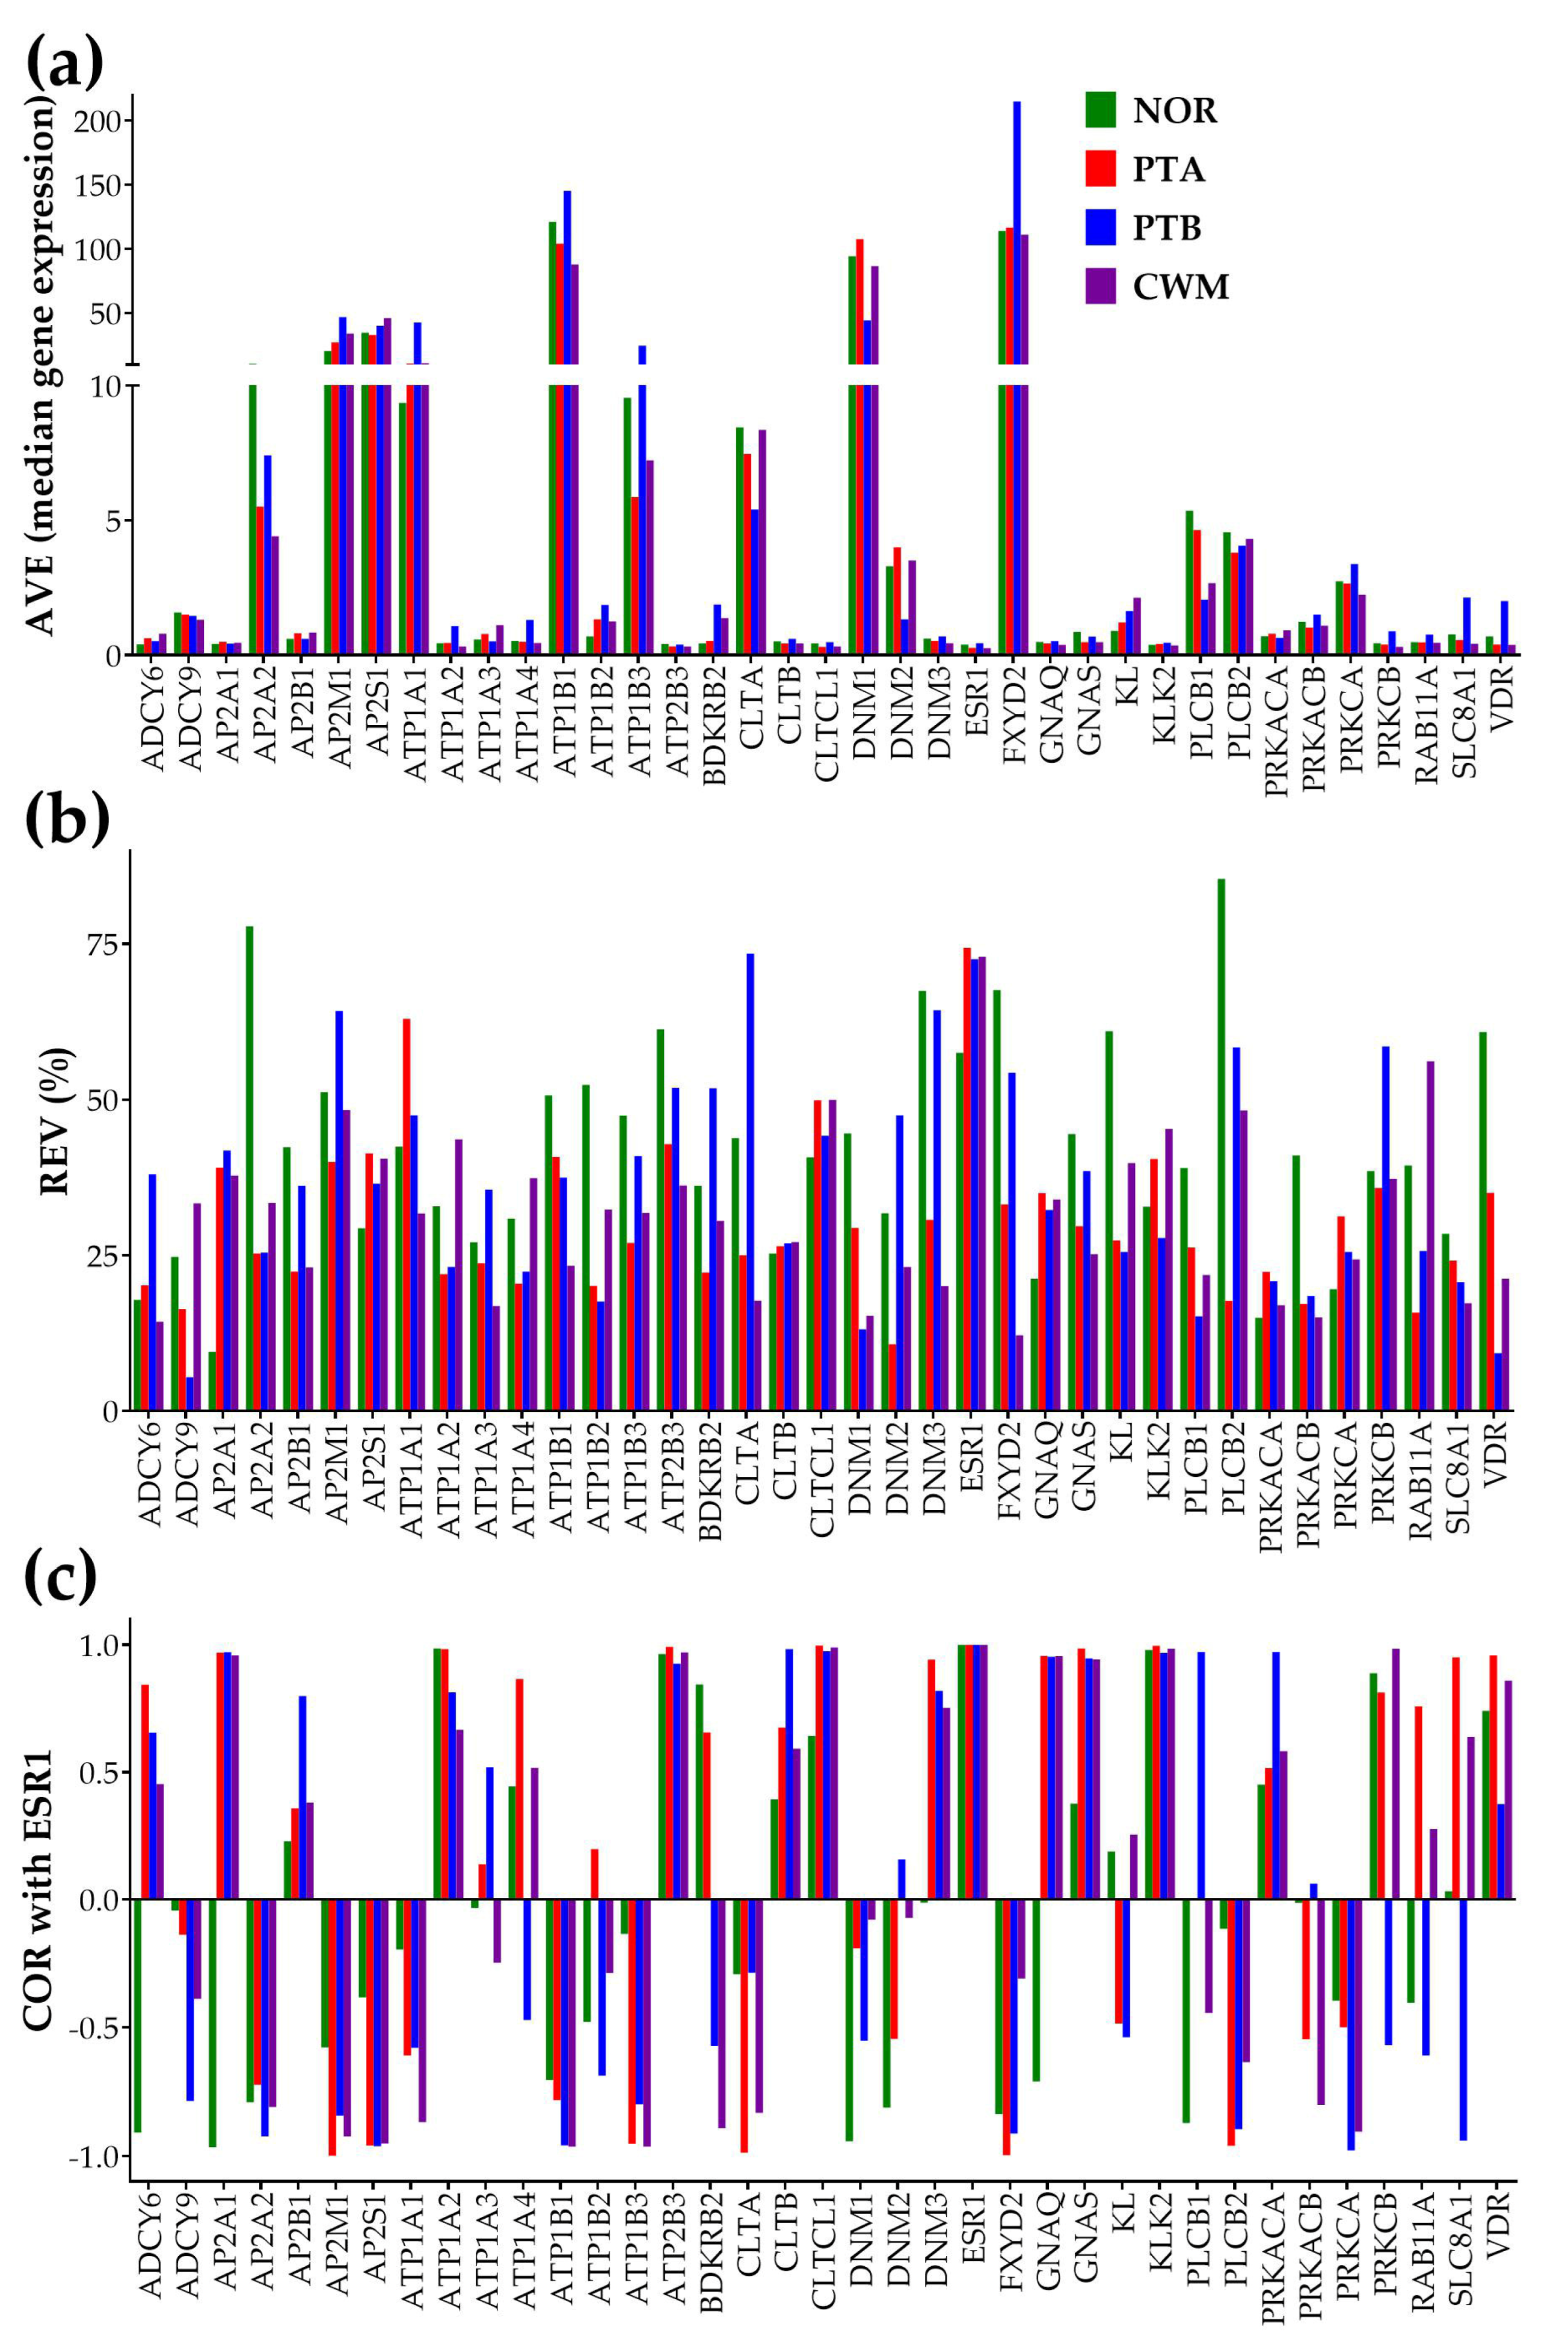
3.2. Independent Characteristics of Gene Expression

Figure 1 illustrates the independence of the three types of expression characteristics for 37 genes involved in the KEGG-constructed pathway of the “Endocrine and other factor—regulated calcium reabsorption” [59] using our microarray data on Fuhrman grade 3 metastatic ccRCC samples [38]. For the COR analysis, we chose to represent the expression correlation with the estrogen receptor 1 (ESR1), owing to the kidney being one of “the most estrogen-responsive, not reproductive organs in the body” [62].
Of note are the differences between the normal tissue and the cancer nodules not only in the average expression levels of certain genes (AVE, as expected and reported by the traditional analysis), but also in the relative expression variability (REV) and correlation (COR) with other genes (here with ESR1). For instance, the significant expression antagonism (COR(NOR) = −0.96624, p = 0.0338) of AP2A1 (adaptor-related protein complex 2, alpha 1 subunit) with ESR1 in the normal tissue is switched into expression synergism in each of the three cancer nodules. We obtained the following correlation values (and statistical significances) between ESR1 and AP2A1 in the cancer samples: COR(PTA) = 0.9607 (p-val = 0.03093), COR(PTB) = 0.970449 (p-val = 0.02955), and COR(CWM) = 0.958562 (p-val = 0.04144). This result means that in the normal tissue, when the expression of ESR1 goes up, that of AP2A1 goes down, and when ESR1 goes down, AP2A1 goes up. By contrast, in cancer, the expression of ESR1 oscillates in-phase with the expression of AP2A1, so that expressions of both genes go up or down simultaneously. It is interesting to also note the differences in all three characteristics of the individual genes between the nodules of PTA and PTB.
The independence of the three characteristics of the individual genes collected from a regular gene expression experiment with four biological replicas of each histopathologically distinct region is visually evident. Therefore, each of the three types of analyses brings non-redundant information and is worth taking into account.

3.3. ccRCC Changed the Gene Hierarchy

Figure 2 presents the GCH scores for all quantified genes selected by the KEGG as involved in the five excretory functional pathways. Of note are again the substantial inter-regional differences in the genes’ GCH scores, indicating distinct gene hierarchies within the corresponding pathways. For instance, the GCH of the IGF1 (insulin-like growth factor 1 (somatomedin C)) from the “Aldosterone-regulated sodium reabsorption” pathway increased from 1.41 in NOR to 13.11 (9.28×) in PTA, although it remains practically unchanged in PTB (2.25) and in CWM (2.38). The CREB3L2 (cAMP responsive element binding protein 3-like 2) from the “Vasopressin-regulated water reabsorption” pathway exhibited a GCH increase of 9.57× in PTB compared to PTA. The GCH of the ATP1A2 (ATPase, Na+/K+ transporting, alpha 2 polypeptide) decreased by 16.85× in CWM with respect to PTB.

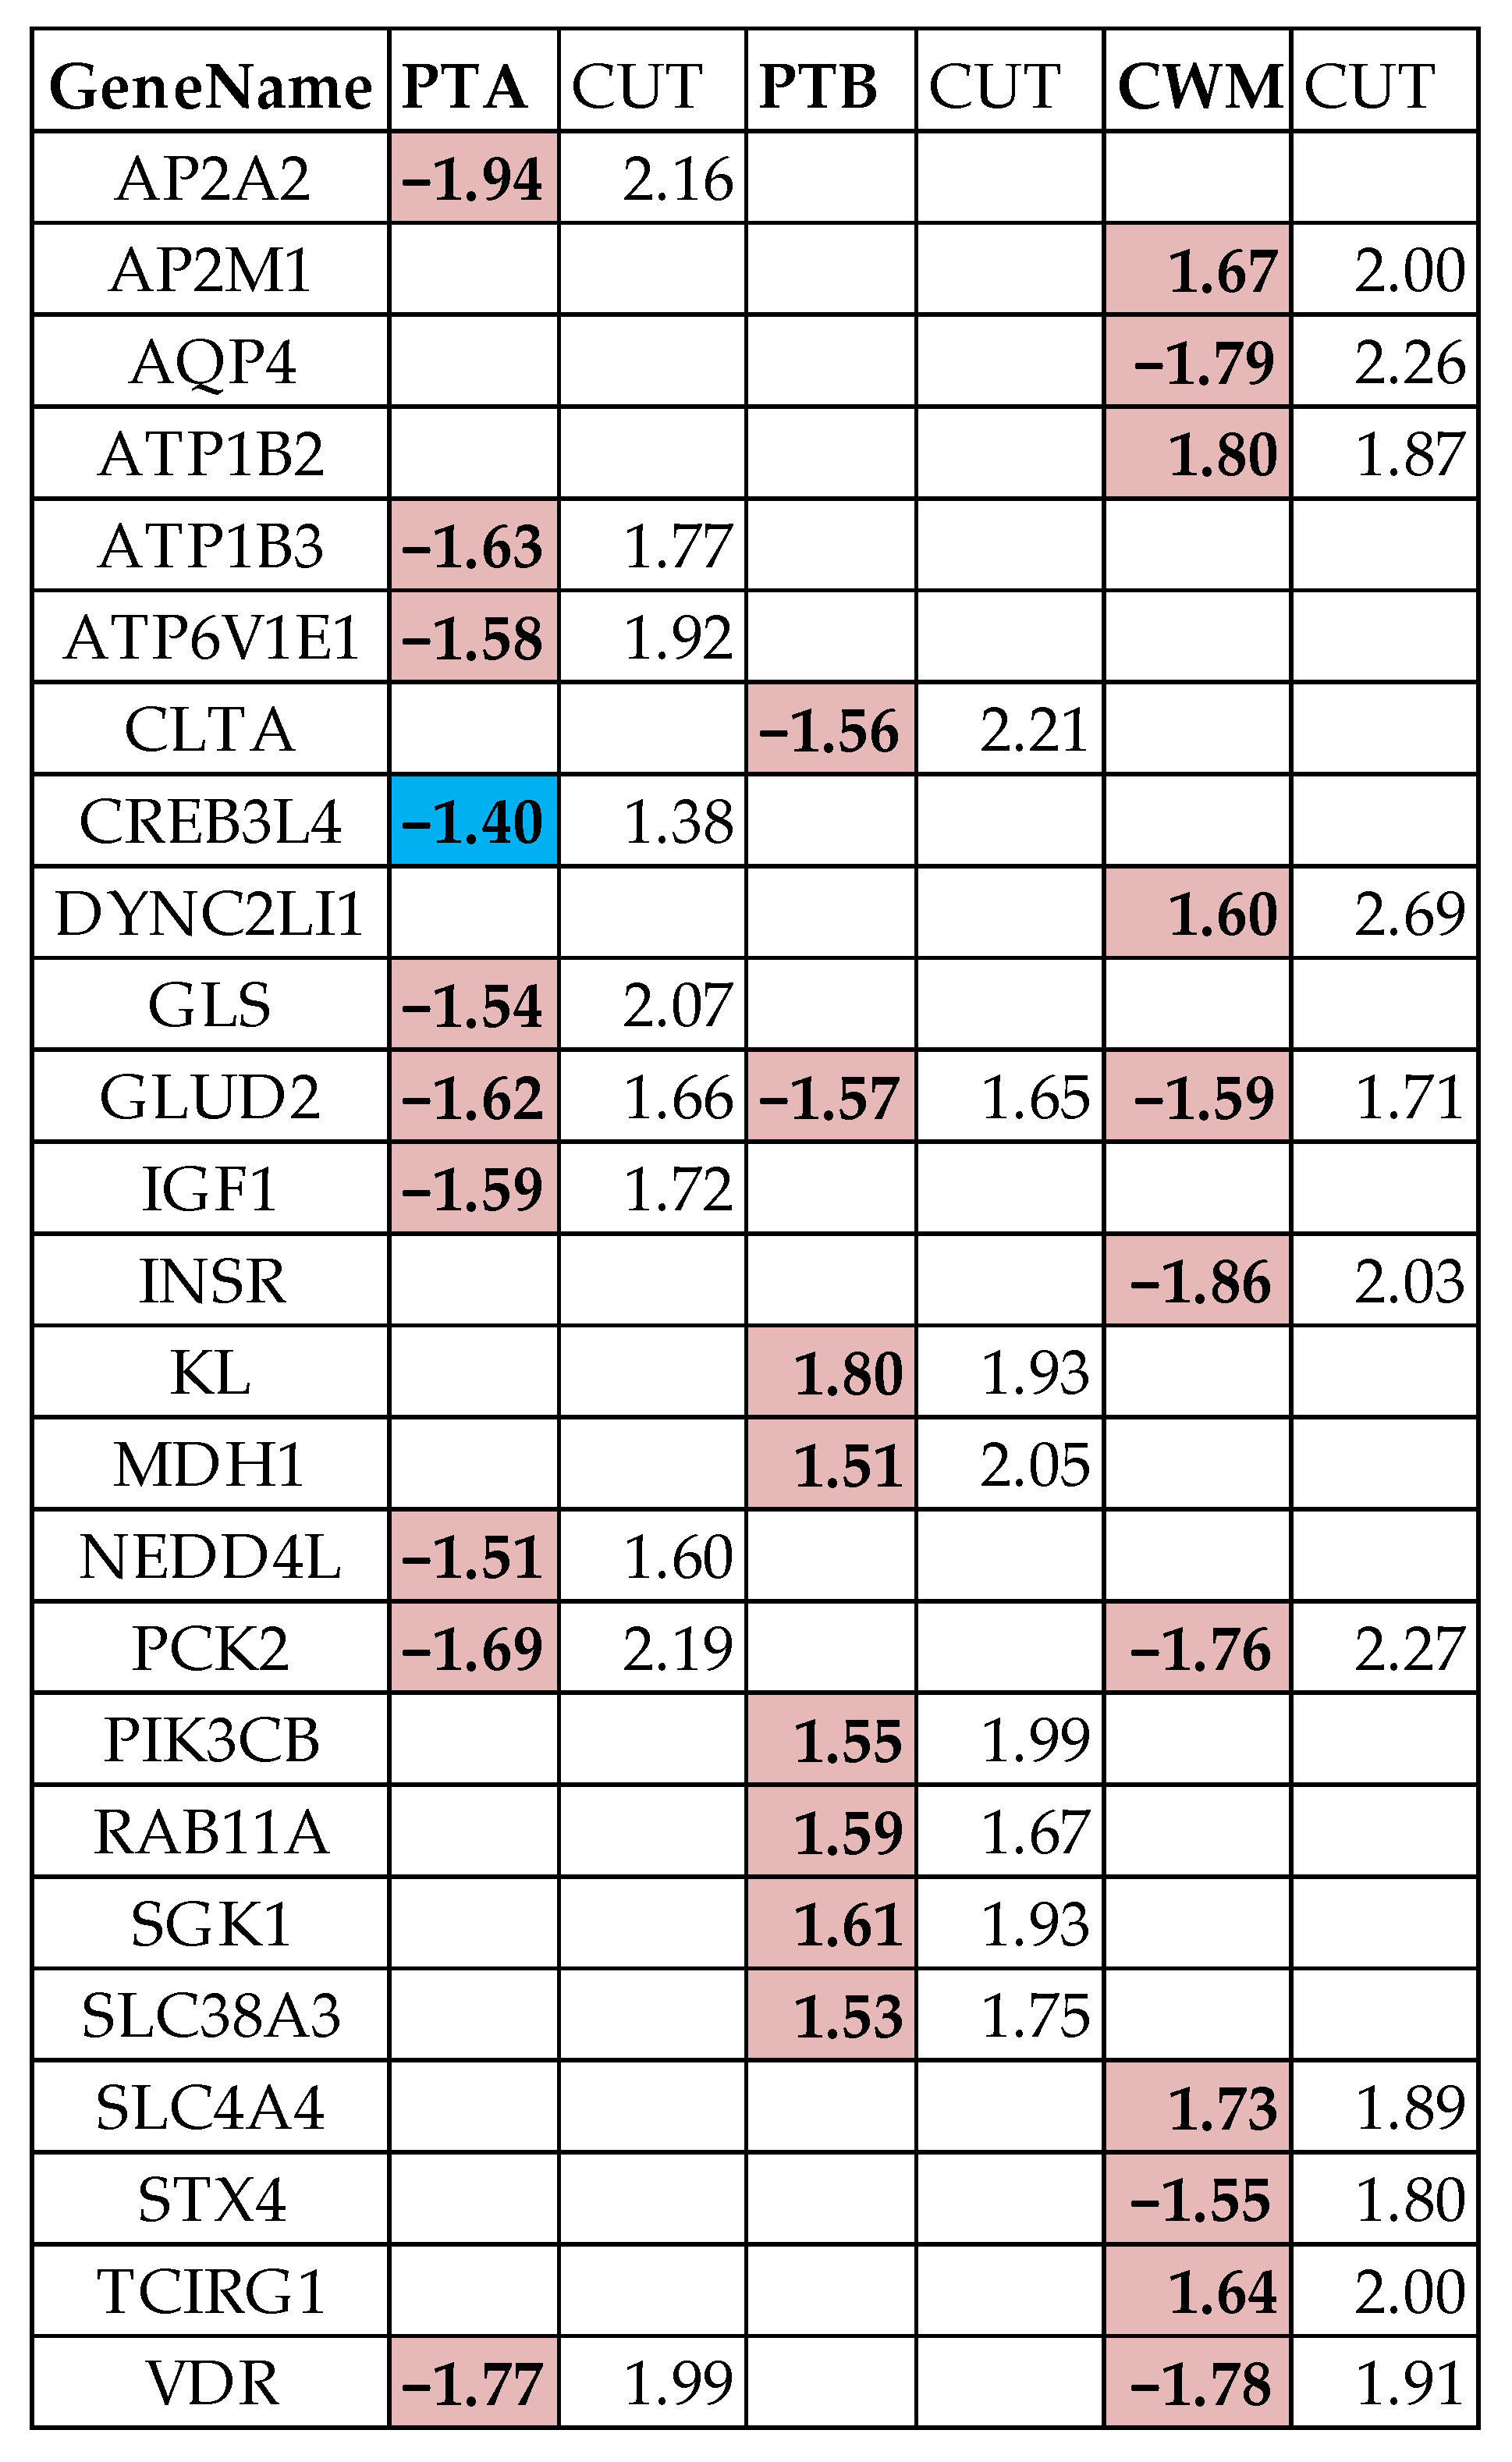
3.4. Measures of Individual Gene Regulation

Figure 3 illustrates the six types of quantifying measures of the ccRCC-induced alterations of the genes from the KEGG-constructed pathway hsa04961 of “Endocrine and other factor-regulated calcium reabsorption”. The six measure types are: the uniform +1/−1 for significant regulation, the expression ratio (negative for the down-regulation), the WIR (Weighted Individual (gene) Regulation, negative for down-regulation), the regulation of the transcription control, the regulation of the expression correlation with all other genes from the pathway, and the TDI (Transcriptomic Distance of Individual gene).
There are notable differences among the three cancer nodules in all six measures. For instance, SLC8A1 (solute carrier family 8 (sodium/calcium exchanger), member 1), which was not regulated in PTA, was significantly up-regulated in PTB (x = 2.75) and significantly down-regulated in CWM (x = −1.84). Only one gene, ATP1B2 (ATPase, Na+/K+ transporting, beta 2 polypeptide), was significantly upregulated in both PTA (x = 1.91) and PTB (x = 2.67), but not in CWM. PLCB1 (phospholipase C, beta 1 (phosphoinositide-specific) was the single gene significantly down-regulated in PTB (x = −2.60) and CWM (x = −2.01), but not in PTA.
As defined, the WIR takes larger absolute values for highly expressed genes in the reference (here NOR) region, sometimes even larger for not significantly regulated genes than for significantly regulated ones. For instance, DNM2 (dynamin2), which is a significantly down-regulated gene in PTB (x(PTB→NOR) = −2.47, CUT(PTB→NOR) = 1.81, p(PTB→NOR) = 0.0242), had a WIR(PTB→NOR) = 4.73. The DNM2 contribution to the transcriptomic alteration in PTB was substantially overpassed by that of the not statistically significantly regulated DNM1 (dynamin1: WIR(PTB→NOR) = 95.74, x(PTB→NOR) = −2.12, CUT (PTB→NOR) = 1.66, p(PTB→NOR) = 0.0969 > 0.05). The reason for this is that in NOR, AVEDNN1 = 94.30 >> 3.30 = AVEDNN2. Nonetheless, by considering the whole change in the expression level, the WIR tells the investigator much more about the contribution of a gene to the transcriptome expression alteration than the uniform +1/−1 up-/down regulation.
Overall, the median expression control 100/<REV> increased from 2.58 in NOR to 4.27 in PTA, 2.92 in PTB, and 3.96 in CWM. In the illustrated pathway, we found genes with a substantial increase in expression control and genes with a substantial decrease in control in cancer. The most substantial increase of the expression control was for ADCY9 (adenylate cyclase 9) in PTB (ΔREC(PTBNOR) = 12.38). It is remarkable that the control of ADCY9 had a modest change in PTA (ΔREC(PTANOR) = 2.08) but the largest decrease of all in CWM (ΔREC(CWMNOR) = −15.50). The largest decrease in PTA was exhibited by AP2A1 (adaptor-related protein complex 2, alpha 1 subunit) with ΔREC(PTANOR) = −7.97, but with insignificant changes in the other nodules with ΔREC(PTBNOR) = −0.17, and ΔREC(CWMNOR) = 0.26. Interestingly, there are genes (e.g., DNM2) whose control increased with respect to NOR in one cancer nodule (PTA, ΔREC(PTANOR) = 6.2) but decreased in the equally ranked other nodule from the same tumor (ΔREC(PTBNOR) = −7.2), indicating a shift in the cell’s priorities. A substantial shift in cell priorities occurred also for VDR (vitamin D (1,25-dihydroxyvitamin D3) receptor) between the nodules of PTB (ΔREC(PTBNOR) = 7.92) and CWM (ΔREC(CWMNOR) = −6.07).
We found genes, such as ADCY6, with an increased overall correlation with the other pathways’ genes with respect to NOR in one nodule (ΔCOR(PTANOR) = 7.39) but decreased in the other nodules (ΔCOR(PTBNOR) = −6.04, ΔCOR(PTBNOR) = −5.92), indicating a profound remodeling of the gene networking. Interestingly, ADCY6 was significantly up-regulated in PTA (x = 1.54) and CWM (x = 1.96), but not in PTB (x = 1.29). A very similar behavior, except that it was not significantly regulated in any of the three cancer nodules, was exhibited by AP2A1COR(PTANOR) = 7.60, ΔCOR(PTBNOR) = −7.02, ΔCOR(PTBNOR) = −6.84).
Nevertheless, the most comprehensive measure that incorporates the changes in all three types of characteristics is the transcriptomic distance of an individual gene (TDI) from its AVE(NOR), REV(NOR), and COR(NOR) (with all other genes within the pathway) in the normal tissue. From the TDI perspective, DNM1 (TDI(PTBNOR) = 95.95 in PTB) followed by FXYD2 (TDI(PTBNOR) = 80.21 in PTB) were the most altered genes within this set. Interestingly, with all differences at the individual gene level, the median TDIs of the three nodules were close to each other (5.72 for PTA, 5.73 for PTB, and 5.37 for CWM).

3.5. Overall Regulation of the Excretory Pathways

Table 2 presents the overall gene expression alterations of the five KEGG-constructed excretory pathways as percentages of up- and down-regulation out of the quantified genes in each of the cancer nodules. Table 2 presents also the WPRs of the analyzed pathways.
With 23.08% in PTA and CWM, and 30.77% in PTB total percentage of up- and down-regulated genes, the ALDO appears as the most altered pathway. However, from the more comprehensive WPR perspective, the COLL is the most altered of the five pathways in all three cancer nodules.
Interestingly, all significantly regulated genes are up for PROX in all three cancer nodules, indicating a major activation of this pathway in ccRCC. The results on the ALDO are intriguing: while there were equal numbers of up- and down-regulated genes (11.54% of 26) in both PTA and CWM, in PTB all 30.77% significantly regulated genes were over-expressed. This means that the ALDO was balanced in PTA and CWM, but strongly activated in PTB. The ALDO regulomes (sets of significantly regulated genes in this pathway) of the three cancer nodules are different, with only one gene, PIK3R2 (phosphoinositide-3-kinase, regulatory subunit 2 (beta)), being significantly up-regulated in all three nodules.
Results from Table 2 show that even when closely located and with equal pathology grades, cancer nodules from the same tumor (PTA and PTB) may exhibit different gene alterations, questioning the validity of meta-analyses comparing ccRCC patients with healthy counterparts.

3.6. False Hits

Figure 4 presents the excretory genes that would have been considered as significantly regulated in the traditional analysis (|x(cancer→NOR)| > 1.5) but were identified by our cut-off criterion as false positive hits (|x(cancer→NOR)| ≤ CUT(cancer→NOR)). In contrast, the CREB3L4 (cAMP responsive element binding protein 3-like 4) was identified as a false negative hit (|x(PTA→NOR)| < 1.50) in PTA because |x(PTA→NOR)| = 1.40 > CUT(PTA→NOR) = 1.38). In consequence, the false positive hits were eliminated, and the false negative hits were included in the “excretory regulomes” of the three cancer nodules.

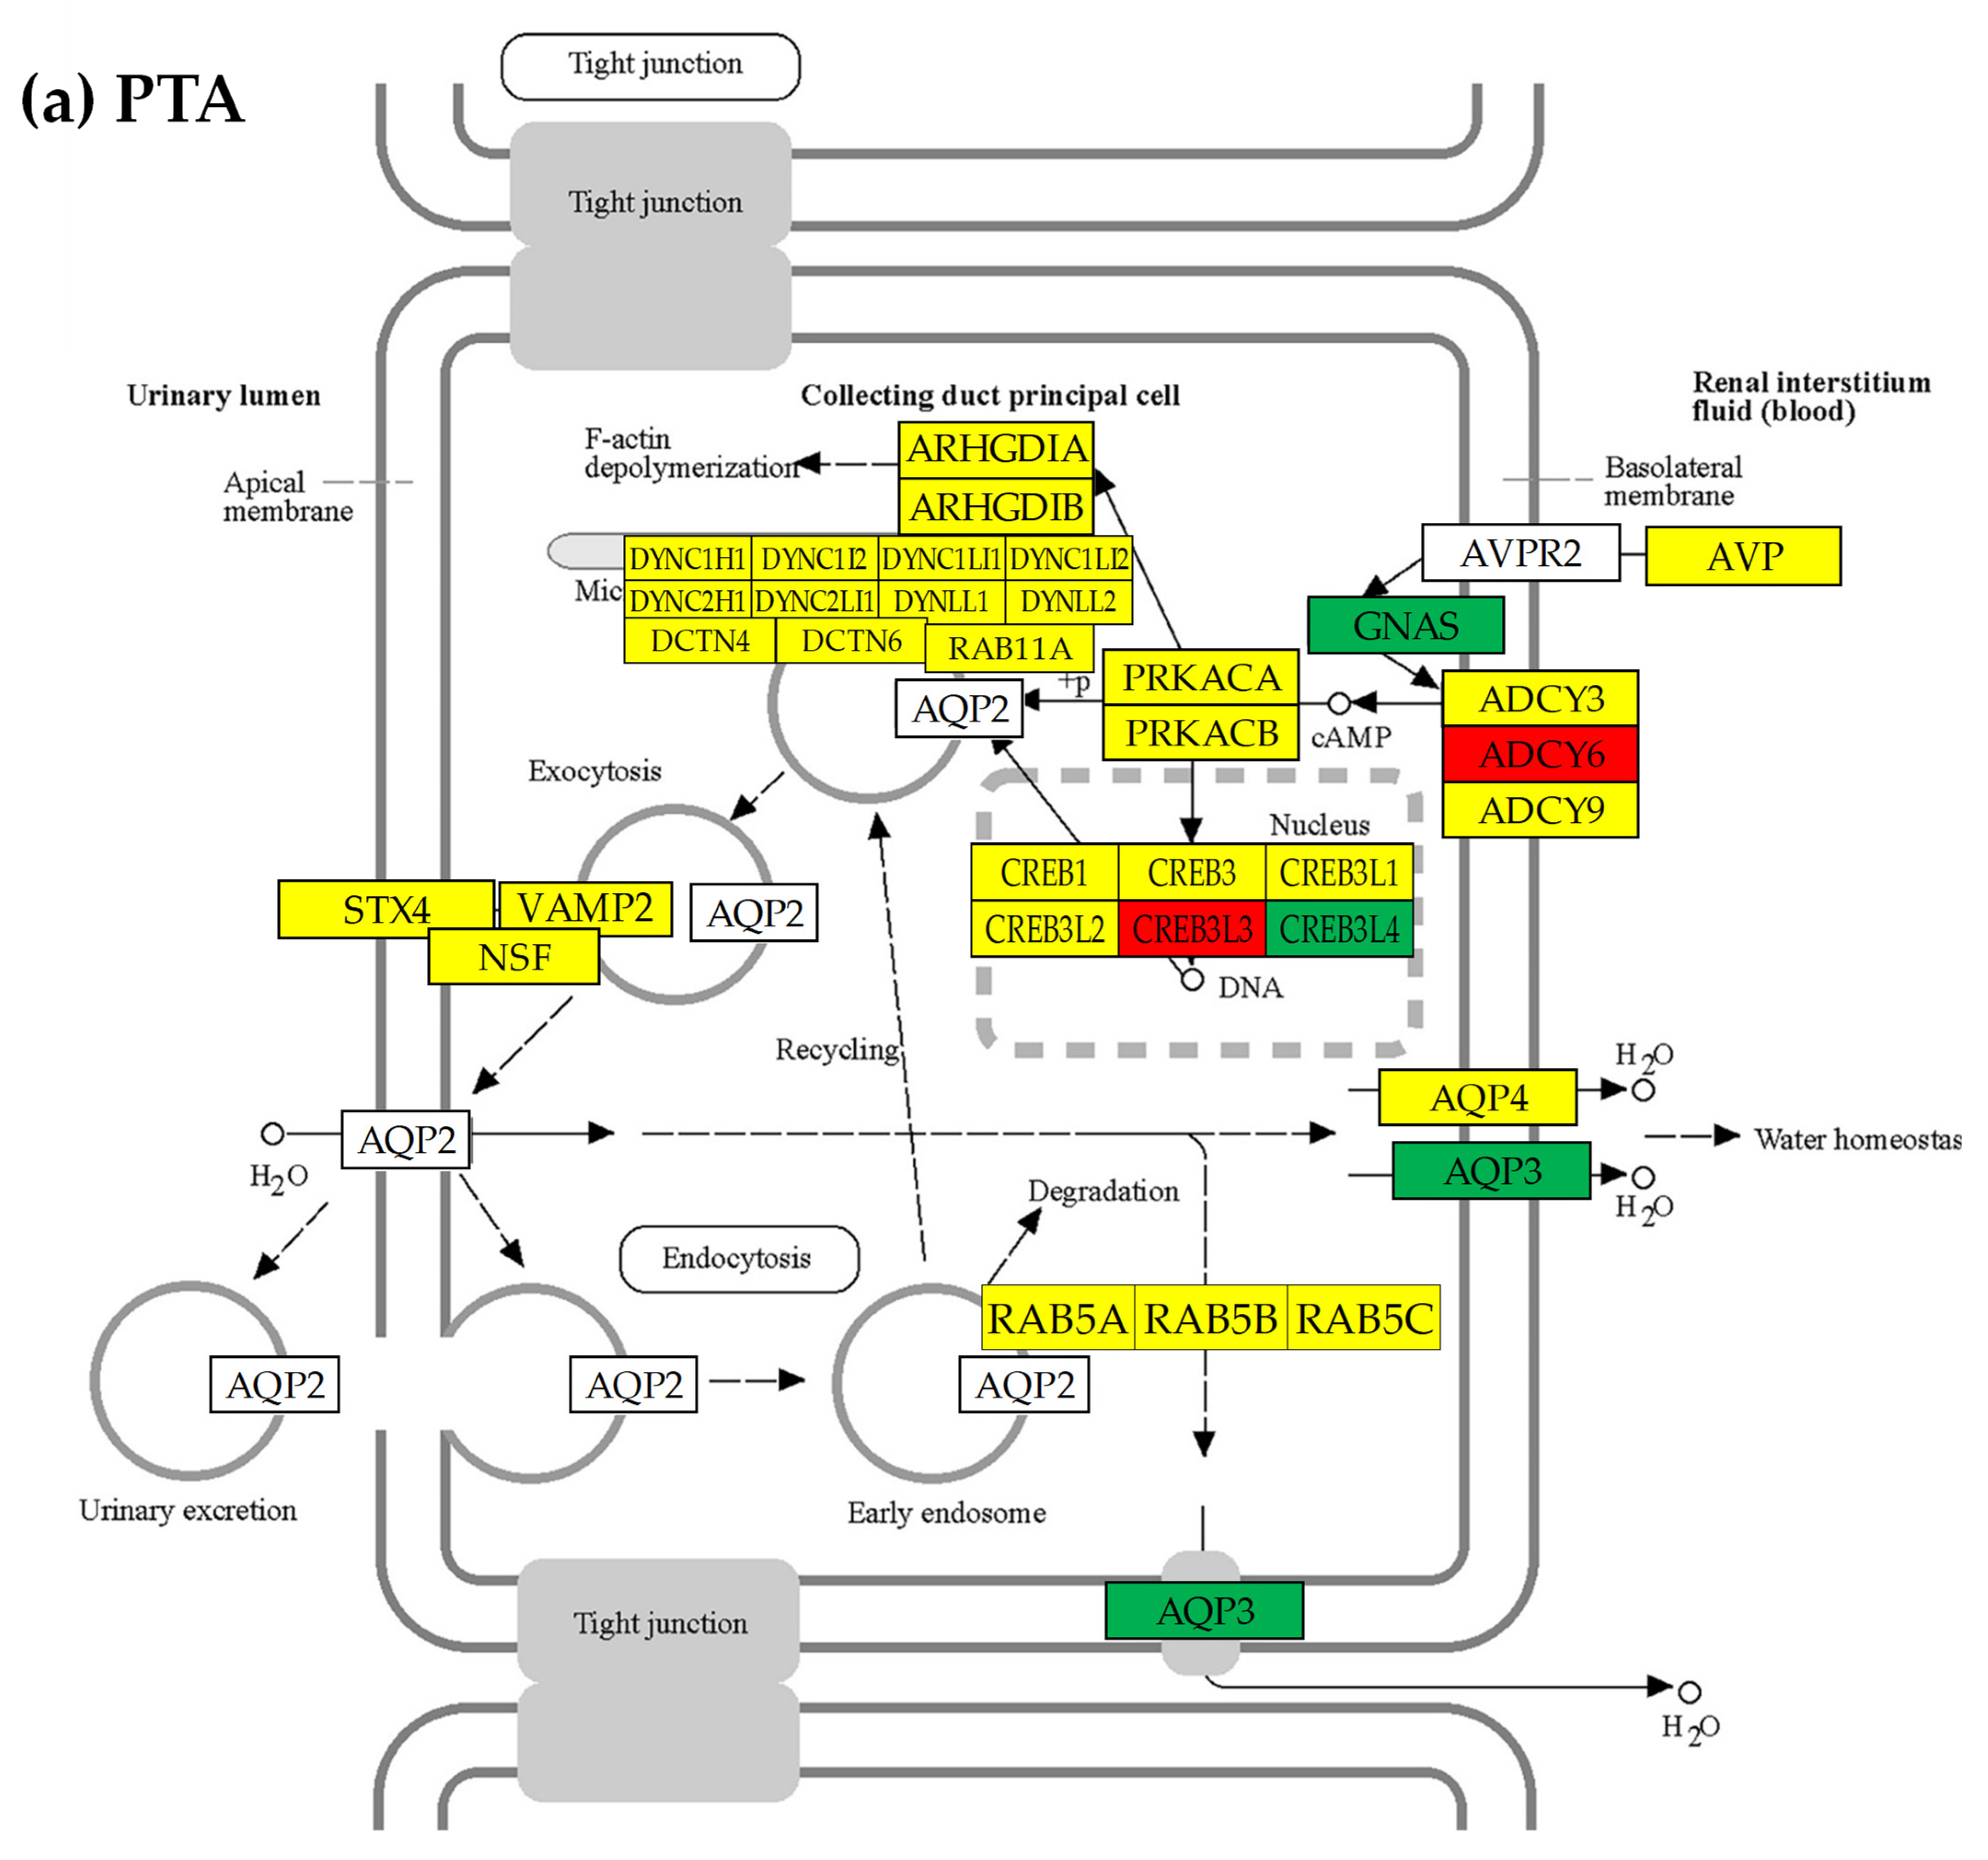
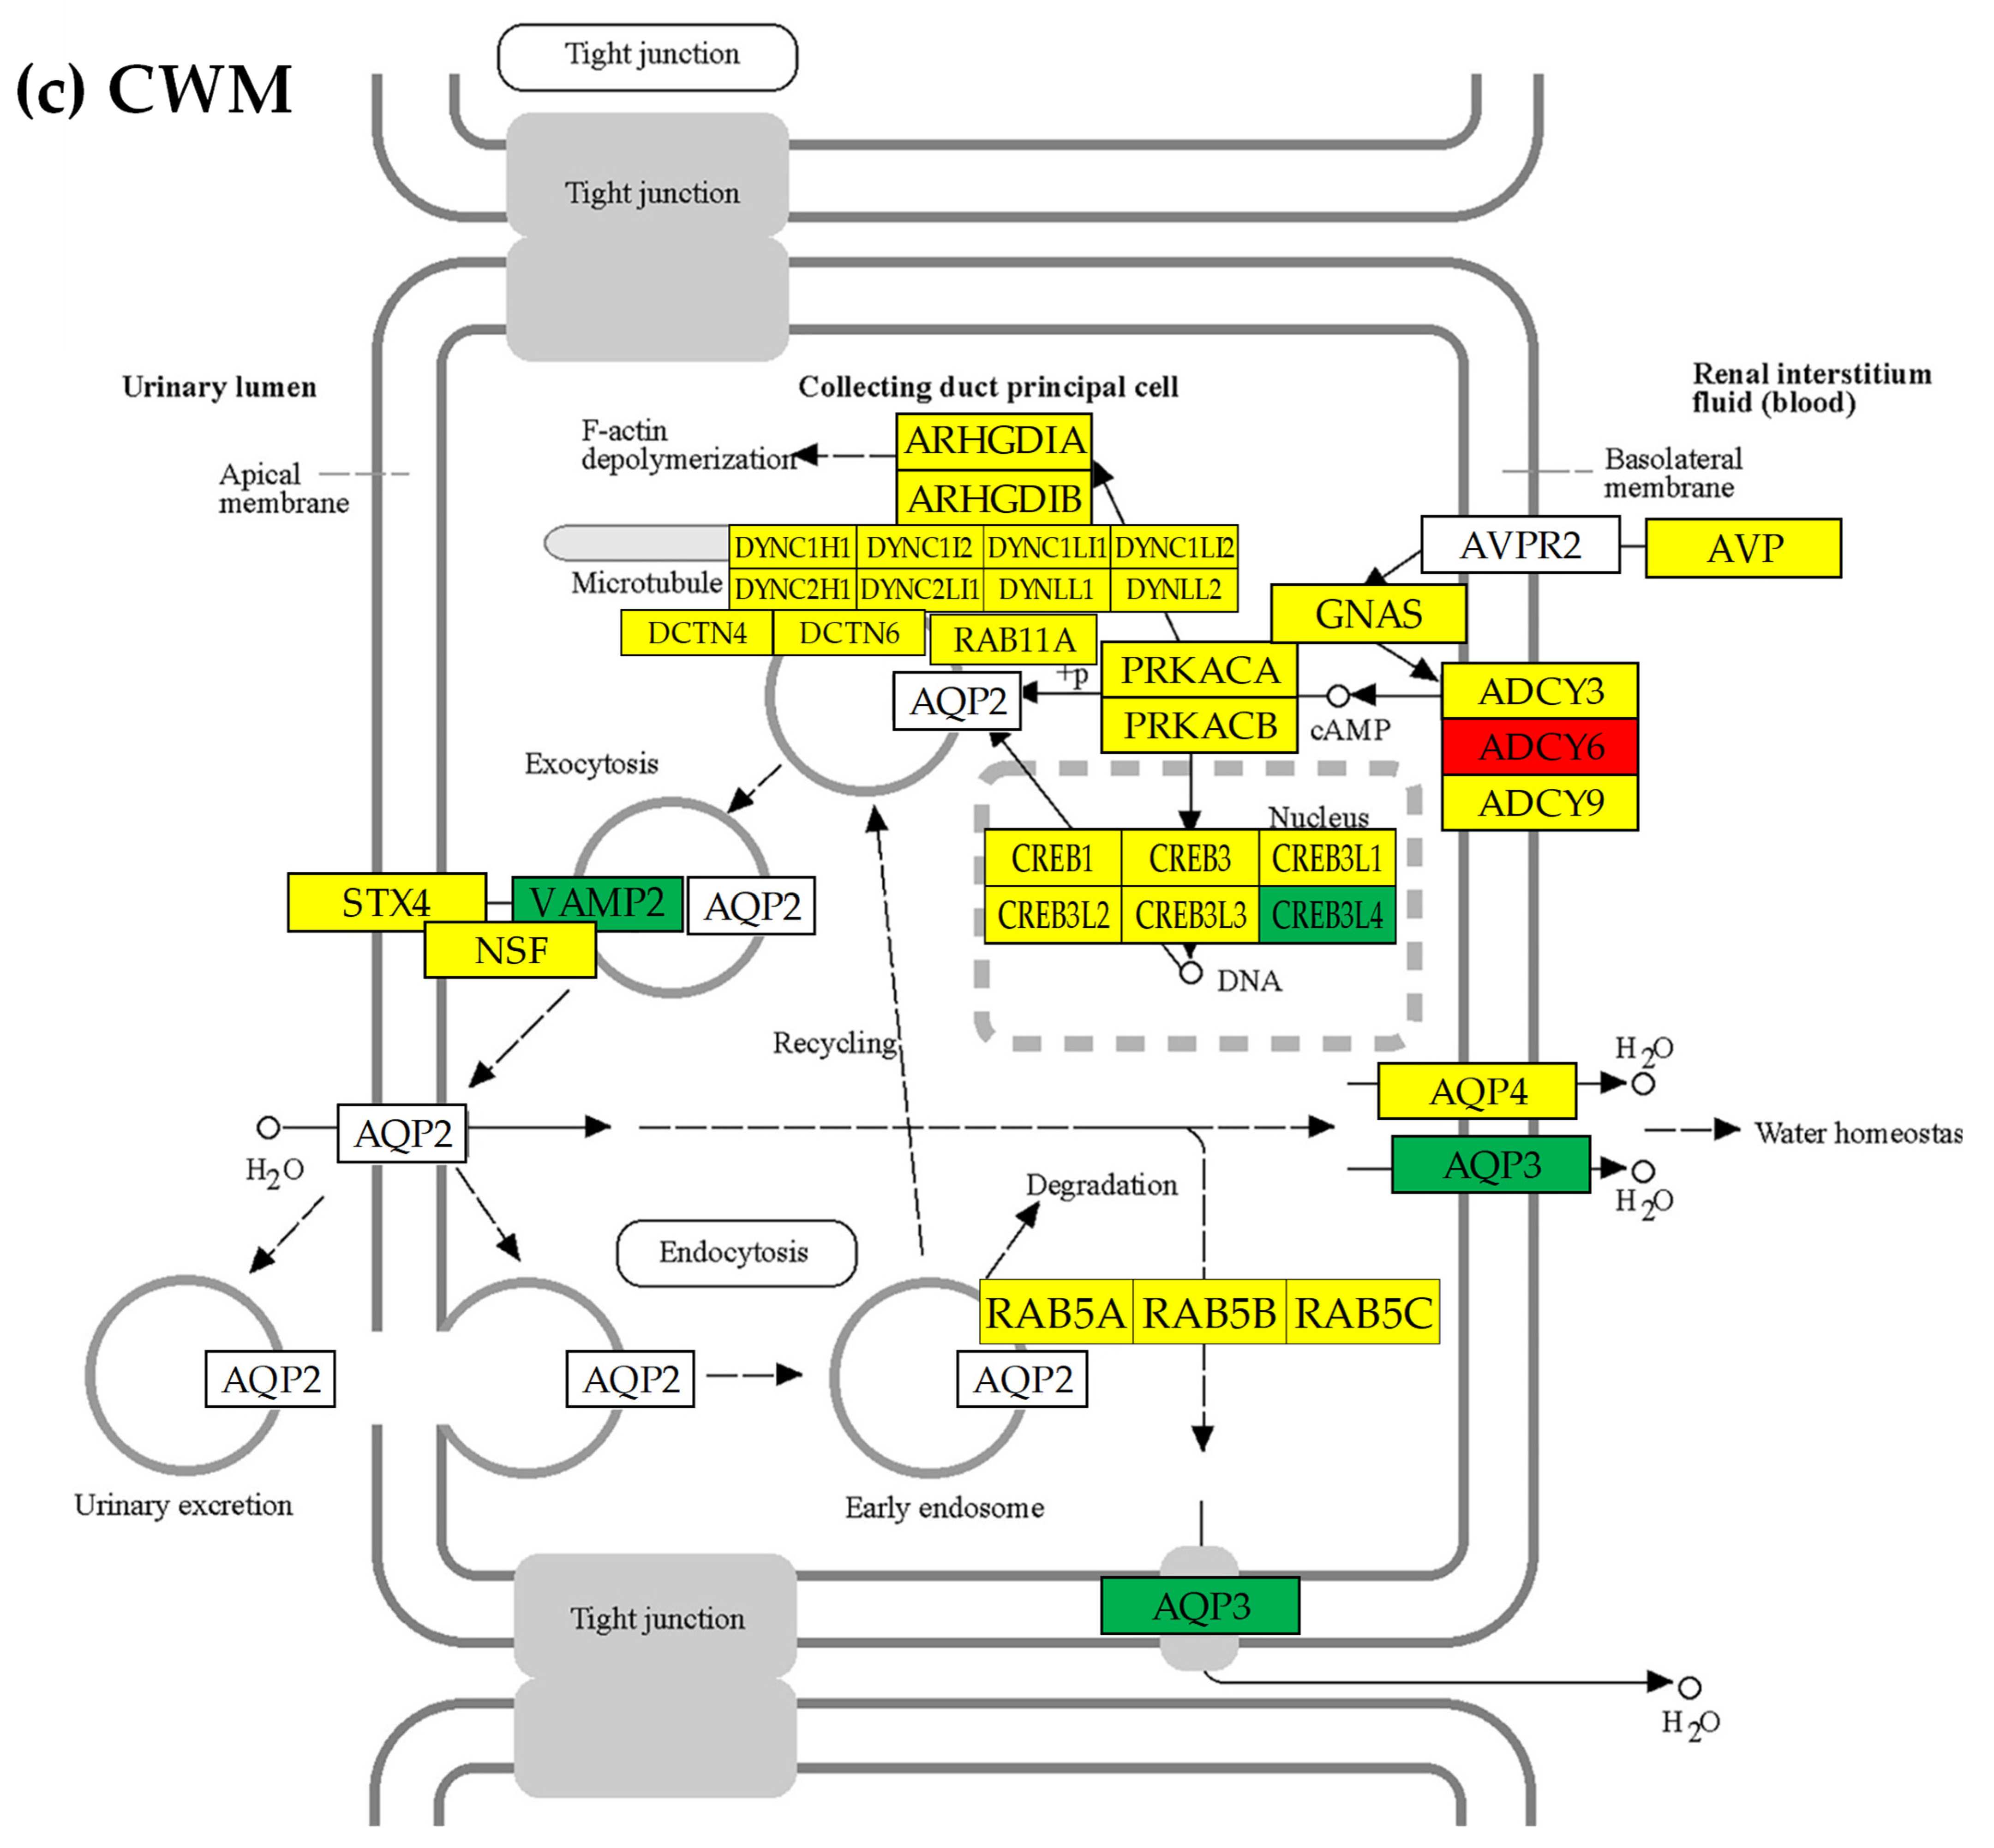
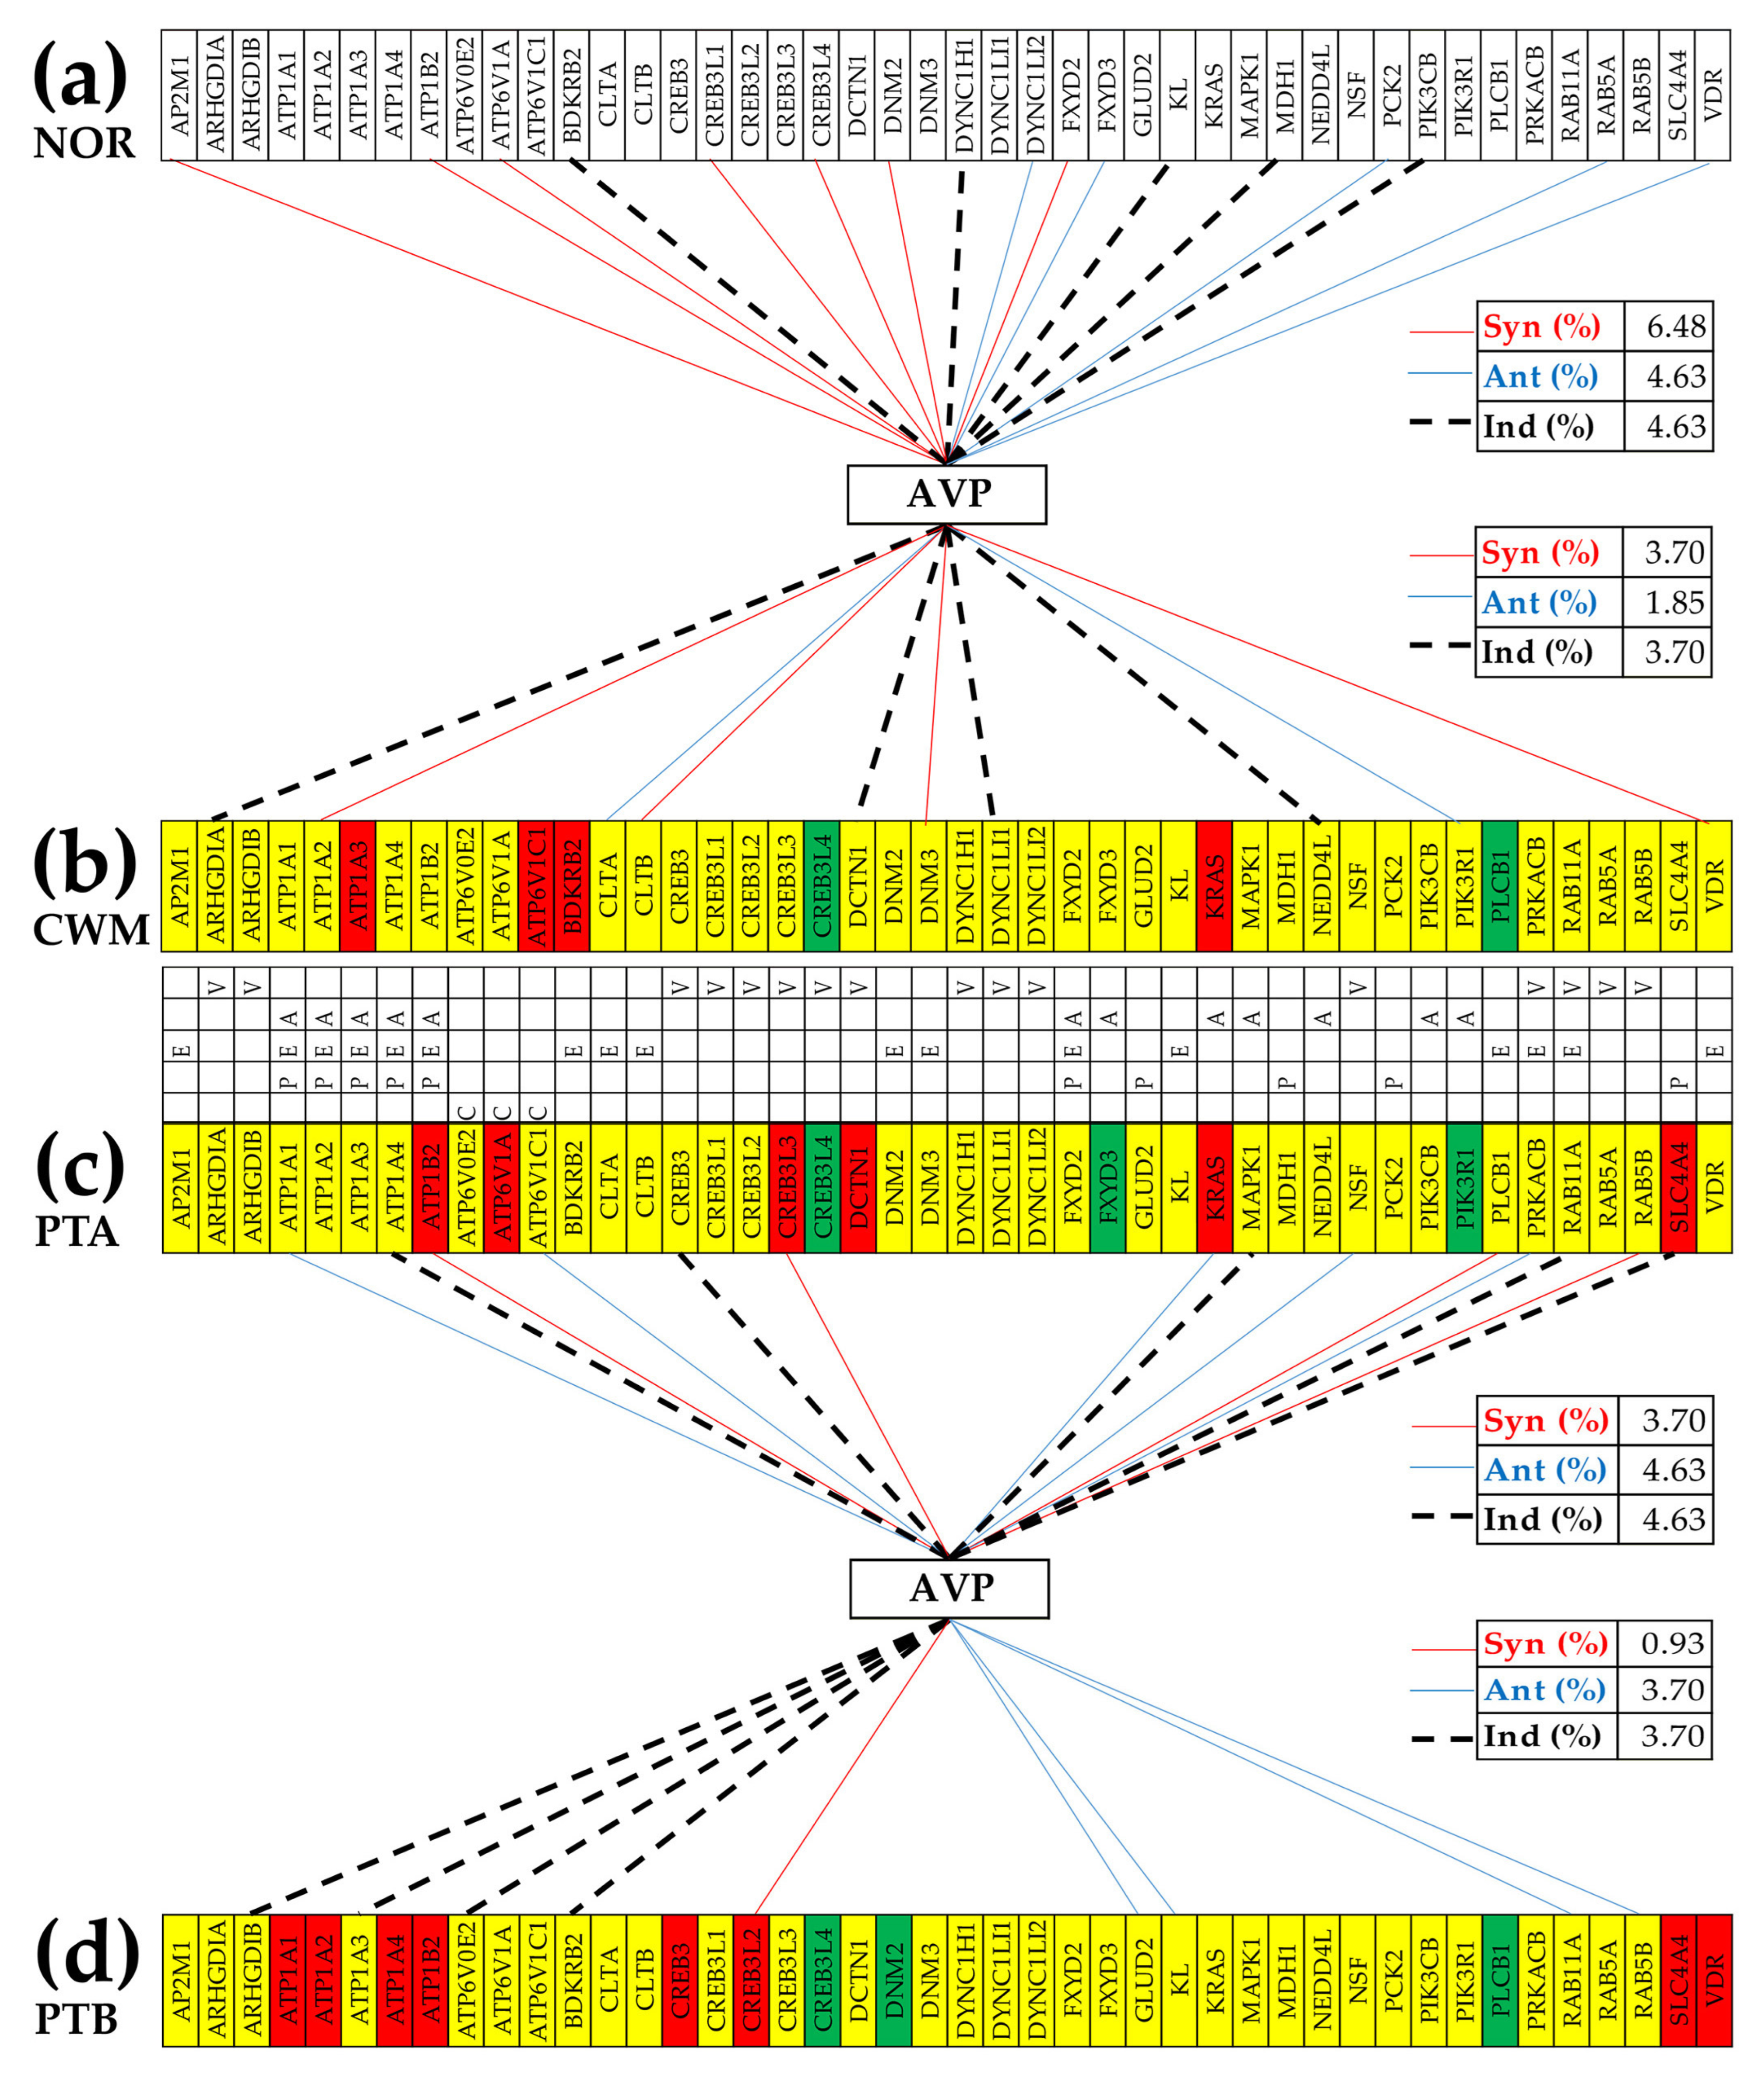
3.7. Location of the Regulated Genes in the Excretory System’s Functional Pathways

See Figure 5 for the hsa04962 (VASO) “Vasopressin-regulated water reabsorption” and Figures S1–S4 from Supplementary Material for the other four KEGG-constructed excretory system pathways present for every profiled cancer nodule and the localizations of the regulated genes. Of note are the inter-nodule differences in the subsets of the regulated genes.
We found that although the VASO gene of AVP (arginine vasopressin) was not significantly regulated in any of the three cancer nodules, expressions of several other genes were significantly altered (though not in the same way) in all profiled regions. For instance, the AQP3 (aquaporin 3 (Gill blood group)) was found as down-regulated in PTA (x(PTA→NOR) = −2.808) and CWM (x(CWM→NOR) = −5.846) but up-regulated in PTB (x(PTB→NOR) = 2.034).
The opposite regulations of the AQP3 in the two closely located and equally pathologically graded nodules of PTA and PTB is another argument to consider the “transcriptomic signature” unreliable for ccRCC [63]. The GDC data Portal of the National Cancer Institute reports four cases of kidney cancer (three females and one male) where AQP3 was found to be mutated.
Unfortunately, the important AQP2 (aquaporin 2) and AVPR2 (arginine vasopressin receptor 2) were not quantified in this experiment.
Only two excretory genes were similarly regulated in all three cancer nodules. The VASO gene CREB3L4 (cAMP responsive element binding protein 3-like 4) was down-regulated: x(PTA→NOR) = −1.40 (CUT (PTA→NOR) = 1.38, p(PTA→NOR) = 0.040); x(PTB→NOR) = −1.74 (CUT(PTB→NOR) = 1.63, p(PTB→NOR) = 0.031), x(CWM→NOR) = −1.95 (CUT(CWM→NOR) = 1.48, p(CWM→NOR) = 0.003). The down-regulation of the CREB3L4 gene in PTA would have been considered not significant in the traditional analysis requiring |x(PTA→NOR)| > 1.50, but was identified as significant by our algorithm that requires the absolute fold-change to exceed the cut-off value computed for that gene in the compared samples.
In contrast, the ALDO gene PIK3R2 (phosphoinositide-3-kinase, regulatory subunit 2 (beta)) was upregulated in all three cancer nodules: x(PTA→NOR) = 3.31 (CUT(PTA→NOR) = 1.89, p(PTA→NOR) = 0.013), x(PTB→NOR) = 1.85 (CUT(PTB→NOR) = 1.82, p(PTB→NOR) = 0.046), x(CWM→NOR) = 3.30 (CUT(CWM→NOR) = 1.90, p(CWM→NOR) = 0.032).
Two genes were oppositely regulated in the nodules of PTB and CWM: the ALDO gene SFN (stratifin; x(PTB→NOR) = 2.03, x(CWM→NOR) = −1.95) and the ENDO gene SLC8A1 (solute carrier family 8 (sodium/calcium exchanger), member 1; x(PTB→NOR) = 2.75, x(CWM→NOR) = −1.84).
Three genes were similarly regulated in PTA and PTB: the ATP1B2 (ATPase, Na+/K+ transporting, beta 2 polypeptide; x(PTA→NOR) = 1.91, x(PTB→NOR) = 2.67), the DCTN2 (dynactin 2 (p50); x(PTA→NOR) = −1.51, x(PTB→NOR) = −2.06), and the SLC4A4 (solute carrier family 4 (sodium bicarbonate cotransporter), member 4; x(PTA→NOR) = 2.19, x(PTB→NOR) = 2.57).
Three regulated genes in PTA were similarly regulated in CWM: the ADCY6 (adenylate cyclase 6; x(PTA→NOR) = 1.52, x(CWM→NOR) = 1.96), the KRAS (Kirsten rat sarcoma viral oncogene homolog; x(PTA→NOR) = 2.21, x(CWM→NOR) = 2.77), and the PIK3CD (phosphatidylinositol-4,5-bisphosphate 3-kinase, catalytic subunit delta; x(PTA→NOR) = −1.65, x(CWM→NOR) = −1.97).
Two genes were similarly regulated in PTB and CWM: the CA2 (carbonic anhydrase II; x(PTB→NOR) = 9.94, x(CWM→NOR) = 3.44) and the PLCB1 (phospholipase C, beta 1 (phosphoinositide-specific), x(PTB) = −2.60, x(CWM) = −2.01).

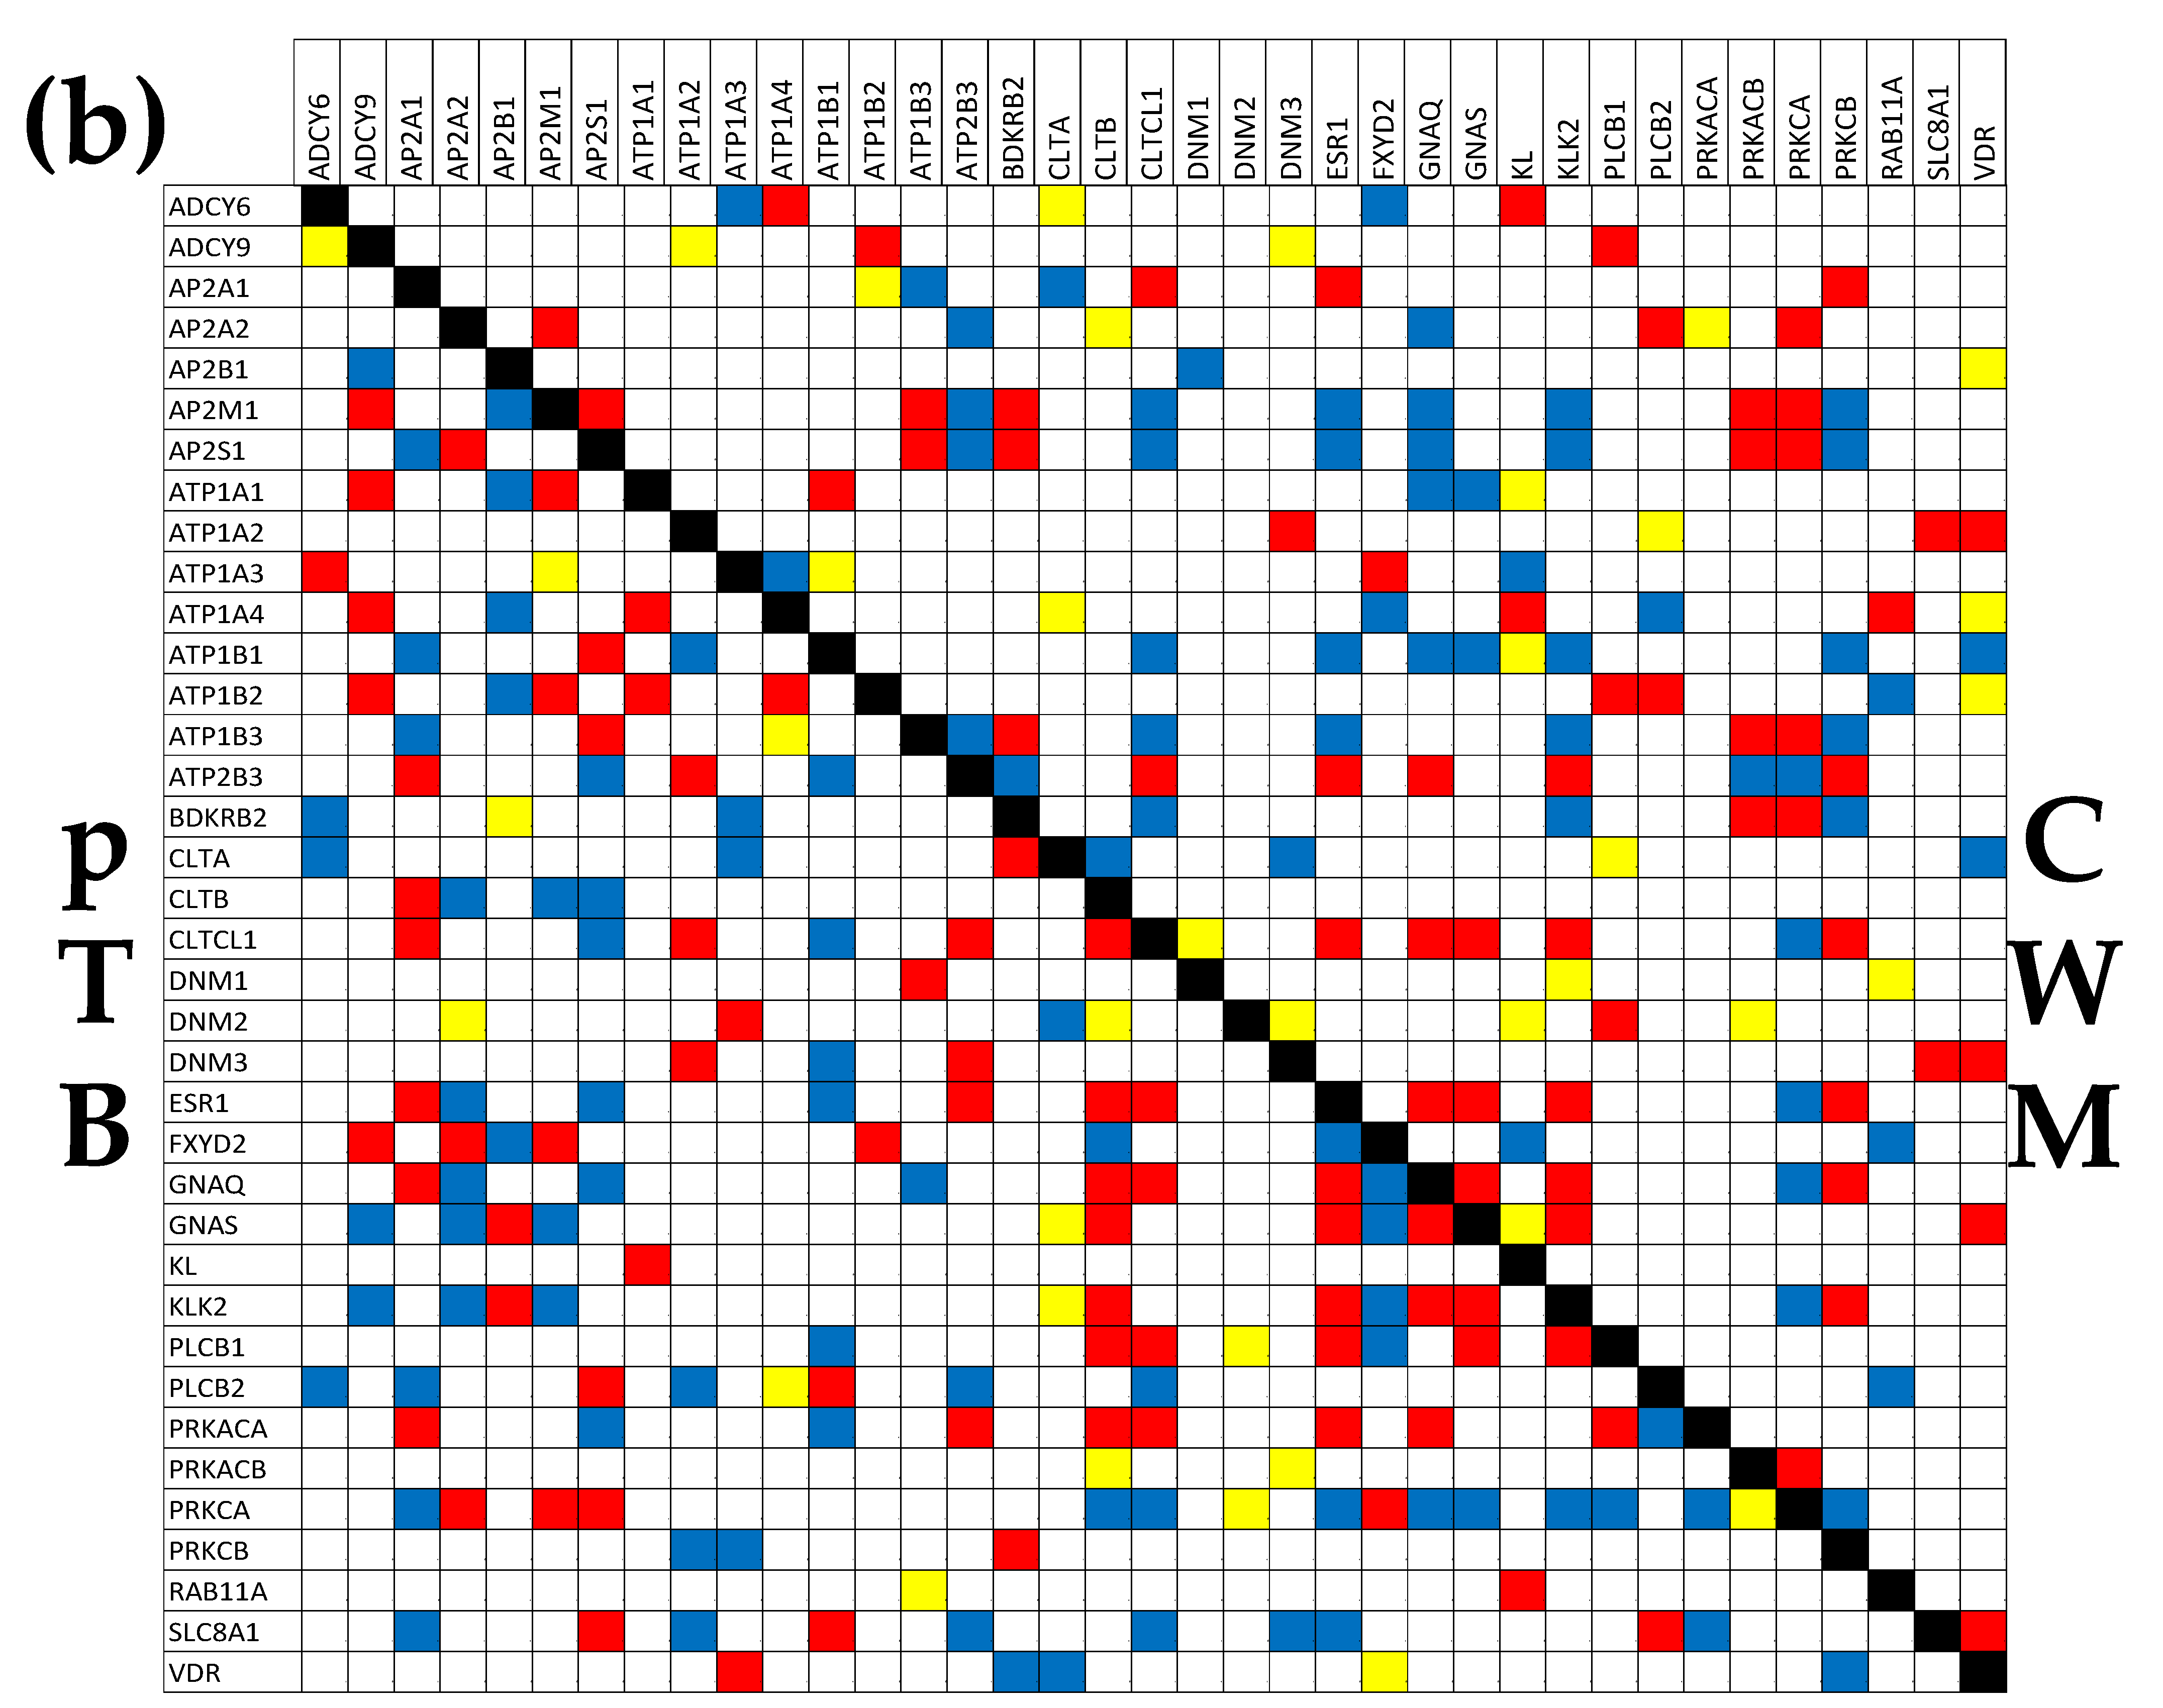
3.8. Tumor Heterogeneity of the Transcriptomic Networks

Figure 6 presents the (p < 0.05) significant synergism, antagonism, and independence among the genes from the hsa04961 pathway of ENDO (Endocrine and other factor-regulated calcium reabsorption) [59]. It is interesting to observe that the percentage of the synergistic pairs increased from 12.28% in NOR to 26.90% in PTA, 20.76% in PTB, and 16.96% in CWM. The percentage of the antagonistic pairs increased from 9.65% in NOR to 21.92% in PTA, 20.76% in PTB, and 16.08% in CWM, while that of the independently expressed pairs decreased from 12.28% in NOR to 4.09% in PTA, 4.68% in PTB, and 6.43% in CWM. Altogether, the coordination score COORD = %synergistic + %antagonistic − %independent increased from 9.65% in NOR to 44.74% in PTA, 36.84% in PTB, and 26.61% in CWM. These results indicate a substantial ccRCC-triggered increase in the inter-coordination of the genes involved in this pathway.
Of note are again the substantial differences between the PTA and PTB regions, indicating distinct wiring of the genes in the functional network. For instance, there are 7 genes (AP2S1, ATP1A2, ATP2B3, CLTCL1, DNM3, ESR1, and PLCB2) whose significant correlations with the sodium/calcium exchanger SLC8A1 are opposite in the two kidney nodules, indicating major differences in the gene networking. Thus, the ATP1A2, ATP2B3, CLTCL1, DNM3, and ESR1 are synergistically expressed with the SLC8A1 in PTA but antagonistically expressed with the SLC8A1 in PTB, while the AP2S1 and PLCB2 are antagonistically expressed with the SLC8A1 in PTA but synergistically expressed with the SLC8A1 in PTB.
Figure 7 presents the (p < 0.05) statistically significant synergism, antagonism, and independence of the quantified excretory genes with AVP in all four regions profiled. In the KEGG-constructed “Vasopressin-regulated water reabsorption” (VASO) pathway, AVP is directly connected to AVPR2 (arginine vasopressin receptor 2; not quantified in the experiment) and indirectly connected to GNAS. Using the COR analysis, we found that in the normal kidney AVP is significantly connected to the CREB3L1, CREB3L4, DYNC1H1, and RAB5A.
The cancer reconfigures the VASO networks, so that in PTA, the AVP is significantly connected to the CREB3L3, NSF, PRKACB, and RAB5B. In PTB, the AVP is connected to the CREB3L2, RAB11A, and RAB5B, while in CWM it is connected to no hsa04962 gene. Remarkably, the hsa04962 genes that also have significant independence with respect to AVP are: DYNC1H1 in NOR, CREB3 and RAB1A in PTA, ARHGDIB in PTB and ARHGDIA, DCTN1, and DYNC1H1 in CWM.

4. Discussion

This study continues the analyses from a previous article [40] on four samples collected from the chest wall metastasis (CWM), two primary tumor regions (PTA and PTB), and the surrounding normal tissue (NOR) in the right kidney of a man with metastatic ccRCC. In [40], we analyzed the ccRCC impact on cyclins, cyclin kinases, and the functional pathways of apoptosis, chemokine and VEGF signaling, oxidative phosphorylation, basal transcription factors, and RNA polymerase, while here we focused on the five KEGG-constructed functional pathways of the excretory system.
An important finding of the previous paper [40], reconfirmed in the present study, was that even equally Fuhrman-graded (3) and closely located cancer nodules from the same kidney exhibit substantial transcriptomic differences and are under the command of distinct gene master regulators. Considerably transcriptomic differences between equally graded cancer nodules were also reported by us in two prostate cancer studies [34,42]. Importantly, tumor heterogeneity, present even in patient-derived RCC organoids [64], is not limited to the genes’ mutations [65] or expression levels [66], but encompasses also the control of the transcripts’ abundances and the way the genes are interconnected in functional pathways. Tumor heterogeneity and the unrepeatable set of cancer-favoring factors characterizing each human make the “transcriptomic signature” unreliable (e.g., [67,68]), and even of the integrated proteogenomic characterization [69] derived from comparing genomic data from large populations of cancer and healthy people is made unreliable. Instead, it imposes the normal tissue surrounding the cancer nodule(s) in the tumor as the most trustable reference.
The novel findings on the alterations of the mechanisms controlling the transcript abundances and the remodeling of the functional pathways were possible by adopting the Genomic Fabric Paradigm (GFP) and the use of its mathematically advanced algorithms and software (detailed in [54]). The GFP improves the traditional gene expression analysis by replacing the arbitrarily introduced (1.5×) cut-off for the absolute fold-change of a gene to be considered as significantly regulated with a cut-off computed for each gene in the compared conditions that considers both biological variability and technical noise. While incorporating an improved version of the traditional analysis, the GFP goes further by also analyzing the gene expression control and inter-coordination. These additional characteristics provide as much supplementary information as going from knowing the height of a mountain to featuring it on a 3D scale model. The independence of the three types of expression characteristics was illustrated here for the genes involved in the KEGG-constructed pathway of the “Endocrine and other factor-regulated calcium absorption”. The independence of the three types of expression characteristics can be proven for any other gene subset (principle discussed in [53]). For instance, in previously published cancer genomics papers, we proved the independence of genes involved in: chemokine signaling [40], apoptosis [55], evading apoptosis [42], and mTOR signaling [34].
The gene networks constructed with the COR analysis do not have the same faults of universality, unicity, and rigidity as those built with the KEGG and other software. The COR-determined networks are not universal but instead depend on the race, age, and other personal characteristics of the patient that modulate his/her gene expression, as we proved in [34] for two prostate cancer patients and two standard human prostate cancer cell lines. They are not unique, with cancer nodule(s) and normal tissue exhibiting different gene wiring, and certainly not rigid, but remodeling during aging, the progression of the disease, and in response to treatment and other external stimuli. Thus, the Postulate of Transcriptomic Stoichiometry (PTS, [44]) also extends Dalton’s Law of Multiple Proportions from chemistry [45] to gene networks.
This analysis of the expression correlation among the genes of the “Endocrine and other factor-regulated calcium reabsorption” revealed an interesting partnership with the estrogen receptor 1 (ESR1), which is a tumor driver and drug-targeting factor in cancer [70], and regulator of age-related mitochondrial dysfunction and inflammation [71]. Thus, while its expression synergisms with the ATP2B3 (ATPase, Ca++ transporting, plasma membrane 3) and KLK2 (kallikrein-related peptidase 2) in NOR are not modified by ccRCC, the antagonistic expression with the AP2A1 is switched to a synergistic one in all three cancer nodules. Because the AP2A1 is important in vesicle formation and intracellular membrane trafficking [72], our result indicates that cancer switched the type of estrogen influence on the intracellular transport phenomena. Interestingly, the altered expression of ESR1 was associated with anti-cancer drug resistance, and non-coding events were identified in the regulatory hotspot of AP2A1 in various metastatic cancers [73].
We found that the excretory genes rank much lower than the GMRs identified for each region in [40]. Thus, the GNAQ (guanine nucleotide-binding protein (G protein), q polypeptide), the top gene involved in the “Endocrine and other factor-regulated calcium reabsorption” in both NOR (GCH(NOR) = 9.46) and CWM (GCH(CWM) = 17.43), is far below the GMRs of these regions: the DAPK3 (death-associated protein kinase 3, GCH(NOR) = 30.31) and the ALG13 (UDP-N-acetylglucosaminyltransferase subunit, GCH(CWM) = 82.95). The IGF1 (insulin-like growth factor 1 (somatomedin C), GCH(PTA) = 13.11) from the pathway of the “Aldosterone-regulated sodium reabsorption” is far below the TASOR (transcription activation suppressor, GCH(PTA) = 63.97) in PTA. The ATP1A2 (ATPase, Na+/K+ transporting, alpha 2 polypeptide, GCH(PTB) = 9.95) from the pathway of the “Proximal tubule bicarbonate reclamation” is below the FAM27C (family with sequence similarity 27, member C, GCH(PTB) = 57.19) in PTB. The much lower GCH scores mean that although the excretory pathways were strongly regulated, no excretory gene is an efficient target for gene therapy against any of the three cancer nodules.
The substantial decrease in the homeostatic control of AP2A1 expression in PTA but not in PTB and CWM indicates that, although not significantly regulated (x(PTANOR) = 1.22 < 1.57 = CUT(PTANOR), x(PTBNOR) = 1.04 < 1.61 = CUT(PTBNOR), x(CWMNOR) = 1.13 < 1.55 = CUT(CWMNOR)), the AP2A1 lost its importance for the cell homeostasis in PTA while keeping it at NOR level in the other nodules. The most interesting case for the expression control analysis was that of ADCY9, a biomarker for glioma [74], lung [75], and hepatocellular carcinoma [76], as well as colorectal [77], bladder [78], and pancreatic cancers [79]. The ADCY9 exhibited the largest increase of the homeostatic control in PTB and the largest decrease in CWM among all profiled excretory genes, while its control in PTA remained the same as in the normal tissue. These results indicate that while cancer had no effect on the homeostatic control of the ADCY9 transcript abundance in one region (PTA) of the tumor, it made the right ADCY9 expression critical in another region (PTB), and totally irrelevant in the metastasis nodule (CWM). Since the expression of ADCY9 is normally four times more controlled than the median kidney gene, we predict that the expression manipulation of ADCY9 will wholly jeopardize the PTB cells, and have a similar (high) negative effect on both normal and PTA cells, while stimulating the proliferation of CWM cells. Thus, at least for this patient, targeting ADCY9 could be both beneficial and harmful.
The increased overall correlation of the ADCY6 and AP2A1 with all other genes from the “Endocrine and other factor-regulated calcium reabsorption” pathway (Figure 3e) in PTA, but the decrease in the other two cancer nodules, indicates substantially different gene networks. Thus, according to Figure 6, in NOR, the AP2A1 has four statistically significant synergistically (ADCY6, DNM2, FXYD2, PLCB1) and four antagonistically (ATP1A2, ATP2B3, ESR1, KLK2) expressed partners, while in PTA it has eleven synergistic (ADCY6, ATP1A2, ATP1A4, ATP2B3, CLTCL1, ESR1, GNAQ, GNAS, KLK2, PRKCB, VDR) and five antagonistic (ATP2M1, ATP1B3, CLTA, FXYD2) partners (bolded symbols indicate the genes that switched the expression correlation type in PTA with respect to NOR). The partnerships of AP2A1 were partially similar in PTB: it had synergism with ATP2B3, CLTB, CLTCL1, ESR1, and GNAQ, and antagonism with AP2S1, ATP1B1, ATP1B3, PLCB2, PRKCA, and SLC8A1 (underlined symbols indicate common partners in PTA and PTB).
Because ADCY6 is a promising target in cancer therapy [80], it is important to know how it relates to other excretory genes. Thus, in normal tissue (NOR) it is synergistically expressed with AP2A1 and ATP1B1, and antagonistically expressed with ATP1A2, ATP2B3, ESR1, and KLK2, as well as independently expressed with CLTB. In PTA, the synergism with AP2A1 is preserved but that with ATP1B1 is switched to antagonism. PTA adds synergism with GNAQ, GNAS, and VDR and antagonism with AP2A2 and ATP1B3. The overall coordination of ADCY6 with other genes from the pathway is diminished in PTB (synergism with ATP1A3 and antagonism with BDKRB2, CLTA, and PLCB2) and CWM (synergism with ATP1A4 and KL, and antagonism with ATP1A3 and FXYD2). Therefore, for this patient, manipulating the expression of ADCY6 would have different effects on his cancer nodules.
The down-regulation of AQP3 (x = −3.889) was reported recently [81] by performing a meta-analysis of public datasets from the publicly accessible databases of ONCOMINE [82] and UALCAN [83]. In the cited study, the authors compared the expressions of all aquaporin encoding genes (AQP1/2/3/4/5/6/7/8/9/10/11) in 533 tumor cases with 72 normal cases, using the uniform fold-change threshold of 1.50× and p-value < 0.01, to decide whether a gene was significantly regulated. Since no web resource specifies the exact locations in the kidney from which the samples have been collected, nor whether the tumors contained more cancer nodules, the authors implicitly assumed homogeneous gene expressions all over the tumor. In contrast, our results (AQP3 down-regulated in PTA and CWM but up-regulated in PTB) indicate that ccRCC tumors do not exhibit uniform but rather heterogeneous gene expressions, and therefore the meta-analyses comparing cancer cases with healthy cases have little biological relevance beyond the statistics exercise. Instead, the best reference for cancer nodules is the normal tissue still present in the tumor.
Figure 7 shows distinct statistically significant coordination partners of AVP, the neuropeptide hormone arginine vasopressin, which is a very important regulator of kidney salt and water homeostasis [84]. Our analysis detailed also how AVP-dependent water reabsorption regulates the cAMP signaling pathway [85,86] through expression correlation with genes shared by the cAMP signaling pathway with the excretory pathways. Thus, in NOR, AVP is synergistically expressed with ATP1B2, CREB3L1, CREB3L4, and FXYD2, has no antagonistic partners, and is independently expressed with PIK3CB. In PTA, AVP is synergistically expressed with ATP1B2 and CREB3L3, antagonistically expressed with ATP1A1 and PRKACB, and independently expressed with ATP1A4, CREB3, and MAPK1. In PTB, AVP is synergistically expressed with CREB3L2 and independently expressed with ATP1A3, while in CWM it is synergistically expressed with ATP1A2 and antagonistically expressed with PIK3R1. AVP is also involved in the KEGG-constructed pathways of hsa04270 “Vascular smooth muscle contraction”, and the very important hsa04020 “Calcium signaling pathway” and hsa04072 “Phospholipase signaling pathway”.
Interestingly, CREB3L4, known for its role in proliferating prostate cancer cells [87], was significantly down-regulated in all kidney cancer nodules (x(PTA) = −1.40, x(PTB) = −1.74, x(CWM) = −1.95). Out of 18 regulated excretory genes in PTA and twenty-one in PTB, only five were similarly regulated (ATP1B2, CREB3L4, DCTN2, PIK3R2, SLC4A4) and one (AQ3) was oppositely regulated.
Altogether, the differences in gene expression regulation and remodeling of the excretory pathways among the three cancer nodules indicate that the bio-assays used to identify the ccRCC presence by the regulation of certain gene biomarkers might not be always valid. For instance, the CA9 (carbonic anhydrase IX) that should be expressed only in ccRCC [88,89] was found by us to be expressed not only in the cancer nodules (AVE(PTA) = 2.11, AVE(PTB) = 0.27, AVE(CWM) = 2.65) but also in the NOR (AVE(NOR) = 2.76). Moreover, the CA9 exhibited a significant down-regulation in PTB (x(PTB→NOR) = −10.37).
Nonetheless, adoption of the GFP increases by 3–4 orders of magnitude the computational effort, thus opening the field of genomics to artificial intelligence applications [90] that have the power to combine practically unlimited amounts of histo-pathological, imaging and “omic” information [91].

5. Conclusions

Although based on a single metastatic ccRCC case, our study shows that adding the analyses of transcriptomic control and expression inter-coordination of the genes provides a significantly deeper understanding of cancer-related transcriptomic alterations. Going from traditional unidimensional gene expression analysis to the GFP is like going from determining only the numbers of electronic items of each type needed to fix a complex robot, to knowing also how to wire these items and what voltages to apply to each of them. Thus, the GFP not only incorporates the traditional gene expression analysis but complements it with a detailed examination of the expression control and gene inter-coordination, altogether providing a complete characterization of the transcriptome.
The unrepeatable combination of cancer-favoring factors among humans questions the validity of the cancer biomarkers derived from meta-analyses of large genomic datasets. The intra-tumor transcriptomic heterogeneity makes the transcriptomic signatures even less reliable. Therefore, we believe that the personalization of cancer gene therapy should go beyond the patient to the primary cancer clones present in his/her tumor. The progress of gene-editing technology will soon allow the industry to produce silencing constructs for all genes at reasonable prices so that personalized cancer gene therapy will become affordable.

Supplementary Materials

The following supporting information can be downloaded at: https://www.mdpi.com/article/10.3390/cimb45120594/s1, Figure S1: Regulated genes in the KEGG-constructed functional pathway hsa04960 Aldosterone-regulated sodium reabsorption, Figure S2: Regulated genes in the KEGG-constructed functional pathway hsa04966 Collecting duct acid secretion, Figure S3: Regulated genes in the KEGG-constructed functional pathway hsa04961 Endocrine and other factor-regulated calcium reabsorption, Figure S4: Regulated genes in the KEGG-constructed functional pathway hsa04964 Proximal tubule bicarbonate reclamation.

Author Contributions

Conceptualization, D.A.I.; methodology, D.A.I. and S.I.; software, D.A.I.; validation, D.A.I. and S.I.; formal analysis, D.A.I.; investigation, S.I.; resources, D.A.I.; data curation, D.A.I.; writing—original draft preparation, D.A.I.; writing—review and editing, E.A.O.; visualization, D.A.I. and E.A.O.; supervision, D.A.I.; project administration, D.A.I.; funding acquisition, D.A.I. All authors have read and agreed to the published version of the manuscript.

Funding

This research received no external funding.

Institutional Review Board Statement

The experimental dataset was retrieved from an investigation conducted according to the guidelines of the Declaration of Helsinki. At the time of the experiment, the study was part of D.A. Iacobas’ project approved by the Institutional Review Boards (IRB) of the New York Medical College’s (NYMC) and Westchester Medical Center’s (WMC) Committees for Protection of Human Subjects. The approved IRB (L11,376 from 2 October 2015) granted access to frozen cancer specimens from the WMC Pathology Archives and depersonalized pathology reports, waiving the patient’s informed consent.

Informed Consent Statement

The approved IRB granted access to frozen cancer specimens from the WMC Pathology Archives and depersonalized pathology reports, thus waiving the patient’s informed consent.

Data Availability Statement

Transcriptomic data are publicly available at https://www.ncbi.nlm.nih.gov/geo/query/acc.cgi?acc=GSE72304 (accessed on 26 October 2023).

Conflicts of Interest

The authors declare no conflict of interest.

Appendix A

1. 
Normalized gene expression levels in the biological replica “k” in condition “c”:
c = P T A , P T B , C W M , N O R & k = 1 ÷ 4 α i ( c ; k ) a i ( c ; k ) a j ( c ; k ) j = 1 ÷ N α j ( c ; k ) j = 1 ÷ N = 1
ai(c;k) is the sum of the net fluorescences of all microarray spots probing gene “i” in the biological replica “k” of condition “c”.
2. 
Relative expression variation:
R E V i ( c ) ( α ) σ i ( c ) 2 A V E i ( c ) r i χ 2 ( β ; r ) + r i χ 2 ( 1 β ; r ) × 100 % , w h e r e : σ i ( c ) = s d e v α i ( c ; k ) k = 1 ÷ 4 , β   ( usually   β = 0 . 05 )   is   the   probability , r i   is   the   number   of   degrees   of   freedom ,   r i = n ν i 1
and χ2 is the chi-square score with β probability for r degrees of freedom.
3. 
Transcriptome configuration function:
F ( 1 , 2 , , N ) = A 1 i = 1 N f 1 ( i ) independent + A 2 i > j = 1 N f 2 ( i , j ) pair - wise + A 3 i > j > k = 1 N f 3 ( i , j , k ) 3 - genes   clusters + + A N f N ( 1 , 2 , , N ) all   genes   cluster
where A1, …, AN are the probabilities of each configuration of gene clustering, and f2, f3, …, fN are distribution functions symmetrical to the permutation(s) of the genes. The above expansion satisfies the following conditions:
probability   condition :   p = 1 N A p = 1 norm   conditions : F ( 1 , 2 , , N ) d V = 1 , p = 1 ÷ N   V i 1 > i 2 > > i p = 1 N f p ( i 1 , i 2 , , i p ) d V = 1
A 3-gene cluster can be approximated with the superposition of three paired genes:
i > j > k N f 3 ( i , j , k ) i > j > k N f 2 ( i , j ) f 2 ( j , k ) f 2 ( k , i )
A 4-gene cluster can be approximated with four 3-gene clusters:
f 4 ( i , j , k , l ) = f 3 ( i , j , k ) f 3 ( j , k , l ) f 3 ( k , l , i ) f 3 ( l , i , j )
that can be further approximated with six squared distributions of paired genes:
f 4 ( i , j , k , l ) = f 2 ( i , j ) f 2 ( j , k ) f 2 ( k , i ) f 3 ( i , j , k ) × f 2 ( j , k ) f 2 ( k , l ) f 2 ( l , j ) f 3 ( j , k , l ) × f 2 ( k , l ) f 2 ( l , i ) f 2 ( i , k ) f 3 ( k , l , i ) × f 2 ( i , j ) f 2 ( j , l ) f 2 ( l , i ) f 3 ( l , i , j ) = f 2 2 ( i , j ) f 2 2 ( j , k ) f 2 2 ( k , i ) f 2 2 ( k , l ) f 2 2 ( l , j ) f 2 2 ( l , i )
and so on, giving the recurrence relation:
p 3 & I p = a   set   of   p   genes f p ( I p ) all   combinations   of   p   genes in   sets   of   p - 1   genes f p 1 ( I p 1 ) i > j I p f 2 p 2 ( i , j )
From the normalization condition, it results that:
p 3 q > r = 1 ÷ N , i > j I p f 2 p 2 ( i , j ) < < i > j I p f 2 ( i , j )
Therefore, one can neglect the contributions of clusters with more than 2 genes:
F ( 1 , 2 , , N ) A 1 i = 1 N f 1 ( i ) independent + A 2 i > j = 1 N f 2 ( i , j ) pair - wise
4. 
Pair-wise correlation of gene expression levels:
C O R i , j ( c ) k = 1 4 log 2 α i ( c ; k ) log 2 A V E i ( c ) log 2 α j ( c ; k ) log 2 A V E j ( c ) k = 1 4 log 2 α i ( c ; k ) log 2 A V E i ( c ) 2 k = 1 4 log 2 α j ( c ; k ) log 2 A V E j ( c ) 2
5. 
Gene Commanding Height:
G C H i ( c ) R E V ( c ) R E V i ( c ) × e x p 4 C O R i , j ( c ) 2 ¯
6. 
Statistically significant regulation of the expression level:
A b s x i ( c a n c e r N O R ) C U T i ( c a n c e r N O R ) = 1 + 2 R E V i ( c a n c e r ) 100 2 + R E V i ( N O R ) 100 2 & p i ( c a n c e r N O R ) < 0.05 where :   x i ( c a n c e r N O R ) =       A V E i ( c a n c e r ) A V E i ( N O R )                 i f A V E i ( c a n c e r ) A V E i ( N O R ) A V E i ( N O R ) A V E i ( c a n c e r )             i f A V E i ( c a n c e r ) < A V E i ( N O R ) , c a n c e r = P T A , P T B , C W M
7. 
Weighted Individual (Gene) Regulation:
W I R i ( c a n c e r N O R ) A V E i ( N O R ) x i ( c a n c e r N O R ) A b s x i ( c a n c e r N O R ) A b s x i ( c a n c e r N O R ) 1 absolute   fold - change 1 p i ( c a n c e r N O R ) confidence
8. 
Weighted Pathway Regulation:
W P R Γ c a n c e r N O R = A b s ( W I R i c a n c e r N O R ) ¯ i ϵ Γ
9. 
Relative Expression Control:
R E C i ( c o n d i t i o n ) R E V ( c o n d i t i o n ) R E V i ( c o n d i t i o n ) 1 × 100 % , where R E V ( c o n d i t i o n )   is   the   median   R E V
10. 
Regulation of the Expression Control:
Δ R E C i ( c a n c e r N O R ) c o n s t R E V i ( c a n c e r ) c o n s t R E V i ( N O R ) , c o n s t = calibration   constant
In this study const = 100.
11. 
Regulation of the Expression Coordination:
Δ C O R i , Γ ( c a n c e r N O R ) j Γ C O R i , j ( c a n c e r ) C O R i , j ( N O R ) A b s j Γ C O R i , j ( c a n c e r ) C O R i , j ( N O R ) j Γ C O R i , j ( c a n c e r ) C O R i , j ( N O R ) 2
12. 
Transcriptomic Distance:
T D I i , Γ c a n c e r N O R W I R i c a n c e r N O R regulation   of expression   level 2 + Δ R E C i c a n c e r N O R regulation   of transription   control 2 + j Γ C O R i , j c a n c e r C O R i , j N O R regulation   of expression   coordination 2

References

  1. Cancer Treatment Options at Houston Methodist Organization. Available online: https://www.houstonmethodist.org/cancer/treatment-options/ (accessed on 3 May 2023).
  2. Pecoraro, A.; Campi, R.; Marchioni, M. European Association of Urology Young Academic Urologists Renal Cancer Working Group. Techniques and outcomes of percutaneous tumour ablation for small renal masses. Curr. Opin. Urol. 2023, 33, 360–366. [Google Scholar] [CrossRef] [PubMed]
  3. Lanza, C.; Carriero, S.; Ascenti, V.; Tintori, J.; Ricapito, F.; Lavorato, R.; Biondetti, P.; Angileri, S.A.; Piacentino, F.; Fontana, F.; et al. Percutaneous Application of High Power Microwave Ablation with 150 W for the Treatment of Tumors in Lung, Liver, and Kidney: A Preliminary Experience. Technol. Cancer Res. Treat. 2023, 22, 15330338231185277. [Google Scholar] [CrossRef] [PubMed]
  4. Key Statistics about Kidney Cancer. Available online: https://www.cancer.org/cancer/kidney-cancer.html (accessed on 6 September 2023).
  5. Mieville, V.; Griffioen, A.W.; Benamran, D.; Nowak-Sliwinska, P. Advanced in vitro models for renal cell carcinoma therapy design. Biochim. Biophys. Acta (BBA)-Rev. Cancer 2023, 1878, 188942. [Google Scholar] [CrossRef] [PubMed]
  6. Dahle, D.O.; Skauby, M.; Langberg, C.W.; Brabrand, K.; Wessel, N.; Midtvedt, K. Renal Cell Carcinoma and Kidney Transplantation: A Narrative Review. Transplantation 2022, 106, e52–e63. [Google Scholar] [CrossRef]
  7. Gong, Y.; Pang, H.; Yu, Z.; Wang, X.; Li, P.; Zhang, Q. Construction of inflammatory associated risk gene prognostic model of NSCLC and its correlation with chemotherapy sensitivity. Ann. Med. 2023, 55, 2200034. [Google Scholar] [CrossRef]
  8. Hara, Y.; Shiba, N.; Yoshida, K.; Yamato, G.; Kaburagi, T.; Shiraishi, Y.; Ohki, K.; Shiozawa, Y.; Kawamura, M.; Kawasaki, H.; et al. TP53 and RB1 alterations characterize poor prognostic subgroups in pediatric acute myeloid leukemia. Genes Chromosomes Cancer 2023, 62, 412–422. [Google Scholar] [CrossRef]
  9. Cancel-Tassin, G.; Koutros, S. Use of genomic markers to improve epidemiologic and clinical research in urology. Curr. Opin. Urol. 2023, 33, 414–420. [Google Scholar] [CrossRef]
  10. Wu, F.; Ning, H.; Sun, Y.; Wu, H.; Lyu, J. Integrative exploration of the mutual gene signatures and immune microenvironment between benign prostate hyperplasia and castration-resistant prostate cancer. Aging Male 2023, 26, 2183947. [Google Scholar] [CrossRef]
  11. Yerukala Sathipati, S.; Tsai, M.J.; Shukla, S.K.; Ho, S.Y. Artificial intelligence-driven pan-cancer analysis reveals miRNA signatures for cancer stage prediction. HGG Adv. 2023, 4, 100190. [Google Scholar] [CrossRef]
  12. Yang, L.; Yang, M.; Cui, C.; Long, X.; Li, Y.; Dai, W.; Lang, T.; Zhou, Q. The myo-inositol biosynthesis rate-limiting enzyme ISYNA1 suppresses the stemness of ovarian cancer via Notch1 pathway. Cell. Signal. 2023, 107, 110688. [Google Scholar] [CrossRef]
  13. Aveta, A.; Cilio, S.; Contieri, R.; Spena, G.; Napolitano, L.; Manfredi, C.; Franco, A.; Crocerossa, F.; Cerrato, C.; Ferro, M.; et al. Urinary MicroRNAs as Biomarkers of Urological Cancers: A Systematic Review. Int. J. Mol. Sci. 2023, 24, 10846. [Google Scholar] [CrossRef] [PubMed]
  14. Huang, L.; Shao, J.; Xu, X.; Hong, W.; Yu, W.; Zheng, S.; Ge, X. WTAP regulates autophagy in colon cancer cells by inhibiting FLNA through N6-methyladenosine. Cell Adhes. Migr. 2023, 17, 1–13. [Google Scholar] [CrossRef] [PubMed]
  15. Yang, R.Y.; Tan, J.Y.; Liu, Z.; Shen, X.L.; Hu, Y.J. Lappaol F regulates the cell cycle by activating CDKN1C/p57 in human colorectal cancer cells. Pharm. Biol. 2023, 61, 337–344. [Google Scholar] [CrossRef]
  16. Yavuz, M.; Takanlou, L.S.; Avcı, Ç.B.; Demircan, T. A selective androgen receptor modulator, S4, displays robust anti-cancer activity on hepatocellular cancer cells by negatively regulating PI3K/AKT/mTOR signalling pathway. Gene 2023, 869, 147390. [Google Scholar] [CrossRef] [PubMed]
  17. Ishiguro, M.; Fukushige, T.; Iwasaki, H. Establishment and Characterization of a TFE3-rearranged Renal Cell Carcinoma Cell Line (FU-UR-2) with the PRCC-TFE3 Fusion Transcript. Anticancer Res. 2023, 43, 3463–3470. [Google Scholar] [CrossRef] [PubMed]
  18. Lasorsa, F.; Rutigliano, M.; Milella, M.; Ferro, M.; Pandolfo, S.D.; Crocetto, F.; Tataru, O.S.; Autorino, R.; Battaglia, M.; Ditonno, P.; et al. Cellular and Molecular Players in the Tumor Microenvironment of Renal Cell Carcinoma. J. Clin. Med. 2023, 12, 3888. [Google Scholar] [CrossRef]
  19. Iacobas, D.A.; Iacobas, S.; Stout, R.F.; Spray, D.C. Cellular Environment Remodels the Genomic Fabrics of Functional Pathways in Astrocytes. Genes 2020, 11, 520. [Google Scholar] [CrossRef]
  20. NIH-National Cancer Institute Genomic Data Commons Data Portal. Available online: https://portal.gdc.cancer.gov/ (accessed on 20 June 2023).
  21. Lasorsa, F.; Rutigliano, M.; Milella, M.; Ferro, M.; Pandolfo, S.D.; Crocetto, F.; Autorino, R.; Battaglia, M.; Ditonno, P.; Lucarelli, G. Cancer Stem Cells in Renal Cell Carcinoma: Origins and Biomarkers. Int. J. Mol. Sci. 2023, 24, 13179. [Google Scholar] [CrossRef]
  22. Sarkar, O.S.; Donninger, H.; Al Rayyan, N.; Chew, L.C.; Stamp, B.; Zhang, X.; Whitt, A.; Li, C.; Hall, M.; Mitchell, R.A.; et al. Monocytic MDSCs exhibit superior immune suppression via adenosine and depletion of adenosine improves efficacy of immunotherapy. Sci. Adv. 2023, 9, eadg3736. [Google Scholar] [CrossRef]
  23. Liu, C.L.; Huang, W.C.; Cheng, S.P.; Chen, M.J.; Lin, C.H.; Chang, S.C.; Chang, Y.C. Characterization of Mammary Tumors Arising from MMTV-PyVT Transgenic Mice. Curr. Issues Mol. Biol. 2023, 45, 4518–4528. [Google Scholar] [CrossRef]
  24. Aggen, D.H.; Ager, C.R.; Obradovic, A.Z.; Chowdhury, N.; Ghasemzadeh, A.; Mao, W.; Chaimowitz, M.G.; Lopez-Bujanda, Z.A.; Spina, C.S.; Hawley, J.E.; et al. Blocking IL1 Beta Promotes Tumor Regression and Remodeling of the Myeloid Compartment in a Renal Cell Carcinoma Model: Multidimensional Analyses. Clin. Cancer Res. 2021, 27, 608–621. [Google Scholar] [CrossRef] [PubMed]
  25. Ding, W.Y.; Kuzmuk, V.; Hunter, S.; Lay, A.; Hayes, B.; Beesley, M.; Rollason, R.; Hurcombe, J.A.; Barrington, F.; Masson, C.; et al. Adeno-associated virus gene therapy prevents progression of kidney disease in genetic models of nephrotic syndrome. Sci. Transl. Med. 2023, 15, eabc8226. [Google Scholar] [CrossRef] [PubMed]
  26. Iacobas, D.A.; Iacobas, S.; Urban-Maldonado, M.; Spray, D.C. Sensitivity of the brain transcriptome to connexin ablation. Biochim. Biophys. Acta (BBA)-Biomembr. 2005, 1711, 183–196. [Google Scholar] [CrossRef] [PubMed]
  27. Iacobas, D.A.; Iacobas, S.; Spray, D.C. Connexin-dependent transcellular transcriptomic networks in mouse brain. Prog. Biophys. Mol. Biol. 2007, 94, 168–184. [Google Scholar] [CrossRef] [PubMed]
  28. Iacobas, D.A.; Iacobas, S.; Urban-Maldonado, M.; Scemes, E.; Spray, D.C. Similar transcriptomic alterations in Cx43 knock-down and knock-out astrocytes. Cell Commun. Adhes. 2008, 15, 195–206. [Google Scholar] [CrossRef] [PubMed]
  29. Iacobas, S.; Iacobas, D.A.; Spray, D.C.; Scemes, E. The connexin43 transcriptome during brain development: Importance of genetic background. Brain Res. 2012, 1487, 131–139. [Google Scholar] [CrossRef]
  30. Li, F.; Aljahdali, I.A.M.; Zhang, R.; Nastiuk, K.L.; Krolewski, J.J.; Ling, X. Kidney cancer biomarkers and targets for therapeutics: Survivin (BIRC5), XIAP, MCL-1, HIF1α, HIF2α, NRF2, MDM2, MDM4, p53, KRAS and AKT in renal cell carcinoma. J. Exp. Clin. Cancer Res. 2021, 40, 254. [Google Scholar] [CrossRef]
  31. Tu, S.-M.; Zhang, M.; Wood, C.G.; Pisters, L.L. Stem Cell Theory of Cancer: Origin of Tumor Heterogeneity and Plasticity. Cancers 2021, 13, 4006. [Google Scholar] [CrossRef]
  32. Li, H.; Zhao, S.; Fan, H.Y.; Li, Y.; Wu, X.P.; Miao, Y.P. The Effect of Histogram Analysis of DCE-MRI Parameters on Differentiating Renal Tumors. Clin. Lab. 2023, 69, 2201–2207. [Google Scholar] [CrossRef]
  33. Brady, L.; Kriner, M.; Coleman, I.; Morrissey, C.; Roudier, M.; True, L.D.; Gulati, R.; Plymate, S.R.; Zhou, Z.; Birditt, B.; et al. Inter and intra-tumor heterogeneity of metastatic prostate cancer determined by digital spatial gene expression profiling. Nat. Commun. 2021, 12, 1426. [Google Scholar] [CrossRef]
  34. Iacobas, S.; Iacobas, D.A. Personalized 3-Gene Panel for Prostate Cancer Target Therapy. Curr. Issues Mol. Biol. 2022, 44, 360–382. [Google Scholar] [CrossRef] [PubMed]
  35. de Vries-Brilland, M.; Rioux-Leclercq, N.; Meylan, M.; Dauvé, J.; Passot, C.; Spirina-Menand, E.; Flippot, R.; Fromont, G.; Gravis, G.; Geoffrois, L.; et al. Comprehensive analyses of immune tumor microenvironment in papillary renal cell carcinoma. J. Immunother. Cancer 2023, 11, e006885. [Google Scholar] [CrossRef] [PubMed]
  36. Gui, Z.; Du, J.; Wu, N.; Shen, N.; Yang, Z.; Yang, H.; Wang, X.; Zhao, N.; Zeng, Z.; Wei, R.; et al. Immune regulation and prognosis indicating ability of a newly constructed multi-genes containing signature in clear cell renal cell carcinoma. BMC Cancer 2023, 23, 649. [Google Scholar] [CrossRef] [PubMed]
  37. Qiagen Ingenuity Pathway Analysis. Available online: https://digitalinsights.qiagen.com/products-overview/discovery-insights-portfolio/analysis-and-visualization/qiagen-ipa/ (accessed on 12 July 2023).
  38. DAVID Functional Annotation Bioinformatics Microarray Analysis. Available online: https://david.ncifcrf.gov (accessed on 12 July 2023).
  39. Kyoto Encyclopedia of Genes and Genomes. Available online: https://www.kegg.jp/kegg/pathway.html (accessed on 12 July 2023).
  40. Iacobas, D.A.; Mgbemena, V.; Iacobas, S.; Menezes, K.M.; Wang, H.; Saganti, P.B. Genomic fabric remodeling in metastatic clear cell renal cell carcinoma (ccRCC): A new paradigm and proposal for a personalized gene therapy approach. Cancers 2020, 12, 3678. [Google Scholar] [CrossRef] [PubMed]
  41. Iacobas, D.A.; Tuli, N.; Iacobas, S.; Rasamny, J.K.; Moscatello, A.; Geliebter, J.; Tiwari, R.M. Gene master regulators of papillary and anaplastic thyroid cancer phenotypes. Oncotarget 2018, 9, 2410–2424. [Google Scholar] [CrossRef] [PubMed]
  42. Iacobas, S.; Iacobas, D.A. A Personalized Genomics Approach of the Prostate Cancer. Cells 2021, 10, 1644. [Google Scholar] [CrossRef] [PubMed]
  43. Remodeling of Major Genomic Fabrics and Their Interplay in Metastatic Clear Cell Renal Carcinoma. Available online: https://www.ncbi.nlm.nih.gov/geo/query/acc.cgi?acc=GSE72304 (accessed on 6 October 2023).
  44. Iacobas, D.A.; Iacobas, S.; Lee, P.R.; Cohen, J.E.; Fields, R.D. Coordinated Activity of Transcriptional Networks Responding to the Pattern of Action Potential Firing in Neurons. Genes 2019, 10, 754. [Google Scholar] [CrossRef] [PubMed]
  45. Ebbing, D.; Gammon, S.D. General Chemistry—Standalone Book; Student, Ed.; Cengage Learning: Boston, MA, USA, 2015; pp. 88–100. [Google Scholar]
  46. Hansen, J.-P.; McDonald, I.R. Chapter 7Time-dependent Correlation and Response Functions. In Theory of Simple Liquids, 4th ed.; Academic Press: London, UK, 2013; pp. 265–310. [Google Scholar]
  47. Eisen, M.; Spellman, P.; Brown, P.; Botstein, D. Cluster analysis and display of genome-wide expression patterns. Proc. Natl. Acad. Sci. USA 1998, 95, 14863–14868. [Google Scholar] [CrossRef]
  48. Butte, A.J.; Tamayo, P.; Slonim, D.; Golub, T.R.; Kohane, I.S. Discovering functional relationships between RNA expression and chemotherapeutic susceptibility using relevance networks. Proc. Natl. Acad. Sci. USA 2000, 97, 12182–12186. [Google Scholar] [CrossRef]
  49. Horvath, S.; Dong, J. Geometric Interpretation of Gene Coexpression Network Analysis. PLoS Comput. Biol. 2008, 4, e1000117. [Google Scholar] [CrossRef]
  50. Oldham, M.C.; Langfelder, P.; Horvath, S. Network methods for describing sample relationships in genomic datasets: Application to Huntington’s disease. BMC Syst. Biol. 2012, 6, 63. [Google Scholar] [CrossRef] [PubMed]
  51. Marbach, D.; Costello, J.C.; Küner, R.; Vega, N.M.; Prill, R.J.; Camacho, D.M.; Allison, K.R.; Aderhold, A.; Bonneau, R.; Chen, Y.; et al. Wisdom of the crowds for robust gene network inference. Nat. Methods 2012, 9, 796–804. [Google Scholar] [CrossRef] [PubMed]
  52. P Value from Pearson (R) Calculator. Available online: https://www.socscistatistics.com/pvalues/pearsondistribution.aspx (accessed on 1 September 2023).
  53. Mathew, R.; Iacobas, S.; Huang, J.; Iacobas, D.A. Metabolic Deregulation in Pulmonary Hypertension. Curr. Issues Mol. Biol. 2023, 45, 4850–4874. [Google Scholar] [CrossRef]
  54. Iacobas, S.; Ede, N.; Iacobas, D.A. The Gene Master Regulators (GMR) Approach Provides Legitimate Targets for Personalized, Time-Sensitive Cancer Gene Therapy. Genes 2019, 10, 560. [Google Scholar] [CrossRef] [PubMed]
  55. Iacobas, D.A. Biomarkers, Master Regulators and Genomic Fabric Remodeling in a Case of Papillary Thyroid Carcinoma. Genes 2020, 11, 1030. [Google Scholar] [CrossRef]
  56. Iacobas, D.A.; Xi, L. Theory and Applications of the (Cardio) Genomic Fabric Approach to Post-Ischemic and Hypoxia-Induced Heart Failure. J. Pers. Med. 2022, 12, 1246. [Google Scholar] [CrossRef]
  57. Aldosterone-Regulated Sodium Reabsorption. Available online: https://www.genome.jp/pathway/hsa04960 (accessed on 1 September 2023).
  58. Collecting Duct Acid Secretion. Available online: https://www.genome.jp/pathway/hsa04966 (accessed on 1 September 2023).
  59. Endocrine and Other Factor-Regulated Calcium Reabsorption. Available online: https://www.genome.jp/pathway/hsa04961 (accessed on 1 September 2023).
  60. Proximal Tubule Bicarbonate Reclamation. Available online: https://www.genome.jp/kegg-bin/show_pathway?hsa04964 (accessed on 9 January 2023).
  61. Vasopressin-Regulated Water Reabsorption. Available online: https://www.genome.jp/kegg-bin/show_pathway?hsa04962 (accessed on 1 September 2023).
  62. Thomas, W.; Harvey, B.J. Estrogen-induced signalling and the renal contribution to salt and water homeostasis. Steroids 2023, 199, 109299. [Google Scholar] [CrossRef]
  63. Xu, W.H.; Xu, Y.; Tian, X.; Anwaier, A.; Liu, W.R.; Wang, J.; Zhu, W.K.; Cao, D.L.; Wang, H.K.; Shi, G.H.; et al. Large-scale transcriptome profiles reveal robust 20-signatures metabolic prediction models and novel role of G6PC in clear cell renal cell carcinoma. J. Cell. Mol. Med. 2020, 24, 9012–9027. [Google Scholar] [CrossRef]
  64. Li, Z.; Xu, H.; Yu, L.; Wang, J.; Meng, Q.; Mei, H.; Cai, Z.; Chen, W.; Huang, W. Patient-derived renal cell carcinoma organoids for personalized cancer therapy. Clin. Transl. Med. 2022, 12, e970. [Google Scholar] [CrossRef]
  65. Gerlinger, M.; Rowan, A.J.; Horswell, S.; Math, M.; Larkin, J.; Endesfelder, D.; Gronroos, E.; Martinez, P.; Matthews, N.; Stewart, A.; et al. Intratumor heterogeneity and branched evolution revealed by multiregion sequencing. N. Engl. J. Med. 2012, 366, 883–892, Erratum in: N. Engl. J. Med. 2012, 367, 976. [Google Scholar] [CrossRef]
  66. Muto, Y.; Dixon, E.E.; Yoshimura, Y.; Wu, H.; Omachi, K.; Ledru, N.; Wilson, P.C.; King, A.J.; Eric Olson, N.; Gunawan, M.G.; et al. Defining cellular complexity in human autosomal dominant polycystic kidney disease by multimodal single cell analysis. Nat. Commun. 2022, 13, 6497. [Google Scholar] [CrossRef]
  67. Jiang, Y.; Wang, Y.; Wang, Z.; Zhang, Y.; Hou, Y.; Wang, X. Anoikis-related genes signature development for clear cell renal cell carcinoma prognosis and tumor microenvironment. Sci. Rep. 2023, 13, 18909. [Google Scholar] [CrossRef]
  68. Chen, W.; Lin, W.; Wu, L.; Xu, A.; Liu, C.; Huang, P. A Novel Prognostic Predictor of Immune Microenvironment and Therapeutic Response in Kidney Renal Clear Cell Carcinoma based on Necroptosis-related Gene Signature. Int. J. Med. Sci. 2022, 19, 377–392. [Google Scholar] [CrossRef]
  69. Clark, D.J.; Dhanasekaran, S.M.; Petralia, F.; Pan, J.; Song, X.; Hu, Y.; da Veiga Leprevost, F.; Reva, B.; Lih, T.M.; Clinical Proteomic Tumor Analysis Consortium; et al. Integrated Proteogenomic Characterization of Clear Cell Renal Cell Carcinoma. Cell 2019, 179, 964–983.e31, Erratum in Cell 2020, 180, 207. [Google Scholar] [CrossRef]
  70. Li, L.; Tan, H.; Zhou, J.; Hu, F. Predicting response of immunotherapy and targeted therapy and prognosis characteristics for renal clear cell carcinoma based on m1A methylation regulators. Sci. Rep. 2023, 13, 12645. [Google Scholar] [CrossRef]
  71. Wang, X.X.; Myakala, K.; Libby, A.E.; Krawczyk, E.; Panov, J.; Jones, B.A.; Bhasin, K.; Shults, N.; Qi, Y.; Krausz, K.W.; et al. Estrogen-Related Receptor Agonism Reverses Mitochondrial Dysfunction and Inflammation in the Aging Kidney. Am. J. Pathol. 2023, 193, 1969–1987. [Google Scholar] [CrossRef]
  72. Adamopoulos, P.G.; Kontos, C.K.; Diamantopoulos, M.A.; Scorilas, A. Molecular cloning of novel transcripts of the adaptor-related protein complex 2 alpha 1 subunit (AP2A1) gene, using Next-Generation Sequencing. Gene 2018, 678, 55–64. [Google Scholar] [CrossRef]
  73. Pleasance, E.; Titmuss, E.; Williamson, L.; Kwan, H.; Culibrk, L.; Zhao, E.Y.; Dixon, K.; Fan, K.; Bowlby, R.; Jones, M.R.; et al. Pan-cancer analysis of advanced patient tumors reveals interactions between therapy and genomic landscapes. Nat. Cancer 2020, 1, 452–468. [Google Scholar] [CrossRef]
  74. Zhang, G.; Xi, M.; Li, Y.; Wang, L.; Gao, L.; Zhang, L.; Yang, Z.; Shi, H. The ADCY9 genetic variants are associated with glioma susceptibility and patient prognosis. Genomics 2021, 113, 706–716. [Google Scholar] [CrossRef] [PubMed]
  75. Tang, Y.; Wang, T.; Zhang, A.; Zhu, J.; Zhou, T.; Zhou, Y.L.; Shi, J. ADCY9 functions as a novel cancer suppressor gene in lung adenocarcinoma. J. Thorac. Dis. 2023, 15, 1018–1035. [Google Scholar] [CrossRef] [PubMed]
  76. Chao, X.; Jia, Y.; Feng, X.; Wang, G.; Wang, X.; Shi, H.; Zhao, F.; Jiang, C. A Case-Control Study of ADCY9 Gene Polymorphisms and the Risk of Hepatocellular Carcinoma in the Chinese Han Population. Front. Oncol. 2020, 10, 1450. [Google Scholar] [CrossRef] [PubMed]
  77. Li, H.; Liu, Y.; Liu, J.; Sun, Y.; Wu, J.; Xiong, Z.; Zhang, Y.; Li, B.; Jin, T. Assessment of ADCY9 polymorphisms and colorectal cancer risk in the Chinese Han population. J. Gene Med. 2021, 23, e3298. [Google Scholar] [CrossRef] [PubMed]
  78. Chen, Q.; Cai, L.; Liang, J. Construction of prognosis model of bladder cancer based on transcriptome. J. Zhejiang Univ. (Med. Sci.) 2022, 51, 79–86. (In English) [Google Scholar] [CrossRef]
  79. Lee, Y.H.; Gyu Song, G. Genome-wide pathway analysis in pancreatic cancer. J. Buon 2015, 20, 1565–1575. [Google Scholar] [PubMed]
  80. Guo, R.; Liu, T.; Shasaltaneh, M.D.; Wang, X.; Imani, S.; Wen, Q. Targeting Adenylate Cyclase Family: New Concept of Targeted Cancer Therapy. Front. Oncol. 2022, 12, 829212. [Google Scholar] [CrossRef] [PubMed]
  81. Wang, H.; Zhang, W.; Ding, Z.; Xu, T.; Zhang, X.; Xu, K. Comprehensive exploration of the expression and prognostic value of AQPs in clear cell renal cell carcinoma. Medicine 2022, 101, e29344. [Google Scholar] [CrossRef] [PubMed]
  82. Oncomine Solutions For Next-Generation Sequencing. Available online: http://www.oncomine.org (accessed on 1 October 2023).
  83. The University of ALabama at Birmingham CANcer Data Analysis Portal. Available online: http://ualcan.path.uab.edu (accessed on 1 October 2023).
  84. Sinha, S.; Dwivedi, N.; Tao, S.; Jamadar, A.; Kakade, V.R.; Neil, M.O.; Weiss, R.H.; Enders, J.; Calvet, J.P.; Thomas, S.M.; et al. Targeting the vasopressin type-2 receptor for renal cell carcinoma therapy. Oncogene 2020, 39, 1231–1245. [Google Scholar] [CrossRef]
  85. Baltzer, S.; Bulatov, T.; Schmied, C.; Krämer, A.; Berger, B.T.; Oder, A.; Walker-Gray, R.; Kuschke, C.; Zühlke, K.; Eichhorst, J.; et al. Aurora Kinase A Is Involved in Controlling the Localization of Aquaporin-2 in Renal Principal Cells. Int. J. Mol. Sci. 2022, 23, 763. [Google Scholar] [CrossRef]
  86. KEGG-Constructed cAMP Signaling Pathway. Available online: https://www.genome.jp/pathway/hsa04024+109 (accessed on 1 October 2023).
  87. Kim, T.H.; Park, J.M.; Kim, M.Y.; Ahn, Y.H. The role of CREB3L4 in the proliferation of prostate cancer cells. Sci. Rep. 2017, 7, 45300. [Google Scholar] [CrossRef]
  88. Giménez-Bachs, J.M.; Salinas-Sánchez, A.S.; Serrano-Oviedo, L.; Nam-Cha, S.H.; Rubio-Del Campo, A.; Sánchez-Prieto, R. Carbonic anhydrase IX as a specific biomarker for clear cell renal cell carcinoma: Comparative study of Western blot and immunohistochemistry and implications for diagnosis. Scand. J. Urol. Nephrol. 2012, 46, 358–364. [Google Scholar] [CrossRef]
  89. Tostain, J.; Li, G.; Gentil-Perret, A.; Gigante, M. Carbonic anhydrase 9 in clear cell renal cell carcinoma: A marker for diagnosis, prognosis and treatment. Eur. J. Cancer 2010, 46, 3141–3148. [Google Scholar] [CrossRef]
  90. Ferro, M.; Falagario, U.G.; Barone, B.; Maggi, M.; Crocetto, F.; Busetto, G.M.; Giudice, F.D.; Terracciano, D.; Lucarelli, G.; Lasorsa, F.; et al. Artificial Intelligence in the Advanced Diagnosis of Bladder Cancer-Comprehensive Literature Review and Future Advancement. Diagnostics 2023, 13, 2308. [Google Scholar] [CrossRef]
  91. Ferro, M.; Crocetto, F.; Barone, B.; Del Giudice, F.; Maggi, M.; Lucarelli, G.; Busetto, G.M.; Autorino, R.; Marchioni, M.; Cantiello, F.; et al. Artificial intelligence and radiomics in evaluation of kidney lesions: A comprehensive literature review. Ther. Adv. Urol. 2023, 15, 17562872231164803. [Google Scholar] [CrossRef]
Figure 1. Independence of: (a) AVE, (b) REV, and (c) COR with ESR1 characteristics for 37 genes involved in the KEGG-constructed pathway of the “Endocrine and other factor-regulated calcium absorption”. The CORESR1,ESR1 = 1 values in all conditions validate the coordination analysis. Observe the differences in all three gene characteristics between the two equally graded and located close to each other nodules of PTA and PTB.
Cimb 45 00594 g001
Figure 2. Gene Commanding Height (GCH) scores of the genes involved in the five KEGG-constructed excretory pathways: (a) Aldosterone-regulated sodium reabsorption, (b) Collecting duct acid secretion, (c) Proximal tubule bicarbonate reclamation, (d) Endocrine and other factor-regulated calcium reabsorption, and (e) Vasopressin-regulated water reabsorption.
Cimb 45 00594 g002
Figure 3. Six measures of individual gene regulation in the KEGG-constructed pathway of ENDO (Endocrine and other factor-regulated calcium reabsorption). (a) Uniform (+1/−1 for significant up-/down regulation). (b) Expression ratio × (negative for down-regulation). (c) Weighted individual (gene) regulation (WIR, negative for down-regulation). (d) Regulation of transcript abundance control mechanisms (negative for decreased control). (e) Regulation of expression coordination (with respect to every other gene of the pathway, negative for reduced correlation); (f) Transcriptomic distance of individual (gene) (here with respect to all its partners within the pathway). Observe that all but the uniform measure takes into account the contributions of every single gene.
Cimb 45 00594 g003
Figure 4. Excretory genes identified by our absolute fold-change criterion (|x(cancer→NOR)| > CUT(cancer→NOR)) as false positive hits (red accent 2 lighter 60% background) and false negative hits (light blue background) in the traditional analysis of gene expression. PTA/PTB/CWM = expression ratio (negative for down-regulation) in the indicated cancer nodule with respect to the normal tissue (NOR). CUT = absolute fold-change cut-off to consider a gene as significantly regulated.
Cimb 45 00594 g004
Figure 5. The regulated genes from the KEGG-constructed pathway of hsa04962 “Vasopressin-regulated water reabsorption” in the three cancer nodules with respect to the surrounding normal (NOR) tissue in the right kidney: (a) PTA, (b) PTB, and (c) CWM. Red/green background of the gene symbol indicates significant up-/down-regulation, yellow background indicates not statistically significant regulation, while blank background indicates that that gene was not quantified. Significantly regulated genes: ADCY6 (adenylate cyclase 6), AQP3, CREB3 (cAMP responsive element binding protein 3), CREB3L2/3/4 (cAMP responsive element binding protein 3-like 2/3/4), DCTN1/2 (dynactin 1/2), DYNC2LI1 (dynein, cytoplasmic 2, light intermediate chain 1), GNAS (GNAS complex locus), and VAMP2 (vesicle-associated membrane protein 2 (synaptobrevin 2)). Note the differences among the three nodules including that AQP3 is down-regulated in PTA and CWM, but up-regulated in PTB.
Cimb 45 00594 g005aCimb 45 00594 g005bCimb 45 00594 g005c
Figure 6. (p < 0.05) significant synergism, antagonism, and independence among the genes responsible for the Endocrine and other factor-regulated calcium reabsorption. (a) Significant gene expression correlations in NOR and PTA. (b) Significant gene expression correlations in PTB and CWM. A red/blue/yellow square indicates significant synergism/antagonism/independence of the genes labeling the intersecting row and column, while a blank square means a lack of statistical significance of the expression correlation.
Cimb 45 00594 g006aCimb 45 00594 g006b
Figure 7. Statistically significant synergism, antagonism, and independence of excretory genes with arginine vasopressin (AVP) in all four profiled regions. (a) Significant expression correlation partners of AVP in NOR. (b) Significant expression correlation partners of AVP in CWM. (c) Significant expression correlation partners of AVP in PTA. (d) Significant expression correlation partners of AVP in PTB. A continuous red/blue line indicates synergism/antagonism, while a dashed black line indicates significant independence. Letters A, C, E, P, and V indicate the pathway affiliations of the genes: A = Aldosterone-regulated sodium reabsorption, C = Collecting duct acid secretion, E = Endocrine and other factor-regulated calcium reabsorption, P = Proximal tubule bicarbonate reclamation, and V = Vasopressin-regulated water reabsorption. Note: only the genes with significant correlations in at least one region were included in the figure.
Cimb 45 00594 g007
Table 1. Numbers of mutated genes in 14 primary sites (data from [20]). Note that the number of mutated genes in the listed individual sites represents from 86.94% (prostate cancer) to 95.07% (bone marrow cancer) of the 22,588 mutated genes reported in all 88,991 cancer cases located in all 68 primary sites.
Primary Site# of Cases# of GenesProtein Coding# of MutationsPrimary Site# of Cases# of GenesProtein Coding# of Mutations
Bladder172520,18319,692114,662Lung12,26221,31819,790443,974
Bone marrow11,02721,47419,705163,756Ovary338120,26619,67364,142
Brain145220,34319,72993,128Pancreas277619,87419,50236,676
Breast912120,45419,727113,777Prostate238719,63819,40227,468
Colorectal814021,06019,794337,634Skin289320,73919,770353,213
Head & neck279220,53519,712116,274Stomach163120,33619,739182,493
Kidney350120,12919,63165,471Uterus280321,47119,781769,622
Table 2. Number of quantified out of number of included genes in the five KEGG-constructed functional pathways of the excretory system, their percentages, and overall weighted regulations in each cancer nodule. ALDO = Aldosterone-regulated sodium reabsorption, COLL = Collecting duct acid secretion, ENDO = Endocrine and other factor-regulated calcium reabsorption, PROX = Proximal tubule bicarbonate reclamation, and VASO = Vasopressin-regulated water reabsorption.
PTAPTBCWM
PathGenes%Up%DownWPR%Up%DownWPR%Up%DownWPR
ALDO26/3711.5411.541.1230.770.008.1911.5411.542.32
COLL16/276.2512.505.2012.500.0016.3612.500.009.69
ENDO37/535.412.700.8818.925.417.688.115.412.15
PROX18/2316.670.000.9638.890.009.0411.110.002.12
VASO36/448.3311.110.6911.115.560.932.788.330.77
Disclaimer/Publisher’s Note: The statements, opinions and data contained in all publications are solely those of the individual author(s) and contributor(s) and not of MDPI and/or the editor(s). MDPI and/or the editor(s) disclaim responsibility for any injury to people or property resulting from any ideas, methods, instructions or products referred to in the content.

