
Complete Mitochondrial Genomes of Metcalfa pruinosa and Salurnis marginella (Hemiptera: Flatidae): Genomic Comparison and Phylogenetic Inference in Fulgoroidea


Abstract
1. Introduction
2. Materials and Methods
2.1. Next-Generation Sequencing for M. pruinosa
2.2. Assembly and Gap Filling
2.3. S. marginella Sequencing by the Sanger Method
2.4. Gene Annotation
2.5. Comparative Genome Analyses
2.6. Phylogenetic Analysis
3. Results and Discussion
3.1. General Mitochondrial Genome Features
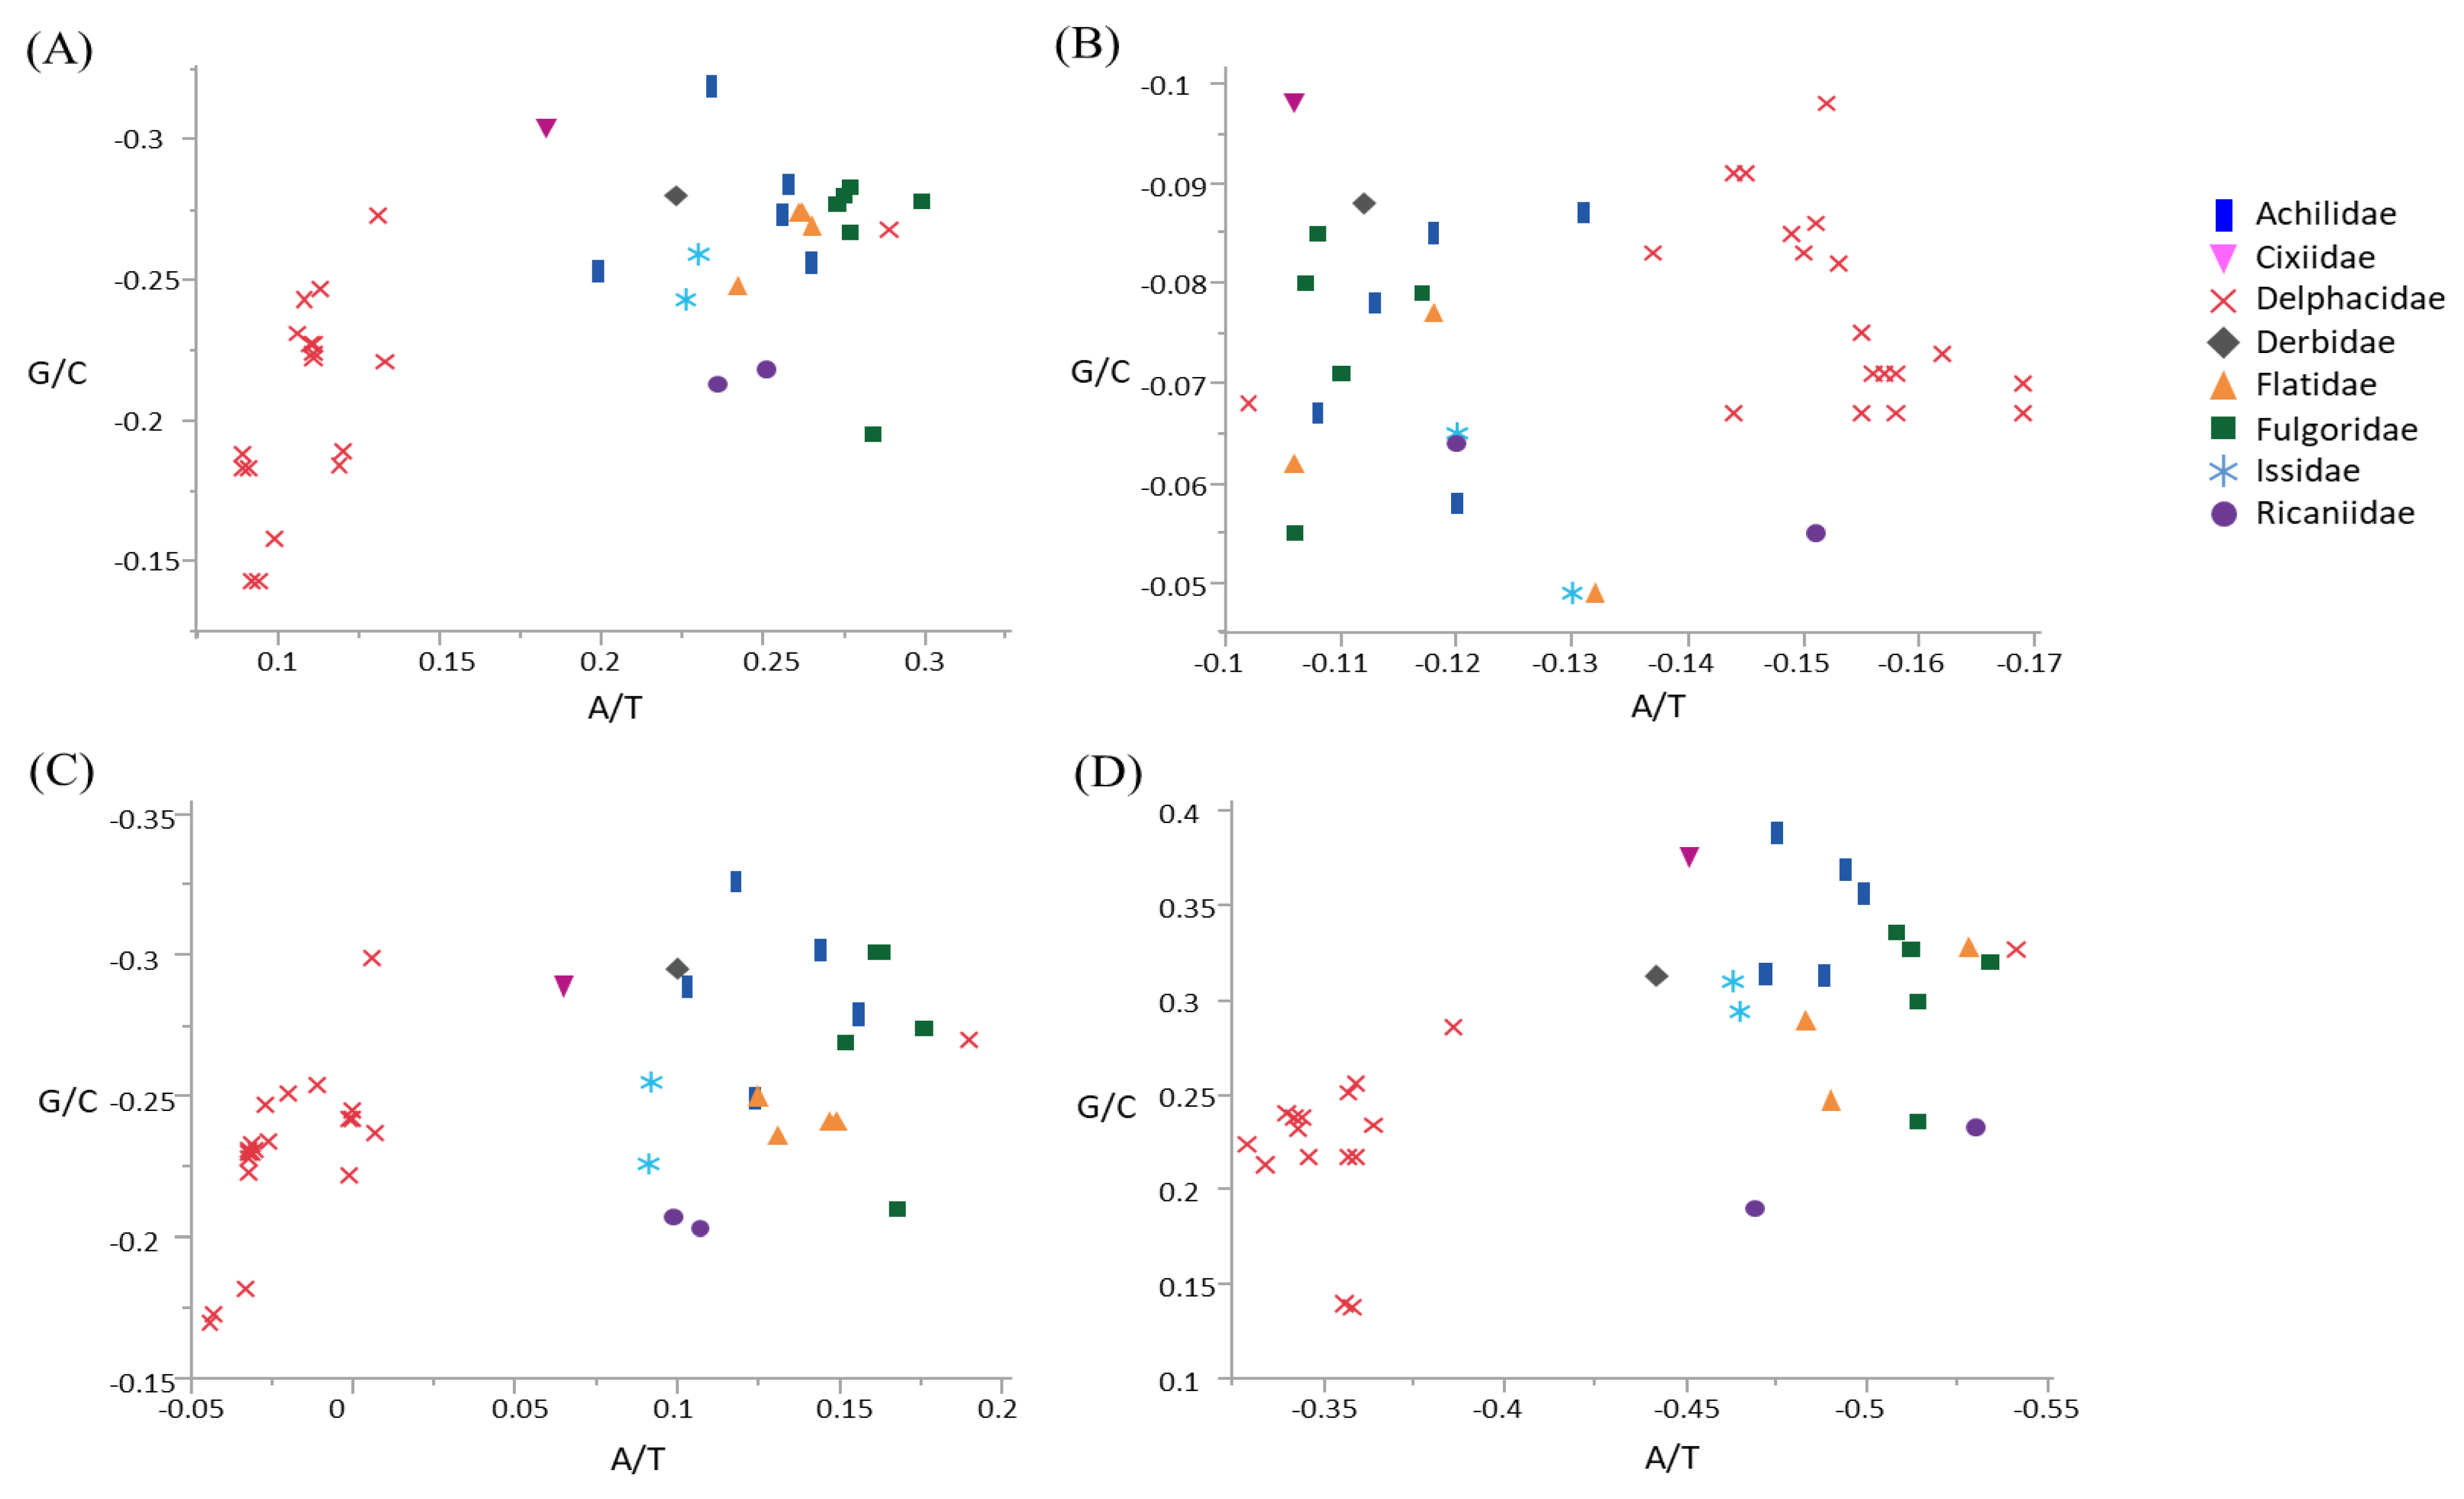
3.2. Compositional Skew
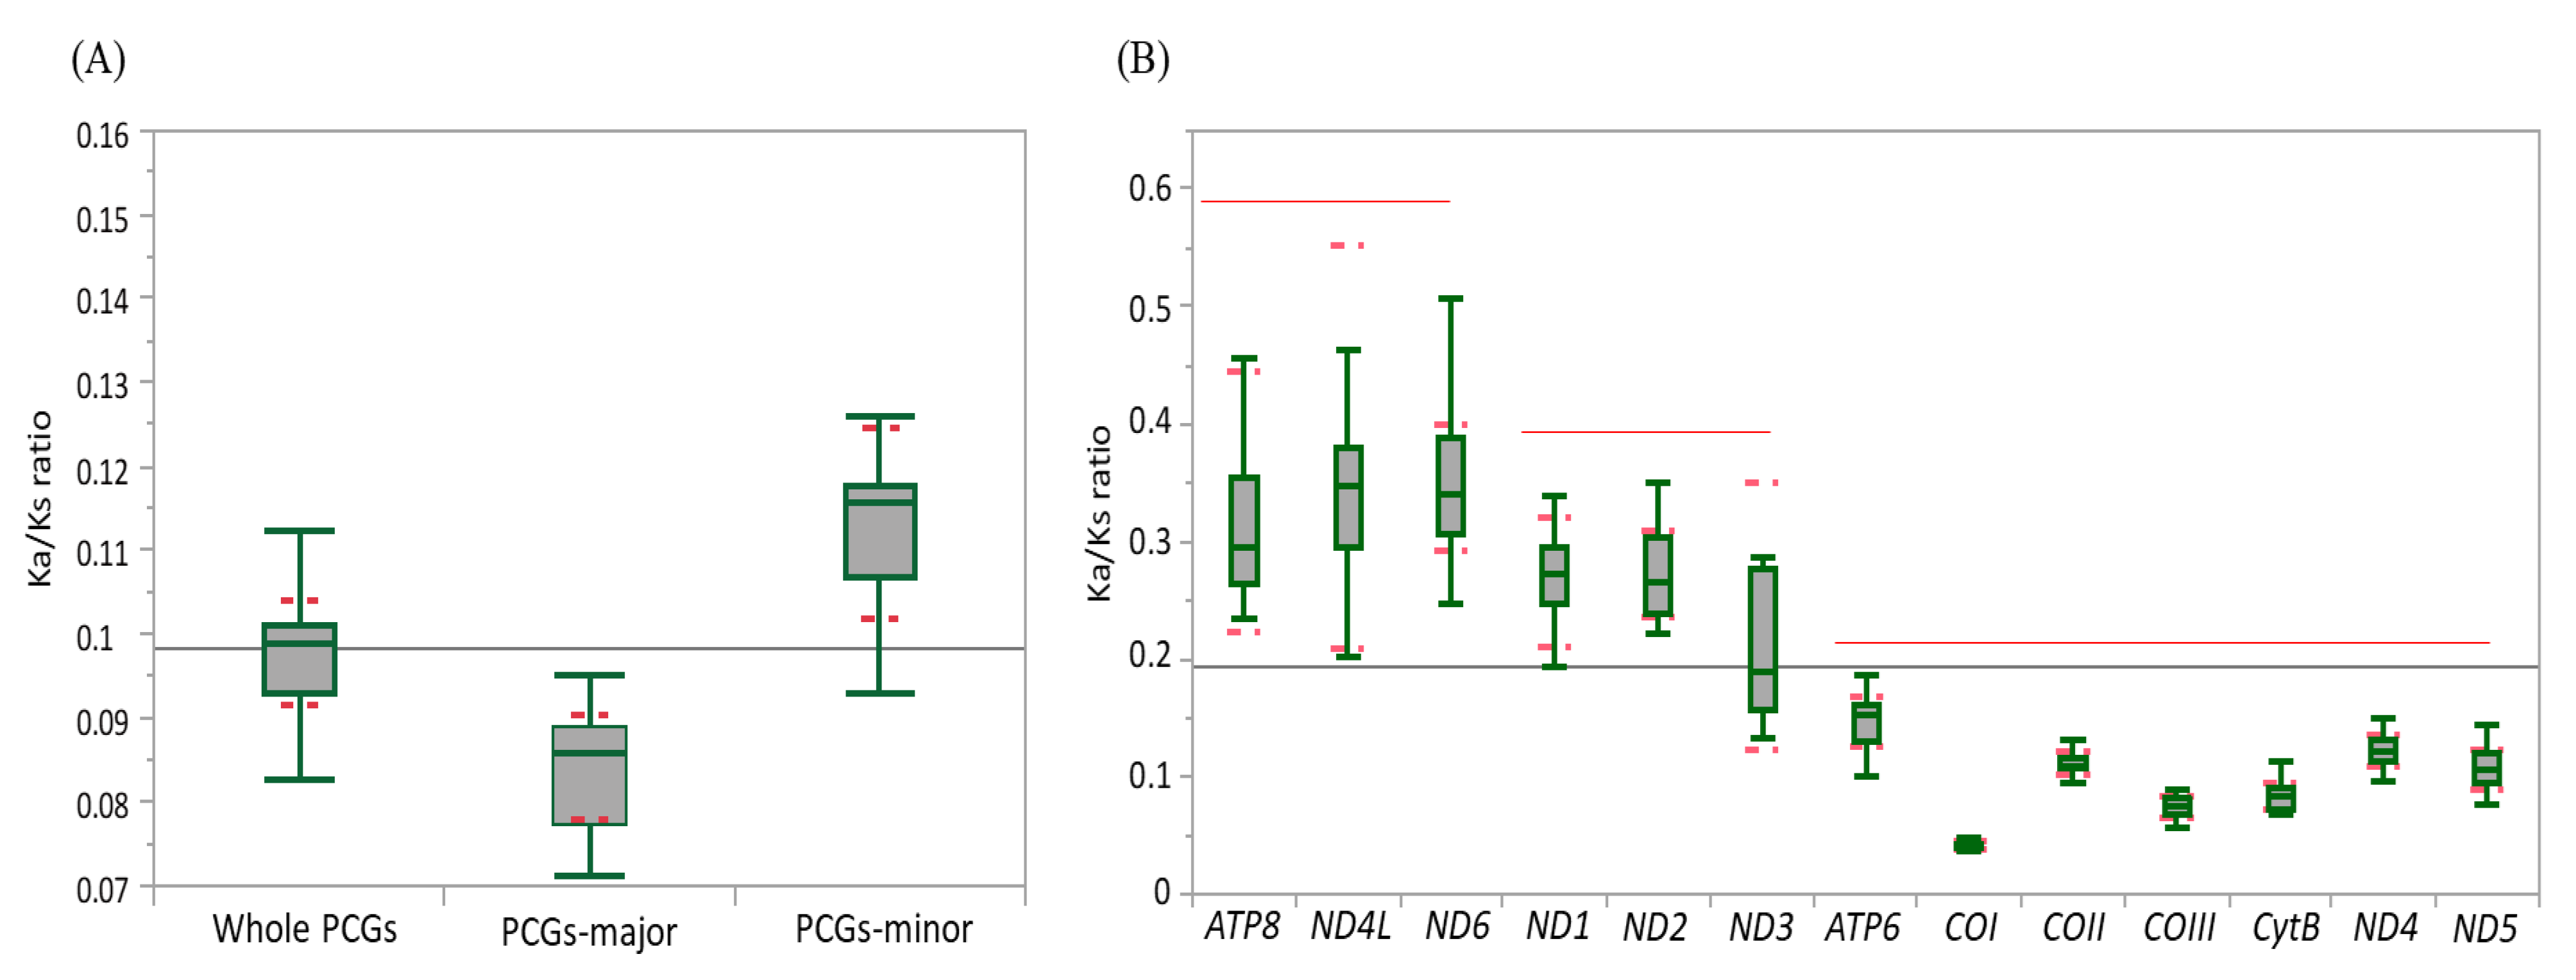
3.3. Genetic Divergence Inferred from the Ka/Ks Ratio
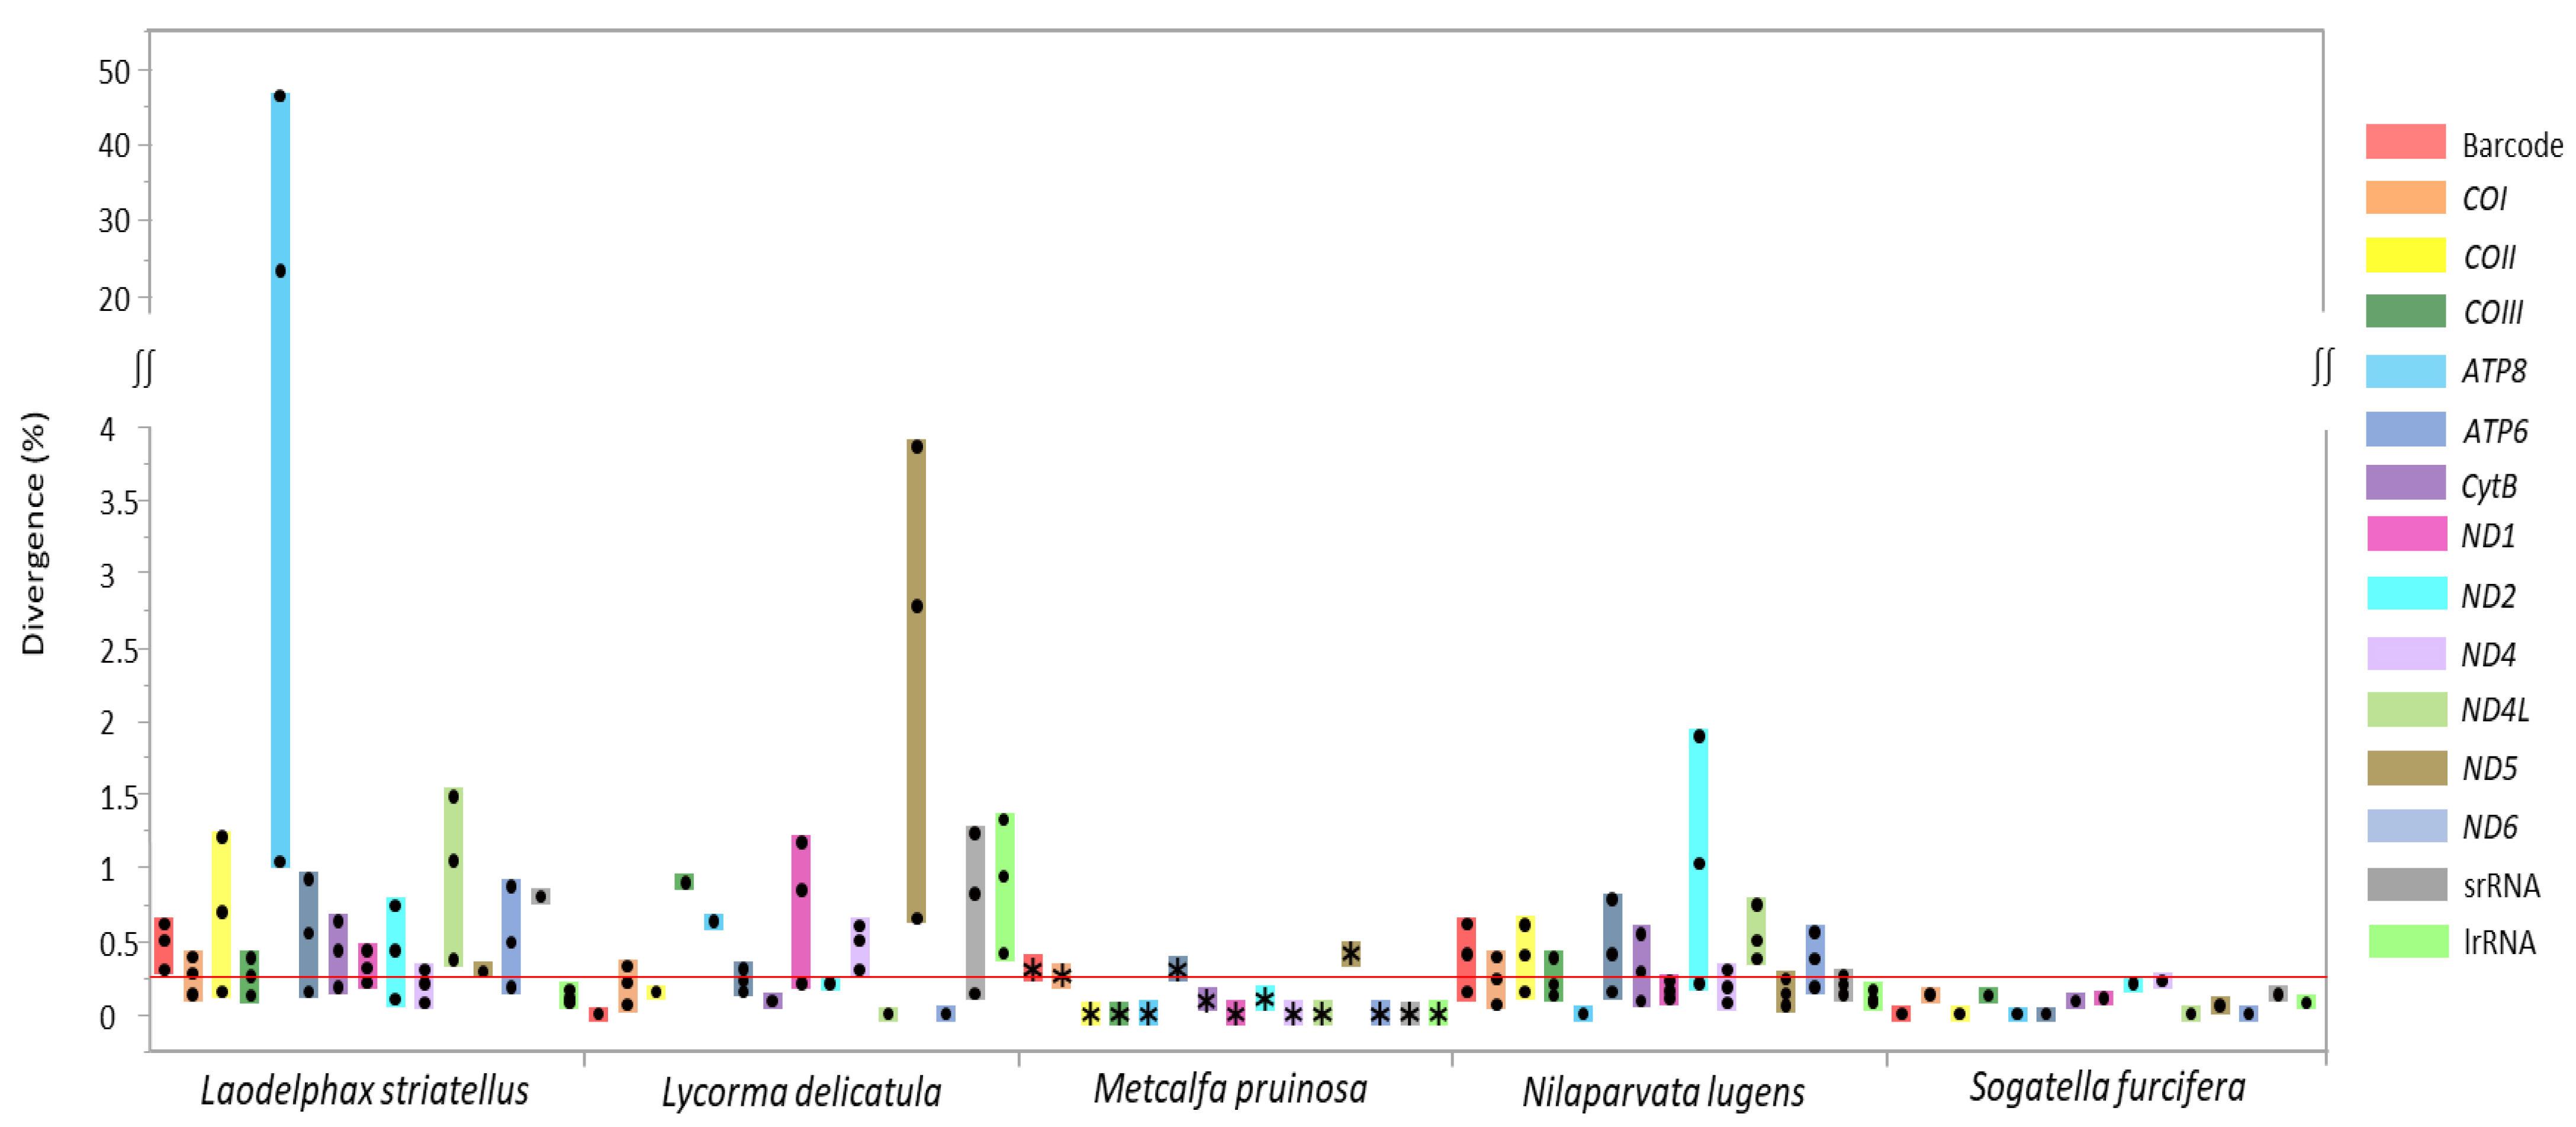
3.4. Individual Gene Divergence within Species
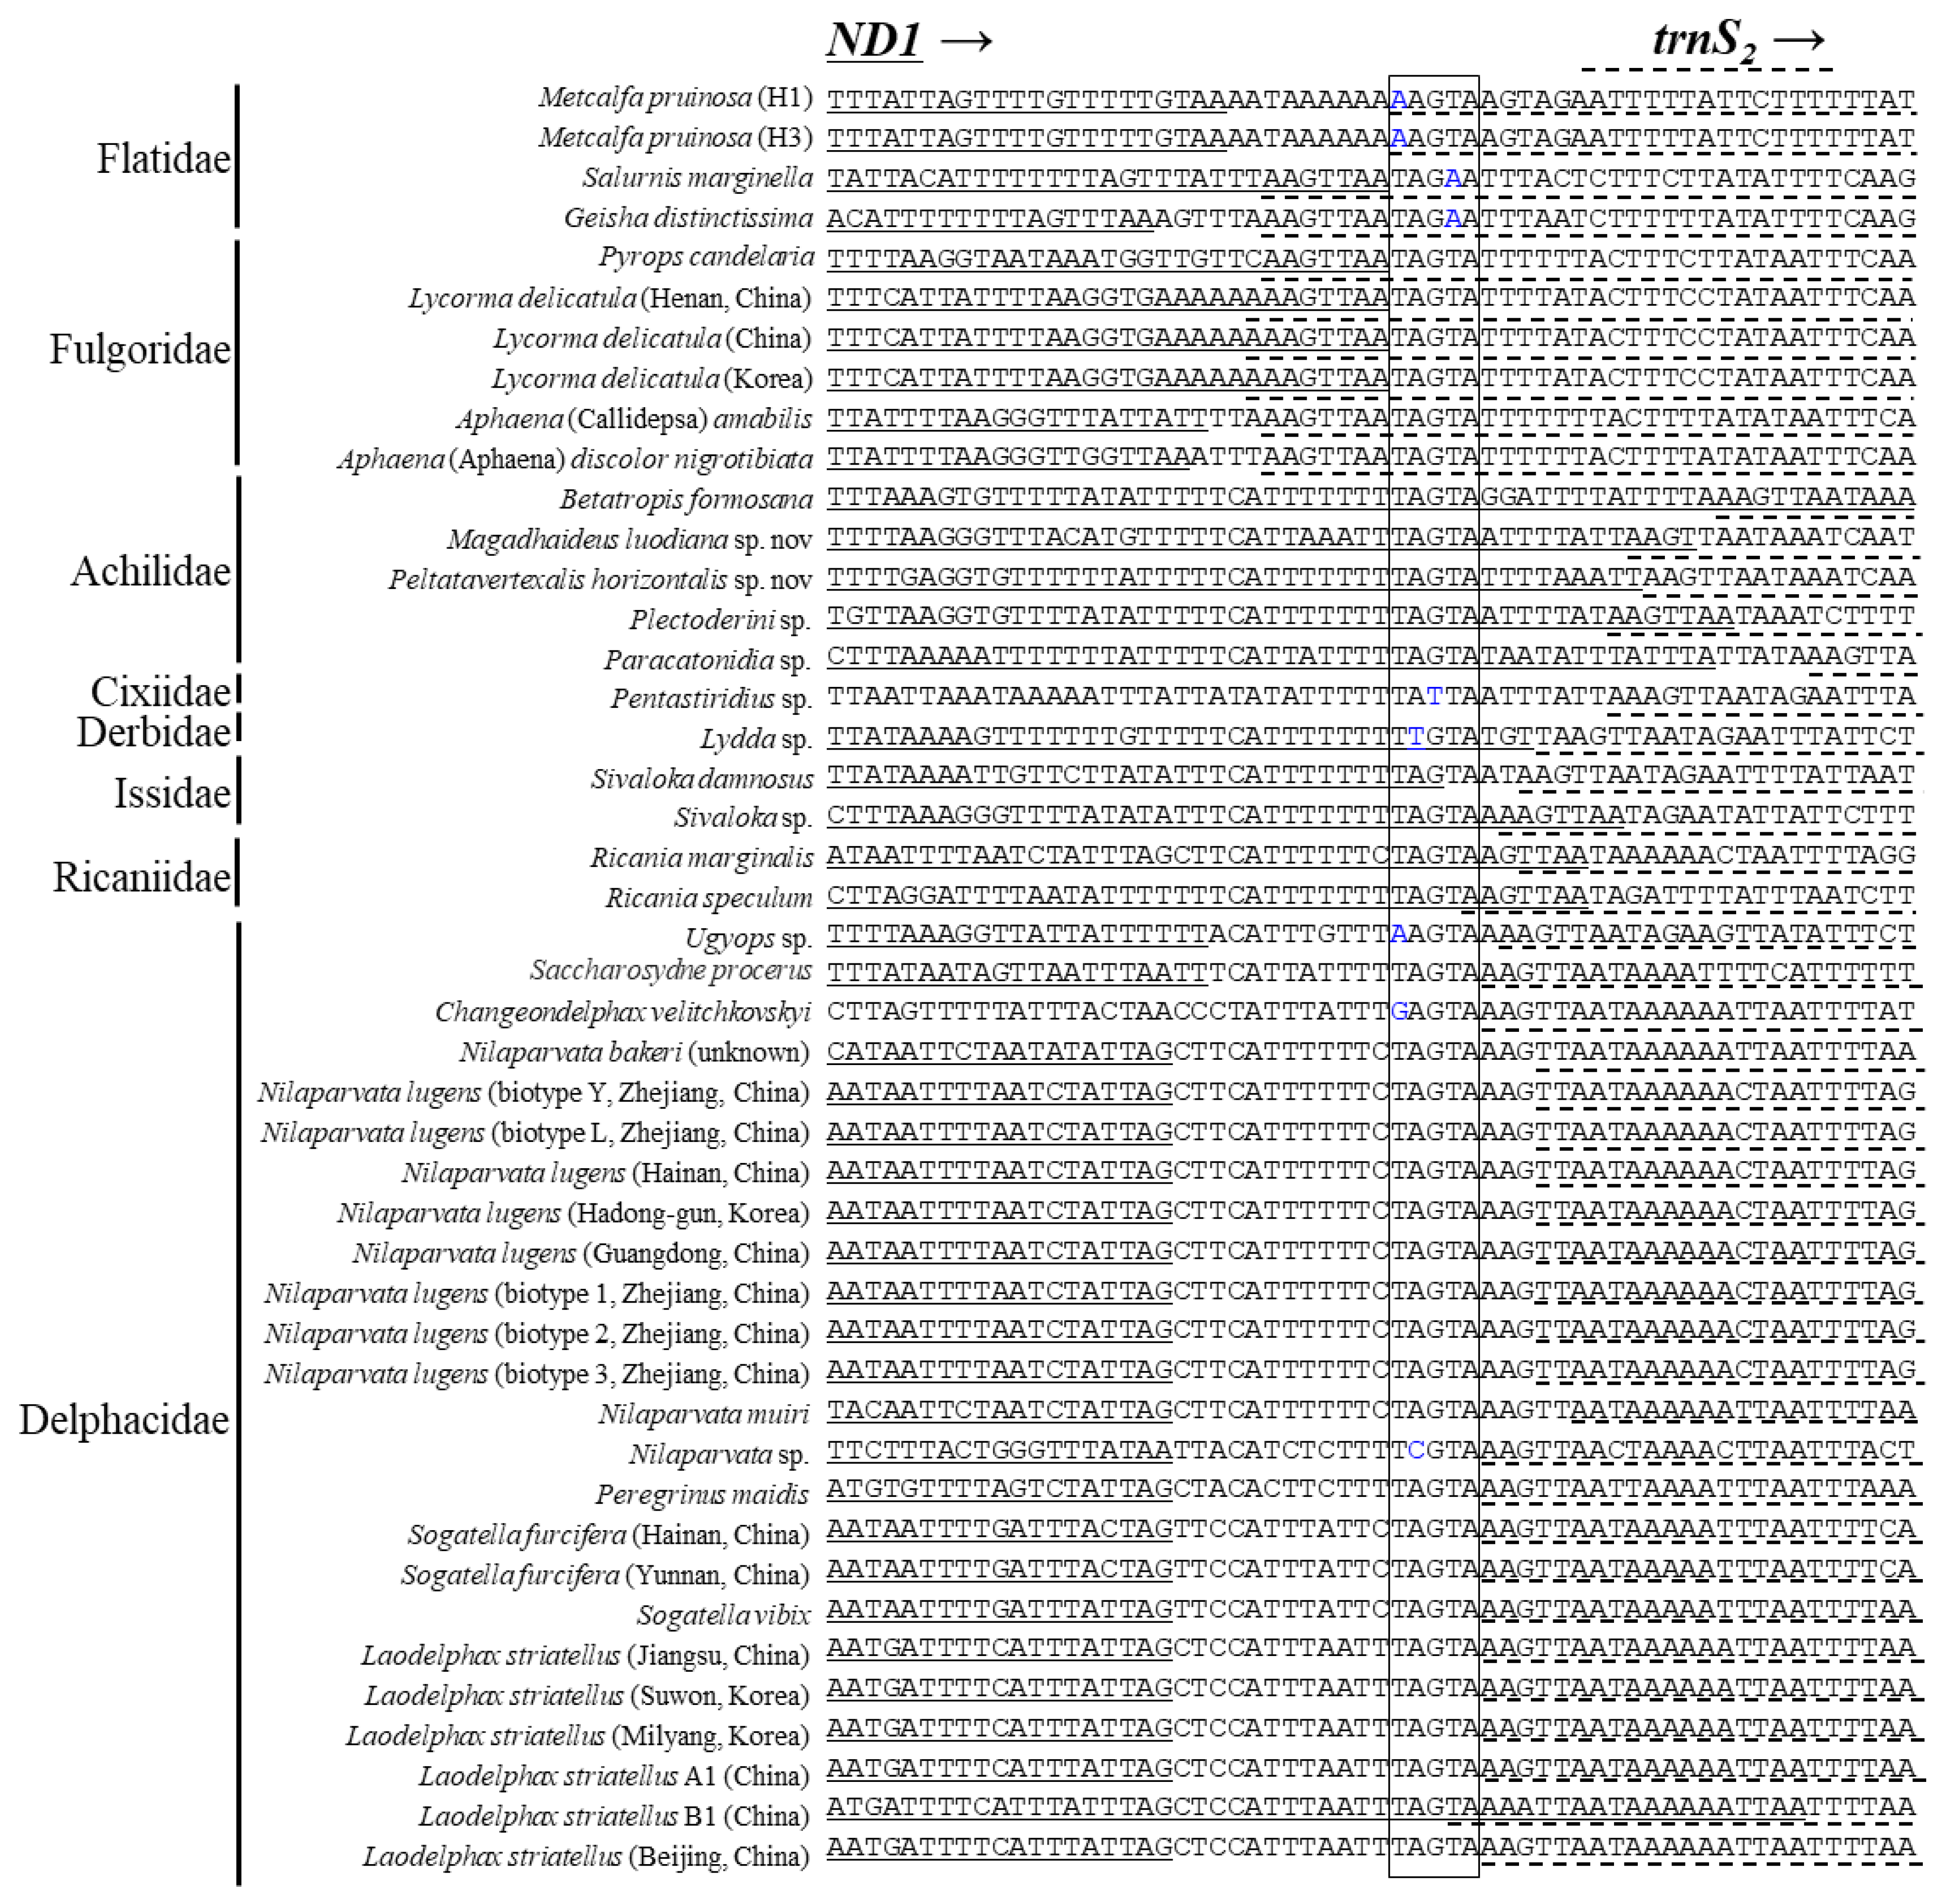
3.5. Intergenic Spacer Regions and Potential Motif Sequences
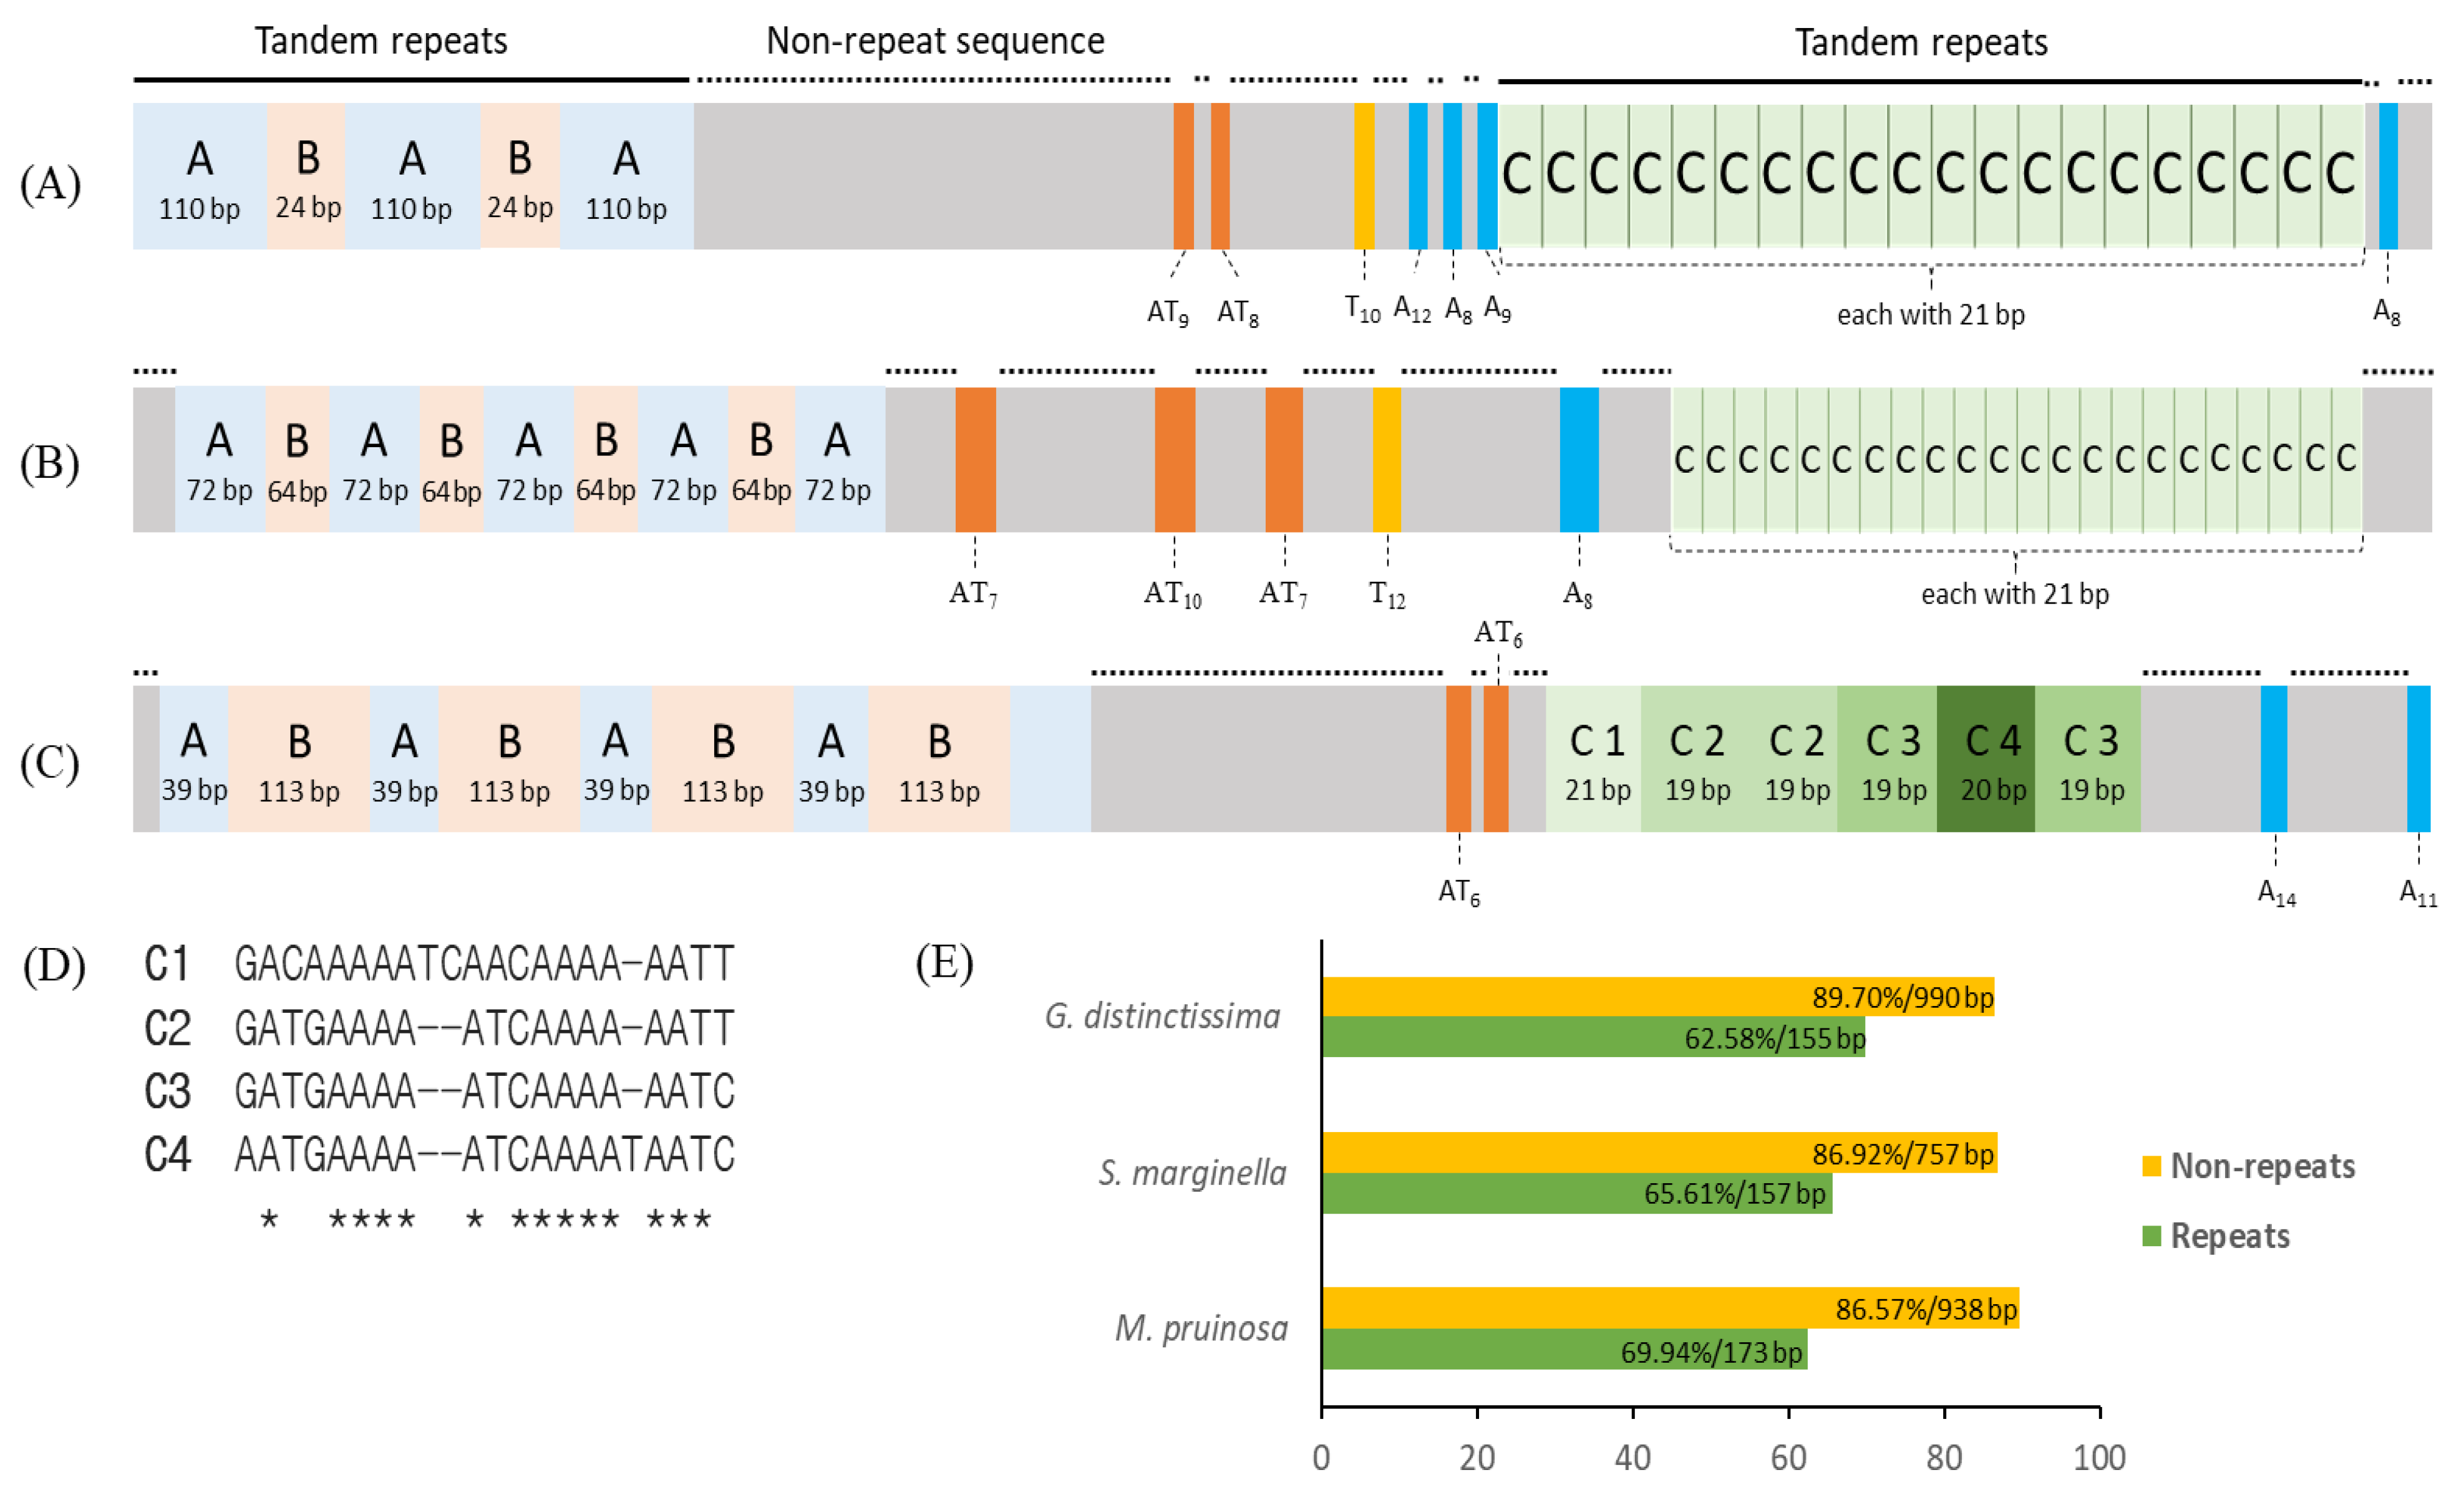
3.6. A+T-rich Region Structure
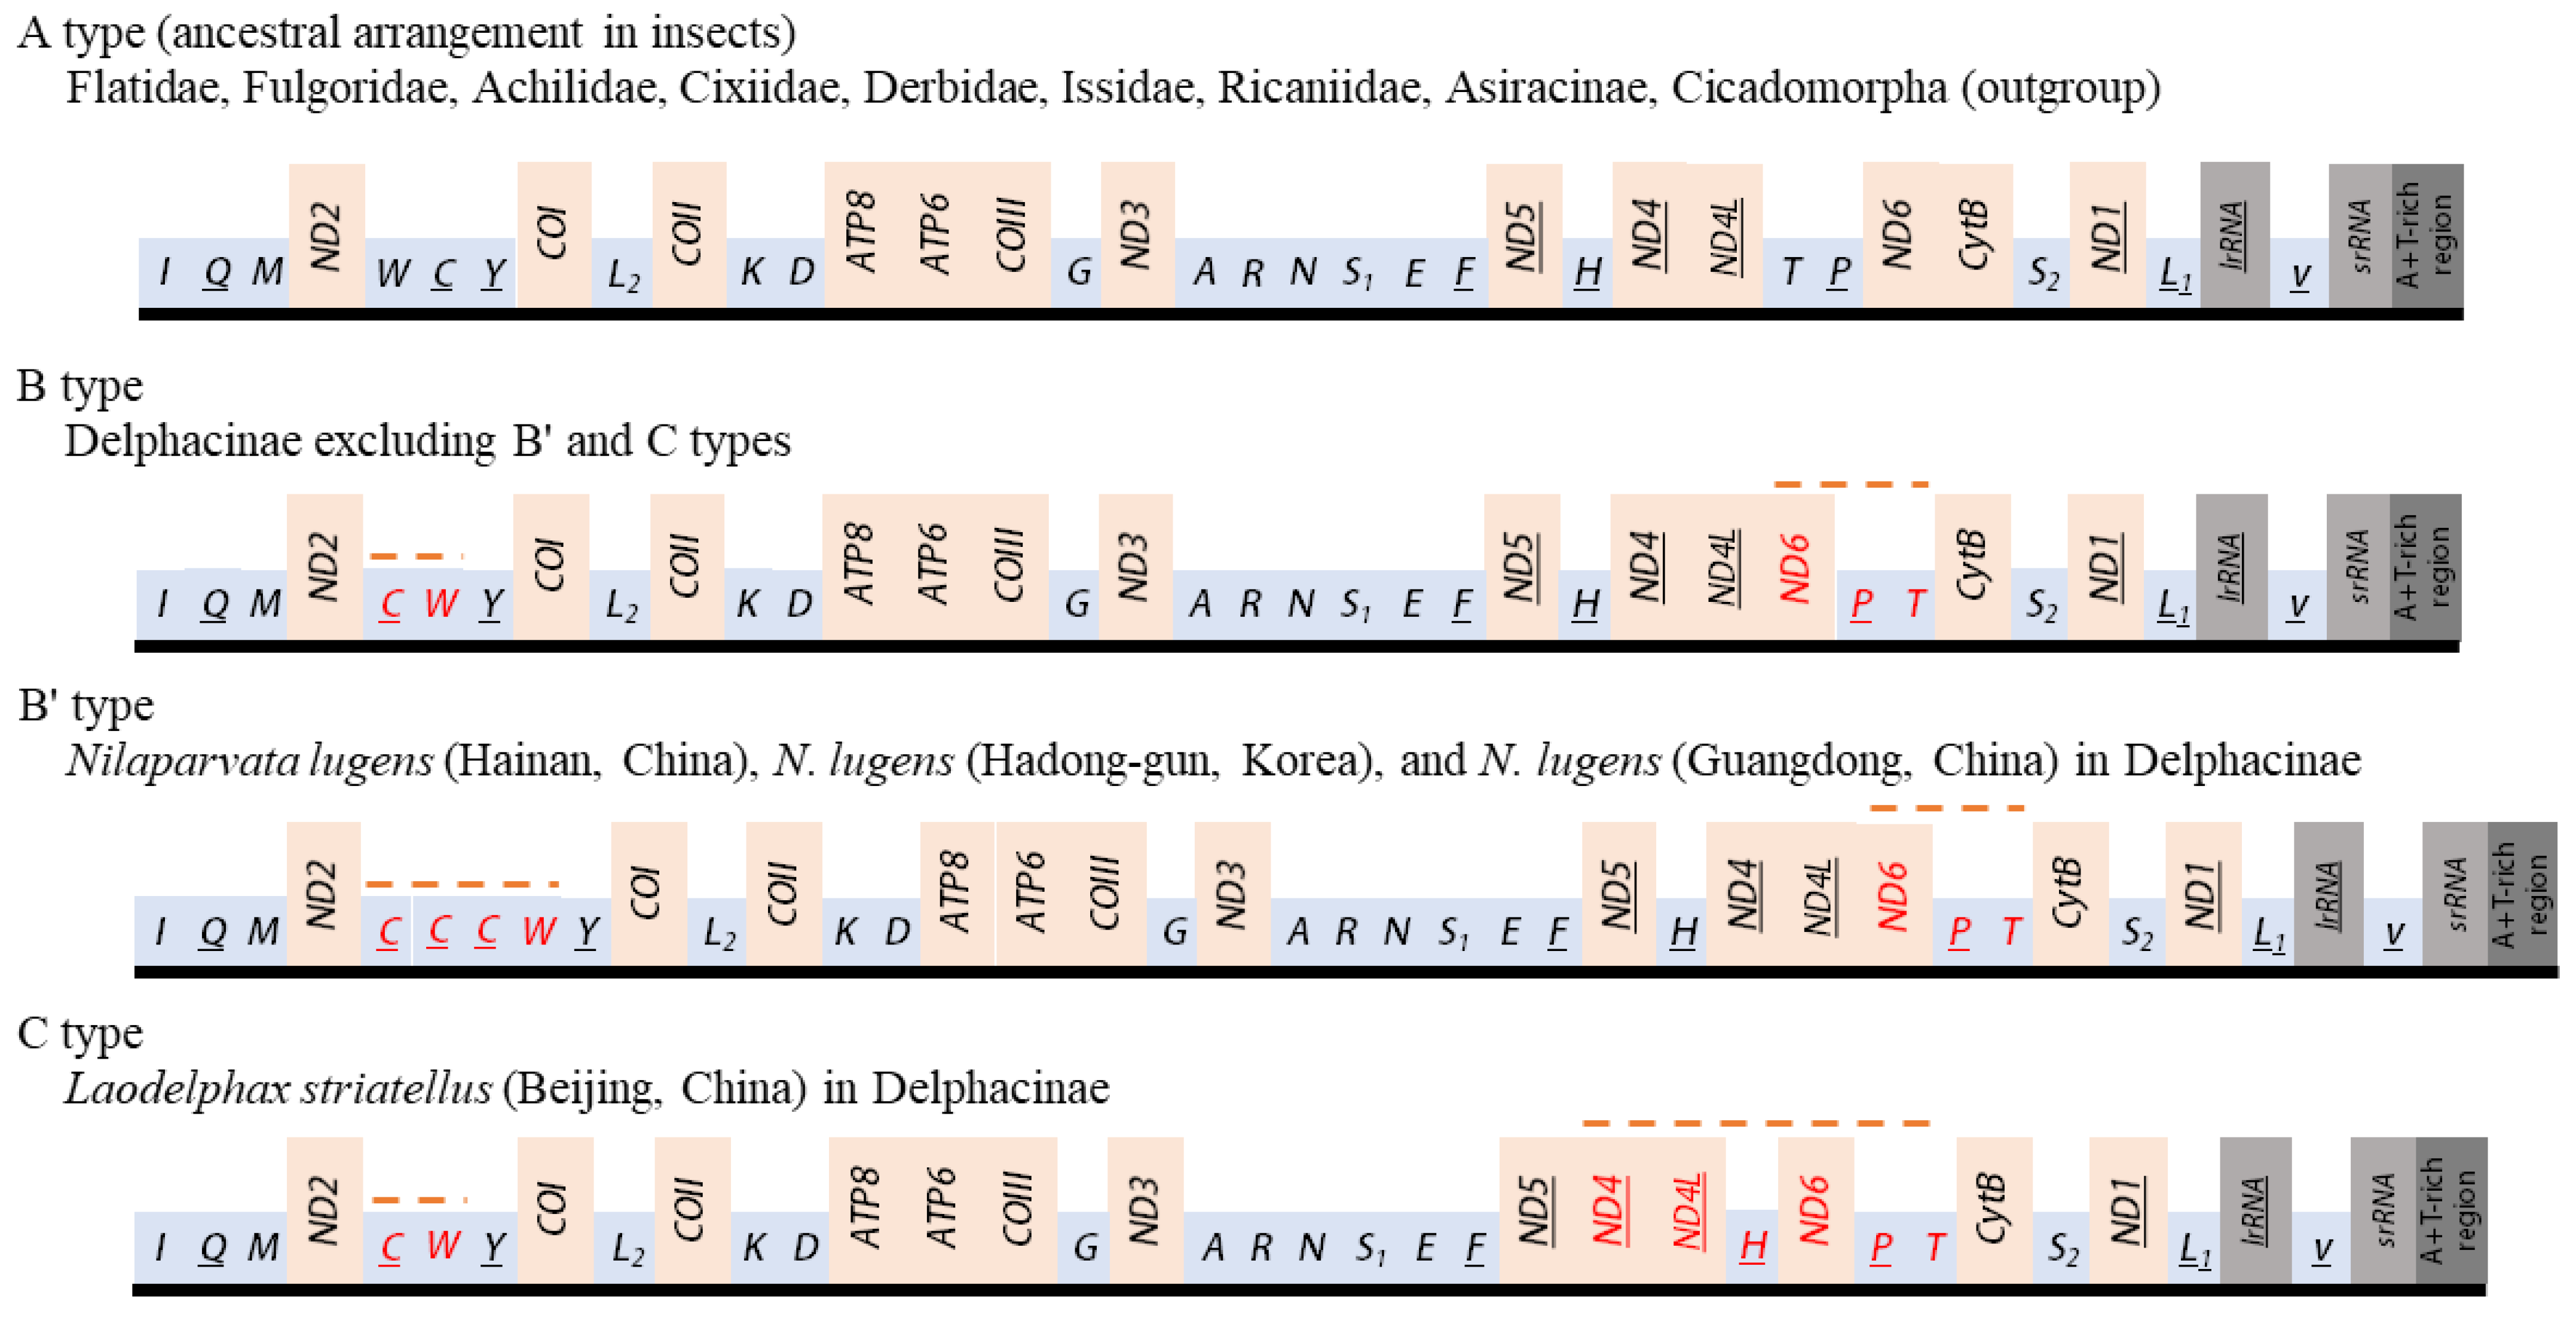
3.7. Gene Arrangements
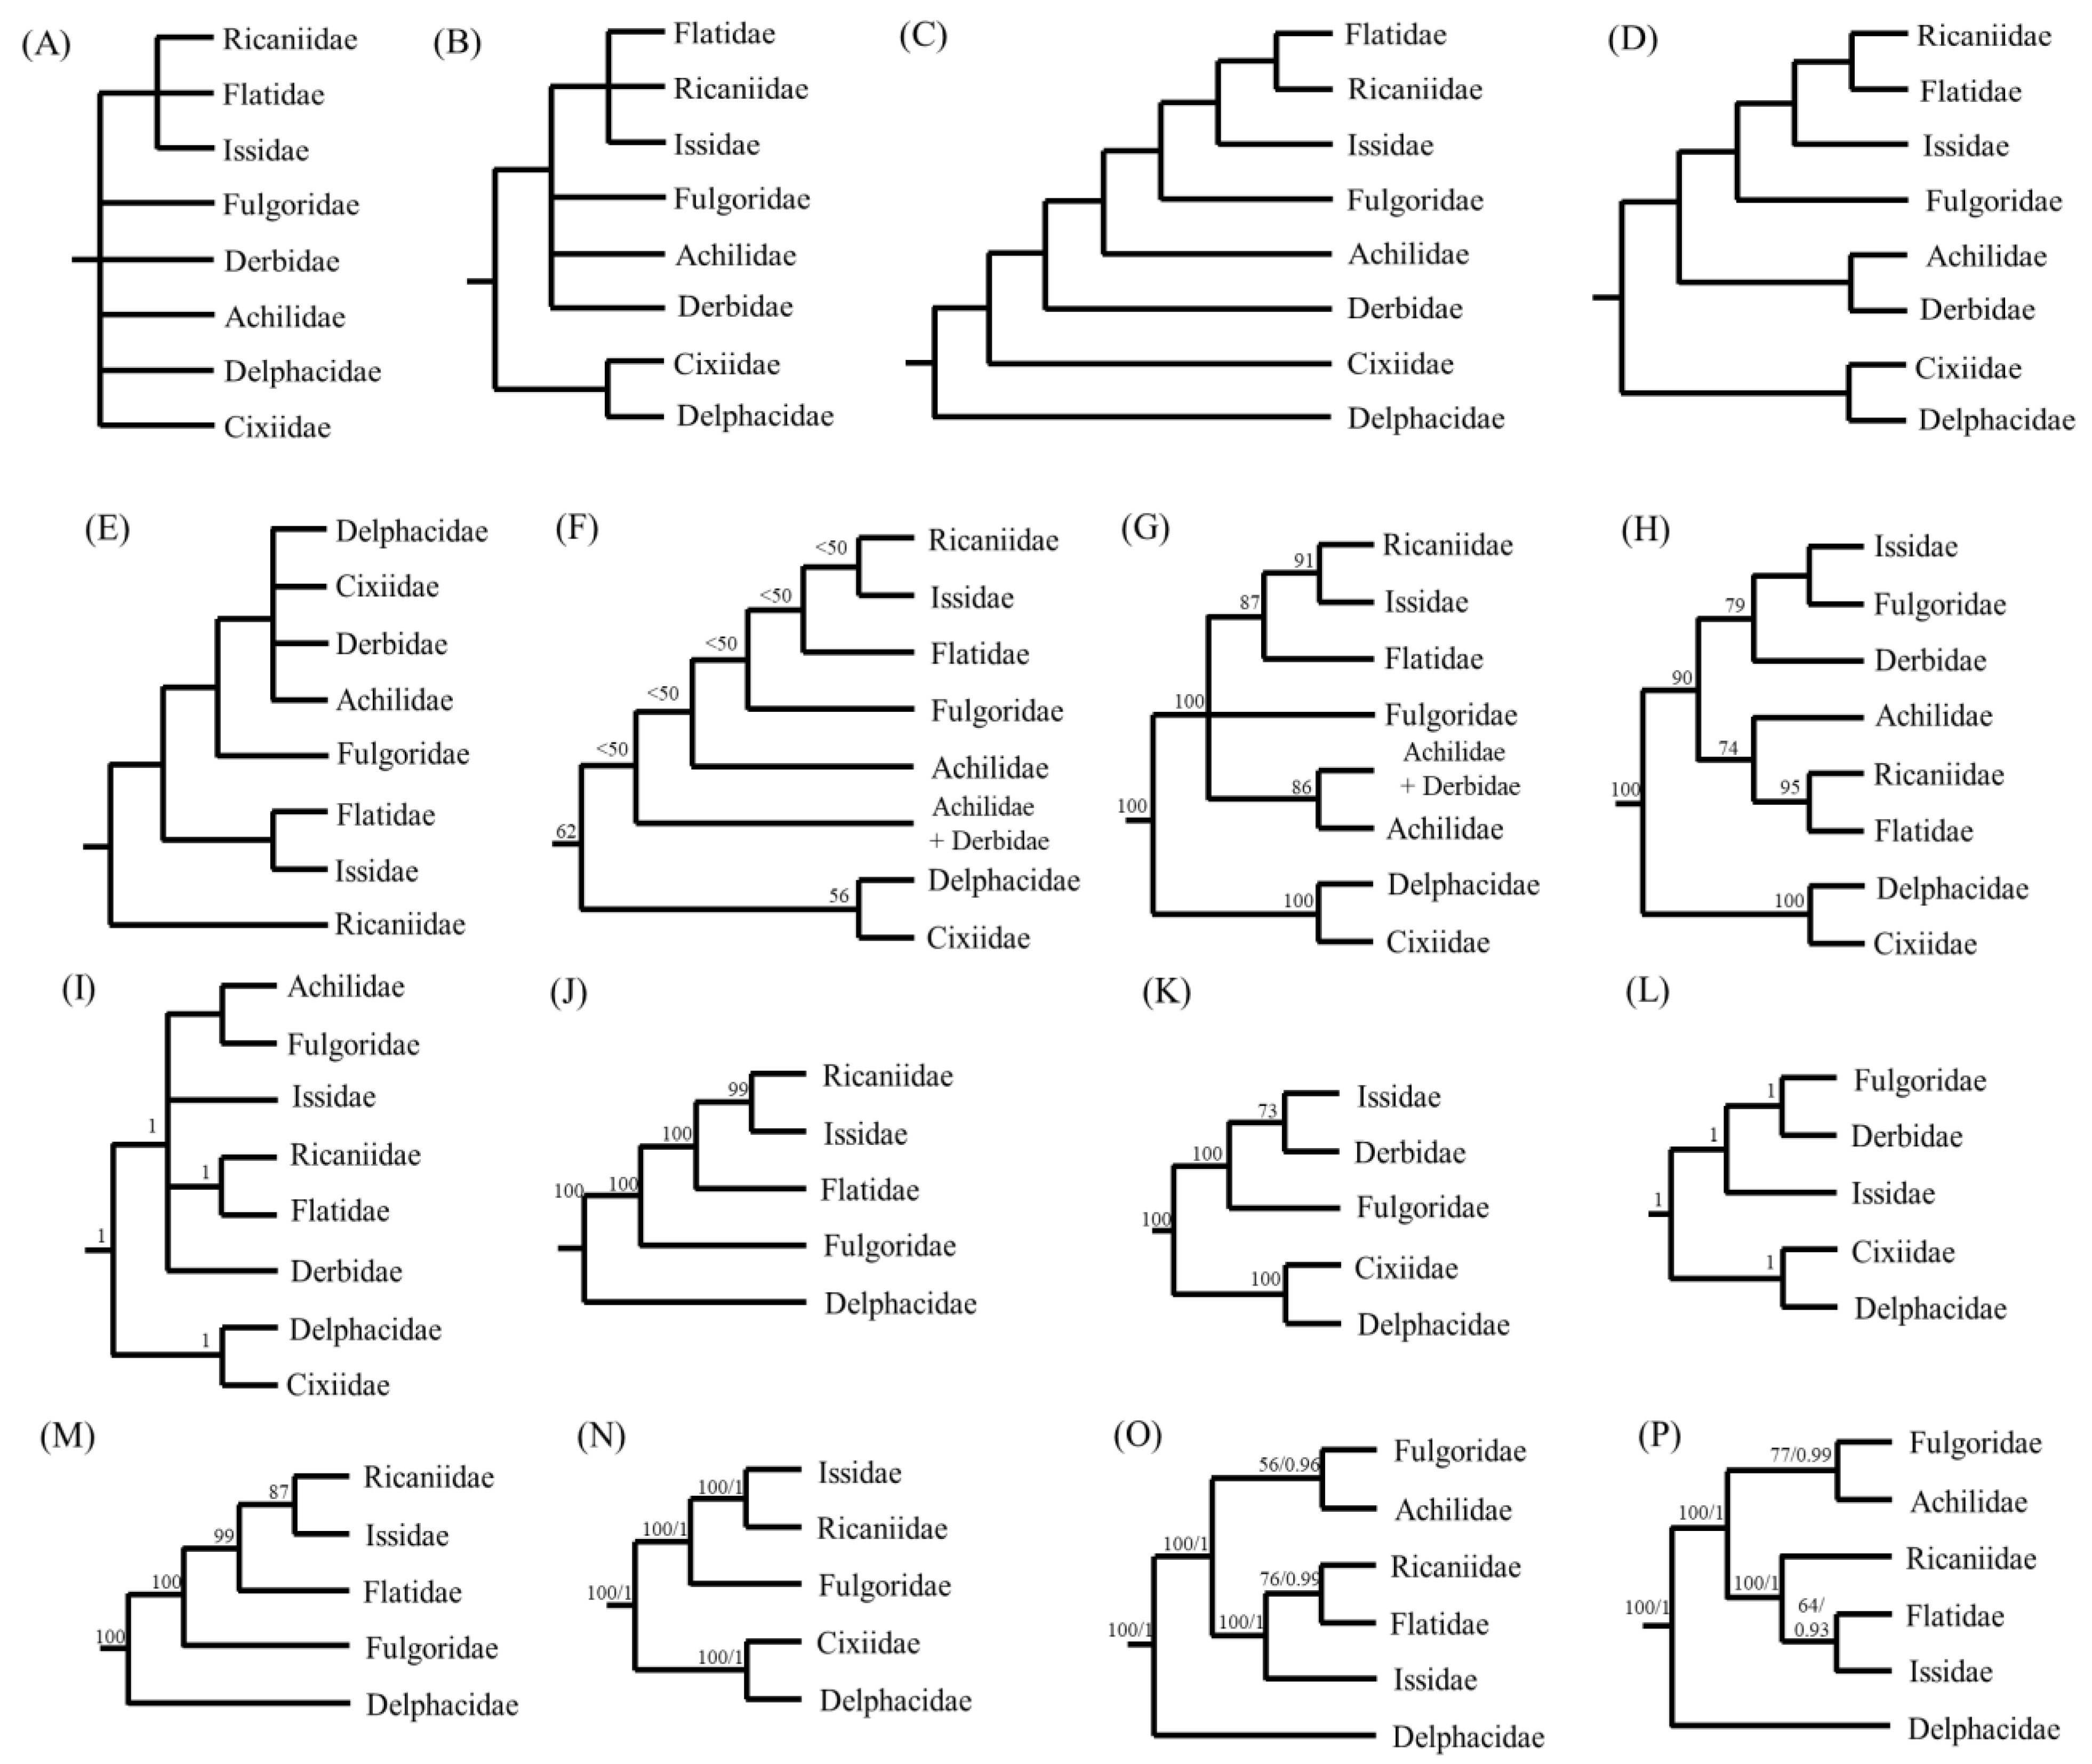
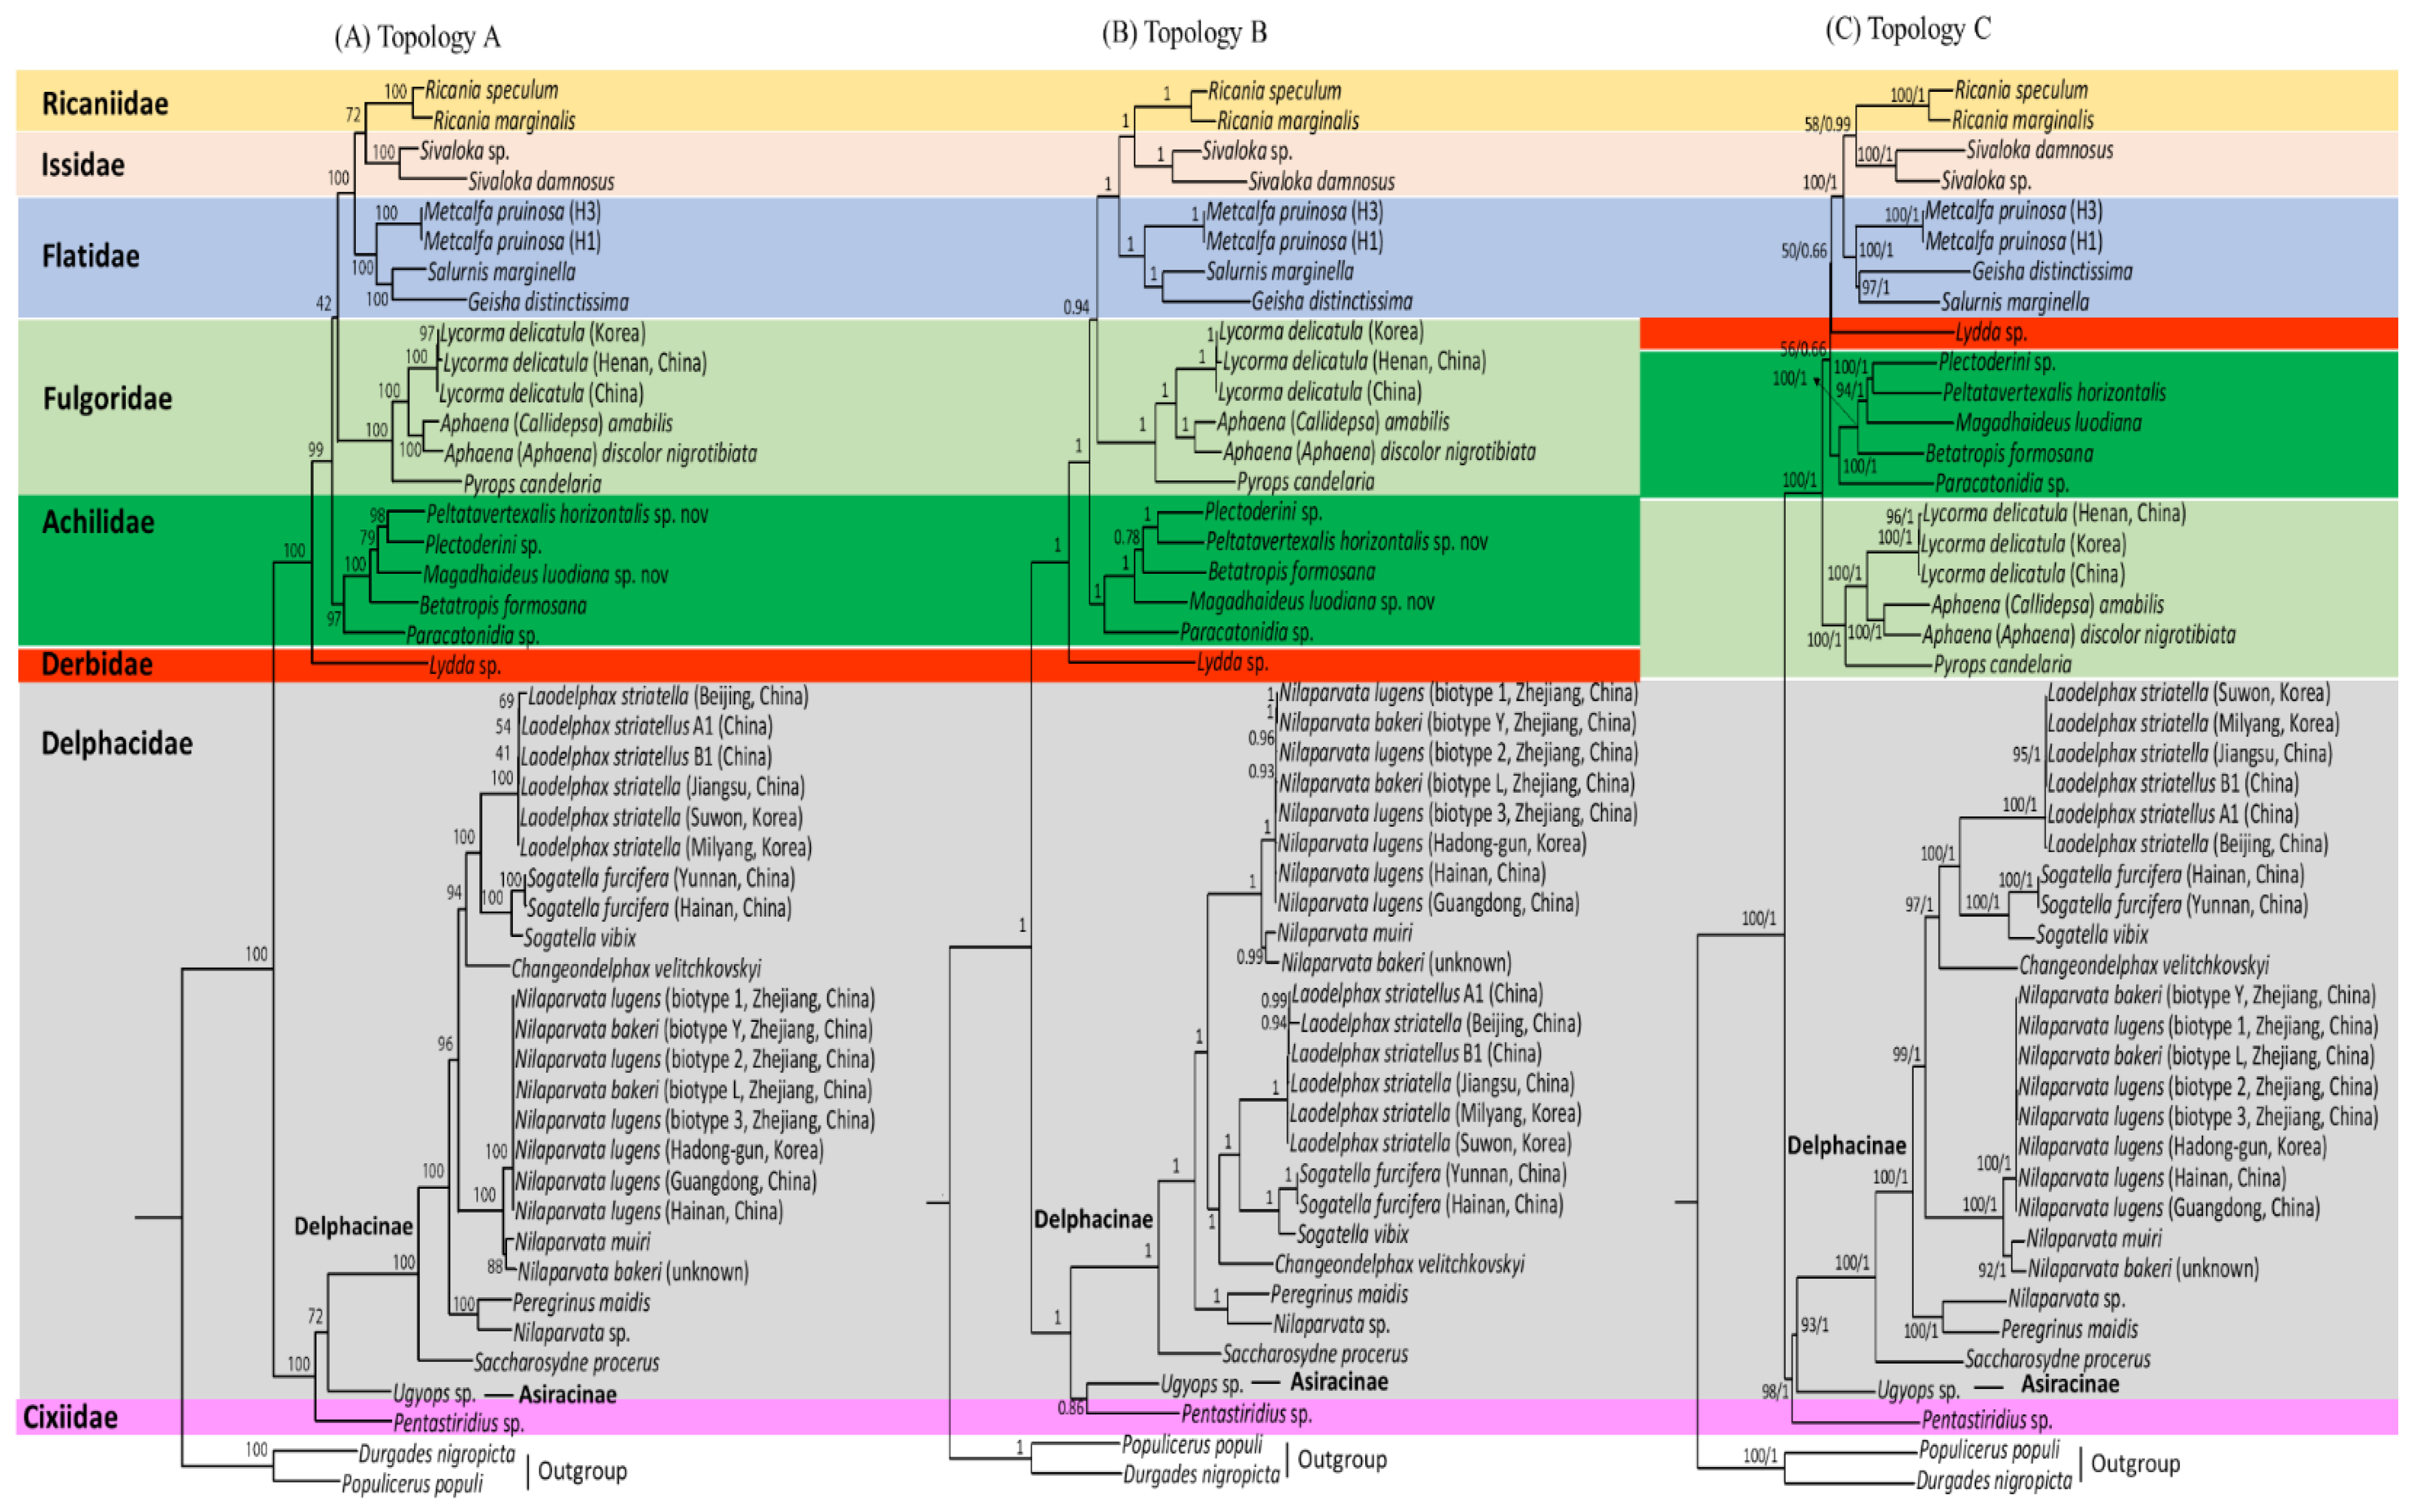
3.8. Phylogenetic Relationships
Supplementary Materials
Author Contributions
Funding
Institutional Review Board Statement
Informed Consent Statement
Data Availability Statement
Acknowledgments
Conflicts of Interest
References
- Du, Z.; Wu, Y.; Chen, Z.; Cao, L.; Ishikawa, T.; Kamitani, S.; Sota, T.; Song, F.; Tian, L.; Cai, W.; et al. Global phylogeography and invasion history of the spotted lanternfly revealed by mitochondrial phylogenomics. Evol. Appl. 2020, 14, 915–930. [Google Scholar] [CrossRef]
- Sun, J.T.; Duan, X.Z.; Hoffmann, A.A.; Liu, Y.; Garvin, M.R.; Chen, L.; Hu, G.; Zhou, J.C.; Huang, H.J.; Xue, X.F.; et al. Mitochondrial variation in small brown planthoppers linked to multiple traits and probably reflecting a complex evolutionary trajectory. Mol. Ecol. 2019, 28, 3306–3323. [Google Scholar] [CrossRef]
- Hua, J.M.; Li, M.; Dong, P.Z.; Cui, Y.; Xie, Q.; Bu, W.J. Phylogenetic analysis of the true water bugs (Insecta: Hemiptera: Heteroptera: Nepomorpha): Evidence from mitochondrial genomes. BMC Evol. Biol. 2009, 9, 134. [Google Scholar] [CrossRef] [PubMed]
- Song, N.; Liang, A.-P. Complete Mitochondrial Genome of the Small Brown Planthopper, Laodelphax striatellus (Delphacidae: Hemiptera), with a Novel Gene Order. Zool. Sci. 2009, 26, 851–860. [Google Scholar] [CrossRef] [PubMed]
- Song, N.; Liang, A.P. The complete mitochondrial genome sequence of Geisha distinctissima (Hemiptera: Flatidae) and comparison with other hemipteran insects. Acta Biochim. Biophys. Sin. 2009, 41, 206–216. [Google Scholar] [CrossRef] [PubMed]
- Song, N.; Liang, A.-P.; Ma, C. The Complete Mitochondrial Genome Sequence of the Planthopper, Sivaloka damnosus. J. Insect Sci. 2010, 10, 1–20. [Google Scholar] [CrossRef] [PubMed]
- Song, N.; Liang, A.-P.; Bu, C.-P. A Molecular Phylogeny of Hemiptera Inferred from Mitochondrial Genome Sequences. PLoS ONE 2012, 7, e48778. [Google Scholar] [CrossRef]
- Zhang, K.-J.; Zhu, W.-C.; Rong, X.; Zhang, Y.-K.; Ding, X.-L.; Liu, J.; Chen, D.-S.; Du, Y.; Hong, X.-Y. The complete mitochondrial genomes of two rice planthoppers, Nilaparvata lugens and Laodelphax striatellus: Conserved genome rearrangement in Delphacidae and discovery of new characteristics of atp8 and tRNA genes. BMC Genom. 2013, 14, 1–12. [Google Scholar] [CrossRef] [PubMed]
- Zhang, K.-J.; Zhu, W.-C.; Rong, X.; Liu, J.; Ding, X.-L.; Hong, X.-Y. The complete mitochondrial genome sequence of Sogatella furcifera (Horváth) and a comparative mitogenomic analysis of three predominant rice planthoppers. Gene 2014, 533, 100–109. [Google Scholar] [CrossRef]
- Lv, L.; Peng, X.; Jing, S.; Liu, B.; Zhu, L.; He, G. Intraspecific and Interspecific Variations in the Mitochondrial Genomes ofNilaparvata(Hemiptera: Delphacidae). J. Econ. Entomol. 2015, 108, 2021–2029. [Google Scholar] [CrossRef]
- Zhang, Q.-X.; Guan, D.-L.; Niu, Y.; Sang, L.-Q.; Zhang, X.-X.; Xu, S.-Q. Characterization of the complete mitochondrial genome of the Asian planthopper Ricania speculum (Hemiptera: Fulgoroidea: Ricannidae). Conserv. Genet. Resour. 2016, 8, 463–466. [Google Scholar] [CrossRef]
- Huang, Y.-X.; Qin, D.-Z. The complete mitochondrial genome sequence of the corn planthopper, Peregrinus maidis (Hemiptera: Fulgoroidea). Mitochondrial DNA Part B 2017, 2, 783–784. [Google Scholar] [CrossRef]
- Huang, Y.-X.; Qin, D.-Z. Sequencing and analysis of the complete mitochondrial genome of Changeondelphax velitchkovskyi (Hemiptera: Fulgoroidea). Mitochondrial DNA Part B 2018, 3, 90–91. [Google Scholar] [CrossRef]
- Huang, Y.X.; Qin, D.Z. First mitogenome for the tribe Saccharosydnini (Hemiptera: Delphacidae: Delphacinae) and the phylogeny of three predominant rice planthoppers. Eur. J. Entomol. 2008, 115, 242–248. [Google Scholar] [CrossRef]
- Song, N.; Cai, W.; Li, H. Deep-level phylogeny of Cicadomorpha inferred from mitochondrial genomes sequenced by NGS. Sci. Rep. 2017, 7, 10429. [Google Scholar] [CrossRef] [PubMed]
- Yu, F.; Liang, A.-P. The Complete Mitochondrial Genome of Ugyops sp. (Hemiptera: Delphacidae). J. Insect Sci. 2018, 18. [Google Scholar] [CrossRef] [PubMed]
- Choi, N.J.; Lee, B.C.; Park, J.; Park, J. The complete mitochondrial genome of Nilaparvata lugens (Stål, 1854) captured in China (Hemiptera: Delphacidae): Investigation of intraspecies variations between countries. Mitochondrial DNA Part B 2019, 4, 1677–1678. [Google Scholar] [CrossRef]
- Park, J.; Jung, J.K.; Koh, Y.H.; Park, J.; Seo, B.Y. The complete mitochondrial genome of Laodelphax striatellus (Fallén, 1826) (Hemiptera: Delphacidae) collected in a mid-Western part of Korean peninsula. Mitochondrial DNA Part B 2019, 4, 2229–2230. [Google Scholar] [CrossRef] [PubMed]
- Park, J.; Kwon, W.; Park, J.; Kim, H.J.; Lee, B.C.; Kim, Y.; Choi, N.J. The complete mitochondrial genome of Nilaparvata lugens (stål, 1854) captured in Korea (Hemiptera: Delphacidae). Mitochondrial DNA Part B 2019, 4, 1674–1676. [Google Scholar] [CrossRef]
- Seo, B.Y.; Jung, J.K.; Koh, Y.H.; Park, J. The complete mitochondrial genome of Laodelphax striatellus (Fallén, 1826) (Hemiptera: Delphacidae) collected in a southern part of Korean peninsula. Mitochondrial DNA Part B 2019, 4, 2242–2243. [Google Scholar] [CrossRef] [PubMed]
- Wang, W.; Huang, Y.; Bartlett, C.; Zhou, F.; Meng, R.; Qin, D. Characterization of the complete mitochondrial genomes of two species of the genus Aphaena Guérin-Méneville (Hemiptera: Fulgoridae) and its phylogenetic implications. Int. J. Biol. Macromol. 2019, 141, 29–40. [Google Scholar] [CrossRef]
- Xu, S.Y.; Long, J.K.; Chen, X.S. Comparative analysis of the complete mitochondrial genomes of five Achilidae species (Hemiptera: Fulgoroidea) and other Fulgoroidea reveals conserved mitochondrial genome organization. Peer J. 2009, 7, e6659. [Google Scholar] [CrossRef]
- Jeong, N.R.; Kim, M.J.; Lee, W.; Lee, G.-S.; Kim, I. Complete mitochondrial genome of the spotted lanternfly, Lycorma delicatula White, 1845 (Hemiptera: Fulgoridae). Mitochondrial DNA Part B 2020, 5, 370–372. [Google Scholar] [CrossRef]
- Muir, F. On the classification of the Fulgoroidea (Homoptera). Ann. Mag. Nat. Hist. 1930, 10, 461–478. [Google Scholar] [CrossRef]
- Asche, M. Preliminary thoughts on the phylogeny of Fulgoromorpha (Homoptera Auchenorrhyncha). In Proceedings of the 6th Auchenorrhyncha Meeting, Turin, Italy, 7–11 September 1987; pp. 47–53. [Google Scholar]
- Emeljanov, A.F. An attempt of construction of the phylogenetic tree of the planthoppers (Homoptera, Cicadina). Entomol. Obozr. 1990, 69, 353–356. [Google Scholar]
- Bourgoin, T. Female genitalia in Fulgoromorpha (Insecta, Hemiptera): Morphological and phylogenetical data. Ann. Soc. Entomol. Fr. 1993, 29, 225–244. [Google Scholar]
- Chen, S.; Yang, C.Y. The metatarsi of the Fulgoroidea (Homoptera: Auchenorrhyncha). Chin. J. Entomol. 1995, 15, 257–269. [Google Scholar]
- Urban, J.M.; Cryan, J.R. Evolution of the planthoppers (Insecta: Hemiptera: Fulgoroidea). Mol. Phylogenetics Evol. 2007, 42, 556–572. [Google Scholar] [CrossRef] [PubMed]
- Song, N.; Liang, A.-P. A Preliminary Molecular Phylogeny of Planthoppers (Hemiptera: Fulgoroidea) Based on Nuclear and Mitochondrial DNA Sequences. PLoS ONE 2013, 8, e58400. [Google Scholar] [CrossRef] [PubMed]
- Dean, H.A.; Bailey, J.C. A flatid planthopper, Metcalfa pruinose. J. Econ. Entomol. 1961, 54, 1104–1106. [Google Scholar] [CrossRef]
- Wilson, S.W.; Lucchi, A. Distribution and ecology of Metcalfa pruinosa and associated planthoppers in North America (Homoptera: Fulgoroidea), Atti della Academia Nazionale Italiana di Entomologia. Rend. Anno 2001, 49, 121–130. [Google Scholar]
- Zangheri, S.; Donadini, P. Comparsa nel veneto di un omottero neartico: Metcalfa pruinosa Say (Homoptera, Flatidae). Redia 1980, 63, 301–305. [Google Scholar]
- EPPO. PQR Database, European and Mediterranean Plant Protection Organization, Paris, France. 2017. Available online: http://www.eppo.int/DATABASES/pqr/pqr.htmREF (accessed on 9 September 2021).
- Lee, H.S.; Wilson, S.W. First report of the Nearctic flatid planthopper Metcalfa pruinosa (Say) in the Republic of Korea (Hemiptera: Fulgoroidea). Entomol. News 2010, 121, 506–513. [Google Scholar] [CrossRef]
- Peng, L.F.; Zhang, Y.L.; Wang, Y.L. A taxonomic study of the genus Salurnis Stal from China (Hemiptera, Flatidae) with description of two new record species. Acta Zootaxonomica Sinica 2009, 34, 878–884. [Google Scholar]
- Kim, D.E.; Kil, J.H. A photographic guide to the alien insects and their host plants in Korea. Nat. Life Korea 2013, 60–67. [Google Scholar]
- Kim, N.Y.; Kim, S.H.; Kim, D.E.; Lee, D.H.; Ryu, T.B.; Choi, D.; Lee, H.; Kim, H.M.; Kim, M.Y.; Kim, Y.C. Ecological Studies of Alien Species (III); Division of Ecology Conservation, Bureau of Ecology Research, National Institute of Ecology: Chungcheongnam-do, Korea, 2016. [Google Scholar]
- Park, C.-G.; Min, S.; Lee, G.-S.; Kim, S.; Lee, Y.; Lee, S.; Hong, K.-J.; Wilson, S.W.; Akimoto, S.-I.; Lee, W. Genetic Variability of the Invasive SpeciesMetcalfa pruinose (Hemiptera: Flatidae) in the Republic of Korea. J. Econ. Entomol. 2016, 109, 1897–1906. [Google Scholar] [CrossRef] [PubMed]
- Andrews, S. FastQC: A Quality Control Tool for High Throughput Sequence Data. 2010. Available online: http://www.bioinformatics.babraham.ac.uk?/projects/fastqc/ (accessed on 6 June 2020).
- Jiang, H.; Lei, R.; Ding, S.-W.; Zhu, S. Skewer: A fast and accurate adapter trimmer for next-generation sequencing paired-end reads. BMC Bioinform. 2014, 15, 182. [Google Scholar] [CrossRef]
- Allam, A.; Kalnis, P.; Solovyev, V. Karect: Accurate correction of substitution, insertion and deletion errors for next-generation sequencing data. Bioinformatics 2015, 31, 3421–3428. [Google Scholar] [CrossRef]
- Hahn, C.; Bachmann, L.; Chevreux, B. Reconstructing mitochondrial genomes directly from genomic next-generation sequencing reads-a baiting and iterative mapping approach. Nucleic Acids Res. 2013, 41, e129. [Google Scholar] [CrossRef]
- Langmead, B.; Salzberg, S.L. Fast Gapped-Read Alignment with Bowtie 2. Nat. Methods 2012, 9, 357–359. [Google Scholar] [CrossRef]
- De Pristo, M.A.; Banks, E.; Poplin, R.; Garimella, K.V.; Maguire, J.R.; Hartl, C.; Philippakis, A.; Del Angel, G.; Rivas, M.A.; Hanna, M.; et al. A framework for variation discovery and genotyping using next-generation DNA sequencing data. Nat. Genet. 2011, 43, 491–498. [Google Scholar] [CrossRef] [PubMed]
- Bernt, M.; Donath, A.; Donath, A.; Externbrink, F.; Florentz, C.; Fritzsch, G.; Pütz, J.; Middendorf, M.; Stadler, P.F. MITOS: Improved de novo metazoan mitochondrial genome annotation. Mol. Phylogenet. Evol. 2013, 69, 313–319. [Google Scholar] [CrossRef] [PubMed]
- Tamura, K.; Stecher, G.; Peterson, D.; Filipski, A.; Kumar, S. MEGA6: Molecular evolutionary genetics analysis ver. 6.0. Mol. Biol. Evol. 2013, 30, 2725–2729. [Google Scholar] [CrossRef] [PubMed]
- Swofford, D.L. PAUP* Phylogenetic Analysis Using Parsimony (*and Other Method) Version 4. 10; Sinauer Associates: Sunderland, MA, USA, 2002. [Google Scholar]
- Perna, N.T.; Kocher, T.D. Patterns of nucleotide composition at fourfold degenerate sites of animal mitochondrial genomes. J. Mol. Evol. 1995, 41, 353–358. [Google Scholar] [CrossRef]
- Posada, D.; Buckley, T.R. Model Selection and Model Averaging in Phylogenetics: Advantages of Akaike Information Criterion and Bayesian Approaches over Likelihood Ratio Tests. Syst. Biol. 2004, 53, 793–808. [Google Scholar] [CrossRef]
- Zhang, Z.; Li, J.; Yu, J. Computing Ka and Ks with a consideration of unequal transitional substitutions. BMC Evol. Biol. 2006, 6, 44. [Google Scholar] [CrossRef]
- Shao, R.; Campbell, N.J.H.; Schmidt, E.R.; Barker, S.C. Increased rate of gene rearrangement in the mitochondrial genomes of three orders of hemipteroid insects. Mol. Biol. Evol. 2001, 18, 1828–1832. [Google Scholar] [CrossRef]
- Wernersson, R.; Pedersen, A.G. RevTrans—Constructing alignments of coding DNA from aligned amino acid sequences. Nucleic Acids Res. 2003, 31, 3537–3539. [Google Scholar] [CrossRef]
- Castresana, J. Selection of conserved blocks from multiple alignments for their use in phylogenetic tool. Mol. Biol. Evol. 2000, 17, 540–552. [Google Scholar] [CrossRef]
- Lanfear, R.; Calcott, B.; Ho, S.Y.W.; Guindon, S. PartitionFinder: Combined Selection of Partitioning Schemes and Substitution Models for Phylogenetic Analyses. Mol. Biol. Evol. 2012, 29, 1695–1701. [Google Scholar] [CrossRef]
- Lanfear, R.; Calcott, B.; Kainer, D.; Mayer, C.; Stamatakis, A. Selecting optimal partitioning schemes for phylogenomic datasets. BMC Evol. Biol. 2014, 14, 82. [Google Scholar] [CrossRef]
- Lanfear, R.; Frandsen, P.; Wright, A.M.; Senfeld, T.; Calcott, B. PartitionFinder 2: New Methods for Selecting Partitioned Models of Evolution for Molecular and Morphological Phylogenetic Analyses. Mol. Biol. Evol. 2016, 34, 772–773. [Google Scholar] [CrossRef]
- Stamatakis, A. RAxML version 8: A tool for phylogenetic analysis and post-analysis of large phylogenies. Bioinformatics 2014, 30, 1312–1313. [Google Scholar] [CrossRef] [PubMed]
- Ronquist, F.; Teslenko, M.; Van Der Mark, P.; Ayres, D.L.; Darling, A.; Hoehna, S.; Larget, B.; Liu, L.; Suchard, M.A.; Huelsenbeck, J.P. MrBayes 3.2: Efficient Bayesian Phylogenetic Inference and Model Choice Across a Large Model Space. Syst. Biol. 2012, 61, 539–542. [Google Scholar] [CrossRef] [PubMed]
- Miller, M.A.; Pfeiffer, W.; Schwartz, T. Creating the CIPRES science gateway for inference of large phylogenetic trees. In Proceedings of the 9th Gateway Computing Environments Workshop (GCE), New Orleans, LA, USA; 2010; pp. 1–8. [Google Scholar]
- Wu, Y.; Dai, R.; Zhan, H.; Qu, L. Complete mitochondrial genome of Drabescoides nuchalis (Hemiptera: Cicadellidae). Mitochondrial DNA Part A 2015, 27, 3626–3627. [Google Scholar] [CrossRef] [PubMed]
- Wang, J.J.; Yang, M.F.; Dai, R.H.; Li, H.; Wang, X.Y. Characterization and phylogenetic implications of the complete mitochondrial genome of Idiocerinae (Hemiptera: Cicadellidae). Int. J. Biol. Macromol. 2018, 120, 2366–2372. [Google Scholar] [CrossRef]
- Letunic, I.; Bork, P. Interactive Tree of Life (iTOL) v4: Recent updates and new developments. Nucleic Acids Res. 2019, 47, W256–W259. [Google Scholar] [CrossRef] [PubMed]
- Boore, J.L. Animal mitochondrial genomes. Nucleic Acids Res. 1999, 27, 1767–1780. [Google Scholar] [CrossRef]
- Kim, J.S.; Kim, M.J.; Jeong, J.S.; Kim, I. Complete mitochondrial genome of Saturnia jonasii (Lepidoptera: Saturniidae): Genomic comparisons and phylogenetic inference among Bombycoidea. Genomics 2018, 110, 274–282. [Google Scholar] [CrossRef]
- Shi, X.; Zhu, Q.; Wu, N.; Tu, J.; Yang, D.; Xu, H.; Yao, Y.; Yang, M.; Li, D. The complete nucleotide sequence of the mitochondrial genome of Drosophila formosana (Diptera: Drosophilidae). Mitochondrial DNA Part A 2015, 27, 4316–4317. [Google Scholar] [CrossRef]
- Wolstenholme, D.R. Animal Mitochondrial DNA: Structure and Evolution. Int. Rev. Cytol. 1992, 141, 173–216. [Google Scholar] [PubMed]
- Du, Y.; Zhang, C.; Dietrich, C.H.; Zhang, Y.; Dai, W. Characterization of the complete mitochondrial genomes of Maiestas dorsalis and Japananus hyalinus (Hemiptera: Cicadellidae) and comparison with other Membracoidea. Sci. Rep. 2017, 7, 1–10. [Google Scholar] [CrossRef] [PubMed]
- Chen, J.; Wang, Y.; Qin, M.; Jiang, L.-Y.; Qiao, G.-X. The mitochondrial genome of Greenidea psidii van der Goot (Hemiptera: Aphididae: Greenideinae) and comparisons with other Aphididae aphids. Int. J. Biol. Macromol. 2018, 122, 824–832. [Google Scholar] [CrossRef] [PubMed]
- Hebert, P.D.N.; Cywinska, A.; Ball, S.L.; Dewaard, J.R. Biological identifications through DNA barcodes. Proc. R. Soc. B: Boil. Sci. 2003, 270, 313–321. [Google Scholar] [CrossRef] [PubMed]
- Hajibabaei, M.; Singer, G.A.; Hebert, P.D.; Hickey, D.A. DNA barcoding: How it complements taxonomy, molecular phylogenetics and population genetics. Trends Genet. 2007, 23, 167–172. [Google Scholar] [CrossRef]
- Lee, J.Y.; Wang, A.R.; Choi, Y.S.; Thapa, R.; Kwon, H.W.; Kim, I. Mitochondrial DNA variations in Korean Apis cerana (Hymenoptera: Apidae) and development of another potential marker. Apidologie 2016, 47, 123–134. [Google Scholar] [CrossRef]
- Choi, D.-S.; Park, J.S.; Kim, M.J.; Kim, J.S.; Jeong, S.Y.; Jeong, J.S.; Park, J.; Kim, I. Geographic variation in the spotted-wing drosophila, Drosophila suzukii (Diptera: Drosophilidae), based on mitochondrial DNA sequences. Mitochondrial DNA Part A 2017, 29, 312–322. [Google Scholar] [CrossRef]
- Sanaei, E.; Husemann, M.; Seiedy, M.; Rethwisch, M.; Tuda, M.; Toshova, T.B.; Kim, M.J.; Atanasova, D.; Kim, I. Global genetic diversity, lineage distribution, and Wolbachia infection of the alfalfa weevil Hypera postica (Coleoptera: Curculionidae). Ecol. Evol. 2019, 9, 9546–9563. [Google Scholar] [CrossRef]
- Kim, M.J.; Cho, Y.; Wang, A.R.; Kim, S.-S.; Choi, S.-W.; Kim, I. Population genetic characterization of the black-veined white, Aporia crataegi (Lepidoptera: Pieridae), using novel microsatellite markers and mitochondrial DNA gene sequences. Conserv. Genet. 2020, 21, 359–371. [Google Scholar] [CrossRef]
- Wang, A.-R.; Kim, M.-J.; Cho, Y.-B.; Wan, X.; Kim, I.-S. Geographic Genetic Contour of a Ground Beetle, Scarites aterrimus (Coleoptera: Carabidae) on the Basis of Mitochondrial DNA Sequence. Int. J. Ind. Entomol. 2011, 22, 65–74. [Google Scholar] [CrossRef][Green Version]
- Arca, M.; Mougel, F.; Guillemaud, T.; Dupas, S.; Rome, Q.; Perrard, A.; Muller, F.; Fossoud, A.; Capdevielle-Dulac, C.; Torres-Leguizamon, M.; et al. Reconstructing the invasion and the demographic history of the yellow-legged hornet, Vespa velutina, in Europe. Biol. Invasions 2015, 17, 2357–2371. [Google Scholar] [CrossRef]
- Kwon, D.H.; Kim, M.; Kim, H.; Lee, Y.; Hong, K.-J.; Lee, S.H.; Lee, S. Estimation of genetic divergence based on mitochondrial DNA variation for an invasive alien species, Metcalfa pruinosa (Say), in Korea. J. Asia-Pacific Entomol. 2015, 18, 447–451. [Google Scholar] [CrossRef]
- Takahashi, R.; Okutama, H.; Kiyoshi, T.; Takahashi, J. Complete mitochondrial DNA sequence of the invasive hornet Vespa velutina (Insecta, Hymenoptera) found in Japan. Mitochondrial DNA Part B 2017, 2, 143–144. [Google Scholar] [CrossRef]
- Kim, K.-G.; Hong, M.Y.; Kim, M.J.; Im, H.H.; Kim, M.I.; Bae, C.H.; Seo, S.J.; Lee, S.H.; Kim, I. Complete mitochondrial genome sequence of the yellow-spotted long-horned beetle Psacothea hilaris (Coleoptera: Cerambycidae) and phylogenetic analysis among coleopteran insects. Mol. Cells 2009, 27, 429–441. [Google Scholar] [CrossRef] [PubMed]
- Jeong, J.S.; Kim, M.J.; Kim, I. The mitochondrial genome of the dung beetle, Copris tripartitus, with mitogenomic comparisons within Scarabaeidae (Coleoptera). Int. J. Biol. Macromol. 2019, 144, 874–891. [Google Scholar] [CrossRef] [PubMed]
- Taanman, J.-W. The mitochondrial genome: Structure, transcription, translation and replication. Biochim. Biophys. Acta (BBA) Bioenerg. 1999, 1410, 103–123. [Google Scholar] [CrossRef]
- Cameron, S.L.; Whiting, M.F. The complete mitochondrial genome of the tobacco hornworm, Manduca sexta, (Insecta: Lepidoptera: Sphingidae), and an examination of mitochondrial gene variability within butterflies and moths. Gene 2008, 408, 112–123. [Google Scholar] [CrossRef]
- Moriz, C.; Brown, W.M. Tandem duplications of D-loop and ribosomal RNA sequences in lizard mitochondrial DNA. Science 1986, 233, 1425–1427. [Google Scholar] [CrossRef]
- Moritz, C.; Brown, W.M. Tandem duplications in animal mitochondrial DNAs: Variation in incidence and gene content among lizards. Proc. Natl. Acad. Sci. USA 1987, 84, 7183–7187. [Google Scholar] [CrossRef]
- Levinson, G.; Gutman, G.A. Slipped-strand mispairing: A major mechanism for DNA sequence evolution. Mol. Biol. Evol. 1987, 4, 203–221. [Google Scholar]
- Bensasson, D.; Zhang, D.-X.; Hartl, D.L.; Hewitt, G.M. Mitochondrial pseudogenes: Evolution’s misplaced witnesses. Trends Ecol. Evol. 2001, 16, 314–321. [Google Scholar] [CrossRef]
- Woischnik, M.; Moraes, C.T. Pattern of Organization of Human Mitochondrial Pseudogenes in the Nuclear Genome. Genome Res. 2002, 12, 885–893. [Google Scholar] [CrossRef] [PubMed]
- White, D.J.; Wolff, J.N.; Pierson, M.; Gemmell, N. Revealing the hidden complexities of mtDNA inheritance. Mol. Ecol. 2008, 17, 4925–4942. [Google Scholar] [CrossRef]
- Kang, A.R.; Kim, M.J.; Park, I.A.; Kim, K.Y.; Kim, I. Extent and divergence of heteroplasmy of the DNA barcoding region in Anapodisma miramae (Orthoptera: Acrididae). Mitochondrial DNA Part A 2015, 27, 3405–3414. [Google Scholar] [CrossRef] [PubMed]
- Unseld, M.; Marienfeld, J.R.; Brandt, P.; Brennicke, A. The mitochondrial genome of Arabidopsis thaliana contains 57 genes in 366,924 nucleotides. Nat. Genet. 1997, 15, 57–61. [Google Scholar] [CrossRef]
- Notsu, Y.; Masood, S.; Nishikawa, T.; Kubo, N.; Akiduki, G.; Nakazono, M.; Hirai, A.; Kadowaki, K. The complete sequence of the rice (Oryza sativa L.) mitochondrial genome: Frequent DNA sequence acquisition and loss during the evolution of flowering plants. Mol. Genet. Genom. 2002, 268, 434–445. [Google Scholar] [CrossRef]
- Wang, Y.; Chen, J.; Jiang, L.Y.; Qiao, G.X. Hemipteran mitochondrial genomes: Features, structures and implications for phylogeny. Int. J. Mol. Sci. 2015, 16, 12382–12404. [Google Scholar] [CrossRef]
- Leister, D. Origin, evolution and genetic effects of nuclear insertions of organelle DNA. Trends Genet. 2005, 21, 655–663. [Google Scholar] [CrossRef]
- Li, K.; Liang, A.-P. Hemiptera Mitochondrial Control Region: New Sights into the Structural Organization, Phylogenetic Utility, and Roles of Tandem Repetitions of the Noncoding Segment. Int. J. Mol. Sci. 2018, 19, 1292. [Google Scholar] [CrossRef]
- Wang, A.R.; Kim, J.S.; Kim, M.J.; Kim, H.-K.; Choi, Y.S.; Kim, I. Comparative description of mitochondrial genomes of the honey bee Apis (Hymenoptera: Apidae): Four new genome sequences and Apis phylogeny using whole genomes and individual genes. J. Apic. Res. 2018, 57, 484–503. [Google Scholar] [CrossRef]
- Dowton, M.; Cameron, S.L.; Dowavic, J.I.; Austin, A.D.; Whiting, M.F. Characterization of 67 mitochondrial tRNA gene rear-rangements in the Hymenoptera suggests that mitochondrial tRNA gene position is selectively neutral. Mol. Biol. Evol. 2009, 26, 1607–1617. [Google Scholar] [CrossRef]
- Timmermans, M.J.; Vogler, A.P. Phylogenetically informative rearrangements in mitochondrial genomes of Coleoptera, and monophyly of aquatic elateriform beetles (Dryopoidea). Mol. Phylogenetics Evol. 2012, 63, 299–304. [Google Scholar] [CrossRef]
- Cameron, S.L. Insect Mitochondrial Genomics: Implications for Evolution and Phylogeny. Annu. Rev. Entomol. 2014, 59, 95–117. [Google Scholar] [CrossRef]
- Urban, J.M.; Bartlett, C.R.; Cryan, J.R. Evolution of Delphacidae (Hemiptera: Fulgoroidea): Combined-evidence phylogenetics reveals importance of grass host shifts. Syst. Entomol. 2010, 35, 678–691. [Google Scholar] [CrossRef]
- Asche, M. Zur Phylogenie der Delphacidae Leach, 1815 (Homoptera Cicadina Fulgoromorpha), Marburger entomologische. Publikationen 1985, 2, 1–910. [Google Scholar]
- Boore, J.L.; Lavrov, D.; Brown, W.M. Gene translocation links insects and crustaceans. Nature 1998, 392, 667–668. [Google Scholar] [CrossRef]
- Curole, J.P.; Kocher, T.D. Mitogenomics: Digging deeper with complete mitochondrial genomes. Trends Ecol. Evol. 1999, 14, 394–398. [Google Scholar] [CrossRef]
- Rokas, A.; Holland, P.W. Rare genomic changes as a tool for phylogenetics. Trends Ecol. Evol. 2000, 15, 454–459. [Google Scholar] [CrossRef]
- Cameron, S.L.; Yoshizawa, K.; Mizukoshi, A.; Whiting, M.F.; Johnson, K.P. Mitochondrial genome deletions and minicircles are common in lice (Insecta: Phthiraptera). BMC Genom. 2011, 12, 394. [Google Scholar] [CrossRef] [PubMed]
- Timmermans, M.J.; Lees, D.C.; Simonsen, T.J. Towards a mitogenomic phylogeny of Lepidoptera. Mol. Phylogenetics Evol. 2014, 79, 169–178. [Google Scholar] [CrossRef] [PubMed]
- Erixon, P.; Svennblad, B.; Britton, T.; Oxelman, B. Reliability of Bayesian Posterior Probabilities and Bootstrap Frequencies in Phylogenetics. Syst. Biol. 2003, 52, 665–673. [Google Scholar] [CrossRef]


| Taxon | Size (bp) | A/T Content (%) | PCG | srRNA | lrRNA | tRNA | A+T-Rich Region | GenBank Accession No. | References | |||||
|---|---|---|---|---|---|---|---|---|---|---|---|---|---|---|
| No. Codons a | AT (%) | Size (bp) | AT (%) | Size (bp) | AT (%) | Size (bp) | AT (%) | Size (bp) | AT (%) | |||||
| Fulgoroidea | ||||||||||||||
| Flatidae | ||||||||||||||
| Flatinae | ||||||||||||||
| Metcalfa pruinosa (H1) | 16,312 | 76.62 | 3,656 | 75.78 | 717 | 77.96 | 1,226 | 79.53 | 1,445 | 76.82 | 1,788 | 77.46 | MK303326 | This study |
| Metcalfa pruinosa (H3) | 16,314 | 76.62 | 3,656 | 75.79 | 717 | 77.96 | 1,226 | 79.53 | 1,445 | 76.82 | 1,790 | 77.54 | MN417319 | This study |
| Salurnis marginella | 16,126 | 75.73 | 3,637 | 75.33 | 724 | 76.52 | 1,204 | 78.90 | 1,390 | 76.12 | 1,836 | 74.73 | MT628542 | This study |
| Geisha distinctissima‡ | 15,971 | 75.11 | 3,633 | 73.47 | 729 | 77.64 | 1,198 | 79.55 | 1,408 | 76.99 | 1,702 | 79.49 | FJ230961 | Song and Liang [5] |
| Fulgoridae | ||||||||||||||
| Fulgorinae | ||||||||||||||
| Pyrops candelaria | 16,021 | 74.36 | 3,653 | 72.64 | 717 | 76.71 | 1,214 | 74.96 | 1,440 | 74.10 | 1,592 | 83.73 | FJ006724 | Song et al. [7] |
| Aphaeninae | ||||||||||||||
| Lycorma delicatula (Henan, China) | 15,946 | 76.36 | 3,641 | 75.04 | 721 | 77.67 | 1,214 | 77.35 | 1,423 | 76.11 | 1,642 | 83.74 | EU909203 | Song et al. [7] |
| Lycorma delicatula (China) | 15,410 | 76.29 | 3,644 | 75.27 | 792 | 77.40 | 1,212 | 77.97 | 1,409 | 76.37 | 1,043 | 83.32 | FJ456942 | Hua et al. [3] |
| Lycorma delicatula (Korea) | 15,798 | 76.50 | 3,646 | 75.30 | 735 | 77.28 | 1,209 | 77.67 | 1,410 | 76.45 | 1,495 | 83.48 | MN607209 | Jeong et al. [23] |
| Aphaena (Callidepsa) amabilis | 16,237 | 77.90 | 3,657 | 77.16 | 730 | 78.77 | 1,210 | 77.93 | 1,403 | 76.48 | 1,869 | 82.24 | MN025522 | Wang et al. [21] |
| Aphaena (Aphaena) discolor nigrotibiata | 16,116 | 77.02 | 3,654 | 76.12 | 733 | 78.72 | 1,210 | 78.18 | 1,397 | 75.88 | 1,764 | 81.07 | MN025523 | Wang et al. [21] |
| Achilidae | ||||||||||||||
| Achilinae | ||||||||||||||
| Betatropis formosana | 16,161 | 77.77 | 3,661 | 76.25 | 726 | 78.37 | 1,182 | 79.53 | 1,397 | 77.24 | 1,778 | 84.81 | MH324927 | Xu et al. [22] |
| Magadhaideus luodiana sp. nov | 15,885 | 74.35 | 3,650 | 72.48 | 726 | 74.38 | 1,213 | 78.57 | 1,406 | 76.17 | 1,550 | 82.00 | MH324928 | Xu et al. [22] |
| Peltatavertexalis horizontalis sp. nov | 15,787 | 75.53 | 3,638 | 74.16 | 729 | 76.13 | 1,213 | 78.15 | 1,400 | 76.00 | 1,459 | 81.91 | MH324929 | Xu et al. [22] |
| Plectoderini sp. | 16,216 | 75.70 | 3,645 | 74.21 | 729 | 75.72 | 1,199 | 79.32 | 1,417 | 75.72 | 1,850 | 81.30 | MH324930 | Xu et al. [22] |
| Paracatonidia sp. | 15,214 | 76.48 | 3,627 | 75.30 | 726 | 77.13 | 1,198 | 78.21 | 1,412 | 77.41 | 909 | 84.60 | MH324931 | Xu et al. [22] |
| Cixiidae | ||||||||||||||
| Cixiinae | ||||||||||||||
| Pentastiridius sp. ‡ | 12,231 | 76.97 | 3,255 | 75.64 | - | - | - | - | 1,296 | 77.78 | - | - | KY039133 | Song et al. [15] |
| Derbidae | ||||||||||||||
| Otiocerinae | ||||||||||||||
| Lydda sp.‡ | 14,755 | 77.93 | 3,599 | 77.45 | 724 | 79.56 | 1,201 | 81.85 | 1,335 | 79.10 | 565 | 69.38 | KY039126 | Song et al. [15] |
| Issidae | ||||||||||||||
| Issinae | ||||||||||||||
| Sivaloka damnosus | 15,287 | 76.52 | 3,625 | 75.56 | 711 | 76.79 | 1,192 | 78.44 | 1,424 | 77.18 | 1,994 | 81.69 | FJ360694 | Song et al. [6] |
| Sivaloka sp.‡ | 15,034 | 75.83 | 3,569 | 74.82 | 800 | 75.12 | 1,210 | 79.83 | 1,321 | 77.52 | 755 | 76.16 | KY039137 | Song et al. [15] |
| Ricaniidae | ||||||||||||||
| Ricaniinae | ||||||||||||||
| Ricania marginalis | 15,698 | 76.12 | 3,646 | 75.00 | 736 | 75.68 | 1,216 | 78.70 | 1,426 | 75.67 | 1,324 | 82.33 | JN242415 | Song et al. [7] |
| Ricania speculum | 15,729 | 75.75 | 3,640 | 74.67 | 727 | 75.79 | 1,198 | 78.30 | 1,415 | 75.76 | 1,346 | 80.76 | KX371891 | Zhang et al. [11] |
| Delphacidae | ||||||||||||||
| Asiracinae | ||||||||||||||
| Ugyops sp. | 15,259 | 77.65 | 3,612 | 76.41 | 767 | 74.97 | 1,206 | 80.76 | 1,397 | 77.31 | 1,031 | 88.85 | MH352481 | Yu and Liang [16] |
| Delphacinae | ||||||||||||||
| Saccharosydnini | ||||||||||||||
| Saccharosydne procerus | 16,031 | 80.53 | 3,602 | 79.16 | 754 | 78.12 | 1,217 | 83.48 | 1,404 | 79.91 | 1,662 | 88.03 | MG515237 | Huang and Qin [14] |
| Delphacini | ||||||||||||||
| Changeondelphax velitchkovskyi | 16,449 | 75.72 | 3,607 | 74.48 | 752 | 74.60 | 1,213 | 77.91 | 1,386 | 76.41 | 1,781 | 80.12 | MG049916 | Huang and Qin [13] |
| Nilaparvata bakeri (unknown) | 14,394 | 77.07 | 3,582 † | 76.58 | 754 | 73.87 | 1,215 | 79.01 | 1,393 | 78.89 | - | - | KC333655 | Lv et al. [10] |
| Nilaparvata lugens (biotype Y, Zhejiang, China) | 14,365 | 76.67 | 3,581 | 75.92 | 751 | 74.83 | 1,219 | 79.57 | 1,390 | 78.71 | - | - | KC333653 | Lv et al. [10] |
| Nilaparvata lugens (biotype L, Zhejiang, China) | 14,366 | 76.72 | 3,581 | 75.98 | 751 | 74.83 | 1,219 | 79.49 | 1,392 | 78.74 | - | - | KC333654 | Lv et al. [10] |
| Nilaparvata lugens (Hainan, China) | 17,619 | 76.95 | 3,608 | 76.01 | 748 | 75.00 | 1,219 | 79.57 | 1,409 | 78.57 | 2,429 | 79.29 | JX880069 | Zhang et al. [8] |
| Nilaparvata lugens (Hadong-gun, Korea) ‡ | 17,610 | 77.12 | 3,619 | 76.19 | 748 | 75.00 | 1,219 | 79.49 | 1,534 | 78.36 | 2,424 | 79.70 | MK590088 | Park et al. [19] |
| Nilaparvata lugens (Guangdong, China) | 17,606 | 77.09 | 3,607 | 76.10 | 748 | 75.00 | 1,219 | 79.49 | 1,535 | 78.31 | 2,424 | 79.79 | MK606371 | Choi et al. [17] |
| Nilaparvata lugens (biotype 1, Zhejiang, China) | 14,364 | 76.69 | 3,582 | 75.95 | 751 | 74.83 | 1,219 | 79.57 | 1,390 | 78.71 | - | - | JN563995 | Lv et al. [10] |
| Nilaparvata lugens (biotype 2, Zhejiang, China) | 14,367 | 76.68 | 3,582 | 75.94 | 751 | 74.83 | 1,219 | 79.57 | 1,392 | 78.74 | - | - | JN563996 | Lv et al. [10] |
| Nilaparvata lugens (biotype 3, Zhejiang, China) | 14,367 | 76.67 | 3,582 | 75.91 | 751 | 74.83 | 1,219 | 79.66 | 1,392 | 78.74 | - | - | JN563997 | Lv et al. [10] |
| Nilaparvata muiri | 14,371 | 76.15 | 3,582 † | 75.41 | 753 | 74.24 | 1,219 | 78.42 | 1,391 | 78.86 | - | - | JN563998 | Lv et al. [10] |
| Nilaparvata sp.‡ | 15,274 | 76.24 | 3,609 | 75.61 | 749 | 74.63 | 1,212 | 79.21 | 1,396 | 78.51 | 725 | 73.10 | KY039125 | Song et al. [15] |
| Peregrinus maidis | 16,279 | 77.75 | 3,607 | 75.74 | 750 | 76.13 | 1,222 | 79.87 | 1,390 | 78.85 | 1,596 | 86.15 | MG049917 | Huang and Qin [12] |
| Sogatella furcifera (Hainan, China) | 16,612 | 76.19 | 3,606 | 74.44 | 747 | 74.03 | 1,224 | 77.94 | 1,389 | 77.75 | 2,223 | 82.50 | KC512914 | Zhang et al. [9] |
| Sogatella furcifera (Yunnan, China) | 16,654 | 76.19 | 3,609 | 74.44 | 747 | 74.16 | 1,225 | 77.96 | 1,388 | 77.74 | 2,264 | 82.29 | KC512915 | Zhang et al. [9] |
| Sogatella vibix | 16,554 | 76.04 | 3,609 | 75.39 | 749 | 74.77 | 1,227 | 79.14 | 1,395 | 77.92 | 2,167 | 75.91 | MG515238 | Huang and Qin [14] |
| Laodelphax striatellus (Jiangsu, China) | 16,431 | 77.17 | 3,613 | 75.74 | 747 | 74.83 | 1,219 | 78.59 | 1,406 | 77.95 | 2,042 | 83.20 | JX880068 | Zhang et al. [8] |
| Laodelphax striatellus (Suwon, Korea) | 16,359 | 77.26 | 3,609 | 75.81 | 747 | 74.83 | 1,219 | 78.67 | 1,406 | 78.09 | 1,972 | 83.67 | MK838101 | Park et al. [18] |
| Laodelphax striatellus (Milyang, Korea) | 16,359 | 77.27 | 3,609 | 75.81 | 747 | 74.83 | 1,219 | 78.67 | 1,406 | 78.09 | 1,972 | 83.72 | MK862265 | Seo et al. [20] |
| Laodelphax striatellus A1 (China) | 16,428 | 77.18 | 3,613 | 75.75 | 747 | 74.83 | 1,219 | 78.67 | 1,406 | 78.09 | 2,039 | 83.13 | MK292897 | Sun et al. [2] |
| Laodelphax striatellus B1 (China) | 16,418 | 77.18 | 3,613 | 75.77 | 747 | 74.83 | 1,219 | 78.67 | 1,409 | 78.07 | 2,032 | 83.12 | MK292932 | Sun et al. [2] |
| Laodelphax striatellus (Beijing, China) | 16,513 | 77.19 | 3,676 | 75.96 | 747 | 74.56 | 1,219 | 78.59 | 1,417 | 78.19 | 2,040 | 83.09 | FJ360695 | Song and Liang [4] |
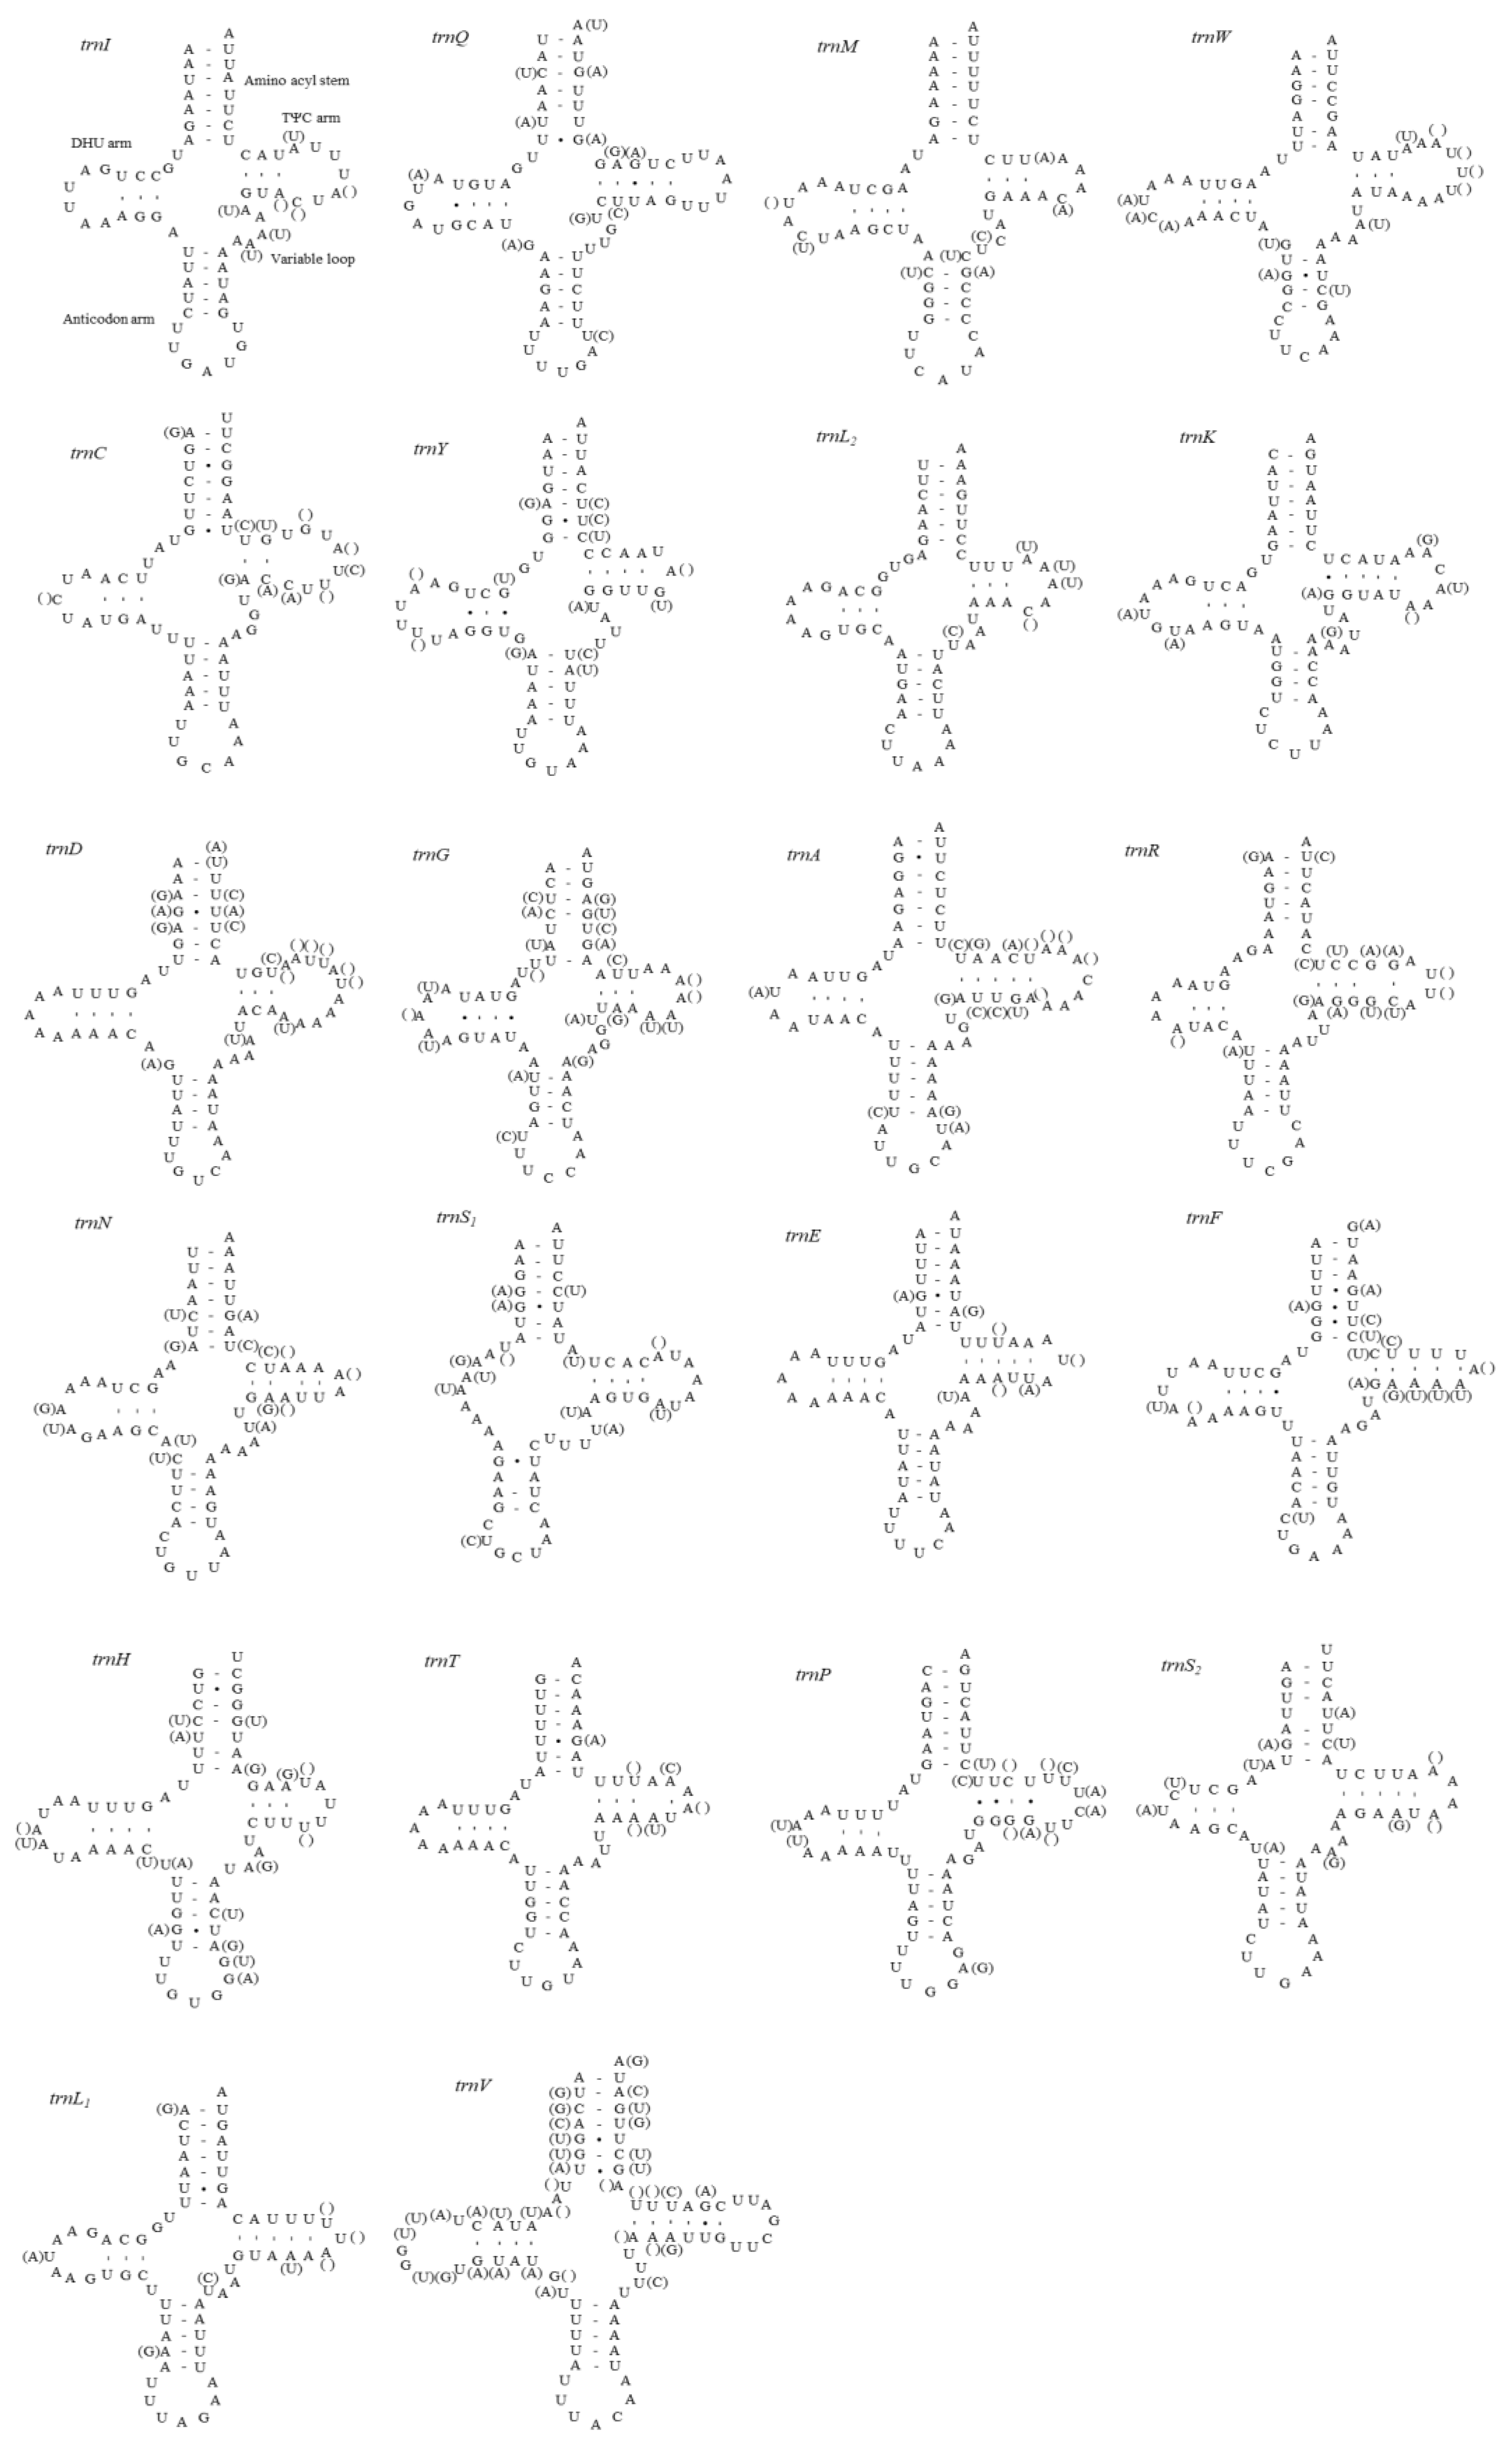
| Gene | Strand | Anticodon | Start Codon | Stop Codon | M. pruinosa (H1) | M. pruinosa (H3) | Salurnis marginella |
|---|---|---|---|---|---|---|---|
| trnI | + | GAT | 1–65 (65) | 1–65 (65) | 1–62 (62) | ||
| trnQ | − | TTG | 69–137 (69) | 69–137 (69) | 81–149 (69) | ||
| trnM | + | CAT | 137–202 (66) | 137–202 (66) | 149–214 (66) | ||
| ND2 | + | ATT | TAA | 203–1180 (978) | 203–1180 (978) | 215-1180 (966) | |
| trnW | + | TCA | 1179–1246 (68) | 1179–1246 (68) | 1179–1243 (65) | ||
| trnC | − | GCA | 1239–1302 (64) | 1239–1302 (64) | 1236–1295 (60) | ||
| trnY | − | GTA | 1310–1373 (64) | 1310–1373 (64) | 1296–1356 (61) | ||
| COI | + | ATC a/ATG b | TAA | 1374–2918 (1545) a | 1374–2918 (1545) a | 1362–2897 (1536) b | |
| trnL2 | + | TAA | 2921–2983 (63) | 2921–2983 (63) | 2898–2959 (62) | ||
| COII | + | ATA | TAA | 2984–3661 (678) | 2984–3661 (678) | 2960–3640 (681) | |
| trnK | + | CTT | 3672–3741 (70) | 3672–3741 (70) | 3641–3709 (69) | ||
| trnD | + | GTC | 3742–3810 (69) | 3742–3810 (69) | 3710–3772 (63) | ||
| ATP8 | + | ATT | TAA | 3811–3966 (156) | 3811–3966 (156) | 3773–3925 (153) | |
| ATP6 | + | ATG | T | 3960–4611 (652) | 3960–4611 (652) | 3919–4570 (652) | |
| COIII | + | ATG | TAA | 4612–5394 (783) | 4612–5394 (783) | 4571–5353 (783) | |
| trnG | + | TCC | 5401–5465 (65) | 5401–5465 (65) | 5355–5415 (61) | ||
| ND3 | + | ATG a/ATT b | TAA | 5467–5817 (351) a | 5467–5817 (351) a | 5451–5786 (336) b | |
| trnA | + | TGC | 5816–5883 (68) | 5816–5883 (68) | 5786–5848 (63) | ||
| trnR | + | TCG | 5901–5964 (64) | 5901–5964 (64) | 5849–5909 (61) | ||
| trnN | + | GTT | 5990–6054 (65) | 5990–6054 (65) | 5911–5973 (63) | ||
| trnS1 | + | GCT | 6056–6116 (61) | 6056–6116 (61) | 5972–6031 (60) | ||
| trnE | + | TTC | 6120–6184 (65) | 6120–6184 (65) | 6034–6095 (62) | ||
| trnF | − | GAA | 6197–6261 (65) | 6197–6261 (65) | 6094–6156 (63) | ||
| ND5 | − | ATG a/GTG b | TAA | 6268–7950 (1683) a | 6268–7950 (1683) a | 6156–7835 (1680) b | |
| trnH | − | GTG | 7952–8016 (65) | 7952–8016 (65) | 7836–7897 (62) | ||
| ND4 | − | ATG | TAG 1/T 2 | 8031–9362 (1332) 1 | 8031–9362 (1332) 1 | 7898–9221 (1324) 2 | |
| ND4L | − | ATG | TAA | 9362–9634 (273) | 9362–9634 (273) | 9223–9495 (273) | |
| trnT | + | TGT | 9637–9700 (64) | 9637–9700 (64) | 9498–9558 (61) | ||
| trnP | − | TGG | 9708–9773 (66) | 9708–9773 (66) | 9560–9622 (63) | ||
| ND6 | + | ATA | TAA | 9775–10275 (501) | 9775–10275 (501) | 9624–10121 (498) | |
| CytB | + | ATG | TAA | 10280–11404 (1125) | 10280–11404 (1125) | 10114–11235 (1122) | |
| trnS2 | + | TGA | 11420–11482 (63) | 11420–11482 (63) | 11235–11295 (61) | ||
| ND1 | − | ATG | TAA | 11492–12442 (951) | 11492–12442 (951) | 11289–12230 (942) | |
| trnL1 | − | TAG | 12444–12508 (65) | 12444–12508 (65) | 12232–12293 (62) | ||
| lrRNA | − | 12509–13734 (1226) | 12509–13734 (1226) | 12294–13497 (1205) | |||
| trnV | − | TAC | 13735–13807 (73) | 13735–13807 (73) | 13498–13567 (70) | ||
| srRNA | − | 13808–14524 (717) | 13808–14524 (717) | 13567–14290 (724) | |||
| A+T–rich region | 14525–16312 (1788) | 14525–16314 (1790) | 14291–16126 (1836) |
Publisher’s Note: MDPI stays neutral with regard to jurisdictional claims in published maps and institutional affiliations. |
© 2021 by the authors. Licensee MDPI, Basel, Switzerland. This article is an open access article distributed under the terms and conditions of the Creative Commons Attribution (CC BY) license (https://creativecommons.org/licenses/by/4.0/).
Share and Cite
Kim, M.J.; Lee, K.H.; Park, J.S.; Jeong, J.S.; Jeong, N.R.; Lee, W.; Kim, I. Complete Mitochondrial Genomes of Metcalfa pruinosa and Salurnis marginella (Hemiptera: Flatidae): Genomic Comparison and Phylogenetic Inference in Fulgoroidea. Curr. Issues Mol. Biol. 2021, 43, 1391-1418. https://doi.org/10.3390/cimb43030099
Kim MJ, Lee KH, Park JS, Jeong JS, Jeong NR, Lee W, Kim I. Complete Mitochondrial Genomes of Metcalfa pruinosa and Salurnis marginella (Hemiptera: Flatidae): Genomic Comparison and Phylogenetic Inference in Fulgoroidea. Current Issues in Molecular Biology. 2021; 43(3):1391-1418. https://doi.org/10.3390/cimb43030099
Chicago/Turabian StyleKim, Min Jee, Keon Hee Lee, Jeong Sun Park, Jun Seong Jeong, Na Ra Jeong, Wonhoon Lee, and Iksoo Kim. 2021. "Complete Mitochondrial Genomes of Metcalfa pruinosa and Salurnis marginella (Hemiptera: Flatidae): Genomic Comparison and Phylogenetic Inference in Fulgoroidea" Current Issues in Molecular Biology 43, no. 3: 1391-1418. https://doi.org/10.3390/cimb43030099
APA StyleKim, M. J., Lee, K. H., Park, J. S., Jeong, J. S., Jeong, N. R., Lee, W., & Kim, I. (2021). Complete Mitochondrial Genomes of Metcalfa pruinosa and Salurnis marginella (Hemiptera: Flatidae): Genomic Comparison and Phylogenetic Inference in Fulgoroidea. Current Issues in Molecular Biology, 43(3), 1391-1418. https://doi.org/10.3390/cimb43030099