
Measurement of Infrasound Components Contained in the Noise Emitted during a Working Wind Turbine
by
 , , , and
Tomasz Boczar
1,*, 
Dariusz Zmarzły
1,
Michał Kozioł
1,*,
Łukasz Nagi
1,
Daria Wotzka
1 and
and
Zbigniew Nadolny
2
1
Faculty of Electrical Engineering, Automatic Control and Informatics, Opole University of Technology, 45-758 Opole, Poland
2
Institute of Electrical Power Engineering, Poznan University of Technology, 60-965 Poznań, Poland
*
Authors to whom correspondence should be addressed.
Energies 2022, 15(2), 597; https://doi.org/10.3390/en15020597
Submission received: 3 December 2021
/
Revised: 11 January 2022
/
Accepted: 11 January 2022
/
Published: 14 January 2022
(This article belongs to the Special Issue Analysis and Prediction of Wind Turbine Noise)
Abstract
:The research reported in this paper involves the development and refinement of methods applicable to the measurement and analysis of infrasound signals generated by the operation of wind turbines. In particular, the presentation focuses on the use of a new system that is applied for simultaneous recording of acoustic signals in the low-frequency range emitted by wind farms in three independent and identical measurement setups. A comparative analysis of the proposed new system was made with the Brüel & Kjaer measurement, a commonly used methodology, which meets the requirements of the IEC 61400-11 standard. The paper focuses on the results of frequency and time-frequency analysis of infrasound signals recorded throughout the operation of a wind turbine with a rated capacity of 2 MW. The use of a correlated system with three simultaneous measurement systems can be a new and alternative measurement method that will eliminate the drawbacks of previous approaches.
1. Introduction
Infrasound is an acoustic signal that occurs both naturally as well as associated with human activities. Among the sounds that are generated by human-made machines or related equipment, we can distinguish land, sea and air vehicles, various types of devices, as well as energy equipment, including wind turbines (WT) [1,2,3]. The issues related to the detection and description of the properties of infrasound generated by the operating WT is important not only for mere cognitive or scientific purposes but also for investigating the potential adverse health effects, as is often claimed by those opposing wind farm installations [4,5]. The measurements of acoustic signals within the range of infrasounds are performed by numerous research institutes and scientific centers around the world. The task of adequate measurements followed by the analysis of infrasound signals is not trivial, as in the vicinity of the tested object there are often other numerous sources that often generate high amplitude acoustic signals in the low-frequency range. It should be borne in mind that propagation of nonlinear infrasound waves ranges from 17 Hz to 340 Hz and there are very poorly damped and, therefore, can travel over relatively long distances. In addition, apart from sources of infrasonic signals such as road vehicles, passing trains or agricultural machines, which should be taken into account when measurements are performed, there may be other more natural sources of their emission, such as thunder, waves on the water surface, wind gusts at high speeds meeting obstacles (sweeping phenomenon), etc. [6,7,8,9]. In the case of wind farms comprising many WT, which can additionally be varied in terms of design, capacity and service life, the varied nature of generated infrasound should be taken into account when measurements are performed and assessment is made of the obtained results. An important issue is associated with adequate identification of noise generated during measurements, often of relatively large amplitudes concerning signals measured and practical from the diagnostic point of view. However, we need to note that in the case of measurements of infrasound resulting from the operation of WT, depending on the country, different methodologies are applied for their registration, analysis and assessment of the potential impact. The level of knowledge regarding infrasound generated both by individual WT and by operating wind farms is varied and depends on the types of meters and applied measurement systems, as well as on the methodology adopted for measurement and analysis. Thus, objective verification of results presented in prior studies is significantly impeded and sometimes impossible when the comparative analysis is performed, as there is a lack of a comprehensive approach to the conditions of the tests and their authors often do not provide crucial information on the parameters of the systems used or the measurement procedures used and methods of processing and analysis of recorded signals [10,11].
In a paper by Zagubien et al. [12], a description is provided of infrasound measurements originating from a working turbine using two pressure meters located in a single line, at a distance of 50 m and 250 m from the WT. The location of the meters was selected in such a way that their orientation was always in the direction opposing the blowing wind to obtain maximum amplitudes of the recorded signals. The problem with this solution is that if the wind direction varies throughout the measurements, the location of the meters should be adjusted and the measurement system needs to be set up from the beginning, followed by its calibration. It should also be noted that infrasound signals propagate in different directions and not only in the direction of the wind, which causes that the measurements performed are not very accurate and the obtained results are ambiguous in interpretation. In addition, Malec et al. [13,14] and Katinas et al. [15] describe measurements of the level of low-frequency noises, captured with a device located at an appropriate distance from the turbine, as per the applicable standard IEC 61400-11 for measuring acoustic signals emitted by operating wind turbines in the audible range. In this case, the variable direction of the blowing wind may also affect the recorded signals in the field of infrasound. Malec et al. [13] assessed the impact of the type of WT generator (synchronous vs. asynchronous) on the output of infrasound signal measurements. With an asynchronous generator, the problem of interference of the recorded signals could also occur, as the investigated turbine was operated in a power plant comprising a setup of 15 turbines. The proximity of other operating devices that are also responsible for generating infrasound may interfere with the recorded signal. Usually, WT are located at such distances apart that they do not interfere in the aerodynamic conditions of their operation; however, the generated acoustic noise in the low-frequency signal range has not been comprehensively analyzed so far. The results of many years of investigations concerned with the influence of periodic wind turbine noise on infrasound array measurements are reported in [8]. Katinas et al. [15] showed that the level of infrasound generated by a wind turbine can be comparable to the background level even when the wind speed is 12 m/s, which provides optimal working conditions by most wind turbines currently available on the market. In this case, the influence of infrasound may be underestimated and measurements applying a single setup may be inaccurate and offer biased results. Because some of the prior studies describing the measurements of infrasound generated by WT refer to research on their effect on the environment [16], it is important to get to know the mechanism related to their generation and propagation in the space directly from their source in as many directions as possible. Okada et al. [17] found that the highest noise levels, including infrasound, are recorded when the measuring instruments are located in the direction of the wind blowing in the direction from the turbine.
Other authors [18,19] have reported the results of studies into the propagation of acoustic noise generated by wind turbines. It is asymmetrical. It assumes the pattern of partially interpenetrating rings. The noise levels in the upwind direction are slightly higher than for the downwind, particularly at high frequencies. On the other hand, on the side of the turbine, the signal propagation range is smaller and irregular. At the same time, we should note that the dynamics of wind energy development in a given area may be influenced by the negative attitude of local communities caused, inter alia, by the lack of reliable information on the actual potential harmfulness of infrasound noise from operating wind turbines [20].
Another important issue for infrasound evaluation is related to the processing and adequate analysis of infrasound signals recorded by measuring systems. In many cases, the analysis involves the optimal separation of low-frequency signals from the installations that generate them in the recorded data [21]. Often the level of infrasound signal is lower than the levels of recorded noise [22]. Measurements applying a single setup mean that the microphone registers both the signals from the turbines and the acoustic background and under certain conditions, it is not viable to distinguish these signals. The mere registration of the acoustic background before the actual measurements and its content in the obtained results does not always offer the anticipated effect, since there is a real difficulty in distinguishing both signals, e.g., when the wind speeds, in relation to the analyzed WT (at the level of its blades), exceed 12 m/s [15]. Correlated measurements taken from the three points can help to identify infrasound generated by WT and, consequently, assist in filtering out background signals. Signal analysis is performed in many ways and its results have been presented in many papers. For example, to classify infrasonic signals, Chilo et al. proposed a method of filtering and extracting features from infrasound data [23] and Liu et al. presented a new classification method based on the Hilbert–Huang transform (HHT) [24]. However, this method is not suitable for real-time data monitoring and analysis of infrasound signals since the data extraction method is complex and the runtime of the algorithm takes a long time. The energy spectrum forms one of the most frequently applied parameters. Marcillo et al. [25] analyzed power spectrum density (PSD), identified the TS (thickness sound) frequency as 0.879 Hz and then searched for that frequency in each determined PSD. This method was 95% effective in detecting WT signals.
PULSE system with dedicated microphones and the Bruel & Kjaer (B&K) LAN-XI 24 bit data acquisition card forms one of the most common devices applied for professional infrasound measurements [26] and which can also be incorporated with microphones with piezoelectric sensors MG M360 (1/4”) [27]. The problem with this type of system is related to the fact that the wind speed and its direction at ground level may differ significantly from the conditions at the height of the hub and rotating blades of a wind turbine [28]. A system using three infrasound measuring setups, placed in different directions, can lead to the elimination of the interference noise generated at the ground level. The recommended normative provisions—IEC 61400-11—provide a way in which the impact of wind on measuring microphones can be limited by the use of windscreens made of polyurethane foam or a special fabric [29].
The aim of the scientific and research work reported herein was to develop and test a new methodology applicable for to the measuring low-frequency and infrasonic signals generated by the operation of WT using an innovative, mobile system that allows wireless registration simultaneously in three places. The functional assumptions of the system are presented and infrasound signals were measured under the actual operating conditions of a WT. The analysis of recorded data was also carried out using signal processing tools that were developed in the Matlab environment.
The use of a correlated system with three simultaneously measuring setups may constitute a new and alternative measurement method that will eliminate the shortcomings of previous approaches. This innovative measurement methodology may also contribute to a better and more accurate understanding of the generation mechanisms and the propagation of infrasound signals around WT.
2. State of the Art
Currently, the method described in the PN-EN 61400-11 standard is used to measure infrasound generated by WT and it is applied to assess noise from WT in the audible range. The standard offers the scope of measurements to be extended to infrasound (Annex A.2—attachment to the PN-EN 61400-11 standard); however, the exact approach to their measurement is not defined. The method described in the standard provides the repeated determination of the level of acoustic power emitted by WT, taking into account wind speed variation. The measurement methodology is based on mounting the microphone on a suitable, standardized reflecting surface and placing it at ground level at a suitable distance behind the turbine. This distance is determined based on WT parameters, such as tower height and rotor diameter. On the other hand, the meteorological conditions are recorded by the weather station, which is installed in front of the turbine at a height of 10 m. The exact location of the weather station is adopted following the guidelines contained in the standard. Figure 1 shows a general diagram of the measurement methodology based on the assumptions contained in the standard above.
The standard defines in detail the requirements for both measurement procedures and measuring equipment, as well as methods of analyzing the obtained results, assessing the uncertainty of the obtained results and the recorded data. The ability to perform measurements following the assumptions of the standard minimizes the wind effect, deflections and other sources, which are the main factors that may interfere with recordings.
The measuring system used herein (Figure 2) meets the requirements of the standard and is comprised of the following elements:
- − module with a four-channel measuring card LAN-XI type 3050-A-60 series PULSE (B&K),
- − laptop with dedicated software,
- − microphone type 4190 with embedded pre-amplifier type 2669L (B&K),
- − sound calibrator type 4231 (B&K),
- − mobile Vantage Pro 2 weather station (Davis).
The LAN-XI type 3050-A-060 m is a professional tool used for measuring sound pressure, noise level and vibrations. Its range of implementation is very wide, starting from typical acoustic tests, such as noise measurements, determining the level of acoustic power, making noise maps using the beamforming technique, testing the acoustic properties of materials and determining the acoustic parameters of rooms and it extends to specialized acoustic tests, including machine diagnostics, modal analysis and electroacoustic tests of acoustic transducers. It enables measurements of acoustic signals in the frequency range from 0.7 Hz to 51.2 kHz, with a sampling rate of 131 kS/s and a resolution of 24 bits.
A computer with dedicated software was used to operate the applied LAN-XI type 3050-A-60 m, which was coupled to the measurement system with a LAN cable. All operating parameters are defined using the PULSE LabShop application, which, in addition to the possibility of precise configuration of the device, enables the recording of measured signals and their offline processing.
The microphone used is dedicated to very accurate measurements in the free field. Its lower cut-off frequency is 1.2 Hz and the frequency response is linear within ±3 dB from 1.2 Hz to 20 kHz. This microphone is characterized by a high sensitivity of 50 mV/Pa and a dynamic range from 15 to 148 dB.
Additionally, during the recording of infrasound signals, wind protection was applied and a round reflecting surface with a diameter of 1 m was used, as established by the B&K UA-2133 setup, designed for WT noise measurements as per the PN-EN 61400-11 standard.
3. Characteristics of the Proposed Measuring System
This system was developed within the context of a scientific project (“Numerical and experimental analysis of low-frequency acoustic phenomena generated by the operation of wind turbines”), that developed the requirements for the functionality and technical parameters of a measurement system applicable to recording low-frequency signals in the 0.5 Hz to 200 Hz bandwidth. The measuring system was built by KFB ACOUSTICS Sp. z o.o and called INFRA. This system allows for synchronized recordings of acoustic signals in the low-frequency range, as well as, simultaneously capturing wind speed and direction data from two measurement stations (ST1 and ST2). The synchronization of measurement setups and data transmission is performed wirelessly, which is an innovative solution in this type of measurement system. The general diagram of the measurement system is presented in Figure 3.
The INFRA measurement system includes the following components: a base station, three wireless measuring stations (ST_1, ST_2, ST_3) and a laptop installed with dedicated software for data acquisition and on-line system configuration.
The base station consists of the following functional elements: a multi-channel measurement data acquisition card, a Ubiquiti BULLET M2 Wi-Fi router and a battery power system. These elements were enclosed in a dedicated case resistant to moisture, dust and mechanical damage. In addition, the base station is equipped with a ProEter10 omnidirectional antenna (from CyberBajt), with vertical, with vertical polarization, operating at the 2.4 GHz frequency. During data registration, the antenna is installed on a telescopic mast at a height of approx. 2 m, which ensures wireless communication with the base station, providing a guaranteed data transmission speed of 100 Mbps+. The equipment ensures stable communication between the base station and the measuring stations located in the field, within a radius of up to 300 m, without the necessity of providing additional signal amplifiers. The general diagram of the base station is presented in Figure 4.
Each measuring station includes the following elements: a GRAS 46AZ microphone with an integrated preamplifier, a four-channel 24-bit measuring card, a network card for wireless transmission of recorded signals via Wi-Fi, which are located in a specially designed water- and dustproof, impact-resistant case, made of aluminum and polypropylene, together with a battery power supply system. Moreover, two of the measuring stations (ST_1, ST_2) are equipped with a wind direction sensor and an anemometer, for measuring weather conditions directly at a given location, with a sampling interval of ten times per second. The general view of the measuring station is presented in Figure 5. The photo of the measuring station is presented in Figure 6. For data transmission, a Cyberbajt LineEter 19 directional antenna was applied, featuring an energy gain of 19 dBi, that operates in the 2.4–2.5 GHz frequency range. The antenna horizontal beamwidth is 25° for −3 dB and 20° for −3 dB for the vertical plane. All measurement connectors are coupled to the National Instruments cDAQ-9191 measurement module, to which the NI 9234 four-channel 24-bit measurement card is connected. This card has a standard, built-in anti-aliasing filter for each of the four channels, which automatically adjusts to the current frequency sampling. The maximum value of the sampling frequency for such devices is 51.2 kHz.
The system is suitable for recording acoustic signals through three measuring stations that can be installed in various locations in relation to the signal source. In addition to the simultaneous measurement of low-frequency signals, the system offers simultaneous acquisition of wind speed and direction, separately at two of the measuring setups. These wind speed sensors enable measurement in the range from 0 m/s to 25 m/s with an accuracy of ± 0.1 m/s. Depending on the type of microphone, the INFRA system is capable of recording both acoustic signals in the low-frequency range and also audible noise.
To enable precise recording of infrasound, condenser microphones were utilized, in which variations in sound pressure lead to membrane vibrations. Their design is based on a kind of condenser with a single movable lining, which varies the size of its electric capacity following changes in pressure. Since the microphone is pre-polarized and its facings are coupled together by a resistor, the proportional voltage changes obtained are the output signal from the microphone. The applied GRAS 46AZ condenser microphone (G.R.A.S. Sound & Vibration A/S) was applied to perform measurements of acoustic signals in the range from 0.5 Hz to 20 kHz. The microphone is integrated with the 26CI type preamplifier in a common housing and has an impulse response optimized for pressure measurement in a diffusive, dispersed field. Table 1 contains a summary of the basic values of the technical parameters of microphones that were used during field tests.
Additionally, throughout all measurement series, in each of the three measurement setups, two protective screens were used, i.e., the inner one located directly on the tip of the microphone and the outer one, see parts marked as A and E in Figure 2 and Figure 7. Each of the microphones along with the screens was placed on the round wooden plate capable of reflecting mechanical waves, 1 m in diameter (see part marked as B in Figure 6 to the right).
To ensure and maintain the quality of measurements required by the standard IEC 61400-11, each microphone was calibrated before and after each measurement series. In the calibration process, the acoustic calibrator type 4231 class 1 from B&K was used. The procedure was performed using a 1 kHz signal at the level of 94 dB. The accuracy of the generated sound level was ±0.2 dB. However, the accuracy of the generated frequency remained at the level of ±0.1%, with distortions of less than 1%. The calibration process was carried out in accordance with the system’s manufacturer specifications and was performed separately for each of the three measurement paths.
The Wi-Fi technology implemented in the measurement system offers communication between the measuring points and the base station over a distance of at least 300 m in free space. This eliminates the need for long installations, increases the range of recordings and, moreover, allows for comparative measurements made simultaneously in any three directions relative to the source of the signal. The measurement data was transferred using the standard TCP/IP data transmission protocol.
During the measurements carried out with the INFRA system, an external weather station type 6250EU Vantage VUE (from Davis) was also used. It comprises a set of external sensors that enables the measurement of the following weather parameters: wind direction, wind speed in the range from 1 m/s to 80 m/s with an accuracy of 0.5 m/s; wind direction sensor, air temperature in the range from −40 °C to +65 °C with an accuracy of ±0.1 °C; atmospheric pressure in the range from 540 hPa to 1100 hPa with an accuracy of 0.1 hPa; precipitation in the range from 1 to 1016 mm/h with an accuracy of 0.2 mm/h and relative air humidity from 0 to 100% with an accuracy of 1%. The Davis weather station was positioned as per the standard IEC 61400-11, as shown in Figure 1. Its most significant drawback is a sampling frequency of 0.31 Hz. Communication between the set of sensors and the console is performed wirelessly, within the radio bandwidth.
4. Measurement Methodology
The operating WT under study had a 2 MW capacity, total height of 155 m, blade span of 90 m and nacelle height of 110 m. The infrasound measurements were carried out at three different locations around the operating WT. During the measurements, the weather conditions were relatively constant. The temperature was in the range 7–11 °C, air humidity 71–80%, atmospheric pressure from 999.8 to 1001.7 hPa. Wind speed and direction values are presented along with the infrasound data in the next section.
Additionally, for comparative purposes, reference measurements were simultaneously carried out with a single-channel system using a LAN-XI type 3050-A-60 m from the PULSE series. The additional measuring point was positioned as per the standard IEC 61400-11, at a distance of 155 m from the WT (see Figure 1). Due to the comparison of two different measurement systems, these systems were synchronized using a software clock.
The turbine under the study is located in southern Poland, in a lowland area and is located in zone IV, i.e., area that is not very favorable in terms of average annual wind speed values. The general view of the tested turbine is shown in Figure 8a and the relative positions of the measuring stations are shown in Figure 8b. The recording of infrasound was carried out continuously. Although the infrasound recordings were carried out continuously, specific data acquisition covered a series of periods with a duration of 60 s, which were synchronized in all three measuring stations.
Background noise measurements were performed for a wind speed equal to 0 m/s, when the turbine stalled. An example of the sound pressure level (SPL) of the background noise (designated on the basis of formula (1)), as measured by ST_1, is shown in Figure 9. For analysis purposes, all signals recorded during the occurrence of other possible sources of low-frequency signals, which include agricultural machinery, specialized vehicles used in the wood industry, as well as cars used by WT service operations, were excluded from analysis.
5. Infrasound Signal Analysis and Discussion of the Results
Acoustic signals recorded during field measurements were subjected to analysis in the frequency domain. The recorded signals were analyzed in the range of low frequencies, i.e., the bandwidth from 0.5 Hz to 200 Hz. Further, the infrasound bandwidth from 0.5 Hz to 20 Hz was subjected to a more detailed analysis. For this purpose, the power spectral densities (PSD) were determined from the registered pressure signals, using the Welch method and the Hamming window of width N = 512 × 10³. The assumed sampling frequency was equal to Fs = 51.2 kHz.
Figure 10 shows examples of two-dimensional PSD, covering a 15 min measurement, as calculated for each of the three INFRA measuring stations, as well as for the PULSE system. Comparative analysis of the signal features can thus be performed among the 4 measuring points. Characteristics from the INFRA stations show similar acoustic events, with slight differences in power for individual frequency ranges. Signals recorded by the PULSE station differ significantly. In particular, the calculated values have lower power, which is due to the much greater distance from the turbine. The signals registered with PULSE appear to have a frequency component around 16 Hz and equally strong components in the 40–60 Hz range, while the INFRA recorded signals show only weak power components in this range. In addition, differences may result from the transmission characteristics of the measurement transducers. In the vicinity of 12–14 min, a characteristic frequency shift appears, which, as further analyses will show, is due to a change in wind speed.
Figure 11 shows the wind speed and direction gathered by the Davis system and INFRA stations 1 and 3, within the same 15 min measurement interval. As mentioned earlier, data acquired from a standard weather station do not show rapid changes in wind speed that affect the frequency components of infrasound recorded by the microphones. Stations ST_1 and ST_2 recorded similar velocities, but stronger winds occurred at location ST_1 around the 7–8 min mark. Although weather station ST_3 did not record a similar increase in wind power at this time, the microphones detected a frequency shift. The characteristic shift may be due to an increase in wind speed up to 10 m/s. Visual analyses of the images do not allow a precise verification of the dependence or correlation. Therefore, in the next section, the authors’ method of signal processing is presented, thus providing precise verification of a correlation between existing wind conditions and the frequency component output from the WT.
Figure 12 shows two-dimensional PSD distributions, for a 70 min measurement interval and for each of the three INFRA measuring stations, allowing for a comparison of the signal characteristics among the different positions around the WT. One can compare the signal characteristics gathered by the devices, located at various positions around the turbine. The highest powers that were recorded during the hourly measurements exceeded 60 dB. Fluctuations of frequency components in the range of 15–27 Hz appear to be characteristic. Sometimes there are fades of these components, but there are two of them that are definitely in the foreground. Station ST_2 has a stronger component around 25 Hz, while ST1 and ST3 recorded equal power for both components. The ST_2 and ST_1 diagrams also show high power in the range up to 9 Hz, while ST_3 does not show these components.
In the analyses, the determined values were related to the sound pressure level (SPL) using Equation (1).
where: s—the measured signal [Pa].
Since signal analysis based on spectrograms alone is not very accurate, a customized signal analysis method was developed. Firstly, the set of gathered PSD waveforms was subjected to regression analysis using the M(f) function defined by Equation (2). This enabled the estimation of the trend in the calculated spectra, which was then subtracted from the original SPL Equation (3). The regression procedure involved the Least Squares and the Nelder Mead Simplex methods for model parameters estimation and optimization.
where:
—frequency [Hz],
—parameters of the model M.
The model accuracy was calculated using the norm δ defined by Equation (4).
where:
δ—the value of the norm,
ŷi—an estimate of the regression function,
yi—empirical data,
n—number of samples.
The proposed model is used to determine the trend of the analyzed spectrum in order to separate significant components of this spectrum. This approach makes it possible to automate the process of analyzing this type of signals with algorithms that will more effectively identify significant frequency components. Figure 13 shows a one-minute SPL-referenced measurement of acoustic signals and the corresponding detrended SPLd signal, in the frequency range of 10 to 200 Hz. The regression model is marked with a thick solid line. Figure 14 shows the same signal from 0.1–40 Hz. It can be observed that the proposed model fits the actual trend with high accuracy and is furthermore insensitive to frequencies significantly prominent in the spectrum. Based on the obtained detrended data, it was possible to determine the locally dominant frequency components, which is discussed later in this paper.
Figure 15 shows detrended PSD signals for the four measuring points registered within a 15 min interval, which correspond to the data presented in Figure 10. It can be observed that the frequency components resulting from the trend have been eliminated. Because the regression process is automated, that is, calculated automatically through a programming script, spurious fits occur for some signal samples. This is evident, for example, in Figure 15a at minute 11, in Figure 15b at minute 13 and in Figure 15d at minute 3. Therefore, the developed procedure should have been performed on as large a sample of data as possible to ensure the statistical significance of the calculated relationships.
As mentioned earlier, the infrasound signal measurements obtained with the INFRA system show some correlation between the change in wind speed and the recorded frequency shift. This confirms the assumption that the recorded infrasound signals are generated by the rotating blades of the wind turbine. Similar results were recorded with the PULSE system. In order to make an accurate analysis, the most relevant peaks were indicated in the trendless signals. In particular, the ‘findpeaks’ function, available in the MATLAB programming environment, was used with the following parameters: ‘MinPeakHeight’ = 3.5 (minimum strength of the SPLd signal), ‘MinPeakDistance’ = 0.1 (distance between the frequency components is minimum equal to 0.1 Hz), ‘MinPeakProminence’ = 1 (minimal pulse width), ‘NPeaks’ = 12 (indicate no more than 12 components).
An example of the result of this calculation is shown in Figure 16. The developed procedure designates an array containing frequency components satisfying the specified conditions (‘MinPeakHeight’, ‘MinPeakDistance’, ‘MinPeakProminence’, ‘NPeaks’) for all measurement samples collected by the three INFRA measurement stations.
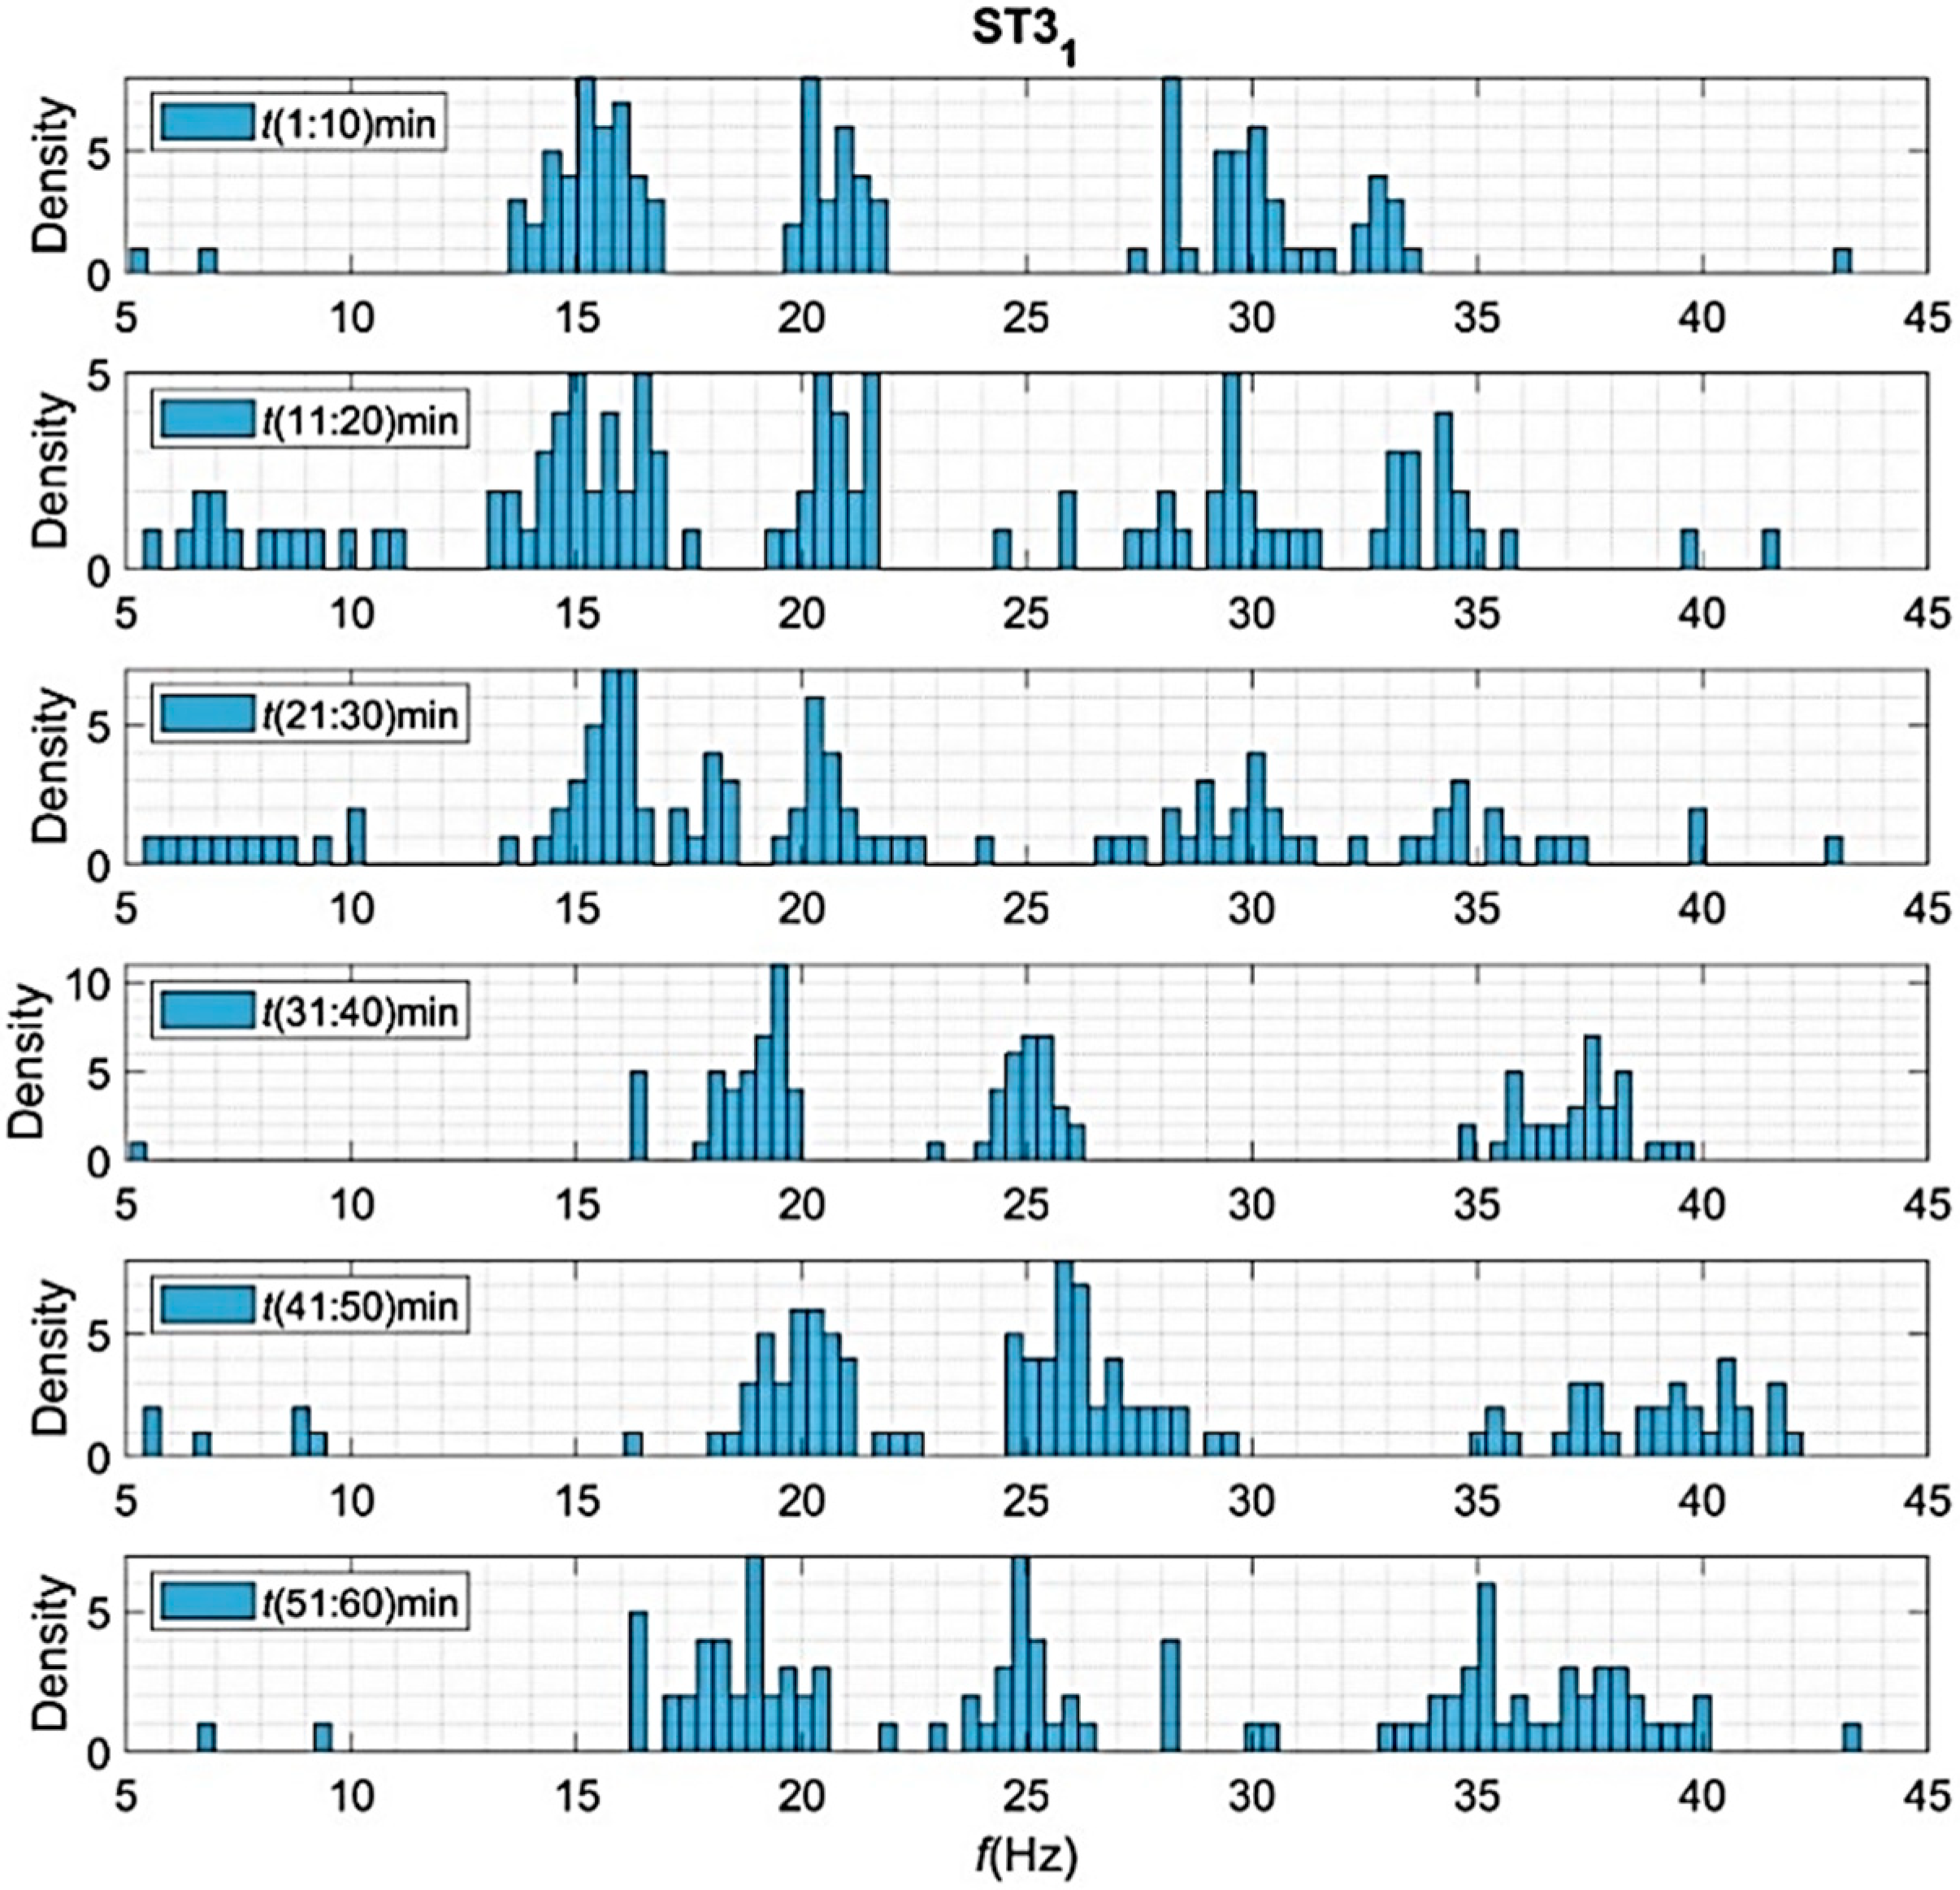
Next, based on the obtained matrix of the most significant frequency components, histograms were generated, which illustrate the frequency of occurrence of particular frequency components in 10 min intervals, for 60 min of measurements on a given measurement day. Figure 17, Figure 18 and Figure 19 presents the gathered histograms. In addition, the average wind speed was calculated for the 10 min measurement intervals and these values were marked in the legend of the images. It can be observed which frequency components occurred most often and how they correlated with changes in wind speed.
Based on the presented analyses, a close relationship was observed between the wind speed and the frequency components of infrasound noise emitted by the WT under consideration. When wind velocity increases, the components shift towards higher frequencies. The rotor speed of the turbine increases and the frequency of the emitted acoustic signals increases as well.
The feasibility of simultaneous and synchronous analysis of infrasound signals registered in different locations in relation to the investigated WT opens up new research and cognitive possibilities for the occurrence and propagation of this type of signal. In addition to the previously discussed possibilities of determining the characteristic components, it is also possible to interpret the intensity of infrasonic wave propagation and their variability concerning the location of the tested wind turbine.
6. Conclusions
The new methodology of low-frequency signal recording, based on a wireless system using three measurement setups proposed in the study offers the possibility of recording signals emitted by a WT simultaneously at three different measurement points and stable communication in the field, within a radius of up to 300 m from the base station. This type of testing is not feasible using typical measuring equipment by application of wired communication. The use of signal processing tools made it possible to determine the so-called waveforms, modified spectra, based on which it is possible, for example, to automatically determine the dominant frequencies in the selected spectra. This methodology significantly extends the existing research area related to the recording and analysis of infrasound generated by the operation of WT and the conducted research confirmed its feasibility for measurements carried out during normal operation of wind installations, often in very difficult field conditions. In addition to analyzing the noise emitted by wind turbines, this method has potential applications in the diagnosis of their technical condition.
Author Contributions
Conceptualization, T.B., D.Z. and D.W.; methodology, T.B. and D.Z.; validation, D.W., Ł.N. and M.K.; formal analysis, D.Z. and D.W.; investigation, T.B., M.K., D.W. and Ł.N.; data curation, M.K., Ł.N. and D.W.; writing—original draft preparation, T.B., D.Z., M.K, Ł.N., D.W. and Z.N.; writing—review and editing, M.K. and D.W.; visualization, D.Z. and D.W.; supervision, T.B.; project administration, T.B. and D.W. All authors have read and agreed to the published version of the manuscript.
Funding
This research was co-financed by the National Science Centre, Poland (NCN) as a part of the OPUS Research Project No. 2015/17/B/ST8/03371.
Conflicts of Interest
The authors declare no conflict of interest.
References
- Vincent, P.; Larsonnier, F.; Rodrigues, D.; Durand, S. Analytical modelling and characterisation of an infrasound generator in the air. Appl. Acoust. 2019, 148, 476–483. [Google Scholar] [CrossRef]
- Cotté, B. Extended source models for wind turbine noise propagation. J. Acoust. Soc. Am. 2019, 145, 1363–1371. [Google Scholar] [CrossRef] [PubMed] [Green Version]
- Boczar, T.; Zmarzły, D.; Kozioł, M.; Wotzka, D. The application of time-frequency ridge transformation for the analysis of infrasound signals generated by wind turbines. Appl. Acoust. 2021, 177, 107961. [Google Scholar] [CrossRef]
- Boczar, T.; Zmarzły, D.; Kozioł, M.; Wotzka, D. The use of advanced signal processing methods for the analysis of infrasound generated by high-power wind turbines. Prz. Elektrotechniczny 2020, 96, 68–75. [Google Scholar]
- Pohl, J.; Gabriel, J.; Hübner, G. Understanding stress effects of wind turbine noise—The integrated approach. Energy Policy 2018, 112, 119–128. [Google Scholar] [CrossRef]
- Le Pichon, A.; Vergoz, J.; Herry, P.; Ceranna, L. Analyzing the detection capability of infrasound arrays in Central Europe. J. Geophys. Res. 2008, 113, D12115. [Google Scholar] [CrossRef] [Green Version]
- Green, D.N.; Matoza, R.S.; Vergoz, J.; Le Pichon, A. Infrasonic propagation from the 2010 Eyjafjallajökull eruption: Investigating the influence of stratospheric solar tides. J. Geophys. Res. Atmos. 2012, 117, D21202. [Google Scholar] [CrossRef] [Green Version]
- Pilger, C.; Ceranna, L. The influence of periodic wind turbine noise on infrasound array measurements. J. Sound Vib. 2017, 388, 188–200. [Google Scholar] [CrossRef]
- Batubara, M.; Yamamoto, M. Infrasound Observations of Atmospheric Disturbances Due to a Sequence of Explosive Eruptions at Mt. Shinmoedake in Japan on March 2018. Remote Sens. 2020, 12, 728. [Google Scholar] [CrossRef] [Green Version]
- Boczar, T.; Zmarzły, D.; Kozioł, M.; Wotzka, D. Analiza wpływu czynników zewnętrznych na wyniki pomiarów infradźwięków emitowanych przez turbiny wiatrowe (Analysis of the influence of external factors on the measurement results of infrasounds emitted by wind turbines). Przegląd Elektrotechniczny 2020, 1, 115–122. [Google Scholar] [CrossRef]
- Møller, H.; Pedersen, C.S. Low-frequency noise from large wind turbines. J. Acoust. Soc. Am. 2011, 129, 3727–3744. [Google Scholar] [CrossRef] [Green Version]
- Zagubień, A.; Wolniewicz, K. The impact of supporting tower on wind turbine noise emission. Appl. Acoust. 2019, 155, 260–270. [Google Scholar] [CrossRef]
- Malec, T.; Boczar, T.; Wotzka, D.; Frącz, P. Comparison of low frequency signals emitted by wind turbines of two different generator types. E3S Web Conf. 2017, 19, 01001. [Google Scholar] [CrossRef] [Green Version]
- Malec, T.; Boczar, T.; Wotzka, D.; Kozioł, M. Measurement and Analysis of Infrasound Signals Generated by Operation of High-Power Wind Turbines. Energies 2021, 14, 6544. [Google Scholar] [CrossRef]
- Katinas, V.; Marčiukaitis, M.; Tamašauskienė, M. Analysis of the wind turbine noise emissions and impact on the environment. Renew. Sustain. Energy Rev. 2016, 58, 825–831. [Google Scholar] [CrossRef]
- Blumendeller, E.; Kimmig, I.; Huber, G.; Rettler, P.; Cheng, P.W. Investigations on Low Frequency Noises of On-Shore Wind Turbines. Acoustics 2020, 2, 343–367. [Google Scholar] [CrossRef]
- Okada, Y.; Yoshihisa, K.; Hyodo, S. Directivity of amplitude modulation sound around a wind turbine under actual meteorological conditions. Acoust. Sci. Technol. 2019, 40, 40–48. [Google Scholar] [CrossRef] [Green Version]
- Wasala, S.H.; Storey, R.C.; Norris, S.E.; Cater, J.E. Aeroacoustic noise prediction for wind turbines using Large Eddy Simulation. J. Wind Eng. Ind. Aerodyn. 2015, 145, 17–29. [Google Scholar] [CrossRef]
- Zhao, D.; Han, N.; Goh, E.; Cater, J.; Reinecke, A. Aeroacoustics of wind turbines. In Wind Turbines and Aerodynamics Energy Harvesters; Zhao, D., Han, N., Goh, E., Cater, J., Reinecke, A., Eds.; Elsevier: Amsterdam, The Netherlands, 2019; pp. 463–491. ISBN 978-0-12-817135-6. [Google Scholar]
- Igliński, B.; Iglińska, A.; Koziński, G.; Skrzatek, M.; Buczkowski, R. Wind energy in Poland—History, current state, surveys, Renewable Energy Sources Act, SWOT analysis. Renew. Sustain. Energy Rev. 2016, 64, 19–33. [Google Scholar] [CrossRef]
- Hessler, G.F.; Hessler, D.M.; Brandstätt, P.; Bay, K. Experimental study to determine wind-induced noise and windscreen attenuation effects on microphone response for environmental wind turbine and other applications. Noise Control. Eng. J. 2008, 56, 300. [Google Scholar] [CrossRef]
- Liu, X.; Bo, L.; Veidt, M. Tonality evaluation of wind turbine noise by filter-segmentation. Measurement 2012, 45, 711–718. [Google Scholar] [CrossRef]
- Chilo, J.; Jabor, A.; Liszka, L.; Eide, A.J.; Lindblad, T.; Bergkvist, L.P.N.-O.; Stahlsten, T.; Andersson, B.L.; Karasalo, I.; Cederholm, A. Filtering and extracting features from infrasound data. In Proceedings of the 14th IEEE-NPSS Real Time Conference, Stockholm, Sweden, 4–10 June 2005; p. 5. [Google Scholar]
- Liu, X.; Li, M.; Tang, W.; Wang, S.; Wu, X. A New Classification Method of Infrasound Events Using Hilbert-Huang Transform and Support Vector Machine. Math. Probl. Eng. 2014, 2014, 456818. [Google Scholar] [CrossRef] [Green Version]
- Marcillo, O.; Arrowsmith, S.; Blom, P.; Jones, K. On infrasound generated by wind farms and its propagation in low-altitude tropospheric waveguides. J. Geophys. Res. Atmos. 2015, 120, 9855–9868. [Google Scholar] [CrossRef]
- Zajamšek, B.; Hansen, K.L.; Doolan, C.J.; Hansen, C.H. Characterisation of wind farm infrasound and low-frequency noise. J. Sound Vib. 2016, 370, 176–190. [Google Scholar] [CrossRef]
- Ryi, J.; Choi, J.-S.; Lee, S.; Lee, S. A full-scale prediction method for wind turbine rotor noise by using wind tunnel test data. Renew. Energy 2014, 65, 257–264. [Google Scholar] [CrossRef]
- Gallo, P.; Fredianelli, L.; Palazzuoli, D.; Licitra, G.; Fidecaro, F. A procedure for the assessment of wind turbine noise. Appl. Acoust. 2016, 114, 213–217. [Google Scholar] [CrossRef]
- van den Berg, G.P. Wind-induced noise in a screened microphone. J. Acoust. Soc. Am. 2006, 119, 824. [Google Scholar] [CrossRef]
- Boczar, T.; Zmarzły, D.; Kozioł, M.; Wotzka, D. Application of Correlation Analysis for Assessment of Infrasound Signals Emission by Wind Turbines. Sensors 2020, 20, 6891. [Google Scholar] [CrossRef]
Figure 1.
Relative positioning of microphone and weather station in relation to the WT, as per the PN-EN 61400-11 standard.
Figure 1.
Relative positioning of microphone and weather station in relation to the WT, as per the PN-EN 61400-11 standard.

Figure 2.
General view of the measurement setup: A—outer wind protection, B—condenser microphone type 4190, C—PULSE LAN-XI type 3050-A module, D—reflective board, E—inner wind protection.
Figure 2.
General view of the measurement setup: A—outer wind protection, B—condenser microphone type 4190, C—PULSE LAN-XI type 3050-A module, D—reflective board, E—inner wind protection.

Figure 3.
General functional diagram of the INFRA system for the measurement of low-frequency signals generated by wind turbines (study results).
Figure 3.
General functional diagram of the INFRA system for the measurement of low-frequency signals generated by wind turbines (study results).
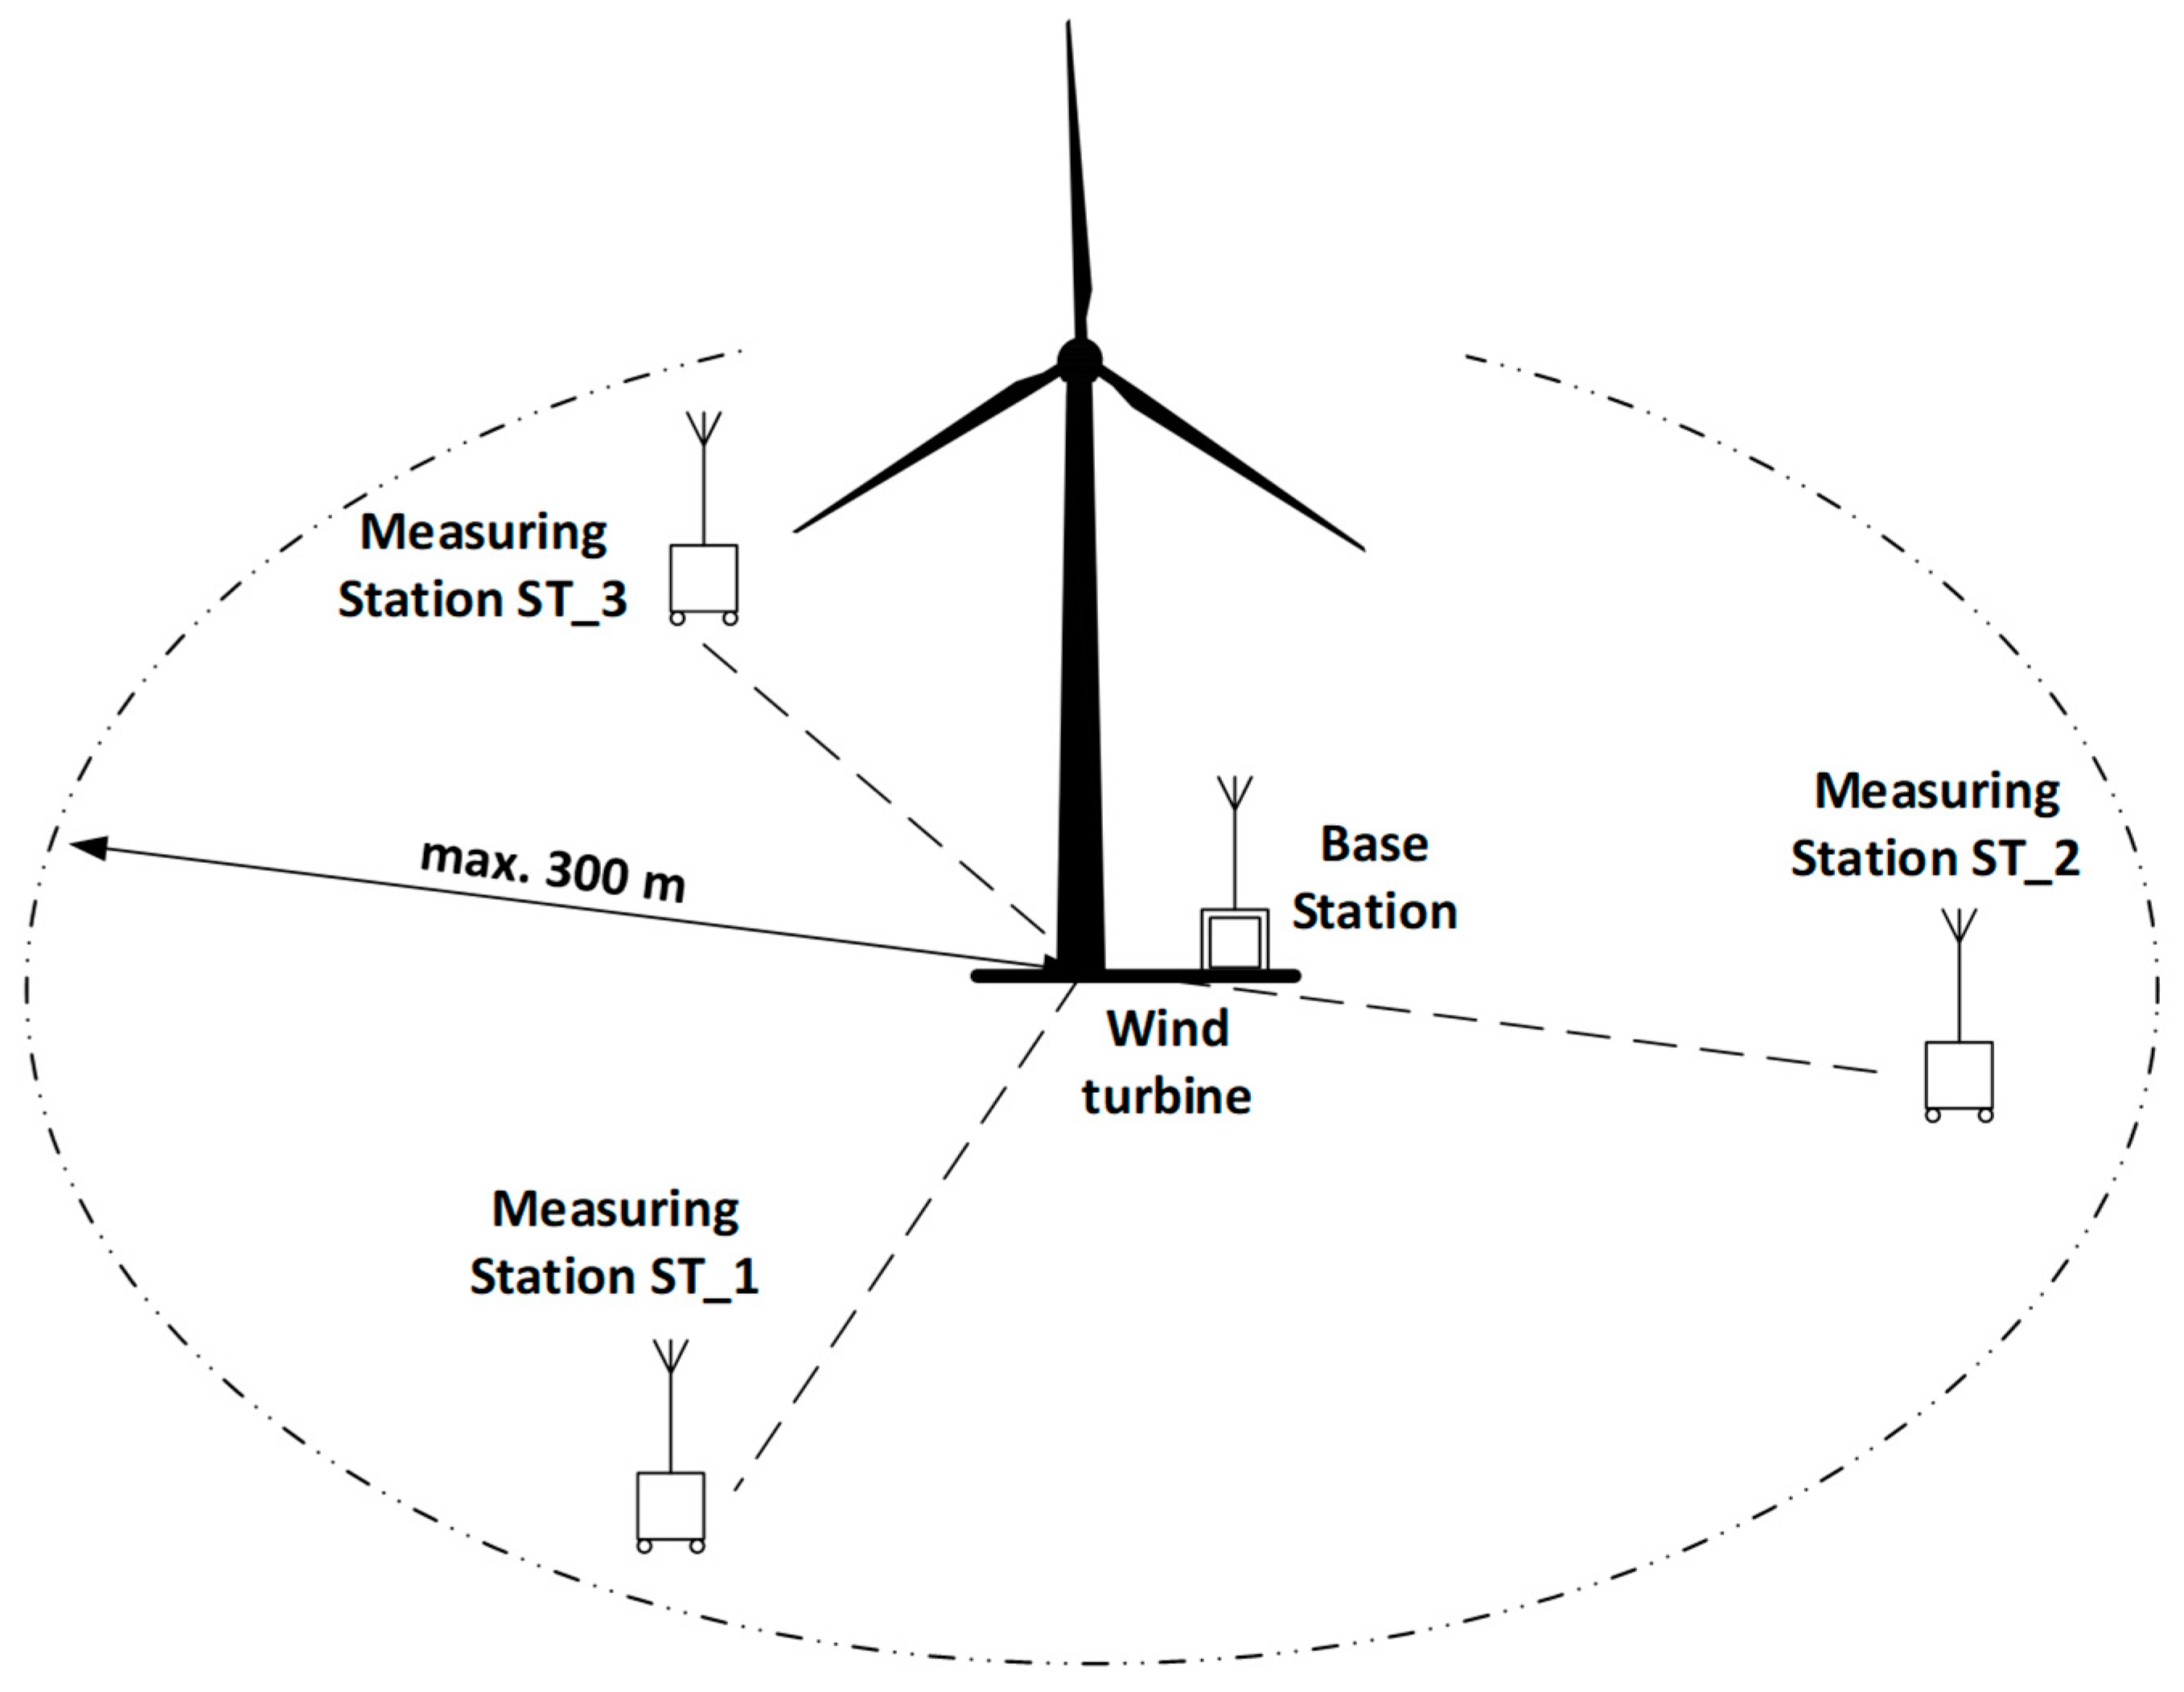
Figure 4.
General diagram of the INFRA base station.
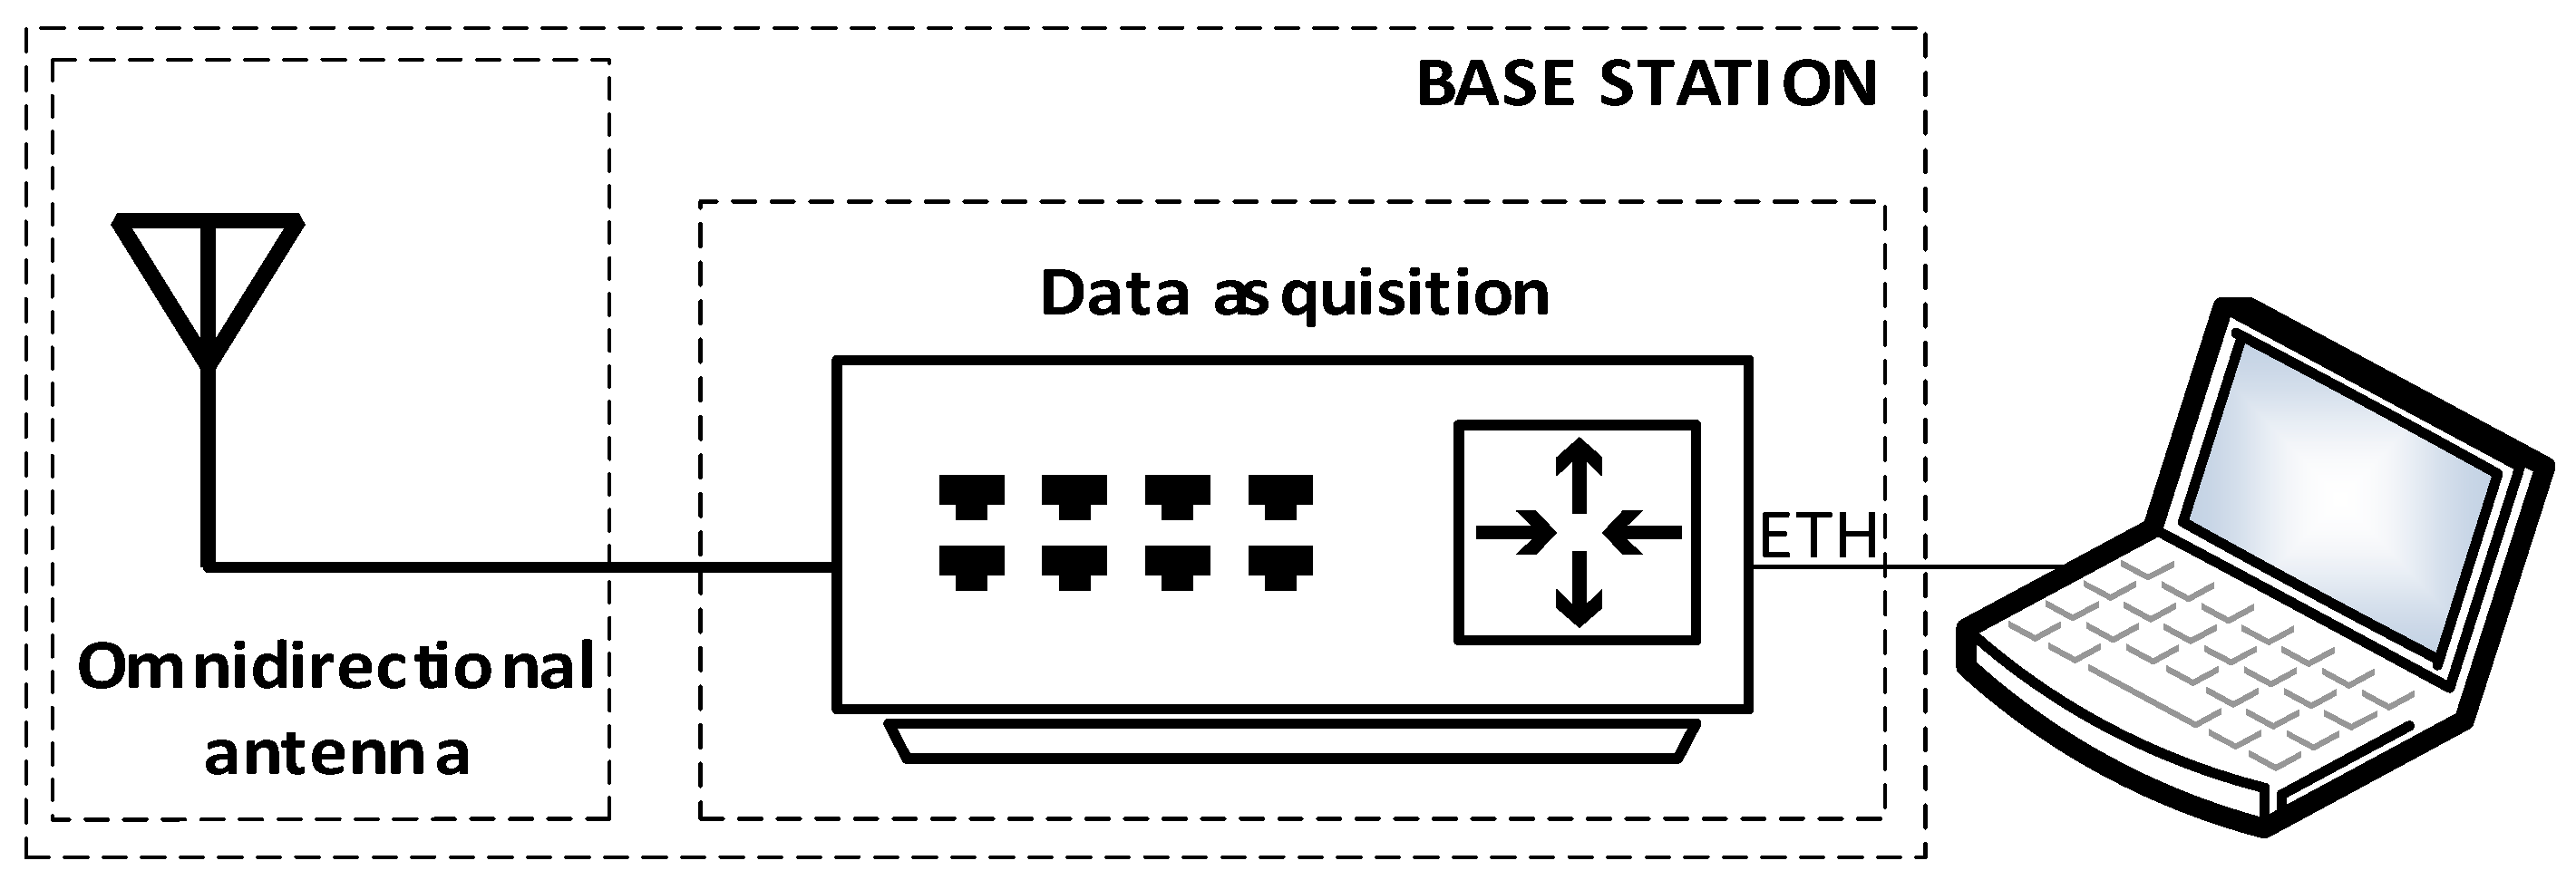
Figure 5.
General diagram of measurement station of the INFRA system.

Figure 6.
Photo of measuring station in the field (left) in the laboratory (right): A—measuring case, B—reflecting board, C—external wind protection, D—directional antenna LineEter 19, E—wind direction sensor, F—anemometer.
Figure 6.
Photo of measuring station in the field (left) in the laboratory (right): A—measuring case, B—reflecting board, C—external wind protection, D—directional antenna LineEter 19, E—wind direction sensor, F—anemometer.
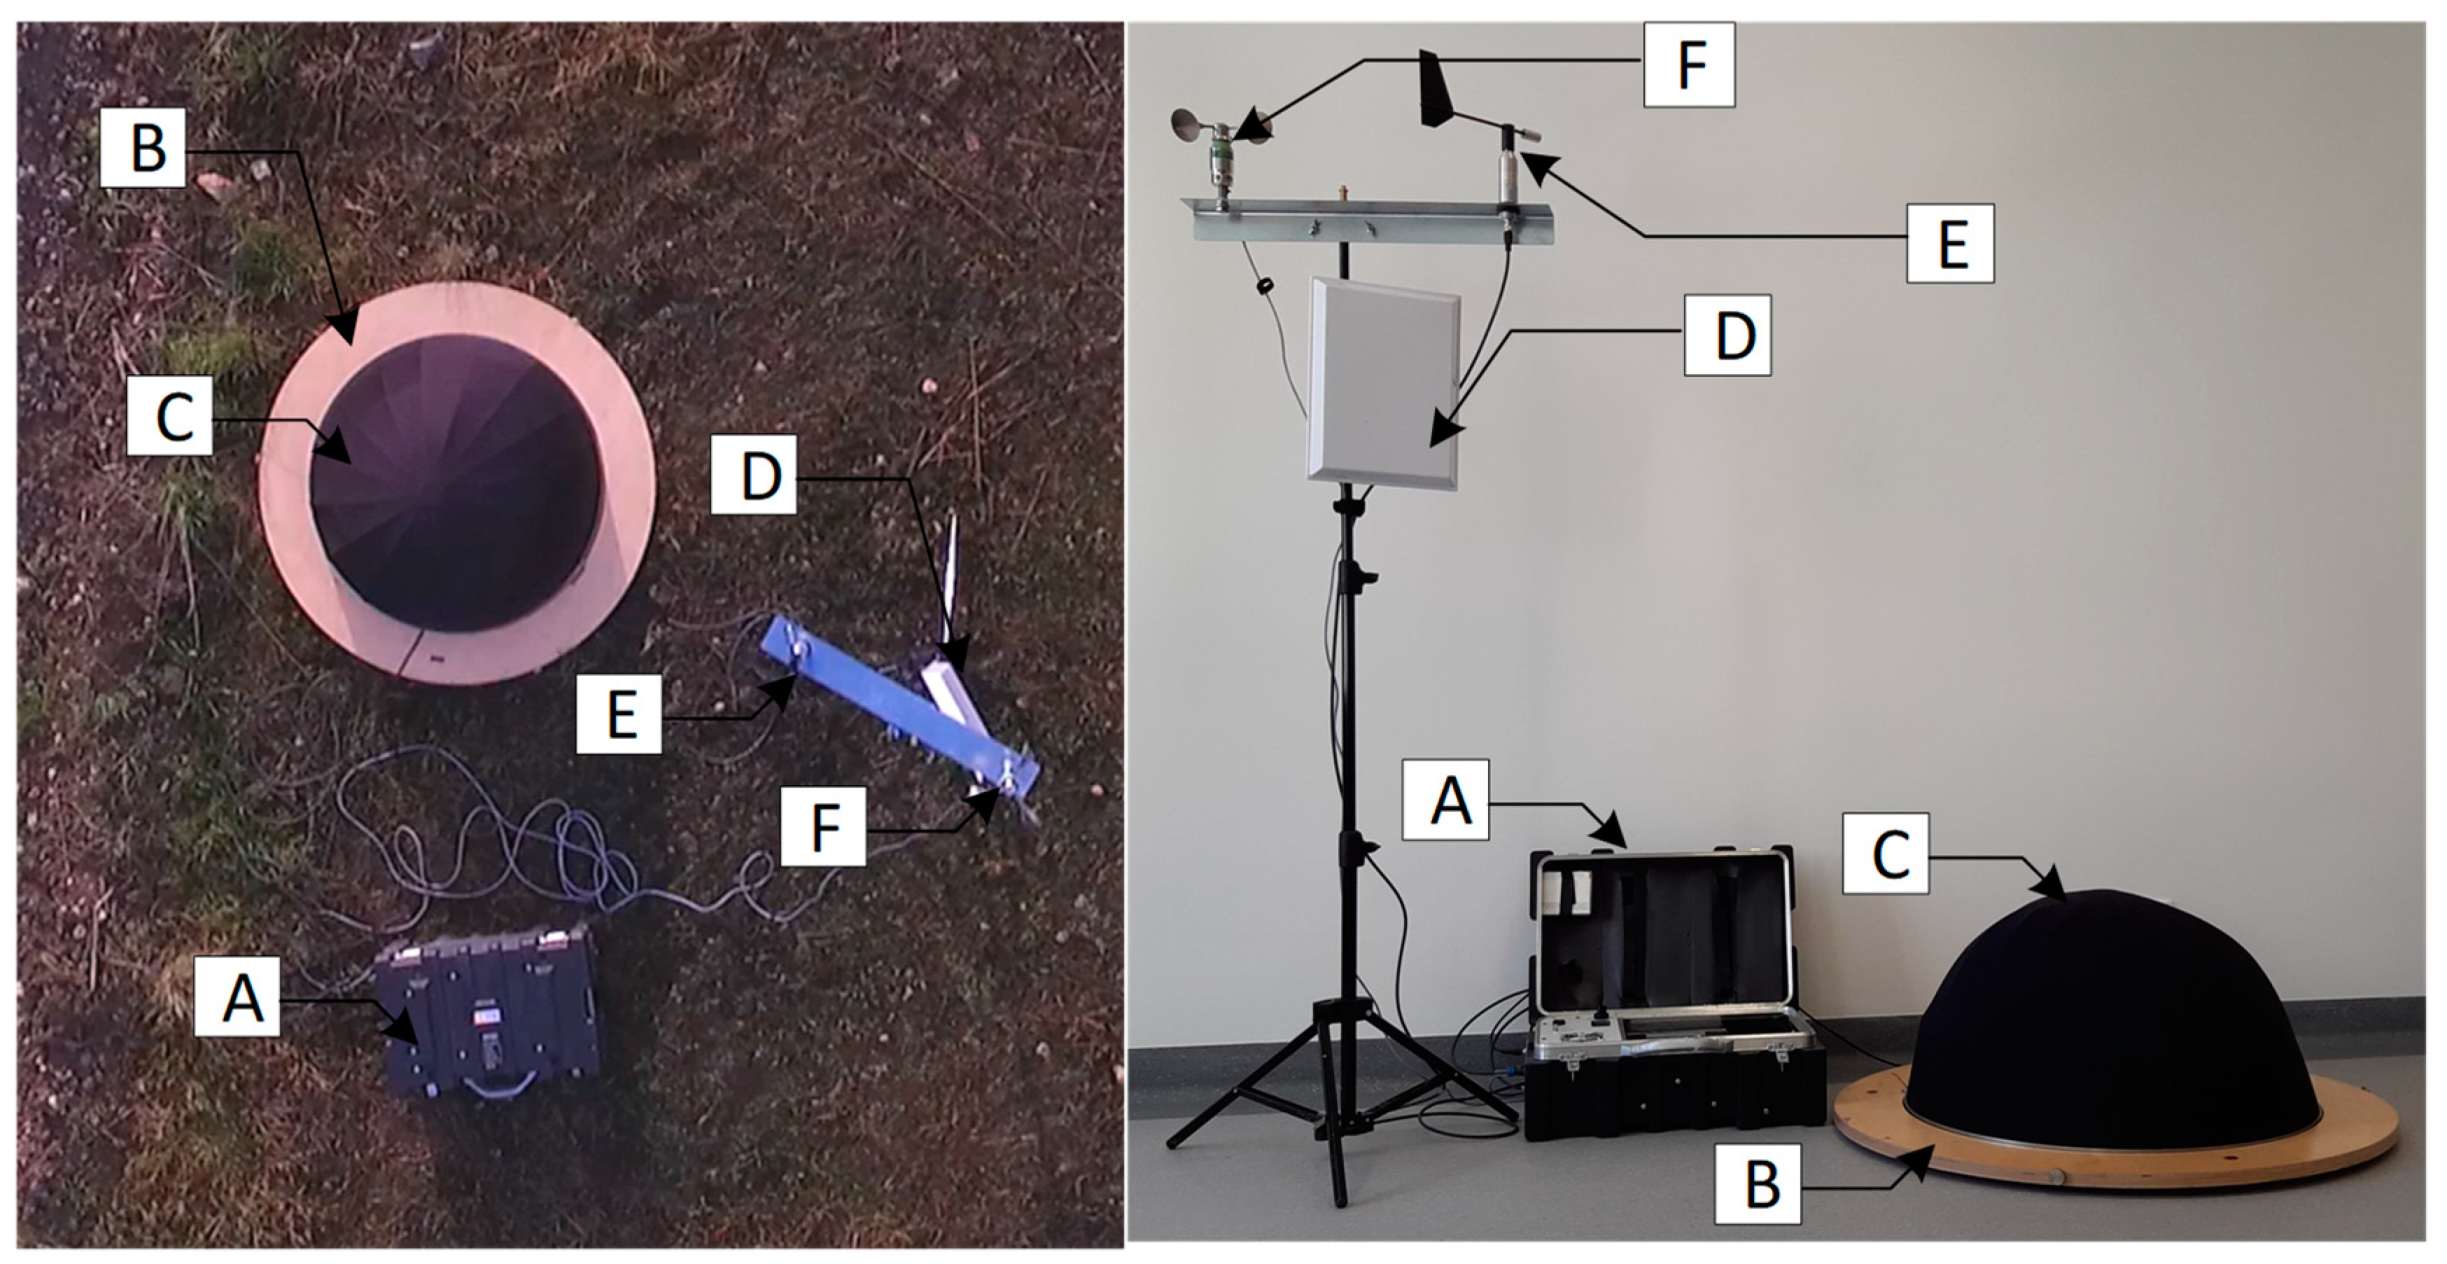
Figure 7.
Diagram of the measuring system. (a) Microphone reflective board-shields (external and internal); (b) Location of the microphone with reflective board, where A = 1 m.
Figure 7.
Diagram of the measuring system. (a) Microphone reflective board-shields (external and internal); (b) Location of the microphone with reflective board, where A = 1 m.

Figure 8.
(a) General view of the wind turbine under the study; (b) Relative positions of the wind turbine (WT), the Davis weather station (WS) and the PULSE system measuring point (MS).
Figure 8.
(a) General view of the wind turbine under the study; (b) Relative positions of the wind turbine (WT), the Davis weather station (WS) and the PULSE system measuring point (MS).

Figure 9.
Example of a SPL graph, calculated for the background noise measured at ST_1.

Figure 10.
Examples of two-dimensional PSD distributions, within a 15 min interval, as gathered by (a) ST_1, (b) ST_2, (c) ST_3 and (d) the PULSE system.
Figure 10.
Examples of two-dimensional PSD distributions, within a 15 min interval, as gathered by (a) ST_1, (b) ST_2, (c) ST_3 and (d) the PULSE system.
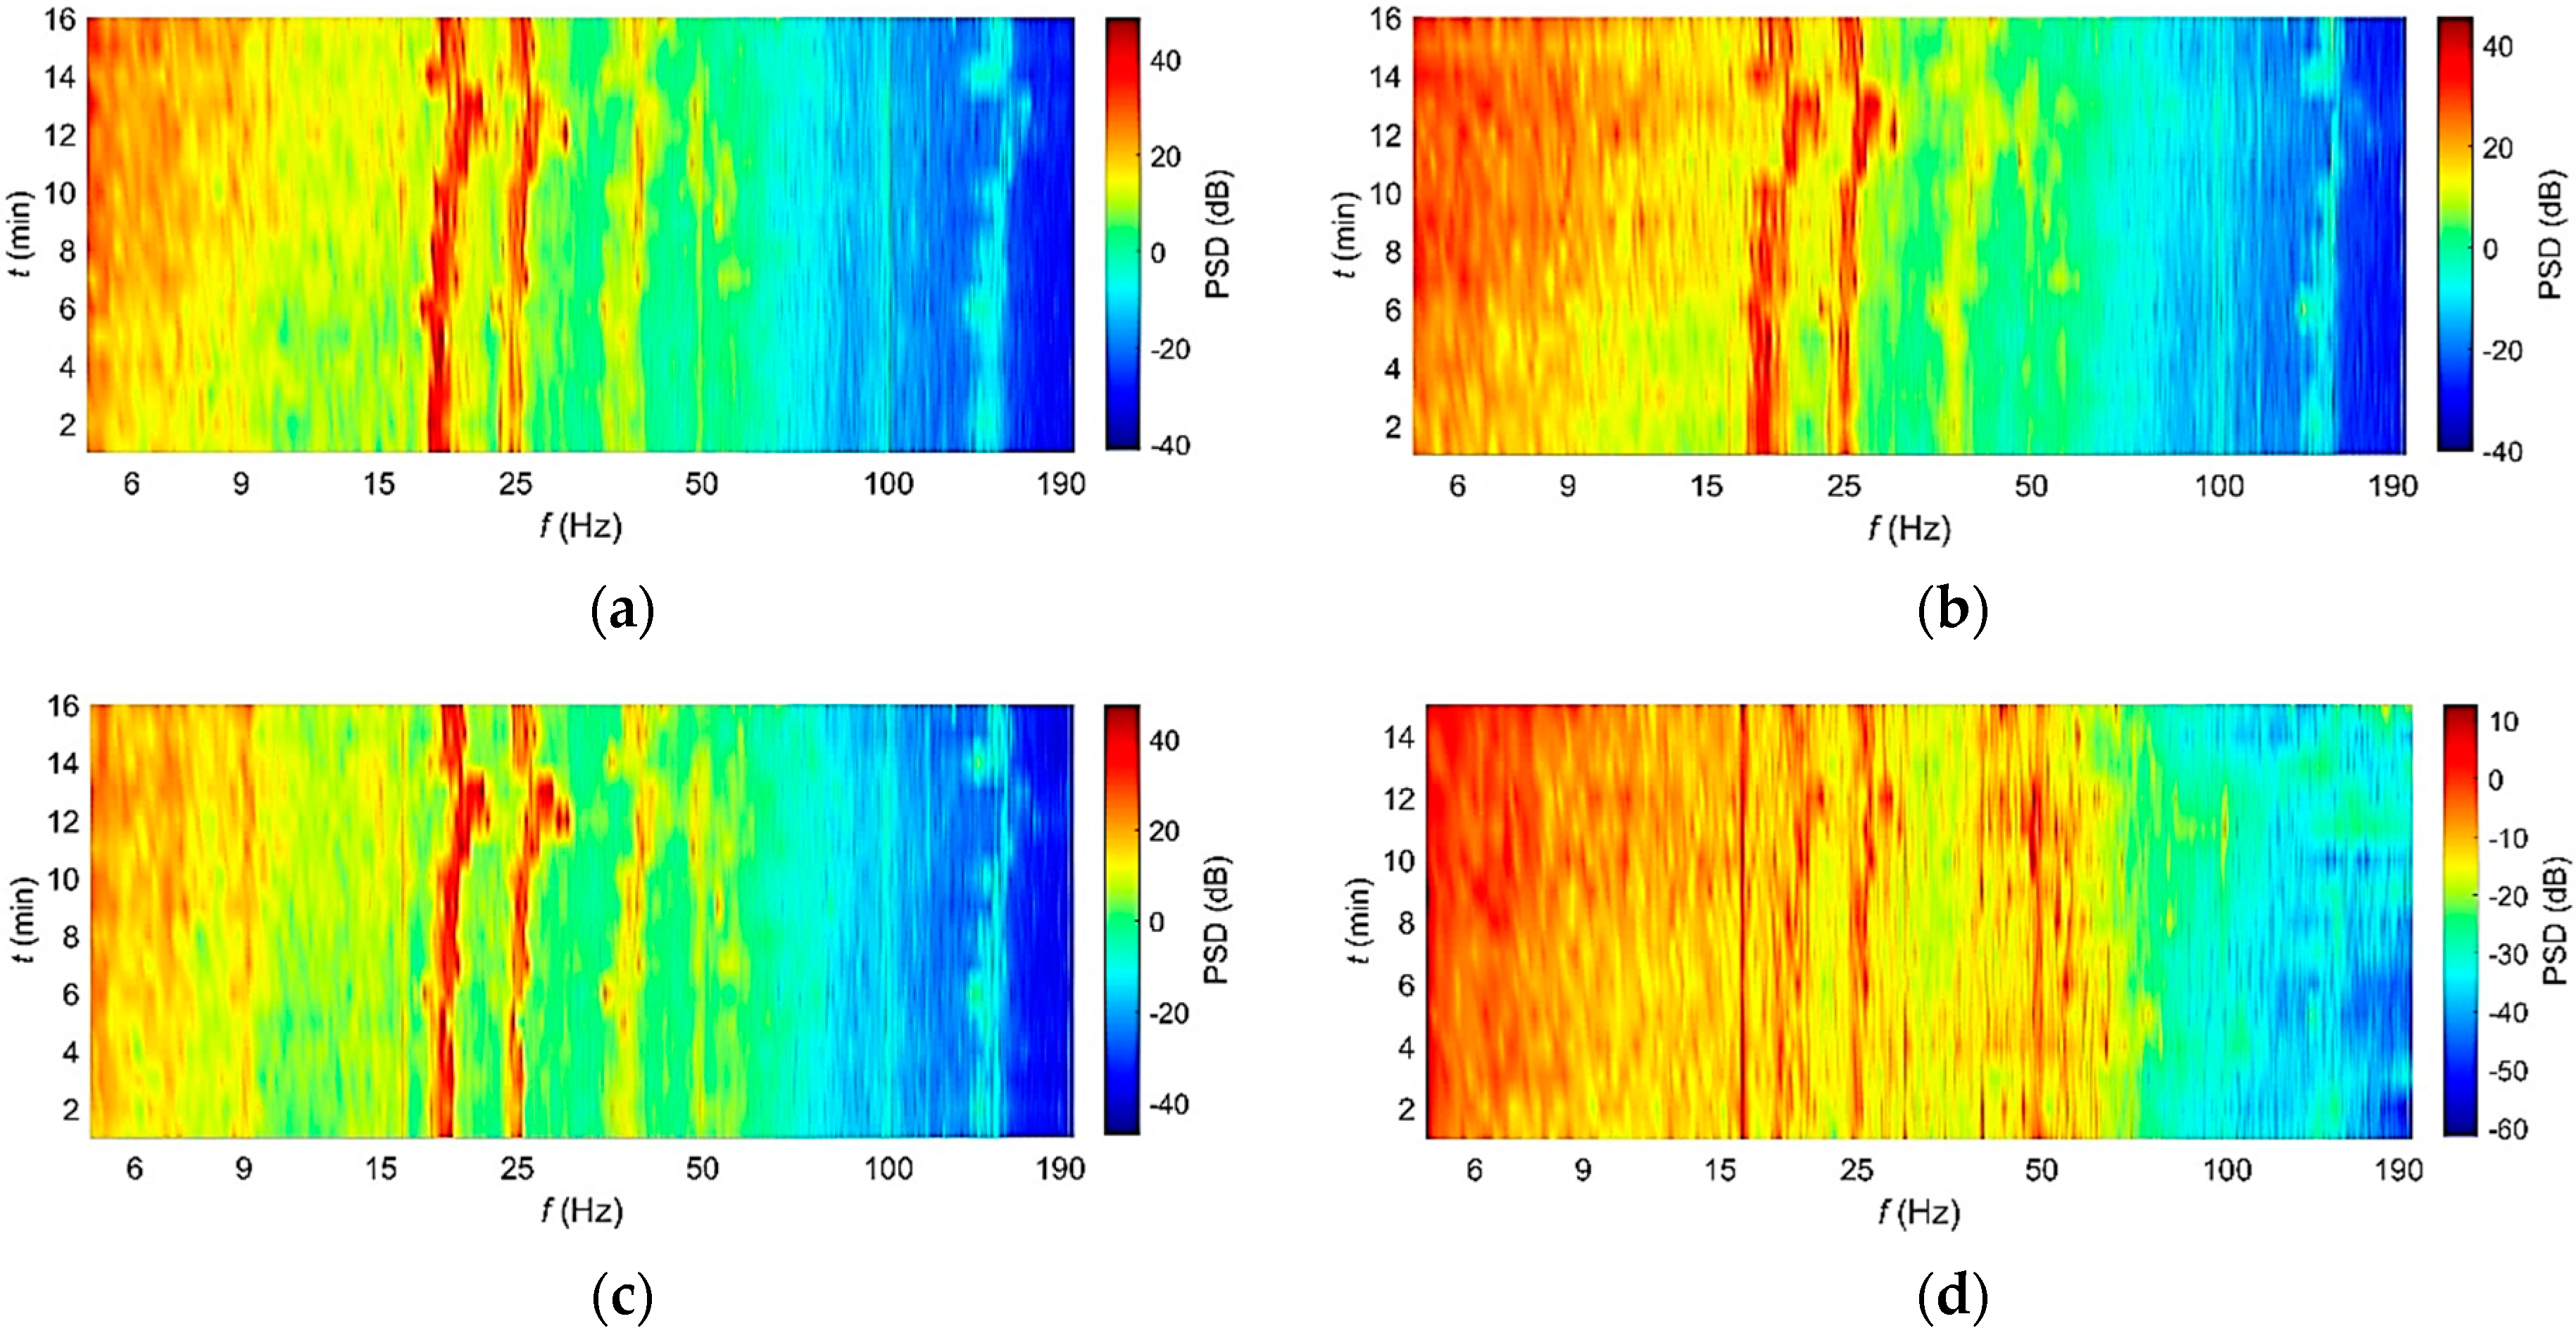
Figure 11.
Wind speed and direction values, gathered by Davis (left), ST_1 (middle) and ST_3 (right) during the considered 15 min measuring interval.
Figure 11.
Wind speed and direction values, gathered by Davis (left), ST_1 (middle) and ST_3 (right) during the considered 15 min measuring interval.
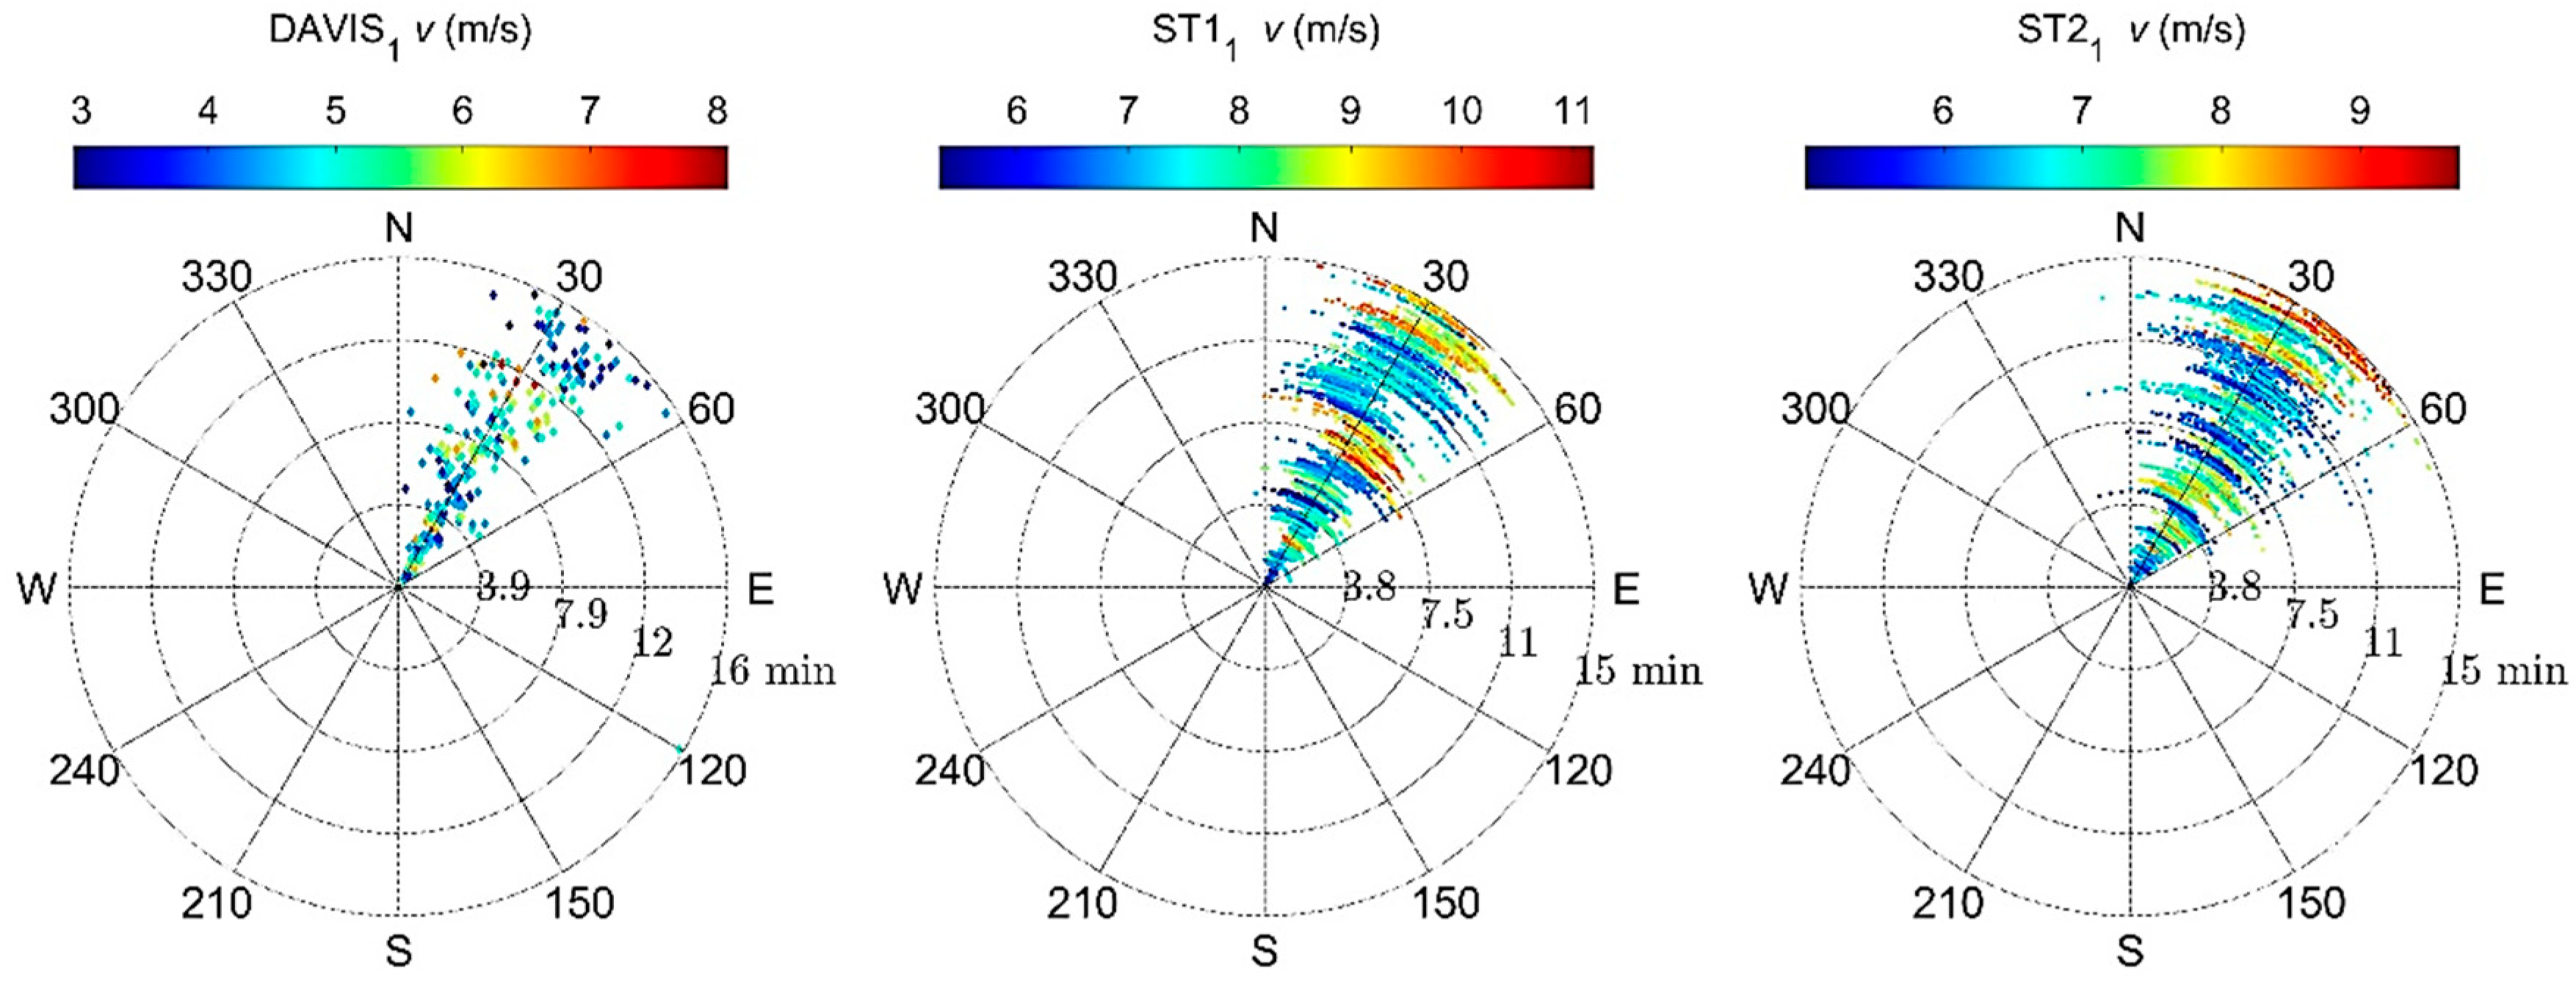
Figure 12.
Two-dimensional PSD characteristics gathered for three measuring stations within 70 min intervals.
Figure 12.
Two-dimensional PSD characteristics gathered for three measuring stations within 70 min intervals.
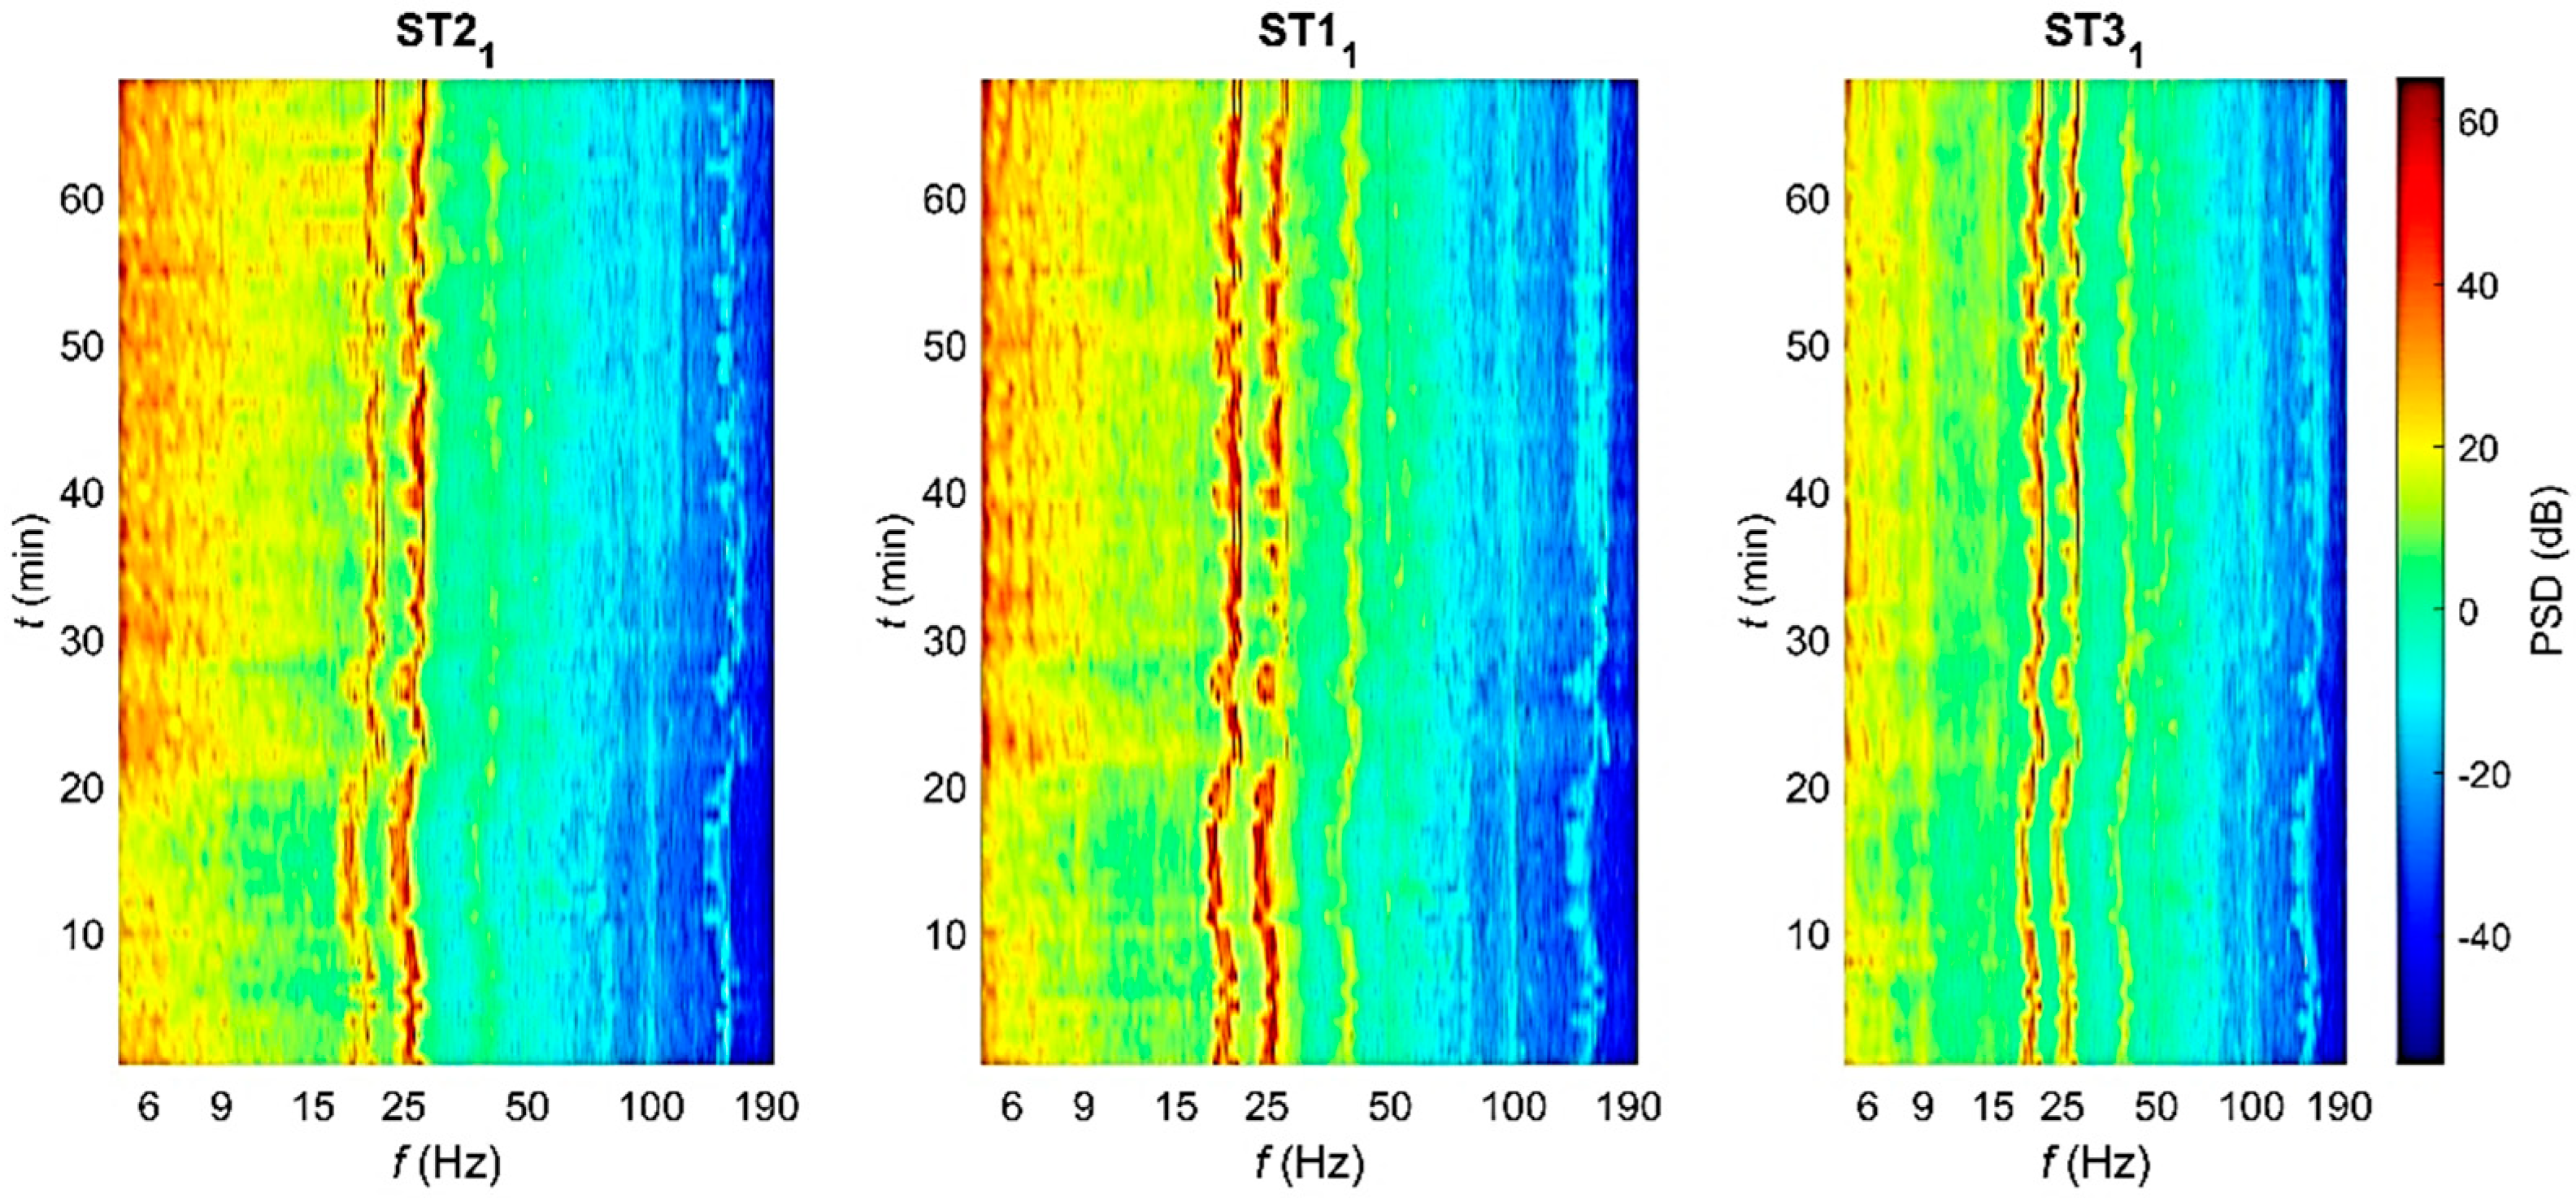
Figure 13.
Example of a PSD distribution from a one-minute SPL-referenced signal, trend line calculated using the model and the corresponding detrended signal. Frequency range up to 200 Hz.
Figure 13.
Example of a PSD distribution from a one-minute SPL-referenced signal, trend line calculated using the model and the corresponding detrended signal. Frequency range up to 200 Hz.

Figure 14.
Example of a PSD distribution from a one-minute SPL-referenced signal, trend line calculated using the model and the corresponding detrended signal. The frequency range was bee reduced down to 40 Hz.
Figure 14.
Example of a PSD distribution from a one-minute SPL-referenced signal, trend line calculated using the model and the corresponding detrended signal. The frequency range was bee reduced down to 40 Hz.
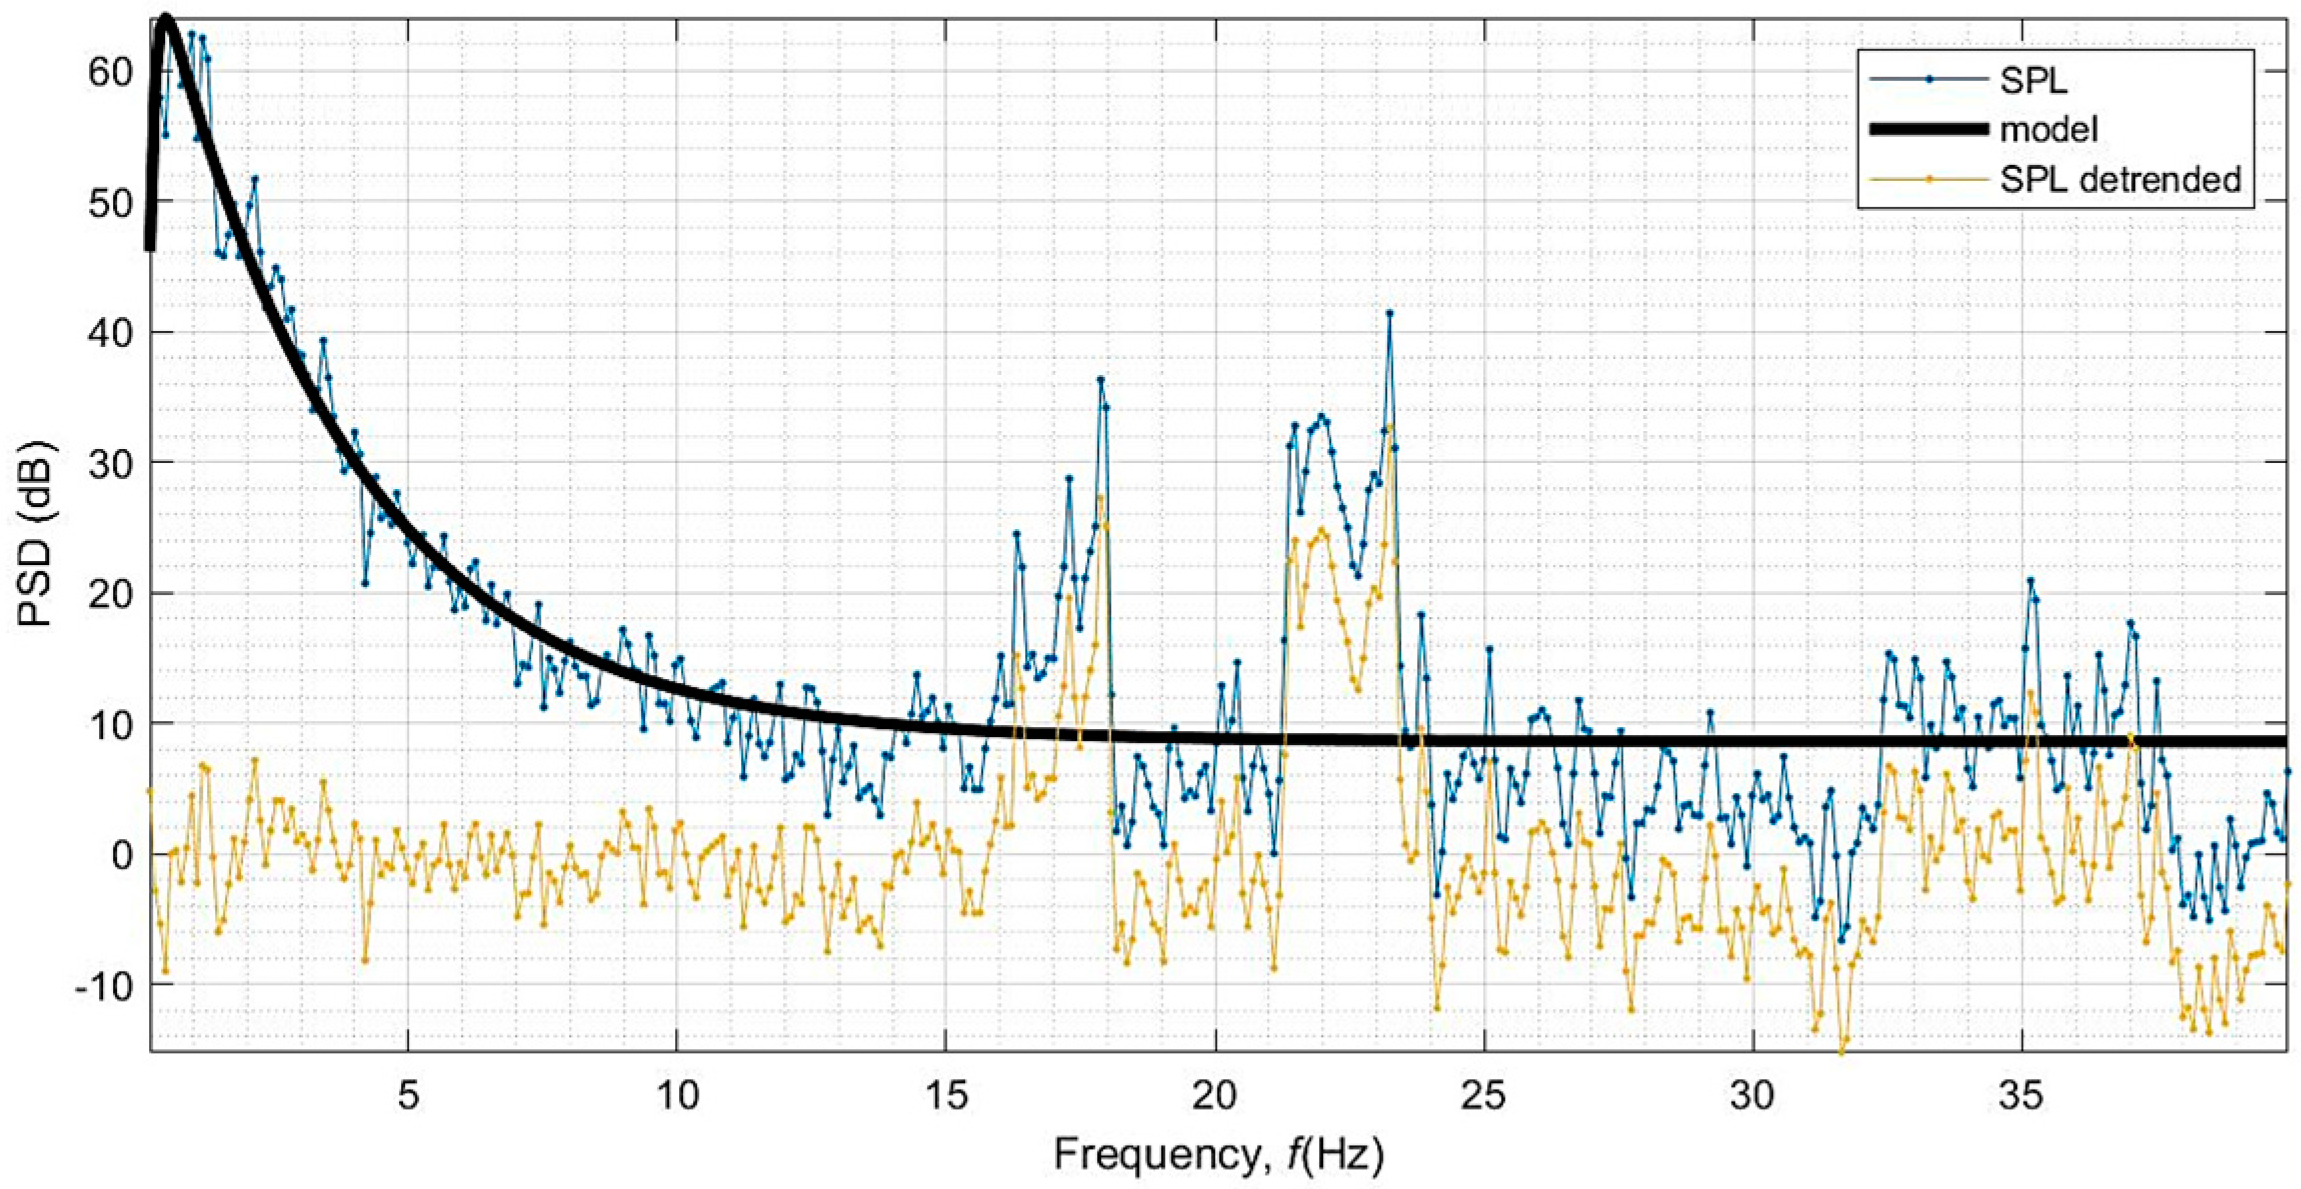
Figure 15.
Example of two-dimensional PSD distributions, within a 15 min interval, gathered by (a) ST_1, (b) ST_2, (c) ST_3 and (d) PULSE system.
Figure 15.
Example of two-dimensional PSD distributions, within a 15 min interval, gathered by (a) ST_1, (b) ST_2, (c) ST_3 and (d) PULSE system.
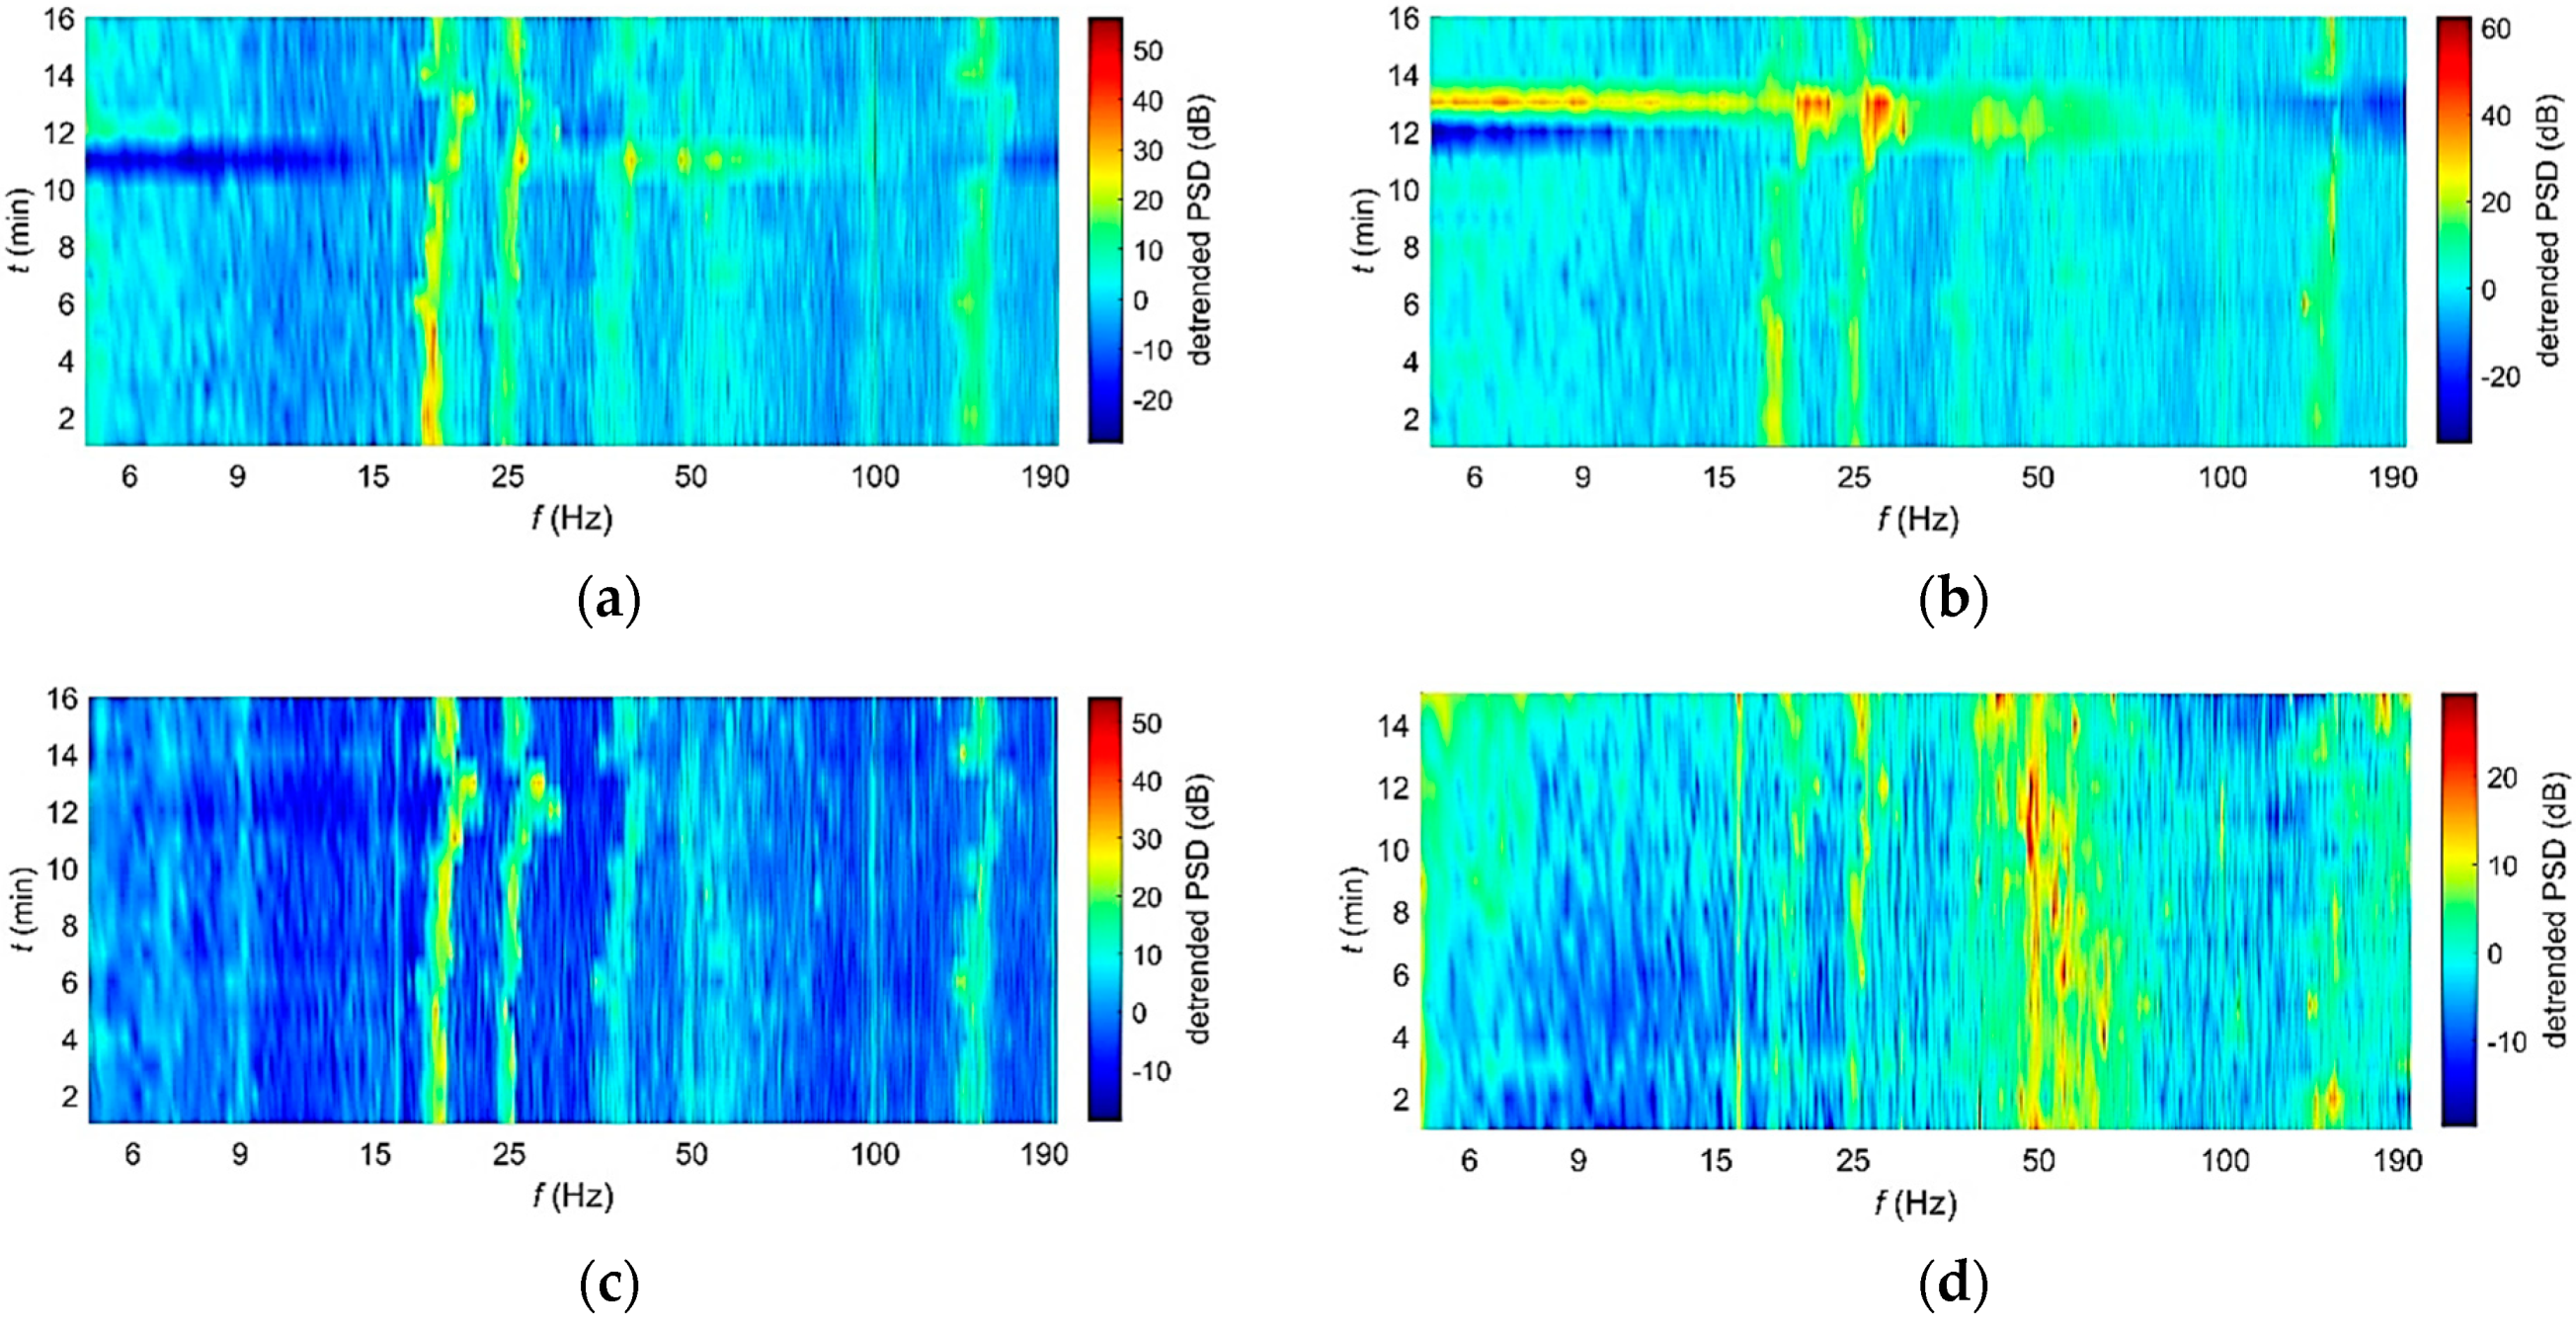
Figure 16.
An example graph showing the 12 most significant frequency components in the detrended SPL signal.
Figure 16.
An example graph showing the 12 most significant frequency components in the detrended SPL signal.
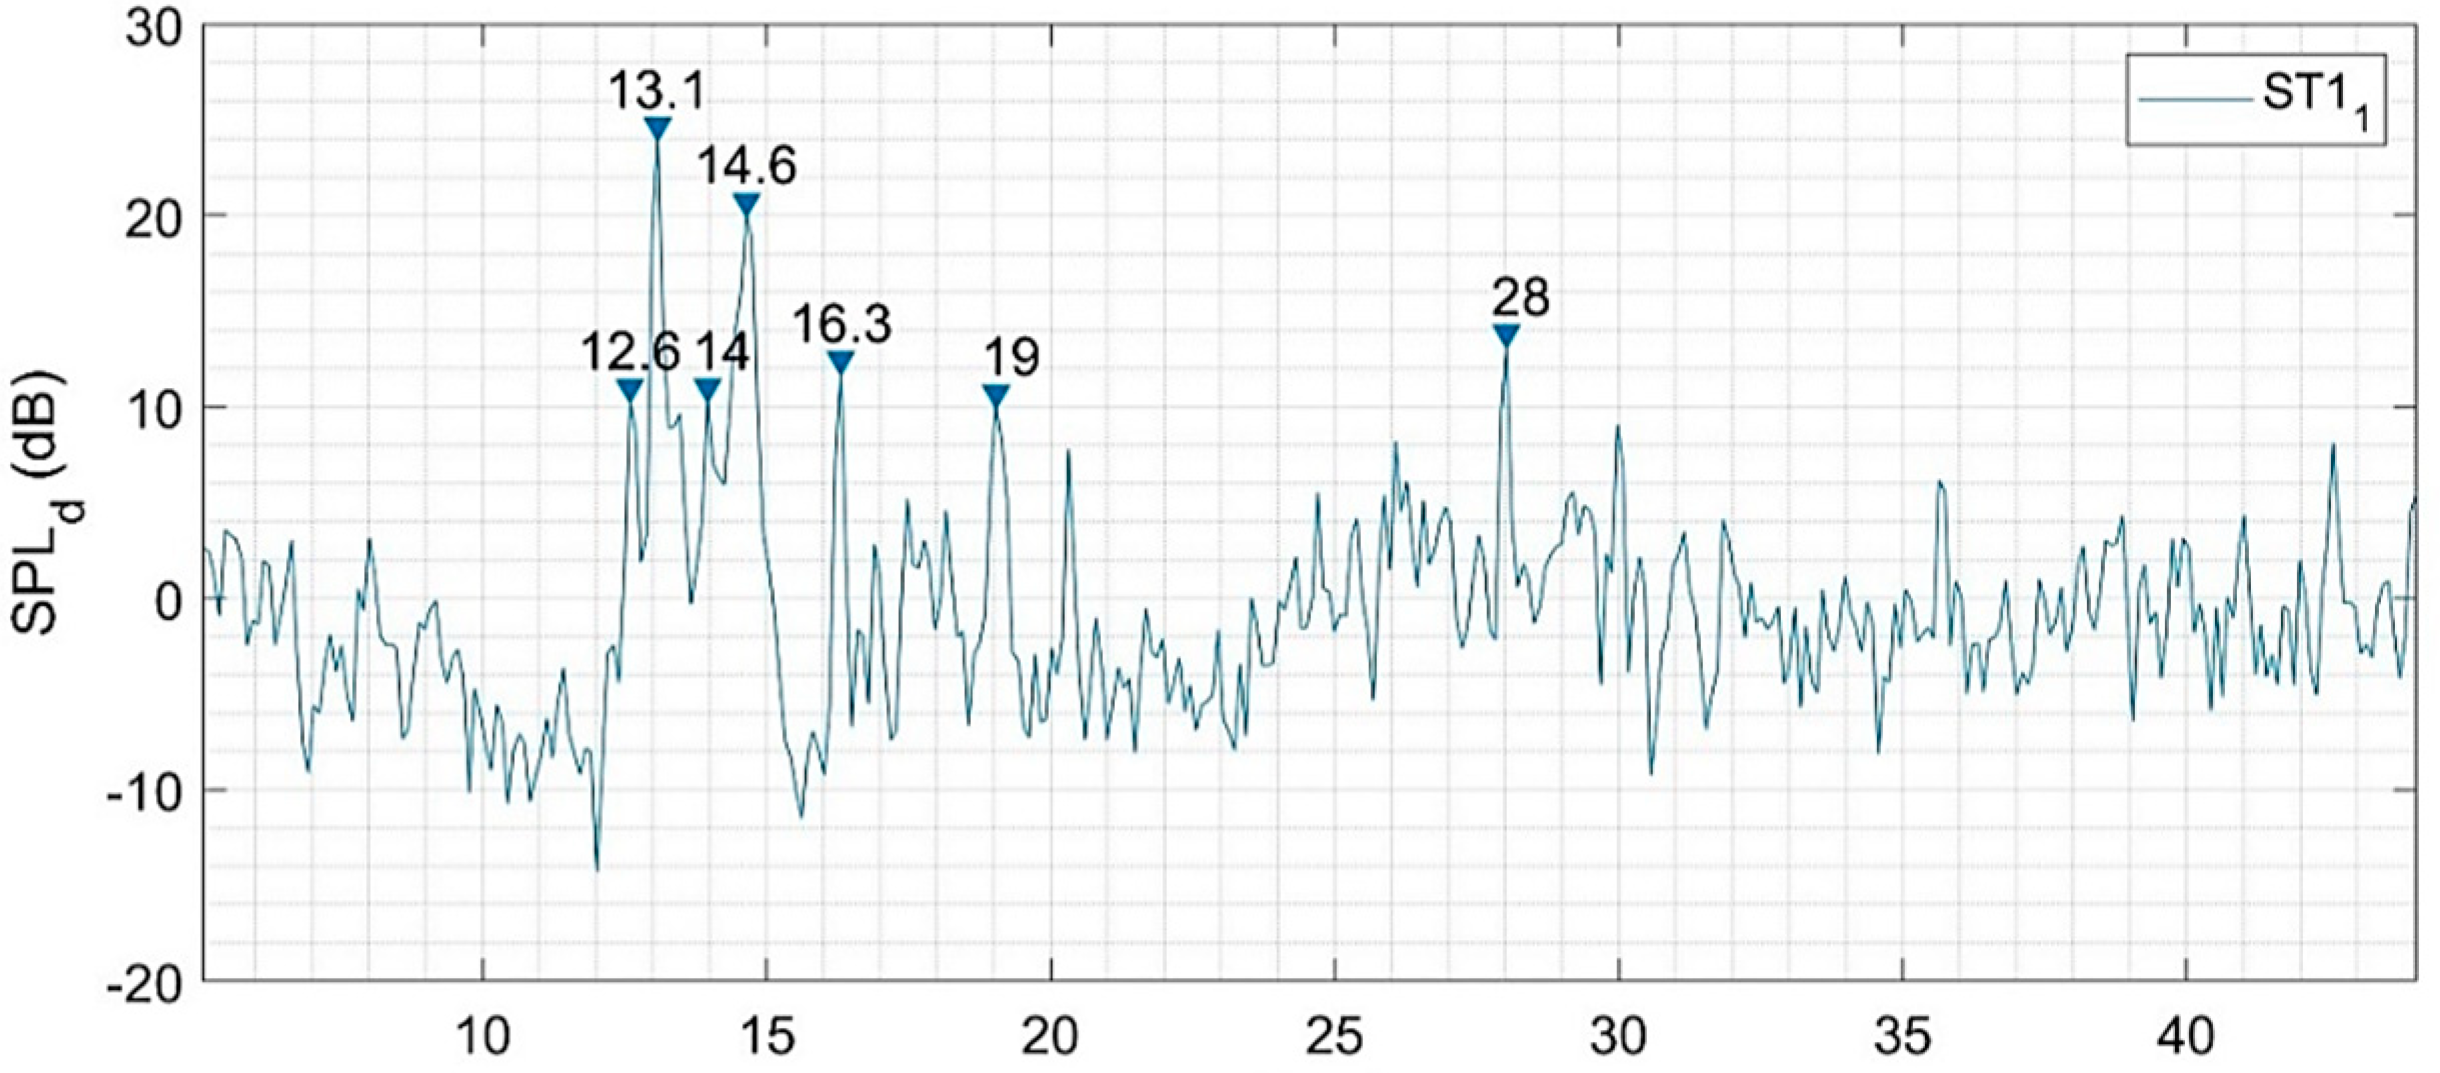
Figure 17.
The density of 12 most significant frequency peaks calculated within 10 min intervals by ST1 with corresponding mean wind velocities given in the legend.
Figure 17.
The density of 12 most significant frequency peaks calculated within 10 min intervals by ST1 with corresponding mean wind velocities given in the legend.
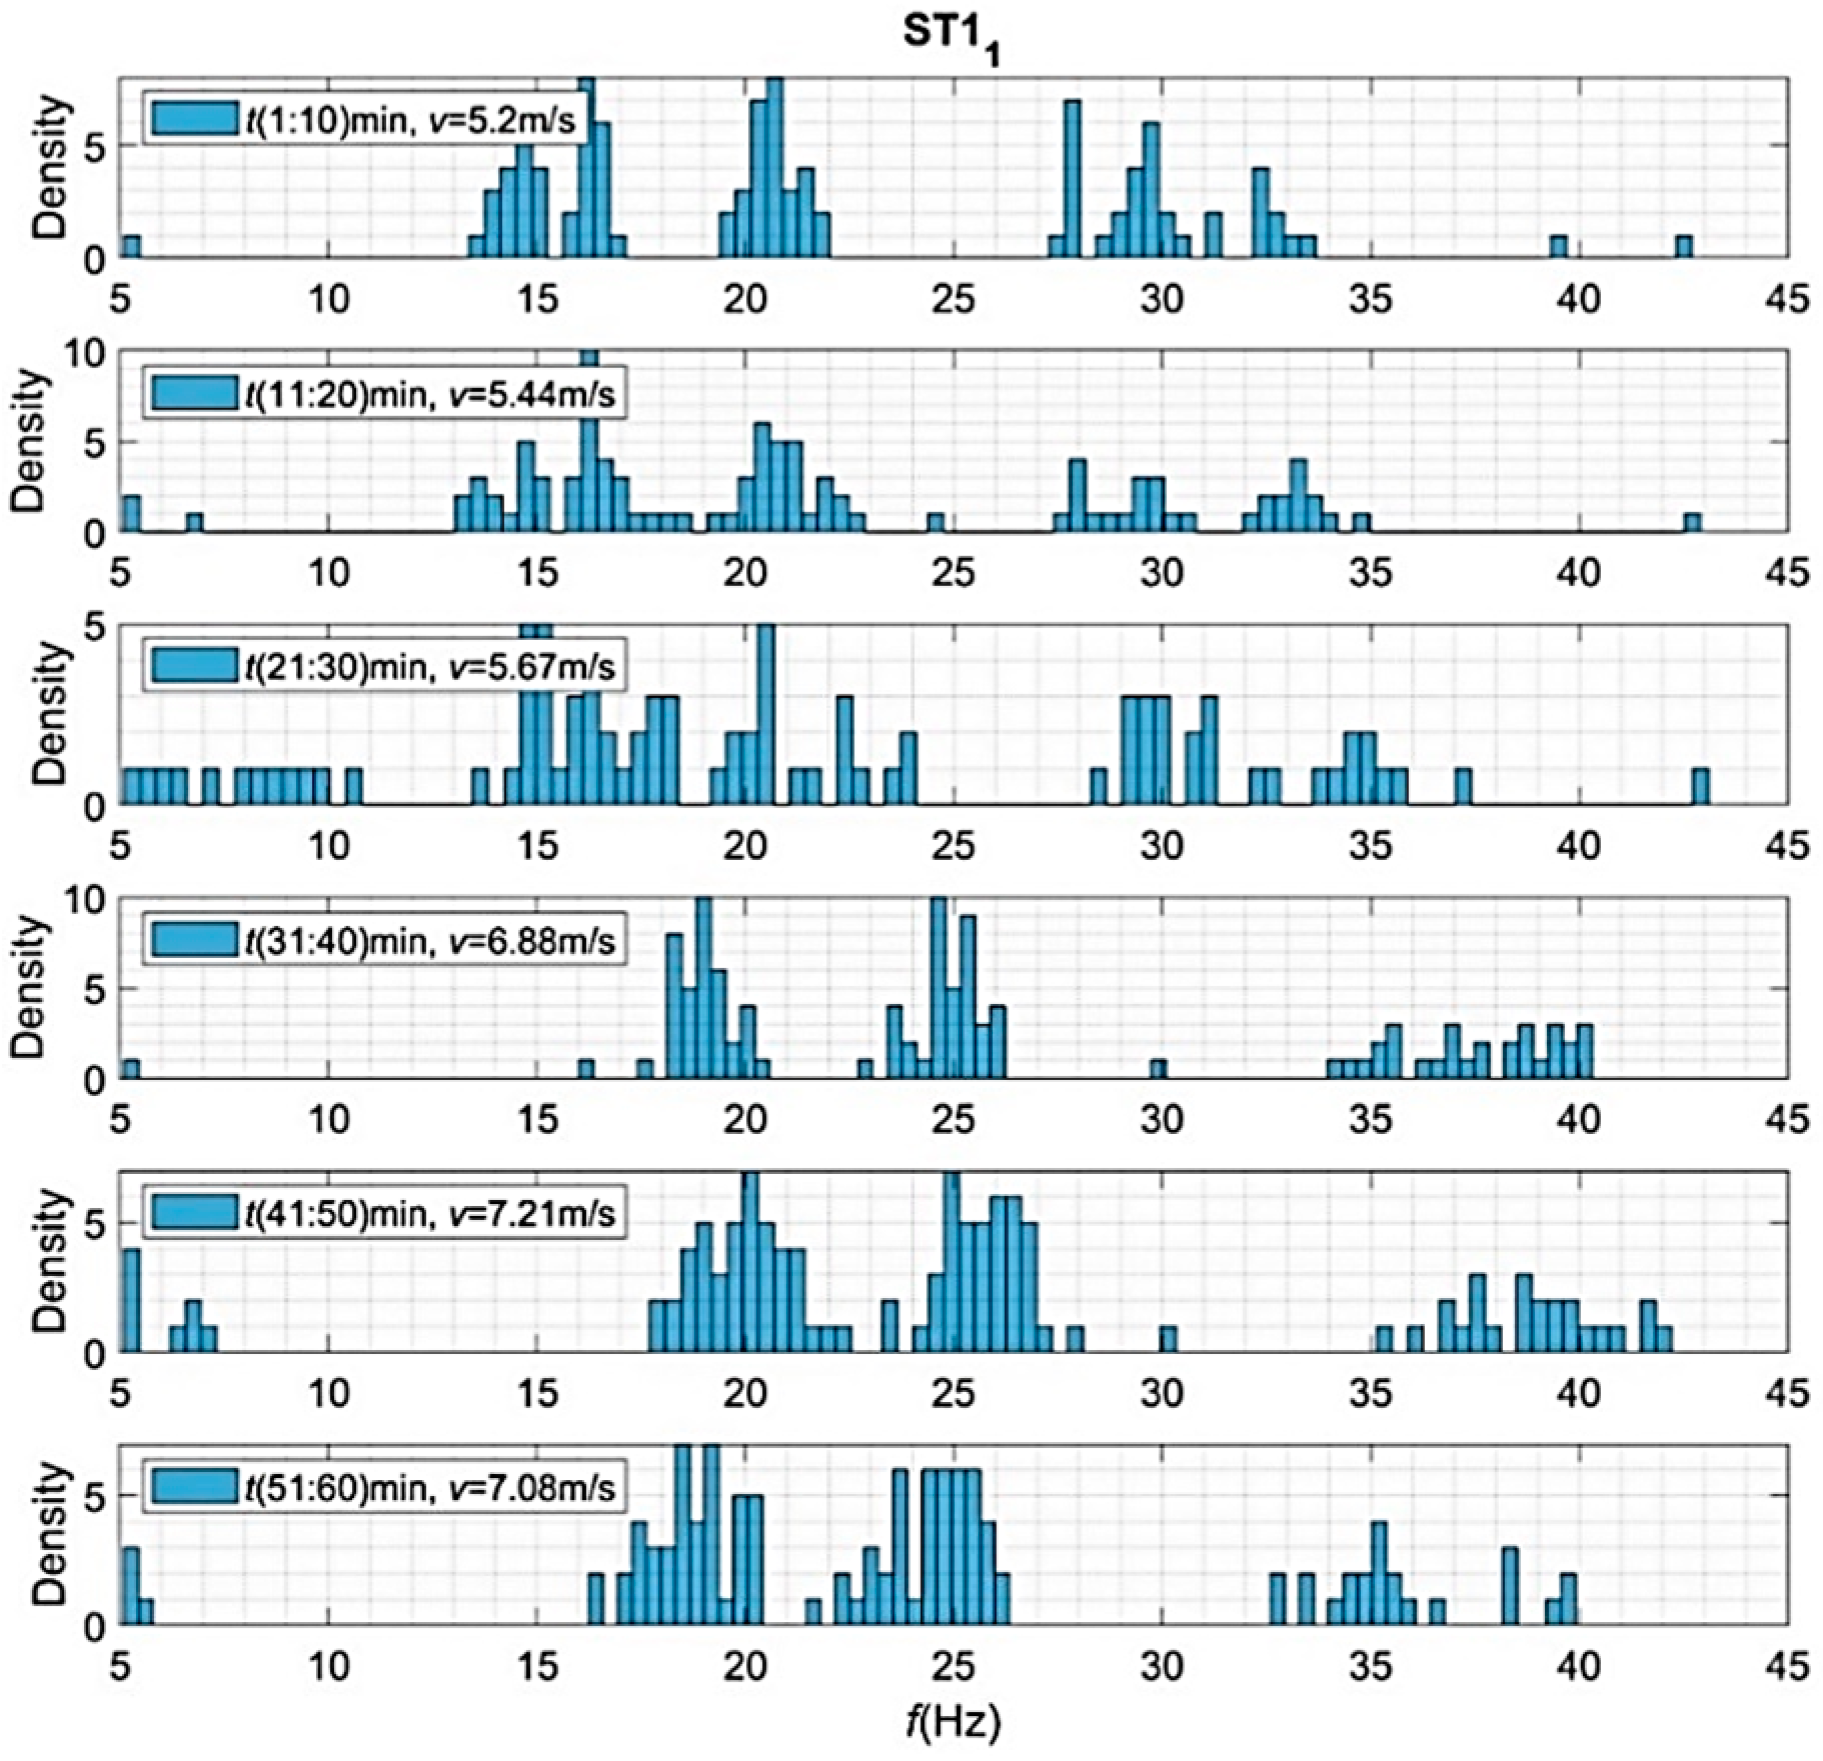
Figure 18.
The density of 12 most significant frequency peaks calculated within 10 min intervals by ST2 with corresponding mean wind velocities given in the legend.
Figure 18.
The density of 12 most significant frequency peaks calculated within 10 min intervals by ST2 with corresponding mean wind velocities given in the legend.
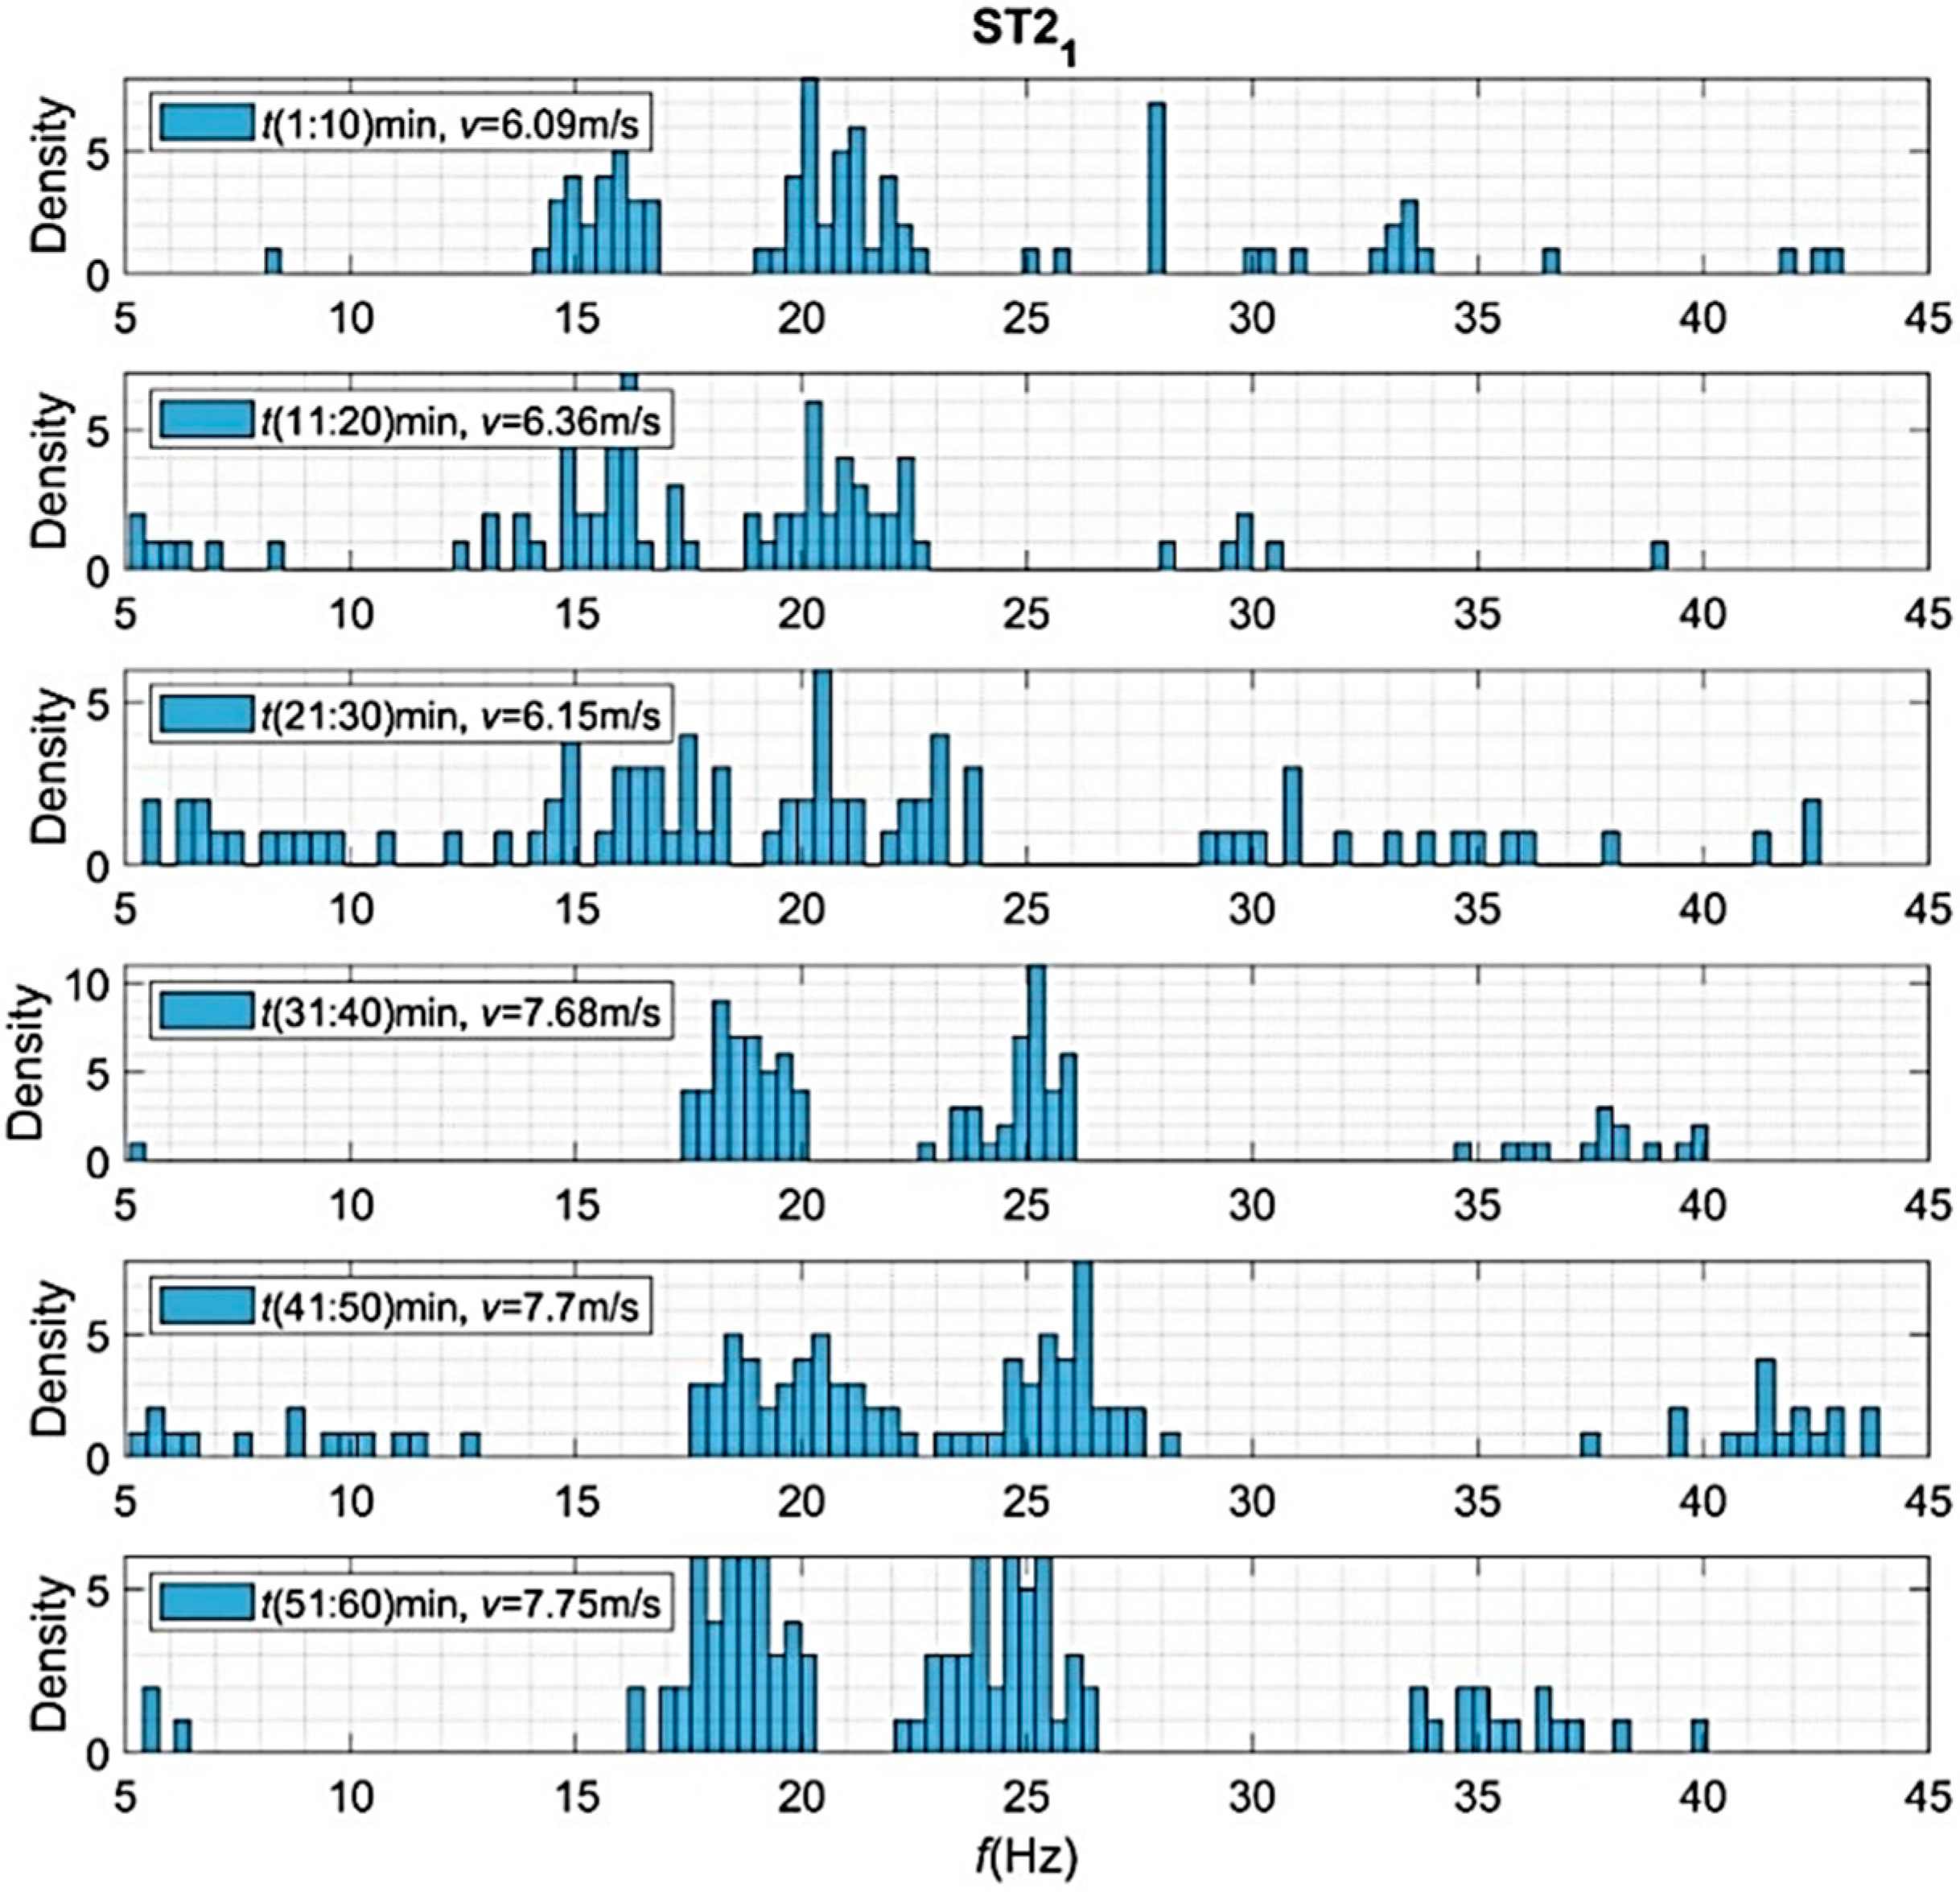
Figure 19.
The density of 12 most significant frequency peaks calculated within 10 min intervals by ST3.
Figure 19.
The density of 12 most significant frequency peaks calculated within 10 min intervals by ST3.

Table 1.
Summary of basic parameters of G.R.A.S. 46AZ microphone.
| Parameters | Units | Values |
|---|---|---|
| Dynamic range lower limit with GRAS preamplifier | dB (A) | 17 |
| Dynamic range upper limit with GRAS preamplifier | dB | 138 |
| Frequency range (±1 dB) | Hz | 1–10 k |
| Frequency range (±2 dB) | Hz | 0.5–20 k |
| Sensitivity | mV/Pa | 50 |
| Nominal sensitivity at 250 Hz | mV/Pa | 50 |
| Input current (CCP) | mA | 2–20 |
| Range of temperatures | °C | −30 to +70 |
Publisher’s Note: MDPI stays neutral with regard to jurisdictional claims in published maps and institutional affiliations. |
© 2022 by the authors. Licensee MDPI, Basel, Switzerland. This article is an open access article distributed under the terms and conditions of the Creative Commons Attribution (CC BY) license (https://creativecommons.org/licenses/by/4.0/).
Share and Cite
MDPI and ACS Style
Boczar, T.; Zmarzły, D.; Kozioł, M.; Nagi, Ł.; Wotzka, D.; Nadolny, Z. Measurement of Infrasound Components Contained in the Noise Emitted during a Working Wind Turbine. Energies 2022, 15, 597. https://doi.org/10.3390/en15020597
AMA Style
Boczar T, Zmarzły D, Kozioł M, Nagi Ł, Wotzka D, Nadolny Z. Measurement of Infrasound Components Contained in the Noise Emitted during a Working Wind Turbine. Energies. 2022; 15(2):597. https://doi.org/10.3390/en15020597
Chicago/Turabian StyleBoczar, Tomasz, Dariusz Zmarzły, Michał Kozioł, Łukasz Nagi, Daria Wotzka, and Zbigniew Nadolny. 2022. "Measurement of Infrasound Components Contained in the Noise Emitted during a Working Wind Turbine" Energies 15, no. 2: 597. https://doi.org/10.3390/en15020597
Note that from the first issue of 2016, this journal uses article numbers instead of page numbers. See further details here.