
Genome-Wide Association Study of Leaf Chlorophyll Content Using High-Density SNP Array in Peanuts (Arachis hypogaea L.)

 , ,
, ,
Abstract
1. Introduction
2. Materials and Methods
2.1. Plant Materials
2.2. DNA Extraction and Genotyping
2.3. Measurement of Chlorophyll
2.4. Population Structure Analysis
2.5. Genome-Wide Association Study (GWAS)
2.6. Linkage Disequilibrium (LD) Analysis and Candidate Gene Identification
2.7. RNA Extraction, cDNA Synthesis, and Expression Analysis
3. Results
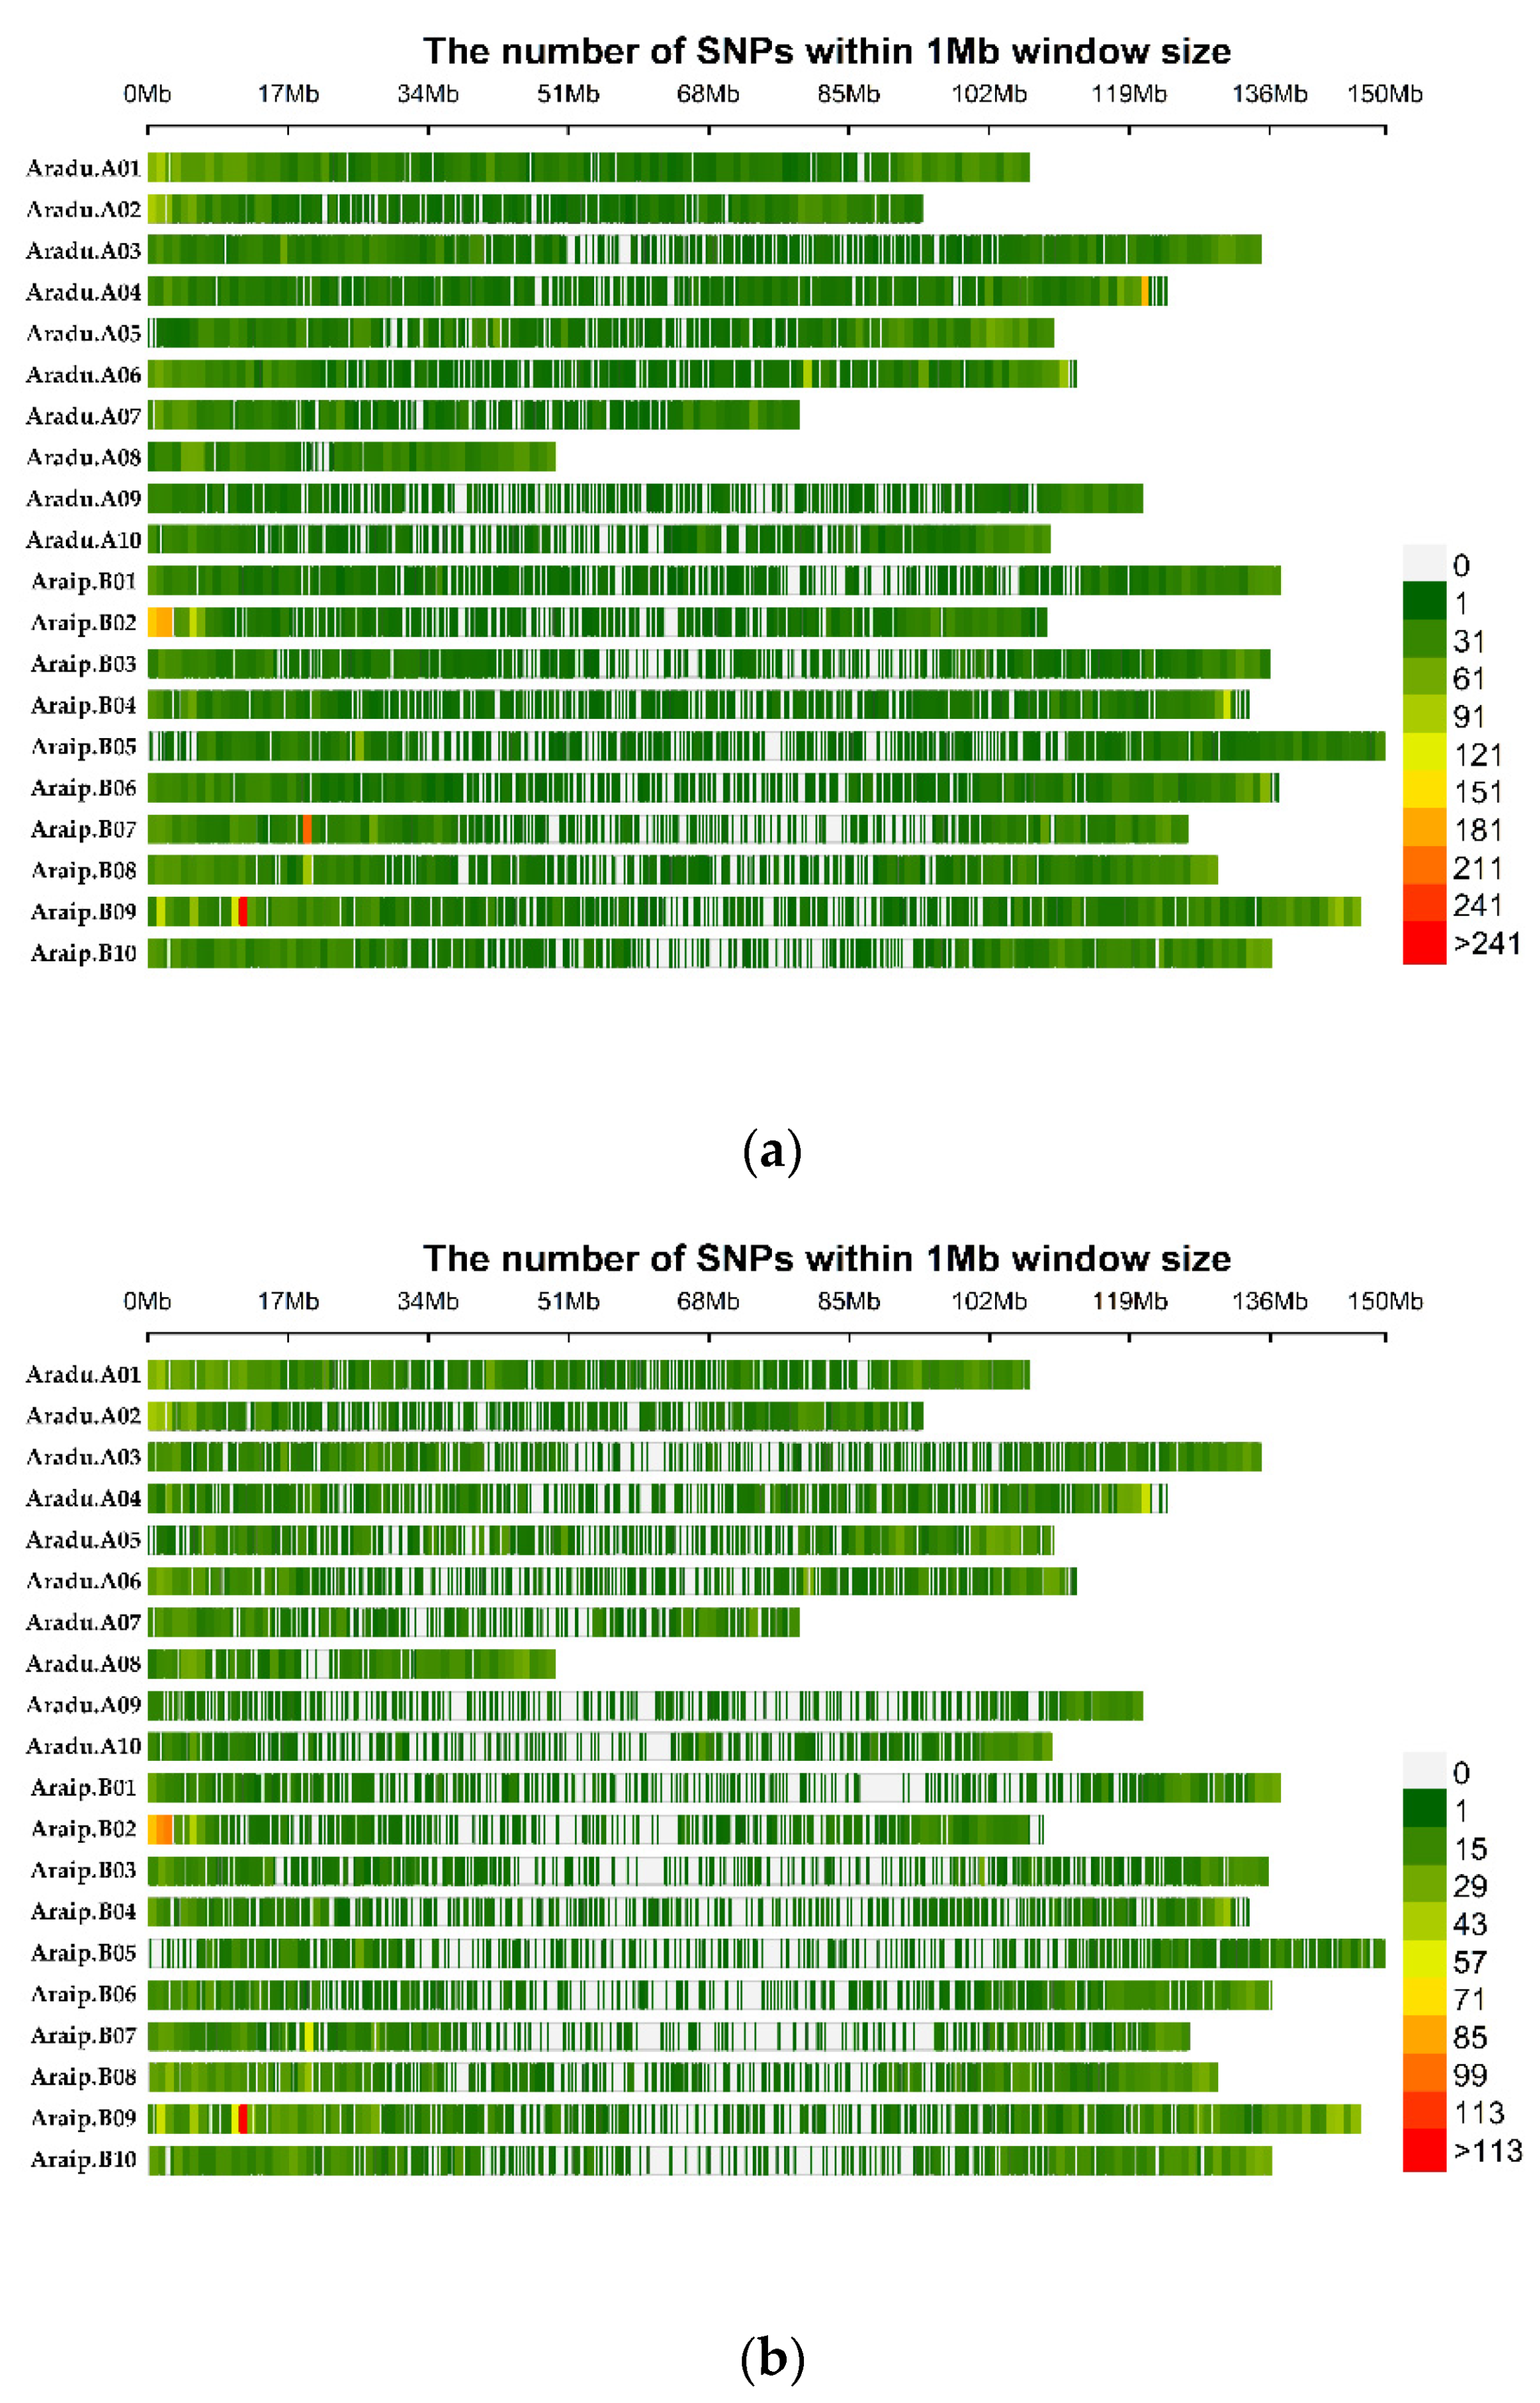
3.1. SNP Genotyping
3.2. Phenotypic Data Analysis
3.3. Genetic Structure
3.4. Genome-Wide Association Study
3.5. LD and Candidate Genes Analysis
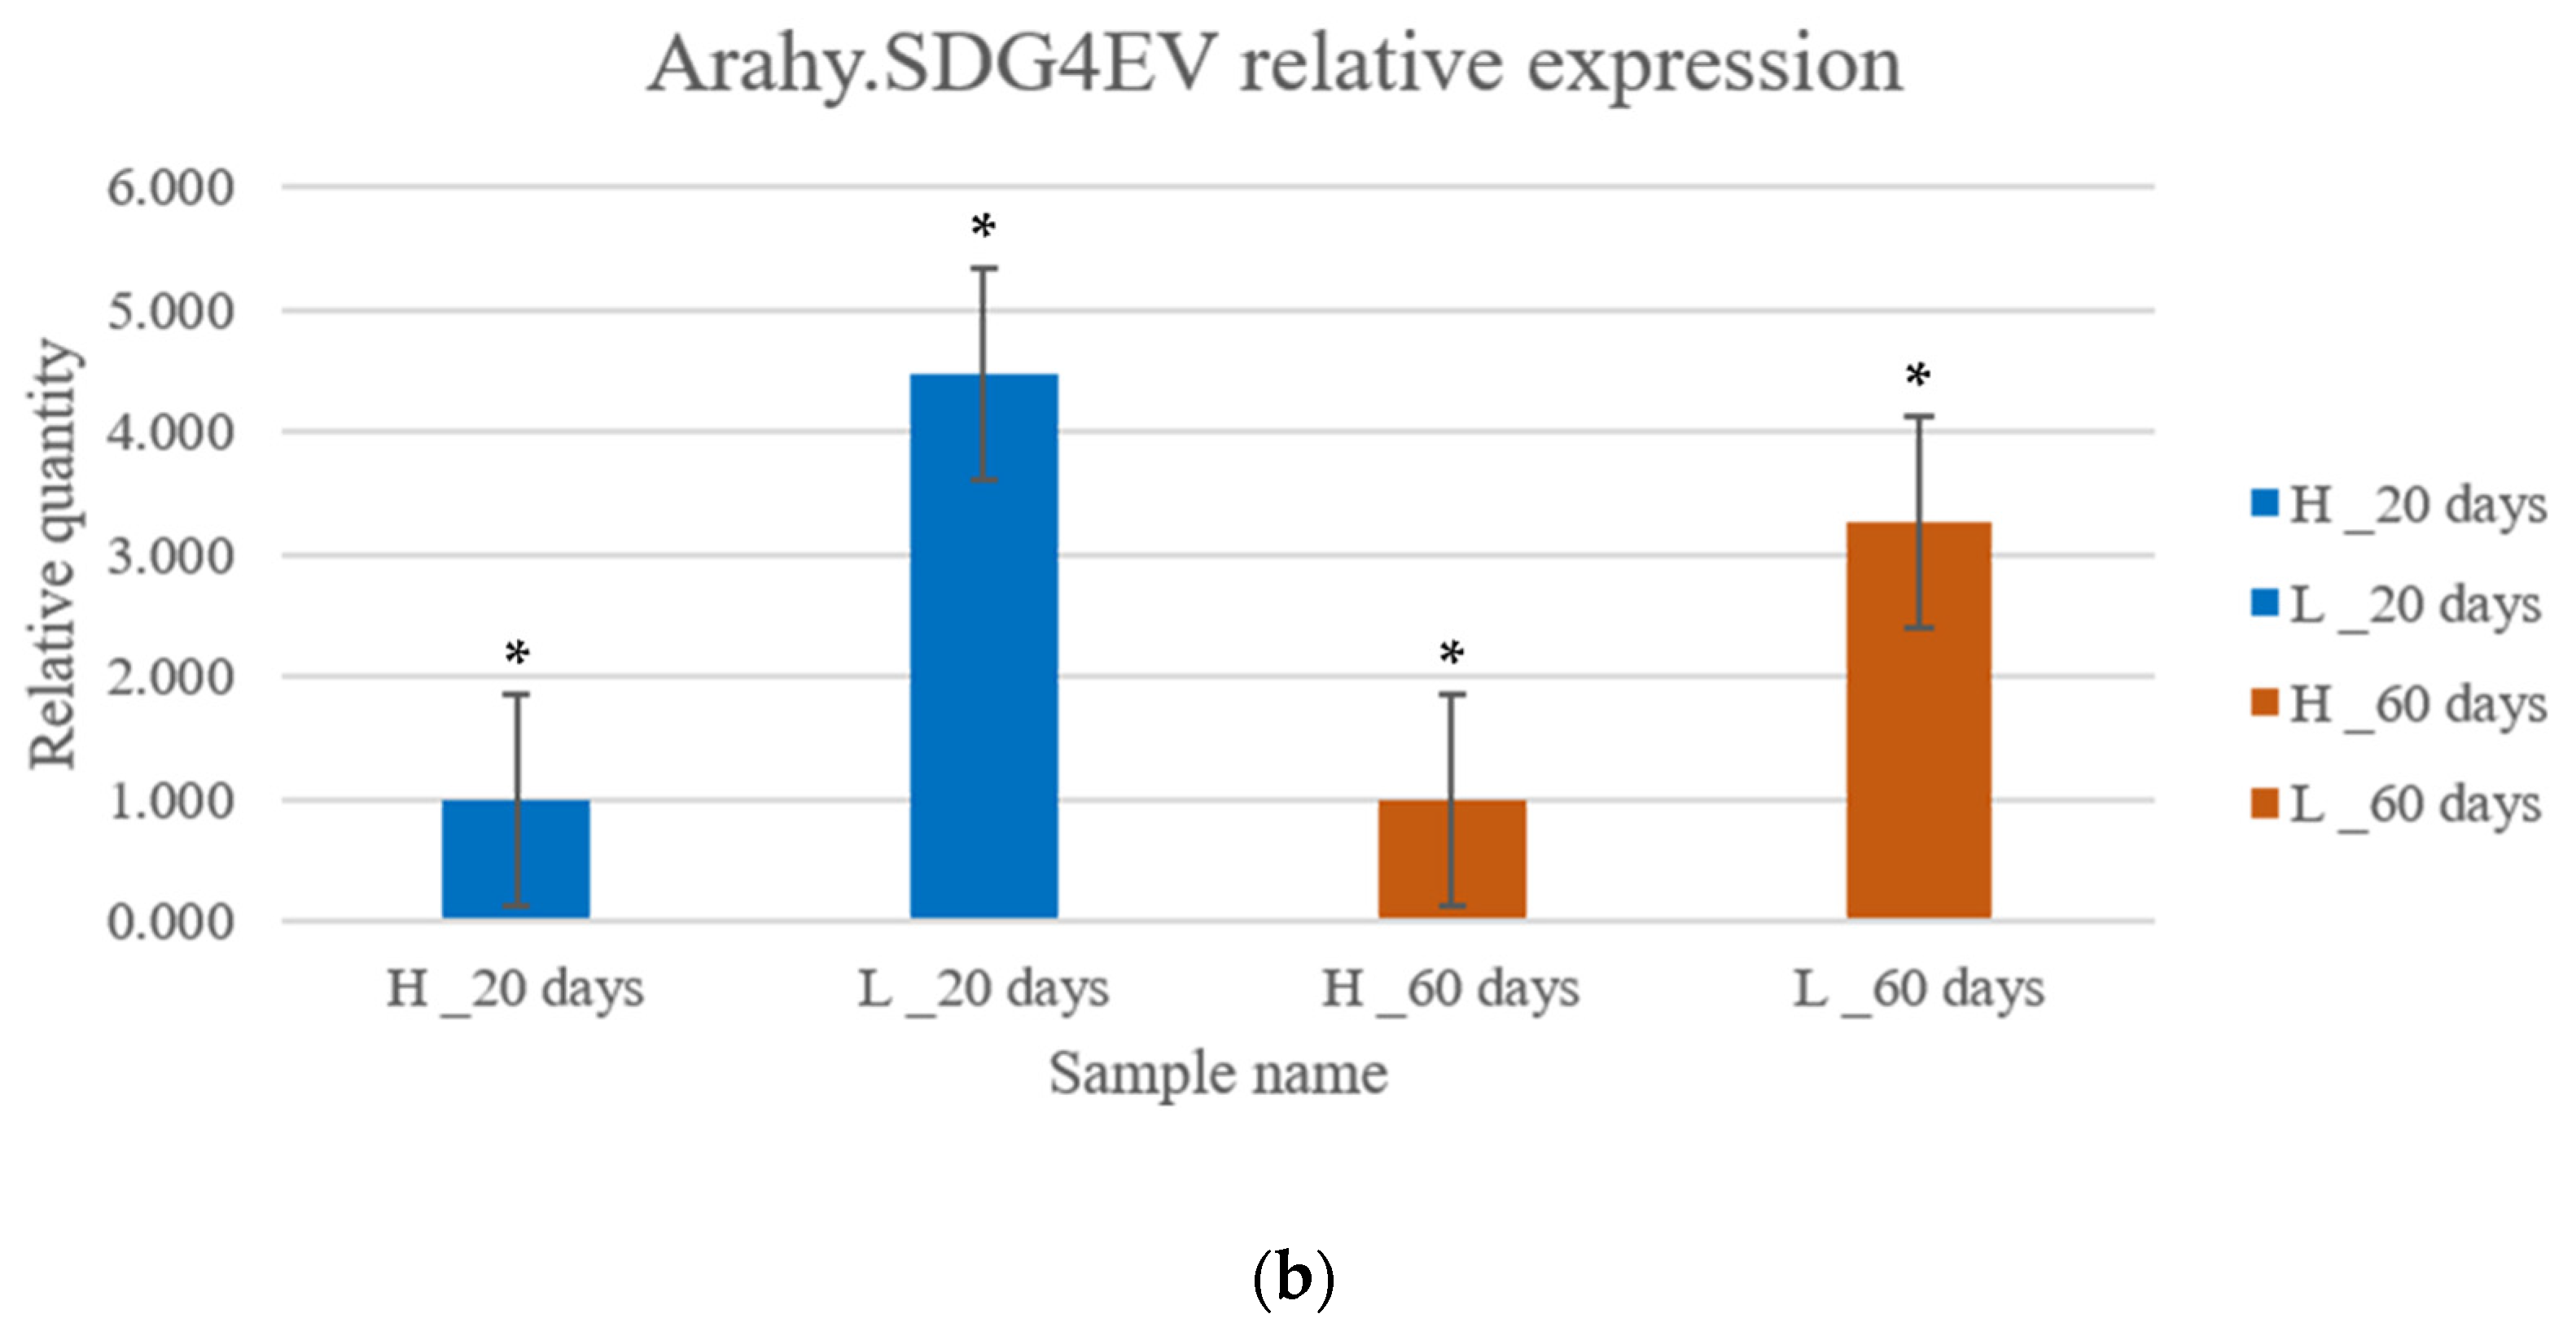
3.6. Gene Expression Analysis by qRT-PCR
4. Discussion
5. Conclusions
Supplementary Materials
Author Contributions
Funding
Institutional Review Board Statement
Informed Consent Statement
Data Availability Statement
Conflicts of Interest
References
- Dhillon, S.S.; Rake, A.V.; Miksche, J.P. Reassociation kinetics and cytophotometric characterization of peanut (Arachis hypogaea L.) DNA. Plant Physiol. 1980, 65, 1121–1127. [Google Scholar] [CrossRef]
- Barkley, N.L.; Isleib, A.T.; Culbreath, A. Why preserve and evaluate genetic resources in peanut? Meet. Abstr. 2013, 11. Available online: https://www.ars.usda.gov/research/publications/publication/?seqNo115=293128 (accessed on 21 December 2021).
- Taru, V.B.; Kyagya, I.Z.; Mshelia, S.I. Profitability of groundnut production in Michika local government area of Adamawa state, Nigeria. J. Agric. Sci. 2010, 1, 25–29. [Google Scholar] [CrossRef]
- Yang, L.; Han, R.; Sun, Y. Effects of exogenous nitric oxide on wheat exposed to enhanced ultraviolet-B radiation. Am. J. Plant Sci. 2013, 4, 1285. [Google Scholar] [CrossRef][Green Version]
- Qi, H.; Zhu, B.; Kong, L.; Yang, W.; Zou, J.; Lan, Y.; Zhang, L. Hyperspectral inversion model of chlorophyll content in peanut leaves. Appl. Sci. 2020, 10, 2259. [Google Scholar] [CrossRef]
- Xie, M.; Wang, Z.; Huete, A.; Brown, L.A.; Wang, H.; Xie, Q.; Ding, Y. Estimating peanut leaf chlorophyll content with dorsiventral leaf adjusted indices: Minimizing the impact of spectral differences between adaxial and abaxial leaf surfaces. Remote Sens. 2019, 11, 2148. [Google Scholar] [CrossRef]
- Peng, S.; Khush, G.S.; Virk, P.; Tang, Q.; Zou, Y. Progress in ideotype breeding to increase rice yield potential. Field Crops Res. 2008, 108, 32–38. [Google Scholar] [CrossRef]
- Sayed, O.H. Chlorophyll fluorescence as a tool in cereal research. Photosynthetica 2003, 41, 321–330. [Google Scholar] [CrossRef]
- Sarker, A.M.; Rahman, M.S.; Paul, N.K. Effect of soil moisture on relative leaf water content, chlorophyll, proline and sugar accumulation in wheat. J. Agron. Crop Sci. 1999, 183, 225–229. [Google Scholar] [CrossRef]
- Epron, D.; Dreyer, E. Long-term effects of drought on photosynthesis of adult oak trees [Quercus petraea (Matt.) Liebl. and Quercus robur L.] in a natural stand. New Phytol. 1993, 125, 381–389. [Google Scholar] [CrossRef]
- Sankar, B.; Karthishwaran, K.; Somasundaram, R. Photosynthetic pigment content alterations in Arachis hypogaea L. in relation to varied irrigation levels with growth hormone and triazoles. J. Ecobiotechnol. 2016, 5, 7–13. [Google Scholar]
- Nageswara Rao, R.C.; Talwar, H.S.; Wright, G.C. Rapid assessment of specific leaf area and leaf nitrogen in peanut (Arachis hypogaea L.) using a chlorophyll meter. J. Agron. Crop Sci. 2001, 186, 175–182. [Google Scholar] [CrossRef]
- Arunyanark, A.; Jogloy, S.; Akkasaeng, C.; Vorasoot, N.; Kesmala, T.; Nageswara Rao, R.C.; Patanothai, A. Chlorophyll stability is an indicator of drought tolerance in peanut. J. Agron. Crop Sci. 2008, 194, 113–125. [Google Scholar] [CrossRef]
- Dhanapal, A.P.; Ray, J.D.; Singh, S.K.; Hoyos-Villegas, V.; Smith, J.R.; Purcell, L.C.; Fritschi, F.B. Genome-wide association mapping of soybean chlorophyll traits based on canopy spectral reflectance and leaf extracts. BMC Plant Biol. 2016, 16, 174. [Google Scholar] [CrossRef] [PubMed]
- Guang-Jun, L.I.; He-Nan, L.I.; Cheng, L.G.; Zhang, Y.M. QTL analysis for dynamic expression of chlorophyll content in soybean (Glycine max L. Merr.). Acta Agron. Sin. 2010, 36, 242–248. [Google Scholar] [CrossRef]
- Hao, D.; Chao, M.; Yin, Z.; Yu, D. Genome-wide association analysis detecting significant single nucleotide polymorphisms for chlorophyll and chlorophyll fluorescence parameters in soybean (Glycine max) landraces. Euphytica 2012, 186, 919–931. [Google Scholar] [CrossRef]
- Upadhyaya, H.D.; Dwivedi, S.L.; Nadaf, H.L.; Singh, S. Phenotypic diversity and identification of wild Arachis accessions with useful agronomic and nutritional traits. Euphytica 2011, 182, 103–115. [Google Scholar] [CrossRef]
- Shaibu, A.S.; Motagi, B.N.; Muhammad, K.S. Peanut genotypes with high chlorophyll content and low leaf temperature are preferred in breeding program for drought prone areas. Legume Res. -Int. J. 2019, 42, 763–767. [Google Scholar] [CrossRef]
- Liu, X.; Li, L.; Li, M.; Su, L.; Lian, S.; Zhang, B.; Li, L. AhGLK1 affects chlorophyll biosynthesis and photosynthesis in peanut leaves during recovery from drought. Sci. Rep. 2018, 8, 2250. [Google Scholar] [CrossRef]
- Zhao, Z.; Tseng, Y.C.; Peng, Z.; Lopez, Y.; Chen, C.Y.; Tillman, B.L.; Dang, P.; Wang, J. Refining a major QTL controlling spotted wilt disease resistance in cultivated peanut (Arachis hypogaea L.) and evaluating its contribution to the resistance variations in peanut germplasm. BMC Genet. 2018, 19, 17. [Google Scholar] [CrossRef]
- Brown, A.H.D. The case for core collections. In The Use of Plant Genetic Resources; 1989; Cambridge University Press: Cambridge, UK; pp. 136–156. [Google Scholar]
- Tohme, J.M.; Beebe, S.E.; Iwanaga, M. The Combined Use of Agroecological and Characterisation Data to Establish the CIAT Phaseolus Vulgaris Core Collection; John Wiley and Sons: Chichester, UK, 1995; pp. 95–107. [Google Scholar]
- Brown, A.H.D. Core collections: A practical approach to genetic resources management. Genome 1989, 31, 818–824. [Google Scholar] [CrossRef]
- Upadhyaya, H.D.; Bramel, P.J.; Ortiz, R.; Singh, S. Developing a mini core of peanut for utilization of genetic resources. Crop. Sci. 2002, 42, 2150–2156. [Google Scholar] [CrossRef]
- Holbrook, C.C.; Anderson, W.F.; Pittman, R.N. Selection of a core collection from the US germplasm collection of peanut. Crop. Sci. 1993, 33, 859–861. [Google Scholar] [CrossRef]
- Jiang, H.F.; Ren, X.P.; Huang, J.Q.; Liao, B.S.; Lei, Y. Establishment of peanut mini core collection in China and exploration of new resource with high oleat. Chin. J. Oil Crop. Sci. 2008, 30, 294–299. [Google Scholar]
- Smartt, J.; Gregory, W.C.; Gregory, M.P. The genomes of Arachis hypogaea. 1. Cytogenetic studies of putative genome donors. Euphytica 1978, 27, 665–675. [Google Scholar] [CrossRef]
- Seijo, G.; Lavia, G.I.; Fernández, A.; Krapovickas, A.; Ducasse, D.A.; Bertioli, D.J.; Moscone, E.A. Genomic relationships between the cultivated peanut (Arachis hypogaea, L.) and its close relatives revealed by double GISH. Am. J. Bot. 2007, 94, 1963–1971. [Google Scholar] [CrossRef] [PubMed]
- Robledo, G.; Lavia, G.I.; Seijo, G. Species relations among wild Arachis species with the A genome as revealed by FISH mapping of rDNA loci and heterochromatin detection. Theor. Appl. Genet. 2009, 118, 1295–1307. [Google Scholar] [CrossRef]
- Bertioli, D.J.; Cannon, S.B.; Froenicke, L.; Huang, G.; Farmer, A.D.; Cannon, E.K.; Liu, X.; Gao, D.; Clevenger, J.; Dash, S.; et al. The genome sequences of Arachis duranensis and Arachis ipaensis, the diploid ancestors of cultivated peanut. Nat. Genet. 2016, 48, 438–446. [Google Scholar] [CrossRef]
- Moretzsohn, M.C.; Gouvea, E.G.; Inglis, P.W.; Leal-Bertioli, S.C.; Valls, J.F.; Bertioli, D.J. A study of the relationships of cultivated peanut (Arachis hypogaea) and its most closely related wild species using intron sequences and microsatellite markers. Ann. Bot. 2012, 111, 113–126. [Google Scholar] [CrossRef]
- Nielen, S.; Vidigal, B.S.; Leal-Bertioli, S.C.; Ratnaparkhe, M.; Paterson, A.H.; Garsmeur, O.; D’Hont, A.; Guimaraes, P.M.; Bertioli, D.J. Matita, a new retroelement from peanut: Characterization and evolutionary context in the light of the Arachis A–B genome divergence. Mol. Genet. Genom. 2012, 287, 21–38. [Google Scholar] [CrossRef]
- Kim, K.S.; Lee, D.; Bae, S.B.; Kim, Y.C.; Choi, I.S.; Kim, S.T.; Lee, T.H.; Jun, T.H. Development of SNP-Based Molecular Markers by Re-Sequencing Strategy in Peanut. Plant Breed. Biotechnol. 2017, 5, 325–333. [Google Scholar] [CrossRef]
- Temsch, E.M.; Greilhuber, J. Genome size variation in Arachis hypogaea and A. monticola re-evaluated. Genome 2000, 43, 449–451. [Google Scholar] [CrossRef]
- Chen, X.; Lu, Q.; Liu, H.; Zhang, J.; Hong, Y.; Lan, H.; Li, H.; Wang, J.; Liu, H.; Li, S.; et al. Sequencing of cultivated peanut, Arachis hypogaea, yields insights into genome evolution and oil improvement. Mol. Plant 2019, 12, 920–934. [Google Scholar] [CrossRef] [PubMed]
- Chen, X.; Li, H.; Pandey, M.K.; Yang, Q.; Wang, X.; Garg, V.; Li, H.; Chi, X.; Doddamani, D.; Hong, Y.; et al. Draft genome of the peanut A-genome progenitor (Arachis duranensis) provides insights into geocarpy, oil biosynthesis, and allergens. Proc. Natl. Acad. Sci. USA 2016, 113, 6785–6790. [Google Scholar] [CrossRef]
- Zou, K.; Kim, K.S.; Kim, K.; Kang, D.; Park, Y.H.; Sun, H.; Jun, T.H. Genetic Diversity and Genome-Wide Association Study of Seed Aspect Ratio Using a High-Density SNP Array in Peanut (Arachis hypogaea L.). Genes 2021, 12, 2. [Google Scholar] [CrossRef]
- Pandey, M.K.; Monyo, E.; Ozias-Akins, P.; Liang, X.; Guimarães, P.; Nigam, S.N.; Upadhyaya, H.D.; Janila, P.; Zhang, X.; Guo, B.; et al. Advances in Arachis genomics for peanut improvement. Biotechnol. Adv. 2012, 30, 639–651. [Google Scholar] [CrossRef] [PubMed]
- Varshney, R.K.; Mohan, S.M.; Gaur, P.M.; Gangarao, N.V.P.R.; Pandey, M.K.; Bohra, A.; Sawargaonkar, S.L.; Chitikineni, A.; Kimurto, P.K.; Janila, P.; et al. Achievements and prospects of genomics-assisted breeding in three legume crops of the semi-arid tropics. Biotechnol. Adv. 2013, 31, 1120–1134. [Google Scholar] [CrossRef]
- Pandey, M.K.; Roorkiwal, M.; Singh, V.K.; Ramalingam, A.; Kudapa, H.; Thudi, M.; Chitikineni, A.; Rathore, A.; Varshney, R.K. Emerging genomic tools for legume breeding: Current status and future prospects. Front. Plant Sci. 2016, 7, 455. [Google Scholar] [CrossRef] [PubMed]
- Pandey, M.K.; Agarwal, G.; Kale, S.M.; Clevenger, J.; Nayak, S.N.; Sriswathi, M.; Chitikineni, A.; Chavarro, C.; Chen, X.; Upadhyaya, H.D.; et al. Development and evaluation of a high density genotyping ‘Axiom_Arachis’ array with 58 K SNPs for accelerating genetics and breeding in groundnut. Sci. Rep. 2017, 7, 40577. [Google Scholar] [CrossRef]
- Clevenger, J.P.; Korani, W.; Ozias-Akins, P.; Jackson, S. Haplotype-based genotyping in polyploids. Front. Plant Sci. 2018, 9, 564. [Google Scholar] [CrossRef]
- Zhang, X.; Zhang, J.; He, X.; Wang, Y.; Ma, X.; Yin, D. Genome-wide association study of major agronomic traits related to domestication in peanut. Front. Plant Sci. 2017, 8, 1611. [Google Scholar] [CrossRef]
- Wang, J.; Yan, C.; Li, Y.; Li, C.; Zhao, X.; Yuan, C.; Shan, S. GWAS discovery of candidate genes for yield-related traits in peanut and support from earlier QTL mapping studies. Genes 2019, 10, 803. [Google Scholar] [CrossRef] [PubMed]
- Zhang, H.; Wang, M.L.; Dang, P.; Jiang, T.; Zhao, S.; Lamb, M.; Chen, C. Identification of potential QTLs and genes associated with seed composition traits in peanut (Arachis hypogaea L.) using GWAS and RNA-Seq analysis. Gene 2021, 769, 145215. [Google Scholar] [CrossRef]
- Otyama, P.I.; Wilkey, A.; Kulkarni, R.; Assefa, T.; Chu, Y.; Clevenger, J.; Cannon, S.B. Evaluation of linkage disequilibrium, population structure, and genetic diversity in the US peanut mini core collection. BMC Genom. 2019, 20, 481. [Google Scholar] [CrossRef] [PubMed]
- Samdur, M.Y.; Singh, A.L.; Mathur, R.K.; Manivel, P.; Chikani, B.M.; Gor, H.K.; Khan, M.A. Field evaluation of chlorophyll meter for screening groundnut (Arachis hypogaea L.) genotypes tolerant to iron-deficiency chlorosis. Curr. Sci. 2000, 79, 211–214. [Google Scholar]
- Akkasaeng, C.; Vorasoot, N.; Jogloy, S.; Patanotai, A. Relationship between SPAD readings and chlorophyll contents in leaves of peanut (Arachis hypogaea L.). Thai J. Agric. Sci. 2003, 36, 279–284. [Google Scholar]
- Alexander, D.H.; Novembre, J.; Lange, K. Fast model-based estimation of ancestry in unrelated individuals. Genome Res. 2009, 19, 1655–1664. [Google Scholar] [CrossRef] [PubMed]
- Tang, Y.; Liu, X.; Wang, J.; Li, M.; Wang, Q.; Tian, F.; Buckler, E.S. GAPIT version 2: An enhanced integrated tool for genomic association and prediction. Plant Genome 2016, 9. [Google Scholar] [CrossRef]
- Li, M.; Liu, X.; Bradbury, P.; Yu, J.; Zhang, Y.M.; Todhunter, R.J.; Zhang, Z. Enrichment of statistical power for genome-wide association studies. BMC Biol. 2014, 12, 73. [Google Scholar] [CrossRef] [PubMed]
- Yang, W.; Guo, Z.; Huang, C.; Duan, L.; Chen, G.; Jiang, N.; Xiong, L. Combining high-throughput phenotyping and genome-wide association studies to reveal natural genetic variation in rice. Nat. Commun. 2014, 5, 5087. [Google Scholar] [CrossRef] [PubMed]
- Hill, W.G.; Robertson, A. Linkage disequilibrium in finite populations. Theor. Appl. Genet. 1968, 38, 226–231. [Google Scholar] [CrossRef] [PubMed]
- Jiang, S.; Sun, Y.; Wang, S. Selection of reference genes in peanut seed by real-time quantitative polymerase chain reaction. Int. J. Food Sci. Technol. 2011, 46, 2191–2196. [Google Scholar] [CrossRef]
- Livak, K.J.; Schmittgen, T.D. Analysis of relative gene expression data using real-time quantitative PCR and the 2−ΔΔCT method. Methods 2001, 25, 402–408. [Google Scholar] [CrossRef] [PubMed]
- Bertioli, D.J.; Jenkins, J.; Clevenger, J.; Dudchenko, O.; Gao, D.; Samoluk, S.S. The genome sequence of segmental allotetraploid peanut Arachis hypogaea. Nat. Genet. 2019, 51, 877–884. [Google Scholar] [CrossRef]
- Otyama, P.I.; Kulkarni, R.; Chamberlin, K.; Ozias-Akins, P.K.; Chu, J.; Fernández-Baca, D.F. Genotypic characterization of the US peanut core collection. BioRxiv 2020, 10, 4013–4026. [Google Scholar] [CrossRef]
- Zhuang, W.; Chen, H.; Yang, M.; Wang, J.; Pandey, M.K.; Zhang, C.; Varshney, R.K. The genome of cultivated peanut provides insight into legume karyotypes, polyploid evolution and crop domestication. Nat. Genet. 2019, 51, 865–876. [Google Scholar] [CrossRef]
- Kaler, A.S.; Purcell, L.C. Estimation of a significance threshold for genome-wide association studies. BMC Genom. 2019, 20, 618. [Google Scholar] [CrossRef] [PubMed]
- Yu, J.; Pressoir, G.; Briggs, W.H.; Bi, I.V.; Yamasaki, M.; Doebley, J.F.; McMullen, M.D.; Gaut, B.S.; Nielsen, D.M.; Holland, J.B.; et al. A unified mixed-model method for association mapping that accounts for multiple levels of relatedness. Nat. Genet. 2006, 38, 203–208. [Google Scholar] [CrossRef]
- Vilas, J.M.; Burgos, E.; Puig, M.L.; Colazo, J.; Livore, A.; Ruiz, O.A.; Maiale, S.J. Genetic structure of Photosystem II functionality in rice unraveled by GWAS analysis. BioRxiv 2020. [Google Scholar] [CrossRef]
- Yang, D.; Li, M.; Liu, Y.; Chang, L.; Cheng, H.; Chen, J.; Chai, S. Identification of quantitative trait loci and water environmental interactions for developmental behaviors of leaf greenness in wheat. Front. Plant Sci. 2016, 7, 273. [Google Scholar] [CrossRef]
- Wang, L.; Conteh, B.; Fang, L.; Xia, Q.; Nian, H. QTL mapping for soybean (Glycine max L.) leaf chlorophyll-content traits in a genotyped RIL population by using RAD-seq based high-density linkage map. BMC Genom. 2020, 21, 739. [Google Scholar] [CrossRef]
- Tafesse, E.G.; Gali, K.K.; Lachagari, V.B.; Bueckert, R.; Warkentin, T.D. Genome-wide association mapping for heat stress responsive traits in field pea. Int. J. Mol. Sci. 2020, 21, 2043. [Google Scholar] [CrossRef]
- Lee, T.; Kim, K.D.; Kim, J.M.; Shin, I.; Heo, J.; Jung, J.; Kang, S. Genome-Wide Association Study for Ultraviolet-B Resistance in Soybean (Glycine max L.). Plants 2021, 10, 1335. [Google Scholar] [CrossRef]
- Li, Y.; He, N.; Hou, J.; Xu, L.; Liu, C.; Zhang, J.; Wu, X. Factors influencing leaf chlorophyll content in natural forests at the biome scale. Front. Ecol. Evol. 2018, 6, 64. [Google Scholar] [CrossRef]
- Fredeen, A.L.; Raab, T.K.; Rao, I.M.; Terry, N. Effects of phosphorus nutrition on photosynthesis in Glycine max (L.). Merr. Planta 1990, 181, 399–405. [Google Scholar] [CrossRef]
- Wolken, J.J.; Mellon, A.D.; Greenblatt, C.L. Environmental Factors Affecting Growth and Chlorophyll Synthesis in Euglena.* I. Physical and Chemical. II. The Effectiveness of the Spectrum for Chlorophyll Synthesis. J. Protozool. 1955, 2, 89–96. [Google Scholar] [CrossRef]
- Krause, G.H.; Weis, E. Chlorophyll fluorescence and photosynthesis: The basics. Annu. Rev. Plant Biol. 1991, 42, 313–349. [Google Scholar] [CrossRef]
- Wang, F.; Wang, G.; Li, X.; Huang, J.; Zheng, J. Heredity, physiology and mapping of a chlorophyll content gene of rice (Oryza sativa L.). J. Plant Physiol. 2008, 165, 324–330. [Google Scholar] [CrossRef]
- Moon, J.; Zhu, L.; Shen, H.; Huq, E. PIF1 directly and indirectly regulates chlorophyll biosynthesis to optimize the greening process in Arabidopsis. Proc. Natl. Acad. Sci. USA 2008, 105, 9433–9438. [Google Scholar] [CrossRef] [PubMed]
- Huq, E.; Al-Sady, B.; Hudson, M.; Kim, C.; Apel, K.; Quail, P.H. Phytochrome-interacting factor 1 is a critical bHLH regulator of chlorophyll biosynthesis. Science 2004, 305, 1937–1941. [Google Scholar] [CrossRef] [PubMed]


| Group | SNP | Chromosome | Position (bp) | p-Value (p) 1 |
|---|---|---|---|---|
| 2019 | AX-176822908 | Araip.B05 | 114145435 | 2.12 × 10⁻⁵ |
| AX-176820297 | Araip.B05 | 118278277 | 2.78 × 10⁻⁵ | |
| AX-147230060 | Aradu.A08 | 15123765 | 3.65 × 10⁻⁵ | |
| 2020 | AX-177644092 AX-176794744 | Araip.B08 Araip.B06 | 80072452 103047540 | 6.49 × 10⁻⁵ 6.54 × 10⁻⁵ |
| Combined | AX-176823290 | Araip.B02 | 45735578 | 1.47 × 10⁻⁵ |
| AX-176820297 | Araip.B05 | 118278277 | 2.26 × 10⁻⁵ | |
| AX-147212224 | Aradu.A02 | 533285 | 2.52 × 10⁻⁵ |
Publisher’s Note: MDPI stays neutral with regard to jurisdictional claims in published maps and institutional affiliations. |
© 2022 by the authors. Licensee MDPI, Basel, Switzerland. This article is an open access article distributed under the terms and conditions of the Creative Commons Attribution (CC BY) license (https://creativecommons.org/licenses/by/4.0/).
Share and Cite
Zou, K.; Kim, K.-S.; Kang, D.; Kim, M.-C.; Ha, J.; Moon, J.-K.; Jun, T.-H. Genome-Wide Association Study of Leaf Chlorophyll Content Using High-Density SNP Array in Peanuts (Arachis hypogaea L.). Agronomy 2022, 12, 152. https://doi.org/10.3390/agronomy12010152
Zou K, Kim K-S, Kang D, Kim M-C, Ha J, Moon J-K, Jun T-H. Genome-Wide Association Study of Leaf Chlorophyll Content Using High-Density SNP Array in Peanuts (Arachis hypogaea L.). Agronomy. 2022; 12(1):152. https://doi.org/10.3390/agronomy12010152
Chicago/Turabian StyleZou, Kunyan, Ki-Seung Kim, Dongwoo Kang, Min-Cheol Kim, Jungmin Ha, Jung-Kyung Moon, and Tae-Hwan Jun. 2022. "Genome-Wide Association Study of Leaf Chlorophyll Content Using High-Density SNP Array in Peanuts (Arachis hypogaea L.)" Agronomy 12, no. 1: 152. https://doi.org/10.3390/agronomy12010152
APA StyleZou, K., Kim, K.-S., Kang, D., Kim, M.-C., Ha, J., Moon, J.-K., & Jun, T.-H. (2022). Genome-Wide Association Study of Leaf Chlorophyll Content Using High-Density SNP Array in Peanuts (Arachis hypogaea L.). Agronomy, 12(1), 152. https://doi.org/10.3390/agronomy12010152