Article

Multitemporal Spatial Analysis of Land Use and Land Cover Changes in the Lower Jaguaribe Hydrographic Sub-Basin, Ceará, Northeast Brazil

1
Research Center on Remote Sensing and Meteorology, Federal University of Rio Grande do Sul, Porto Alegre 91501-970, Brazil
2
Institute of Agricultural Sciences, Federal University of Minas Gerais, Montes Claros 31270-901, Brazil
3
Geosciences Department, Federal University of Rio Grande do Sul, Porto Alegre 91501-970, Brazil
4
Earth System Science Center, National Institute for Space Research, São José dos Campos 12227-010, Brazil
*
Author to whom correspondence should be addressed.
Land 2022, 11(1), 103; https://doi.org/10.3390/land11010103
Submission received: 29 November 2021 / Revised: 27 December 2021 / Accepted: 29 December 2021 / Published: 8 January 2022
(This article belongs to the Special Issue Remote Sensing Analysis of Agricultural Landscapes)

Abstract

:
Aquaculture is currently one of the fastest growing food production systems globally, and shrimp is considered one of the most highly valued products. Our study area is the lower Jaguaribe River sub-basin (LJRSB), located in the northeastern part of Ceará in Brazil. The aquaculture activity in this area began in the early 1990s and is currently one of the largest shrimp producers in Brazil. This study generated a spatial-temporal analysis of vegetation index and land use and land cover (LULC) using remote sensing images from Landsat satellites processed using geographic information systems (GIS). The findings showed an increase in the water bodies class where shrimp farms are found. In addition, to help us discuss the results, data from the Global Surface Water Explorer was also used to understand this change throughout intra and interannual water variability. Besides shrimp farms’ intensification, agricultural areas in the LJRSB also increased, mainly in the irrigated perimeter lands (IPLs), causing a loss in the Caatinga native vegetation. In summary, over recent years, significant changes have been noticeable in the LJRSB coastal region, caused by an increase in shrimp farms mainly located on the Jaguaribe River margins, destroying the native riparian forest.

1. Introduction

Understanding the dynamics between human beings and the environment is already considered a priority for research and investment by the entire community that studies global environmental changes [1]. Consequently, understanding the integration between complex human-environmental systems, analyzing their causes, consequences, and effects is essential to organize land use and obtain information that improves the management of river basins and environments [2,3].
The increase in agricultural areas is one of the most significant and essential changes in land use, affecting environmental sustainability [4] and causing deforestation [5]. Therefore, it is considered one of the main ways of analyzing the social-environmental interaction and is being recognized in several regions of the globe, such as Lake Poyang, China [2], Msimbazi basin, Tanzania [6], Ethiopian basins [7], and the Brazilian Cerrado [8].
However, activities such as tourism, wind farms, shrimp, and fish farming, among others, have increased enormously [9]. The lack of public control and planning of these activities has caused an increase in mineral and vegetable extraction, leading to environmental degradation, mainly in the mangrove regions close to the coast and in the margins of inland water bodies [10]. Aquaculture, especially shrimp farming, has grown significantly in Brazil and the Ceará state, mainly in the lower Jaguaribe River sub-basin (LJRSB). However, it is an activity that generates conflict with water pollution, the destruction of mangroves, and the disruption of fishing communities.
In addition, there is an intense relationship between shrimp farming and the intensive and uncontrolled degradation of ecosystems, which usually causes deforestation in mangrove regions and inadequate occupations in areas along the beach and close to rivers, being the leading cause of mangrove destruction [11]. The intense change is caused by shrimp farming and land use and occupation, especially in the coastal regions of northeastern Brazil [12].
The landscape modification over time has become progressively accelerated due to the increase of occupation and land use by humans, which is often carried out without any planning and supervision from the public government. Therefore, the environment and hydrological processes are severely affected, which requires an understanding and monitoring of the modifications in order to ensure sustainable development and management of water resources and ecosystem services [13,14].
Remote sensing products have been widely used to monitor land use and land cover (LULC) change to collect and expand quantitative information about the Earth. This is mainly because of improved image interpretation techniques and evolutionary analysis using geoprocessing tools and digital image processing (DIP) [15,16,17].
Therefore, LULC studies are essential in monitoring landscape changes, highlighting the contradiction between ecosystems and economic development [18], and reflecting the intensity and modes of human-environment interactions [19]. The Brazilian Institute of Geography and Statistics (IBGE) prepared a technical manual for LULC analysis [20]. In this manual, land cover is considered the human activity expression on the terrestrial surface and is directly linked to land use and management. Studies that correlate land cover characterization, the analysis of its different services, and management are essential in understanding the landscape changes and their intensity and direction.
Thus, this study aims to understand how land use and land cover are spatially changing in the lower Jaguaribe hydrographic sub-basin in the Ceará state in Brazil, using remote sensing. Consequently, a multitemporal evaluation in the LJRSB was performed to create land use and land cover, vegetation index, and water surface frequency maps to achieve this objective.

2. Materials and Methods
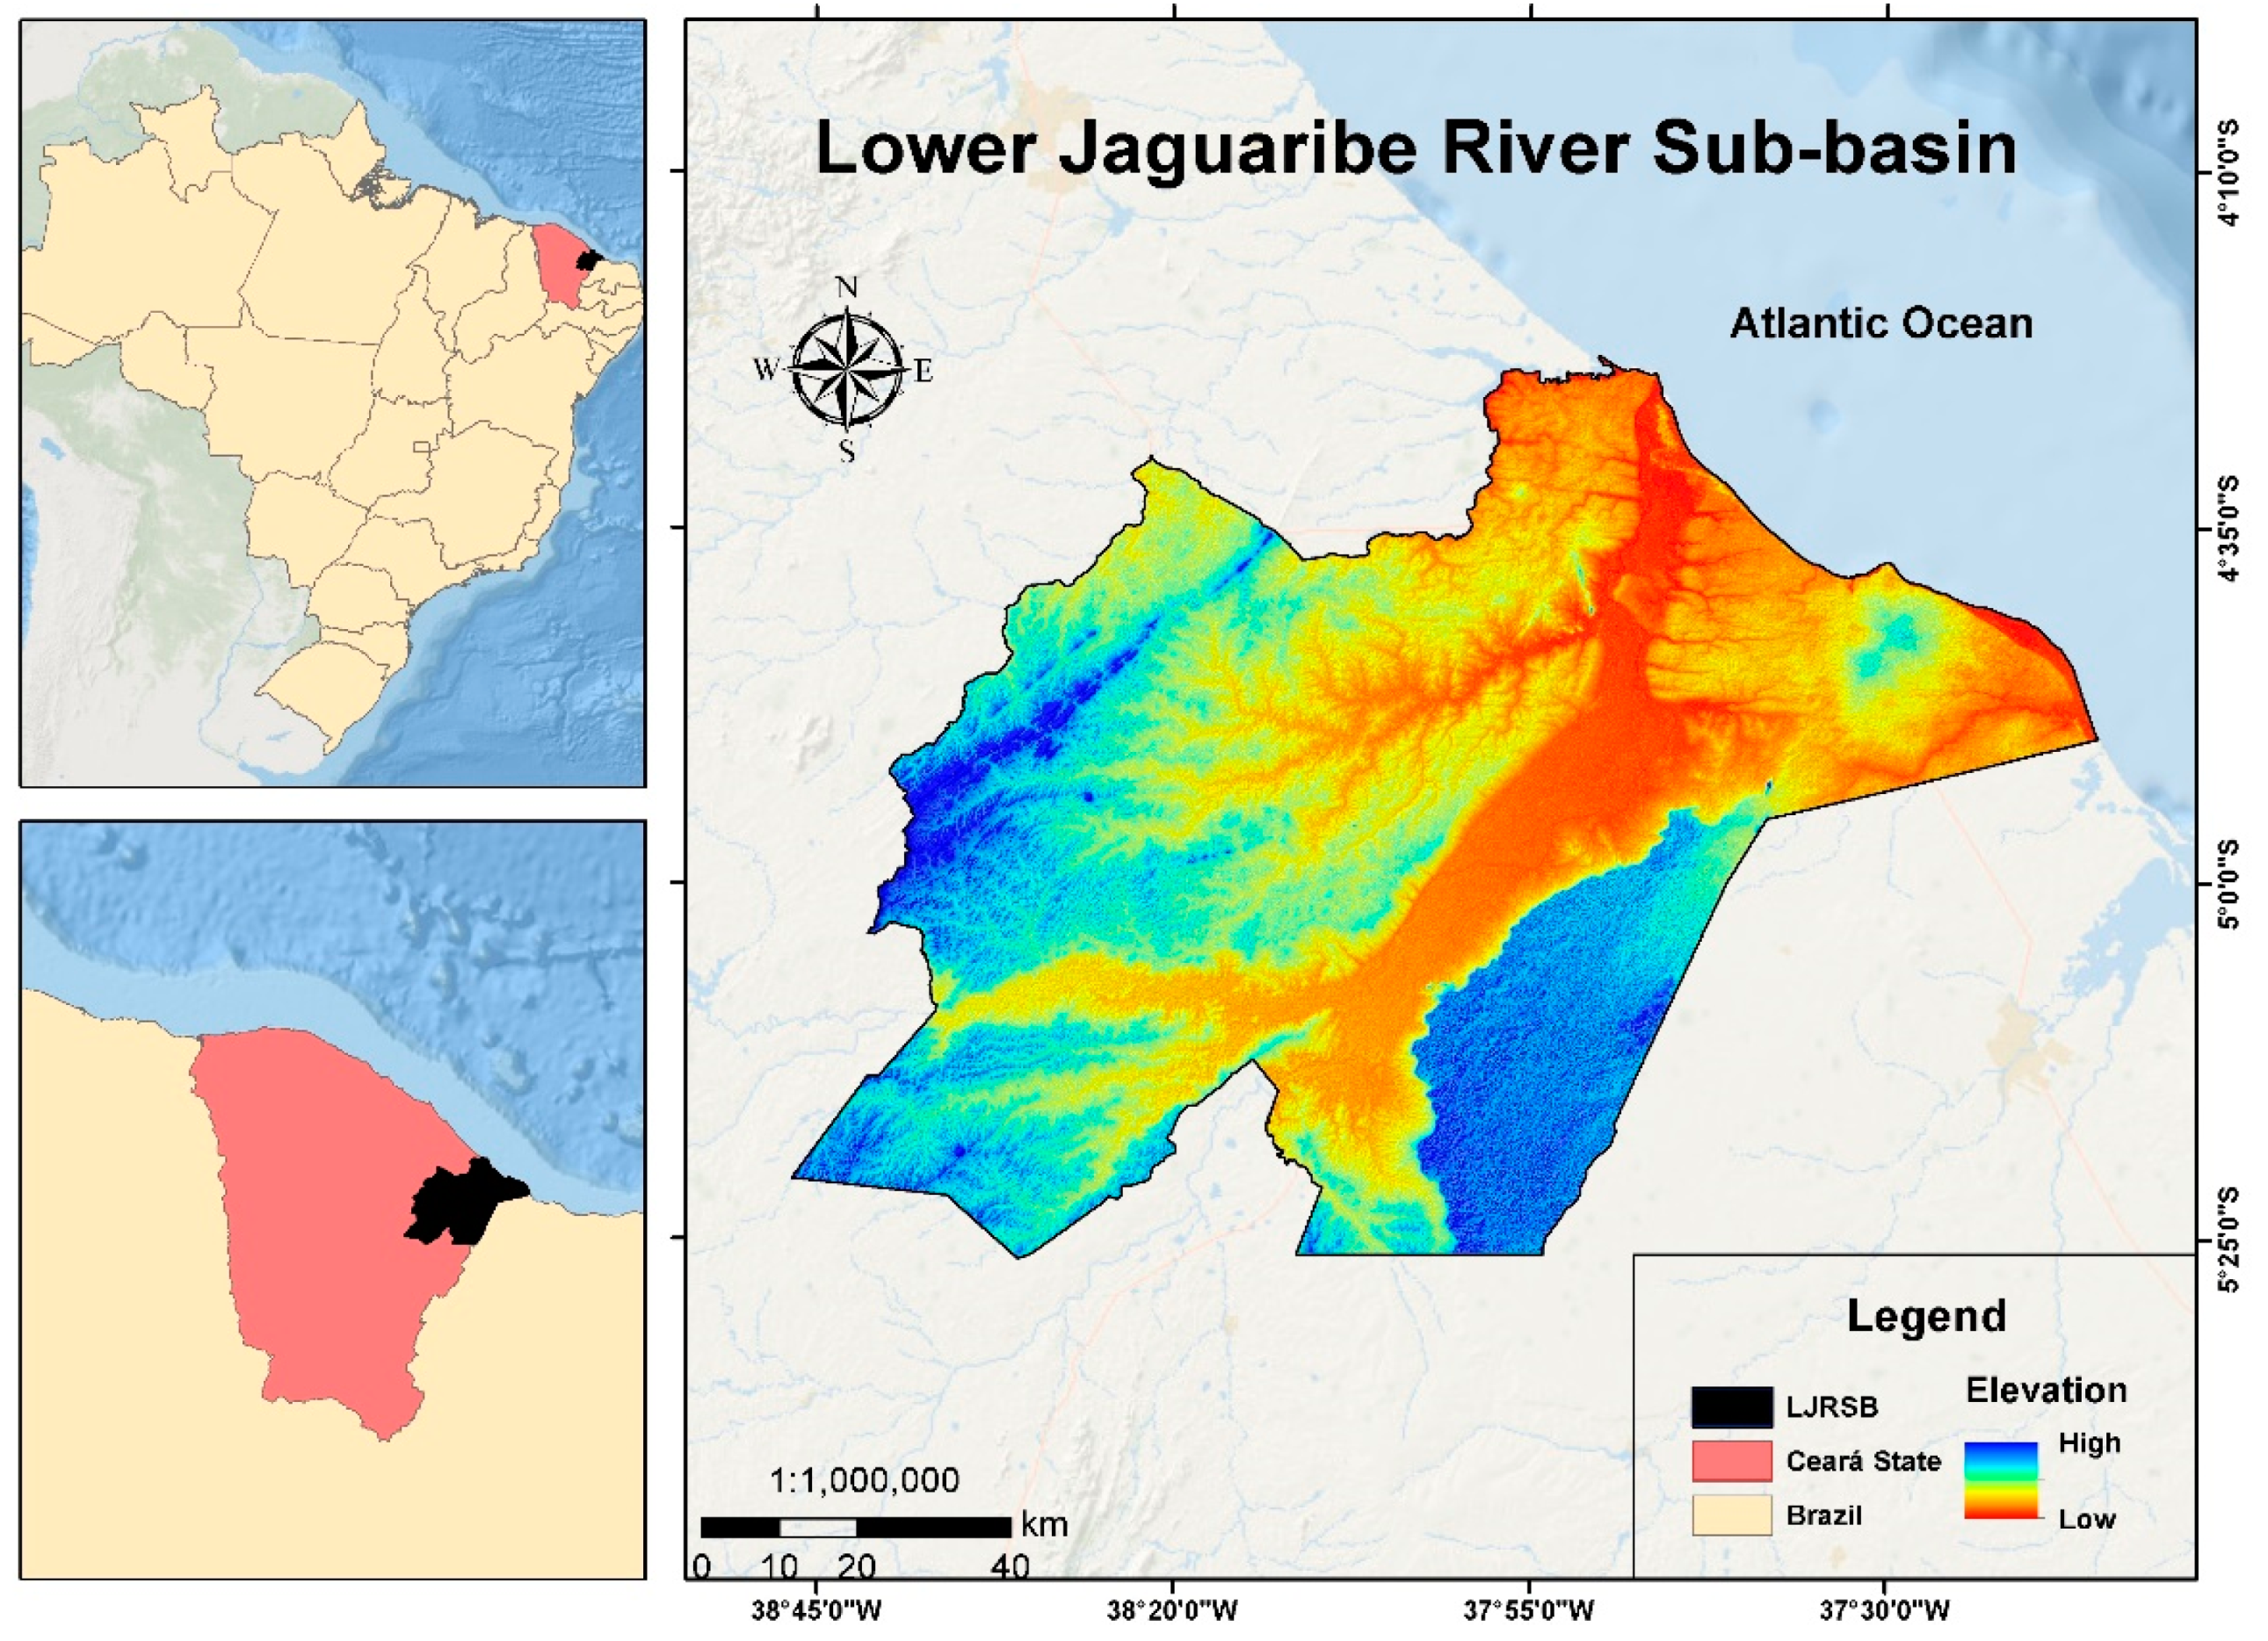
2.1. Study Area

The Jaguaribe River basin covers approximately 48% of Ceará territory in Brazil. Its importance dates back to the beginning of the colonization period when the Jaguaribe River, the basin’s main tributary, served as a path to expand cattle ranching in the region. This watercourse used to be considered the largest dry river in the world, increasing in volume during rainy seasons and completely drying in drought periods. Currently, it is no longer considered an intermittent river due to the hydrological control provided by the creation of the Castanhão and Orós water reservoirs, the biggest in the Ceará state, with water fluxes of 16,400 and 6890 L per second, respectively [21].
The lower Jaguaribe River valley extends from the northeast to the coast of Ceará (Figure 1). The geological, hydrographic, and landscape characteristics make the valley a privileged region, spreading floodplains over kilometers and established cities [22]. The Jaguaribe River is the main river of this sub-basin, draining 7021 km2 and covering an entire course of 137 km [23].
The climate in the LJRSB is hot, semiarid, characterized as dry, and very hot by the Köppen classification, with mean annual temperatures ranging from 26 °C to 28 °C. The mean annual rainfall is 838 mm. During May, rainfall varies from 30 to 200 mm and is almost zero in October (Table 1) [24].
The predominant vegetation types are Restinga, which consists of sandy coastal plain vegetation, and Caatinga, with deciduous thorn woodland shrubs and trees [13]. Furthermore, the LJRSB is also constituted by the irrigated public lands (IPLs), whose infrastructure is designed, implemented, and operated by the Brazilian government. The irrigated perimeter is used for agricultural production by societal interests such as family lots and diverse societal and business interests [25,26].
Shrimp farming began to be cultivated in Ceará in the early 1990s, initially covering the estuarine areas of Fortim, Icapuí, and Aracati cities. This last one became the leading shrimp producer in the LJRSB and the state. Due to the activity overgrowth, shrimp farms started to spread to the Jaguaribe River floodplain after the 2000s, when the towns of Limoeiro do Norte, Russas, Jaguaruana, and Itaiçaba incorporated the activity (Table 2). Therefore, since then the LJRSB has become a specialized region in shrimp production.
The shrimp farming growth in the LJRSB was favored by soil properties, climate characteristics, and the large land areas in the floodplains and estuary. In addition to favorable physical conditions, the government has invested in infrastructure, storage, telecommunications, and electricity. Therefore, where there are good environmental characteristics and investments in infrastructure, shrimp farms have increased over time. From the perspective of temporal persistence, more than 50% of the aquaculture area in Ceará has remained the same for more than the last ten years [29].

2.2. Processing of Satellite Images

The methodology in this study was based on data analysis related to shrimp farm production in the LJRSB and remote sensing satellite products. First, the land use, land cover, and vegetation index were generated for 1999, 2004, 2008, and 2015. The training data were obtained by interpreting satellite images with the help of the NDVI and field verifications. In total, 150 known points were used based on high spatial resolution images, and 50 field points collected with GPS were used. After that, the Kappa index was generated for validation, and data from the Global Surface Water Explorer (GSWE) project were used to assist the spatiotemporal analysis (Figure 2).

2.2.1. Data Acquisition

This study used several Landsat images from the United States Geological Survey (USGS) to analyze vegetation cover and land use classes in the LJRSB. They corresponded to four different dates from 1999 to 2015 [30]. The image information (year, date, and obtained scenes) are described in Table 3.
The selected image’s date corresponded to the drought season [24] and was chosen due to low cloud interference for this time of the year, which could influence the image classification. In addition, the images from the dry season present the lowest water class levels, influenced by the climate, which is an essential factor to be considered because we aim to demonstrate the water body’s spatial changes over the years and how shrimp farms influenced these changes.
To help us understand how the surface water changes in the LJRSB, we also used data from the Global Surface Water Explorer (GSWE) project, highlighting different facets of surface water dynamics [31]. Using Landsat images, the GSWE project also shows where and when open water was present on the Earth’s surface between 1984 and 2020. This data has been used in several studies where the water surface is needed, for example, to be applied to locate shrimp farms [32]. The GSWE data from water occurrence, recurrence, transitions, and occurrence change intensity were used in this study and downloaded from http://global-surface-water.appspot.com/download in 15 July 2021.

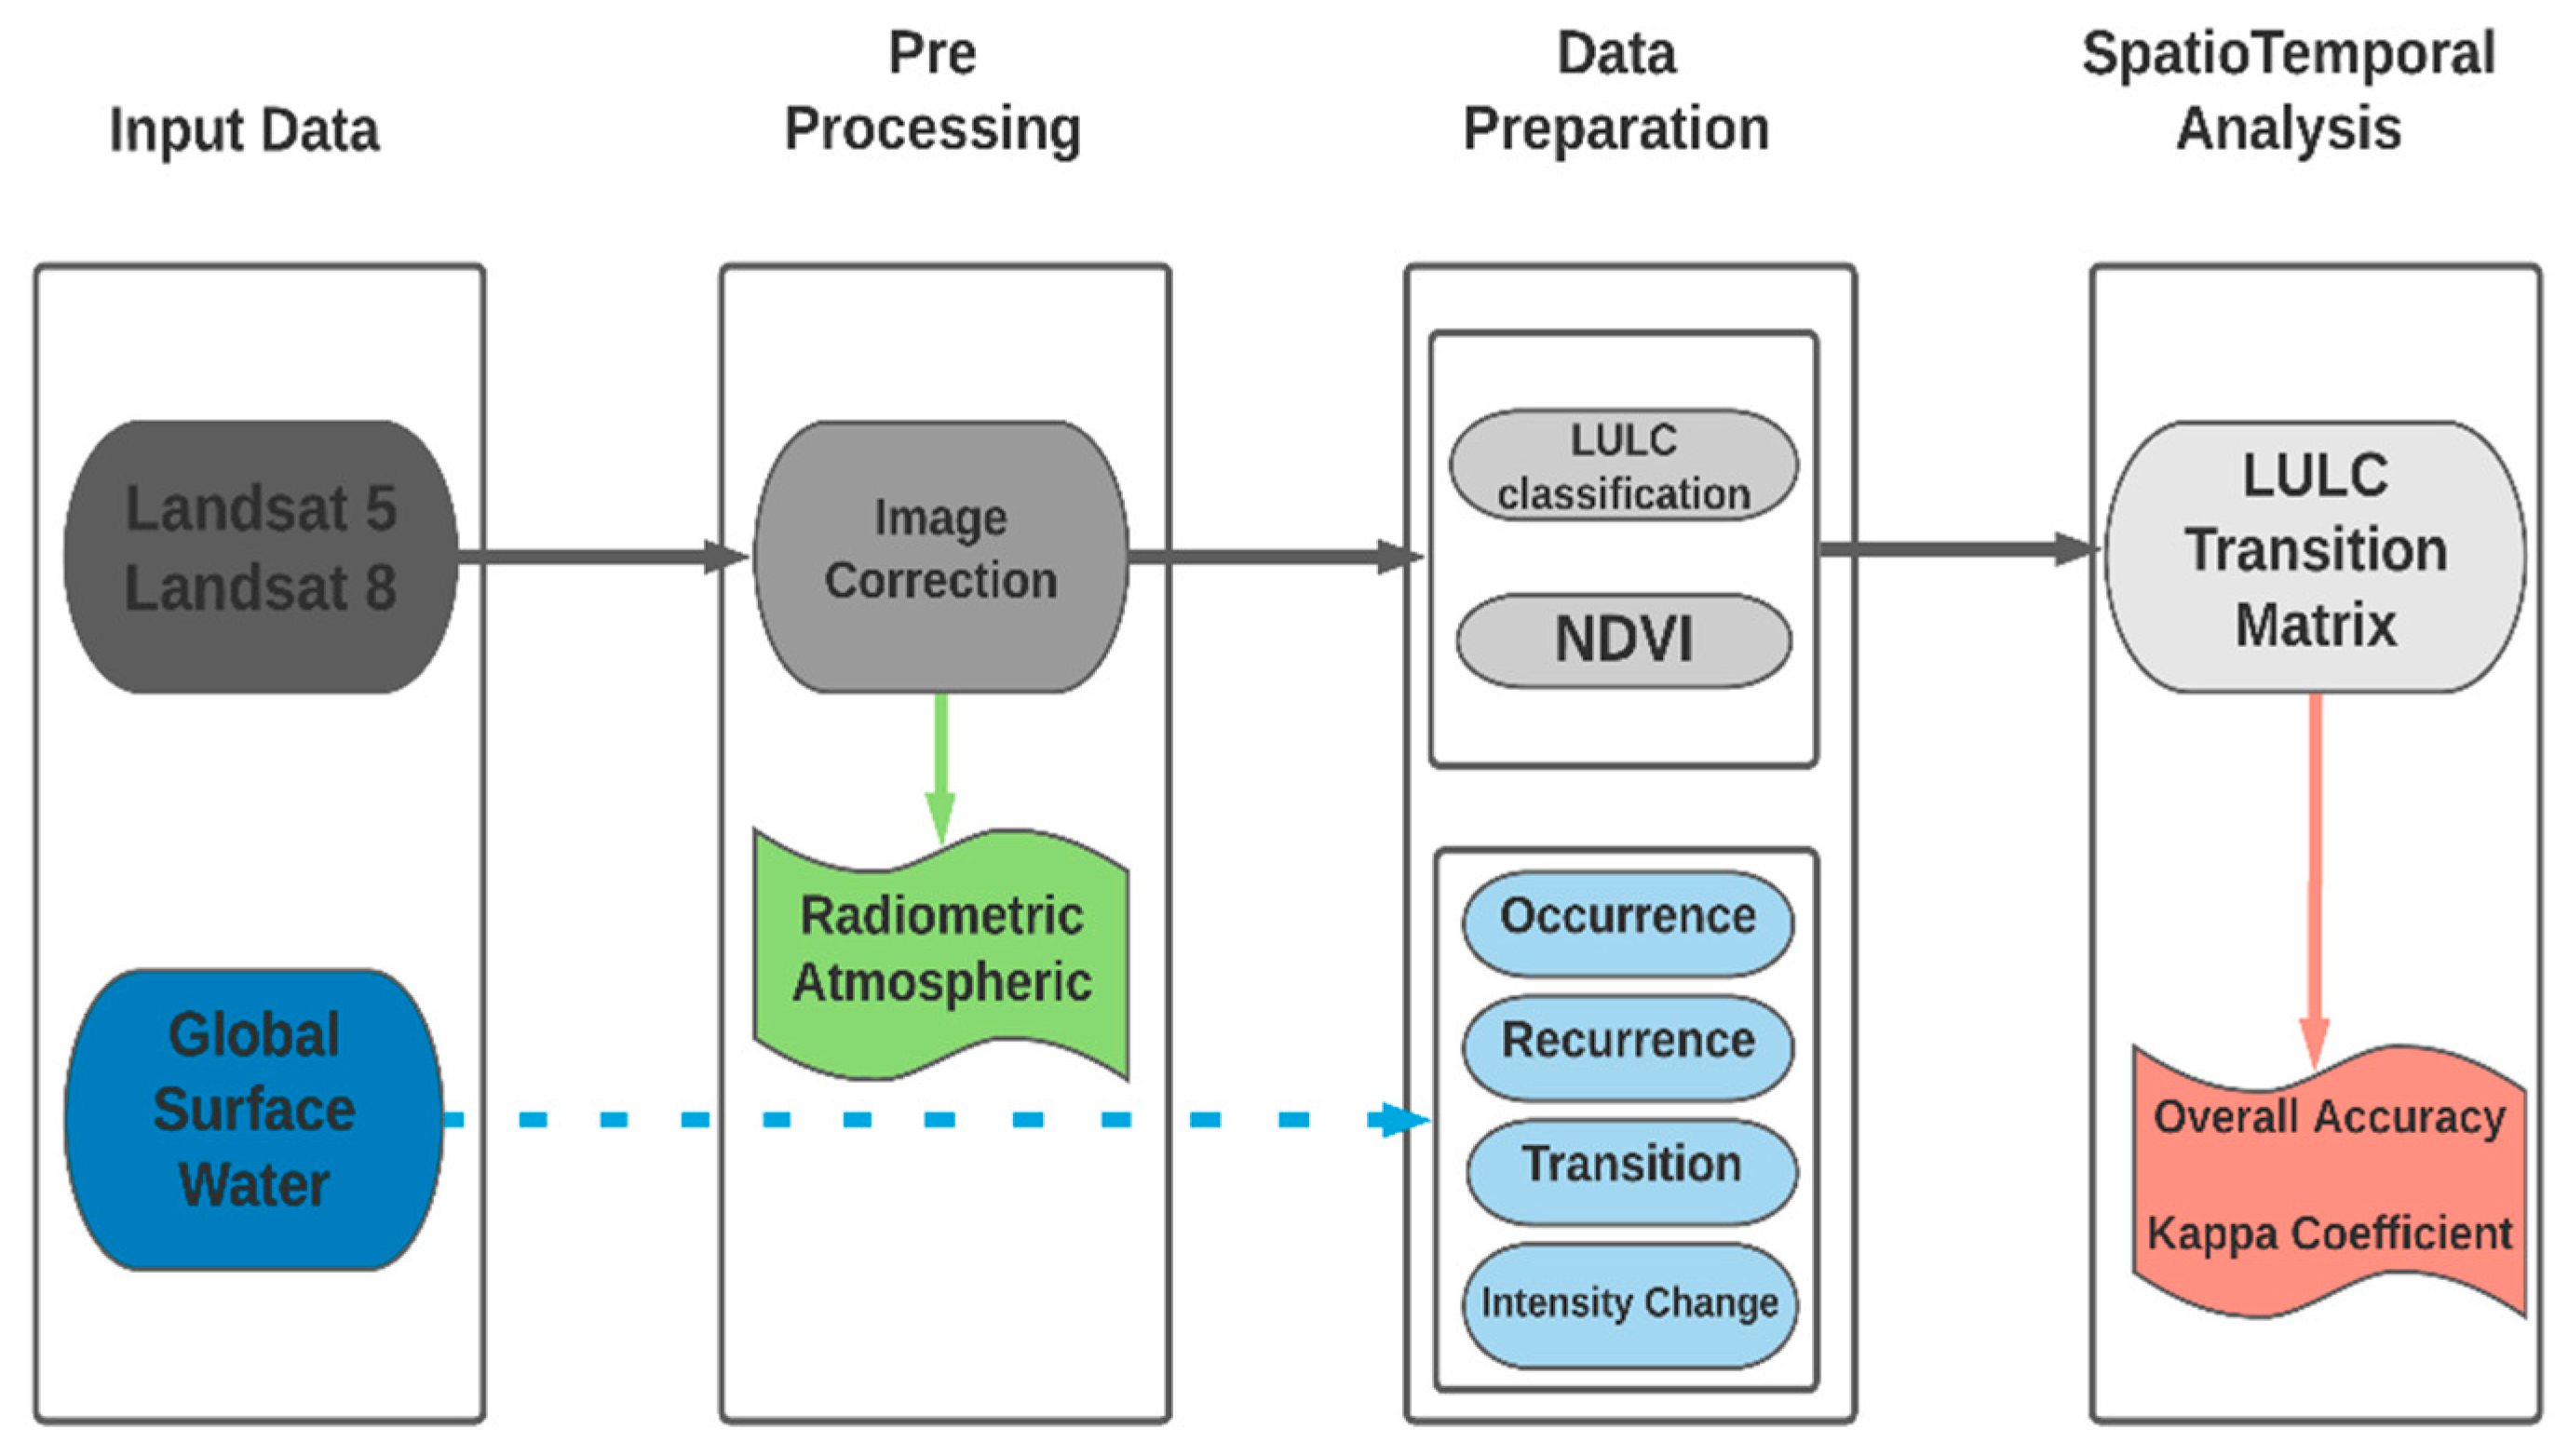
2.2.2. Image Processing

All Landsat images shown in Table 3 were pre-processed using georeferencing, image mosaicking, and atmospheric and radiometric correction techniques. ArcGIS, version 10.3® and Envi® software were utilized in this pre-processing step. Subsequently, the classifications were generated, and the normalized difference vegetation index (NDVI) was used to assess the vegetation cover.
NDVI is the ratio of the difference between the near-infrared and red reflectance to the sum of those bands. It is a sensitive indicator of the vegetation amount and condition, whose values range from minus one to plus one [33]. This index was extracted from the sequence of previously pre-processed images using ArcGIS.
In addition to the vegetation index, LULC classification was also performed, based on red, green, and blue (RGB) composites—both false and natural color composites (R3G2B1)—following the IBGE technical manual [18]. In addition, field observations were performed to increase the LULC accuracy and reliability, and six classes were identified as follows: water bodies (including aquaculture), sand bodies (dunes), bare soil, Caatinga trees, Caatinga shrubs, and agriculture.

2.2.3. Validation

The LULC analysis requires good accuracy [34], and several parameters can be used to measure it. However, the Kappa coefficient (KC) stands out, using confusion matrices for error and accuracy analysis. Therefore, to assess the classification correctness, the confusion matrix equation of the training areas was used. This coefficient is considered a great statistical test in the supervised classification’s confidence interval analysis and has been used in several studies that analyze LULC applied to aquaculture [29,35,36].
The KC system is designed to compare results from different regions or classifications. It is widely used for satellite imagery and remote sensing studies, and its results, ranging from 0 to 1, are considered acceptable when above 0.7 [37,38]. The confusion matrix’s accuracy depends on the sampling and knowledge of the study area. The training sample’s homogeneity and representativeness are essential factors to be considered [37].

3. Results and Discussion

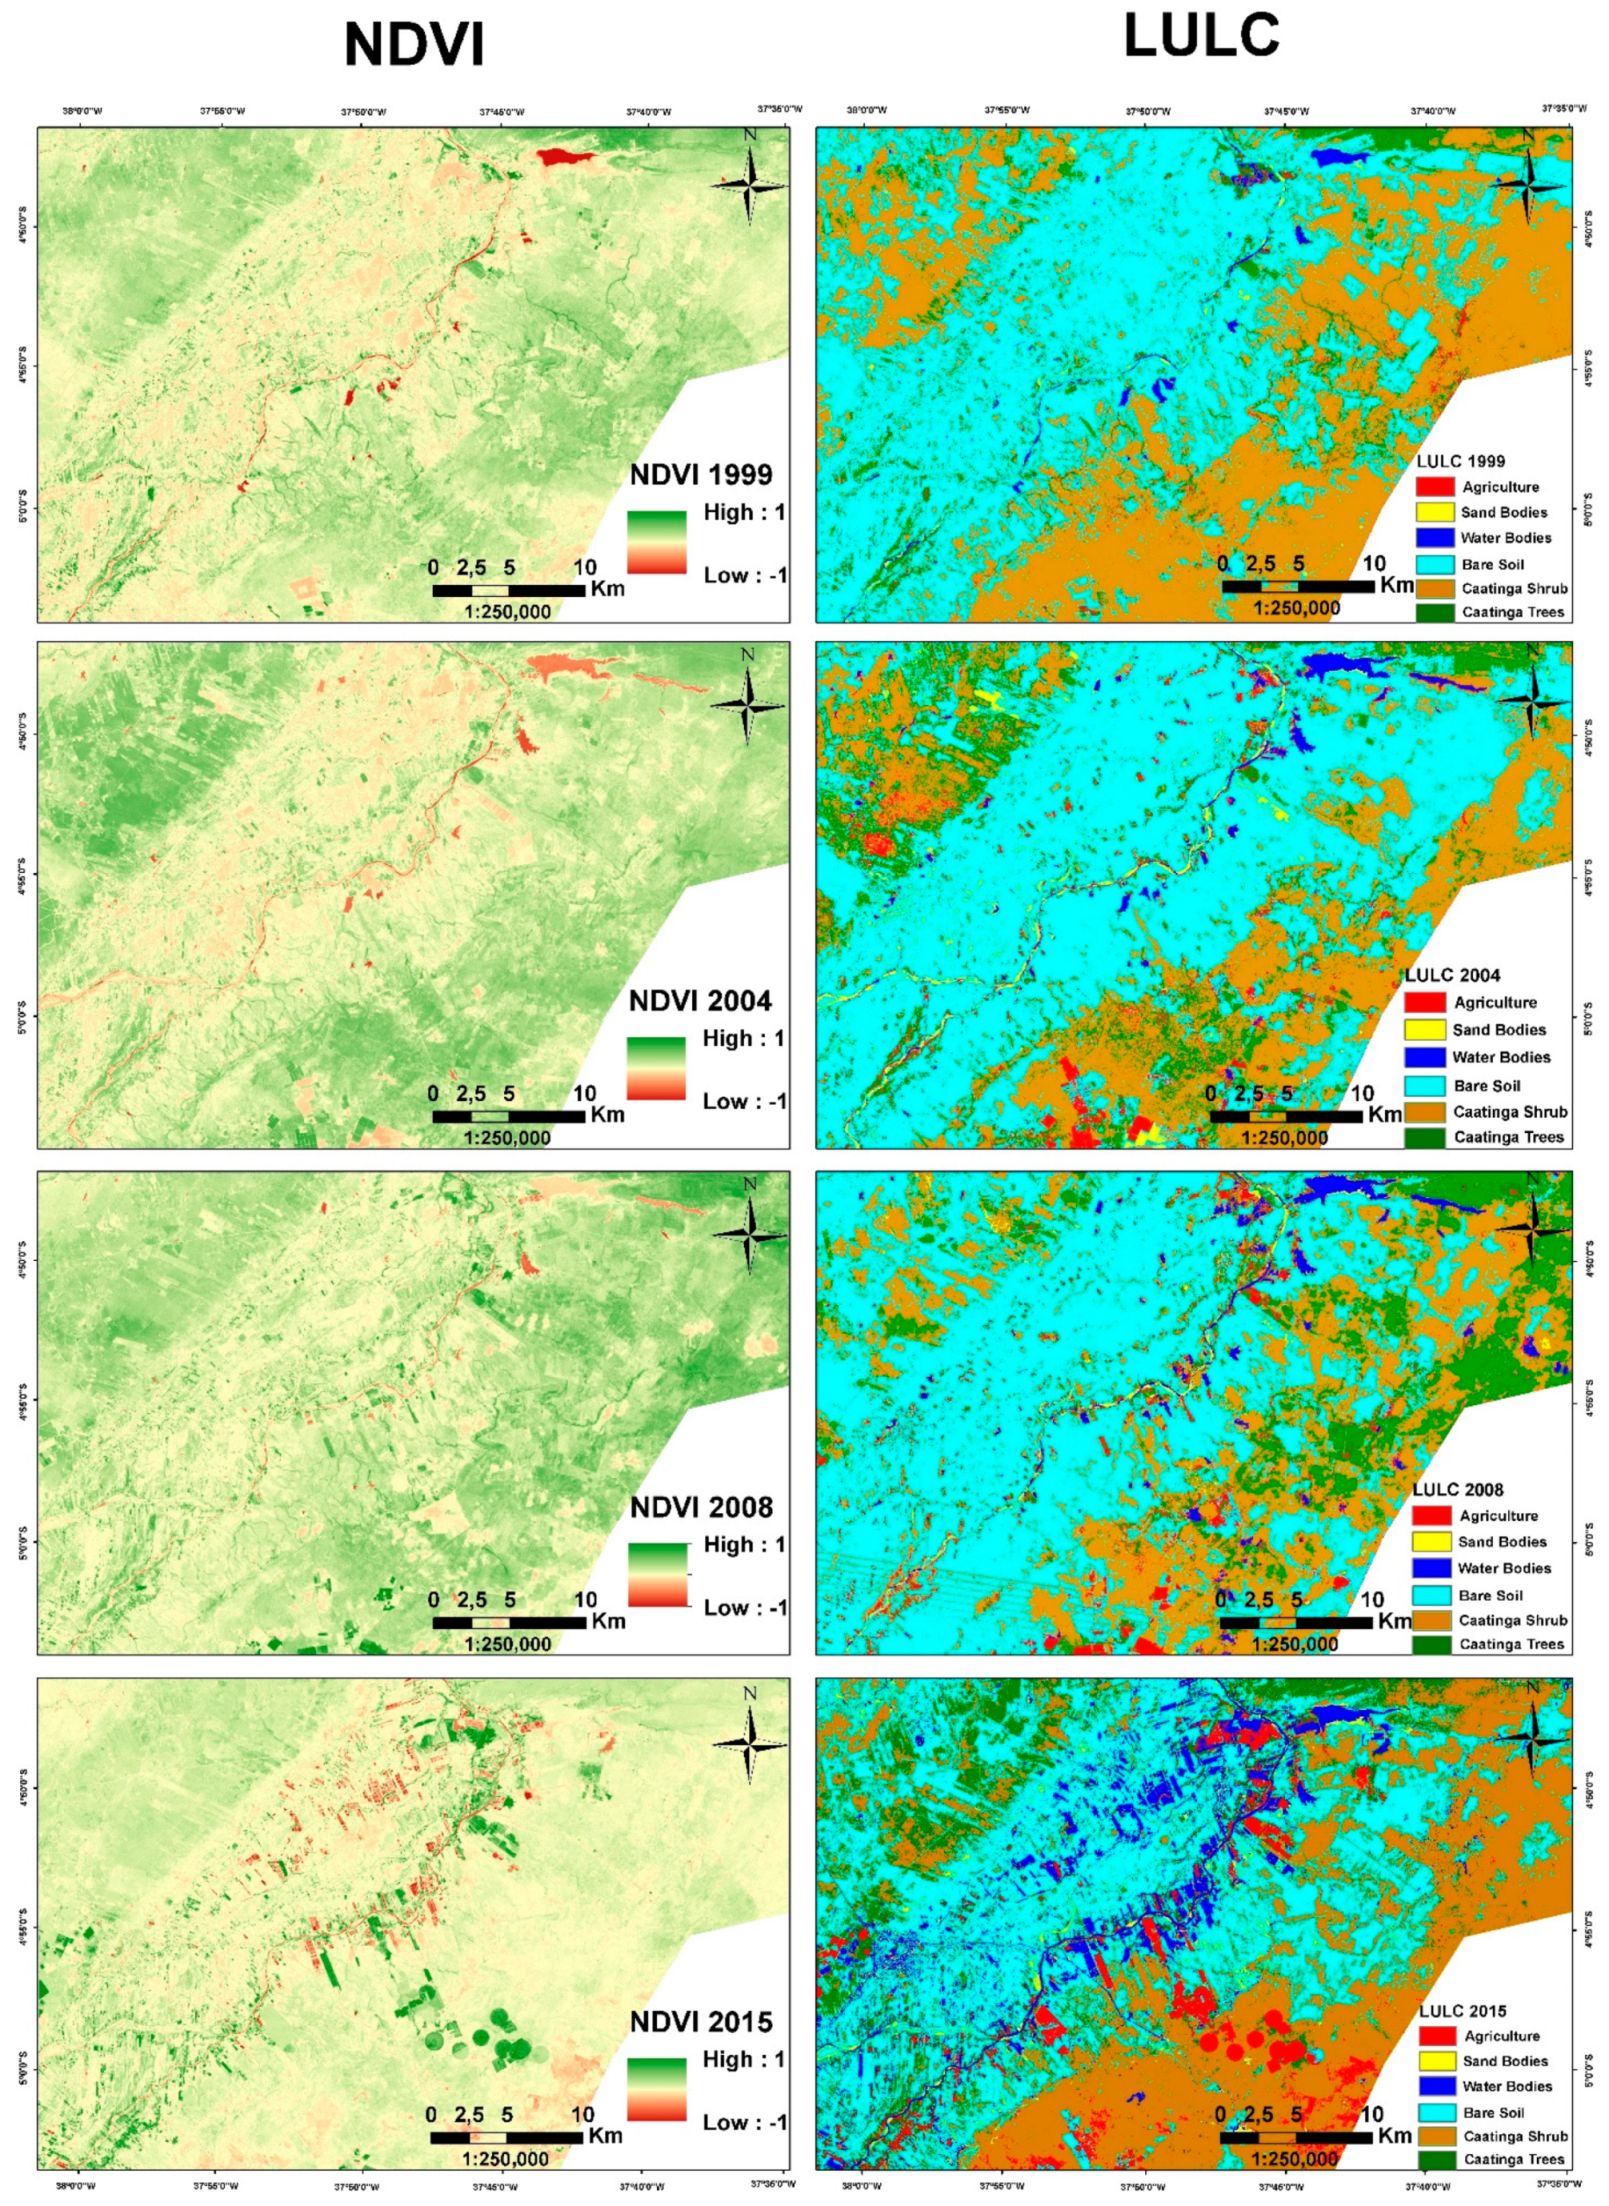
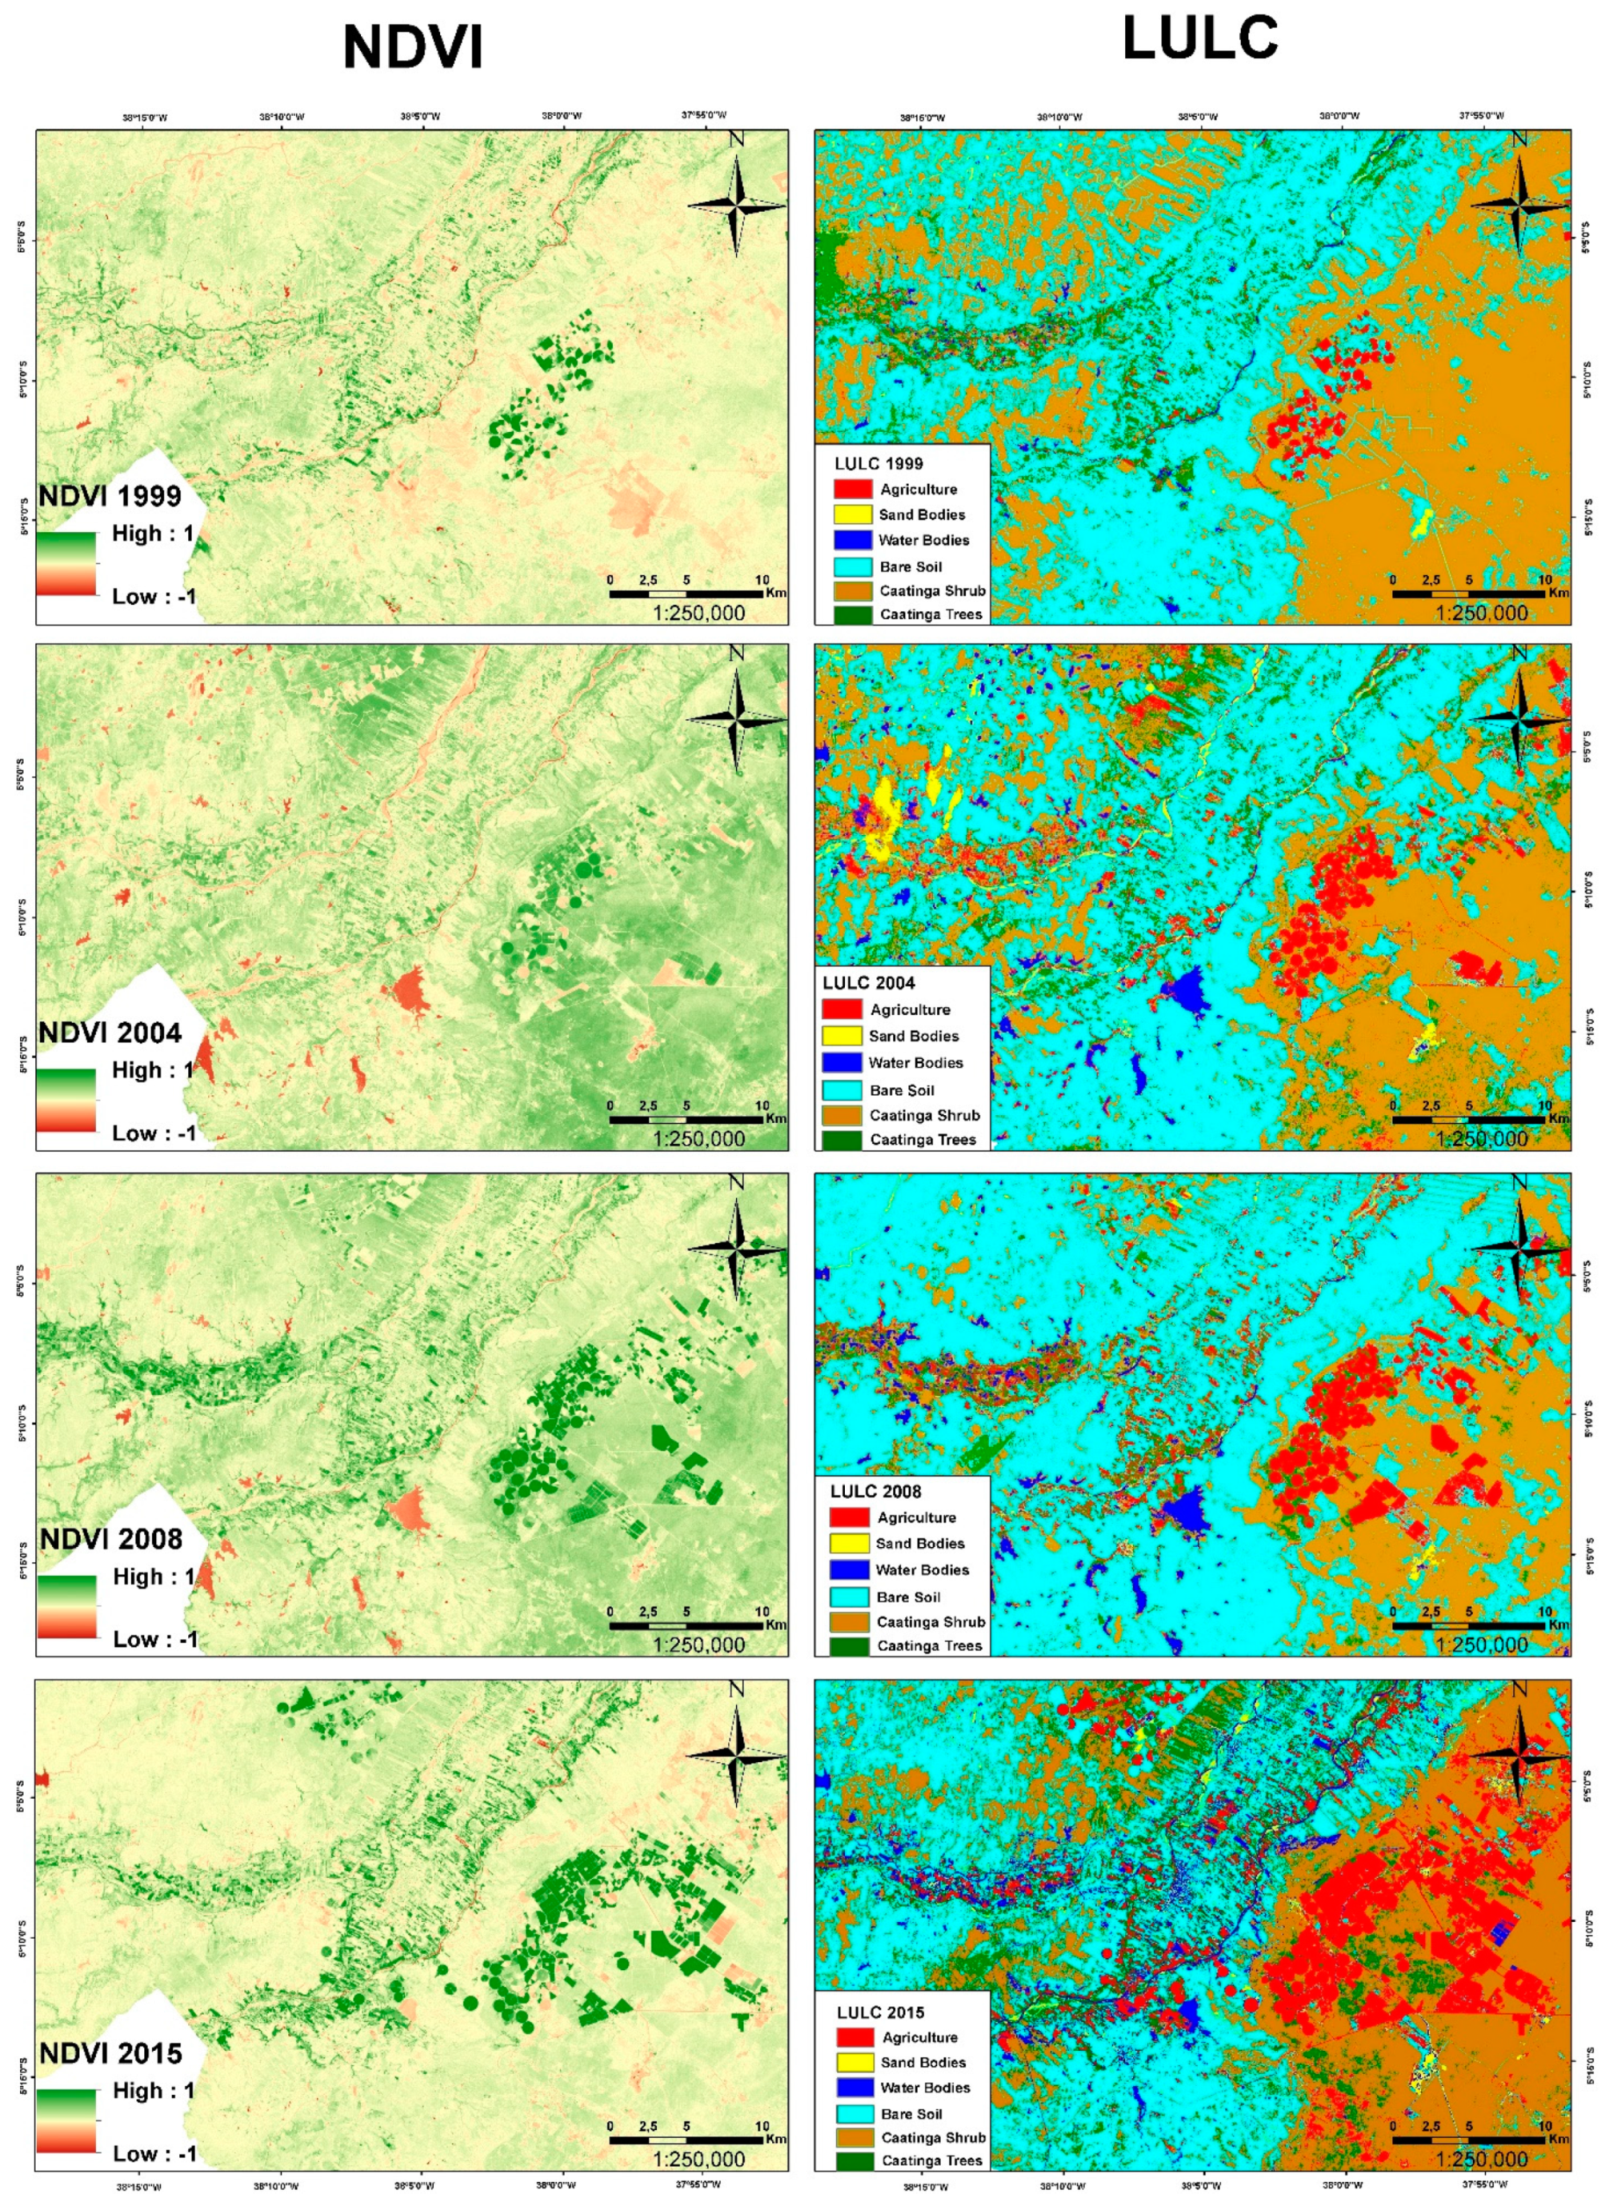
3.1. Spatiotemporal Analysis of Land Use

Land use and land cover thematic maps in the LJRSB were generated for 1999, 2004, 2008, and 2015 (Figure 3). They were categorized into agriculture, sandy bodies, water bodies, bare soil, and Caatinga shrubs and trees. In addition, the vegetation index was calculated for the same years through the NDVI. The higher this index, the healthier the vegetation; meanwhile, values near zero correspond to bare soil, while negative values usually represent water, clouds, and shadows [39].
The obtained KC for the LULC maps (Table 4) was above 0.70, which is considered acceptable. The overall classification accuracy also yielded outstanding values consistently above 80%. In general, all LULC classes increased over time, except for sandy bodies that remained constant and presented just a slight decrease in 2008, and the Caatinga shrub, which suffered an intense loss over time. Since this class covered more than 42% of the entire study area in 2015, its relative area loss was 12% over the 16 studied years.
Therefore, significant changes are noticeable in the LJRSB, mainly in the coastal region over recent years caused by the water class increase, specifically because shrimp farms have grown. Inland aquaculture is usually more geographically concentrated than marine aquaculture [40]. The findings of our study present a strong correlation with shrimp tanks and negative NDVI, mainly in the northeast coastal region (Figure 4) and the Jaguaribe River margins (Figure 5) due to shrimp farms.
A significant extension of shrimp farming areas was confirmed by the Ceará northern coast shrimp census, which recorded an increase of over 300% in shrimp producers from 2004 to 2015, making the state the country’s largest shrimp producer. Shrimp tank areas increased from 3804 to almost 10,000 ha in the same period [28]. From this total, the most significant part is located in the LJRSB, with the most prominent site being Aracati city [9].
Furthermore, according to MapBiomas collection 5—a LULC mapping project that used Landsat satellite images from 1985 to 2019 for the whole of Brazil—from the largest thirty municipalities with aquaculture area, nine are in Ceará [41]. Four of them are inside the LJRSB located near the coast. From the smallest to biggest in aquaculture area are the cities of Icapuí, Fortim, Jaguaruana, and Aracati. This last one has increased its activity by more than 560% in the last 20 years, mainly caused by shrimp farms.
Although we associate the water bodies class in our LULC maps and negative values of NDVI with shrimp farms, it is challenging to discriminate their use due to the Landsat images’ spatial and spectral resolution. Some studies, for example [42], used XGBoost and random forest to classify Landsat images for the coastal regions of Bangladesh, which presented a substantial decline in the vegetation cover caused by natural and human disturbances such as shrimp farming. However, it is important to highlight that even though this study used a more sophisticated classification technique, the Kappa coefficient was very similar to our classification.
More recently, [35] used deep learning techniques with U-Net convolutional network to classify aquaculture and salt cultures on the Brazilian coast and improve the classification of these activities. However, it could not differentiate them because they presented a similar spectral response. In our study, several field visits were conducted to improve our knowledge of the area and confirm that a significant part of the water class growth was related to shrimp farms in the LJRSB, mainly near the coast next to the Jaguaribe River margins (Figure 5).
Therefore, the water class in our LULC maps increased by 164% over the analyzed years, mainly near the coast and the Jaguaribe River. However, in some parts of the LJRSB, a water class decrease occurred, mainly due to drought and some lakes’ disappearance, which caused a decline in the Caatinga trees and shrubs due to the local water scarcity expressed by the vegetation index. This observation agrees with the MapBiomas collection 5, which found a reduction in natural vegetation areas and increased aquaculture for the Jaguaribe River region in the same period as our study [41].
In the LJRSB, the vegetation cover (Caatinga) and riparian forest removal are usually performed for shrimp tank construction. Aquaculture usually contributes to deforestation, acceleration of erosion processes [43], and even soil fertility decreases, contributing to a larger bare soil area and less crop production [44].
On the one hand, shrimp farming has been one of the most economically essential agribusinesses in the LJRSB [28]. However, this activity is often associated with mangroves and riparian forest deforestation [45], salt marsh area extinction [46], and soil salinity increase, which can make the soil unproductive [11]. These negative impacts caused by shrimp farm activity are the primary threat to local biodiversity [47,48,49].
These environmental impacts can lead to socioeconomic conflicts with existing smallholders [50]. For example, the same is occurring in different regions of the world, such as in Bangladesh [42,51], the Philippines [52], and Vietnam [53], among other areas where shrimp farms exist.
Remote sensing products can plan and monitor if these aquaculture areas are correctly established and causing environmental impacts. For example, [54] performed a territorial assessment for five common aquaculture practices in Uruguay using several remote sensing images associated with other spatial data.
Some solutions to avoid such environmental degradation by shrimp farms are adopting better management practices such as proper site selection, tank construction and preparation, feed management, water quality, effluents, solid waste management, and last but not least, taking into consideration social responsibility [55]. Together with reducing non-climate stressors such as pollution and conservation of sensitive ecosystems, some of these practices would also combat climate change impacts caused by shrimp farms [56].
Regarding the water and land use interest conflict in the LJRSB, a study using a GIS-based approach associated with participatory decision making and land suitability assessment could be conducted. For example, [57] performed a multi-criteria land suitability assessment, through spatial analysis based on four stakeholder sector visions: aquaculture, agriculture, cattle ranching, and conservation for a coastal area in Mexico; they found that for planning purposes, shrimp farming developments should be favored, and they highlighted that spatial analysis is fundamental in preventing the problems generated by shrimp farming activities.
However, in the LJRSB, there are other activities besides shrimp farming. For example, an increase in the agricultural areas was noticed in the central-southern region (Figure 6), a consequence of the IPLs’ creation in the Ceará state. IPLs have received high water extraction and transportation investments, which transform problematic agricultural areas into suitable areas, mainly for fruit cultivation such as bananas, oranges, and melons, among others [58]. Thus, for IPLs, drought usually has little influence on water availability, and agricultural production takes place throughout nearly the whole year.
These agricultural lands have been increasingly growing, making the LJRSB one of the most expressive regions concerning irrigated fruit in northeast Brazil [59]. However, the increase in irrigated agricultural lands in the LJRSB can cause several water resource conflicts because the water is usually extracted from the Jaguaribe River, controlled by the Castanhão reservoir, and has multiple uses such as urban supply and aquaculture [58].
Between 1999 and 2015, the MapBiomas collection 5 recorded an increase in the agricultural area, from 136,000 to 268,000 ha, throughout the mid and lower Jaguaribe River basins [41]. Despite the progress that IPLs have brought to the Ceará state, their construction resulted in aggressive changes to the regional environment [58]. Moreover, areas that should be used for environmental preservation are often invaded and deforested for cropping.
In the LJRSB southern and eastern areas, vegetation has become increasingly scarce over the years. Over the 16-year study period, the LJRSB has significantly decreased its native vegetation, particularly Caatinga trees and shrubs. Poor land use practices threaten this biome with high deforestation rates [59], resulting from accelerated human disturbances and environmental degradation. Both favored by severe drought periods [25].
This landscape characteristic can lead to desertification processes which can cause environmental and social losses and are frequent in the Jaguaribe region [60]. In addition, the influence of climate change must be considered since it can intensify drought length and severity, which affects almost the entire northeastern region of Brazil and causes severe water availability issues [61].
In the LJRSB, drought frequency and duration have increased over the years (although not monotonically) and presented cyclical behavior [25]. Consequently, they have contributed to a significant increase in bare soil areas in all sub-basins. For example, in 2008, a substantial increase in bare soil areas in the LJRSB central-southern region was observed.
The main factors contributing to this change were deforestation and the drought that affected the northeastern part of Brazil in 2007, considerably diminishing the Caatinga areas due to water scarcity. Consequently, a greater extent of bare soil regions started the desertification process in some areas, along with sandy soils and intense drought. At the same time, the Caatinga biome is suffering from habitat loss and fragmentation mainly caused by irrigated agriculture [61].

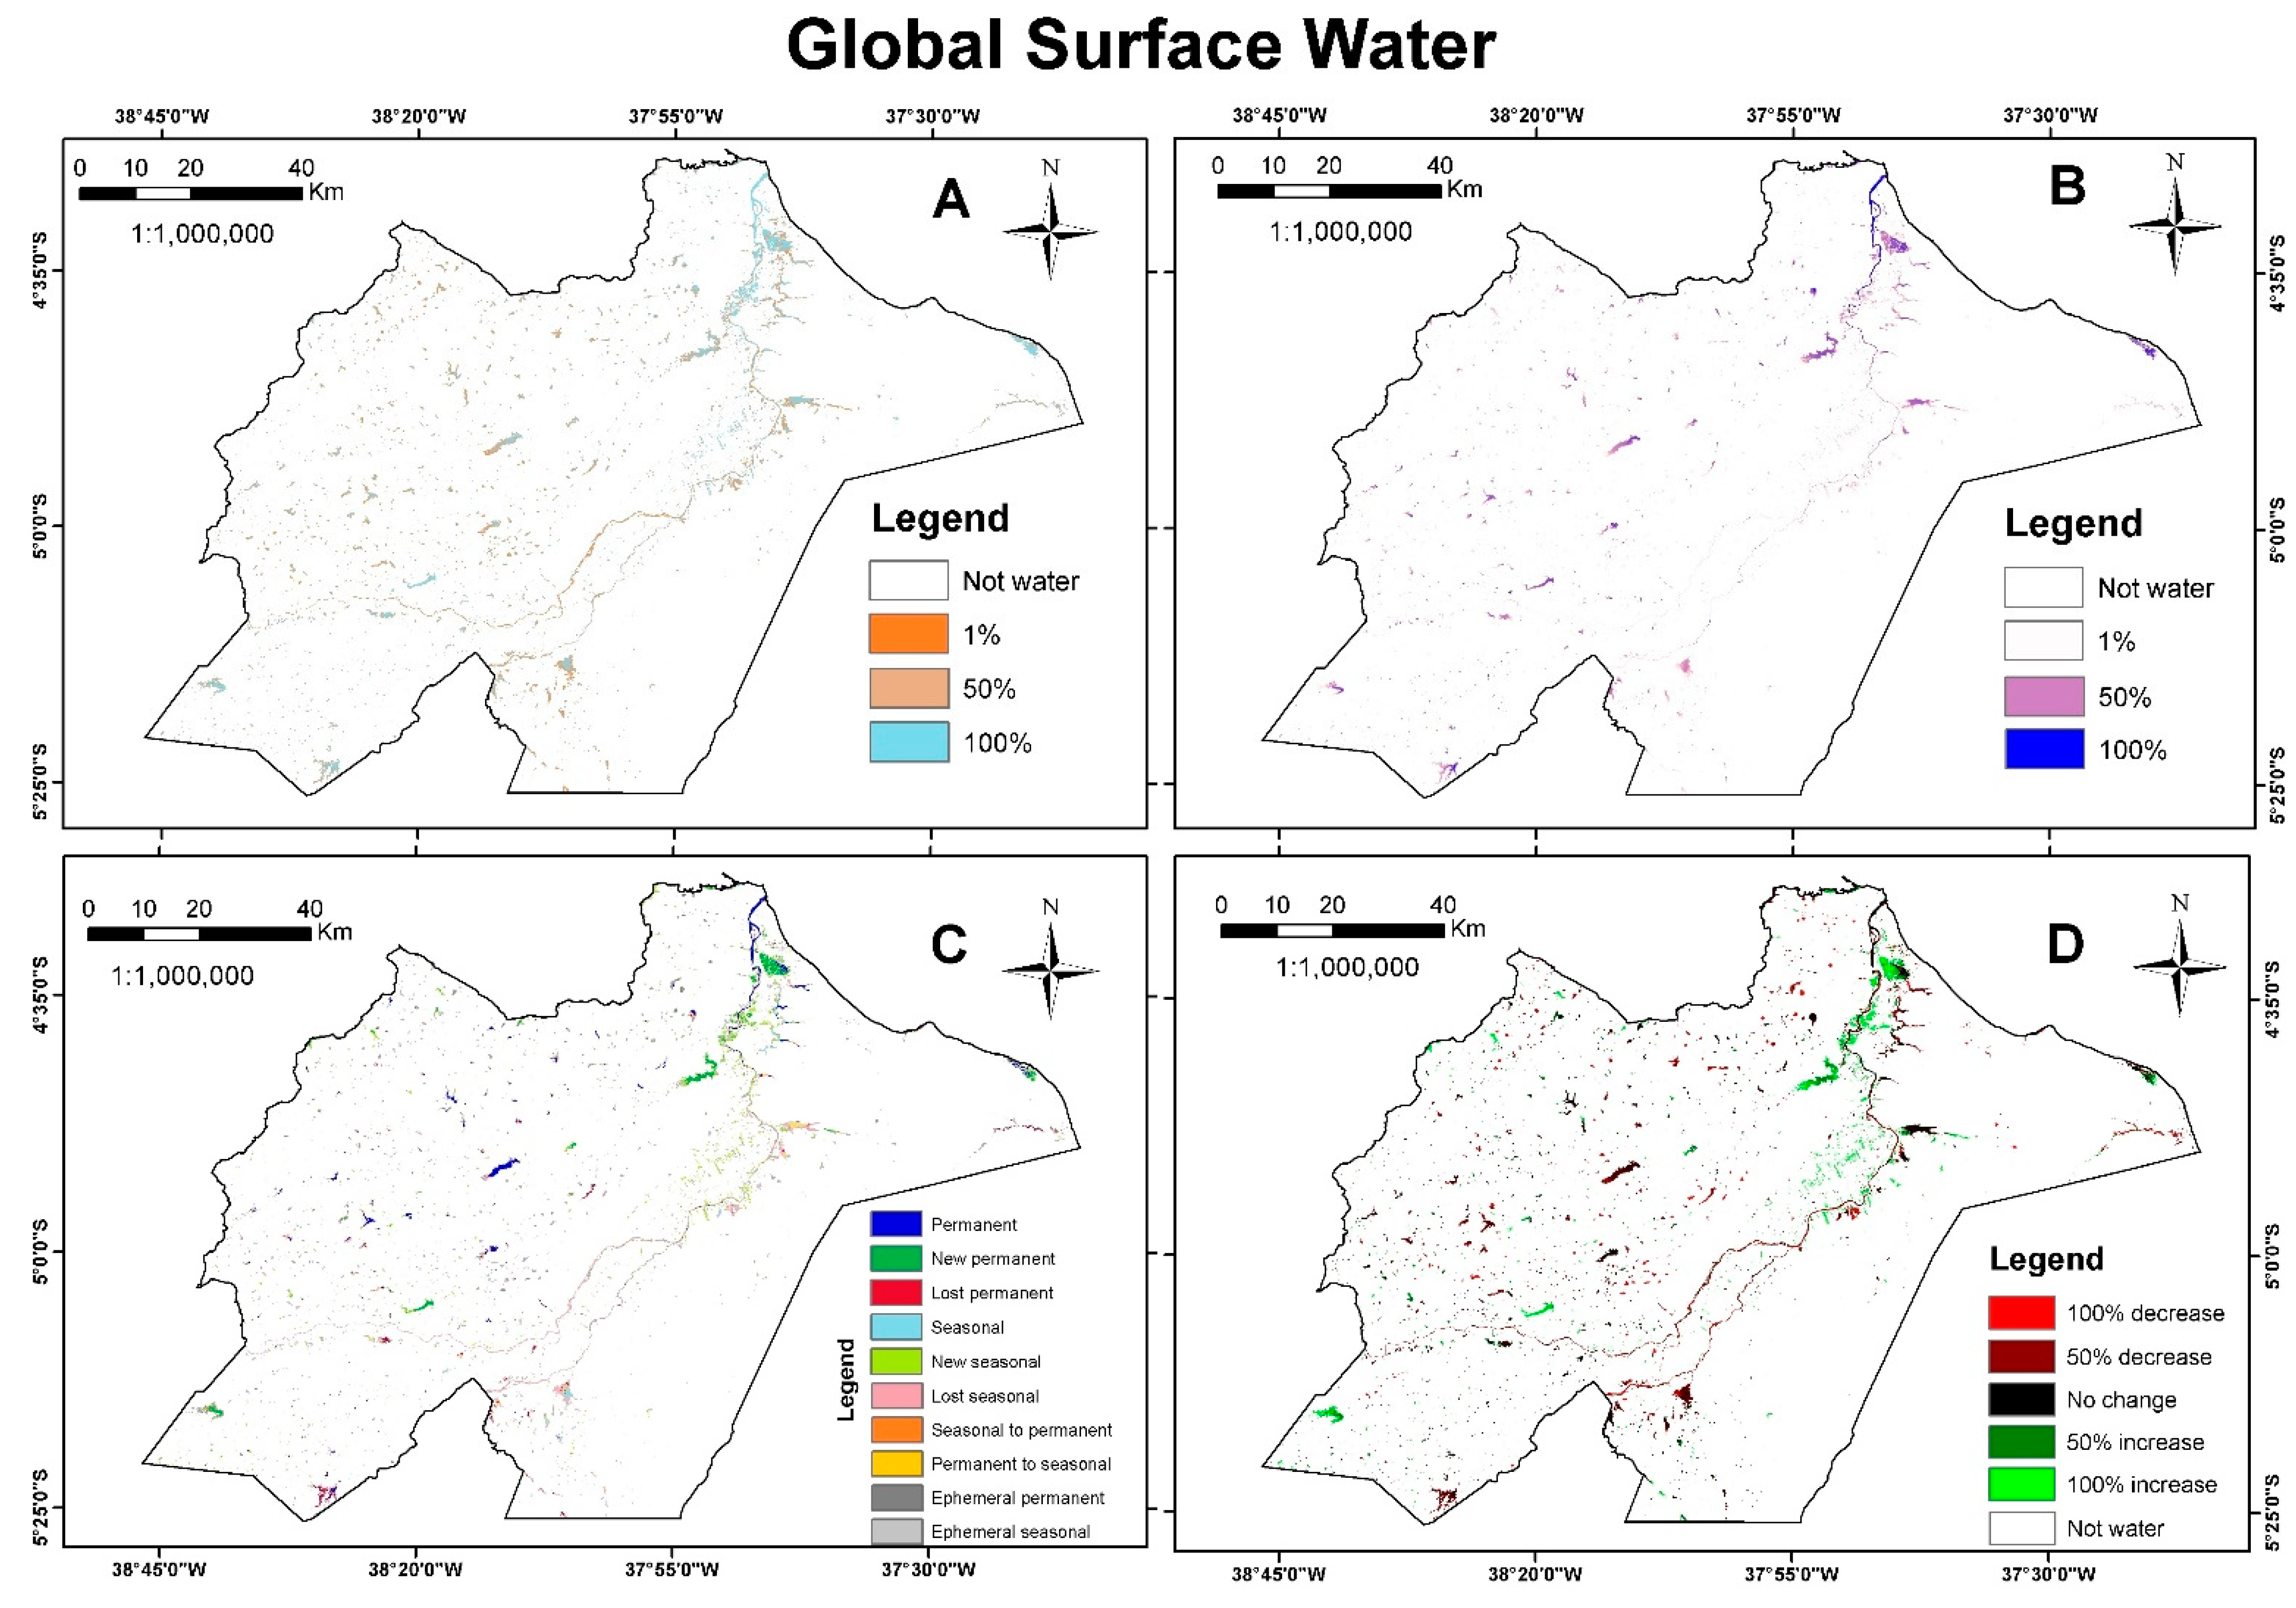
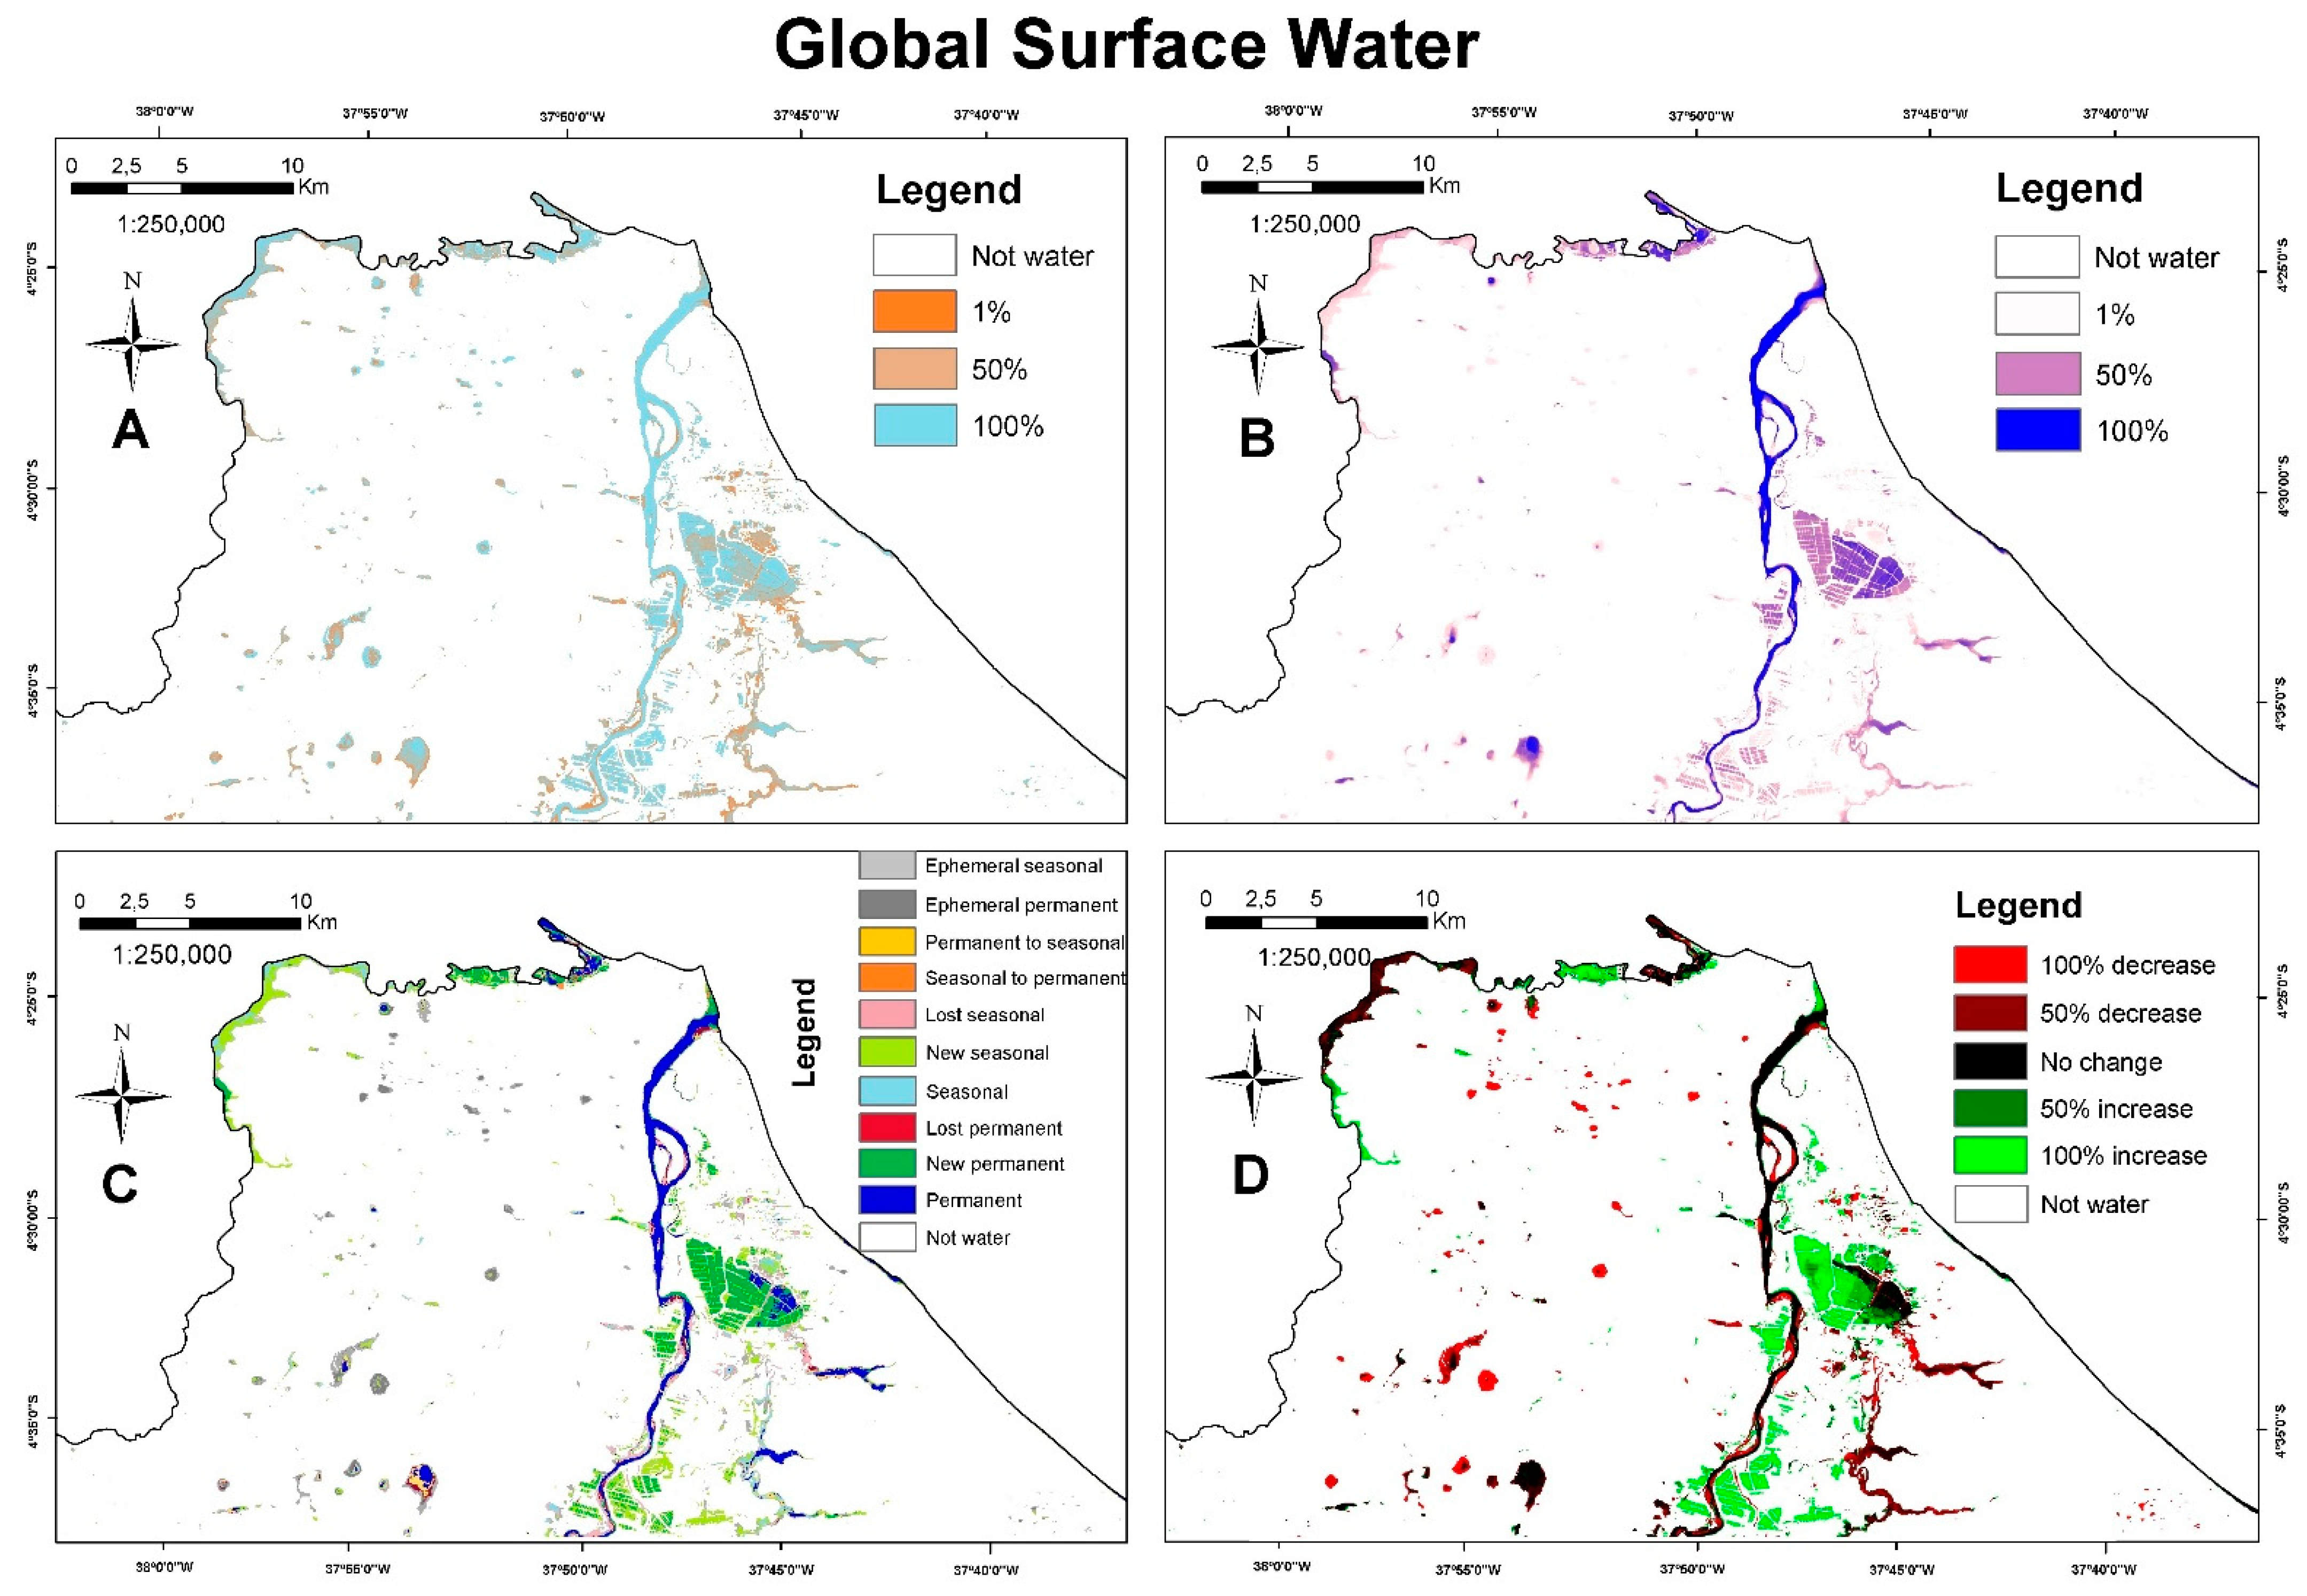
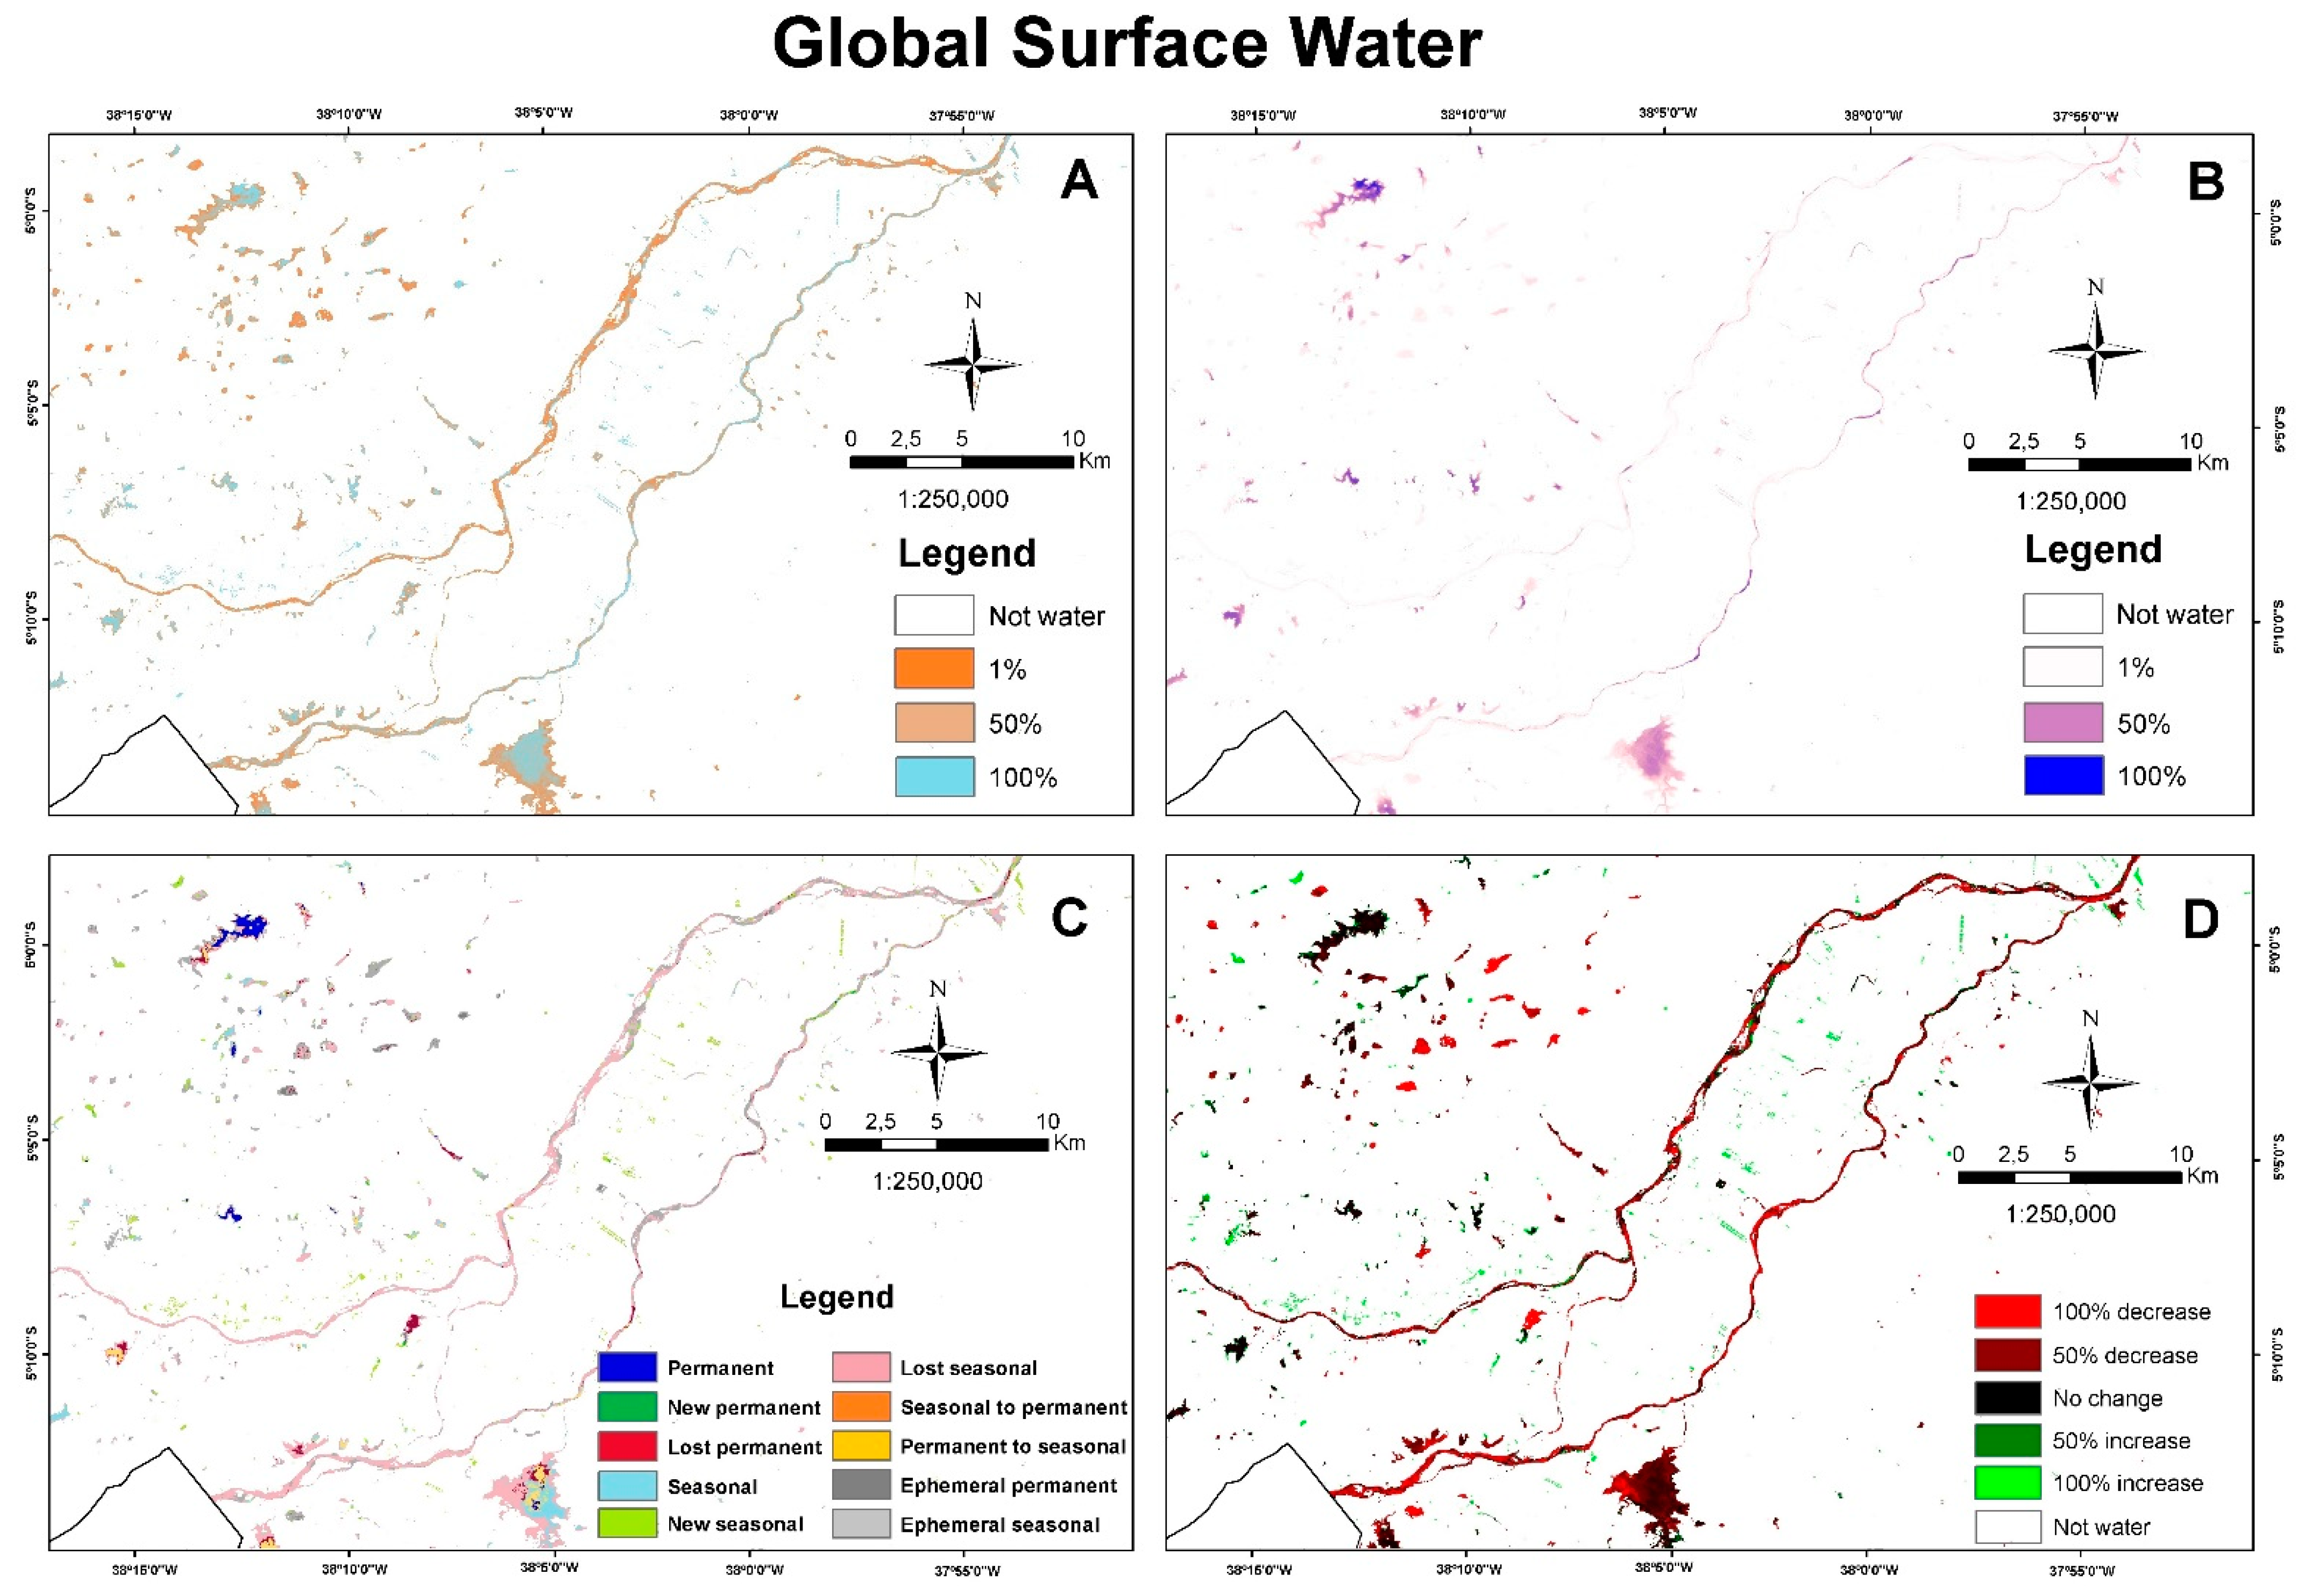
3.2. Water Surface Change

Open water is considered by the GSWE as any expanse of water open to the sky and comprises fresh and saltwater areas over 30 m2. Maps display water surfaces visible from space, including natural and artificial water bodies [31]. Among the various products generated within the GSWE project, four of them were chosen to help highlight the changes that have taken place in the LJRSB, which are water recurrence, occurrence, transitions, and change intensity (Figure 7).
The recurrence map provides information concerning the interannual behavior of water surfaces and captures the frequency with which water returns from year to year, expressed as a percentage [31]. However, the water occurrence shows where surface water occurred between 1984 and 2020 and provides information concerning overall water dynamics. Therefore, the GSWE captures both the intra and interannual variability and changes.
The water transitions map provides information on the change in seasonality between the first and last years. It captures the differences between the three not water, seasonal water, and permanent water classes. While the changing intensity provides information on where surface water occurrence increased, decreased, or remained the same between 1984–1999 and 2000–2020, both the direction of change and its intensity are presented.
The most significant changes occur in the coastal region and on the banks of the Jaguaribe River (Figure 8). The shrimp cultivation process in several watersheds in the world usually begins near the coast and then expands to inland areas [48]. The intra and interannual change in water resources in the LJRSB become clear, mainly due to the region’s significant increase in shrimp farming tanks.
Shrimp farming activity started to occur throughout the year, seeing as the recurrence and occurrence of shrimp tanks are shown with values close to 100% (Figure 8A,B). Additionally, according to the transition water surface, most shrimp tanks emerged in the last two decades, moving from dry land areas to new permanent water regions (Figure 8C), confirmed by the 100% increase class on the water change intensity maps (Figure 8D).
The map of agricultural regions mainly demonstrates the intensity of the change that has taken place in the Jaguaribe River region (Figure 9). The change intensity map shows that the water amount along the river margins has remarkably decreased. The explanation for that is that this water has been used for agriculture in the irrigation perimeters, highlighting a water deficit downstream.
Therefore, the water use conflict is aggravated because its use is almost entirely destined for large arable areas and IPLs, difficult water access, and forcing vulnerable residents to seek new livelihood alternatives than subsistence agriculture. Consequently, in this context, small and irregular shrimp tanks are created closest to the Jaguaribe River, thereby modifying the landscape even further and increasing the water contamination risk and conflict.

4. Conclusions

The land use and land cover in the lower Jaguaribe River sub-basin underwent several changes over time. These human degradation modifications often defer costs to future generations. Most notably in the region was the native vegetation loss, mainly in native vegetation Caatinga shrub classes, which was replaced by shrimp farms, bare soil, and agricultural areas. Our findings showed that agriculture is the class whose area expanded the most in the whole LJRSB but mainly concentrated in the central-southern region associated with the IPLs’ creation. On the other hand, the shrimp farms’ expansion is more spatially clustered near the Jaguaribe River margins.
Concerns about the shrimp farming environmental impact have been highlighted by their large-scale production in the LJRSB. Overall, our study found that shrimp farms contributed to significant LULC changes through remote sensing satellite images. However, it was deemed necessary to use high-resolution satellite images and more modern classification techniques in the future to better separate shrimp farms from the water class since this activity has a vital regional economic interest.
Satellite images also help to highlight the increase in largescale agricultural regions, mainly focused on fruit growing, which is one of the leading commercial activities in the LJRSB. However, large farms end up harming small local farmers in the region, who often change their livelihoods due to large differences in productivity and end up migrating to other activities, such as shrimp farms, which have lower costs and better opportunities that affect the entire basin socially and economically.
Therefore, further studies are intended to use satellite images with better spatial and spectral resolutions associated with more robust classification techniques, such as machine learning, to obtain more precise LULC classification and changes. This improvement might help the efficient water resources management, including the sustainable shrimp farm development with minimal environmental impacts, such as water pollution and riparian forest and mangrove destruction. In addition, all different water uses must be considered to avoid conflicts and think of a shared sustainable future. These factors justify the need for more significant concern and supervision by Brazilian environmental agencies to preserve the LJRSB natural vegetation and water resources since it is a strategic region in Ceará and Brazil.

Author Contributions

Conceptualization, S.G.; methodology, S.G. and V.N.; writing—original draft preparation, S.G. and V.N.; writing—review and editing, D.F., G.S. and J.O.; supervision, V.N.; funding acquisition, J.O. All authors have read and agreed to the published version of the manuscript.

Funding

The authors thank CAPES for Victor Fernandez Nascimento’s post-doctoral scholarship process no 88882.316284/2019-0. We also knowledge the support of the project International Nitrogen Management System (INMS).

Data Availability Statement

The data presented in this study are available on request from the author.

Acknowledgments

The authors thank the National Institute for Space Research (INPE), Rio Grande do Sul Federal University (UFRGS), Minas Gerais Federal University (UFMG), and The International Nitrogen Management System (INMS) Project for the support given during this research.

Conflicts of Interest

The authors reported no potential conflict of interest.

References

  1. López-Carr, D. A Review of Small Farmer Land Use and Deforestation in Tropical Forest Frontiers: Implications for Conservation and Sustainable Livelihoods. Land 2021, 10, 1113. [Google Scholar] [CrossRef]
  2. Gu, X.; Long, A.; Liu, G.; Yu, J.; Wang, H.; Yang, Y.; Zhang, P. Changes in Ecosystem Service Value in the 1 km Lakeshore Zone of Poyang Lake from 1980 to 2020. Land 2021, 10, 951. [Google Scholar] [CrossRef]
  3. Huajun, T.; Wenbin, W.; Peng, Y.; Youqi, C.; Verburg, P.H. Recent progresses of land use and land cover change (lucc) models. Acta Geogr. Sin. 2009, 64, 456–468. [Google Scholar] [CrossRef]
  4. Alexander, P.; Rounsevell, M.D.A.; Dislich, C.; Dodson, J.R.; Engström, K.; Moran, D. Drivers for global agricultural land use change: The nexus of diet, population, yield and bioenergy. Glob. Environ. Chang. 2015, 35, 138–147. [Google Scholar] [CrossRef] [Green Version]
  5. Acheampong, E.O.; Macgregor, C.J.; Sloan, S.; Sayer, J. Deforestation is driven by agricultural expansion in Ghana’s forest reserves. Sci. Afr. 2019, 5, e00146. [Google Scholar] [CrossRef]
  6. Machiwa, H.; Mango, J.; Sengupta, D.; Zhou, Y. Using Time-Series Remote Sensing Images in Monitoring the Spatial–Temporal Dynamics of LULC in the Msimbazi Basin, Tanzania. Land 2021, 10, 1139. [Google Scholar] [CrossRef]
  7. Regasa, M.S.; Nones, M.; Adeba, D. A Review on Land Use and Land Cover Change in Ethiopian Basins. Land 2021, 10, 585. [Google Scholar] [CrossRef]
  8. Alves, W.S.; Martins, A.P.; Pôssa, E.M.; Moura, D.M.B.; Morais, W.A.; Ferreira, R.S.; Santos, L.N.S. Geotechnologies applied in the analysis of land use and land cover (LULC) transition in a hydrographic basin in the Brazilian Cerrado. Remote Sens. Appl. Soc. Environ. 2021, 22, 100495. [Google Scholar] [CrossRef]
  9. SEMACE. Relatório final de caracterização ambiental e dos mapeamentos. In Reestruturação e Atualização do Mapeamento do Projeto Zoneamento Ecológico-Econômico do Ceará—Zona Costeira e Unidades de Conservação Costeiras; SEMACE: Fortaleza, Brazil, 2016; p. 480. [Google Scholar]
  10. Ribeiro, L.F.; de Souza, M.C.M.B.N.; Barros, F.; Hatje, V. Challenges of Shrimp Farming: Legal Aspects, Environmental Impacts and Mitigating Alternatives. J. Integr. Coast. Zone Manag. 2014, 14, 365–383. [Google Scholar] [CrossRef] [Green Version]
  11. Mota, L.H.D.S.D.O.; Valladares, G.S.; Leite, H.M.F.; Gomes, A.D.S.; Magalhães, R.M.F.; Silva, T.A.D. Análise Multitemporal Do Uso e Cobertura Das Terras Da Região Do Baixo Acaraú-CE. Geociências 2013, 32, 379–396. [Google Scholar]
  12. De Sousa Barbosa, W.C.; Valladares, G.S. Analysis of the Landscape and Land Use Changes in the Brazilian Northeast, Semiarid Coast. Soc. Nat. 2020, 32, 674–686. [Google Scholar] [CrossRef]
  13. Shrestha, M.; Shrestha, S.; Shrestha, P.K. Evaluation of Land Use Change and Its Impact on Water Yield in Songkhram River Basin, Thailand. Int. J. River Basin Manag. 2020, 18, 23–31. [Google Scholar] [CrossRef]
  14. Lal, A.M.; Anouncia, M.S. Semi-supervised change detection approach combining sparse fusion and constrained k means for multi-temporal remote sensing images. Egypt. J. Remote Sens. Space Sci. 2015, 18, 279–288. [Google Scholar] [CrossRef] [Green Version]
  15. Jensen, J.R. Sensoriamento Remoto Do Ambiente: Uma Perspectiva Em Recursos Terrestres; Prentice Hall: Hoboken, NJ, USA, 2009; ISBN 978-85-60507-06-1. [Google Scholar]
  16. Jensen, J.R. Introductory Digital Image Processing: A Remote Sensing Perspective, 4th ed.; Prentice Hall: Hoboken, NJ, USA, 2015; ISBN 9780134058160. [Google Scholar]
  17. Tesfaye, B.; Lengoiboni, M.; Zevenbergen, J.; Simane, B. Mapping Land Use Land Cover Changes and their determinants in the context of a massive free labour mobilization campaign: Evidence from South Wollo, Ethiopia. Remote Sens. 2021, 13, 5078. [Google Scholar] [CrossRef]
  18. Yang, N.; Mo, W.; Li, M.; Zhang, X.; Chen, M.; Li, F.; Gao, W. A study on the spatio-temporal land use changes and ecological response of the Dongting Lake Catchment. ISPRS Int. J. Geo Inf. 2021, 10, 716. [Google Scholar] [CrossRef]
  19. Ye, J.; Hu, Y.; Zhen, L.; Wang, H.; Zhang, Y. Analysis on Land-Use Change and its driving mechanism in Xilingol, China, during 2000–2020 using the google earth engine. Remote Sens. 2021, 13, 5134. [Google Scholar] [CrossRef]
  20. IBGE. Manuais Técnicos Em Geociências, No 7: Manual Técnico de Uso Da Terra, 3rd ed.; IBGE: Rio de Janeiro, Brazil, 2013; ISBN 9788524043079.
  21. ANA. Manual de Procedimentos Técnicos e Administrativos de Outorga de Direito de Uso de Recursos Hídricos Da Agência Nacional de Águas; ANA: Brasilia, Brazil, 2014; Volume 2013.
  22. RADAMBRASIL. Folhas SB. 24/25 Jaguaribe/Natal: Geologia, Geomorfologia, Pedologia, Vegetação e Uso e Potencial Do Solo. 1981. Available online: https://biblioteca.ibge.gov.br/biblioteca-catalogo.html?id=216333&view=detalhes (accessed on 4 October 2018).
  23. INESP. Caderno Regional Da Sub-Bacia Do Baixo Jaguaribe; INESP: Fortaleza, Brazil, 2009. [Google Scholar]
  24. FUNCEME. Calendário Das Chuvas No Estado Do Ceará; FUNCEME: Fortaleza, Brazil, 2021. [Google Scholar]
  25. Xavier, L.C.P.; Carvalho, T.M.N.; Filho, J.D.P.; de Souza Filho, F.A.; da Silva, S.M.O. Use of Machine Learning in Evaluation of Drought Perception in Irrigated Agriculture: The Case of an Irrigated Perimeter in Brazil. Water 2020, 12, 1546. [Google Scholar] [CrossRef]
  26. Agência de Desenvolvimento do Estado do Ceará (ADECE). Perímetros Público Irrigados Do Ceará; Agência de Desenvolvimento do Estado do Ceará (ADECE): Fortaleza, Brazil, 2011; p. 20.
  27. IBAMA Diagnóstico Da Carcinicultura No Estado Do Ceará; IBAMA: Brasilia, Brazil, 2005.
  28. ABCC/MAPA. Censo Da Carcinicultura Do Litoral Sul Do Estado Do Ceará e Zonas Interioranas Adjacentes 2015/2016, 1st ed.; ABCC/MAPA: Natal, Brazil, 2017. [Google Scholar]
  29. Diniz, C.; Cortinhas, L.; Pinheiro, M.L.; Sadeck, L.; Filho, A.F.; Baumann, L.R.F.; Adami, M.; Souza-Filho, P.W.M. A Large-Scale Deep-Learning Approach for Multi-Temporal Aqua and Salt-Culture Mapping. Remote Sens. 2021, 13, 1415. [Google Scholar] [CrossRef]
  30. USGS Landsat Archives. Available online: https://www.usgs.gov/core-science-systems/nli/landsat (accessed on 4 October 2018).
  31. Pekel, J.-F.; Cottam, A.; Gorelick, N.; Belward, A.S. High-Resolution Mapping of Global Surface Water and Its Long-Term Changes. Nature 2016, 540, 418–422. [Google Scholar] [CrossRef]
  32. Dorber, M.; Verones, F.; Nakaoka, M.; Sudo, K. Can We Locate Shrimp Aquaculture Areas from Space?—A Case Study for Thailand. Remote Sens. Appl. Soc. Environ. 2020, 20, 100416. [Google Scholar] [CrossRef]
  33. Rouse, J.W.; Haas, R.H.; Scheel, J.A.; Deering, D.W. Monitoring Vegetation Systems in the Great Plains with ERTS. In Proceedings of the 3rd Earth Resource Technology Satellite (ERTS) Symposium, Washington, DC, USA, 10–14 December 1973; Scientific and Technical Information Office, National Aeronautics and Space Administration: Washington, DC, USA, 1974; pp. 309–317. [Google Scholar]
  34. Winkler, K.; Fuchs, R.; Rounsevell, M.; Herold, M. Global Land Use Changes Are Four Times Greater than Previously Estimated. Nat. Commun. 2021, 12, 2501. [Google Scholar] [CrossRef]
  35. Prasad, K.A.; Ottinger, M.; Wei, C.; Leinenkugel, P. Assessment of Coastal Aquaculture for India from Sentinel-1 SAR Time Series. Remote Sens. 2019, 11, 357. [Google Scholar] [CrossRef] [Green Version]
  36. Sun, Z.; Luo, J.; Yang, J.; Yu, Q.; Zhang, L.; Xue, K.; Lu, L. Nation-Scale Mapping of Coastal Aquaculture Ponds with Sentinel-1 SAR Data Using Google Earth Engine. Remote Sens. 2020, 12, 3086. [Google Scholar] [CrossRef]
  37. Congalton, R.G.; Green, K. Assessing the Accuracy of Remotely Sensed Data Principles and Practices, 3rd ed.; CRC Press: Boca Raton, FL, USA, 2020; Volume 53, ISBN 9788578110796. [Google Scholar]
  38. Diep, N.T.H.; Korsem, T.; Can, N.T.; Phonphan, W.; Minh, V.Q. Determination of Aquaculture Distribution by Using Remote Sensing Technology in Thanh Phu District, Ben Tre Province, Vietnam. Vietnam J. Sci. Technol. Eng. 2019, 61, 35–41. [Google Scholar] [CrossRef] [Green Version]
  39. Barbosa, H.A.; Huete, A.R.; Baethgen, W.E. A 20-Year Study of NDVI Variability over the Northeast Region of Brazil. J. Arid Environ. 2006, 67, 288–307. [Google Scholar] [CrossRef]
  40. FAO. The State of World Fisheries and Aquaculture 2020. Sustainability in Action; FAO: Rome, Italy, 2020. [Google Scholar]
  41. Souza, C.M.; Shimbo, J.Z.; Rosa, M.R.; Parente, L.L.; Alencar, A.A.; Rudorff, B.F.T.; Hasenack, H.; Matsumoto, M.; Ferreira, L.G.; Souza-Filho, P.W.M.; et al. Reconstructing Three Decades of Land Use and Land Cover Changes in Brazilian Biomes with Landsat Archive and Earth Engine. Remote Sens. 2020, 12, 2735. [Google Scholar] [CrossRef]
  42. Abdullah, A.Y.M.; Masrur, A.; Gani Adnan, M.S.; al Baky, M.A.; Hassan, Q.K.; Dewan, A. Spatio-Temporal Patterns of Land Use/Land Cover Change in the Heterogeneous Coastal Region of Bangladesh between 1990 and 2017. Remote Sens. 2019, 11, 790. [Google Scholar] [CrossRef] [Green Version]
  43. Dhar, A.R.; Uddin, M.T.; Roy, M.K. Assessment of Organic Shrimp Farming Sustainability from Economic and Environmental Viewpoints in Bangladesh. Environ. Res. 2020, 180, 108879. [Google Scholar] [CrossRef]
  44. Diniz, C.; Cortinhas, L.; Nerino, G.; Rodrigues, J.; Sadeck, L.; Adami, M.; Souza-Filho, P. Brazilian Mangrove Status: Three Decades of Satellite Data Analysis. Remote Sens. 2019, 11, 808. [Google Scholar] [CrossRef] [Green Version]
  45. Stiller, D.; Ottinger, M.; Leinenkugel, P. Spatio-Temporal Patterns of Coastal Aquaculture Derived from Sentinel-1 Time Series Data and the Full Landsat Archive. Remote Sens. 2019, 11, 1707. [Google Scholar] [CrossRef] [Green Version]
  46. Rodrigues, F.G.d.S.; Kelting, F.M.S. Landscape and Marine Shrimp Culture in Estuary River Jaguaribe, Aracati, Ceará. Geonordeste 2010, 1, 51–65. [Google Scholar]
  47. Rahman, M.R.; Ando, K.; Takeda, S. Development of Shrimp-Based Cropping Systems in the Coastal Area of Bangladesh: A Village-Level Study in Satkhira District. J. Land Use Sci. 2014, 9, 195–210. [Google Scholar] [CrossRef]
  48. Barai, K.R.; Harashina, K.; Satta, N.; Annaka, T. Comparative Analysis of Land-Use Pattern and Socioeconomic Status between Shrimp- and Rice- Production Areas in Southwestern Coastal Bangladesh: A Land-Use/Cover Change Analysis over 30 Years. J. Coast. Conserv. 2019, 23, 531–542. [Google Scholar] [CrossRef]
  49. Sá, T.D.; de Sousa, R.R.; Rocha, Í.R.C.B.; de Lima, G.C.; Costa, F.H.F. Brackish Shrimp Farming in Northeastern Brazil: The Environmental and Socio-Economic Impacts and Sustainability. Nat. Resour. 2013, 04, 538–550. [Google Scholar] [CrossRef] [Green Version]
  50. Ahmed, S. Shrimp Farming at the Interface of Land Use Change and Marginalization of Local Farmers: Critical Insights from Southwest Coastal Bangladesh. J. Land Use Sci. 2018, 13, 251–258. [Google Scholar] [CrossRef]
  51. Long, J.; Napton, D.; Giri, C.; Graesser, J. A Mapping and Monitoring Assessment of the Philippines’ Mangrove Forests from 1990 to 2010. J. Coast. Res. 2014, 30, 260–271. [Google Scholar] [CrossRef]
  52. Nguyen, H.H. The Relation of Coastal Mangrove Changes and Adjacent Land-Use: A Review in Southeast Asia and Kien Giang, Vietnam. Ocean Coast. Manag. 2014, 90, 1–10. [Google Scholar] [CrossRef]
  53. Díaz, I.; Mello, A.L.; Salhi, M.; Spinetti, M.; Bessonart, M.; Achkar, M. Multiscalar Land Suitability Assessment for Aquaculture Production in Uruguay. Aquac. Res. 2017, 48, 3052–3065. [Google Scholar] [CrossRef]
  54. Sivaraman, I.; Krishnan, M.; Radhakrishnan, K. Better Management Practices for Sustainable Small-Scale Shrimp Farming. J. Clean. Prod. 2019, 214, 559–572. [Google Scholar] [CrossRef]
  55. Jayasinghe, J.M.P.K.; Gamage, D.G.N.D.; Jayasinghe, J.M.H.A. Combating climate change impacts for shrimp aquaculture through adaptations: Sri lankan perspective. In Sustainable Solutions for Food Security: Combating Climate Change by Adaptation; Springer International Publishing: New York, NY, USA, 2019; pp. 287–309. ISBN 9783319778785. [Google Scholar]
  56. Bojórquez-Tapia, L.A.; Días-Mondragón, S.; Ezcurra, E. GIS-Based Approach for Participatory Decision Making and Land Suitability Assessment. Int. J. Geogr. Inf. Sci. 2001, 15, 129–151. [Google Scholar] [CrossRef]
  57. Rêgo, L.C.; da Silva Costa, J.P.; de Castro Cardoso Cardoso, G.C.; dos Santos, C.V. A Graph Model Analysis of the Conflict in the Irrigated Perimeter in Chapada Do Apodi-Brazil. Environ. Chall. 2021, 4, 100124. [Google Scholar] [CrossRef]
  58. Freitas, B.M.C.; Bombardi, L.M. A Política Nacional de Irrigação e o Uso de Agrotóxicos No Brasil: Contaminação e Intoxicações No Ceará. GEOgraphia 2018, 20, 86. [Google Scholar] [CrossRef]
  59. Da Silva, J.M.C.; Lacher, T.E. Caatinga—South America; Elsevier Inc.: Amsterdam, The Netherlands, 2020; ISBN 9780124095489. [Google Scholar]
  60. Bezerra, F.G.S.; Aguiar, A.P.D.; Alvalá, R.C.S.; Giarolla, A.; Bezerra, K.R.A.; Lima, P.V.P.S.; do Nascimento, F.R.; Arai, E. Analysis of Areas Undergoing Desertification, Using EVI2 Multi-Temporal Data Based on MODIS Imagery as Indicator. Ecol. Indic. 2020, 117, 106579. [Google Scholar] [CrossRef]
  61. Salazar, A.A.; Arellano, E.C.; Muñoz-sáez, A.; Miranda, M.D.; da Silva, F.O.; Zielonka, N.B.; Crowther, L.P.; Silva-ferreira, V.; Oliveira-reboucas, P.; Dicks, L.V. Restoration and Conservation of Priority Areas of Caatinga’s Semi-arid Forest Remnants Can Support Connectivity within an Agricultural Landscape. Land 2021, 10, 550. [Google Scholar] [CrossRef]
Figure 1. Map of localization in the lower Jaguaribe River sub-basin.
Land 11 00103 g001
Figure 2. Flowchart of the methodology.
Land 11 00103 g002
Figure 3. Land use and land cover and NDVI in the LJRSB for 1999, 2004, 2008, and 2015.
Land 11 00103 g003
Figure 4. Land use and land cover and NDVI in the LJRSB coast for 1999, 2004, 2008, and 2015.
Land 11 00103 g004
Figure 5. Land use and land cover and NDVI in the Jaguaribe River margins at the LJRSB for 1999, 2004, 2008, and 2015.
Land 11 00103 g005
Figure 6. Land use and land cover and NDVI in the LJRSB central-southern region for 1999, 2004, 2008, and 2015.
Land 11 00103 g006
Figure 7. Surface water maps in the LJRSB showing water (A) recurrence, (B) occurrence, (C) transition, and (D) change intensity.
Land 11 00103 g007
Figure 8. Surface water maps in the LJRSB coast showing water (A) recurrence, (B) occurrence, (C) transition, and (D) change intensity.
Land 11 00103 g008
Figure 9. Surface water maps in the LJRSB central-southern region showing water (A) recurrence, (B) occurrence, (C) transition, and (D) change intensity.
Land 11 00103 g009
Table 1. Mean and observed rainfall for August and September months over the LJRSB during the studied years.
Month/YearMean (mm)Observed (mm)Deviation (%)
09/19991.10.4−63.2
08/20045.00.9−82.7
09/20081.10.7−38.7
09/20151.10.0−100.0
Adapted from [24].
Table 2. Number of shrimp farming developments by the city in the LJRSB.
City20052017
Aracati77148
Jaguaruana27202
Fortim24101
Itaiçaba1517
Icapuí0707
Russas0203
Limoeiro do Norte0206
TOTAL157
Sources: [27,28].
Table 3. Year, date, and scene of the Landsat images used.
YearDateScene
199922 September216/63 and 216/64
200402 August216/63 and 216/64
200814 September216/63 and 216/64
201504 September216/63 and 216/64
Table 4. Area percentage of each class, Kappa coefficient, and overall accuracy by year.
1999200420082015
Water bodies1.0%2.6%2.4%2.8%
Sandy bodies1.3%1.3%0.8%1.3%
Bare soil25.8%27.5%52.3%31.2%
Caatinga trees15.8%19.3%19.2%17.7%
Caatinga shrubs54.8%45.4%21.8%42.1%
Agriculture1.2%3.9%3.5%4.9%
Kappa coefficient0.880.790.720.77
Overall accuracy91.9%85.7%80.4%84.7%
Publisher’s Note: MDPI stays neutral with regard to jurisdictional claims in published maps and institutional affiliations.

