
Genetic Profiles and Risk Stratification in Adult De Novo Acute Myeloid Leukaemia in Relation to Age, Gender, and Ethnicity: A Study from Malaysia

 ,
,
Abstract
1. Introduction
2. Results
3. Discussion
4. Materials and Methods
Supplementary Materials
Author Contributions
Funding
Institutional Review Board Statement
Informed Consent Statement
Data Availability Statement
Acknowledgments
Conflicts of Interest
References
- Martens, J.H.A.; Stunnenberg, H.G. The molecular signature of oncofusion proteins in acute myeloid leukemia. FEBS Lett. 2010, 584, 2662–2669. [Google Scholar] [CrossRef]
- Papaemmanuil, E.; Gerstung, M.; Bullinger, L.; Gaidzik, V.I.; Paschka, P.; Roberts, N.D.; Potter, N.E.; Heuser, M.; Thol, F.; Bolli, N.; et al. Genomic classification and prognosis in acute myeloid leukemia. N. Engl. J. Med. 2016, 374, 2209–2221. [Google Scholar] [CrossRef] [PubMed]
- Grimwade, D.; Hills, R.K.; Moorman, A.V.; Walker, H.; Chatters, S.; Goldstone, A.H.; Wheatley, K.; Harrison, C.J.; Burnett, A.K. Refinement of cytogenetic classification in acute myeloid leukemia: Determination of prognostic significance of rare recurring chromosomal abnormalities among 5876 younger adult patients treated in the United Kingdom Medical Research Council trials. Blood 2010, 116, 354–365. [Google Scholar] [CrossRef] [PubMed]
- Byrd, J.C.; Mrózek, K.; Dodge, R.; Carroll, A.J.; Edwards, C.G.; Arthur, D.C.; Pettenati, M.J.; Patil, S.R.; Rao, K.W.; Watson, M.S.; et al. Pretreatment cytogenetic abnormalities are predictive of induction success, cumulative incidence of relapse, and overall survival in adult patients with de novo acute myeloid leukemia: Results from Cancer. Blood 2002, 100, 4325–4336. [Google Scholar] [CrossRef]
- Grimwade, D.; Walker, H.; Oliver, F.; Wheatley, K.; Harrison, C.; Harrison, G.; Rees, J.; Hann, I.; Stevens, R.; Burnett, A.; et al. The importance of diagnostic cytogenetics on outcome in AML: Analysis of 1,612 patients entered into the MRC AML 10 trial. Blood 1998, 92, 2322–2333. [Google Scholar] [CrossRef] [PubMed]
- Schlenk, R.F.; Benner, A.; Hartmann, F.; del Valle, F.; Weber, C.; Pralle, H.; Fischer, J.T.; Gunzer, U.; Pezzutto, A.; Weber, W.; et al. Risk-adapted postremission therapy in acute myeloid leukemia: Results of the german multicenter AML HD93 treatment trial. Leukemia 2003, 17, 1521–1528. [Google Scholar] [CrossRef] [PubMed]
- Slovak, M.L.; Kopecky, K.J.; Cassileth, P.A.; Harrington, D.H.; Theil, K.S.; Mohamed, A.; Paietta, E.; Willman, C.L.; Head, D.R.; Rowe, J.M.; et al. Karyotypic analysis predicts outcome of preremission and postremission therapy in adult acute myeloid leukemia: A Southwest oncology group/Eastern cooperative oncology group study. Blood 2000, 96, 4075–4083. [Google Scholar] [CrossRef] [PubMed]
- SEER Cancer Statistics Review (CSR) 2014–2018. Available online: https://seer.cancer.gov/statfacts/html/amyl.html (accessed on 19 November 2021).
- Fröhling, S.; Schlenk, R.F.; Kayser, S.; Morhardt, M.; Benner, A.; Döhner, K.; Döhner, H. Cytogenetics and age are major determinants of outcome in intensively treated acute myeloid leukemia patients older than 60 years: Results from AMLSG trial AML HD98-B. Blood 2006, 108, 3280–3288. [Google Scholar] [CrossRef]
- Grimwade, D.; Walker, H.; Harrison, G.; Oliver, F.; Chatters, S.; Harrison, C.J.; Wheatley, K.; Burnett, A.K.; Goldstone, A.H. The predictive value of hierarchical cytogenetic classification in older adults with acute myeloid leukemia (AML): Analysis of 1065 patients entered into the United Kingdom Medical Research Council AML11 trial. Blood 2001, 98, 1312–1320. [Google Scholar] [CrossRef] [PubMed]
- Creutzig, U.; Zimmermann, M.; Reinhardt, D.; Rasche, M.; von Neuhoff, C.; Alpermann, T.; Dworzak, M.; Perglerová, K.; Zemanova, Z.; Tchinda, J.; et al. Changes in cytogenetics and molecular genetics in acute myeloid leukemia from childhood to adult age groups. Cancer 2016, 122, 3821–3830. [Google Scholar] [CrossRef]
- Li, X.; Li, X.; Xie, W.; Hu, Y.; Li, J.; Du, W.; Liu, W.; Li, H.; Chen, X.; Zhang, L.; et al. Comprehensive profile of cytogenetics in 2308 Chinese children and adults with de novo acute myeloid leukemia. Blood Cells Mol. Dis. 2012, 49, 107–113. [Google Scholar] [CrossRef]
- Ait boujmia, O.k.; Lamchahab, M.; Hda, N.; Quessar, A. Characteristics and Survival of 927 Moroccan Adults with Acute Myeloid Leukemia: Monocentric Experience. Asian Pac. J. Cancer Biol. 2021, 6, 5–13. [Google Scholar] [CrossRef]
- Gmidène, A.; Sennana, H.; Wahchi, I.; Youssef, Y.B.; Jeddi, R.; Elloumi, M.; Saad, A. Cytogenetic profile of a large cohort of Tunisian de novo acute myeloid leukemia. Hematology 2012, 17, 9–14. [Google Scholar] [CrossRef] [PubMed]
- Meng, C.Y.; Noor, P.J.; Ismail, A.; Md Ahid, M.F.; Zakaria, Z. Cytogenetic profile of de novo acute myeloid leukemia patients in Malaysia. Int. J. Biomed. Sci. 2013, 9, 30–36. [Google Scholar]
- Nakase, K.; Bradstock, K.; Sartor, M.; Gottlieb, D.; Byth, K.; Kita, K.; Shiku, H.; Kamada, N. Geographic heterogeneity of cellular characteristics of acute myeloid leukemia: A comparative study of Australian and Japanese adult cases. Leukemia 2000, 14, 163–168. [Google Scholar] [CrossRef] [PubMed][Green Version]
- Shaikh, M.S.; Ahmed, Z.A.; Shaikh, M.U.; Adil, S.N.; Khurshid, M.; Moatter, T.; Rashid, A.; Karim, F.; Raheem, A.; Ali, N. Distribution of chromosomal abnormalities commonly observed in adult acute myeloid leukemia in Pakistan as predictors of prognosis. Asian Pac. J. Cancer Prev. 2018, 19, 1903–1906. [Google Scholar] [CrossRef] [PubMed]
- Amare, P.S.K.; Jain, H.; Kabre, S.; Deshpande, Y.; Pawar, P.; Banavali, S.; Menon, H.; Sengar, M.; Arora, B.; Khattry, N.; et al. Cytogenetic Profile in 7209 Indian Patients with de novo Acute Leukemia: A Single Centre Study from India. J. Cancer Ther. 2016, 7, 530–544. [Google Scholar] [CrossRef]
- Liu, H.; Zhang, X.; Li, M.; Zhou, W.; Jiang, G.; Yin, W.; Song, C. The incidence and prognostic effect of Fms-like tyrosine kinase 3 gene internal tandem and nucleolar phosphoprotein 1 genes in acute myeloid leukaemia: A PRISMA-compliant systematic review and meta-analysis. Medicine 2020, 99, e23707. [Google Scholar] [CrossRef] [PubMed]
- National Cancer Institute. Malaysia National Cancer Registry Report (MNCRR) 2012–2016. 2019. Available online: http://nci.moh.gov.my/index.php/ms/list-penerbitan/35-laporan/398-summary-of-malaysian-national-cancer-registry-report-2007-2011 (accessed on 19 November 2021).
- Moorman, A.V.; Roman, E.; Willett, E.V.; Dovey, G.J.; Cartwright, R.A.; Morgan, G.J. Karyotype and age in acute myeloid leukemia. Are they linked? Cancer Genet. Cytogenet. 2001, 126, 155–161. [Google Scholar] [CrossRef]
- Döhner, H.; Estey, E.; Grimwade, D.; Amadori, S.; Appelbaum, F.R.; Büchner, T.; Dombret, H.; Ebert, B.L.; Fenaux, P.; Larson, R.A.; et al. Diagnosis and management of AML in adults: 2017 ELN recommendations from an international expert panel. Blood 2017, 129, 424–447. [Google Scholar] [CrossRef]
- Xhaard, A.; Brunstein, C.; De Fontbrune, F.S.; Rowe, J.M.; Tallman, M.S.; Papaemmanuil, E.; Gerstung, M.; Bullinger, L.; Gaidzik, V.I.; Paschka, P.; et al. Diagnosis and management of acute myeloid leukemia in adults: Recommendations from an international expert panel, on behalf of the European LeukemiaNet. Blood 2016, 51, 1411–1412. [Google Scholar] [CrossRef]
- Tyner, J.W.; Tognon, C.E.; Bottomly, D.; Wilmot, B.; Kurtz, S.E.; Savage, S.L.; Long, N.; Schultz, A.R.; Traer, E.; Abel, M.; et al. Functional genomic landscape of acute myeloid leukaemia. Nature 2018, 562, 526–531. [Google Scholar] [CrossRef]
- Welch, J.S.; Ley, T.J.; Link, D.C.; Miller, C.A.; Larson, D.E.; Koboldt, D.C.; Wartman, L.D.; Lamprecht, T.L.; Liu, F.; Xia, J.; et al. The Origin and Evolution of Mutations in Acute Myeloid Leukemia. Cell 2012, 150, 264–278. [Google Scholar] [CrossRef] [PubMed]
- Enjeti, A.K.; Tien, S.L.; Sivaswaren, C.R. Cytogenetic abnormalities in de novo acute myeloid leukemia in adults: Relation to morphology, age, sex and ethnicity—A single center study from Singapore. Hematol. J. 2004, 5, 419–425. [Google Scholar] [CrossRef] [PubMed]
- Cheng, Y.; Wang, Y.; Wang, H.; Chen, Z.; Lou, J.; Xu, H.; Wang, H.; Qian, W.; Meng, H.; Lin, M.; et al. Cytogenetic profile of de novo acute myeloid leukemia: A study based on 1432 patients in a single institution of China. Leukemia 2009, 23, 1801–1806. [Google Scholar] [CrossRef]
- Moorman, A.V.; Roman, E.; Cartwright, R.A.; Morgan, G.J. Age-specific incidence rates for cytogenetically-defined subtypes of acute myeloid leukaemia. Br. J. Cancer 2002, 86, 1061–1063. [Google Scholar] [CrossRef] [PubMed]
- Shysh, A.C.; Nguyen, L.T.; Guo, M.; Vaska, M.; Naugler, C.; Rashid-Kolvear, F. The incidence of acute myeloid leukemia in Calgary, Alberta, Canada: A retrospective cohort study. BMC Public Health 2017, 18, 94. [Google Scholar] [CrossRef] [PubMed]
- Heim, S.; Mitelman, F. Chromosomal and Molecular Genetic Aberrations of Tumor Cells. Cancer Cytogenet. 1995, 369, 2. [Google Scholar]
- Mrózek, K.; Heerema, N.A.; Bloomfield, C.D. Cytogenetics in acute leukemia. Blood Rev. 2004, 18, 115–136. [Google Scholar] [CrossRef]
- Koh, K.N.; Lee, J.O.; Seo, E.J.; Lee, S.W.; Suh, J.K.; Im, H.J.; Seo, J.J. Clinical significance of previously cryptic copy number alterations and loss of heterozygosity in pediatric acute myeloid leukemia and myelodysplastic syndrome determined using combined array comparative genomic hybridization plus single-nucleotide polymo. J. Korean Med. Sci. 2014, 29, 926–933. [Google Scholar] [CrossRef] [PubMed]
- Tyybäkinoja, A.; Elonen, E.; Piippo, K.; Porkka, K.; Knuutila, S. Oligonucleotide array-CGH reveals cryptic gene copy number alterations in karyotypically normal acute myeloid leukemia. Leukemia 2007, 21, 571–574. [Google Scholar] [CrossRef] [PubMed]
- Ley, T.J.; Mardis, E.R.; Ding, L.; Fulton, B.; McLellan, M.D.; Chen, K.; Dooling, D.; Dunford-Shore, B.H.; McGrath, S.; Hickenbotham, M.; et al. DNA sequencing of a cytogenetically normal acute myeloid leukaemia genome. Nature 2008, 456, 66–72. [Google Scholar] [CrossRef]
- Ibáñez, M.; Carbonell-Caballero, J.; Such, E.; Garcõia-Alonso, L.; Liquori, A.; López-Pavõia, M.; Llop, M.; Alonso, C.; Barragán, E.; Gómez-Seguõi, I.; et al. The modular network structure of the mutational landscape of Acute Myeloid Leukemia. PLoS ONE 2018, 13, e202926. [Google Scholar] [CrossRef] [PubMed]
- Rowley, J.D.; Alimena, G.; Garson, O.M.; Hagemeijer, A.; Mitelman, F.; Prigogina, E.L. A collaborative study of the relationship of the morphological type of acute nonlymphocytic leukemia with patient age and karyotype. Blood 1982, 59, 1013–1022. [Google Scholar] [CrossRef] [PubMed]
- Sakurai, M.; Swansbury, G.J. Overview of Association between Chromosome Pattern and Cell Morphology, Age, Sex, and Race. Cancer Genet. Cytogenet. 1984, 11, 265–274. [Google Scholar] [CrossRef]
- Keating, M.J.; Cork, A.; Broach, Y.; Smith, T.; Walters, R.S.; McCredie, K.B.; Trujillo, J.; Freireich, E.J. Toward a clinically relevant cytogenetic classification of acute myelogenous leukemia. Leuk. Res. 1987, 11, 119–133. [Google Scholar] [CrossRef]
- Mauritzson, N.; Johansson, B.; Albin, M.; Billström, R.; Ahlgren, T.; Mikoczy, Z.; Nilsson, P.G.; Hagmar, L.; Mitelman, F. A single-center population-based consecutive series of 1500 cytogenetically investigated adult hematological malignancies: Karyotypic features in relation to morphology, age and gender. Eur. J. Haematol. 1999, 62, 95–102. [Google Scholar] [CrossRef] [PubMed]
- Rowley, J.D. Association of specific chromosome abnormalities with type of acute leukemia and with patient age. Cancer Res. 1981, 41, 3407–3410. [Google Scholar]
- Schoch, C.; Kern, W.; Schnittger, S.; Buchner, T.; Hiddemann, W.; Haferlach, T. The influence of age on prognosis of de novo acute myeloid leukemia differs according to cytogenetic subgroups. Haematologica. Haematologica 2004, 89, 1082–1090. [Google Scholar] [PubMed]
- Lazarevic, V.; Hörstedt, A.S.; Johansson, B.; Antunovic, P.; Billström, R.; Derolf, Å.; Hulegårdh, E.; Lehmann, S.; Möllgård, L.; Nilsson, C.; et al. Incidence and prognostic significance of karyotypic subgroups in older patients with acute myeloid leukemia: The Swedish population-based experience. Blood Cancer J. 2014, 4, e188. [Google Scholar] [CrossRef] [PubMed]
- Tien, H.F.; Wang, C.H.; Lin, M.T.; Lee, F.Y.; Liu, M.C.; Chuang, S.M.; Chen, Y.C.; Shen, M.C.; Lin, K.H.; Lin, D.T. Correlation of cytogenetic results with immunophenotype, genotype, clinical features, and ras mutation in acute myeloid leukemia A study of 235 Chinese patients in Taiwan. Cancer Genet. Cytogenet. 1995, 84, 60–68. [Google Scholar] [CrossRef]
- Appelbaum, F.R.; Gundacker, H.; Head, D.R.; Slovak, M.L.; Willman, C.L.; Godwin, J.E.; Anderson, J.E.; Petersdorf, S.H. Age and acute myeloid leukemia. Blood 2006, 107, 3481–3485. [Google Scholar] [CrossRef] [PubMed]
- Pedersen-Bjergaard, J.; Rowley, J.D. The balanced and the unbalanced chromosome aberrations of acute myeloid leukemia may develop in different ways and may contribute differently to malignant transformation. Blood 1994, 83, 2780–2786. [Google Scholar] [CrossRef] [PubMed]
- Bleyer, W.A. Cancer in older adolescents and young adults: Epidemiology, diagnosis, treatment, survival, and importance of clinical trials. Med. Pediatr. Oncol. 2002, 38, 1–10. [Google Scholar] [CrossRef] [PubMed]
- DR Head evised classification of acute myeloid leukemia. Leukemia 1996, 10, 1826–1831.
- Aplan, P.D. Causes of oncogenic chromosomal translocation. Trends Genet. 2006, 22, 46–55. [Google Scholar] [CrossRef]
- Schneider, F.; Hoster, E.; Schneider, S.; Dufour, A.; Woermann, B.J.; Feuring-buske, M.; Buske, C. Age-dependent frequencies of NPM1 mutations and FLT3 -ITD in patients with normal karyotype AML (NK-AML). Ann. Hematol. 2012, 91, 9–18. [Google Scholar] [CrossRef]
- Chou, W.C.; Tang, J.L.; Lin, L.I.; Yao, M.; Tsay, W.; Chen, C.Y.; Wu, S.J.; Huang, C.F.; Chiou, R.J.; Tseng, M.H.; et al. Nucleophosmin Mutations in De novo Acute Myeloid Leukemia: The Age-Dependent Incidences and the Stability during Disease Evolution. Cancer Res. 2006, 66, 3310–3316. [Google Scholar] [CrossRef]
- Falini, B.; Mecucci, C.; Tiacci, E.; Alcalay, M.; Rosati, R.; Pasqualucci, L.; La Starza, R.; Diverio, D.; Colombo, E.; Santucci, A.; et al. Cytoplasmic Nucleophosmin in Acute Myelogenous Leukemia with a Normal Karyotype. N. Engl. J. Med. 2005, 352, 254–266. [Google Scholar] [CrossRef] [PubMed]
- Verhaak, R.G.W.; Goudswaard, C.S.; van Putten, W.; Bijl, M.A.; Sanders, M.A.; Hugens, W.; Uitterlinden, A.G.; Erpelinck, C.A.J.; Delwel, R.; Löwenberg, B.; et al. Mutations in nucleophosmin (NPM1) in acute myeloid leukemia (AML): Association with other gene abnormalities and previously established gene expression signatures and their favorable prognostic significance. Blood 2005, 106, 3747–3754. [Google Scholar] [CrossRef]
- Suzuki, T. Clinical characteristics and prognostic implications of NPM1 mutations in acute myeloid leukemia. Blood 2005, 106, 2854–2861. [Google Scholar] [CrossRef]
- Schnittger, S.; Schoch, C.; Dugas, M.; Kern, W.; Staib, P.; Wuchter, C.; Löffler, H.; Sauerland, C.M.; Serve, H.; Büchner, T.; et al. Analysis of FLT3 length mutations in 1003 patients with acute myeloid leukemia: Correlation to cytogenetics, FAB subtype, and prognosis in the AMLCG study and usefulness as a marker for the detection of minimal residual disease. Blood 2002, 100, 59–66. [Google Scholar] [CrossRef] [PubMed]
- Büchner, T.; Berdel, W.E.; Haferlach, C.; Haferlach, T.; Schnittger, S.; Müller-Tidow, C.; Braess, J.; Spiekermann, K.; Kienast, J.; Staib, P.; et al. Age-Related Risk Profile and Chemotherapy Dose Response in Acute Myeloid Leukemia: A Study by the German Acute Myeloid Leukemia Cooperative Group. J. Clin. Oncol. 2009, 27, 61–69. [Google Scholar] [CrossRef] [PubMed]
- Herold, T.; Rothenberg-Thurley, M.; Grunwald, V.V.; Janke, H.; Goerlich, D.; Sauerland, M.C.; Konstandin, N.P.; Dufour, A.; Schneider, S.; Neusser, M.; et al. Validation and refinement of the revised 2017 European LeukemiaNet genetic risk stratification of acute myeloid leukemia. Leukemia 2020, 34, 3161–3172. [Google Scholar] [CrossRef]
- Sekeres, M.A. Differences in prognostic factors and outcomes in African Americans and whites with acute myeloid leukemia. Blood 2004, 103, 4036–4042. [Google Scholar] [CrossRef]
- Ambayya, A.; Sasmita, A.O.; Seman, Z.; Chang, K.M.; Sathar, J.; Yegappan, S.; Noor, S.M. Microarray-based genomic analysis identifies germline and somatic copy number variants and loss of heterozygosity in acute myeloid leukaemia. Malaysian J. Med. Health Sci. 2018, 14, 11–24. [Google Scholar]
- Angeli, A.; Leong, W.M.; Jameela, S.R.H. Transcriptomic Profiling of Cytogenetically Normal Acute Myeloid Leukaemia by Using High Throughput Deep Sequencing Technology in Malaysia. Blood Res. 2020, 55, 181. [Google Scholar]
- Simons, A.; Shaffer, L.G.; Hastings, R.J. Cytogenetic nomenclature: Changes in the ISCN 2013 compared to the 2009 edition. Cytogenet. Genome Res. 2013, 141, 1–6. [Google Scholar] [CrossRef] [PubMed]


| Factors | Male | Female | p-Value ¥ | Malay | Chinese | Indian | p-Value £ | Total |
|---|---|---|---|---|---|---|---|---|
| Age (years) | 854 (100) | |||||||
| 13–15 years | 16 (2) | 8 (1) | 19 (4) | 5 (2) | 0 (0) | 24 (3) | ||
| 16–19 Years | 29 (3) | 29 (3) | 42 (8) | 10 (4) | 6 (9) | 58 (6) | ||
| 20–29 Years | 66 (8) | 58 (7) | 84 (17) | 27 (10) | 13 (19) | 124 (15) | ||
| 30–39 Years | 73 (9) | 79 (9) | 94 (19) | 44 (16) | 14 (20) | 152 (18) | ||
| 40–49 Years | 62 (7) | 75 (9) | 83 (16) | 46 (16) | 8 (11) | 137 (16) | ||
| 50–59 Years | 89 (10) | 79 (9) | 94 (19) | 59 (21) | 15 (21) | 168 (19) | ||
| 60–69 Years | 71 (8) | 57 (7) | 69 (14) | 52 (19) | 7 (10) | 128 (15) | ||
| 70 and above | 37 (4) | 26 (3) | 19 (4) | 37 (13) | 7 (10) | 63 (7) | ||
| Below 60 and above 60 | 854 (100) | |||||||
| <60 years | 335 (39) | 328 (38) | 0.140 | 416 (49) | 191 (22) | 56 (7) | 0.000 | 663 (77) |
| >60 years | 108 (13) | 83 (10) | 88 (10) | 89 (10) | 14 (2) | 191 (23) | ||
| Ethnicity | 854 (100) | |||||||
| Malay | 257 (30) | 247 (29) | 504 (59) | |||||
| Chinese | 149 (17) | 131 (15) | 280 (32) | |||||
| Indian | 37 (4) | 33 (4) | 70 (8) | |||||
| White blood cell count (109/L) a | 740 (100) | |||||||
| <100 (109/L) | 323 (85) | 301 (84) | 0.600 | 624 (84) | ||||
| >100 (109/L) | 57 (15) | 59 (16) | 116 (16) | |||||
| Karyotype | 854 (100) | |||||||
| Normal karyotype | 161 (52) | 133 (46) | 0.720 | 177 (49) | 94 (50) | 23 (42) | 294 (49) | |
| Translocation Karyotype | ||||||||
| t(15:17) | 34 (11) | 52 (18) | 53 (15) | 26 (14) | 7 (13) | 86 (14) | ||
| t(8; 21) | 23 (7) | 28 (10) | 30 (8) | 19 (10) | 2 (4) | 51 (8) | ||
| inv(16) | 16 (5) | 14 (5) | 14 (4) | 11 (6) | 5 (9) | 30 (5) | ||
| t(11q23) | 9 (3) | 6 (2) | 12 (3) | 1 (1) | 2 (4) | 15 (2) | ||
| Miscellaneous translocations | 21 (7) | 11 (4) | 19 (5) | 9 (5) | 4 (7) | 32 (5) | ||
| Deletion karyotype | ||||||||
| del(5q/7q) | 16 (5) | 16 (5) | 12 (3) | 14 (7) | 6 (11) | 32 (5) | ||
| Miscellaneous deletions | 15 (5) | 13 (4) | 18 (5) | 6 (3) | 4 (7) | 28 (5) | ||
| Trisomy karyotype | ||||||||
| +8 | 9 (3) | 10 (3) | 11 (3) | 6 (3) | 2 (4) | 19 (3) | ||
| Miscellaneous trisomies | 6 (2) | 8 (3) | 12 (3) | 2 (1) | 0 (0) | 14 (2) | ||
| Total | 0 | 0 | 0 | 0 | 0 | 0 | ||
| Moorman’s Classification (% of successful cases) | 854 (100) | |||||||
| Normal karyotype | 161 (52) | 133 (46) | 0.720 | 177 (49) | 94 (50) | 23 (42) | 0.3400 | 294 (49) |
| Translocation Karyotype | 103 (33) | 111 (38) | 0.810 | 128 (36) | 66 (35) | 20 (36) | 214 (36) | |
| Deletion karyotype | 31 (10) | 29 (10) | 0.890 | 30 (8) | 20 (11) | 10 (18) | 60 (10) | |
| Trisomy karyotype | 15 (5) | 18 (6) | 0.120 | 23 (6) | 8 (4) | 2 (4) | 33 (5) | |
| Gene mutations | ||||||||
| NPM1 b | 419 (100) | |||||||
| Detected | 41 (19) | 49 (25) | 0.16 | 61 (24) | 18 (14) | 11 (29) | 0.030 | 90 (22) |
| Not Detected | 176 (81) | 151 (75) | 191 (76) | 109 (86) | 27 (71) | 327 (78) | ||
| FLT3-ITD c | 485 (100) | |||||||
| Detected | 47 (19) | 37 (16) | 0.42 | 51 (17) | 24 (17) | 9 (21) | 0.8 | 84 (17) |
| Not Detected | 205 (81) | 196 (84) | 247 (83) | 120 (83) | 34 (79) | 401 (83) | ||
| Genotype (FLT3-ITD/NPM1) d | 414 (100) | |||||||
| FLT3-ITDmut NPM1mut | 15 (7) | 16 (8) | 0.37 | 21 (8) | 8 (6) | 2 (5) | 0.113 | 31 (7) |
| FLT3-ITDmut NPM1wt | 29 (13) | 19 (10) | 27 (11) | 15 (12) | 6 (16) | 48 (12) | ||
| FLT3-ITDnegNPM1mut | 26 (12) | 33 (26) | 40 (16) | 10 (8) | 9 (24) | 59 (14) | ||
| FLT3-ITDneg NPMwt | 145 (67) | 129 (65) | 160 (65) | 93 (74) | 20 (54) | 276 (67) | ||
| Cytogenetic risk based on ELN 2017 e | 494 (100) | |||||||
| Favourable | 85 (34) | 116 (47) | 0.011 | 121 (42) | 59 (38) | 21 (43) | 0.020 | 201 (41) |
| Intermediate | 109 (44) | 86 (35) | 119 (41) | 65 (42) | 11 (22) | 195 (39) | ||
| Adverse | 55 (22) | 43 (18) | 50 (17) | 31 (20) | 17 (35) | 98 (20) | ||
| ELN and age groups | 494 (100) | |||||||
| Below 60 f | 408 (83) | |||||||
| Favourable | 77 (39) | 103 (49) | 0.110 | 109 (44) | 53 (45) | 18 (45) | 0.02 | 180 (44) |
| Intermediate | 79 (40) | 76 (36) | 101 (40) | 46 (39) | 8 (20) | 155 (38) | ||
| Adverse | 41 (34) | 32 (15) | 40 (16) | 19 (29) | 14 (35) | 73 (18) | ||
| Above 60 g | 86 (17) | |||||||
| Favourable | 8 (15) | 13 (38) | 0.010 | 12 (30) | 6 (16) | 3 (33) | 0.00 | 21 (24) |
| Intermediate | 30 (58) | 10 (29) | 18 (45) | 19 (51) | 3 (33) | 40 (47) | ||
| Adverse | 14 (27) | 11 (32) | 10 (25) | 12 (32) | 3 (33) | 25 (29) | ||
| Cytogenetics Group | Total a | Males | Females | Sex Ratio (M:F) |
|---|---|---|---|---|
| Cytogenetics Investigation | ||||
| Total cases | 854 (100) | 443 (100) | 411 (100) | 1.08 |
| Successful | 601 (70) | 310 (70) | 291 (71) | 1.07 |
| Failed | 60 (7) | 31 (7) | 29 (7) | 1.07 |
| Not tested | 193 (23) | 102 (23) | 91 (22) | 1.12 |
| Karyotype Group b | ||||
| Normal karyotype | 294 (49) | 161 (52) | 133 (46) | 1.21 |
| Translocation Karyotype | 214 (36) | 103 (33) | 111 (38) | 0.93 |
| t(15:17) | 86 (14) | 34 (11) | 52 (18) | 0.65 |
| t(8; 21) | 51 (9) | 23 (7) | 28 (9) | 0.82 |
| inv(16) | 30 (5) | 16 (5) | 14 (5) | 1.14 |
| t(11q23) | 15 (3) | 9 (3) | 6 (2) | 1.5 |
| Miscellaneous translocations | 32 (5) | 21 (7) | 11 (4) | 1.91 |
| Deletion karyotype | 60 (10) | 31 (10) | 29 (10) | 1.07 |
| del(5q/7q) | 32 (5) | 16 (5) | 16 (6) | 1 |
| Miscellaneous deletions | 28 (5) | 15 (5) | 13 (4) | 1.15 |
| Trisomy karyotype | 33 (5) | 15 (5) | 18 (6) | 0.83 |
| +8 | 19 (3) | 9 (3) | 10 (3) | 0.9 |
| Miscellaneous trisomies | 14 (2) | 6 (2) | 8 (3) | 0.75 |
| Cytogenetic Group | Total | 13–15 Years | 16–19 Years | 20–29 Years | 30–39 Years | 40–49 Years | 50–59 Years | 60–69 Years | ≥70 |
|---|---|---|---|---|---|---|---|---|---|
| Cytogenetic investigation | |||||||||
| Total cases | 854 (100) | 24 (3) | 58 (7) | 124 (14) | 152 (18) | 137 (16) | 168 (20) | 128 (15) | 63 (7) |
| Successful | 601 (100) | 16 (3) | 42 (7) | 103 (17) | 119 (20) | 98 (16) | 115 (19) | 86 (14) | 22 (4) |
| Failed | 60 (100) | 3 (5) | 2 (3) | 8 (13) | 9 (15) | 9 (15) | 16 (27) | 11 (18) | 2 (3) |
| Not tested | 193 (100) | 5 (3) | 14 (7) | 13 (7) | 24 (12) | 30 (16) | 37 (19) | 31 (16) | 39 (20) |
| Karyotype Group | |||||||||
| Normal karyotype | 294 (100) | 3 (1) | 21 (7) | 46 (16) | 52 (18) | 48 (16) | 65 (22) | 49 (17) | 10 (3) |
| Translocation Karyotype | 214 (100) | 11 (5) | 17 (8) | 51 (24) | 49 (23) | 37 (17) | 31 (14) | 14 (7) | 4 (2) |
| t(15:17) | 86 (100) | 2 (2) | 8 (9) | 20 (23) | 21 (24) | 17 (20) | 12 (14) | 5 (6) | 1 (1) |
| t(8; 21) | 51 (100) | 5 (10) | 8 (16) | 12 (23) | 11 (21) | 6 (12) | 6 (12) | 1 (2) | 2 (4) |
| inv(16) | 30 (100) | 1 (3) | 1 (3) | 8 (27) | 9 (30) | 4 (13) | 7 (23) | 0 (0) | 0 (0) |
| t(11q23) | 15 (100) | 0 (0) | 0 (0) | 5 (33) | 2 (13) | 3 (20) | 1 (7) | 4 (27) | 0 (0) |
| Miscellaneous translocations | 32 (100) | 3 (9) | 0 (0) | 6 (19) | 6 (19) | 7 (22) | 5 (16) | 4 (12) | 1 (3) |
| Deletion karyotype | 60 (100) | 0 (0) | 3 (5) | 4 (7) | 14 (23) | 8 (13) | 11 (18) | 13 (22) | 7 (12) |
| del(5q/7q) | 32 (100) | 0 (0) | 2 (6) | 0 (0) | 6 (19) | 2 (6) | 9 (28) | 9 (28) | 4 (13) |
| Miscellaneous deletions | 28 (100) | 0 (0) | 1 (4) | 4 (14) | 8 (29) | 6 (21) | 2 (7) | 4 (14) | 3 (11) |
| Trisomy karyotype | 33 (100) | 2 (6) | 1 (3) | 2 (6) | 4 (12) | 5 (15) | 8 (24) | 10 (30) | 1 (3) |
| +8 | 19 (100) | 2 (11) | 1 (5) | 1 (5) | 2 (11) | 1 (5) | 5 (26) | 6 (32) | 1 (5) |
| Miscellaneous trisomies | 14 (100) | 0 (0) | 0 (0) | 1 (7) | 2 (14) | 4 (29) | 3 (21) | 4 (29) | 0 (0) |
| Abnormality | t(15:17) | t(8; 21) | inv(16) | t(11q23) | t(3q; 21) | del(5q) | del(7q) | del(9q) | +8 | +21 | +22 | Total Abnormalities |
|---|---|---|---|---|---|---|---|---|---|---|---|---|
| t(15:17) | 77 | 0 | 0 | 0 | 0 | 0 | 2 | 0 | 3 | 4 | 0 | 86 |
| t(8; 21) | 0 | 47 | 0 | 0 | 0 | 0 | 1 | 2 | 0 | 1 | 1 | 52 |
| inv(16) | 0 | 0 | 25 | 0 | 0 | 0 | 1 | 0 | 0 | 1 | 3 | 30 |
| t(11q23) | 0 | 0 | 0 | 13 | 0 | 0 | 0 | 0 | 1 | 1 | 0 | 15 |
| t(3q; 21) | 0 | 0 | 0 | 0 | 2 | 0 | 1 | 0 | 0 | 0 | 0 | 3 |
| del(5q) | 0 | 0 | 0 | 0 | 0 | 4 | 10 | 2 | 4 | 1 | 3 | 24 |
| del(7q) | 2 | 1 | 1 | 0 | 1 | 10 | 10 | 2 | 5 | 1 | 2 | 35 |
| del(9q) | 0 | 2 | 0 | 0 | 0 | 2 | 2 | 8 | 1 | 1 | 0 | 16 |
| +8 | 3 | 0 | 0 | 1 | 0 | 4 | 5 | 1 | 17 | 1 | 1 | 33 |
| +21 | 4 | 1 | 1 | 1 | 0 | 1 | 1 | 1 | 1 | 7 | 1 | 19 |
| +22 | 0 | 0 | 3 | 0 | 0 | 3 | 2 | 0 | 1 | 1 | 1 | 11 |
| Total abnormalities | 86 | 51 | 30 | 15 | 3 | 24 | 35 | 16 | 33 | 19 | 12 | 324 |
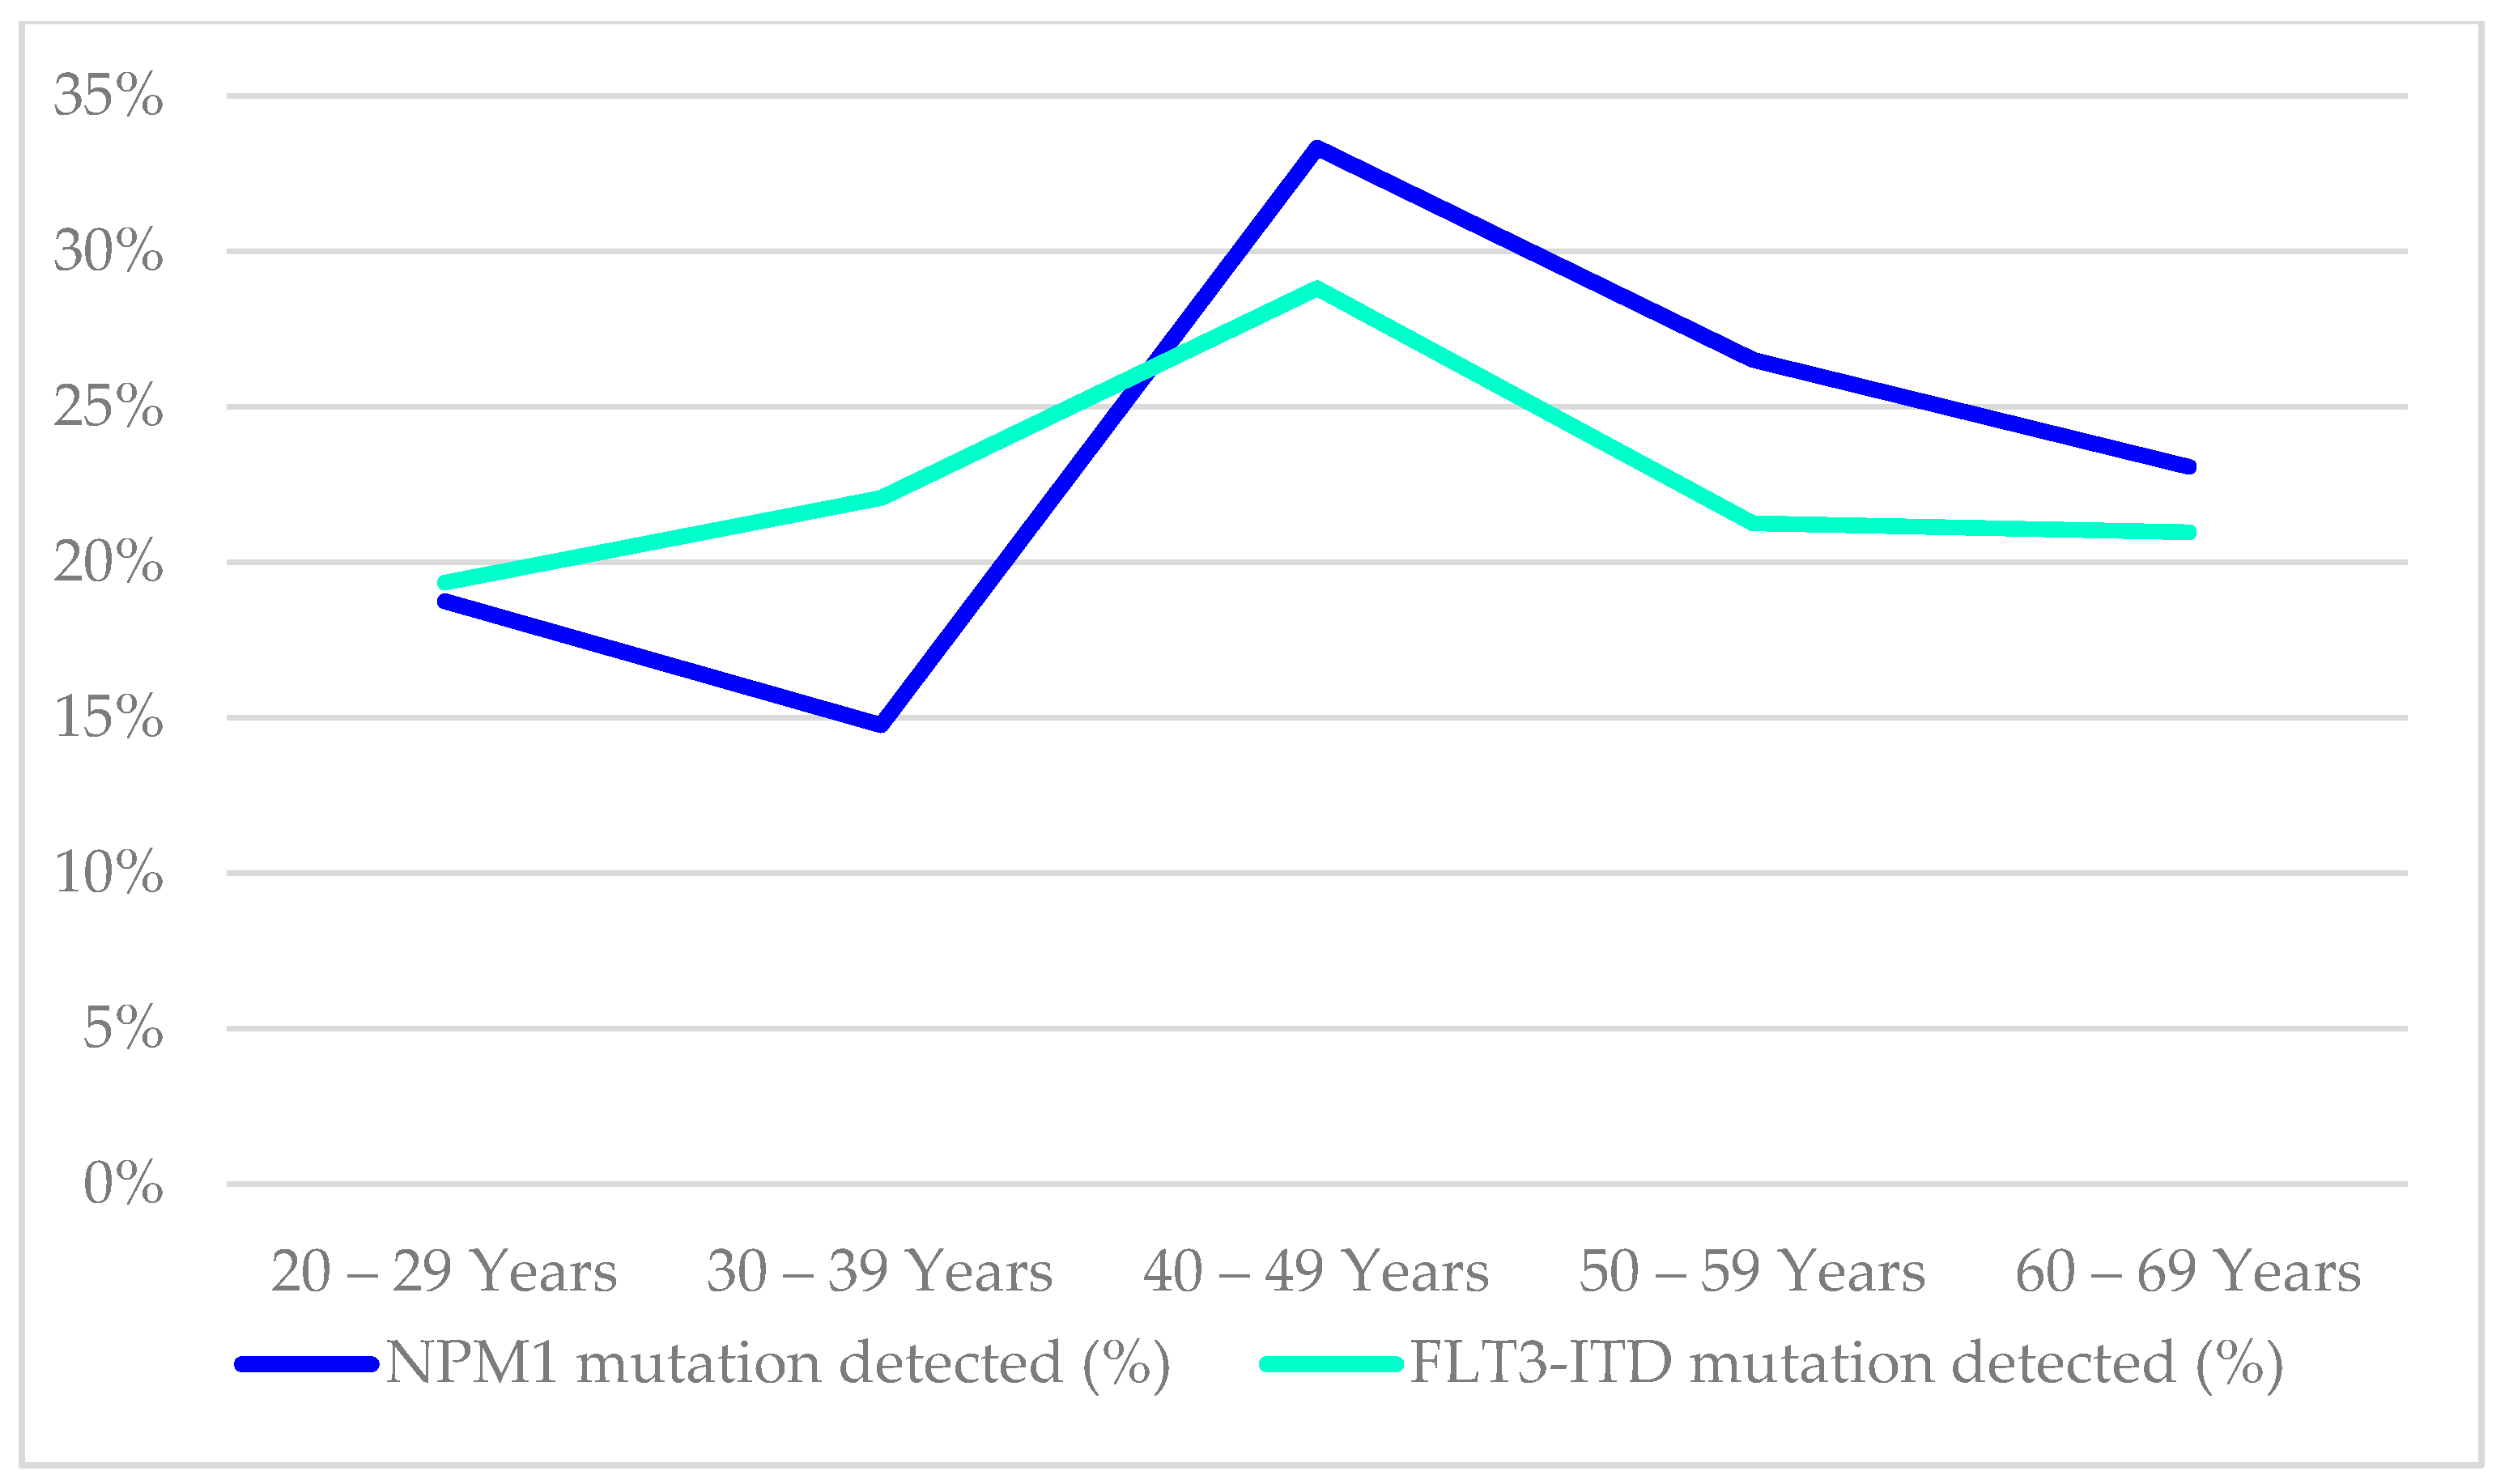
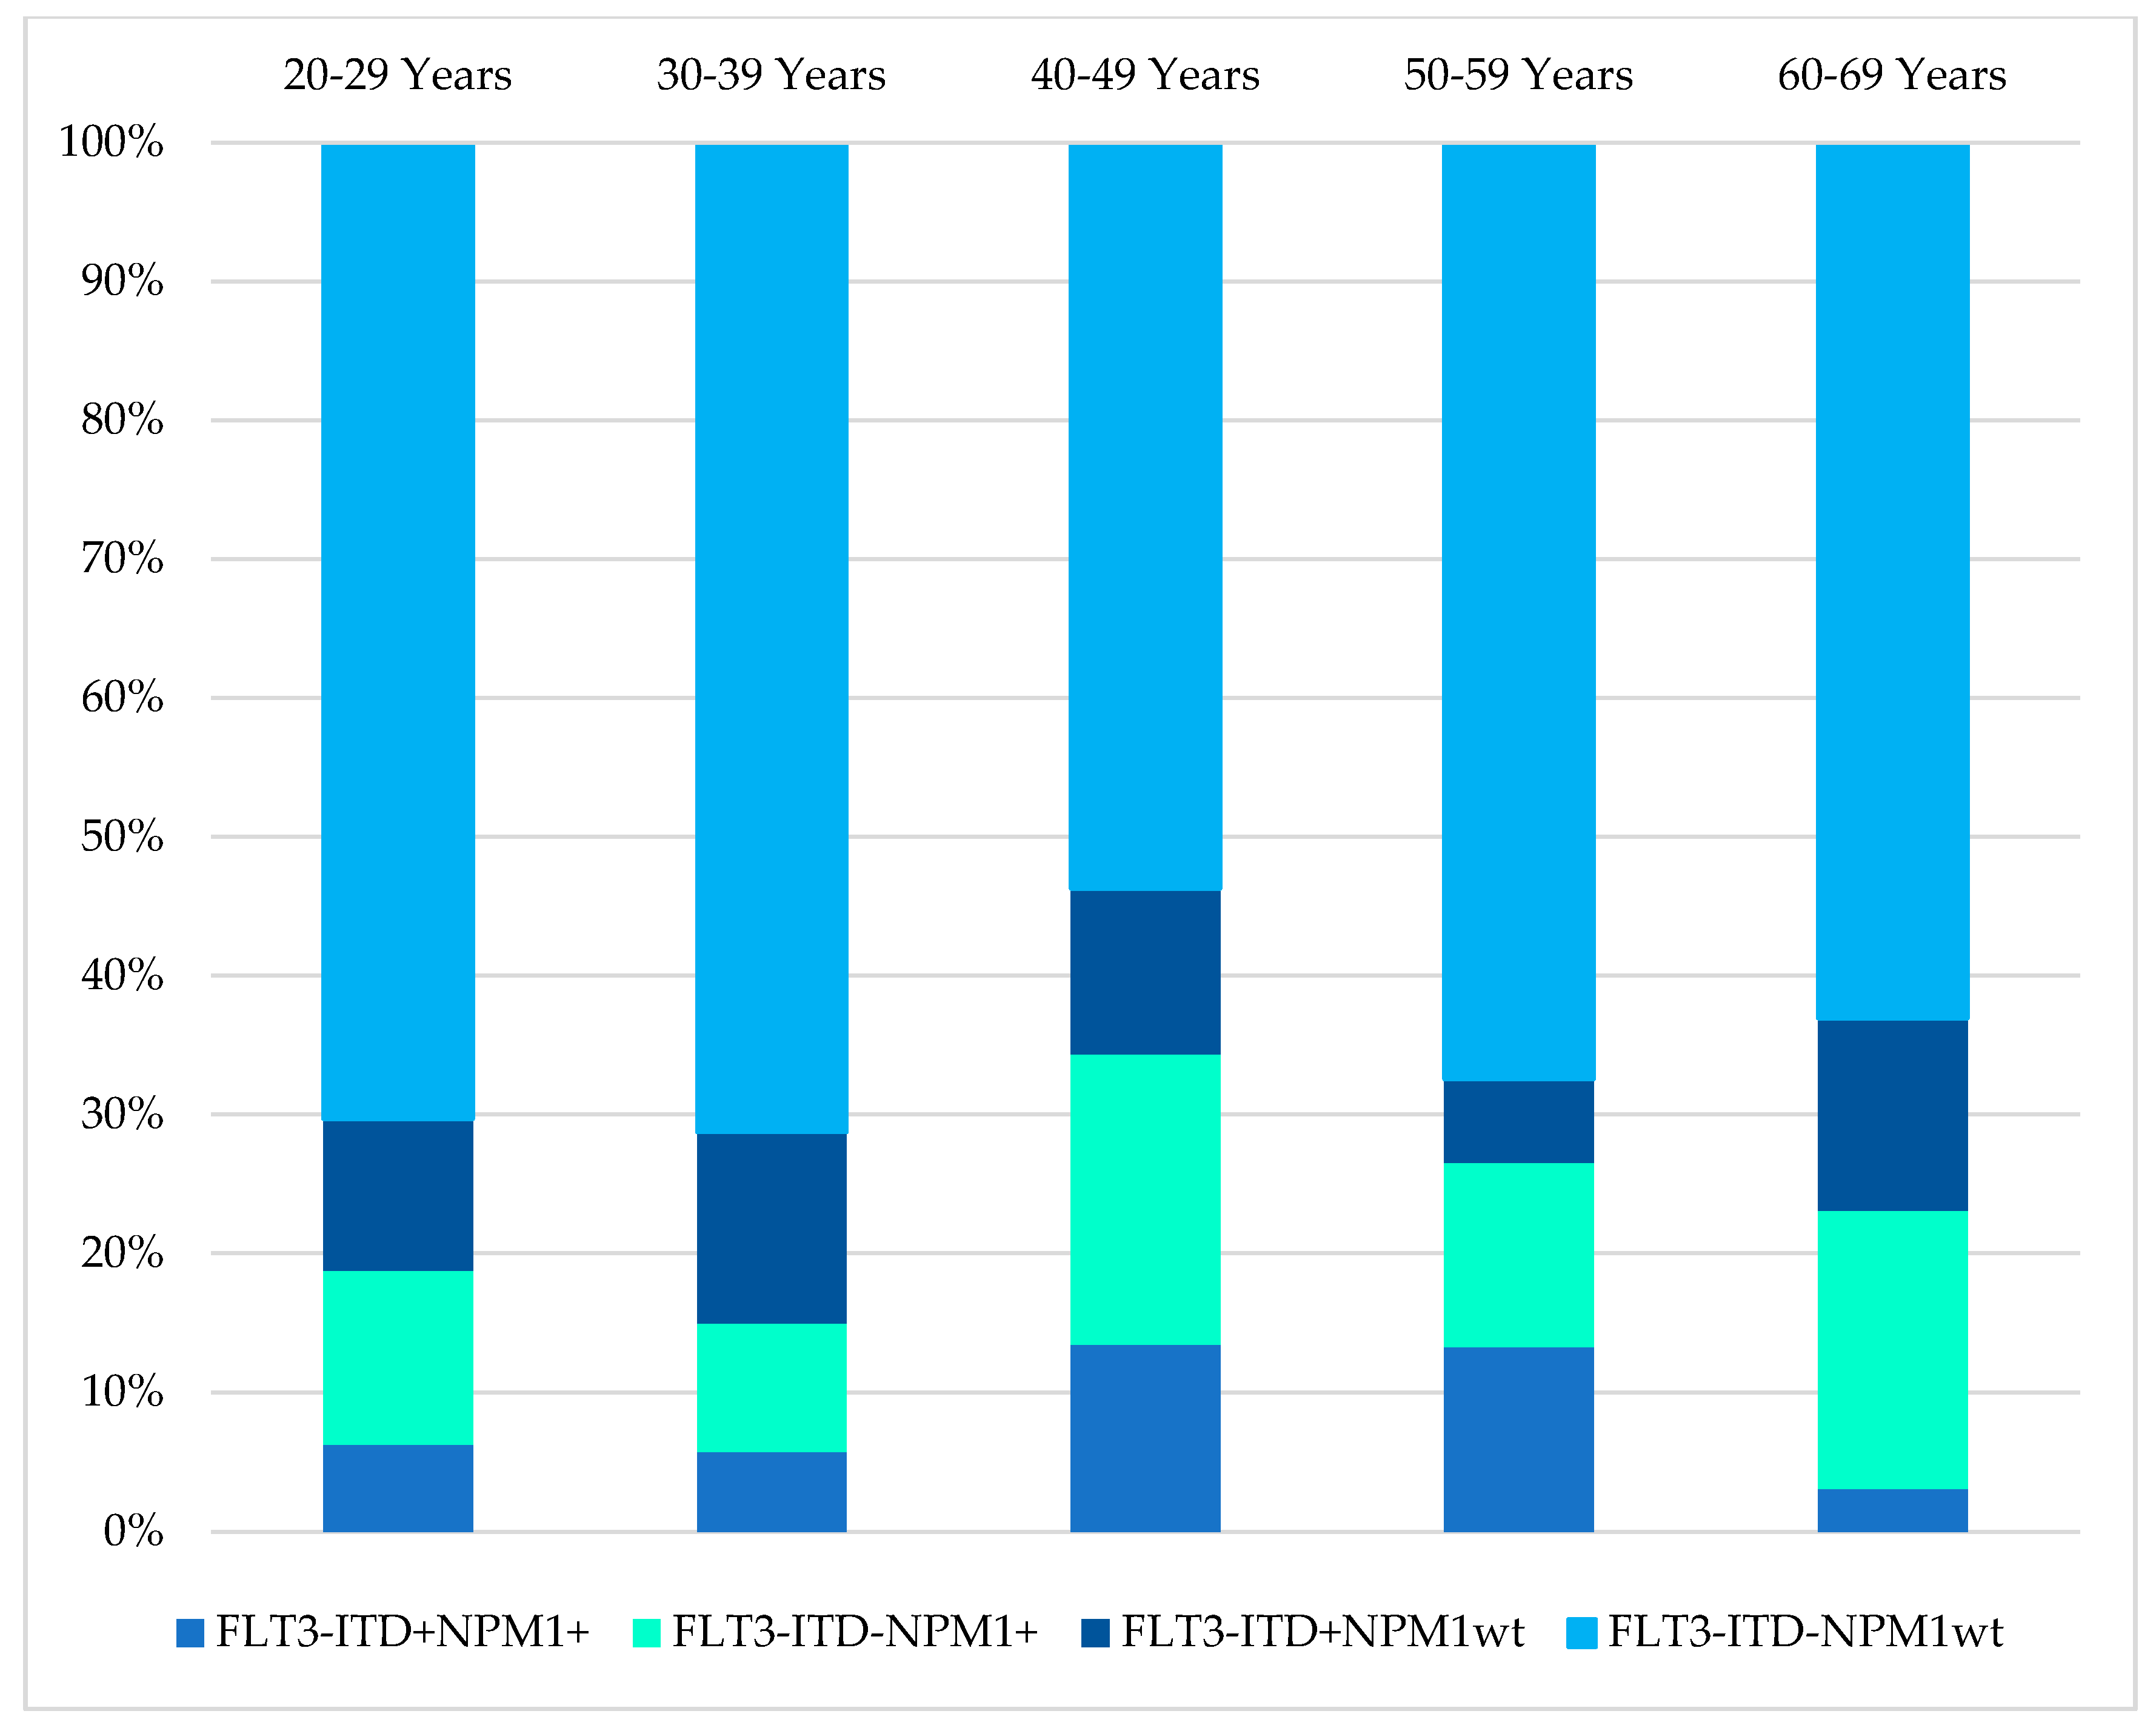
| Age Groups | NPM1 Mutation Detected (%) | Total (n) Tested for NPM1 | FLT3-ITD Mutation Detected (%) | Total (n) Tested for FLT3-ITD | FLT3-ITD+NPM1+ | FLT3-ITD-NPM1+ | FLT3-ITD+NPM1wt | FLT3-ITD-NPM1wt | Total (n) Tested for Both FLT3-ITD and NPM1 |
|---|---|---|---|---|---|---|---|---|---|
| 13–15 years | 0 (0) | 5 | 0 (0) | 14 | 0 (0) | 0 (0) | 0 (0) | 5 (100) | 5 |
| 16–19 Years | 3 (12) | 26 | 5 (16) | 32 | 0 (0) | 3 (12) | 5 (19) | 18 (69) | 26 |
| 20–29 Years | 12 (19) | 64 | 12 (16) | 74 | 4 (6) | 8 (13) | 7 (11) | 45 (70) | 64 |
| 30–39 Years | 13 (15) | 88 | 17 (18) | 94 | 5 (6) | 8 (9) | 12 (14) | 62 (71) | 87 |
| 40–49 Years | 23 (33) | 69 | 17 (22) | 76 | 9 (13) | 14 (21) | 8 (12) | 36 (54) | 67 |
| 50–59 Years | 22 (27) | 83 | 17 (18) | 97 | 11 (13) | 11 (13) | 5 (6) | 56 (67) | 83 |
| 60–69 Years | 15 (23) | 65 | 13 (17) | 75 | 2 (3) | 13 (20) | 9 (14) | 41 (63) | 65 |
| 70 and above | 2 (12) | 17 | 3 (13) | 23 | 0 (0) | 2 (12) | 2 (12) | 13 (76) | 17 |
| Total | 90 | 417 | 84 | 485 | 31 | 59 | 48 | 276 | 414 |
| Cytogenetic Group | ||||||||||||
|---|---|---|---|---|---|---|---|---|---|---|---|---|
| Reference Year | Country | Age Band (Years) | Total | Normal | t(15; 17) | t(8; 21) | inv(16) | t(11q23) | del(5q/7q) | del(5q) | del(7q) | Trisomy 8 |
| Grimwade et al., 1998 [5] § | UK | Total | 1612 (100) | 680 (42) | 198 (12) | 122 (8) | 57 (4) | 60 (4) | - | 28 (2) | 32 (2) | 148 (9) |
| 0–14 | 340 (21) | 91 (27) | 31 (9) | 41 (12) | 16 (5) | 26 (8) | - | 4 (1) | 7 (2) | 46 (14) | ||
| 15–34 | 461 (29) | 177 (38) | 87 (19) | 28 (6) | 26 (6) | 21 (5) | - | 5 (1) | 8 (2) | 47 (10) | ||
| 35+ | 811 (50) | 412 (51) | 80 (10)+ | 53 (7)+ | 15 (2)+ | 13 (2)+ | - | 19 (2) | 17 (2) | 55 (7) | ||
| Moorman et al., 2001 [21] | UK | Total | 593 (100) | 242 (100) | 74 (100) | 34 (100) | 27 (100) | 12 (100) | 61 (100) | - | - | 37 (100) |
| 16–19 | 20 (3) | 8 (3) | 3 (4) | 1 (3) | 1 (4) | 0 (0) | 1 (2) | - | - | 1 (3) | ||
| 20–29 | 77 (13) | 21 (9) | 17 (23) | 10 (30) | 7 (26) | 3 (25) | 1 (2) | - | - | 6 (16) | ||
| 30–39 | 80 (13) | 27 (11) | 14 (19) | 8 (24) | 3 (11) | 6 (50) | 5 (8) | - | - | 5 (14) | ||
| 40–49 | 98 (17) | 40 (17) | 15 (20) | 5 (15) | 7 (26) | 2 (17) | 6 (10) | - | - | 5 (14) | ||
| 50–59 | 117 (20) | 50 (21) | 15 (20) | 4 (12) | 6 (22) | 0 (0) | 13 (21) | - | - | 8 (22) | ||
| 60–69 | 201 (34) | 96 (40) | 10 (14) | 6 (18) | 3 (11) | 1 (8) | 35 (57) | - | - | 12 (32) | ||
| Creutzig et al., 2016 [11] | Germany | Total | 5564 (100) | 2394 | 311 | 256 | 99 | 140 | 81 | |||
| 0 – <2 | 271 (5) | 37 (2) | 5 (2) | 1 (0) | 17 (17) | 68 (49) | NA | - | - | 5 (6) | ||
| 2 – <12 | 477 (9) | 96 (4) | 28 (9) | 82 (32) | 27 (27) | 27 (19) | NA | - | - | 7 (8) | ||
| 12 – <18 | 444 (8) | 121 (5) | 52 (17) | 59 (23) | 24 (24) | 20 (14) | NA | - | - | 13 (16) | ||
| 18 – <40 | 417 (7) | 182 (8) | 52 (17) | 33 (13) | 15 (15) | 14 (10) | NA | - | - | 10 (12) | ||
| 40 – <60 | 1099 (20) | 576 (24) | 89 (29) | 47 (18) | 12 (12) | 5 (4) | NA | - | - | 11 (14) | ||
| 60 – <80 | 2446 (44) | 1196 (50) | 76 (24) | 34 (13) | 4 (4) | 2 (2) | NA | - | - | 18 (22) | ||
| ≥80 | 410 (7) | 186 (8) | 9 (3) | 0 | 0 | 3 (2) | NA | - | - | 17 (21) | ||
| Lazarevic et al., 2014 [42] | Sweden | Total | 3251 (100) | 810 (43) | NA | 36 (1.9) | 42 (2.2) | 21 (1.1) | - | 238 (13) | 249 (13) | NA |
| 18–39 | 193 (6) | 57 (37) | NA | 11 (7.1) | 16 (10) | 3 (1.9) | - | 7 (4.5) | 11 (7.1) | NA | ||
| 40–59 | 612 (19) | 212 (44) | NA | 13 (2.7) | 13 (2.7) | 12 (2.5) | - | 54 (11) | 66 (14) | NA | ||
| 60–69 | 650 (20) | 211 (45) | NA | 6 (1.3) | 8 (1.7) | 0 (0) | - | 56 (12) | 62 (13) | NA | ||
| 70–79 | 1007 (31) | 240 (41) | NA | 4 (0.7) | 5 (0.9) | 6 (1) | - | 91 (16) | 86 (15) | NA | ||
| 80+ | 789 (26) | 90 (45) | NA | 2 (1) | 0 (0) | 0 (0) | - | 30 (15) | 24 (12) | NA | ||
| Enjeti et al., 2004 [26] | Singapore | Total | 454 (100) | 179 (39) | 52 (11) | 34 (7.5) | 5 (1.1) | 4 (0.9) | 62 (13.6) | 30 (6.6) | 32 (7) | 33 (7.3) |
| 15–35 | 102 (22) | 35 (34) | 17 (17) | 18 (18) | 1 (1) | 1 (1) | 7 (6.8) | 3 (2.9) | 4 (3.9) | 6 (5.9) | ||
| 36–55 | 175 (39) | 74 (42) | 25 (14) | 12 (6.9) | 3 (1.7) | 3 (1.7) | 10 (5.7) | 3 (1.7) | 7 (4) | 11 (6.3) | ||
| 56–75 | 148 (33) | 60 (41) | 9 (6.1) | 4 (2.7) | 1 (0.7) | nil | 35 (23) | 18 (12) | 17 (11) | 11 (7.4) | ||
| >75 | 29 (6) | 11 (38) | 1 (3.4) | nil | nil | nil | 10 (35) | 6 (21) | 4 (14) | 5 (17) | ||
| Nakase et al., 2000 [16] | Total | 350(100) | 189 (54.0) | 49 (14.0) | 57 (16.3) | 12 (3.4) | 10 (2.9) | 33 (9.4) | ||||
| Japan | 16–35 | 60 (17.1) | 23 (28.4) | 12 (14.8) | 15 (18.5) | 3 (3.7) | 2 (6.2) | 5 (6.2) * | ||||
| 36–55 | 134 (38.2) | 69 (41.3) | 21 (12.6) | 24 (14.4) | 8 (4.8) | 5 (3.0) | 7 (4.2) * | |||||
| 56–75 | 136 (38.9) | 82 (49.1) | 16 (9.6) | 18 (10.8) | 1 (0.6) | 2 (1.2) | 17 (10.2) * | |||||
| 76–95 | 20 (5.7) | 15 (65.2) | 0 (0) | 0 (0) | 0 (0) | 1 (4.2) | 4 (7.4) * | |||||
| Total | 192 (100) | 102 (53.1) | 27 (14.1) | 11 (5.7) | 14 (7.2) | 6 (3.1) | 31 (16.1) | |||||
| Australia | 16–35 | 58 (30.2) | 30 (46.2) | 6 (9.2) | 7 (10.8) | 7 (10.8) | 3 (4.6) | 5 (7.7) * | ||||
| 36–55 | 67 (34.8) | 36 (45.6) | 11 (13.9) | 4 (5.1) | 4 (5.1) | 3 (3.8) | 9 (11.4) * | |||||
| 56–75 | 57 (29.6) | 32 (44.4) | 8 (11.1) | 1 (1.4) | 3 (4.2) | 0 (0) | 13 (18.1) * | |||||
| 76–95 | 10 (5.2) | 4 (28.6) | 2 (14.3) | 0 (0) | 0 (0) | 0 (0) | 4 (28.6) * | |||||
| Cheng, Y. et al., 2009 [27] | China | Total | 1290 | 547 (42) | 187 (14) | 109 (8) | NA | 16 (1) | 29 (2) | 11 (1) | 18 (1) | 26 (2) |
| 0–9 | 13 | 2 (15) | 3 (23) | 2 (15) | 1 (8) | 0 (0) | 0 (0) | 0 (0) | 0 (0) | |||
| 10–19 | 123 | 43 (35) | 22 (18) | 15 (12) | 2 (2) | 3 (2) | 0 (0) | 3 (2) | 0 (0) | |||
| 20–29 | 186 | 69 (37) | 29 (15) | 19 (10) | 4 (2) | 2 (1) | 0 (0) | 2 (1) | 4 (2) | |||
| 30–39 | 259 | 98 (38) | 46 (17) | 27 (10) | 2 (1) | 5 (2) | 2 (1) | 3 (1) | 4 (2) | |||
| 40–49 | 273 | 118 (43) | 46 (17) | 20 (7) | 2 (1) | 8 (2) | 4 (1) | 4 (1) | 7 (3) | |||
| 50–59 | 239 | 111 (46) | 31 (13) | 19 (8) | 4 (2) | 4 (2) | 0 (0) | 4 (2) | 5 (2) | |||
| 60–69 | 141 | 76 (54) | 5 (4) | 7 (5) | 1 (1) | 4 (3) | 3 (2) | 1 (1) | 2 (1) | |||
| 70–79 | 48 | 21 (44) | 4 (8) | 0 (0) | 0 (0) | 3 (6) | 2 (4) | 1 (2) | 4 (8) | |||
| 80–89 | 8 | 8 (100) | 0 (0) | 0 (0) | 0 (0) | 0 (0) | 0 (0) | 0 (0) | 0 (0) | |||
| Xin, L. et al., 2012 [12] | China | Total | 2308 (100) | 919 (39.8) | 386 (16.7) | 349 (15.1) | 48 (2.1) | 30 (1.3) | NA | NA | 63 (2.7) | 126 (5.5) |
| 0–9 | 156 (6.8) | 50 (32.1) | 22 (14.1) | 35 (22.4) | 3 (1.9) | 9 (5.8) | 1 (0.6) | 1 (0.6) | ||||
| 10–19 | 310 (13.4) | 103 (33.2) | 56 (18.1) | 83 (26.8) | 8 (2.6) | 4 (1.3) | 1 (0.3) | 3 (1.0) | ||||
| 20–29 | 371 (16.1) | 150 (40.4) | 77 (20.8) | 53 (14.3) | 12 (3.2) | 4 (1.1) | 3 (0.8) | 5 (1.3) | ||||
| 30–39 | 406 (17.6) | 155 (38.2) | 92 (22.7) | 49 (12.1) | 8 (2.0) | 2 (0.5) | 2 (0.5) | 11 (2.7) | ||||
| 40–49 | 405 (17.5) | 162 (40.0) | 77 (19.0) | 57 (14.1) | 10 (2.5) | 4 (1.0) | 3 (0.7) | 14 (3.5) | ||||
| 50–59 | 341 (14.8) | 156 (45.7) | 44 (12.9) | 47 (13.8) | 5 (1.5) | 2 (0.6) | 3 (0.9) | 6 (1.8) | ||||
| 60–69 | 200 (8.7) | 93 (46.5) | 12 (6.0) | 13 (6.5) | 1 (0.5) | 4 (2.0) | 2 (1.0) | 8 (4.0) | ||||
| 70–79 | 105 (4.5) | 42 (40.0) | 5 (4.8) | 12 (11.4) | 1 (1.0) | 1 (1.0) | 1 (1.0) | 8 (7.6) | ||||
| 80–89 | 14 (0.6) | 7 (50.0) | 1 (7.1) | 0 (0.0) | 0 (0.0) | 0 (0.0) | 1 (7.1) | 0 (0.0) | ||||
| Kadam, A.P.S. et al., 2016 [18] ¥ | India | Total adult | 1906 (100) | 887 (46.5) | 172 (9) | 286 (15) | 76 (4) | 95 (5) | 171 (9) | 57 (3) | 114 (6) | 152 (8) |
| Boujmia O.K.A et al., 2021 [13] | Morroco | Total adult | 789 (100) | 347 (44) | 31 (3.9) | 66 (8.4) | 37 (4.7) | NA | NA | NA | NA | 42 (5.3) |
| Gmidène et al., 2012 [14] | Tunisia | Total | 631 (100) | 234 (37.1) | 83 (13.2) | 78 (12.2) | 22 (3.5) | NA | 33 (5.3) | 14 (2.2) | 19 (3) | 44 (7) |
| ≤ 15 | 97 (15.3) | 22 (3.5) | 16 (2.6) | 18 (2.8) | 3 (0.5) | NA | 6 (0.9) | 2 (0.3) | 4 (0.6) | 8 (1.3) | ||
| >15 | 534 (84.7) | 212 (33.6) | 67 (10.6) | 60 (9.4) | 19 (3) | NA | 27 (4.3) | 12 (1.9) | 15 (2.4) | 36 (5.7) | ||
| Shaikh, M.S. et al., 2018 [17] | Pakistan | Total adult | 288 (100) | 176 (61.1) | 14 (4.9) | 24 (8.3) | 2 (0.7) | NA | na | na | 3 (1) | 7 (2.4) |
| Meng et al., 2013 [15] | Malaysia | Total | 480 (100) | 334 | 11 | 36 | NA | NA | - | 4 | 6 | NA |
| 0–14 | 61 (12.7) | 35 (10.5) | 2 (18.2) | 12 (33.4) | NA | NA | - | - | - | NA | ||
| 15–30 | 121 (25.2) | 86 (25.7) | 3 (27.2) | 9 (25.0) | NA | NA | - | - | 4 (66.6) | NA | ||
| 31–40 | 75 (15.6) | 59 (17.7) | 2 (18.2) | 6 (16.7) | NA | NA | - | - | - | NA | ||
| 41–50 | 82 (17.1) | 64 (19.2) | 2 (18.2) | 2 (5.5) | NA | NA | - | - | 1 (16.7) | NA | ||
| 51–60 | 70 (14.6) | 46 (13.8) | 1 (9.1) | 5 (13.9) | NA | NA | - | 3 (75) | 1 (16.7) | NA | ||
| This study 2021, Malaysia | Malaysia | Total | 854 (100) | 294 (100) | 86 (100) | 51 (100) | 30 (100) | 15 (100) | 32 (100) | - | - | 19 (100) |
| 13–15 | 24 (3) | 3 (1) | 2 (2) | 5 (10) | 1 (3) | 0 (0) | 0 (0) | - | - | 2 (11) | ||
| 16–19 | 58 (7) | 21 (7) | 8 (9) | 8 (16) | 1 (3) | 0 (0) | 2 (6) | - | - | 1 (5) | ||
| 20–29 | 124 (14) | 46 (16) | 20 (23) | 12 (23) | 8 (27) | 5 (33) | 0 (0) | - | - | 1 (5) | ||
| 30–39 | 152 (18) | 52 (18) | 21 (24) | 11 (21) | 9 (30) | 2 (13) | 6 (19) | - | - | 2 (11) | ||
| 40–49 | 137 (16) | 48 (16) | 17 (20) | 6 (12) | 4 (13) | 3 (20) | 2 (6) | - | - | 1 (5) | ||
| 50–59 | 168 (20) | 65 (22) | 12 (14) | 6 (12) | 7 (23) | 1 (7) | 9 (28) | - | - | 5 (26) | ||
| 60–69 | 128 (15) | 49 (17) | 5 (6) | 1 (2) | 0 (0) | 4 (27) | 9 (28) | - | - | 6 (32) | ||
| >70 | 63 (7) | 10 (3) | 1 (1) | 2 (4) | 0 (0) | 0 (0) | 4 (13) | - | - | 1 (5) | ||
Publisher’s Note: MDPI stays neutral with regard to jurisdictional claims in published maps and institutional affiliations. |
© 2021 by the authors. Licensee MDPI, Basel, Switzerland. This article is an open access article distributed under the terms and conditions of the Creative Commons Attribution (CC BY) license (https://creativecommons.org/licenses/by/4.0/).
Share and Cite
Ambayya, A.; Moorman, A.V.; Sathar, J.; Eswaran, J.; Sulong, S.; Hassan, R. Genetic Profiles and Risk Stratification in Adult De Novo Acute Myeloid Leukaemia in Relation to Age, Gender, and Ethnicity: A Study from Malaysia. Int. J. Mol. Sci. 2022, 23, 258. https://doi.org/10.3390/ijms23010258
Ambayya A, Moorman AV, Sathar J, Eswaran J, Sulong S, Hassan R. Genetic Profiles and Risk Stratification in Adult De Novo Acute Myeloid Leukaemia in Relation to Age, Gender, and Ethnicity: A Study from Malaysia. International Journal of Molecular Sciences. 2022; 23(1):258. https://doi.org/10.3390/ijms23010258
Chicago/Turabian StyleAmbayya, Angeli, Anthony V. Moorman, Jameela Sathar, Jeyanthy Eswaran, Sarina Sulong, and Rosline Hassan. 2022. "Genetic Profiles and Risk Stratification in Adult De Novo Acute Myeloid Leukaemia in Relation to Age, Gender, and Ethnicity: A Study from Malaysia" International Journal of Molecular Sciences 23, no. 1: 258. https://doi.org/10.3390/ijms23010258
APA StyleAmbayya, A., Moorman, A. V., Sathar, J., Eswaran, J., Sulong, S., & Hassan, R. (2022). Genetic Profiles and Risk Stratification in Adult De Novo Acute Myeloid Leukaemia in Relation to Age, Gender, and Ethnicity: A Study from Malaysia. International Journal of Molecular Sciences, 23(1), 258. https://doi.org/10.3390/ijms23010258