3.1. Condensation of pDNA and the Evaluation of the Physiochemical Properties
The optimal conditions were determined for condensing pDNA with protamine, a condenser showing efficient DNA release [
13,
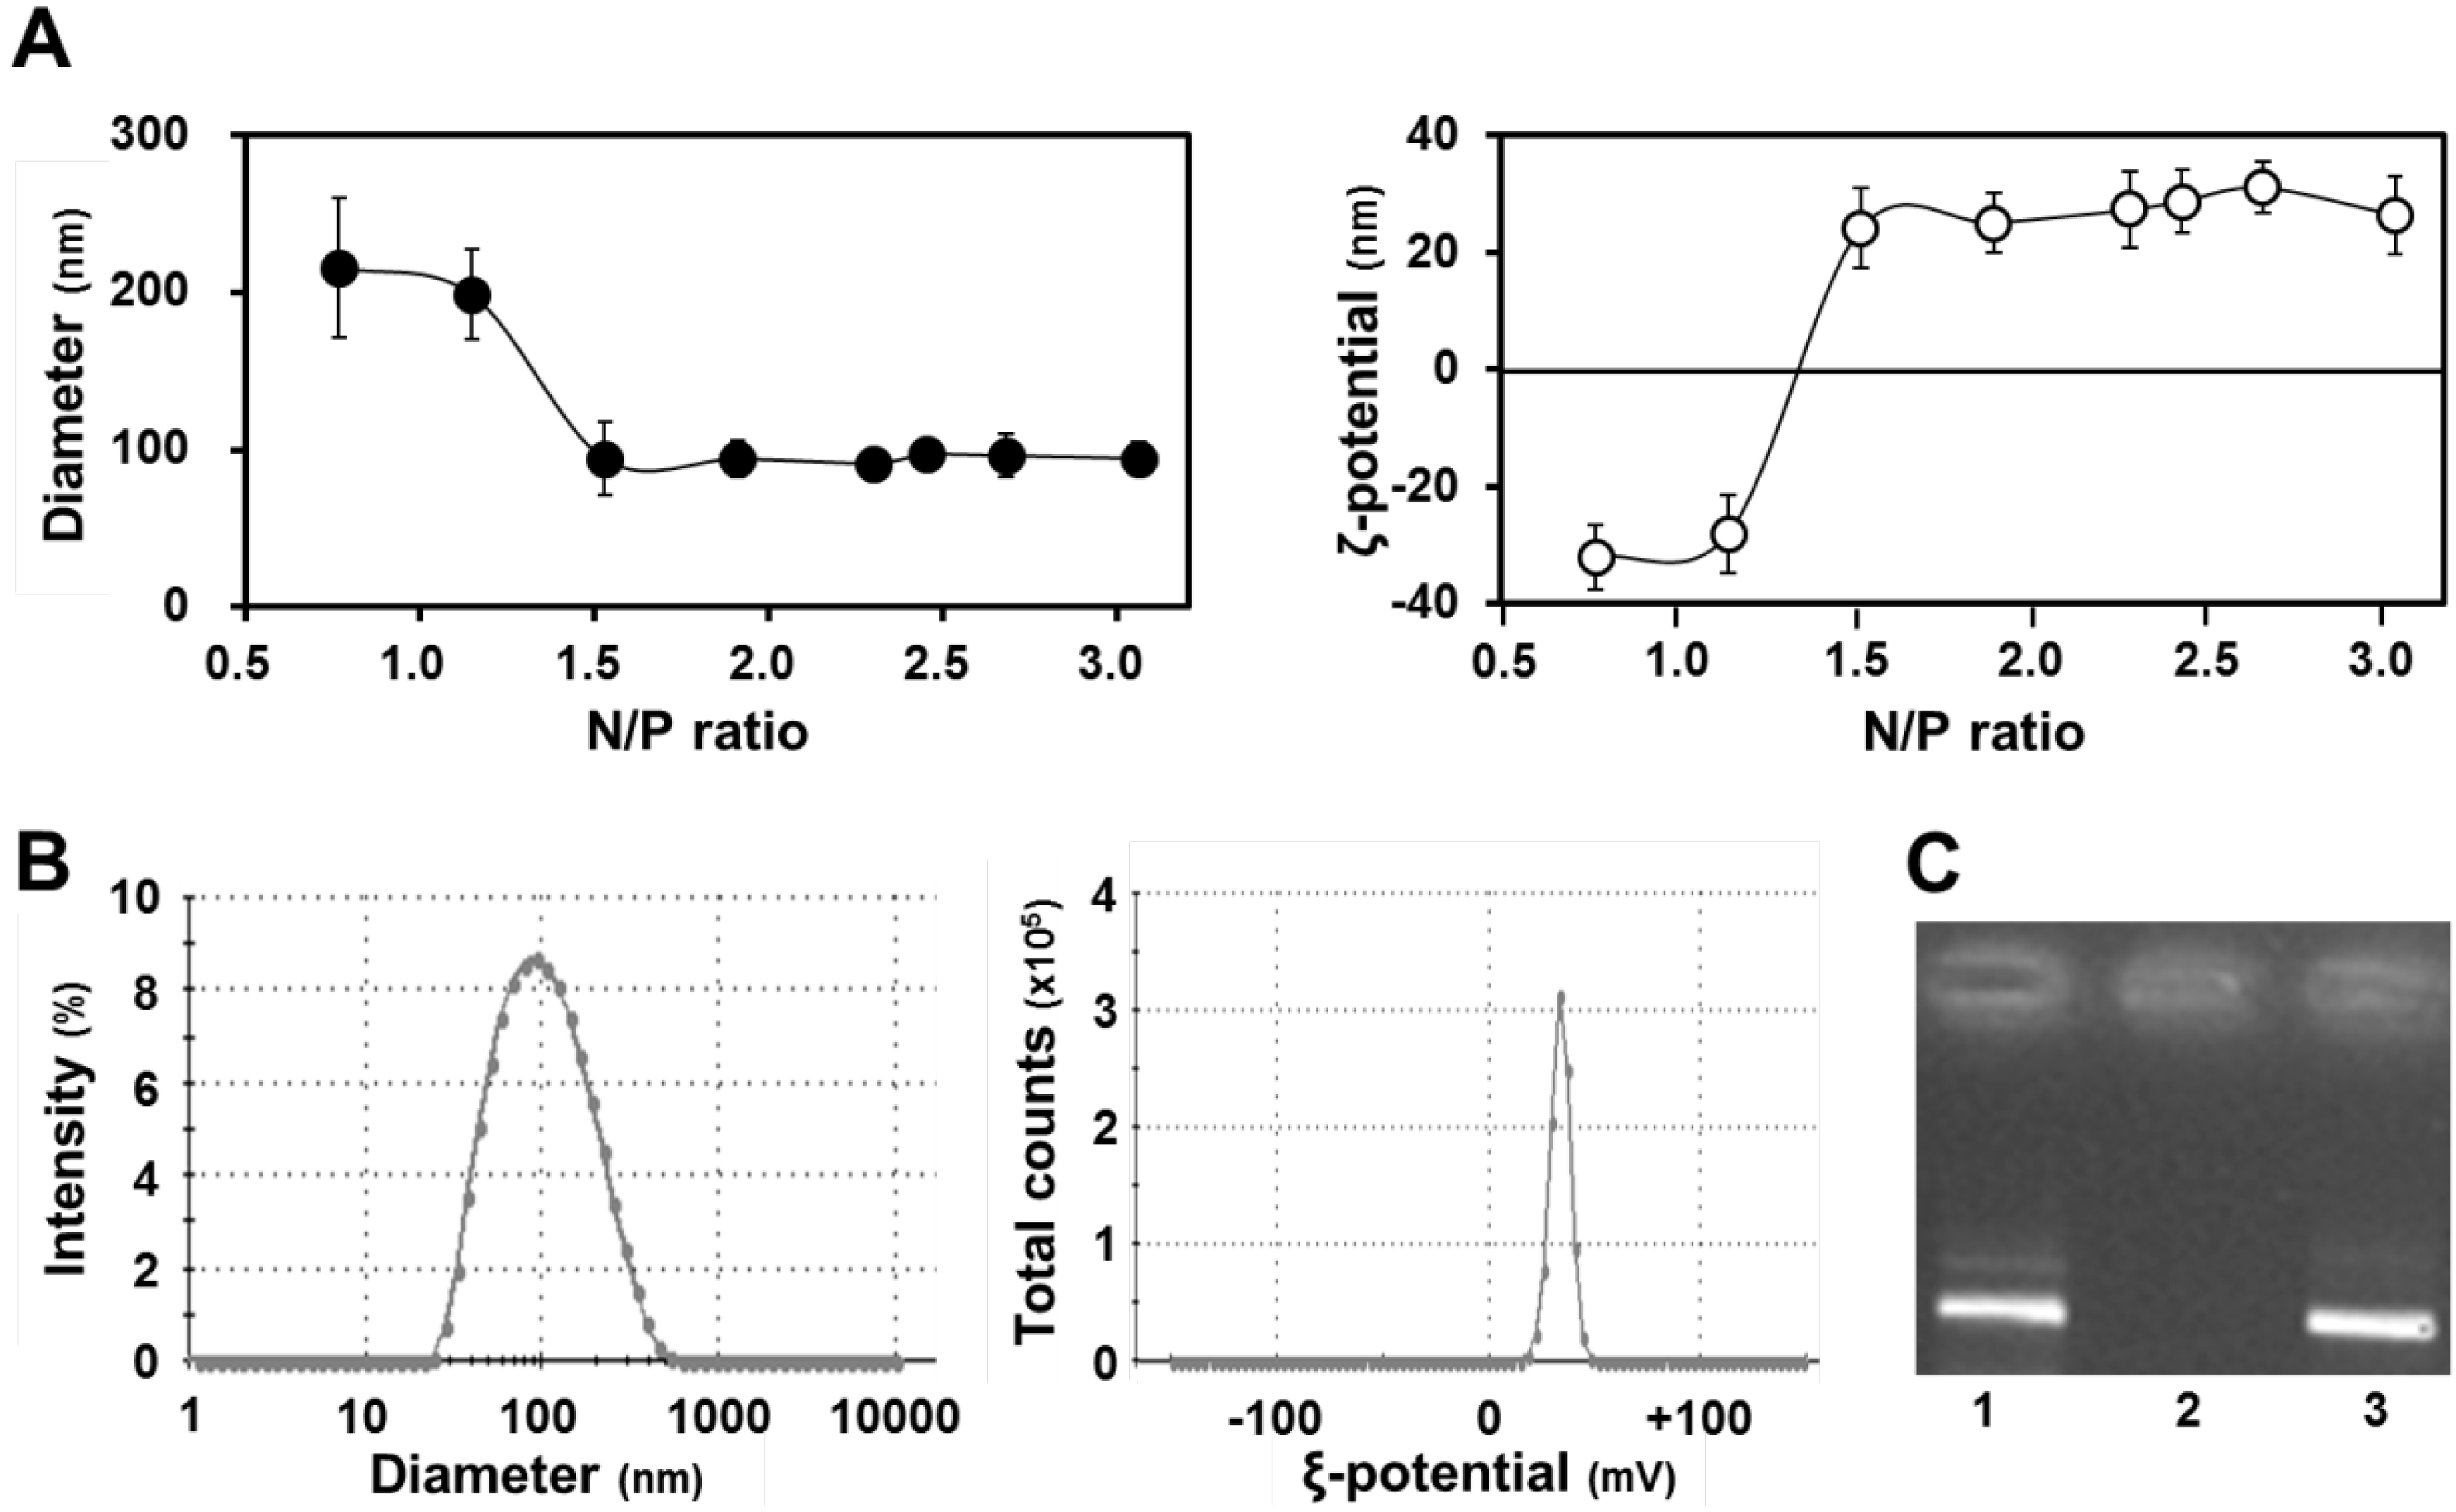
14]. pDNA was mixed with protamine at several N/P ratios to form nanoparticles and their diameters and ζ-potentials were then measured (
Figure 2A).
Figure 2A (left panel) shows the diameters of the condensed pDNA, in which particles with diameters of ~100 nm were formed at N/P ratios higher than 1.5.
Figure 2A (right panel) shows the ζ potentials of condensed pDNA, where the charges of particles had changed from minus to plus when the N/P ratio was increased. In this experiment, we used small positively charged particles that were formed at an N/P ratio of 2.3. As shown in
Figure 2B, the condensed pDNA was a positively charged nanoparticle with a homogeneous structure. A dynamic light scattering analysis indicated a single population that was small in size (left panel,
Figure 2B). Furthermore, the ζ potential for the carrier also exhibited a single peak (right panel,
Figure 2B).
Figure 2.
Characteristics of condensed pDNA. (A) Diameters (left) and ξ potentials (right) of condensed pDNA prepared using protamine at a series of N/P ratios. Data represent the mean ± S.D. (n = 4); (B) Distribution of diameter (left) and ξ potential (right) of condensed pDNA with protamine at an N/P ratio of 2.3; (C) Gel electrophoresis data for the release of pDNA from condensed pDNA. Naked pDNA (lane 1) and pDNA condensed with protamine were subjected to agarose gel electrophoresis before (lane 2) and after (lane 3) pAsp treatment.
We also evaluated the stability of the condensed pDNA with protamine by agarose gel electrophoresis before and after treatment with a polyanion, which inhibits the development of electrostatic interactions between pDNA and the cationic protamine. (
Figure 2C). In this experiment, we observed the fluorescent band of pDNA, when pDNA is released from the condensed pDNA. Gel electrophoresis data showed that the pDNA was condensed with protamine under normal conditions (lane 2,
Figure 2C). On the other hand, pDNA was easily released from the condensed pDNA by protamine in the presence of a counter polyanion such as poly(
l-aspartic acid) (pAsp) (lane 3,
Figure 2C). We hypothesized that pDNA would be released from the condensed pDNA during the period that the q-PCR experiment was performed, because a buffer containing a polyanion was used during the q-PCR experiment. Thus, we concluded that it is possible to compare mitochondrial DNA association between naked pDNA and condensed pDNA, when the pDNA was condensed with protamine.
3.2. Comparison of Mitochondrial Association with pDNA by HLV Injection between Naked pDNA and Condensed pDNA
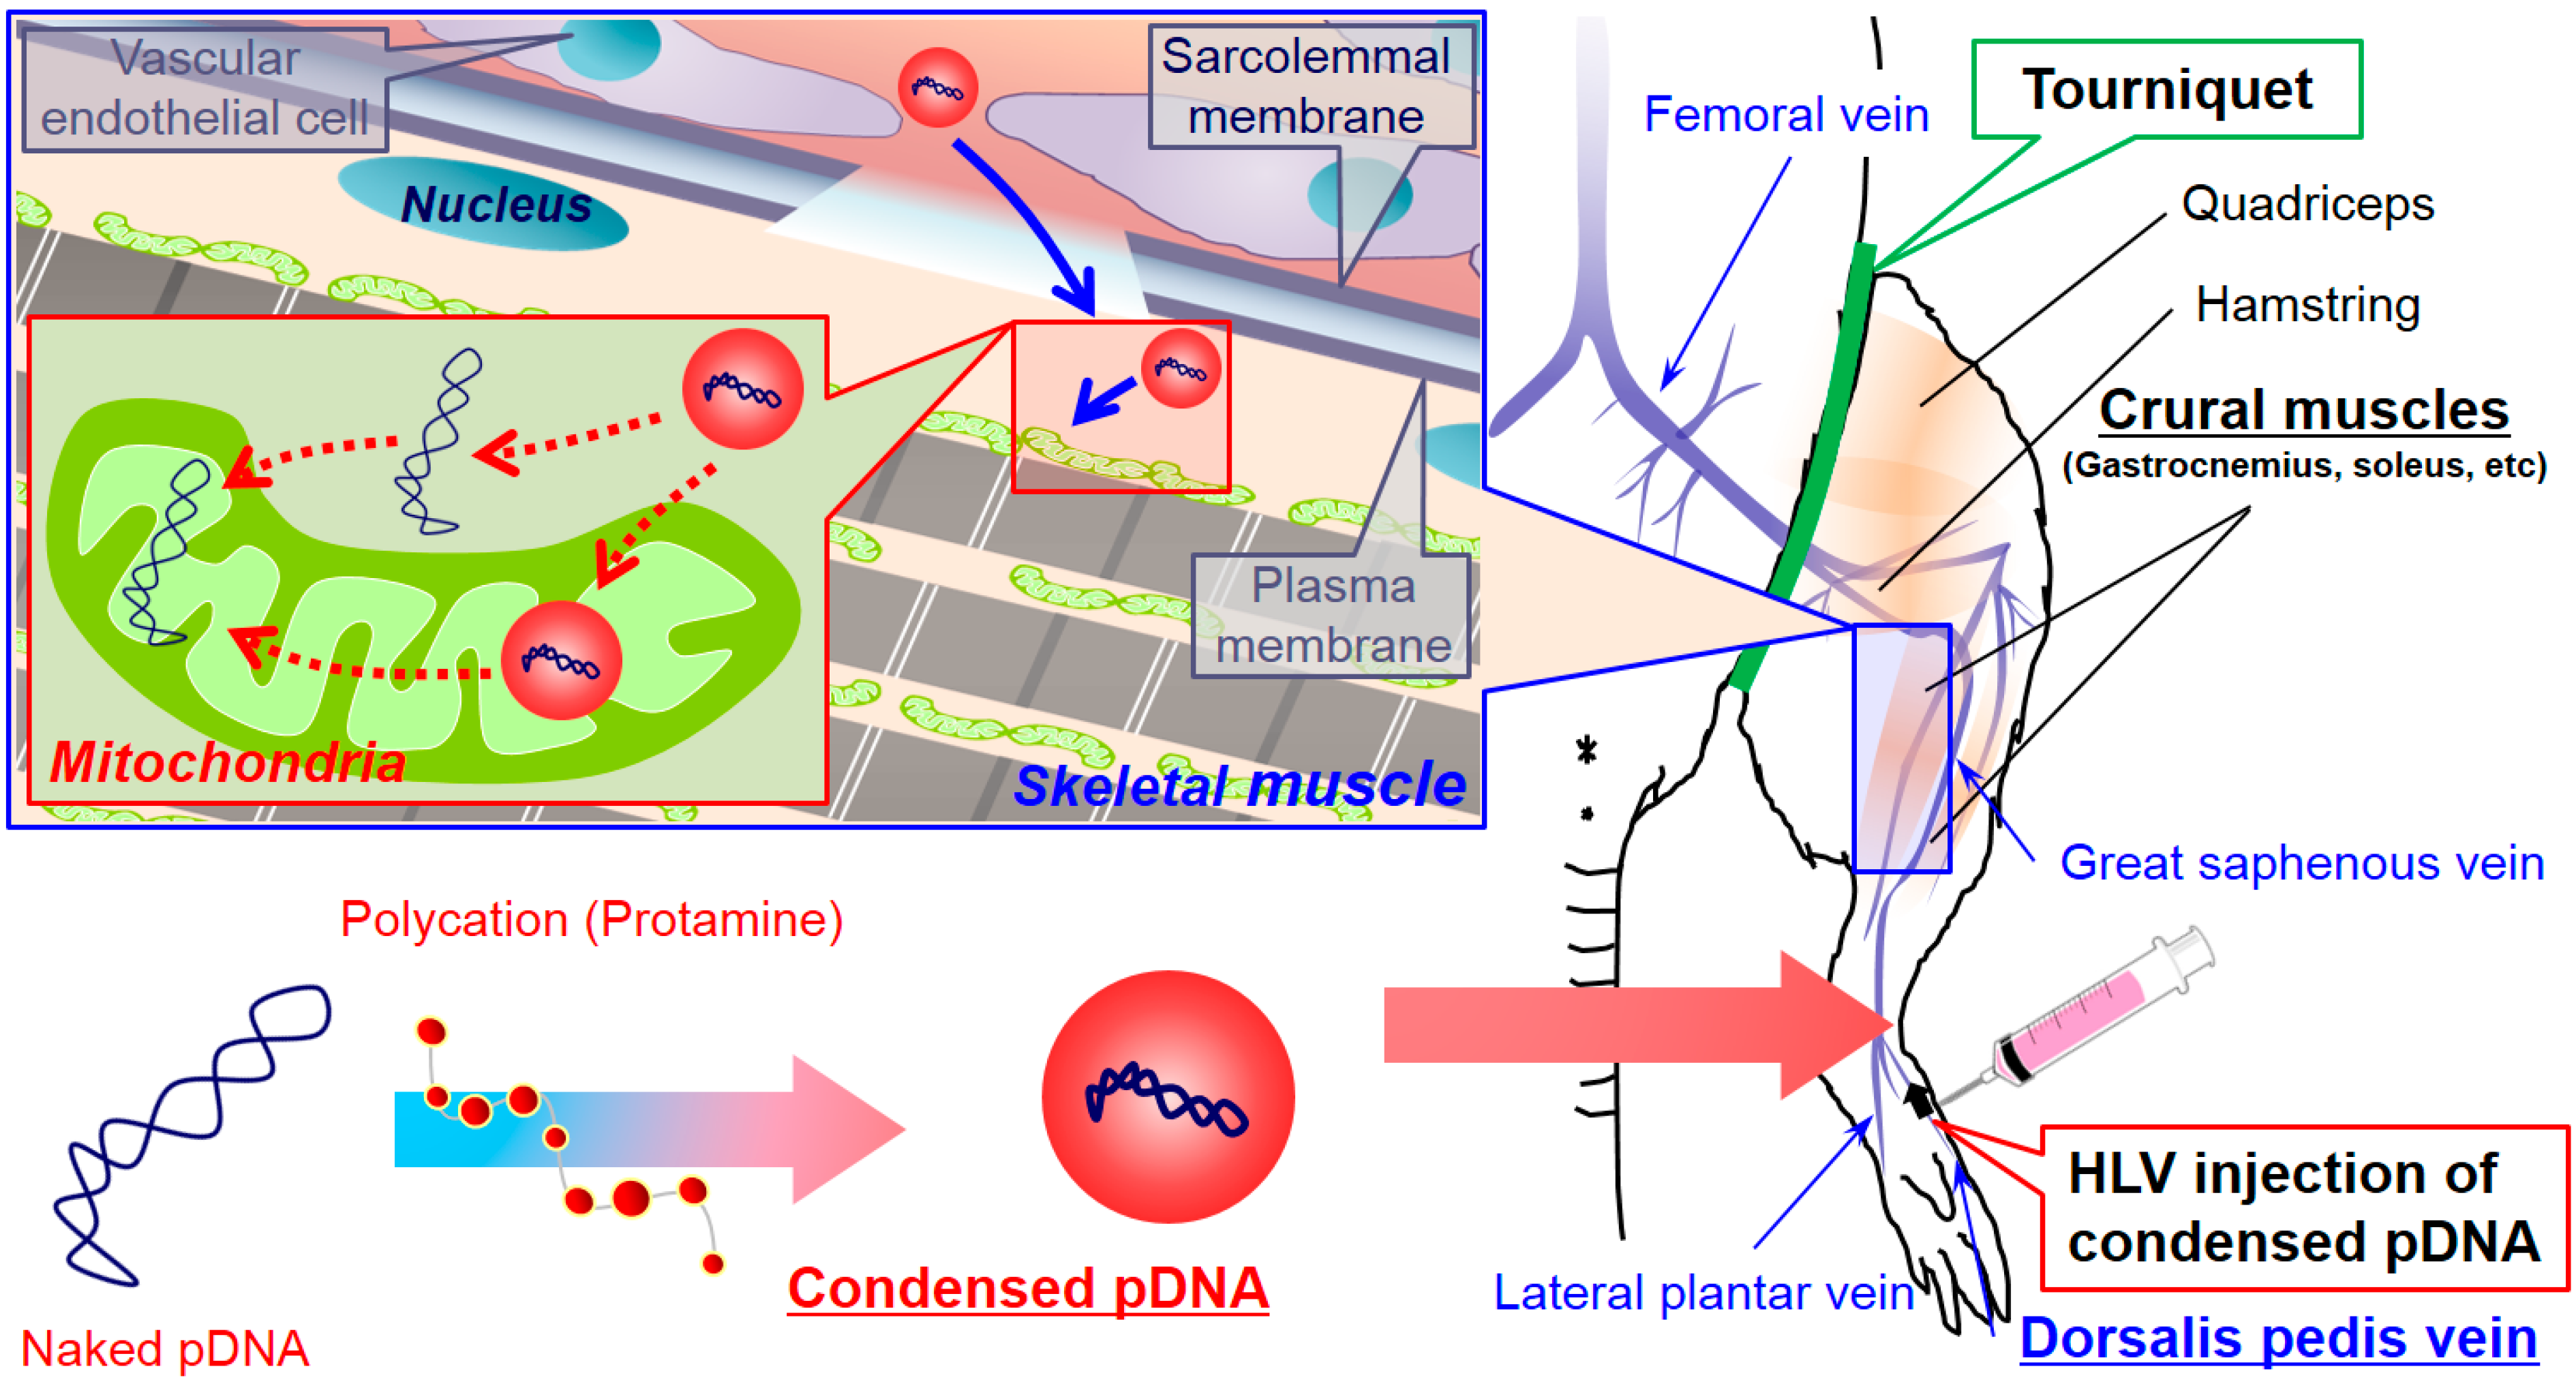
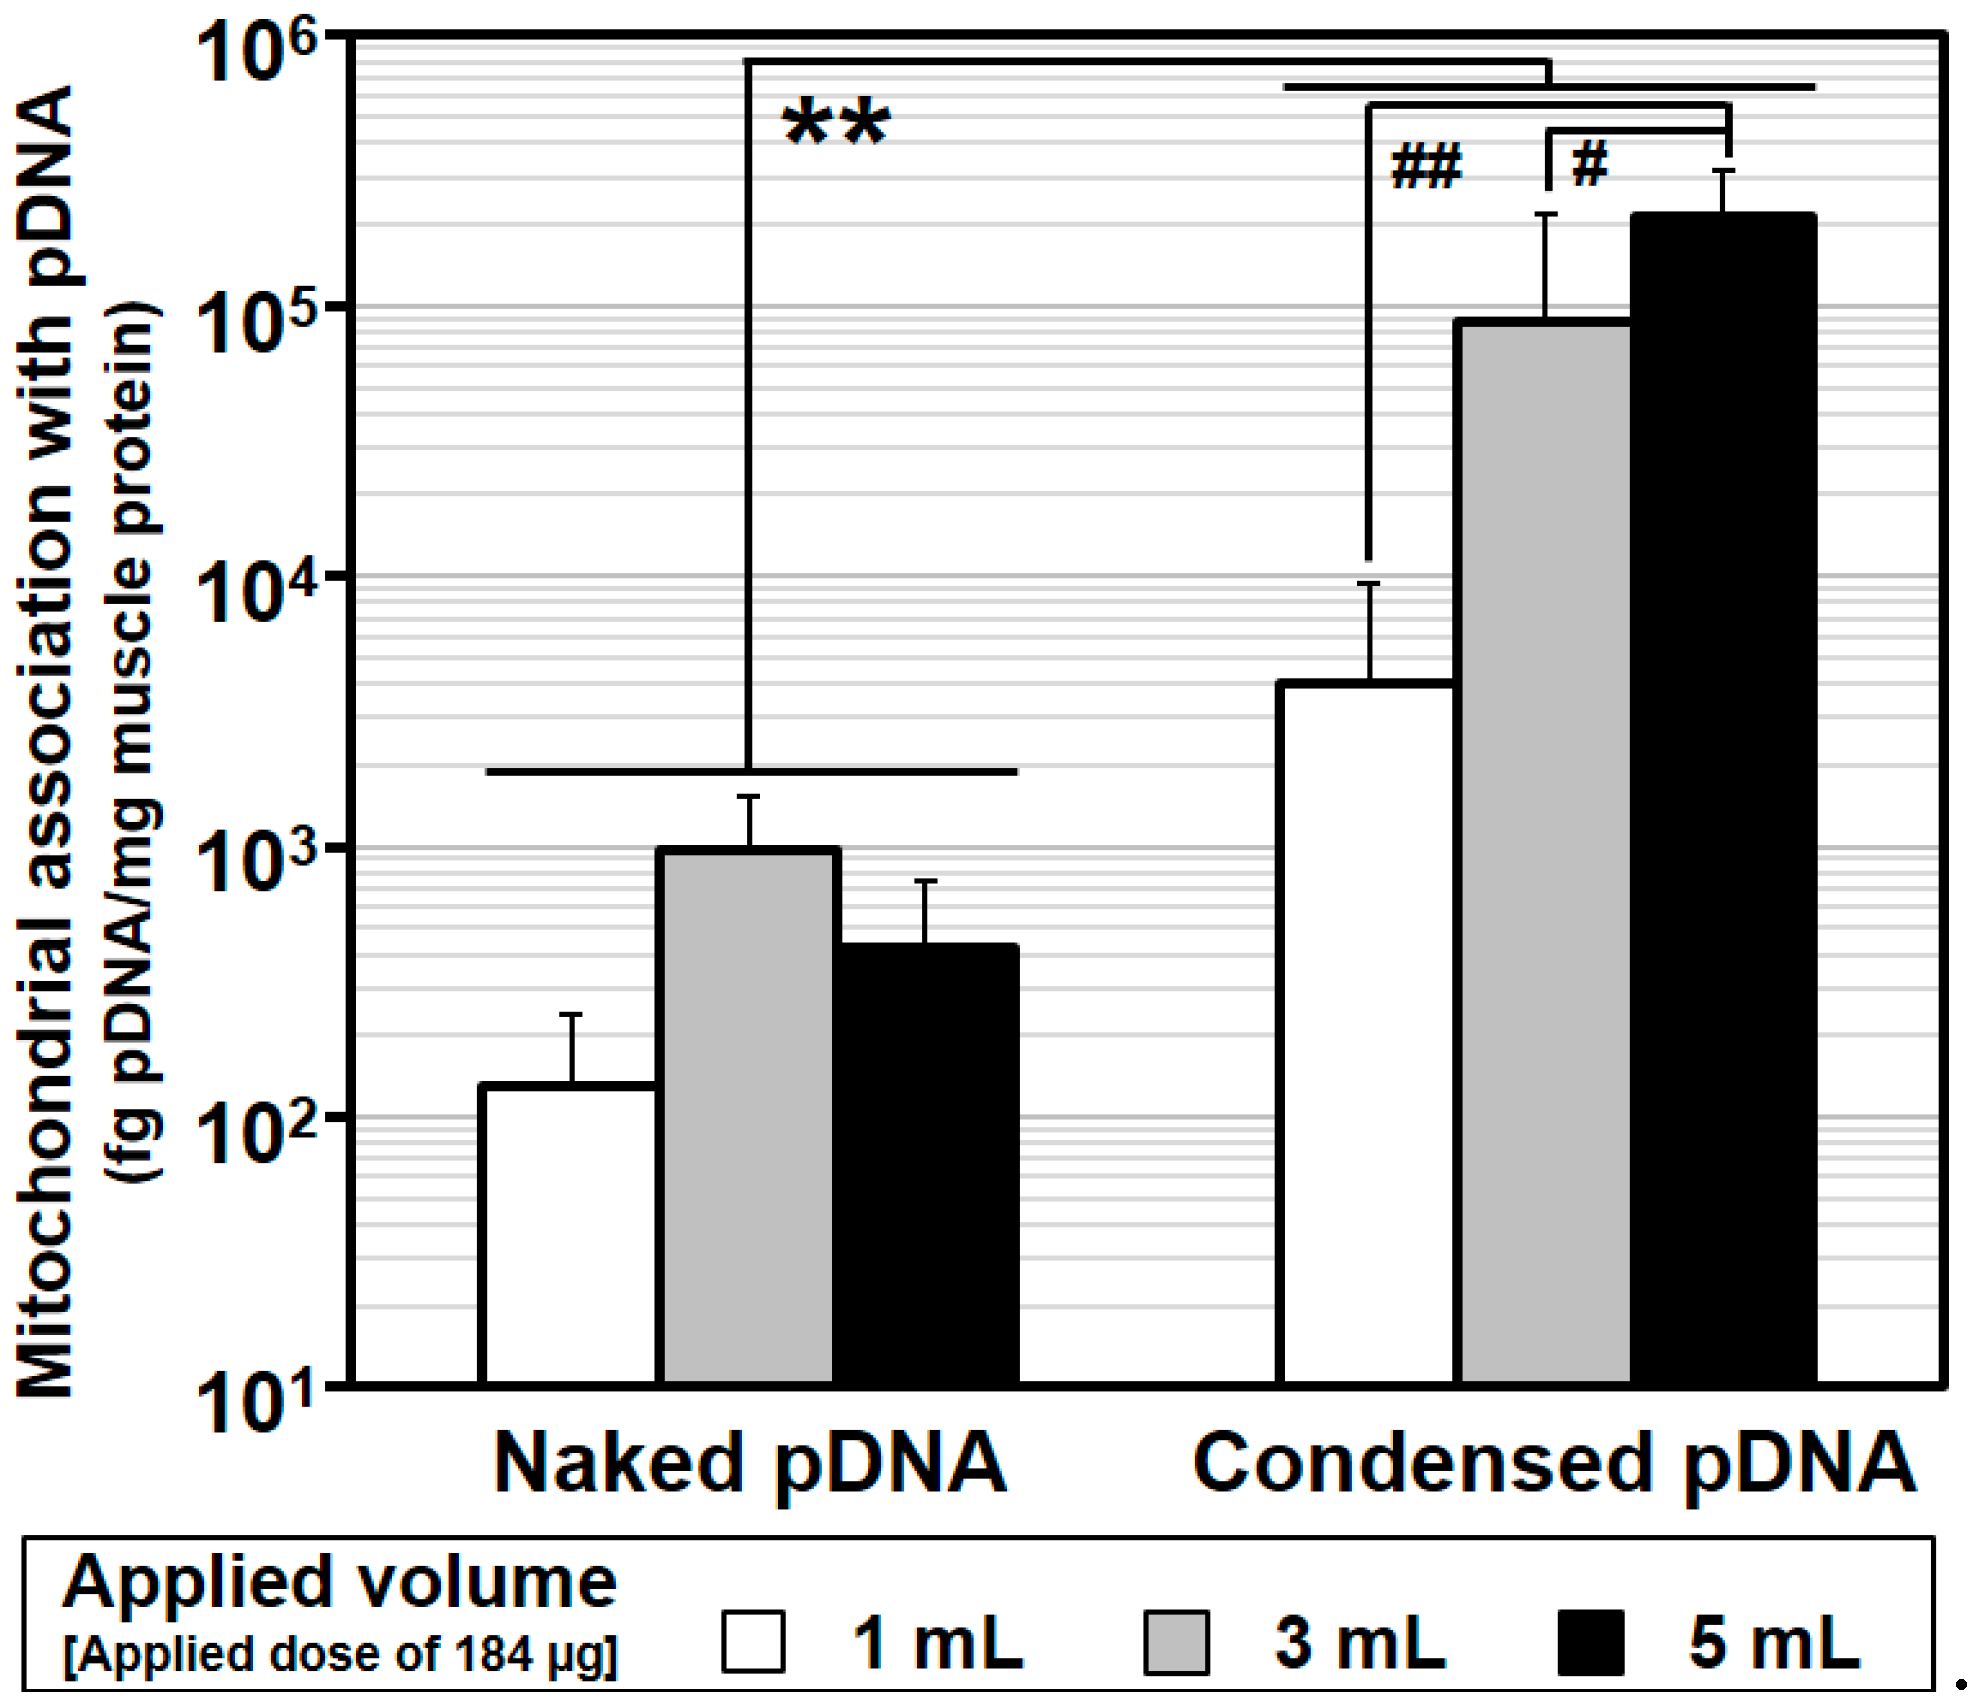
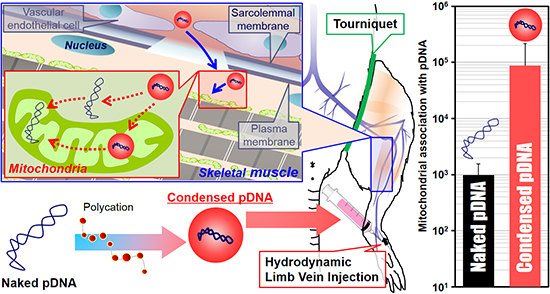
The use of naked pDNA and condensed pDNA in mitochondrial association were compared, after the HLV injection of 184 μg of pDNA in 1–5 mL of solution (
Figure 3). In this experiment, pDNA was intravenously injected within a period of 20 s into the distal hind limb of rats, as previously reported [
5]. At 24 h postinjection, the rats were sacrificed, and the pDNA in the mitochondria-enriched fraction of crural muscles was quantified using q-PCR.
Figure 3.
Comparison between naked pDNA and condensed pDNA for mitochondrial association with pDNA as the result of HLV injection. After the HLV injection of naked pDNA or condensed pDNA particles, the crural muscles were harvested, the pDNA in the mitochondria-enriched fraction was measured using q-PCR. Regarding the values for naked pDNA, these data were previously reported [
5]. Open columns represent 184 μg/1 mL, gray columns represent 184 μg/3 mL and closed columns represent 184 μg/5 mL. Bars indicate the mean ± S.D. (
n = 3–5).
** Significant differences of mitochondrial association with pDNA between naked pDNA and condensed pDNA (
p < 0.001 by two-way ANOVA, followed by Bonferroni correction). Significant differences (##
p < 0.01, #
p < 0.05) of mitochondrial association with pDNA among injection volumes for naked pDNA and condensed pDNA by two-way ANOVA, followed by Bonferroni correction.
Figure 3 shows a comparison of mitochondrial association with pDNA by HLV injection between naked pDNA and condensed pDNA and the statistical analysis by a two-way ANOVA. Regarding the values for naked pDNA, previous data were used [
5]. Based on the results, the mitochondrial association with condensed pDNA was significantly higher than that of naked pDNA for any injection volume (**Significant difference (
p < 0.001),
Figure 3). It is noteworthy that the mitochondrial association with condensed pDNA was ~1000 fold higher than that of naked pDNA in the case of a 5 mL injection volume (black column,
Figure 3). We also compared the mitochondrial DNA association as a function of injection volume for naked pDNA and condensed pDNA, respectively. In the case of naked pDNA, the values were comparable. On the other hand, in the case of condensed pDNA, the value for a 5 mL injection volume (black column in right,
Figure 3) was significantly higher than the others. These results suggest that, to achieve the efficient mitochondrial association with condensed pDNA by HLV injection, a high injection volume might be required.
As shown in
Figure 3, the use of condensed pDNA increased the amount of pDNA in the mitochondria-enriched fraction following HLV injection compared to naked pDNA. Here, we considered the reasons for why condensation of pDNA enhanced mitochondrial association following HLV injection. In previous reports regarding nuclear transgene expression using mice and HLV injections, Itaka
et al. showed that condensed pDNA resulted in about a 200-fold increase in the amount of intact pDNA in muscle compared to naked pDNA [
10]. This report prompted us to consider that condensed pDNA, which has a small rigid structure, may have easy access to myofibrillar mitochondria, which are present on muscle fibers far from blood vessels. On the other hand, the results of previous
in vitro experiments suggest that the mitochondrial import of large-sized cargoes might be inhibited in many cytoskeletons and a high density of cell components inside the cells [
15]. Hydrodynamic force may assist condensed pDNA in accessing mitochondria, even in such a cell environment, although the mitochondrial import of condensed pDNA would be hindered by intracellular barriers. It is also presumed that condensed pDNA with a positive charge would bind readily to mitochondria, because a high negative potential would be maintained.
Another possibility is that the use of pDNA condensed with polycations could influence the levels of exogenous pDNA in myofibrillar mitochondria. Previous reports showed that the amounts of naked pDNA in the nuclei of liver cells decreased to 1/10 at 24 h after hydrodynamic injection into tail vein of mice [
16]. Thus, the more than a 100–1000 fold increase in the levels of exogenous pDNA in the mitochondria-enriched fraction (
Figure 3) cannot be explained only by protecting pDNA from degradation, although the target organ and organelle were different between the current study and the previous study. Based on previous reports and our results, we concluded that the high levels of exogenous pDNA in the mitochondria-enriched fraction (when condensed pDNA was used) can be explained, not only by the protection of pDNA from degradation but also by an enhancement in the mitochondrial association with pDNA.
3.4. Evaluation of Mitochondrial Toxicity in Skeletal Muscle after HLV Injection of Condensed pDNA
Since the use of HLV injection for the efficient delivery of pDNA involves rather severe conditions, a toxicity assessment is an important issue that is related to the potential therapeutic utility of this methodology. Therefore, we previously investigated mitochondrial toxicity following HLV injection, and an evaluation of COX activity and mitochondrial membrane potentials showed that the HLV injection had no significant effect on mitochondrial function [
5].
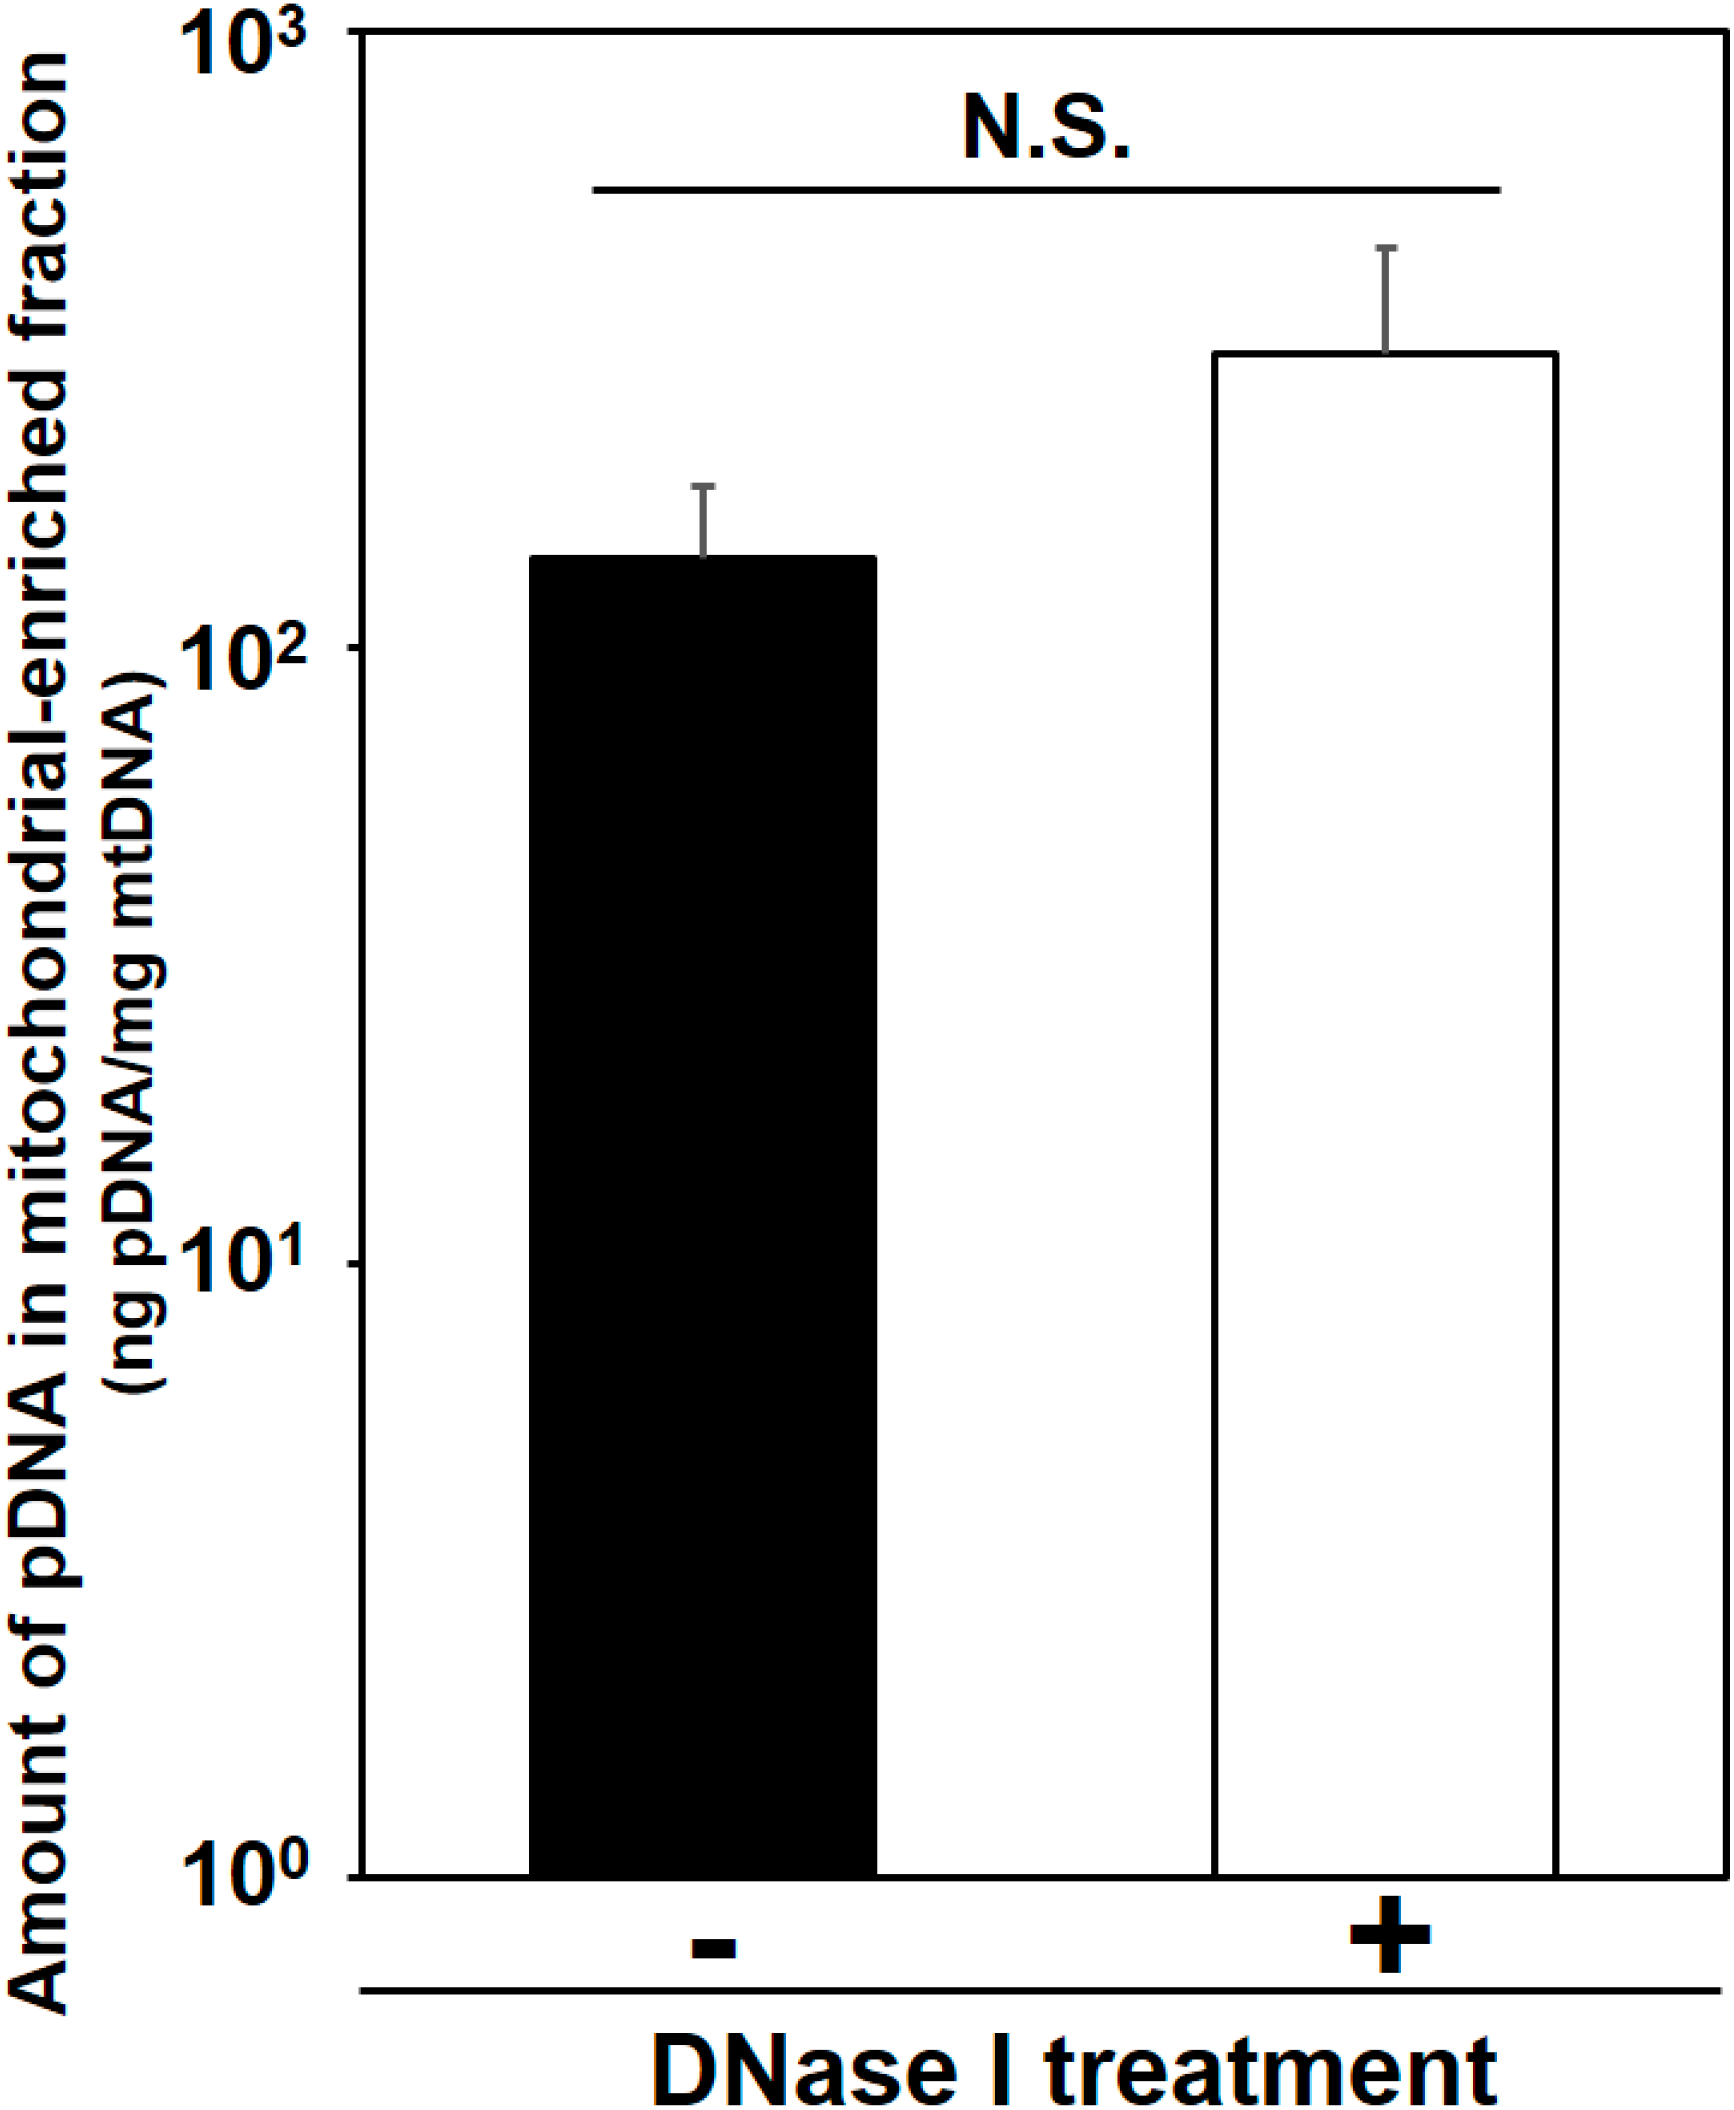
Figure 4.
Detection of exogenous pDNA in the mitochondria-enriched fraction before and after DNase treatment. At 24 h after HLV injection of the condensed pDNA, the crural muscles were harvested, and the pDNA in mitochondria-enriched fraction was then measured using q-PCR, before and after treatment with DNase I. Bars indicate means ± S.D. (n = 3). Statistical analysis was performed by a two-tailed unpaired Student’s t-test. N.S. indicates non-significant difference.
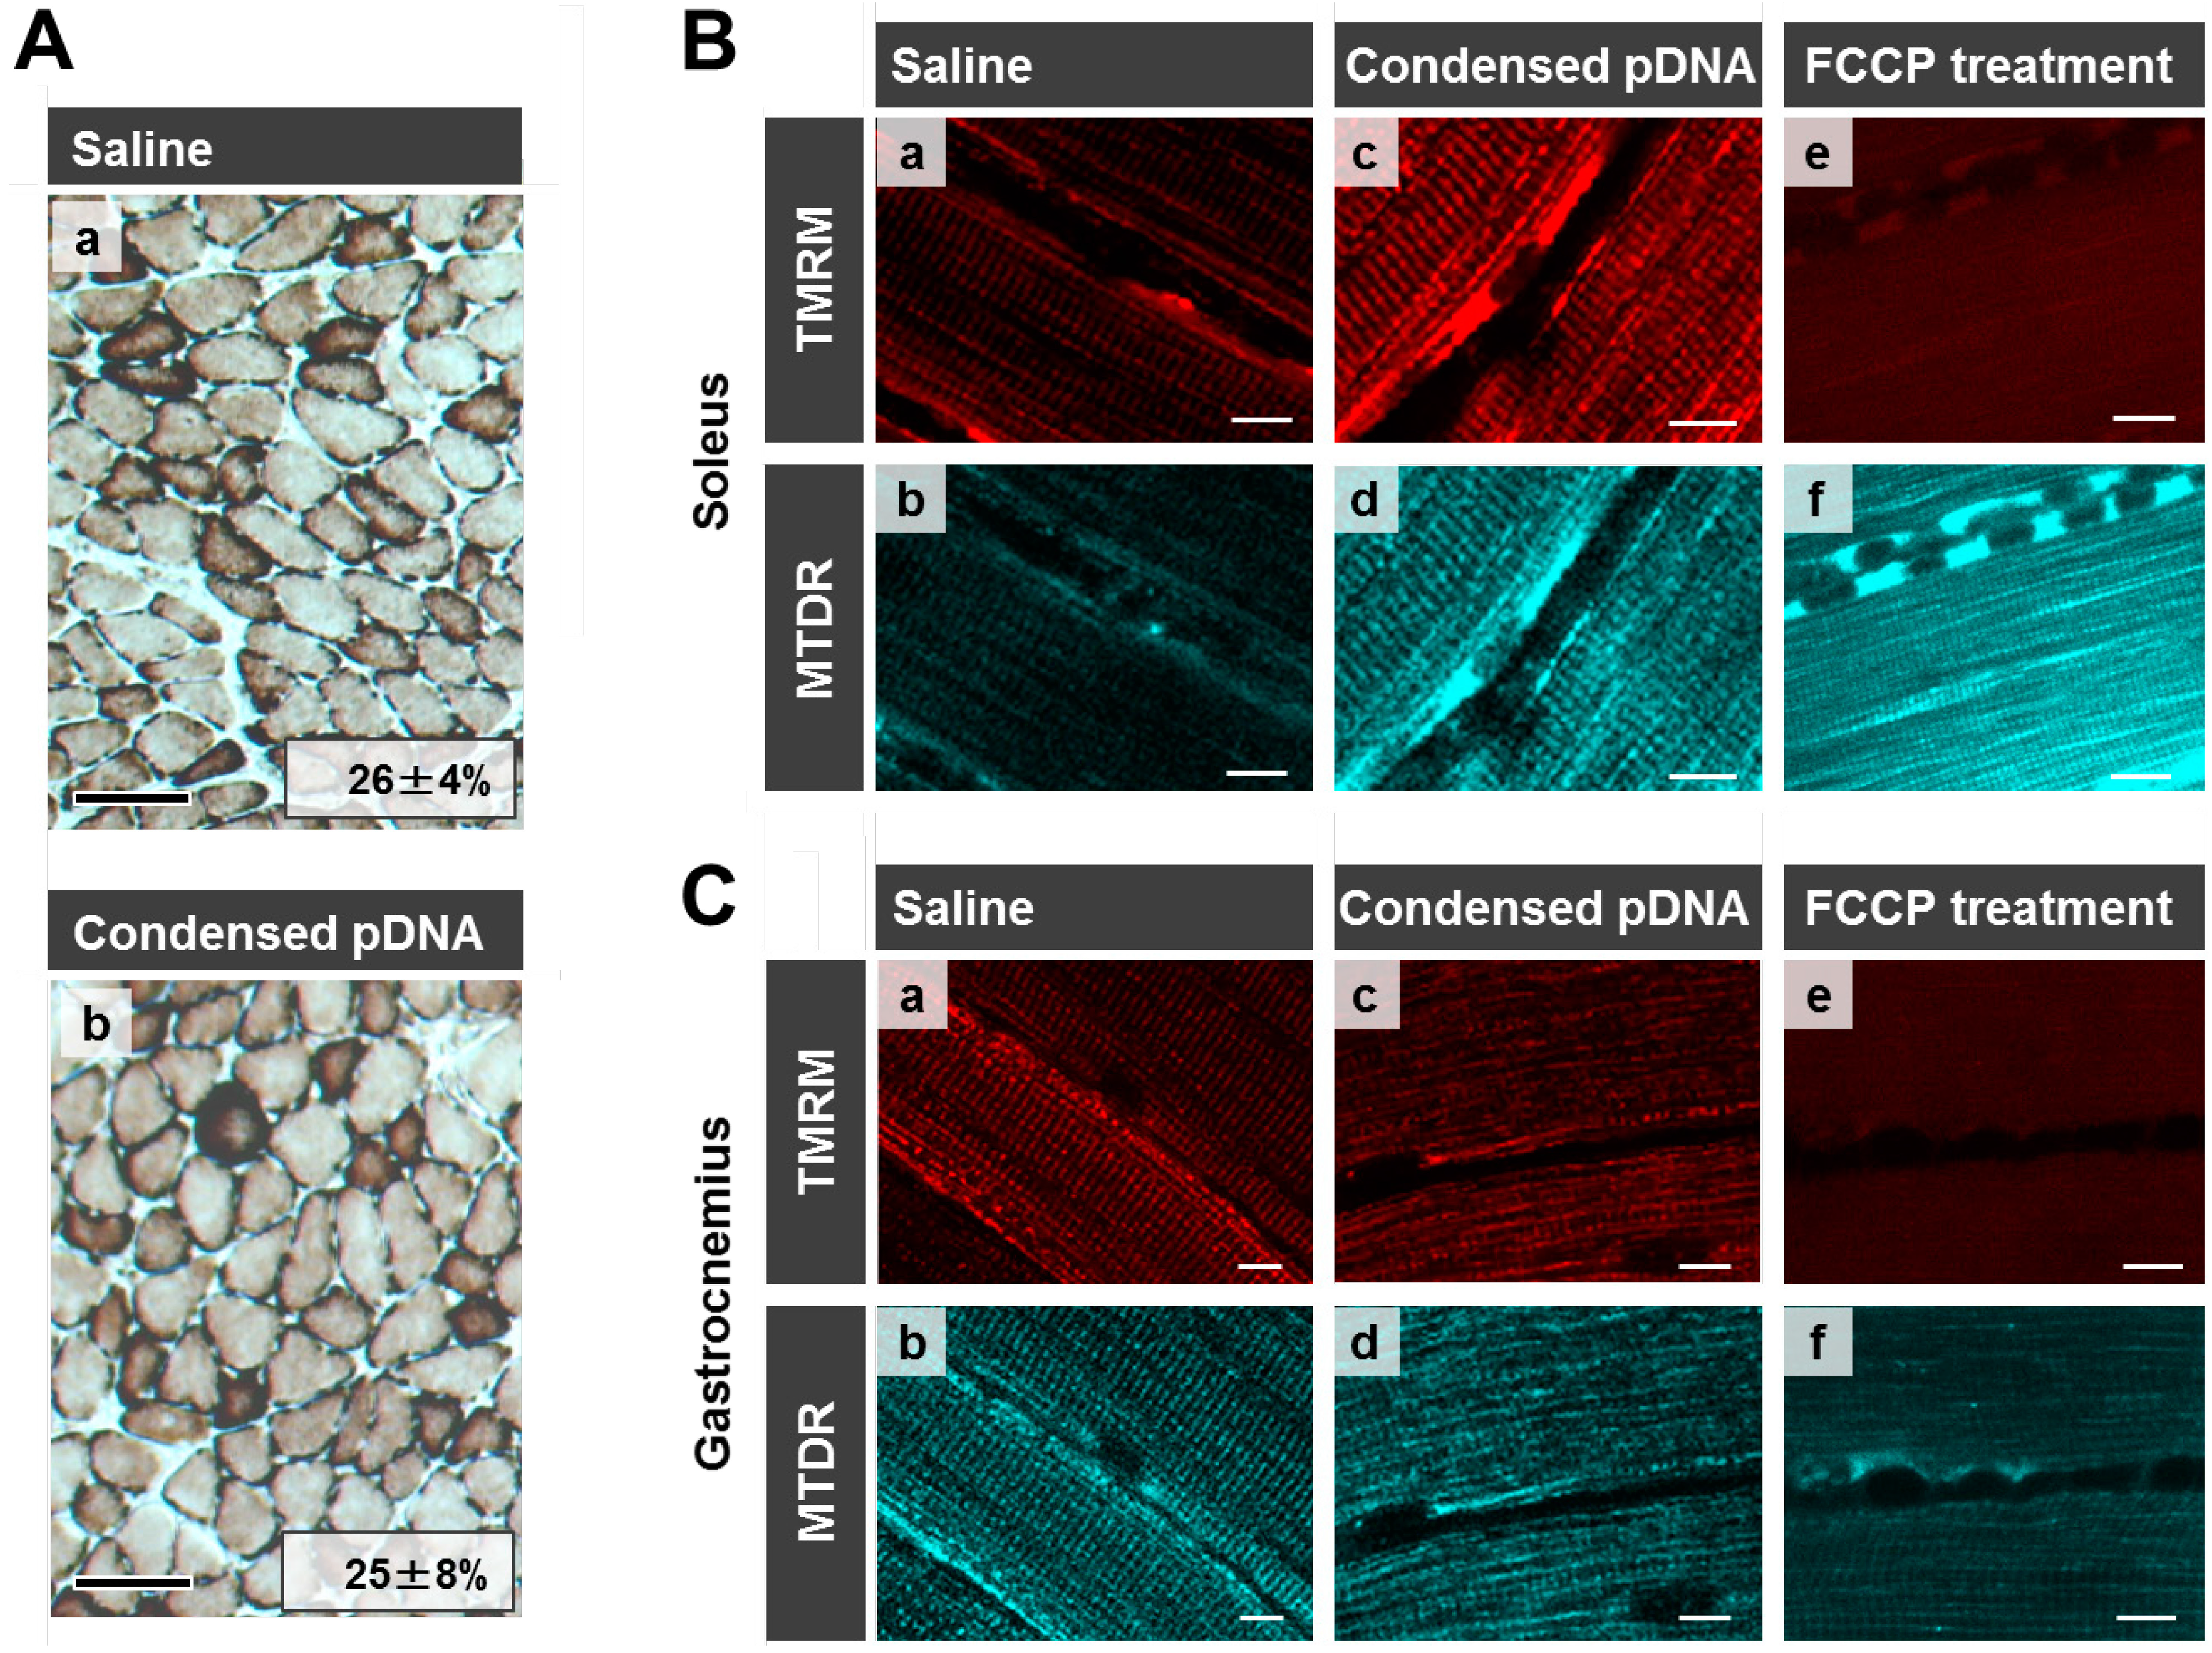
Here we evaluated mitochondrial toxicity after the HLV injection of condensed pDNA, which resulted in a more efficient mitochondrial association with pDNA. Myofibrillar mitochondrial activity was evaluated by COX staining, after performing an HLV injection (
Figure 5A). Saline administered muscle was used as a positive control for COX staining where COX-positive cells are stained brown [
Figure 5A(a)]. COX-positive cells were observed in skeletal muscles after the HLV injection of condensed pDNA [
Figure 5A(b)]. It was also confirmed that the ratios of COX-positive cells between saline administered muscle (26% ± 4%) and condensed pDNA administered muscle (26% ± 7%) were comparable. The results indicate that the mitochondria maintained COX activity in skeletal muscles after the HLV injection of condensed pDNA.
Mitochondrial membrane potentials of the soleus of crural muscle following HLV injection were also evaluated (
Figure 5B). The staining of mitochondria with tetramethylrhodamine (TMRM) (red color; a,c,e,
Figure 5B) is dependent on the membrane potential, while MitoTracker Deep Red 633 (MTDR) stains mitochondria (cyan pseudo color; b,d,f,
Figure 5B), even when the membrane potential is lost. In the case of saline administered muscle (a,b) and condensed pDNA administered muscle (c,d), the mitochondria were extensively stained with TMRM at comparable levels, indicating that most of the mitochondria in skeletal muscles maintained their membrane potential.
Figure 5.
Evaluation of mitochondrial toxicity following HLV injection. (A) COX staining of skeletal muscle following HLV injection. Frozen cross-sections (10 μm thickness) of HLV injection performed skeletal muscle were prepared, followed by COX staining. The section was then observed by microscopy; saline administered muscle (a) and condensed pDNA administered muscle (b). Scale bars, 100 μm. In this experiment, cells were stained brown when the cells have the cytochrome oxidase activity (COX-positive cells). We also calculated the ratios of COX-positive cells and the values for each image as indicated. Data represent the mean ± S.D. (n = 3). Statistical analysis was performed by a two-tailed unpaired Student’s t-test (p = 0.95). (B,C) Evaluation of mitochondrial membrane potential in skeletal muscles following HLV injection. At 24 h post HLV injections, the soleus (B) or gastrocnemius (C) of crural muscles were harvested, and mitochondria were then stained with TMRM (red color; a,c,e) and MTDR (cyan pseudo color; b,d,f). The staining of mitochondria with TMRM is dependent on the membrane potential, while MTDR can stain mitochondria even when membrane potential is lost. The muscle tissues were observed using CLSM. Scale bars, 10 μm.
![Pharmaceuticals 07 00881 g005]()
We also confirmed that mitochondria were incompletely stained by TMRM, when the mitochondrial membrane potential was depolarized, in the case where muscles were treated with FCCP (a mitochondrial uncoupler) (e,f in
Figure 5B). These results indicate that the HLV injection of condensed pDNA does not cause a significant decrease in the mitochondrial membrane potential, compared to the FCCP treatment. A similar tendency regarding mitochondrial membrane potentials was observed in the case of the gastrocnemius of crural muscles (
Figure 5C).
