Structural and Affinity Analyses of G-Quadruplex DNA Aptamers for Camptothecin Derivatives

Abstract
:1. Introduction
2. Experimental Section
2.1. General

| Fragment | Sequence a | Kd (µM) b | |||||||||
|---|---|---|---|---|---|---|---|---|---|---|---|
| Analyte | |||||||||||
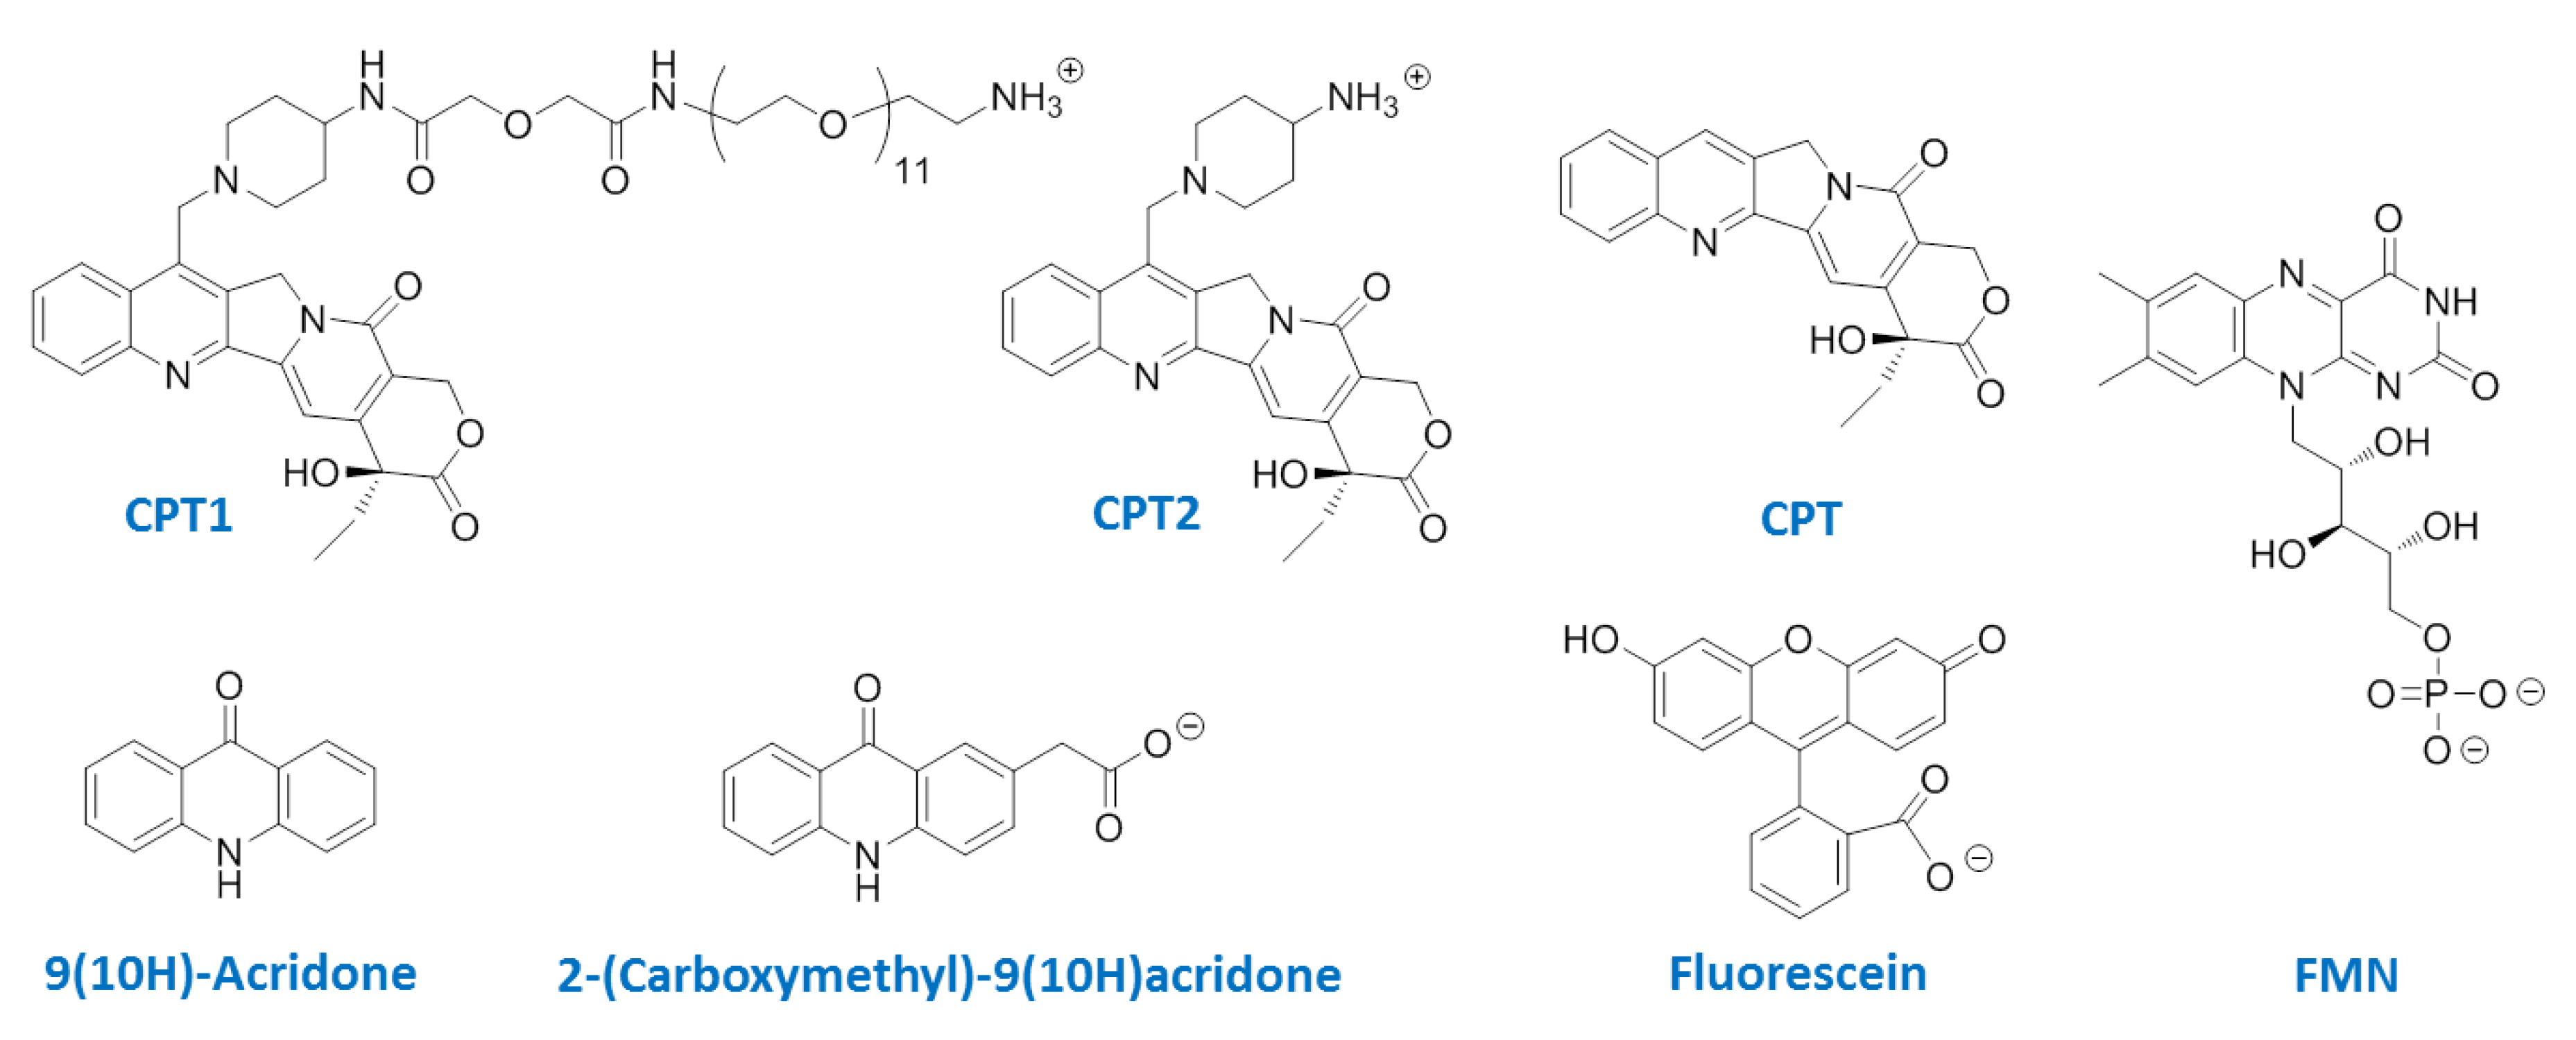
| CPT1 | CPT2 | CPT | |||||||||
| | | |||||||||||
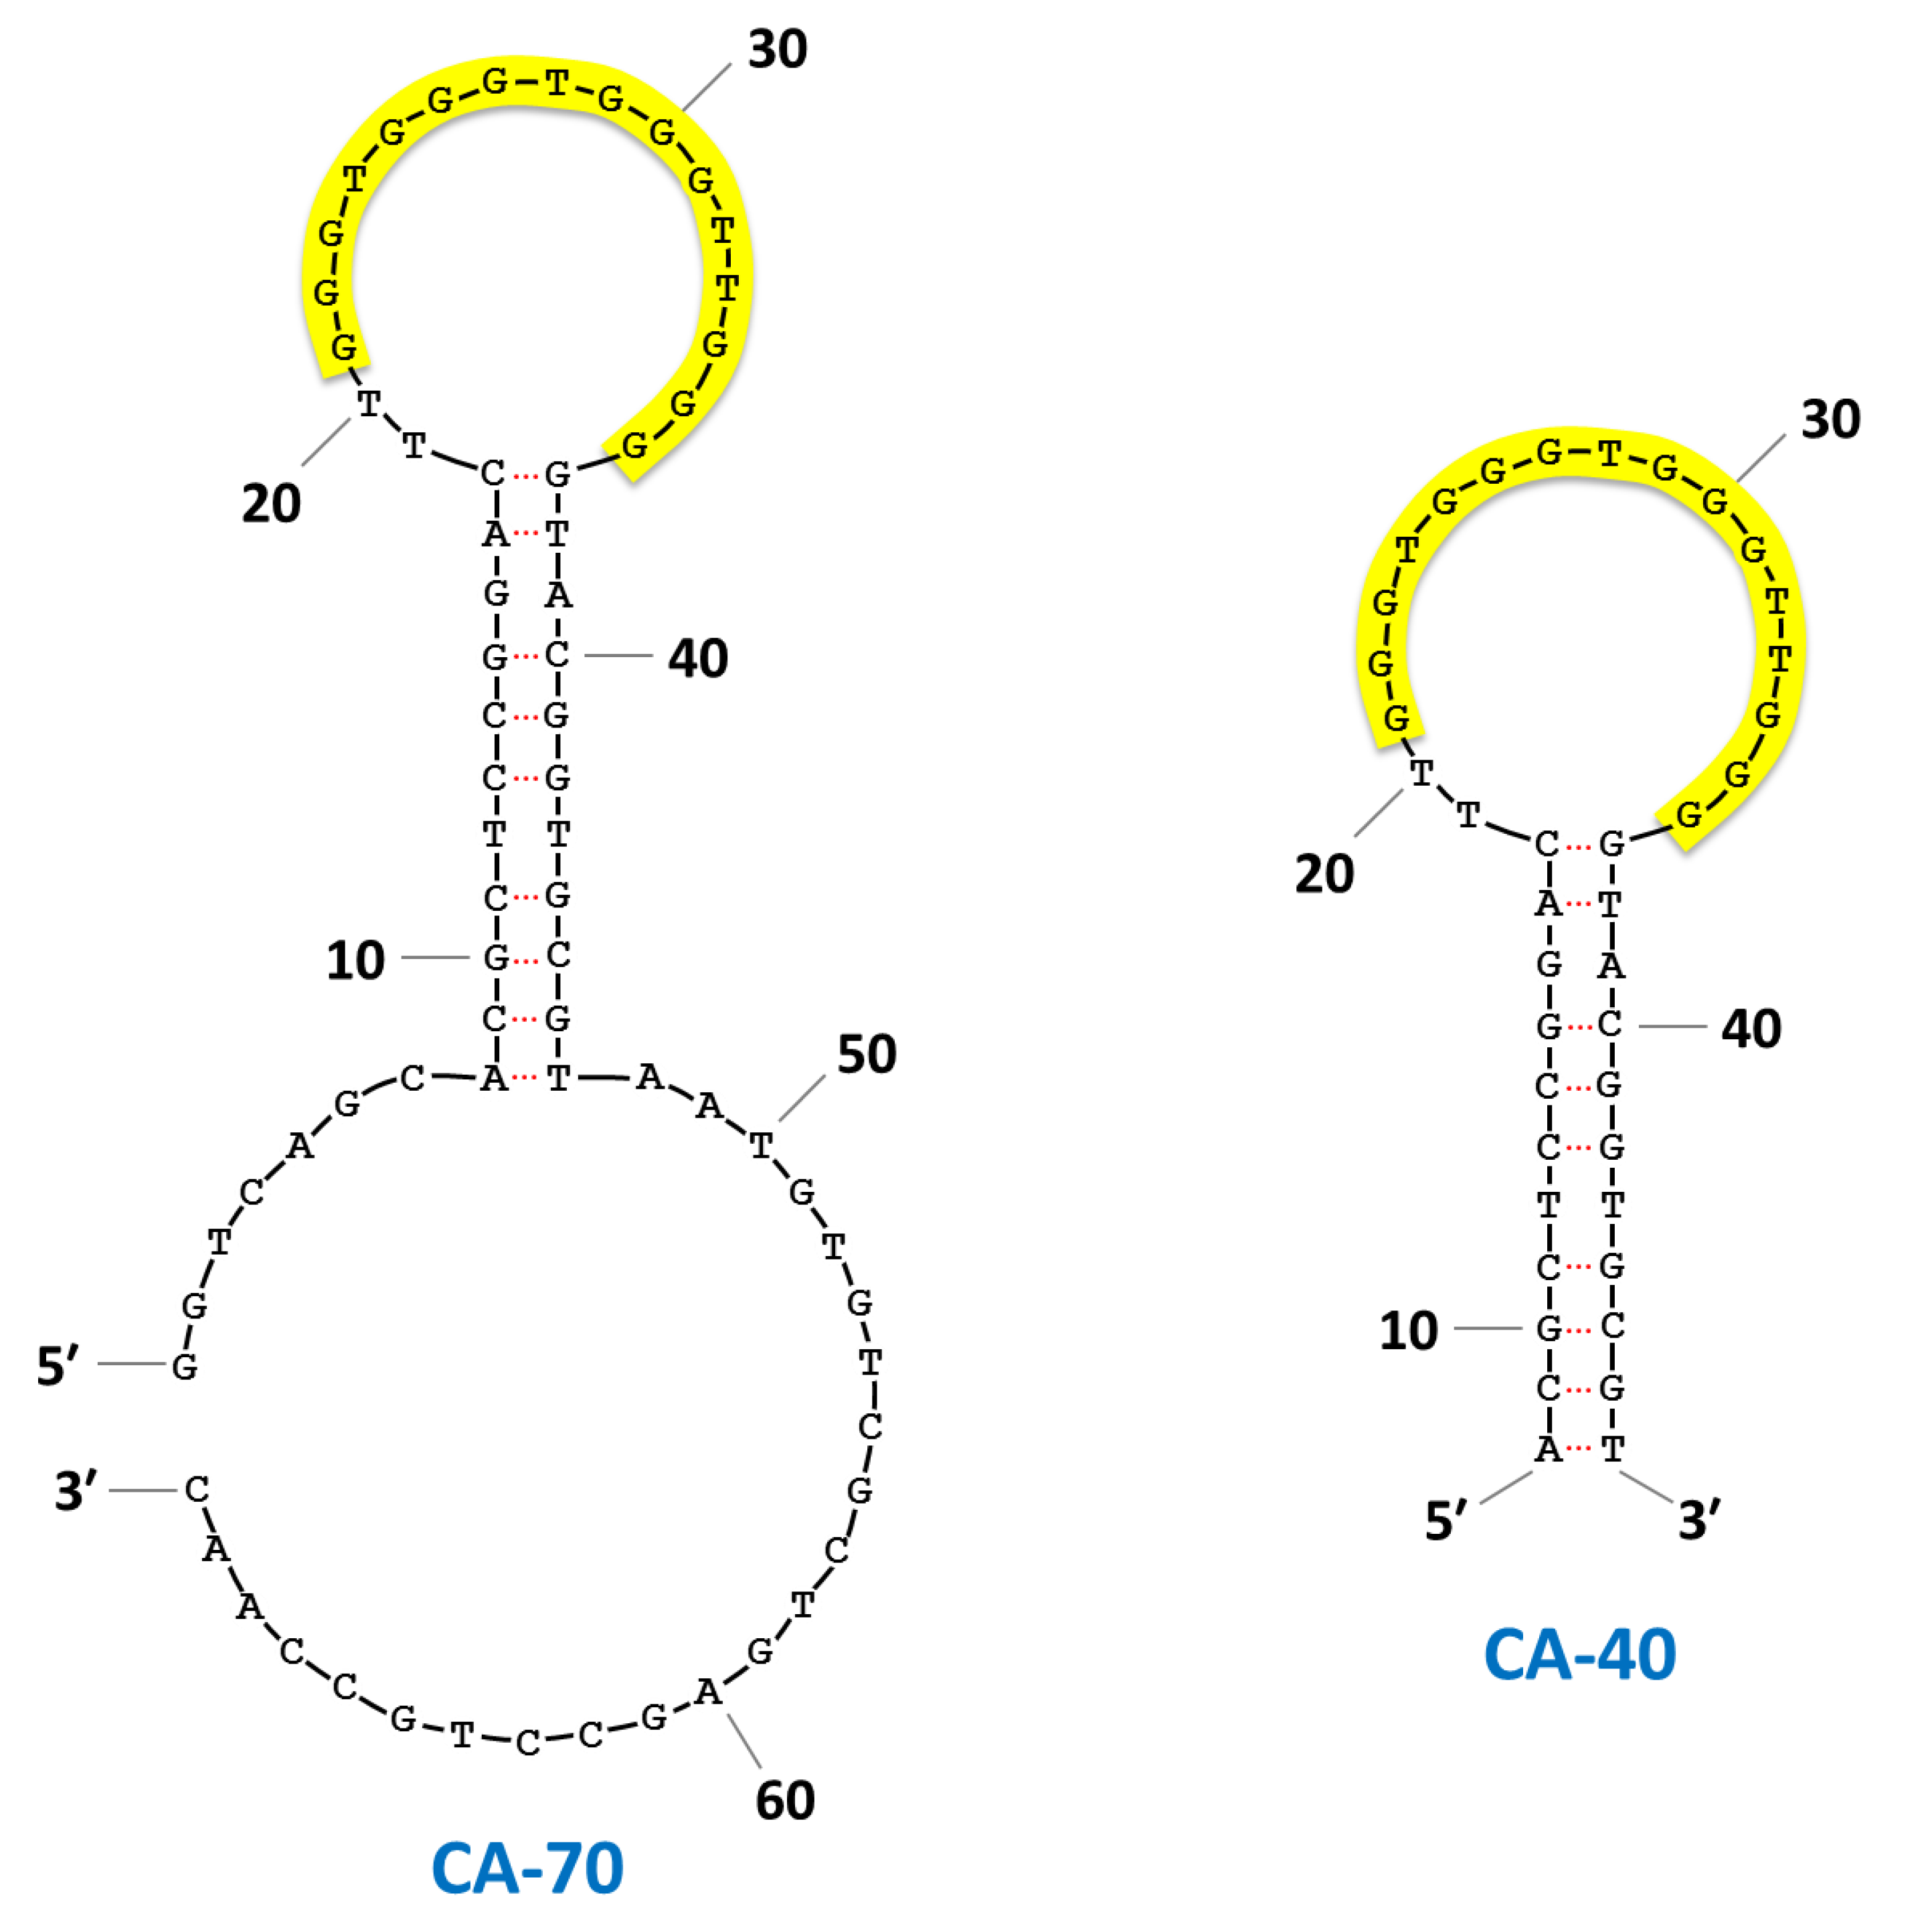
| CA-70 | GGTCAGCACGCTCCGGACTT GGGTGGGTGGGTTGGGGTACGGTGCGTAATGTGTCGCTGAGCCTGCCAAC | 1.8 ± 0.3 | 3.6 ± 0.2 | 4.6 ± 0.3 | |||||||
| CA-40 | ACGCTCCGGACTT GGGTGGGTGGGTTGGGGTACGGTGCGT | 3.0 ± 0.4 | 3.0 ± 0.2 | 5.6 ± 0.5 | |||||||
| CA-23A | ACTT GGGTGGGTGGGTTGGGGTA | 2.1 ± 0.9 | n.d. | n.d. | |||||||
| CA-23B | TTTT GGGTGGGTGGGTTGGGGTA | >10 | n.d. | n.d. | |||||||
| CA-20 | T GGGTGGGTGGGTTGGGGTA | >10 | >10 | >10 | |||||||
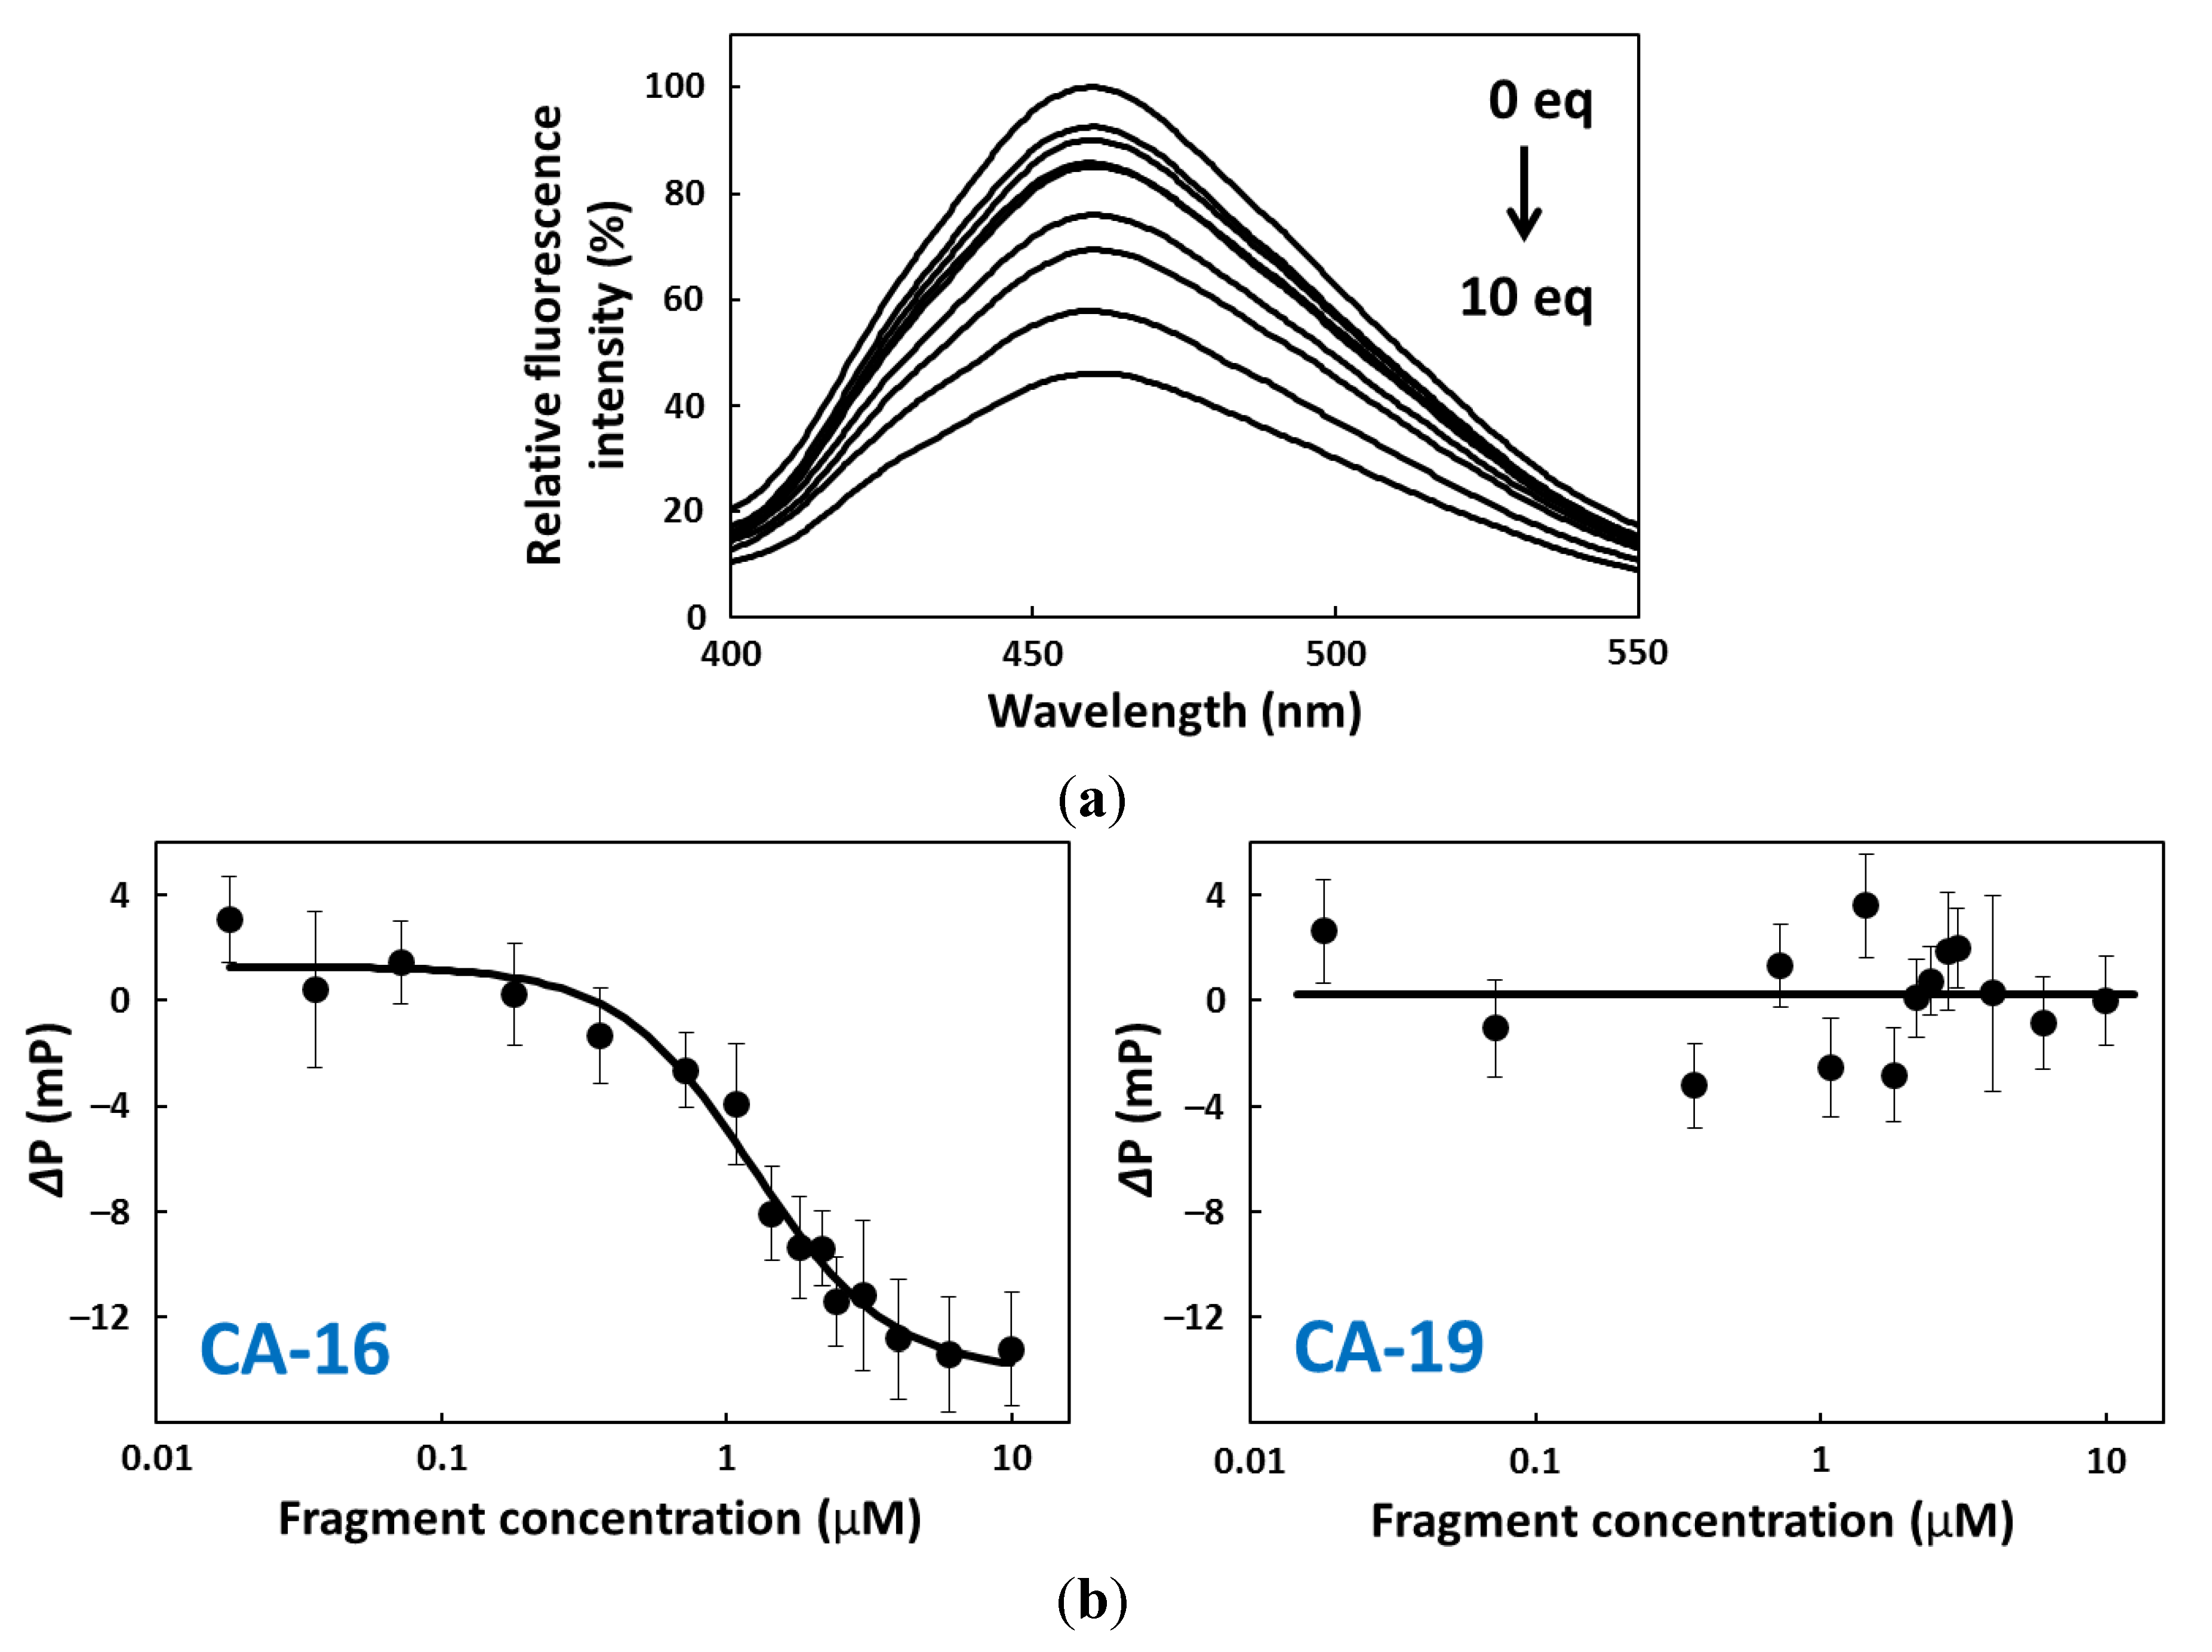
| CA-19 | GGGTGGGTGGGTTGGGGTA | >10 | >10 | >10 | |||||||
| CA-18A | T GGGTGGGTGGGTTGGGG | 6.0 ± 0.8 | 3.4 ± 0.3 | >10 | |||||||
| CA-18B | GGGTGGGTGGGTTGGGGT | >10 | >10 | >10 | |||||||
| CA-17 | GGGTGGGTGGGTTGGGG | 8.1 ± 0.9 | 8.9 ± 1.0 | >10 | |||||||
| CA-16 | GGGTGGGTGGGTTGGG | 1.8 ± 0.3 | 2.7 ± 0.3 | 4.2 ± 0.4 | |||||||

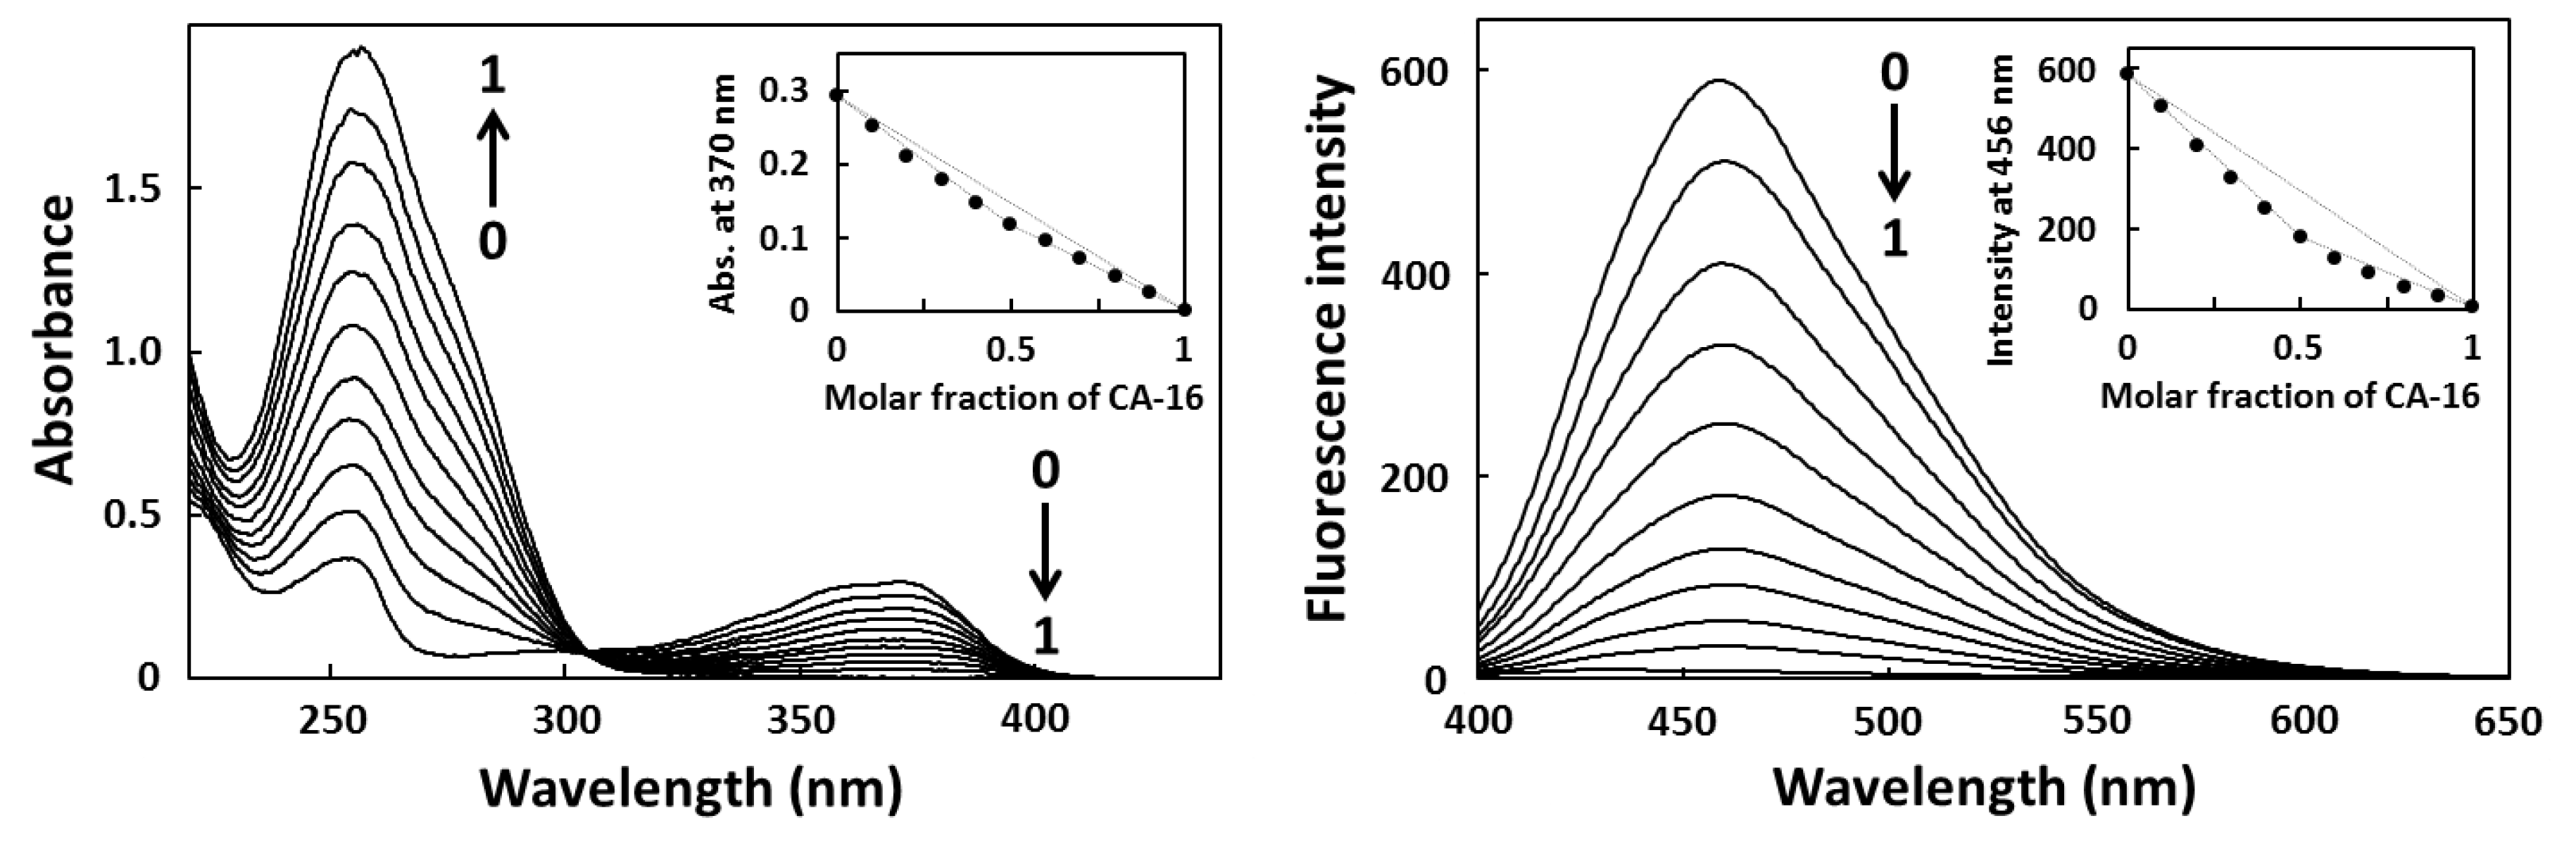
2.2. Job Plot Analysis

2.3. Fluorescence Titration

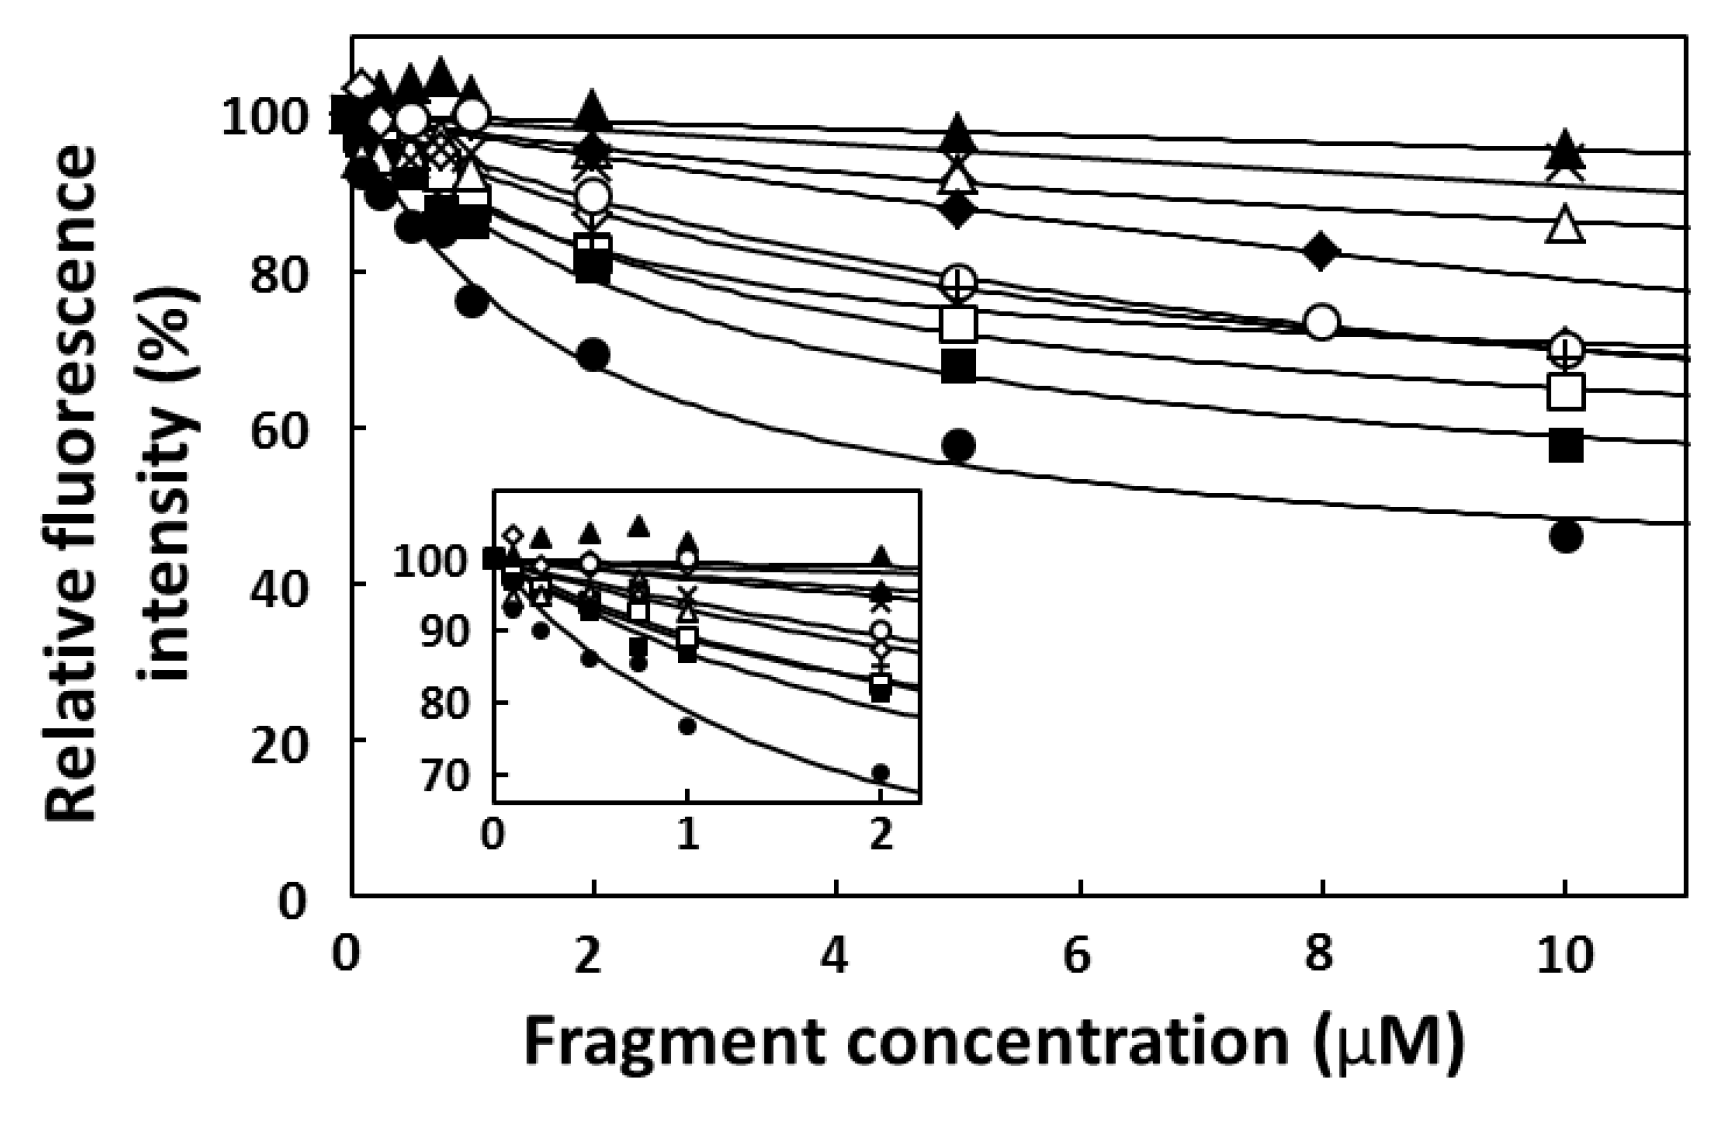
2.4. FP Assay
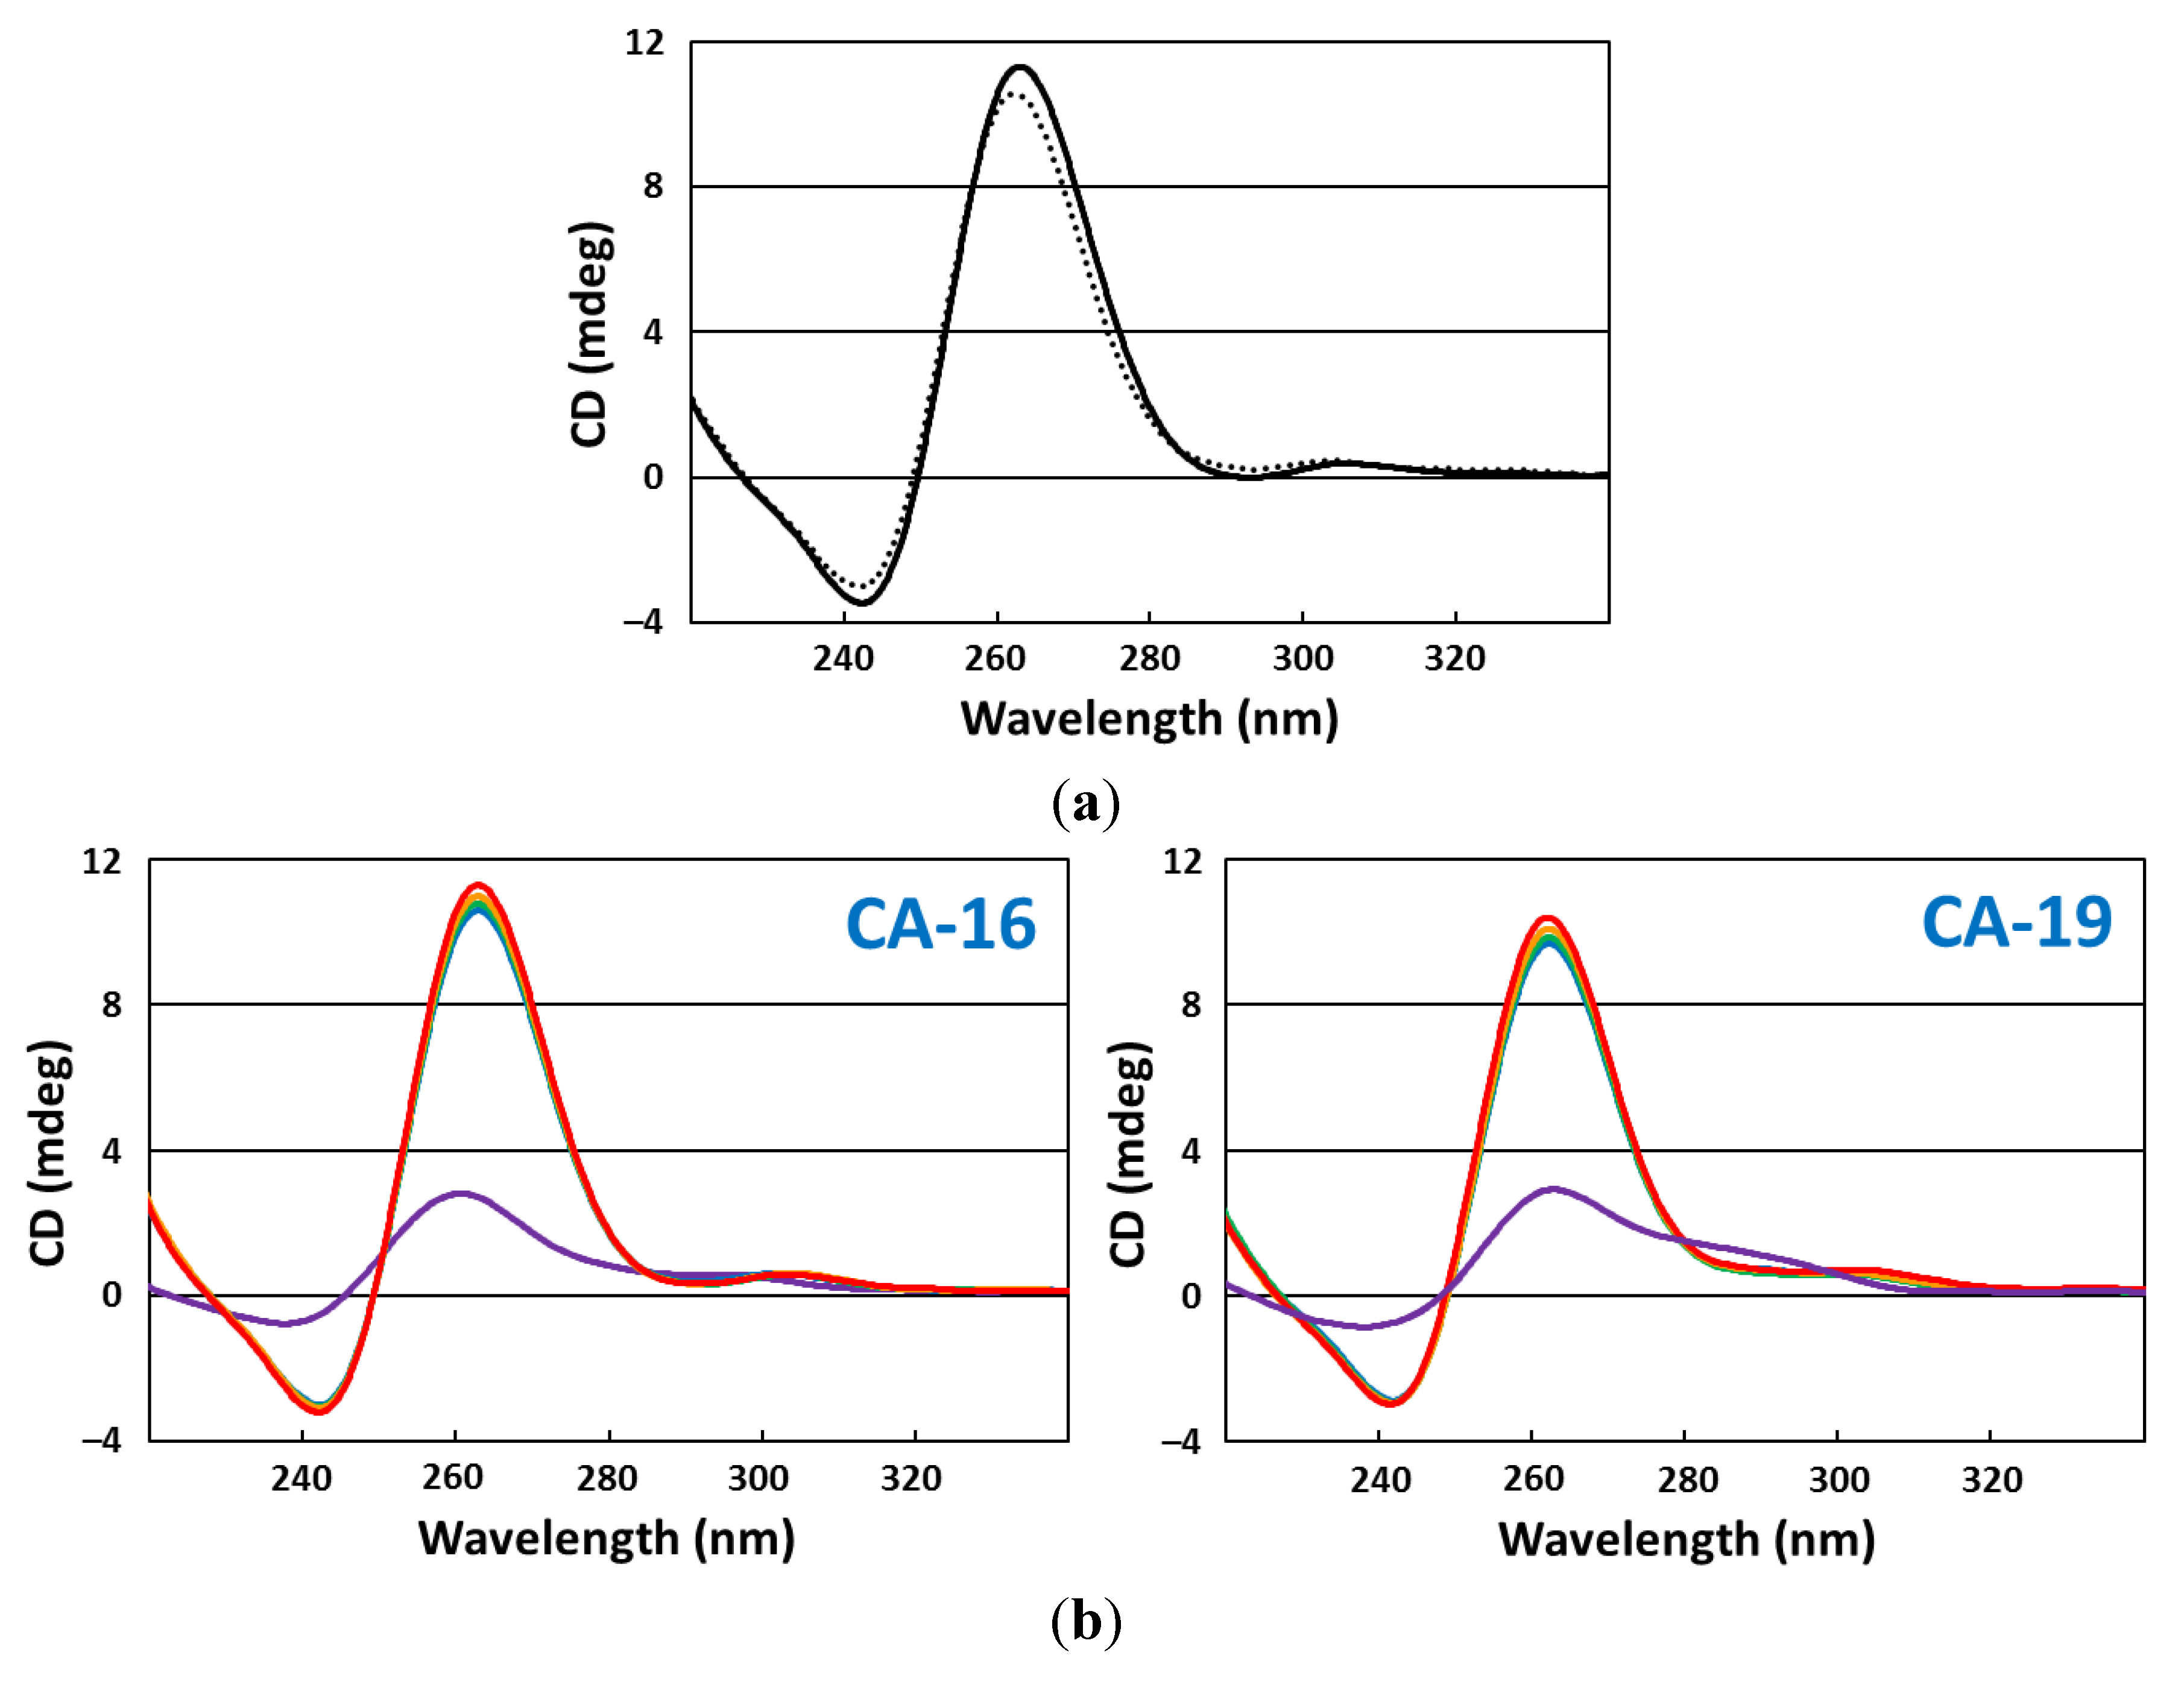
2.5. CD Spectroscopy

2.6. CD Melting Curves
3. Results and Discussion

4. Conclusions
Acknowledgments
Conflicts of Interest
References
- Ellington, A.D.; Szostak, J.W. In vitro selection of RNA molecules that bind specific ligands. Nature 1990, 346, 818–822. [Google Scholar] [CrossRef]
- Tuerk, C.; Gold, L. Systematic evolution of ligands by exponential enrichment: RNA ligands to bacteriophage T4 DNA polymerase. Science 1990, 249, 505–510. [Google Scholar]
- Ellington, A.D.; Szostak, J.W. Selection in vitro of single-stranded DNA molecules that fold into specific ligand-binding structures. Nature 1992, 355, 850–852. [Google Scholar] [CrossRef]
- Sissi, C.; Gatto, B.; Palumbo, M. The evolving world of protein-G-quadruplex recognition: a medicinal chemist’s perspective. Biochimie 2011, 93, 1219–1230. [Google Scholar] [CrossRef]
- Hamon, F.; Faverie, A.; Renaud, F.A.; Hamon, F.; Di Primo, C.; Largy, E.; Dausse, E.; Delaurière, L.; Landras-Guetta, C.; Toulmé, J.J.; et al. Nucleic acids targeted to drugs: SELEX against a quadruplex ligand. Biochimie 2011, 93, 1357–1367. [Google Scholar] [CrossRef]
- Tucker, W.O.; Shum, K.T.; Tanner, J.A. G-quadruplex DNA aptamers and their ligands: Structure, function and application. Curr. Pharm. Des. 2012, 18, 2014–2026. [Google Scholar] [CrossRef]
- Nadai, M.; Sattin, G.; Palù, G.; Palumbo, M.; Richter, S.N. Clerocidin-mediated DNA footprinting discriminates among different G-quadruplex conformations and detects tetraplex folding in a duplex environment. Biochim. Biophys. Acta 2013, 1830, 4660–4668. [Google Scholar] [CrossRef]
- Gatto, B.; Palumbo, M.; Sissi, C. Nucleic acid aptamers based on the G-quadruplex structure: therapeutic and diagnostic potential. Curr. Med. Chem. 2009, 16, 1248–1265. [Google Scholar] [CrossRef]
- Smirnov, I.V.; Shafer, R.H. Electrostatics dominate quadruplex stability. Biopolymers 2007, 85, 91–101. [Google Scholar] [CrossRef]
- Nagatoishi, S.; Isono, N.; Tsumoto, K.; Sugimoto, N. Loop residues of thrombin-binding DNA aptamer impact G-quadruplex stability and thrombin binding. Biochimie 2011, 93, 1231–1238. [Google Scholar] [CrossRef]
- Nagatoishi, S.; Sugimoto, N. Interaction of water with the G-quadruplex loop contributes to the binding energy of G-quadruplex to protein. Mol. Biosyst. 2012, 8, 2766–2770. [Google Scholar] [CrossRef]
- Pramanik, S.; Nagatoishi, S.; Sugimoto, N. DNA tetraplex structure formation from human telomeric repeat motif (TTAGGG):(CCCTAA) in nanocavity water pools of reverse micelles. Chem. Commun. 2012, 48, 4815–4817. [Google Scholar] [CrossRef]
- Imaizumi, Y.; Kasahara, Y.; Fujita, H.; Kitadume, S.; Ozaki, H.; Endoh, T.; Kuwahara, M.; Sugimoto, N. Efficacy of base-modification on target binding of small molecule DNA aptamers. J. Am. Chem. Soc. 2013, 135, 9412–9419. [Google Scholar] [CrossRef]
- McLuckie, K.I.; Waller, Z.A.; Sanders, D.A.; Alves, D.; Rodriguez, R.; Dash, J.; McKenzie, G.J.; Venkitaraman, A.R.; Balasubramanian, S. G-quadruplex-binding benzo[a]phenoxazines down-regulate c-KIT expression in human gastric carcinoma cells. J. Am. Chem. Soc. 2011, 133, 2658–2663. [Google Scholar] [CrossRef]
- Hurley, L.H.; von Hoff, D.D.; Siddiqui-Jain, A.; Yang, D. Drug targeting of the c-MYC promoter to repress gene expression via a G-quadruplex silencer element. Semin. Oncol. 2006, 33, 498–512. [Google Scholar] [CrossRef]
- Shoji, A.; Hasegawa, T.; Kuwahara, M.; Ozaki, H.; Sawai, H. Chemico-enzymatic synthesis of a new fluorescent-labeled DNA by PCR with a thymidine nucleotide analogue bearing an acridone derivative. Bioorg. Med. Chem. Lett. 2007, 17, 776–779. [Google Scholar] [CrossRef]
- Beno, I.; Rosenthal, K.; Levitine, M.; Shaulov, L.; Haran, T.E. Sequence-dependent cooperative binding of p53 to DNA targets and its relationship to the structural properties of the DNA targets. Nucleic Acids Res. 2011, 39, 1919–1932. [Google Scholar] [CrossRef]
- Nagesh, N.; Sharma, V.K.; Ganesh, K.A.; Lewis, E.A. Effect of Ionic Strength on Porphyrin Drugs Interaction with Quadruplex DNA Formed by the Promoter Region of C-myc and Bcl2 Oncogenes. J. Nucleic Acids 2010, 2010, 146418. [Google Scholar]
- Jecklin, M.C.; Schauer, S.; Dumelin, C.E.; Zenobi, R. Label-free determination of protein-ligand binding constants using mass spectrometry and validation using surface plasmon resonance and isothermal titration calorimetry. J. Mol. Recognit. 2009, 22, 319–329. [Google Scholar] [CrossRef]
- Ruta, J.; Perrier, S.; Ravelet, C.; Fize, J.; Peyrin, E. Noncompetitive fluorescence polarization aptamer-based assay for small molecule detection. Anal. Chem. 2009, 81, 7468–7473. [Google Scholar] [CrossRef]
- Mohanty, J.; Barooah, N.; Dhamodharan, V.; Harikrishna, S.; Pradeepkumar, P.I.; Bhasikuttan, A.C. Thioflavin T as an efficient inducer and selective fluorescent sensor for the human telomeric G-quadruplex DNA. J. Am. Chem. Soc. 2013, 135, 367–376. [Google Scholar] [CrossRef]
- Chen, S.B.; Shi, Q.X.; Peng, D.; Huang, S.Y.; Ou, T.M.; Li, D.; Tan, J.H.; Gu, L.Q.; Huang, Z.S. The role of positive charges on G-quadruplex binding small molecules: Learning from bisaryldiketene derivatives. Biochim Biophys Acta 2013, 1830, 5006–5013. [Google Scholar] [CrossRef]
- Shi, S.; Huang, H.L.; Gao, X.; Yao, J.L.; Lv, C.Y.; Zhao, J.; Sun, W.L.; Yao, T.M.; Ji, L.N. A comparative study of the interaction of two structurally analogous ruthenium complexes with human telomeric G-quadruplex DNA. J. Inorg. Biochem. 2013, 121, 19–27. [Google Scholar] [CrossRef]
- SantaLucia, J., Jr. A unified view of polymer, dumbbell, and oligonucleotide DNA nearest-neighbor thermodynamics. Proc. Natl. Acad. Sci. USA 1998, 95, 1460–1465. [Google Scholar] [CrossRef]
- Zuker, M. Mfold web server for nucleic acid folding and hybridization prediction. Nucleic Acids Res. 2003, 31, 3406–3415. [Google Scholar] [CrossRef]
- Sen, D.; Gilbert, W. Formation of parallel four-stranded complexes by guanine-rich motifs in DNA and its implications for meiosis. Nature 1988, 334, 364–366. [Google Scholar] [CrossRef]
- Giri, B.; Smaldino, P.J.; Thys, R.G.; Creacy, S.D.; Routh, E.D.; Hantgan, R.R.; Lattmann, S.; Nagamine, Y.; Akman, S.A. Vaughn, J.P. G4 resolvase 1 tightly binds and unwinds unimolecular G4-DNA. Nucleic Acids Res. 2011, 39, 7161–7178. [Google Scholar] [CrossRef]
- Kasahara, Y.; Irisawa, Y.; Fujita, H.; Yahara, A.; Ozaki, H.; Obika, S.; Kuwahara, M. Capillary electrophoresis-systematic evolution of ligands by exponential enrichment selection of base- and sugar-modified DNA aptamers: target binding dominated by 2'-O,4'-C-methylene-bridged/locked nucleic acid primer. Anal. Chem. 2013, 85, 4961–4967. [Google Scholar] [CrossRef]
- Seenisamy, J.; Rezler, E.M.; Powell, T.J.; Tye, D.; Gokhale, V.; Joshi, C.S. Siddiqui-Jain, A.; Hurley, L.H. The dynamic character of the G-quadruplex element in the c-MYC promoter and modification by TMPyP4. J. Am. Chem. Soc. 2004, 126, 8702–8709. [Google Scholar] [CrossRef]
- Kang, H.J.; Park, H.J. Novel molecular mechanism for actinomycin D activity as an oncogenic promoter G-quadruplex binder. Biochemistry 2009, 48, 7392–7398. [Google Scholar] [CrossRef]
© 2013 by the authors; licensee MDPI, Basel, Switzerland. This article is an open access article distributed under the terms and conditions of the Creative Commons Attribution license (http://creativecommons.org/licenses/by/3.0/).
Share and Cite
Fujita, H.; Imaizumi, Y.; Kasahara, Y.; Kitadume, S.; Ozaki, H.; Kuwahara, M.; Sugimoto, N. Structural and Affinity Analyses of G-Quadruplex DNA Aptamers for Camptothecin Derivatives. Pharmaceuticals 2013, 6, 1082-1093. https://doi.org/10.3390/ph6091082
Fujita H, Imaizumi Y, Kasahara Y, Kitadume S, Ozaki H, Kuwahara M, Sugimoto N. Structural and Affinity Analyses of G-Quadruplex DNA Aptamers for Camptothecin Derivatives. Pharmaceuticals. 2013; 6(9):1082-1093. https://doi.org/10.3390/ph6091082
Chicago/Turabian StyleFujita, Hiroto, Yuri Imaizumi, Yuuya Kasahara, Shunsuke Kitadume, Hiroaki Ozaki, Masayasu Kuwahara, and Naoki Sugimoto. 2013. "Structural and Affinity Analyses of G-Quadruplex DNA Aptamers for Camptothecin Derivatives" Pharmaceuticals 6, no. 9: 1082-1093. https://doi.org/10.3390/ph6091082
APA StyleFujita, H., Imaizumi, Y., Kasahara, Y., Kitadume, S., Ozaki, H., Kuwahara, M., & Sugimoto, N. (2013). Structural and Affinity Analyses of G-Quadruplex DNA Aptamers for Camptothecin Derivatives. Pharmaceuticals, 6(9), 1082-1093. https://doi.org/10.3390/ph6091082