Author Contributions
Conceptualization, S.D.; Methodology, Y.S., S.M., and S.D.; Software, Y.S., S.M., and S.D.; Validation, Y.S., S.M., and S.D.; Formal analysis, Y.S., and S.M.; Investigation, Y.S. and S.D.; Resources, S.D.; Data curation, Y.S.; Writing—original draft, Y.S., S.M., and S.D.; Writing—review and editing, Y.S., S.M., and S.D.; Visualization, Y.S., S.M., and S.D.; Supervision, S.D.; Project administration, S.D.; Funding acquisition, S.D. All authors have read and agreed to the published version of the manuscript.
Figure 1.
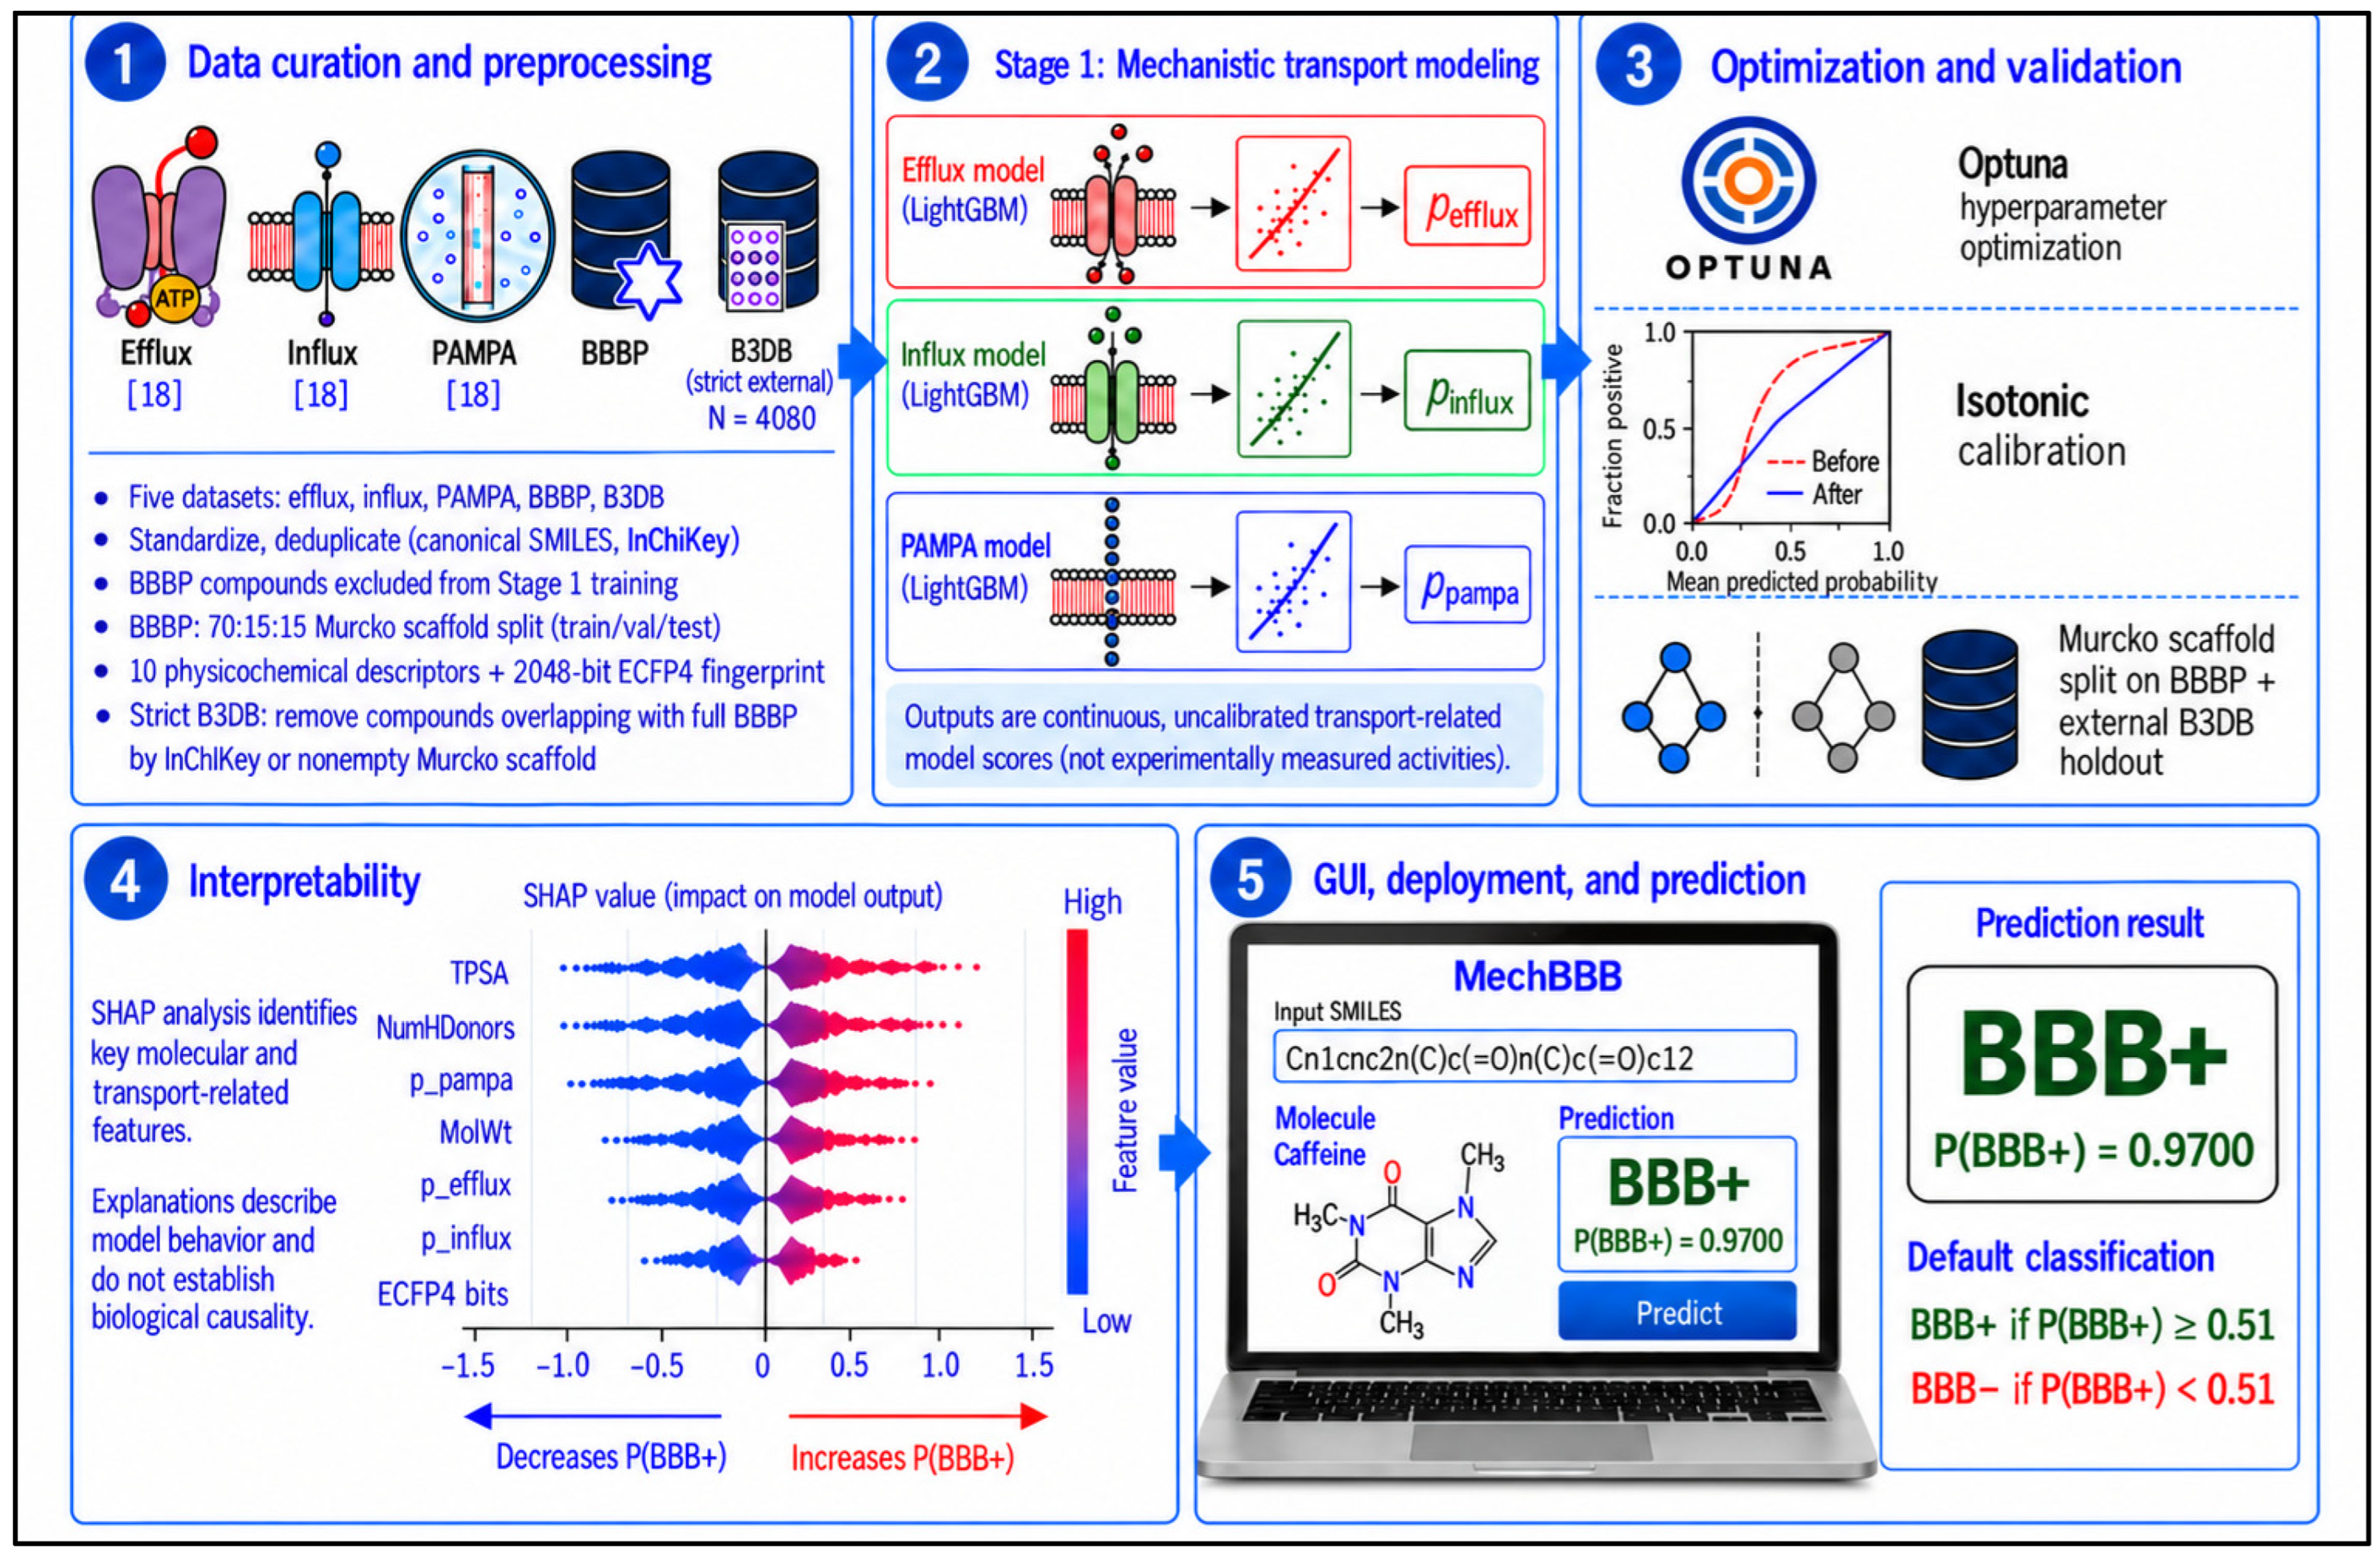
Overview of the MechBBB workflow. (
1) Data curation and preprocessing of the efflux, influx, PAMPA, BBBP, and B3DB datasets [
18], including molecular standardization, duplicate removal, and leakage control [
27]. (
2) Stage 1 LightGBM models generate continuous efflux, influx, and passive permeability scores [
23]. (
3) Stage 2 optimization, scaffold-based validation, and isotonic calibration are performed using BBBP, followed by evaluation on the held-out BBBP test set and strict B3DB external set [
28,
29]. (
4) SHAP analysis is used to describe contributions from physicochemical descriptors, ECFP4 fingerprints, and Stage 1 scores [
26]. (
5) The final frozen model is deployed through the MechBBB graphical user interface for single-molecule and batch prediction (Figure Created in BioRender).
Figure 1.
Overview of the MechBBB workflow. (
1) Data curation and preprocessing of the efflux, influx, PAMPA, BBBP, and B3DB datasets [
18], including molecular standardization, duplicate removal, and leakage control [
27]. (
2) Stage 1 LightGBM models generate continuous efflux, influx, and passive permeability scores [
23]. (
3) Stage 2 optimization, scaffold-based validation, and isotonic calibration are performed using BBBP, followed by evaluation on the held-out BBBP test set and strict B3DB external set [
28,
29]. (
4) SHAP analysis is used to describe contributions from physicochemical descriptors, ECFP4 fingerprints, and Stage 1 scores [
26]. (
5) The final frozen model is deployed through the MechBBB graphical user interface for single-molecule and batch prediction (Figure Created in BioRender).
Figure 2.
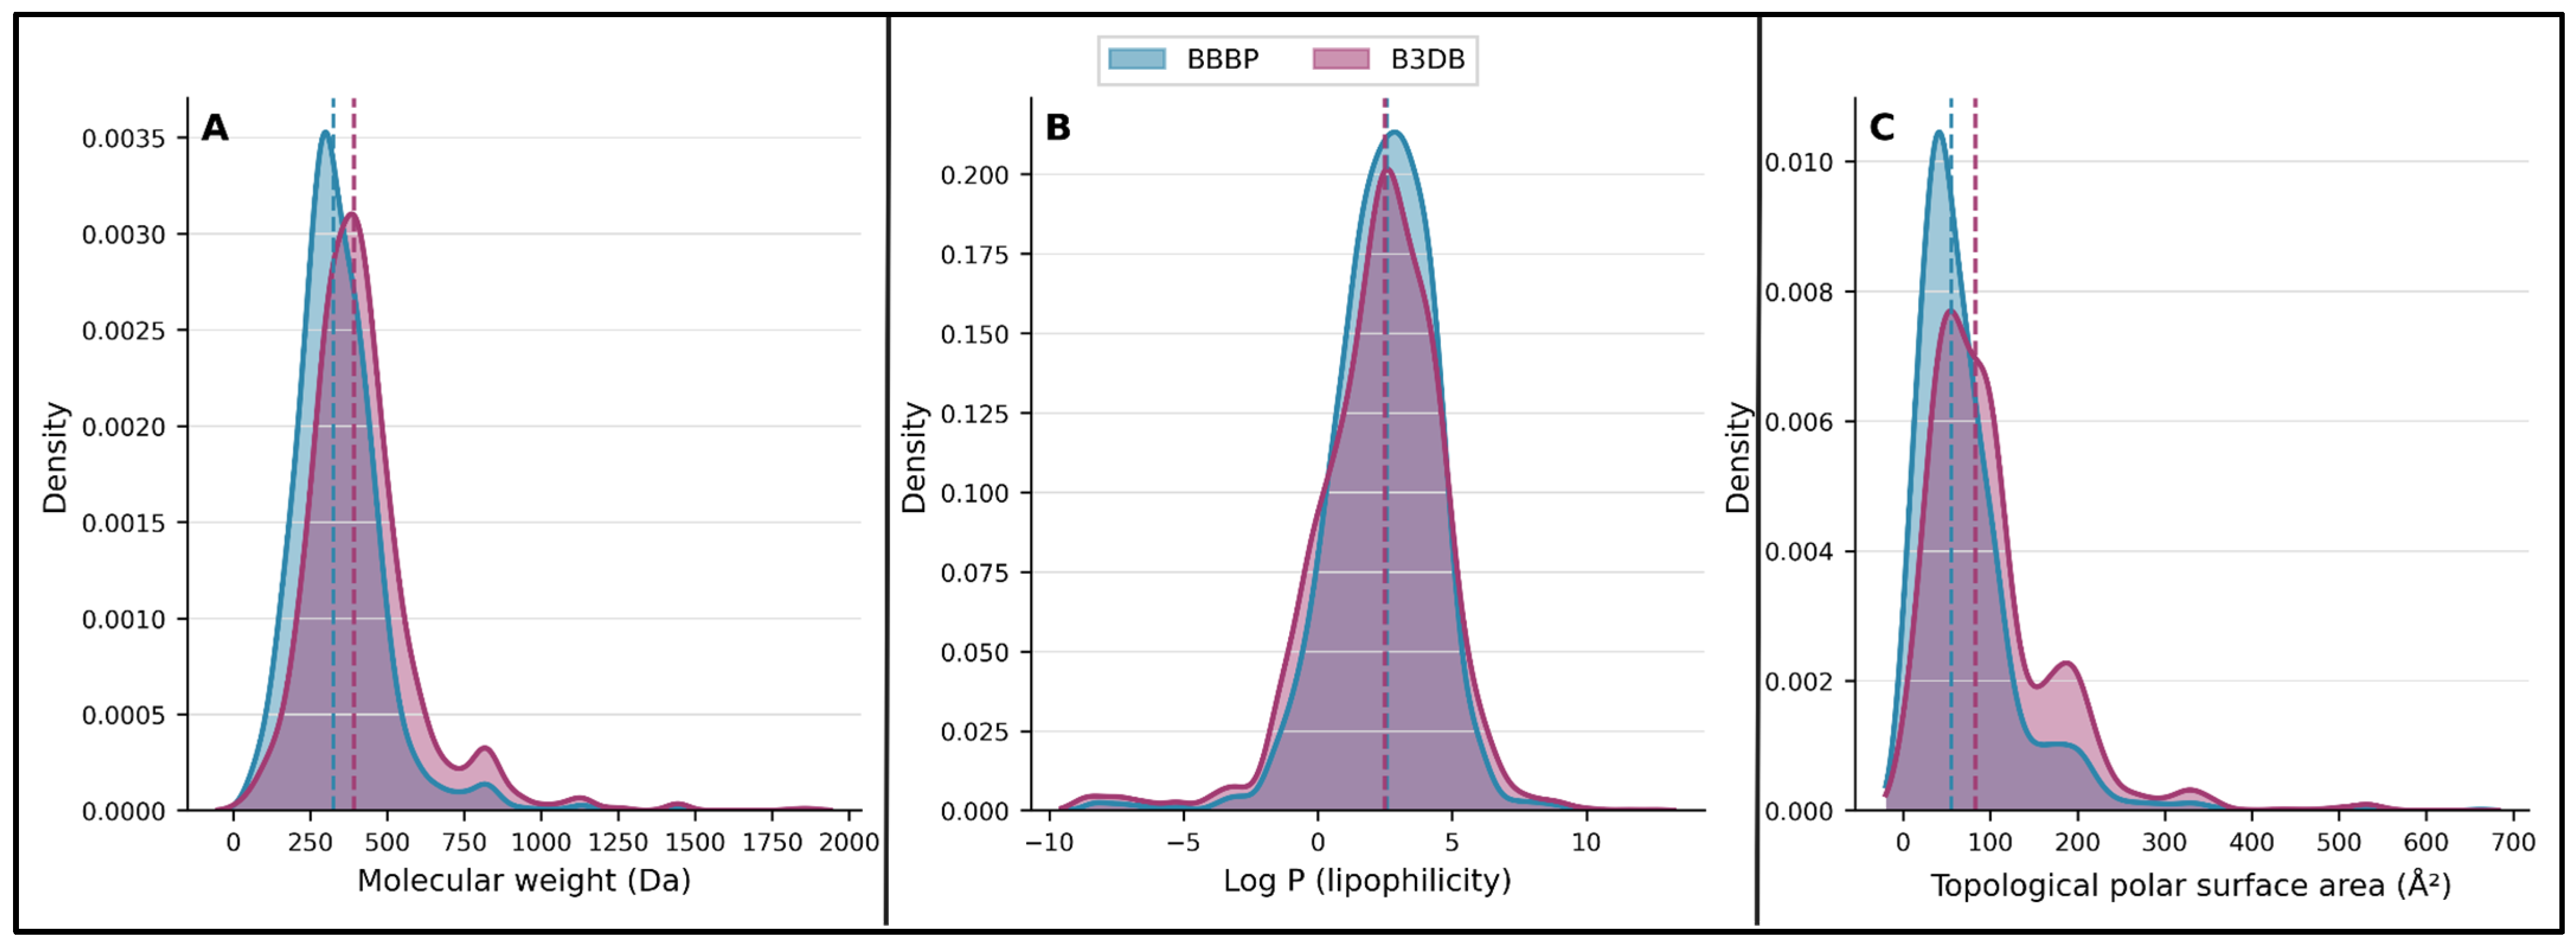
Physicochemical property distributions for the BBBP training set (n = 1365) and the strict B3DB external test set (n = 4080). (A) Molecular weight (MW). (B) Log P (lipophilicity). (C) Topological polar surface area (TPSA). The strict B3DB set was built by removing compounds that overlap the full BBBP dataset by InChIKey or nonempty Murcko scaffold. The dashed lines mark the median of each set. The plots show differences in physicochemical properties between the two populations. Only the BBBP training set was used for model fitting, and B3DB was kept for external testing.
Figure 2.
Physicochemical property distributions for the BBBP training set (n = 1365) and the strict B3DB external test set (n = 4080). (A) Molecular weight (MW). (B) Log P (lipophilicity). (C) Topological polar surface area (TPSA). The strict B3DB set was built by removing compounds that overlap the full BBBP dataset by InChIKey or nonempty Murcko scaffold. The dashed lines mark the median of each set. The plots show differences in physicochemical properties between the two populations. Only the BBBP training set was used for model fitting, and B3DB was kept for external testing.
Figure 3.
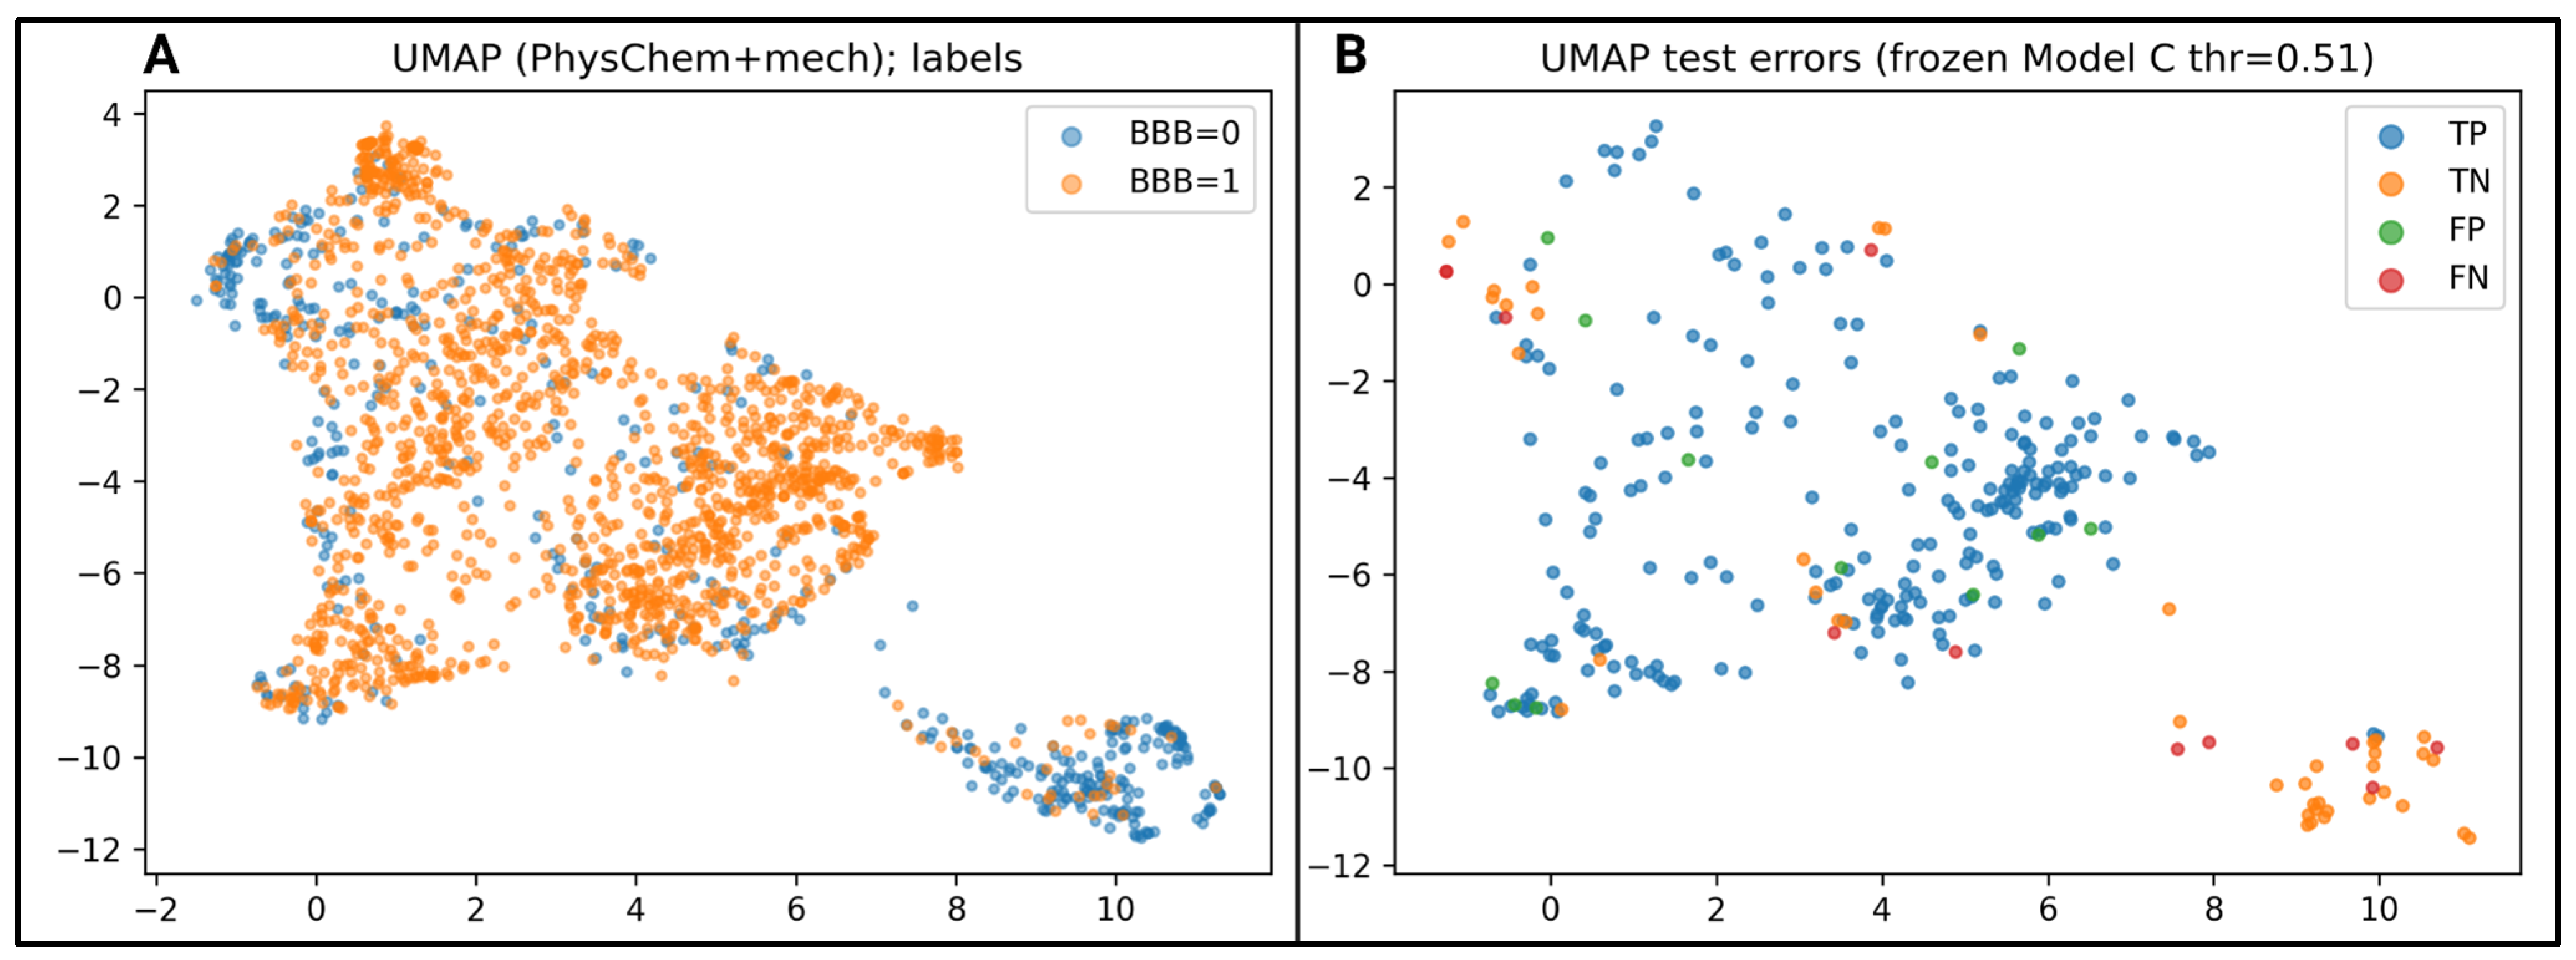
UMAP view of BBBP chemical space and Model C test set outcomes. (
A) UMAP of the full BBBP dataset (
n = 1950) colored by BBB label, where BBB− and BBB+ mark the two classes. (
B) The held-out BBBP test compounds (
n = 293) were placed in the same UMAP space and colored by the outcome from the frozen Model C, true positive (TP), true negative (TN), false positive (FP), and false negative (FN). Outcomes were set from the P(BBB+) values of Model C and the fixed threshold of 0.51. The UMAP came from the physicochemical and Stage 1 score inputs and was used for viewing only [
36]. The placed coordinates carry no direct physicochemical reading and do not set biological mechanism.
Figure 3.
UMAP view of BBBP chemical space and Model C test set outcomes. (
A) UMAP of the full BBBP dataset (
n = 1950) colored by BBB label, where BBB− and BBB+ mark the two classes. (
B) The held-out BBBP test compounds (
n = 293) were placed in the same UMAP space and colored by the outcome from the frozen Model C, true positive (TP), true negative (TN), false positive (FP), and false negative (FN). Outcomes were set from the P(BBB+) values of Model C and the fixed threshold of 0.51. The UMAP came from the physicochemical and Stage 1 score inputs and was used for viewing only [
36]. The placed coordinates carry no direct physicochemical reading and do not set biological mechanism.
Figure 4.
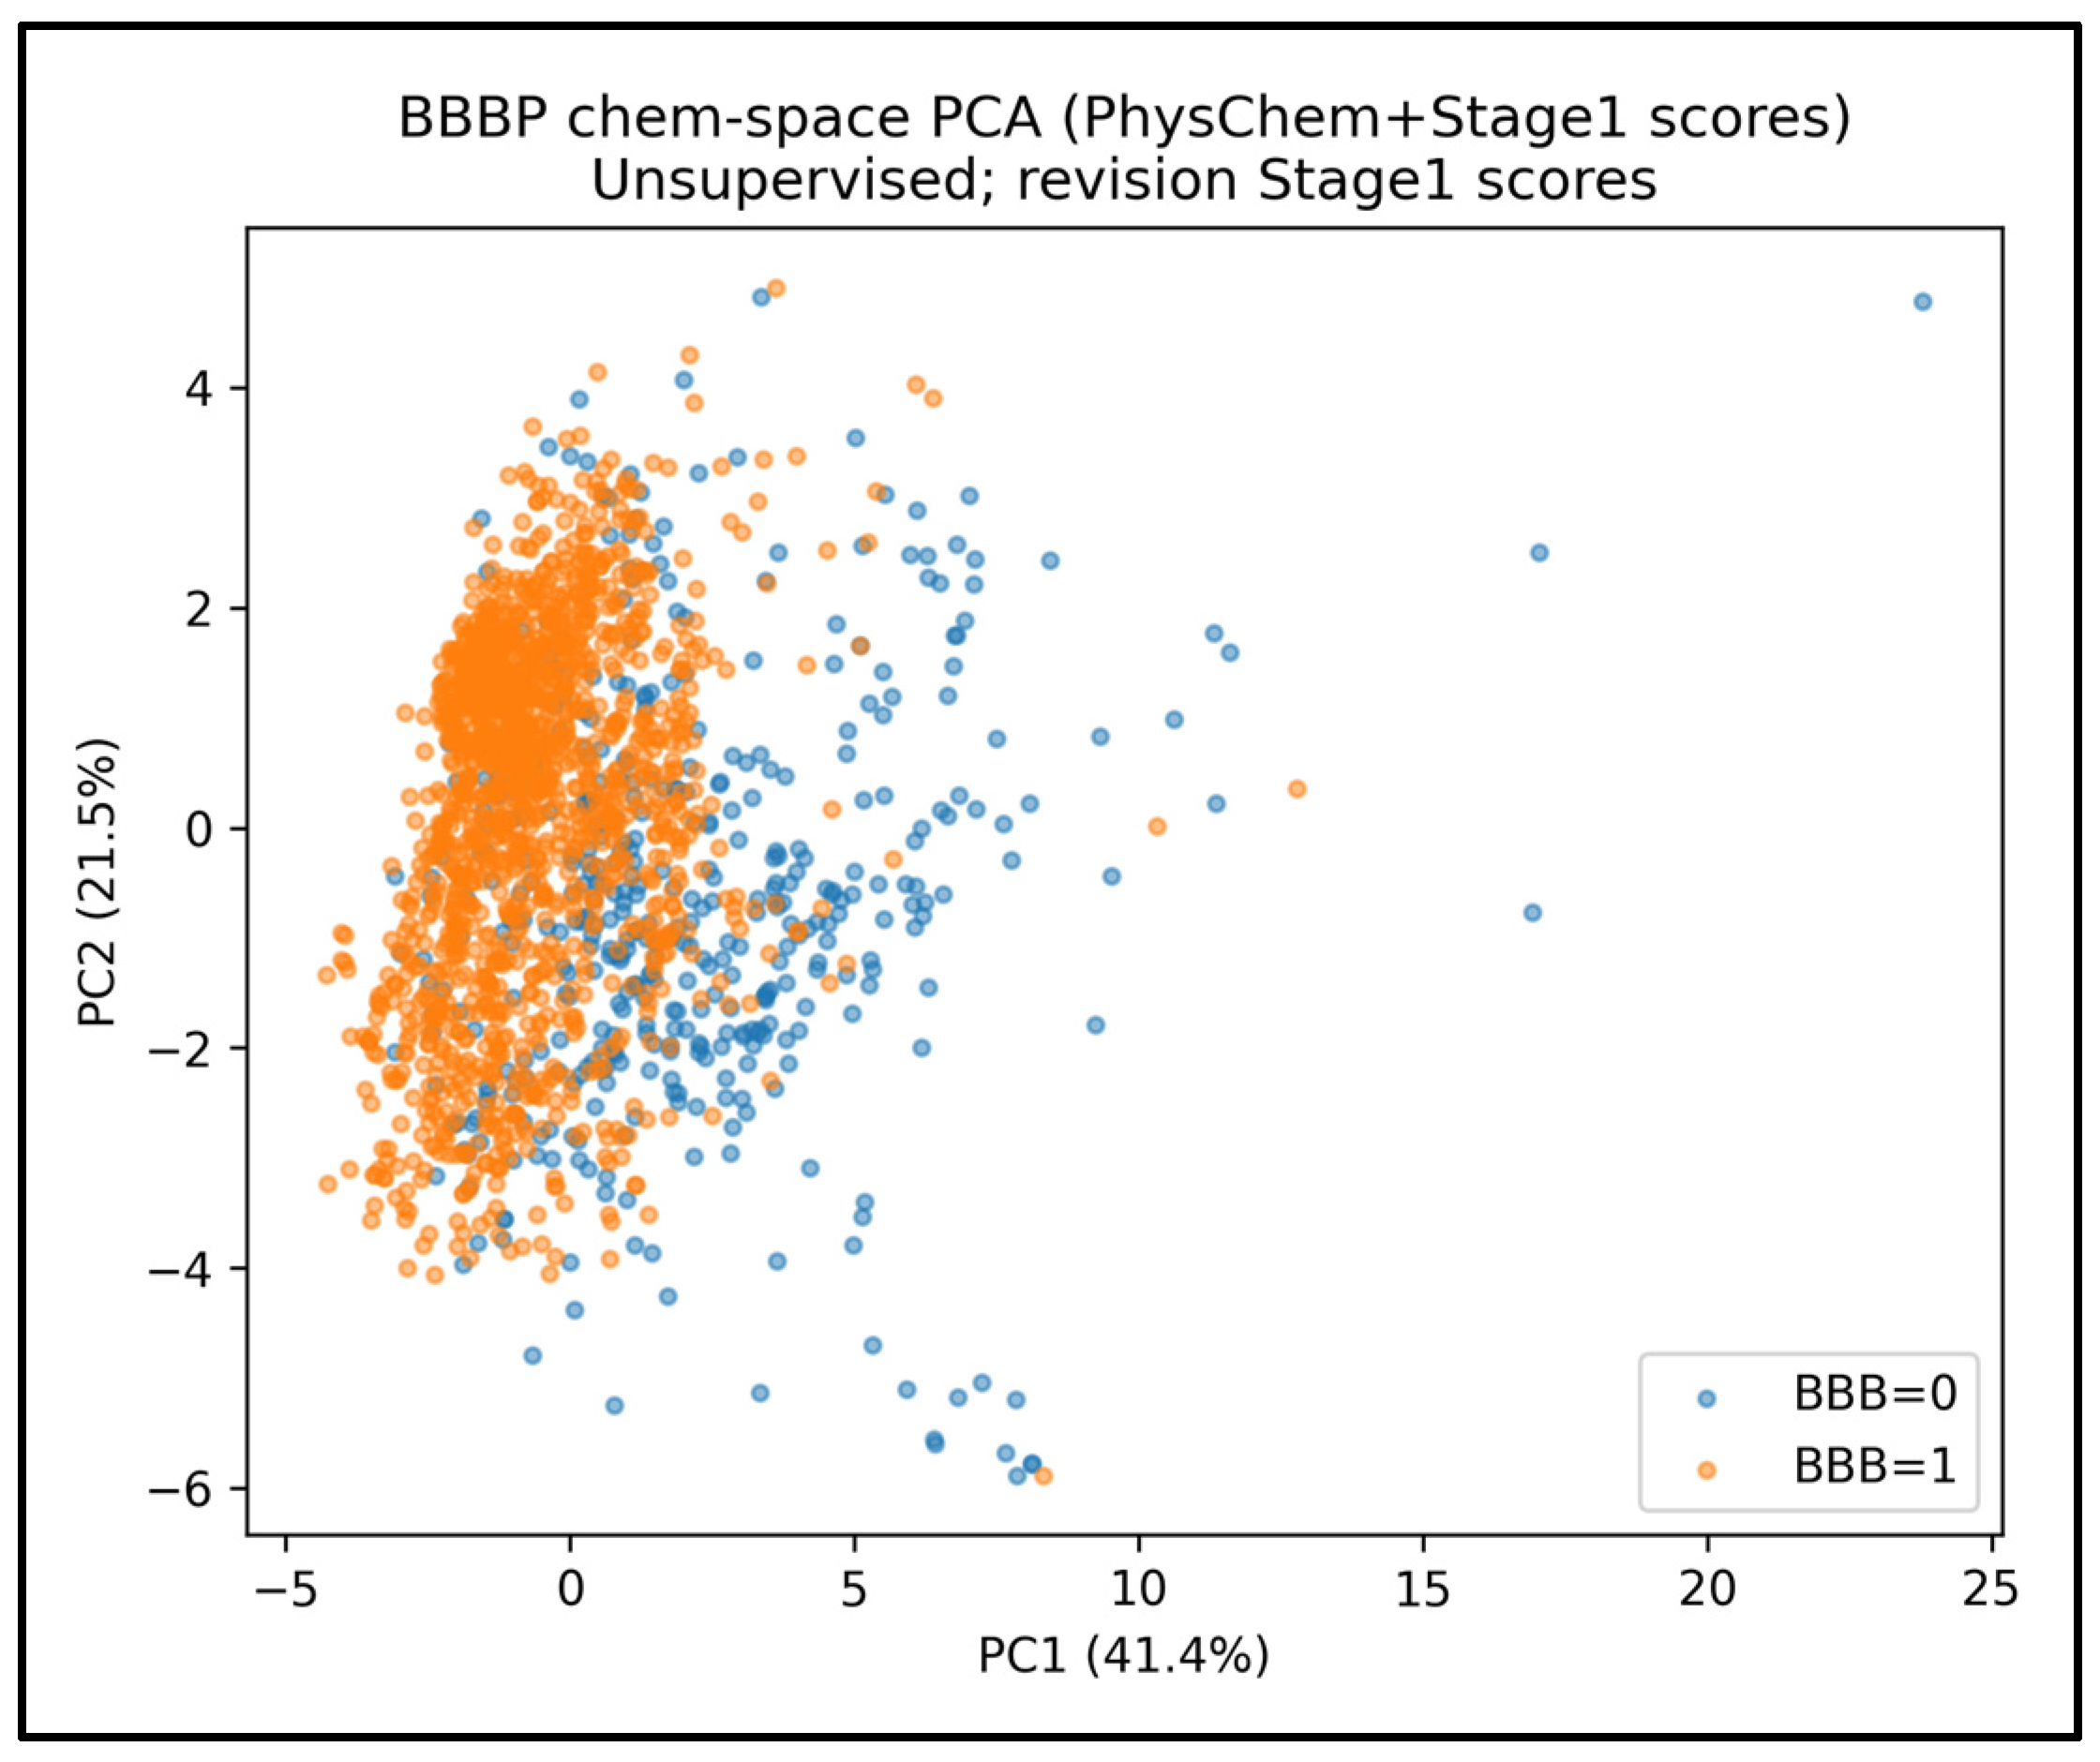
PCA of the BBBP continuous input space. PCA was run on 13 inputs made of 10 physicochemical descriptors and three Stage 1 transport scores, p_efflux, p_influx, and p_pampa [
37]. The 2048-bit ECFP4 fingerprint was not part of this PCA. Points show BBBP compounds colored by BBB label. PC1 held 41.4% of the total variance and PC2 held 21.5% for total of 62.9% over the two shown components. The PCA was used for viewing only and was not an input-reduction step in Stage 2 training.
Figure 4.
PCA of the BBBP continuous input space. PCA was run on 13 inputs made of 10 physicochemical descriptors and three Stage 1 transport scores, p_efflux, p_influx, and p_pampa [
37]. The 2048-bit ECFP4 fingerprint was not part of this PCA. Points show BBBP compounds colored by BBB label. PC1 held 41.4% of the total variance and PC2 held 21.5% for total of 62.9% over the two shown components. The PCA was used for viewing only and was not an input-reduction step in Stage 2 training.
Figure 5.
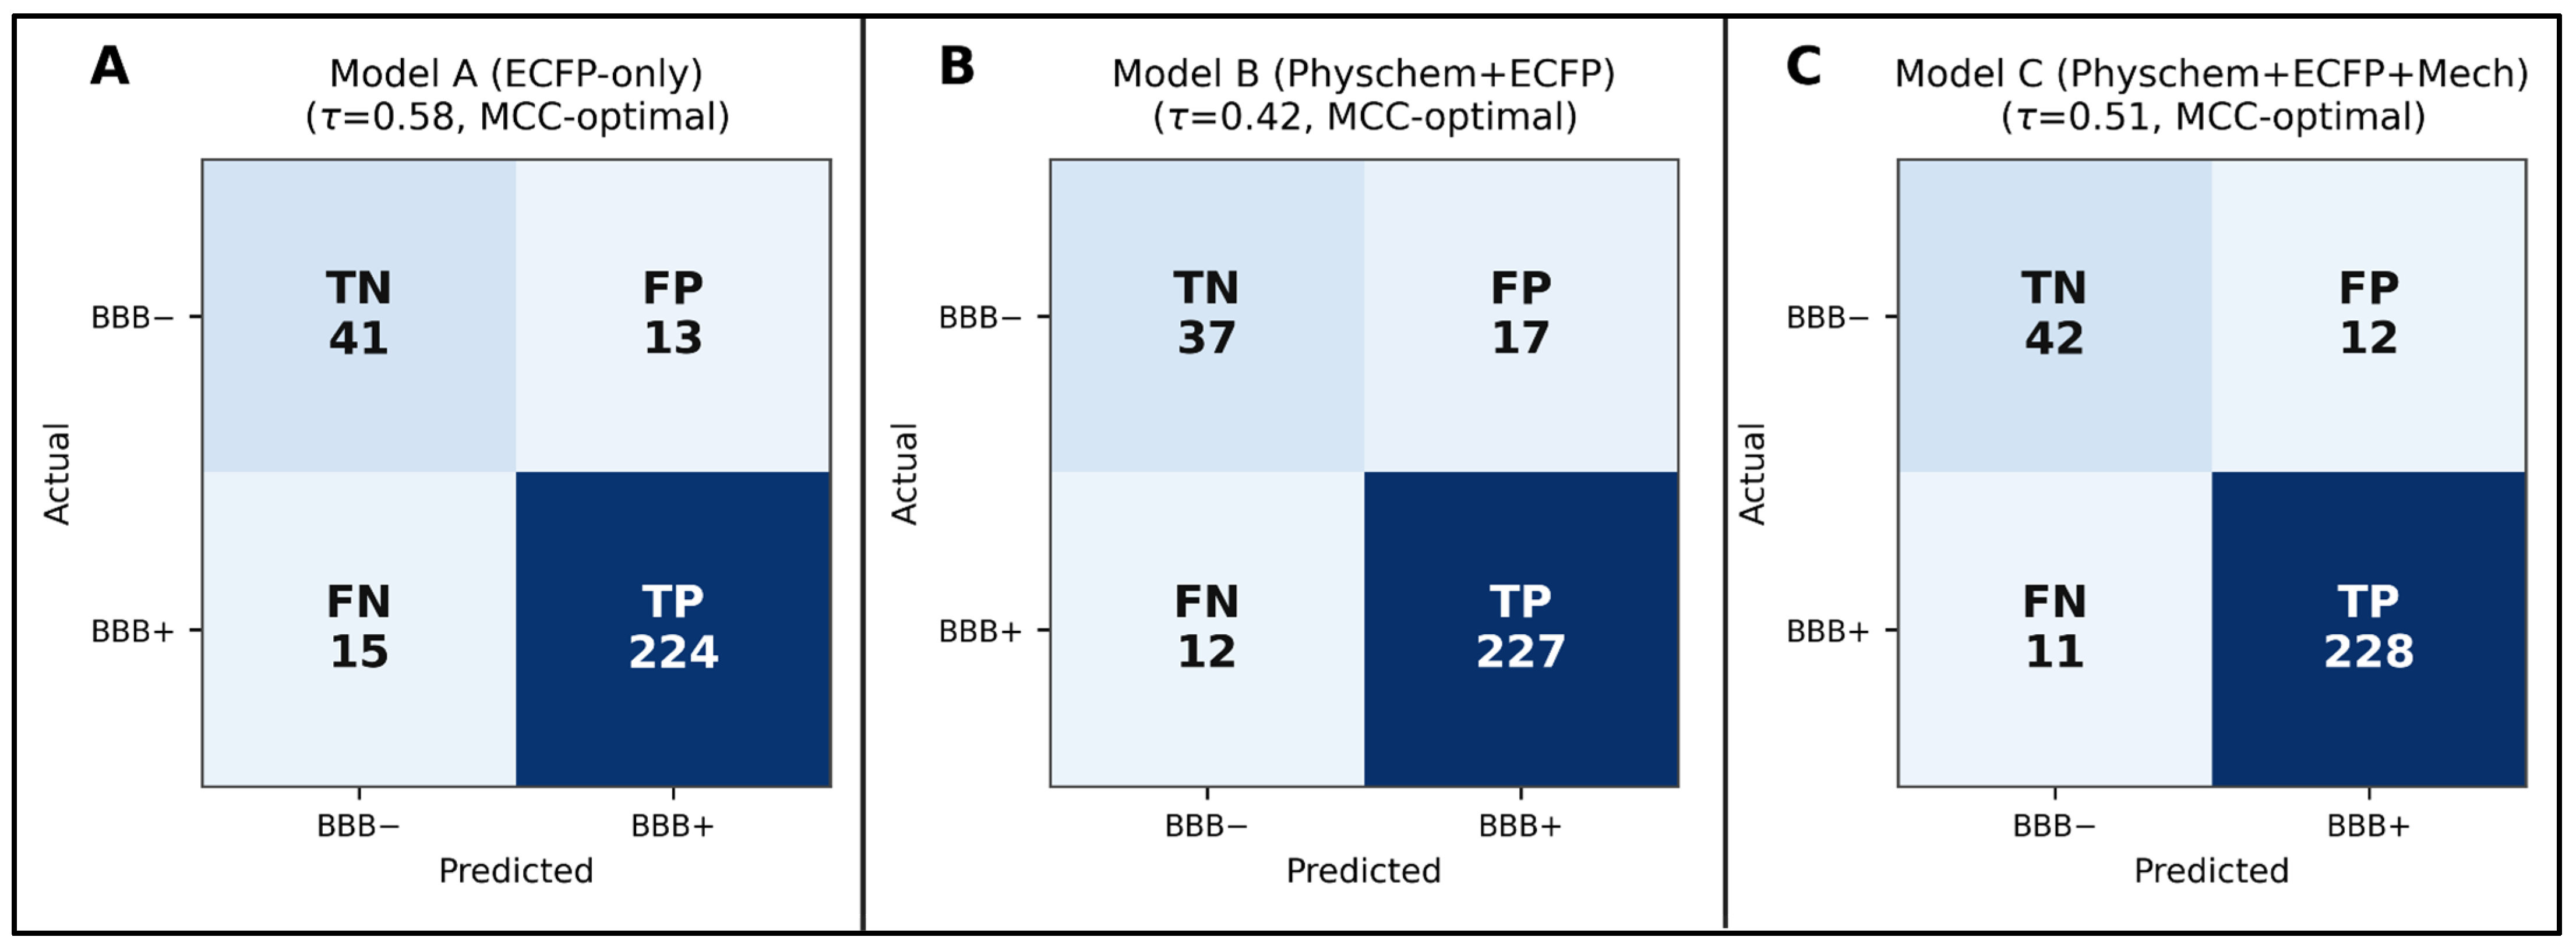
Confusion matrices for Model A, Model B, and Model C on the BBBP test set (n = 293) at their MCC optimal thresholds. (A) Model A (ECFP only) at threshold 0.58. (B) Model B (physicochemical descriptors plus ECFP) at threshold 0.42. (C) Model C (physicochemical descriptors plus ECFP plus Stage 1 scores) at threshold 0.51. Each panel reports true negative, false positive, false negative, and true positive counts at the validation selected threshold. Darker shading indicates a higher count.
Figure 5.
Confusion matrices for Model A, Model B, and Model C on the BBBP test set (n = 293) at their MCC optimal thresholds. (A) Model A (ECFP only) at threshold 0.58. (B) Model B (physicochemical descriptors plus ECFP) at threshold 0.42. (C) Model C (physicochemical descriptors plus ECFP plus Stage 1 scores) at threshold 0.51. Each panel reports true negative, false positive, false negative, and true positive counts at the validation selected threshold. Darker shading indicates a higher count.
Figure 6.
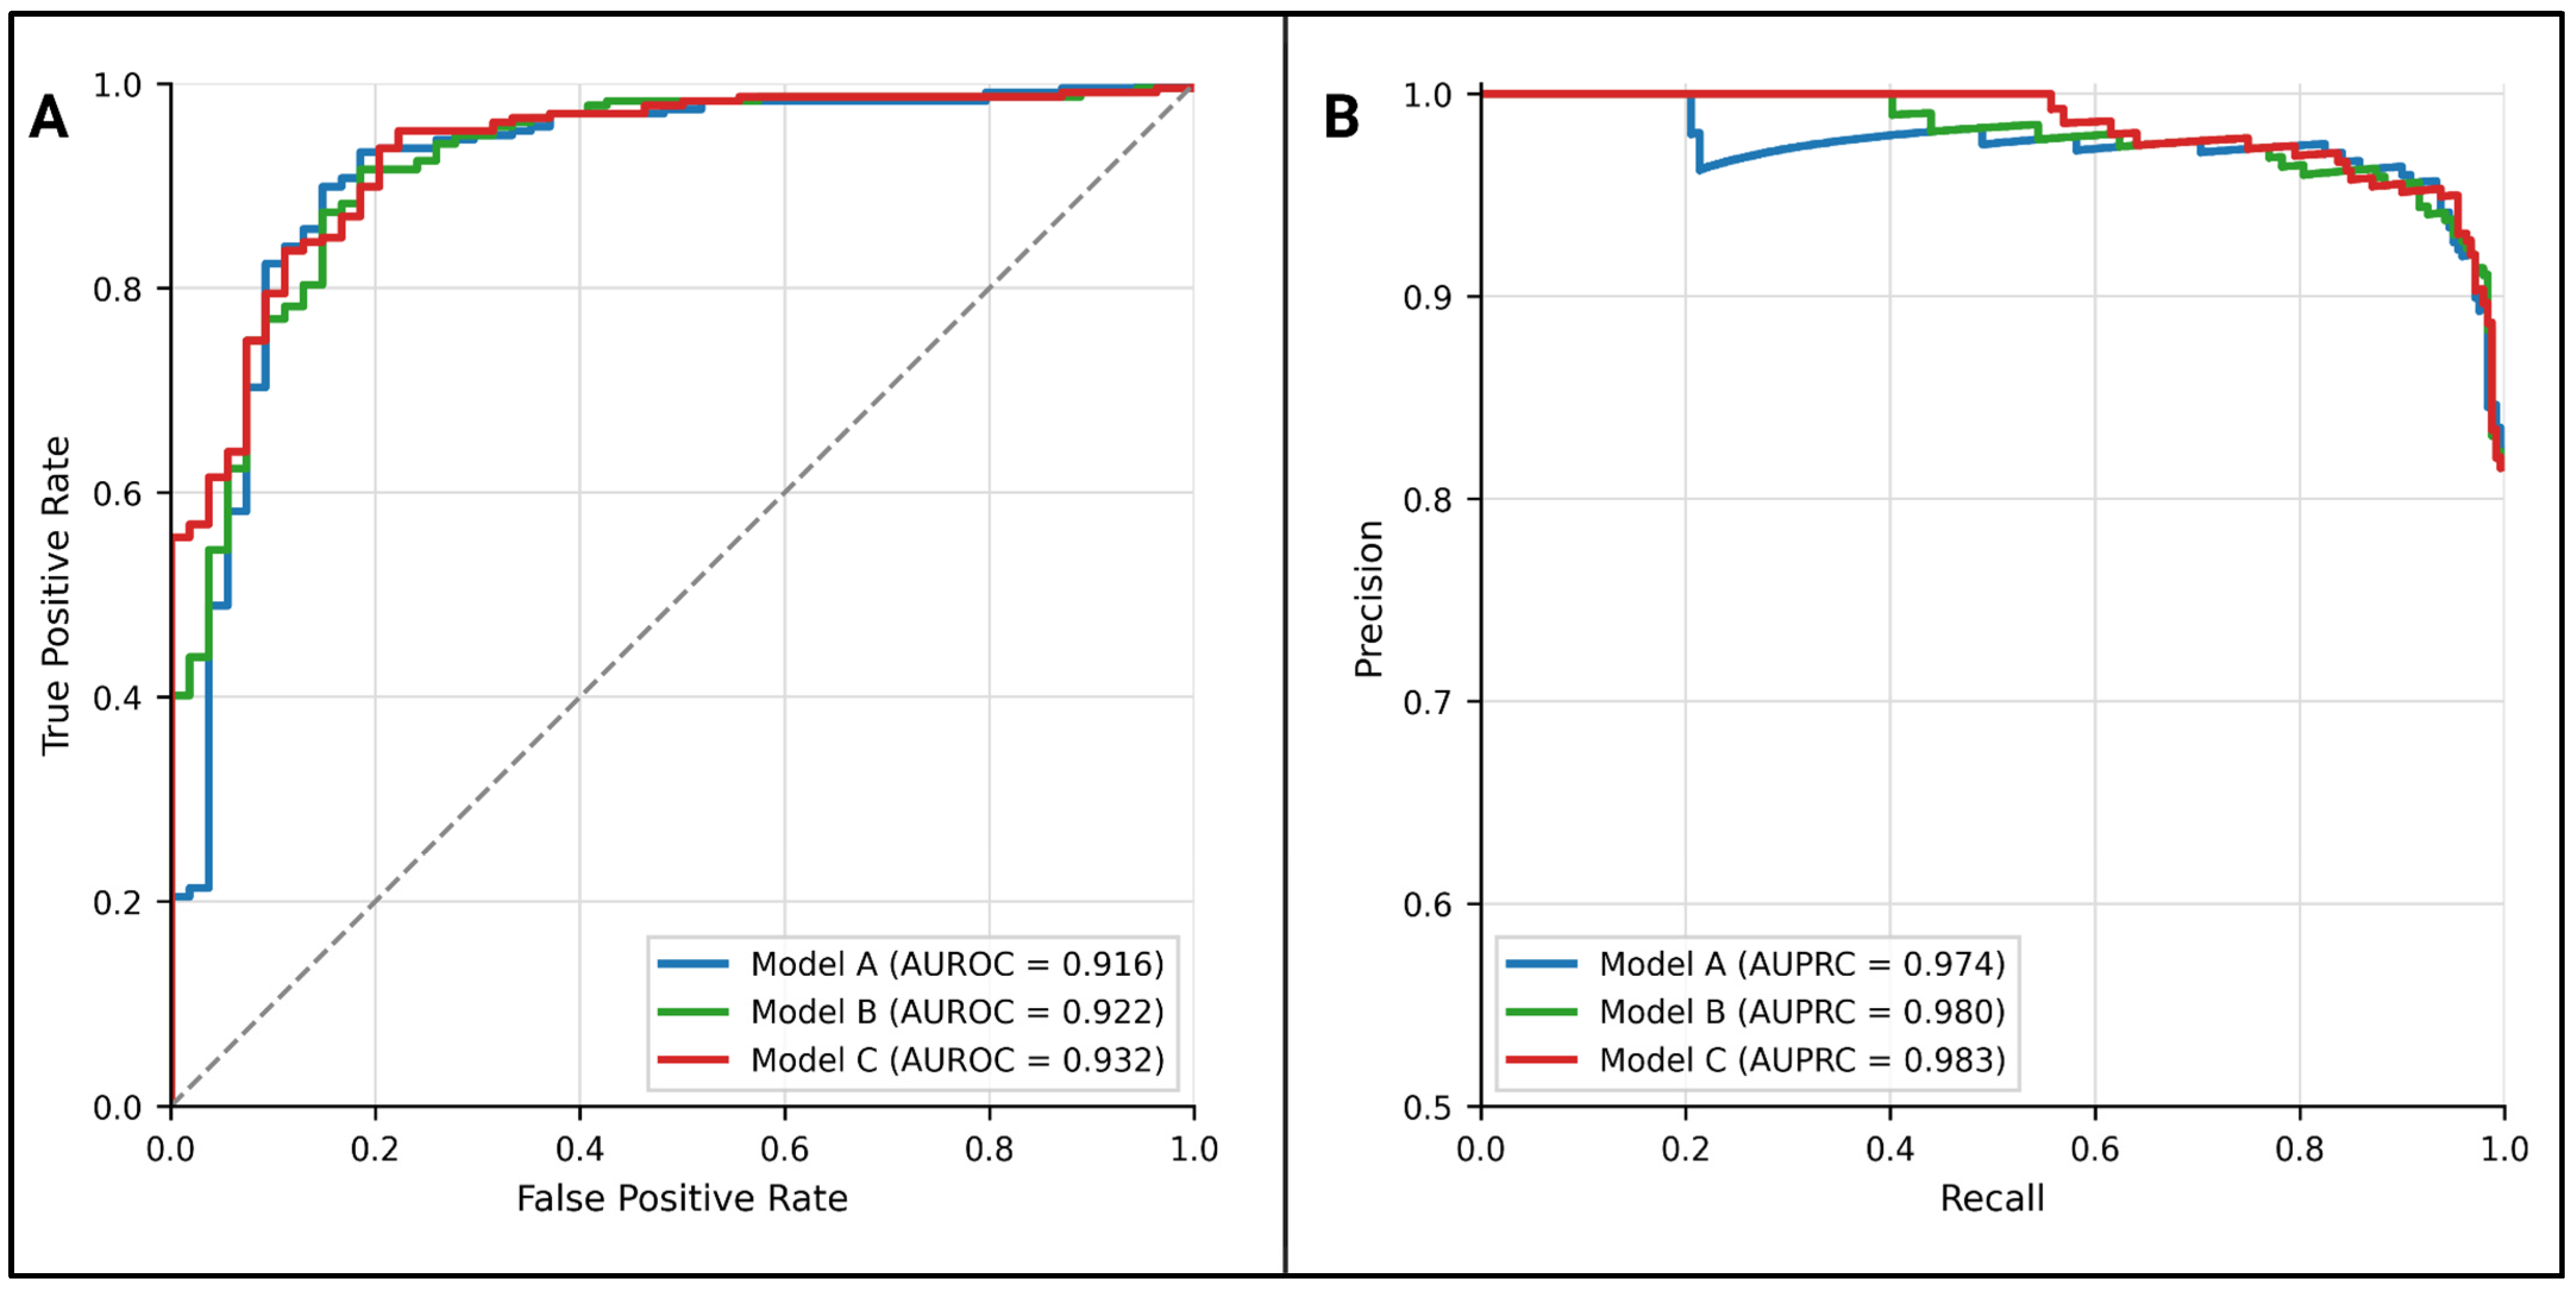
ROC and precision recall curves for Model A, Model B, and Model C on the BBBP scaffold split test set (
n = 293). (
A) ROC curves with AUROC in the legend. Model A uses ECFP4 fingerprints only. Model B uses ten physicochemical descriptors plus ECFP4 fingerprints. Model C uses ten physicochemical descriptors plus ECFP4 fingerprints plus three Stage 1 scores. (
B) Precision recall curves for the same models. Model C scores come from a five seed average, with the per-molecule scores averaged over the seeds before reporting. The curves show ranking performance over all thresholds and do not depend on one decision threshold [
33,
34].
Figure 6.
ROC and precision recall curves for Model A, Model B, and Model C on the BBBP scaffold split test set (
n = 293). (
A) ROC curves with AUROC in the legend. Model A uses ECFP4 fingerprints only. Model B uses ten physicochemical descriptors plus ECFP4 fingerprints. Model C uses ten physicochemical descriptors plus ECFP4 fingerprints plus three Stage 1 scores. (
B) Precision recall curves for the same models. Model C scores come from a five seed average, with the per-molecule scores averaged over the seeds before reporting. The curves show ranking performance over all thresholds and do not depend on one decision threshold [
33,
34].
Figure 7.
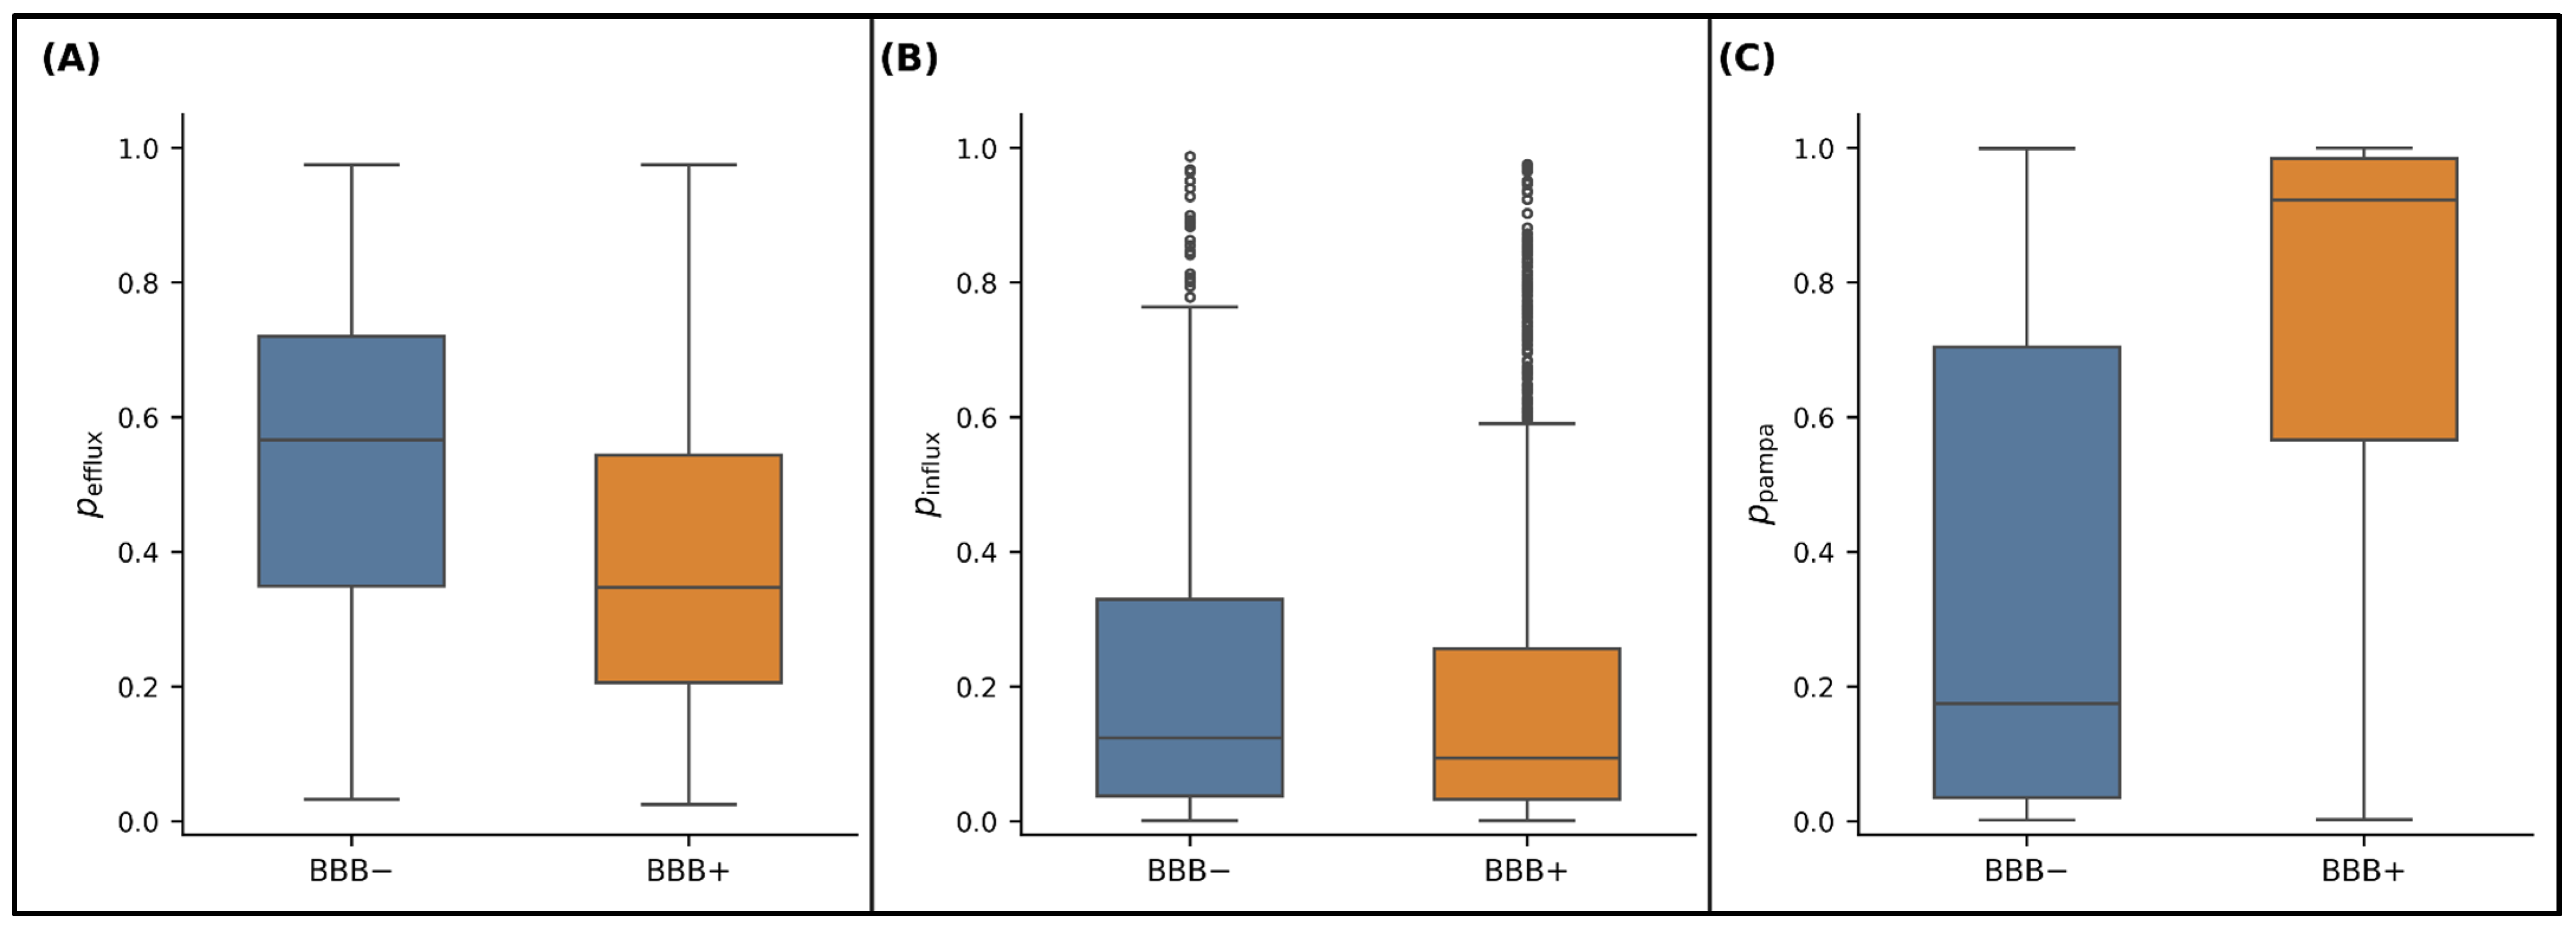
Distributions of the corrected Stage 1 scores on the cleaned BBBP dataset by experimental BBB label (n = 1950, BBB+ n = 1491, BBB− n = 459). Boxplots show the model scores for (A) p_efflux, (B) p_influx, and (C) p_pampa. Each box shows the median and the interquartile range. Whiskers reach 1.5 times the interquartile range, and points past the whiskers mark single compounds. The scores came from the corrected Stage 1 refit models and are not direct transporter or PAMPA measurements.
Figure 7.
Distributions of the corrected Stage 1 scores on the cleaned BBBP dataset by experimental BBB label (n = 1950, BBB+ n = 1491, BBB− n = 459). Boxplots show the model scores for (A) p_efflux, (B) p_influx, and (C) p_pampa. Each box shows the median and the interquartile range. Whiskers reach 1.5 times the interquartile range, and points past the whiskers mark single compounds. The scores came from the corrected Stage 1 refit models and are not direct transporter or PAMPA measurements.
Figure 8.
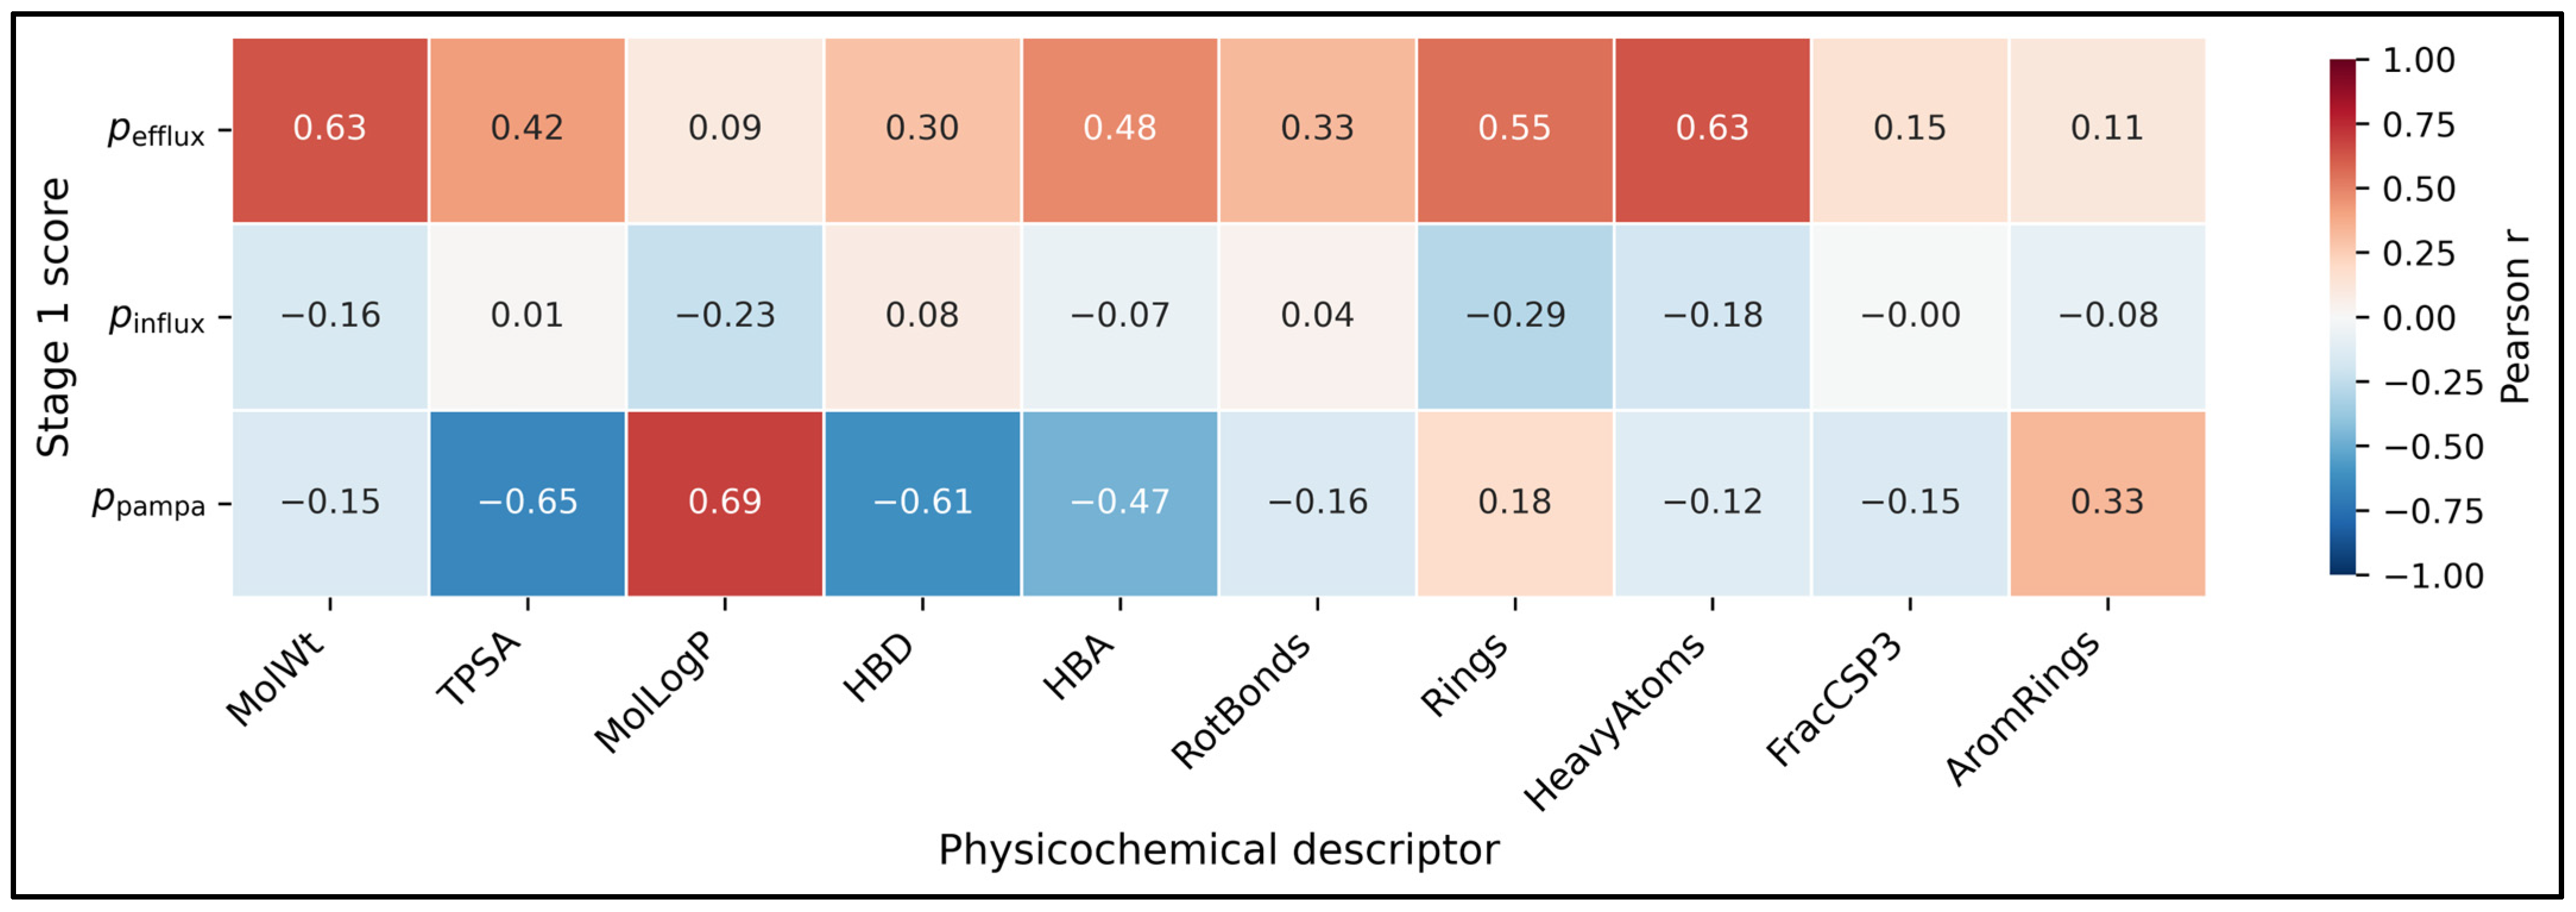
Pearson correlation heatmap between the corrected Stage 1 scores and the 10 physicochemical descriptors used in Stage 2 on the cleaned BBBP dataset (n = 1950). Correlations are shown for p_efflux, p_influx, and p_pampa against MolWt, TPSA, MolLogP, NumHDonors, NumHAcceptors, NumRotatableBonds, RingCount, HeavyAtomCount, FractionCSP3, and NumAromaticRings. The strongest links were p_pampa with MolLogP (r = +0.687) and p_efflux with MolWt (r = +0.630). p_influx showed weaker links with the descriptors, and its largest absolute value was with RingCount (r = −0.287). All correlations came from the corrected refit scores paired with the Stage 2 descriptor table.
Figure 8.
Pearson correlation heatmap between the corrected Stage 1 scores and the 10 physicochemical descriptors used in Stage 2 on the cleaned BBBP dataset (n = 1950). Correlations are shown for p_efflux, p_influx, and p_pampa against MolWt, TPSA, MolLogP, NumHDonors, NumHAcceptors, NumRotatableBonds, RingCount, HeavyAtomCount, FractionCSP3, and NumAromaticRings. The strongest links were p_pampa with MolLogP (r = +0.687) and p_efflux with MolWt (r = +0.630). p_influx showed weaker links with the descriptors, and its largest absolute value was with RingCount (r = −0.287). All correlations came from the corrected refit scores paired with the Stage 2 descriptor table.
Figure 9.
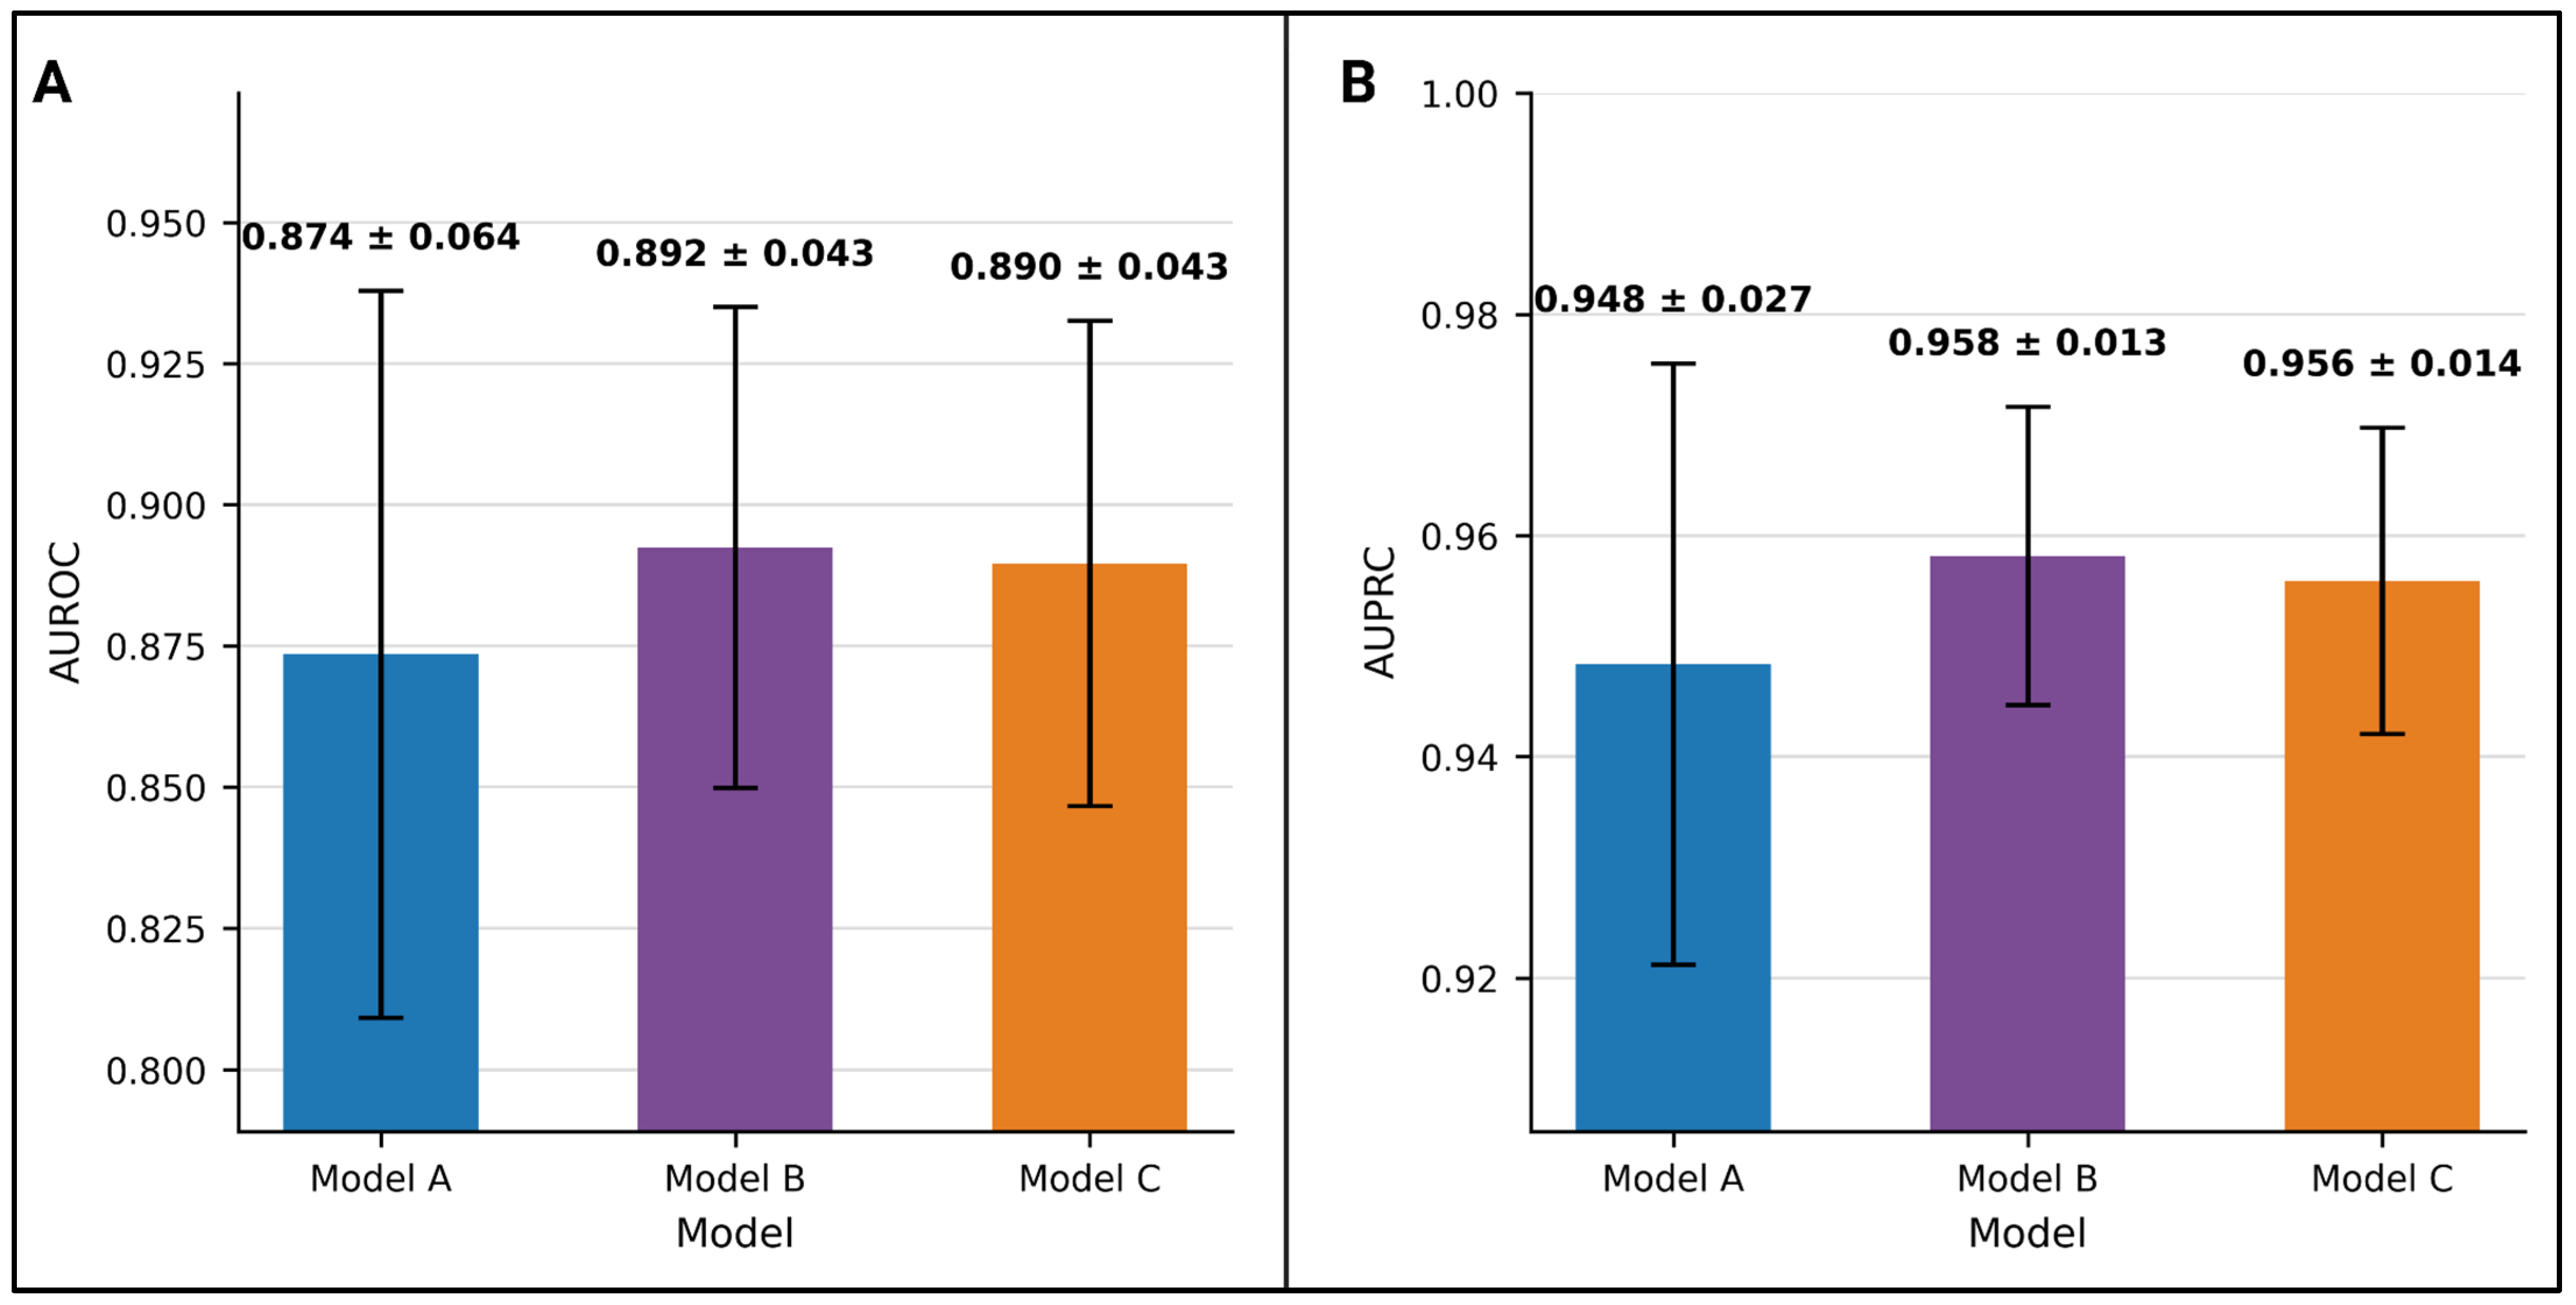
Five-fold scaffold-grouped cross-validation results for Models A, B, and C on the BBBP training and validation set. (A) AUROC and (B) AUPRC averaged across five Murcko scaffold-grouped folds. Bars show the mean across folds, and error bars show one standard deviation. Model A uses ECFP4 only. Model B uses physicochemical descriptors and ECFP4. Model C uses physicochemical descriptors, ECFP4, and Stage 1 scores (p_efflux, p_influx, p_pampa).
Figure 9.
Five-fold scaffold-grouped cross-validation results for Models A, B, and C on the BBBP training and validation set. (A) AUROC and (B) AUPRC averaged across five Murcko scaffold-grouped folds. Bars show the mean across folds, and error bars show one standard deviation. Model A uses ECFP4 only. Model B uses physicochemical descriptors and ECFP4. Model C uses physicochemical descriptors, ECFP4, and Stage 1 scores (p_efflux, p_influx, p_pampa).
Figure 10.
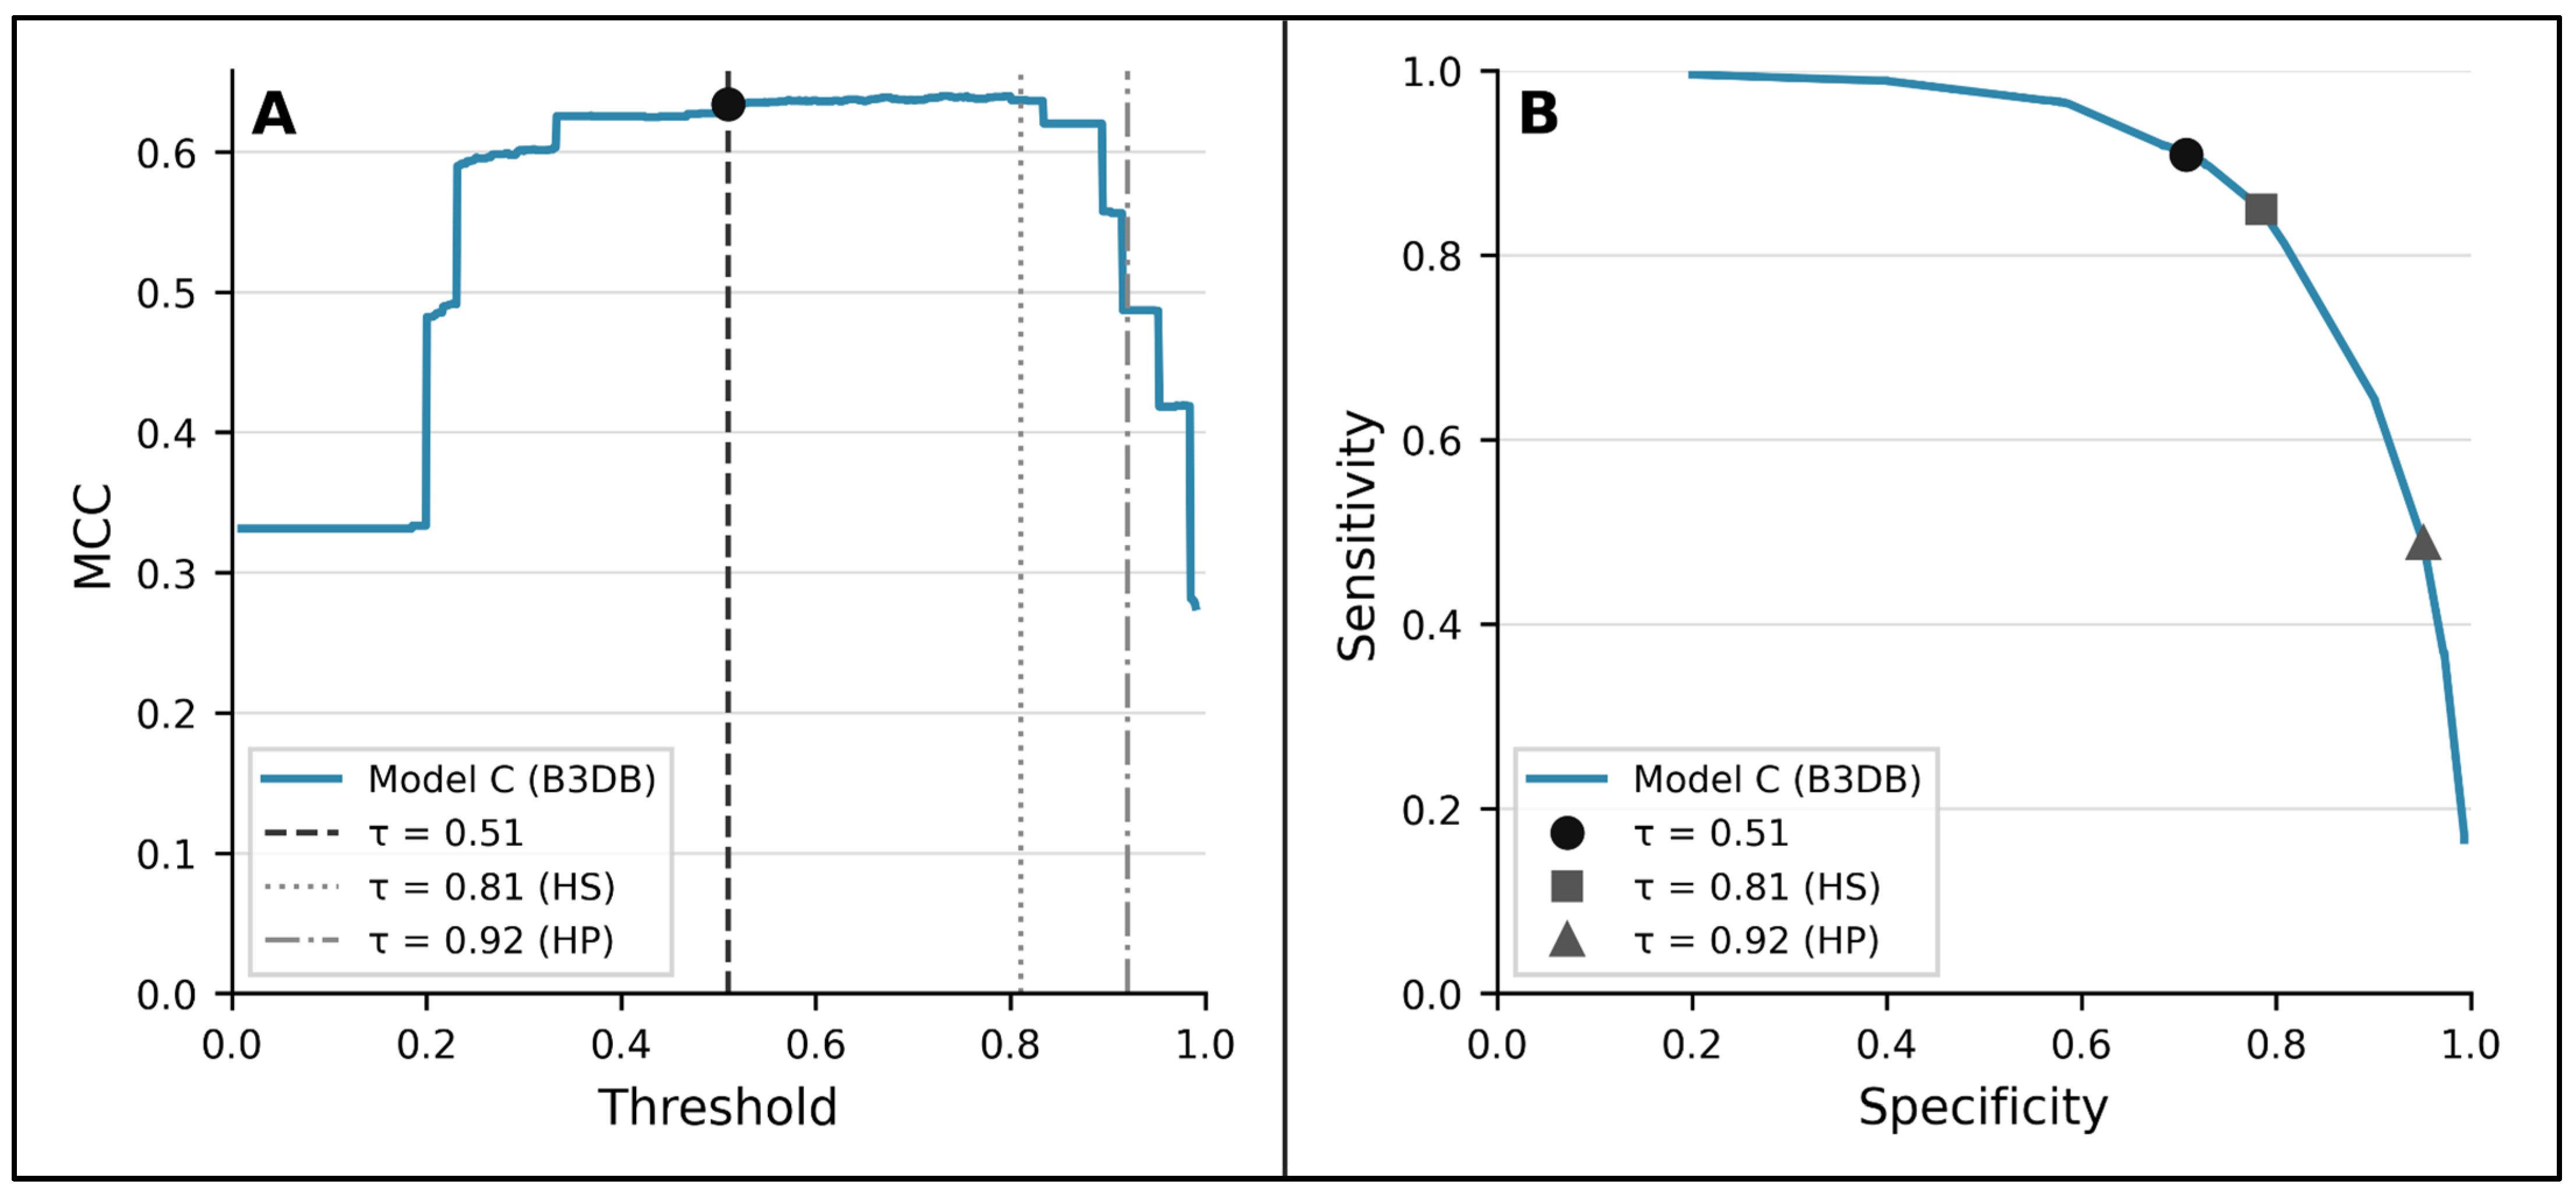
Threshold robustness analysis for Model C on the strict B3DB external set (n = 4080, 53.2% BBB+). (A) MCC against decision threshold, with the fixed primary threshold τ = 0.51 and the two-validation set operating points τ = 0.81 and τ = 0.92 marked. (B) Sensitivity and specificity trade-off curve, with the same three operating points marked. All thresholds were set on BBBP validation and applied with no change to B3DB. The threshold sweep is descriptive and was not used to set a new external operating point.
Figure 10.
Threshold robustness analysis for Model C on the strict B3DB external set (n = 4080, 53.2% BBB+). (A) MCC against decision threshold, with the fixed primary threshold τ = 0.51 and the two-validation set operating points τ = 0.81 and τ = 0.92 marked. (B) Sensitivity and specificity trade-off curve, with the same three operating points marked. All thresholds were set on BBBP validation and applied with no change to B3DB. The threshold sweep is descriptive and was not used to set a new external operating point.
Figure 11.
Probability calibration and score distributions for MechBBB (Model C) on the held-out BBBP test set and strict B3DB [
40]. (
A) Reliability diagram for the BBBP test set (
n = 293), comparing raw and calibrated predicted probabilities with observed BBB+ fractions. (
B) Distribution of calibrated probabilities for BBB+ and BBB− compounds on the BBBP test set, with the fixed primary threshold of 0.51 marked. (
C) Reliability diagram for strict B3DB (
n = 4080), using the isotonic mapping fitted on BBBP validation without refitting. (
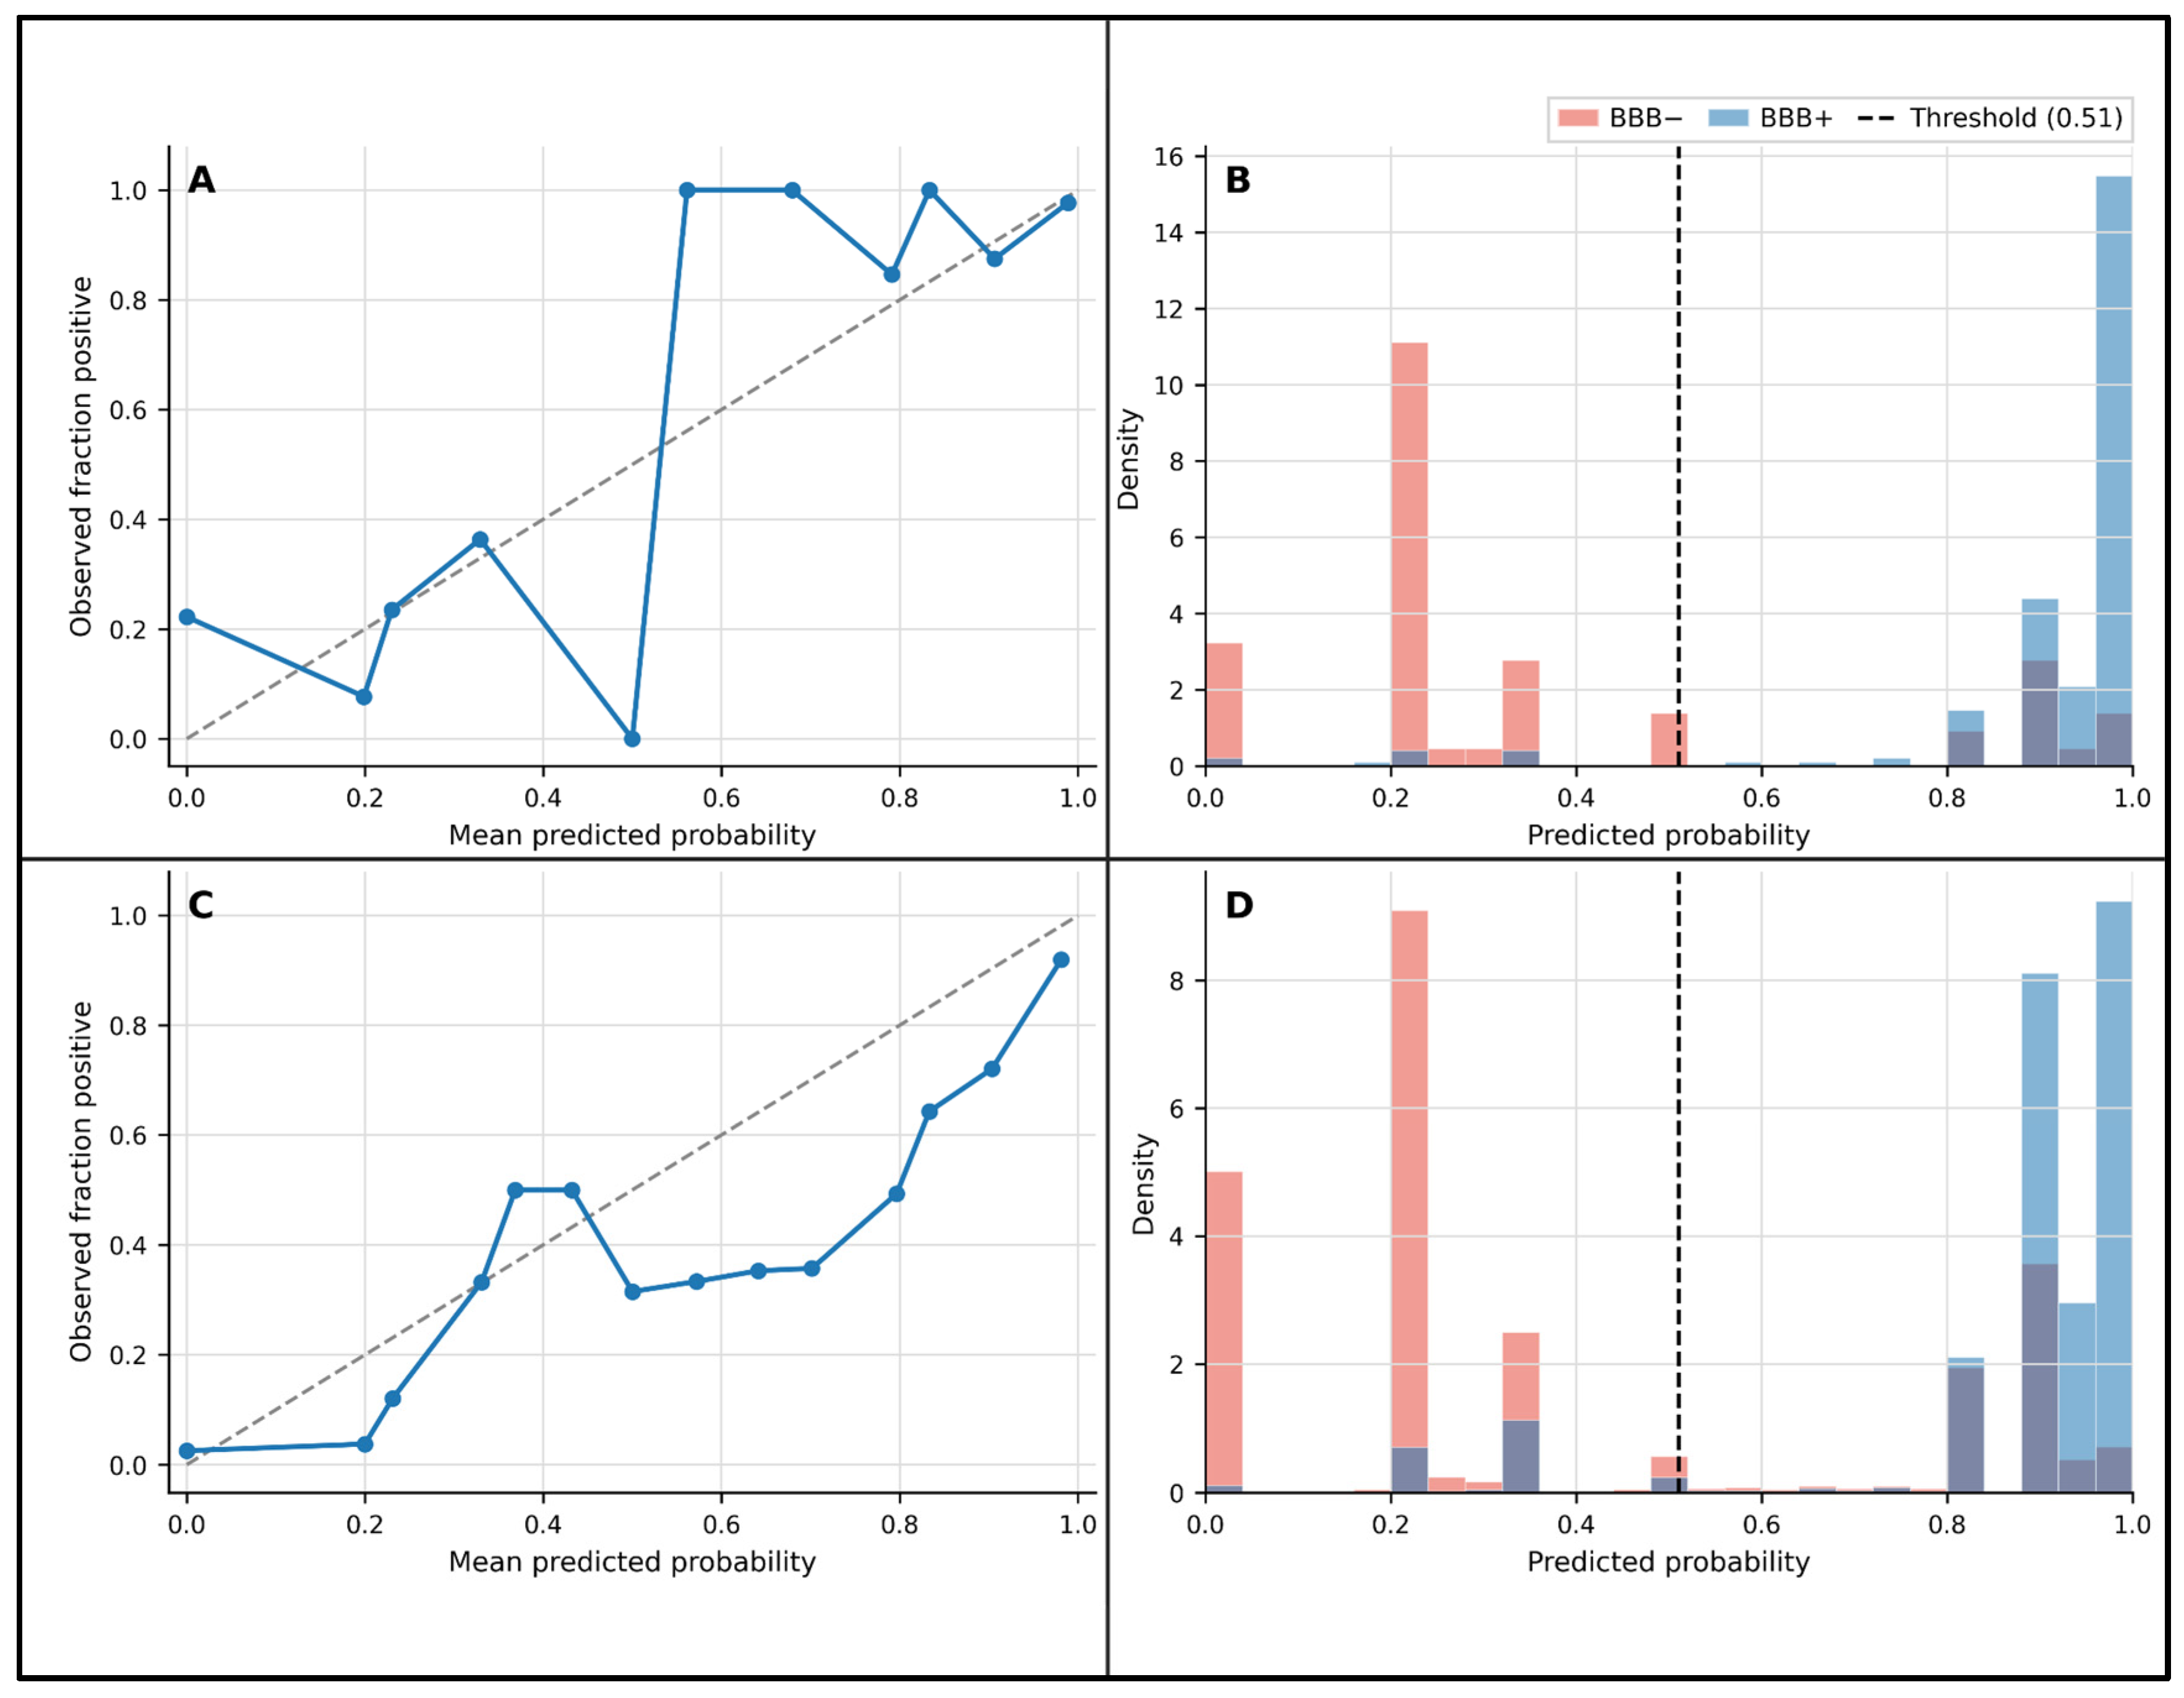
D) Distribution of calibrated probabilities for BBB+ and BBB− compounds on strict B3DB, with the same fixed threshold marked. For Model C, BBBP test ECE changed from 0.0720 to 0.0482 and Brier score from 0.0822 to 0.0710 after calibration. On strict B3DB, ECE changed from 0.0488 to 0.1201 and Brier score from 0.1312 to 0.1495. The reliability diagrams describe calibration on the evaluated populations and do not establish causal explanations for differences between datasets. The diagonal dashed line indicates perfect calibration.
Figure 11.
Probability calibration and score distributions for MechBBB (Model C) on the held-out BBBP test set and strict B3DB [
40]. (
A) Reliability diagram for the BBBP test set (
n = 293), comparing raw and calibrated predicted probabilities with observed BBB+ fractions. (
B) Distribution of calibrated probabilities for BBB+ and BBB− compounds on the BBBP test set, with the fixed primary threshold of 0.51 marked. (
C) Reliability diagram for strict B3DB (
n = 4080), using the isotonic mapping fitted on BBBP validation without refitting. (
D) Distribution of calibrated probabilities for BBB+ and BBB− compounds on strict B3DB, with the same fixed threshold marked. For Model C, BBBP test ECE changed from 0.0720 to 0.0482 and Brier score from 0.0822 to 0.0710 after calibration. On strict B3DB, ECE changed from 0.0488 to 0.1201 and Brier score from 0.1312 to 0.1495. The reliability diagrams describe calibration on the evaluated populations and do not establish causal explanations for differences between datasets. The diagonal dashed line indicates perfect calibration.

Figure 12.
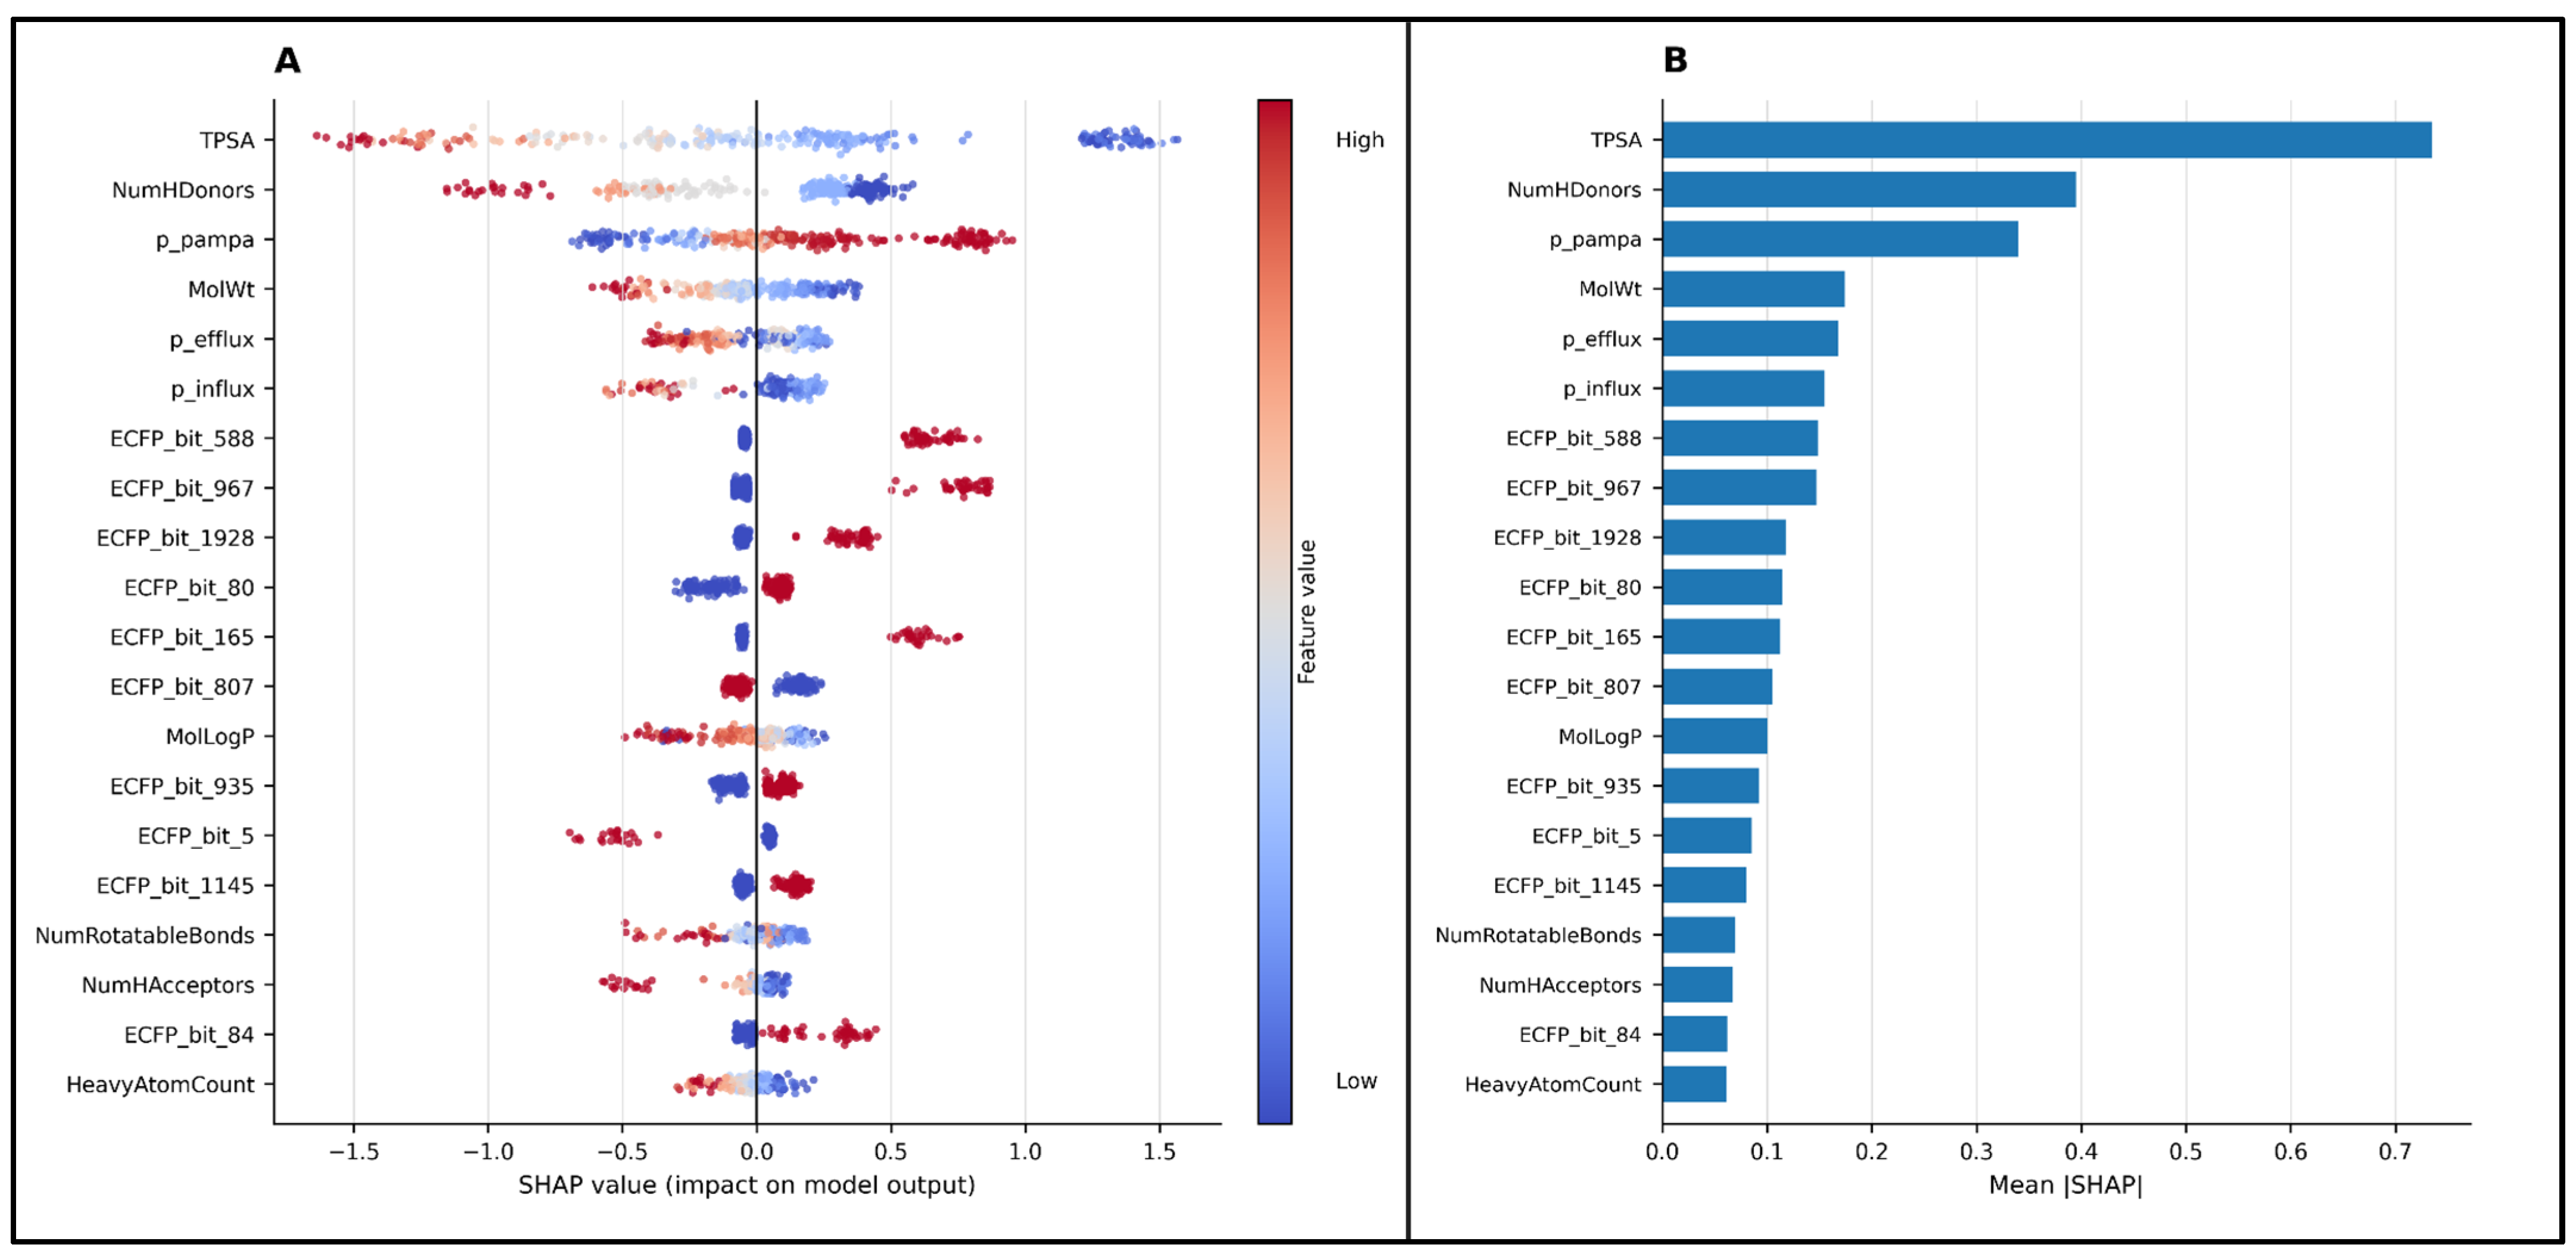
Global SHAP analysis of Model C on the held out BBBP test set [
26]. (
A) Beeswarm plot showing feature contributions across compounds. Color indicates feature value from low to high, and horizontal position indicates the SHAP contribution on the raw model margin scale. (
B) Feature importance ranked by mean absolute SHAP value across test compounds. SHAP values were calculated for each of the five frozen LightGBM models and averaged across models before summarization. The plots describe model attribution rather than biological causality or additive contributions to the final isotonic calibrated probability.
Figure 12.
Global SHAP analysis of Model C on the held out BBBP test set [
26]. (
A) Beeswarm plot showing feature contributions across compounds. Color indicates feature value from low to high, and horizontal position indicates the SHAP contribution on the raw model margin scale. (
B) Feature importance ranked by mean absolute SHAP value across test compounds. SHAP values were calculated for each of the five frozen LightGBM models and averaged across models before summarization. The plots describe model attribution rather than biological causality or additive contributions to the final isotonic calibrated probability.
Figure 13.
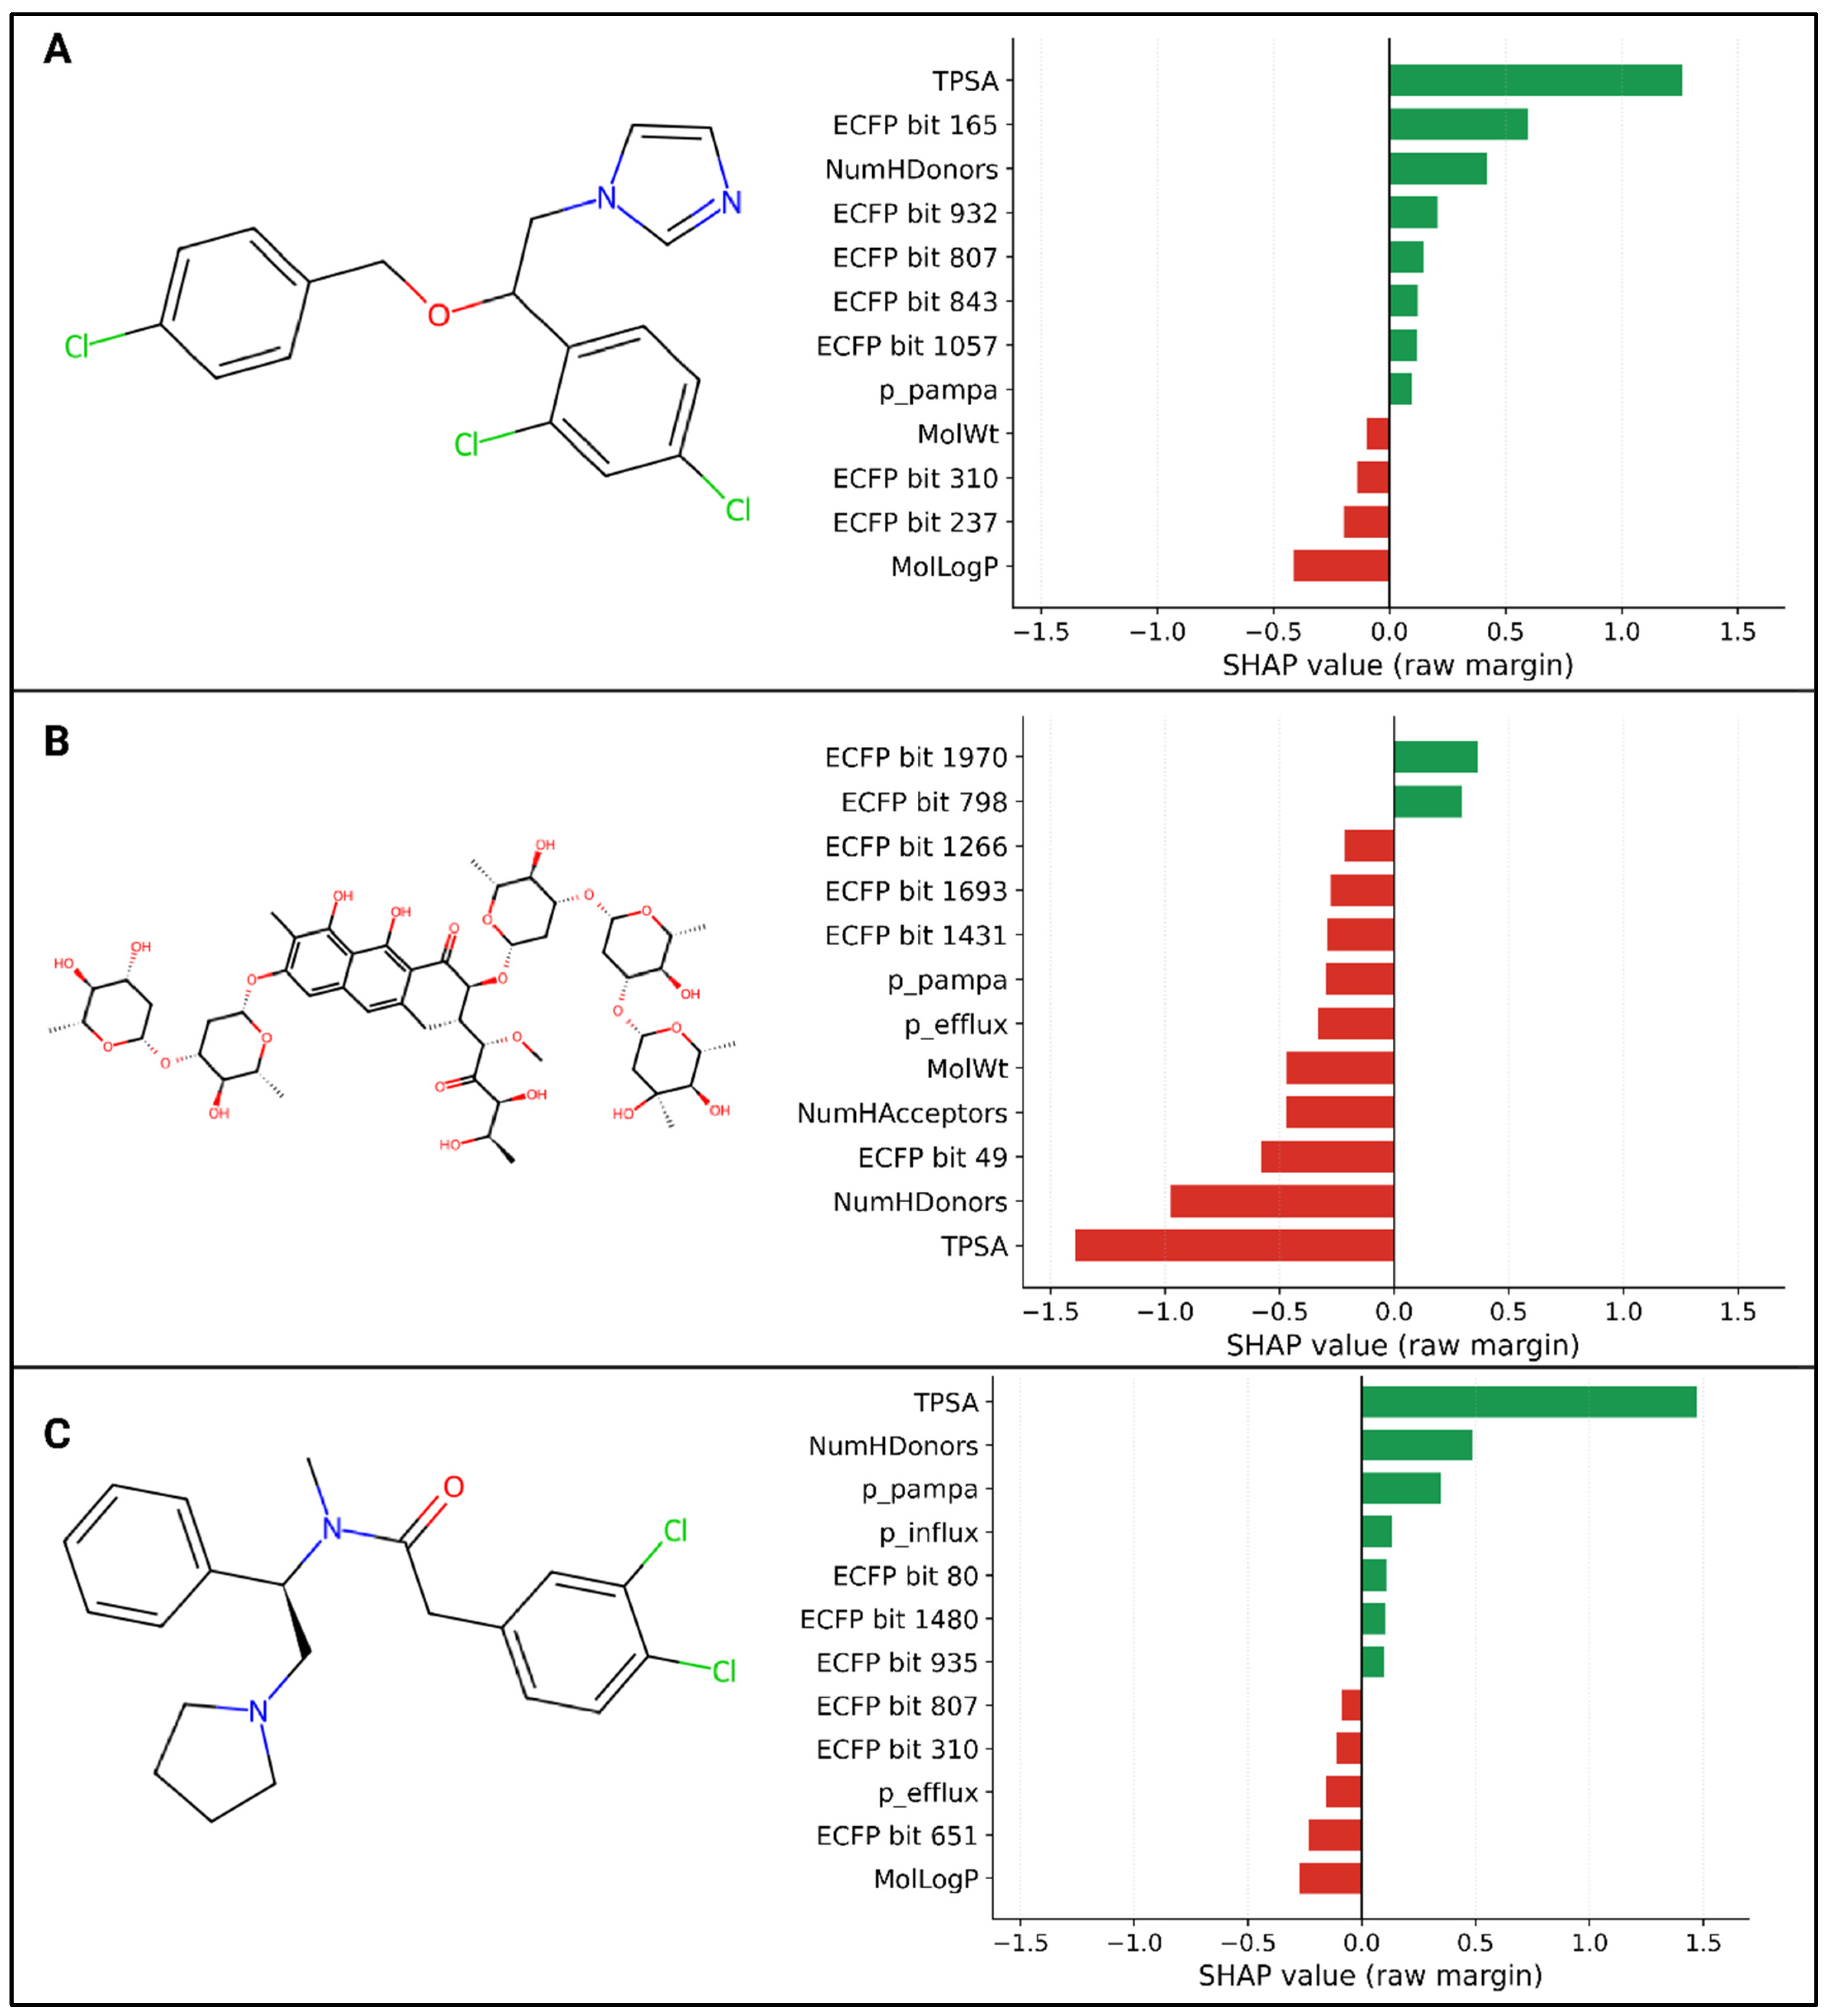
Individual compound SHAP explanations for three representative compounds from the held-out BBBP test set. (
A) False-positive compound with experimental label BBB− and predicted label BBB+ (calibrated P(BBB+) = 0.984). (
B) False negative compound with experimental label BBB+ and predicted label BBB− (calibrated P(BBB+) = 0.000). (
C) Correctly classified true positive compound with experimental and predicted labels BBB+ (calibrated P(BBB+) = 0.984). Molecular structures are shown on the left, and the largest positive and negative SHAP contributions are shown on the right. Green bars indicate contributions that increase the raw Model C margin toward BBB+, whereas red bars indicate contributions that decrease the raw margin. SHAP values were calculated for each frozen ensemble member and averaged across the five models [
26]. These values explain the raw model margin rather than the isotonic calibrated probability.
Figure 13.
Individual compound SHAP explanations for three representative compounds from the held-out BBBP test set. (
A) False-positive compound with experimental label BBB− and predicted label BBB+ (calibrated P(BBB+) = 0.984). (
B) False negative compound with experimental label BBB+ and predicted label BBB− (calibrated P(BBB+) = 0.000). (
C) Correctly classified true positive compound with experimental and predicted labels BBB+ (calibrated P(BBB+) = 0.984). Molecular structures are shown on the left, and the largest positive and negative SHAP contributions are shown on the right. Green bars indicate contributions that increase the raw Model C margin toward BBB+, whereas red bars indicate contributions that decrease the raw margin. SHAP values were calculated for each frozen ensemble member and averaged across the five models [
26]. These values explain the raw model margin rather than the isotonic calibrated probability.
Figure 14.
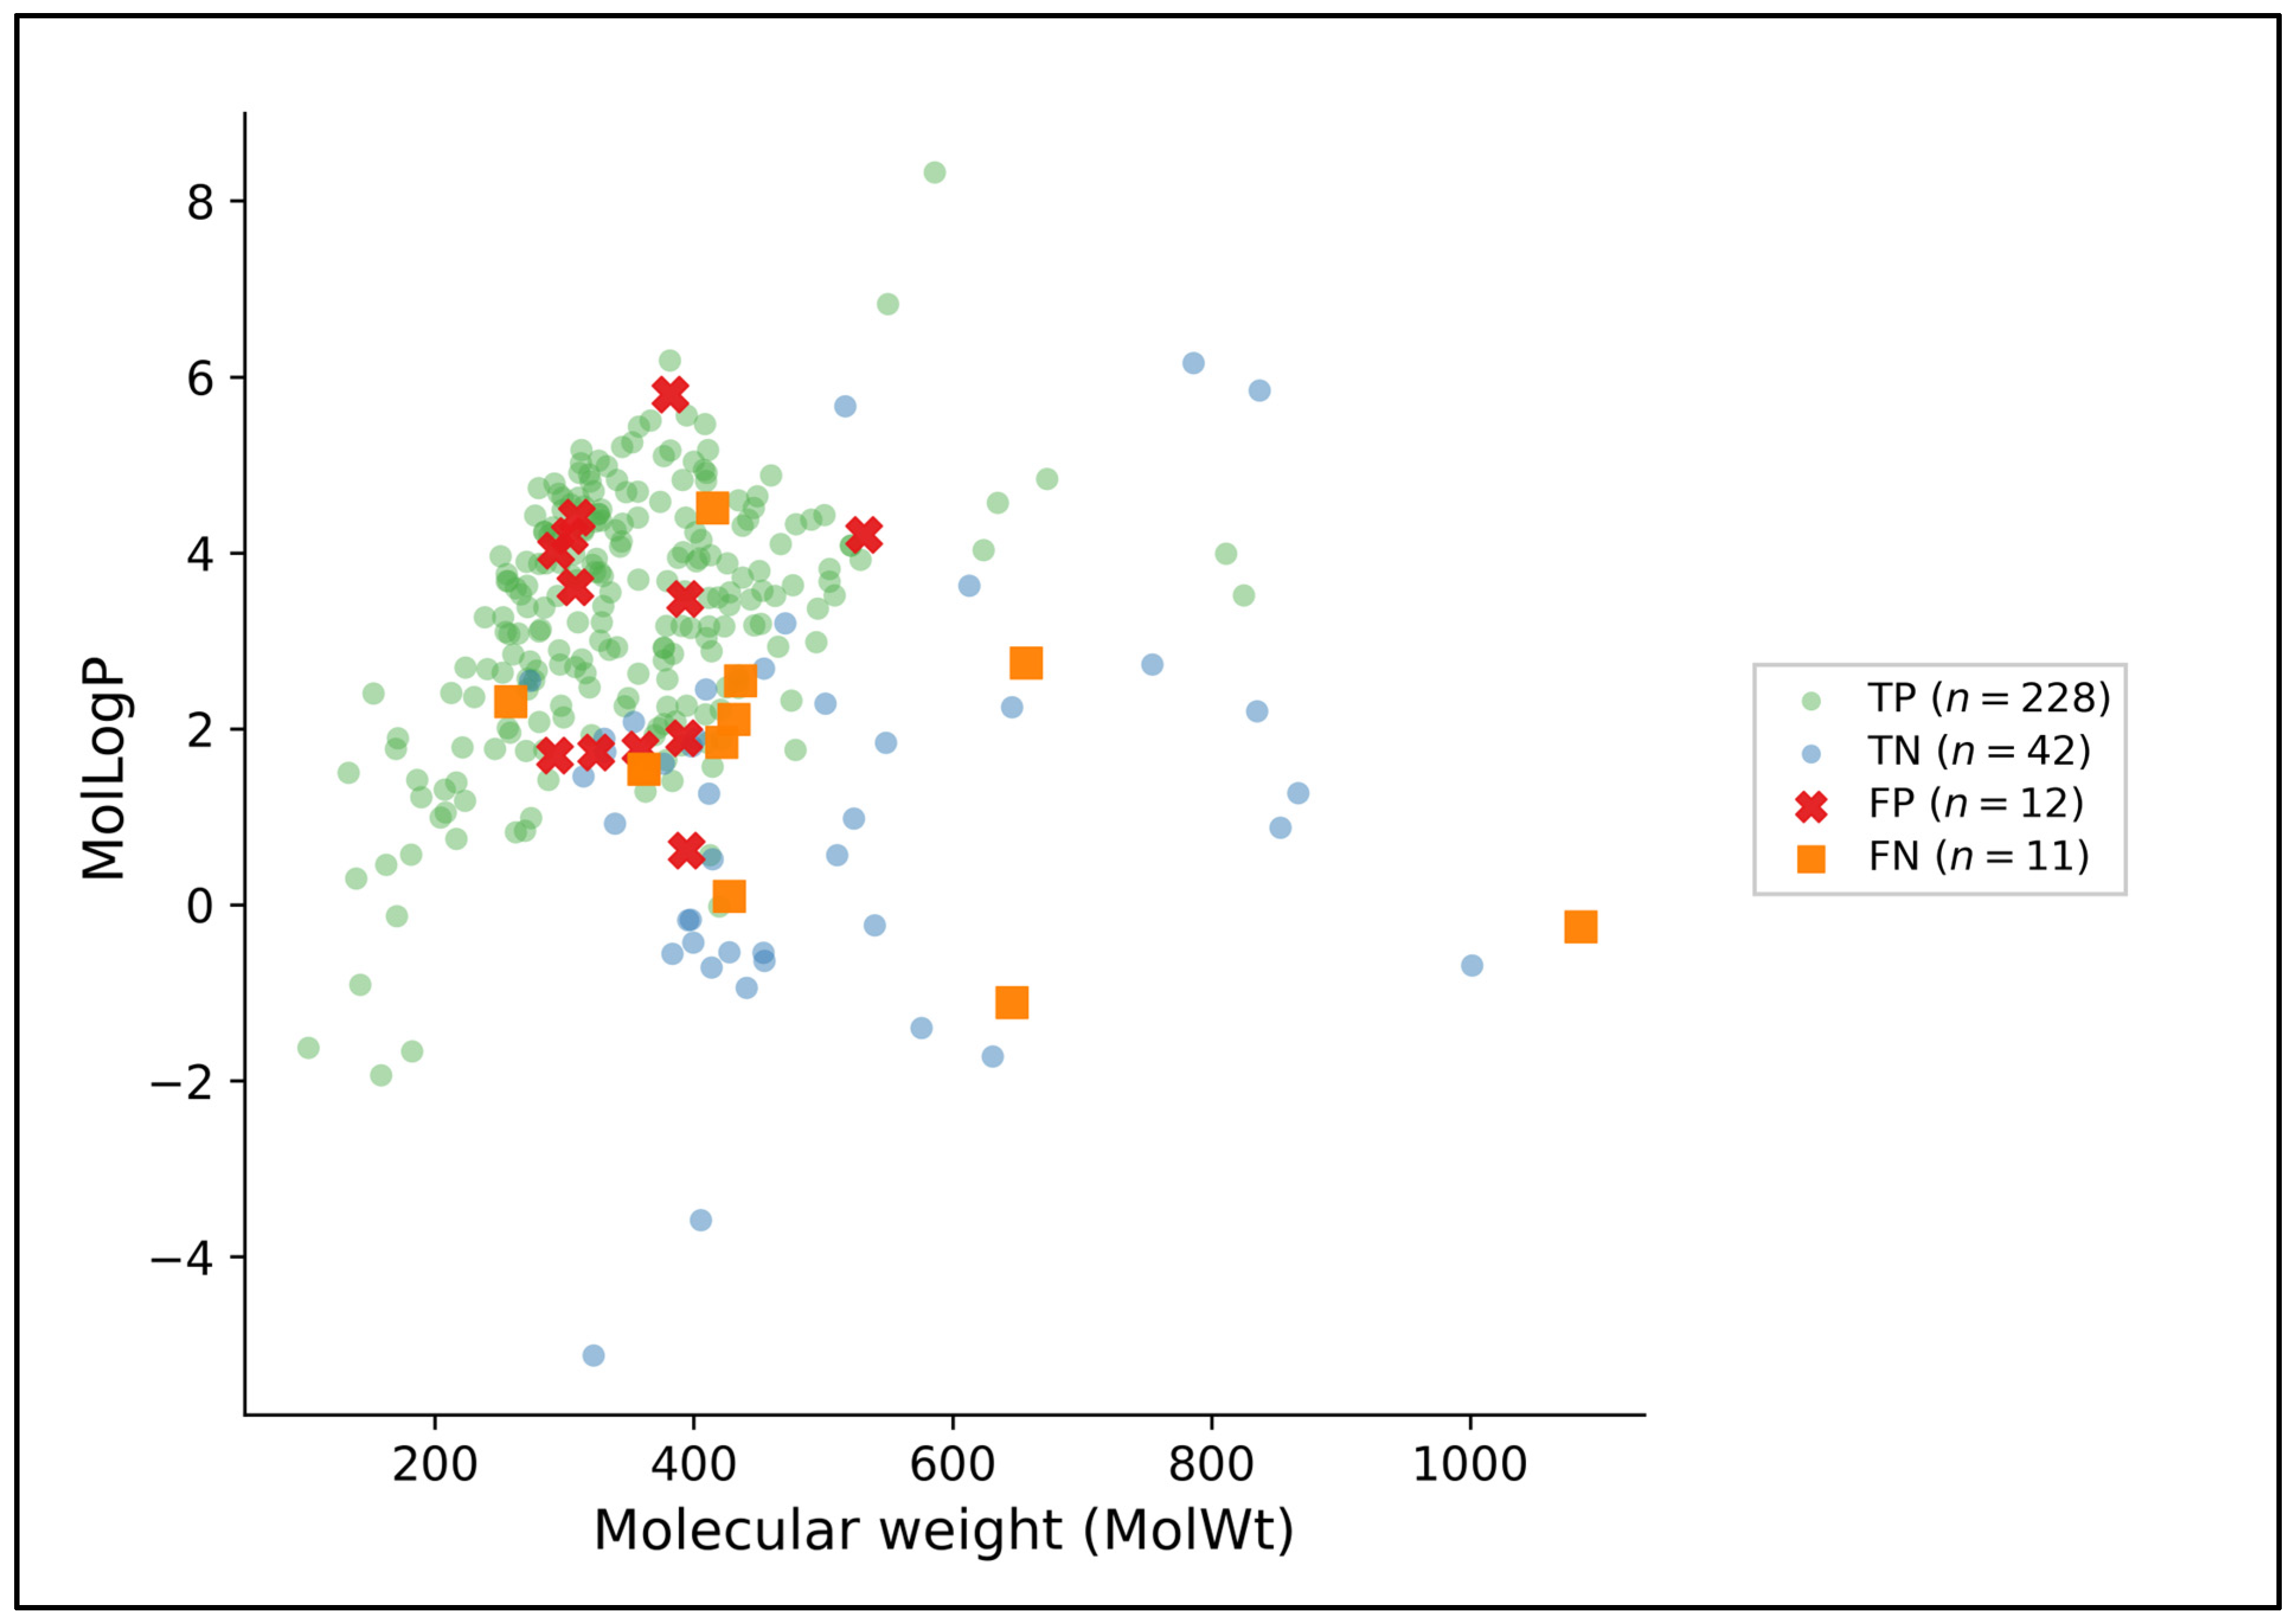
Error localization for Model C on the held-out BBBP test set (n = 293) in the molecular weight and MolLogP plane. True positives (TP, n = 228), true negatives (TN, n = 42), false positives (FP, n = 12), and false negatives (FN, n = 11) are shown using distinct markers. Classification outcomes were determined from calibrated probabilities using the fixed validation-selected threshold of 0.51. Molecular weight and MolLogP are shown only as descriptive reference properties. Proximity between compounds in this two-dimensional plot does not establish structural similarity or the biological cause of an error.
Figure 14.
Error localization for Model C on the held-out BBBP test set (n = 293) in the molecular weight and MolLogP plane. True positives (TP, n = 228), true negatives (TN, n = 42), false positives (FP, n = 12), and false negatives (FN, n = 11) are shown using distinct markers. Classification outcomes were determined from calibrated probabilities using the fixed validation-selected threshold of 0.51. Molecular weight and MolLogP are shown only as descriptive reference properties. Proximity between compounds in this two-dimensional plot does not establish structural similarity or the biological cause of an error.
Figure 15.
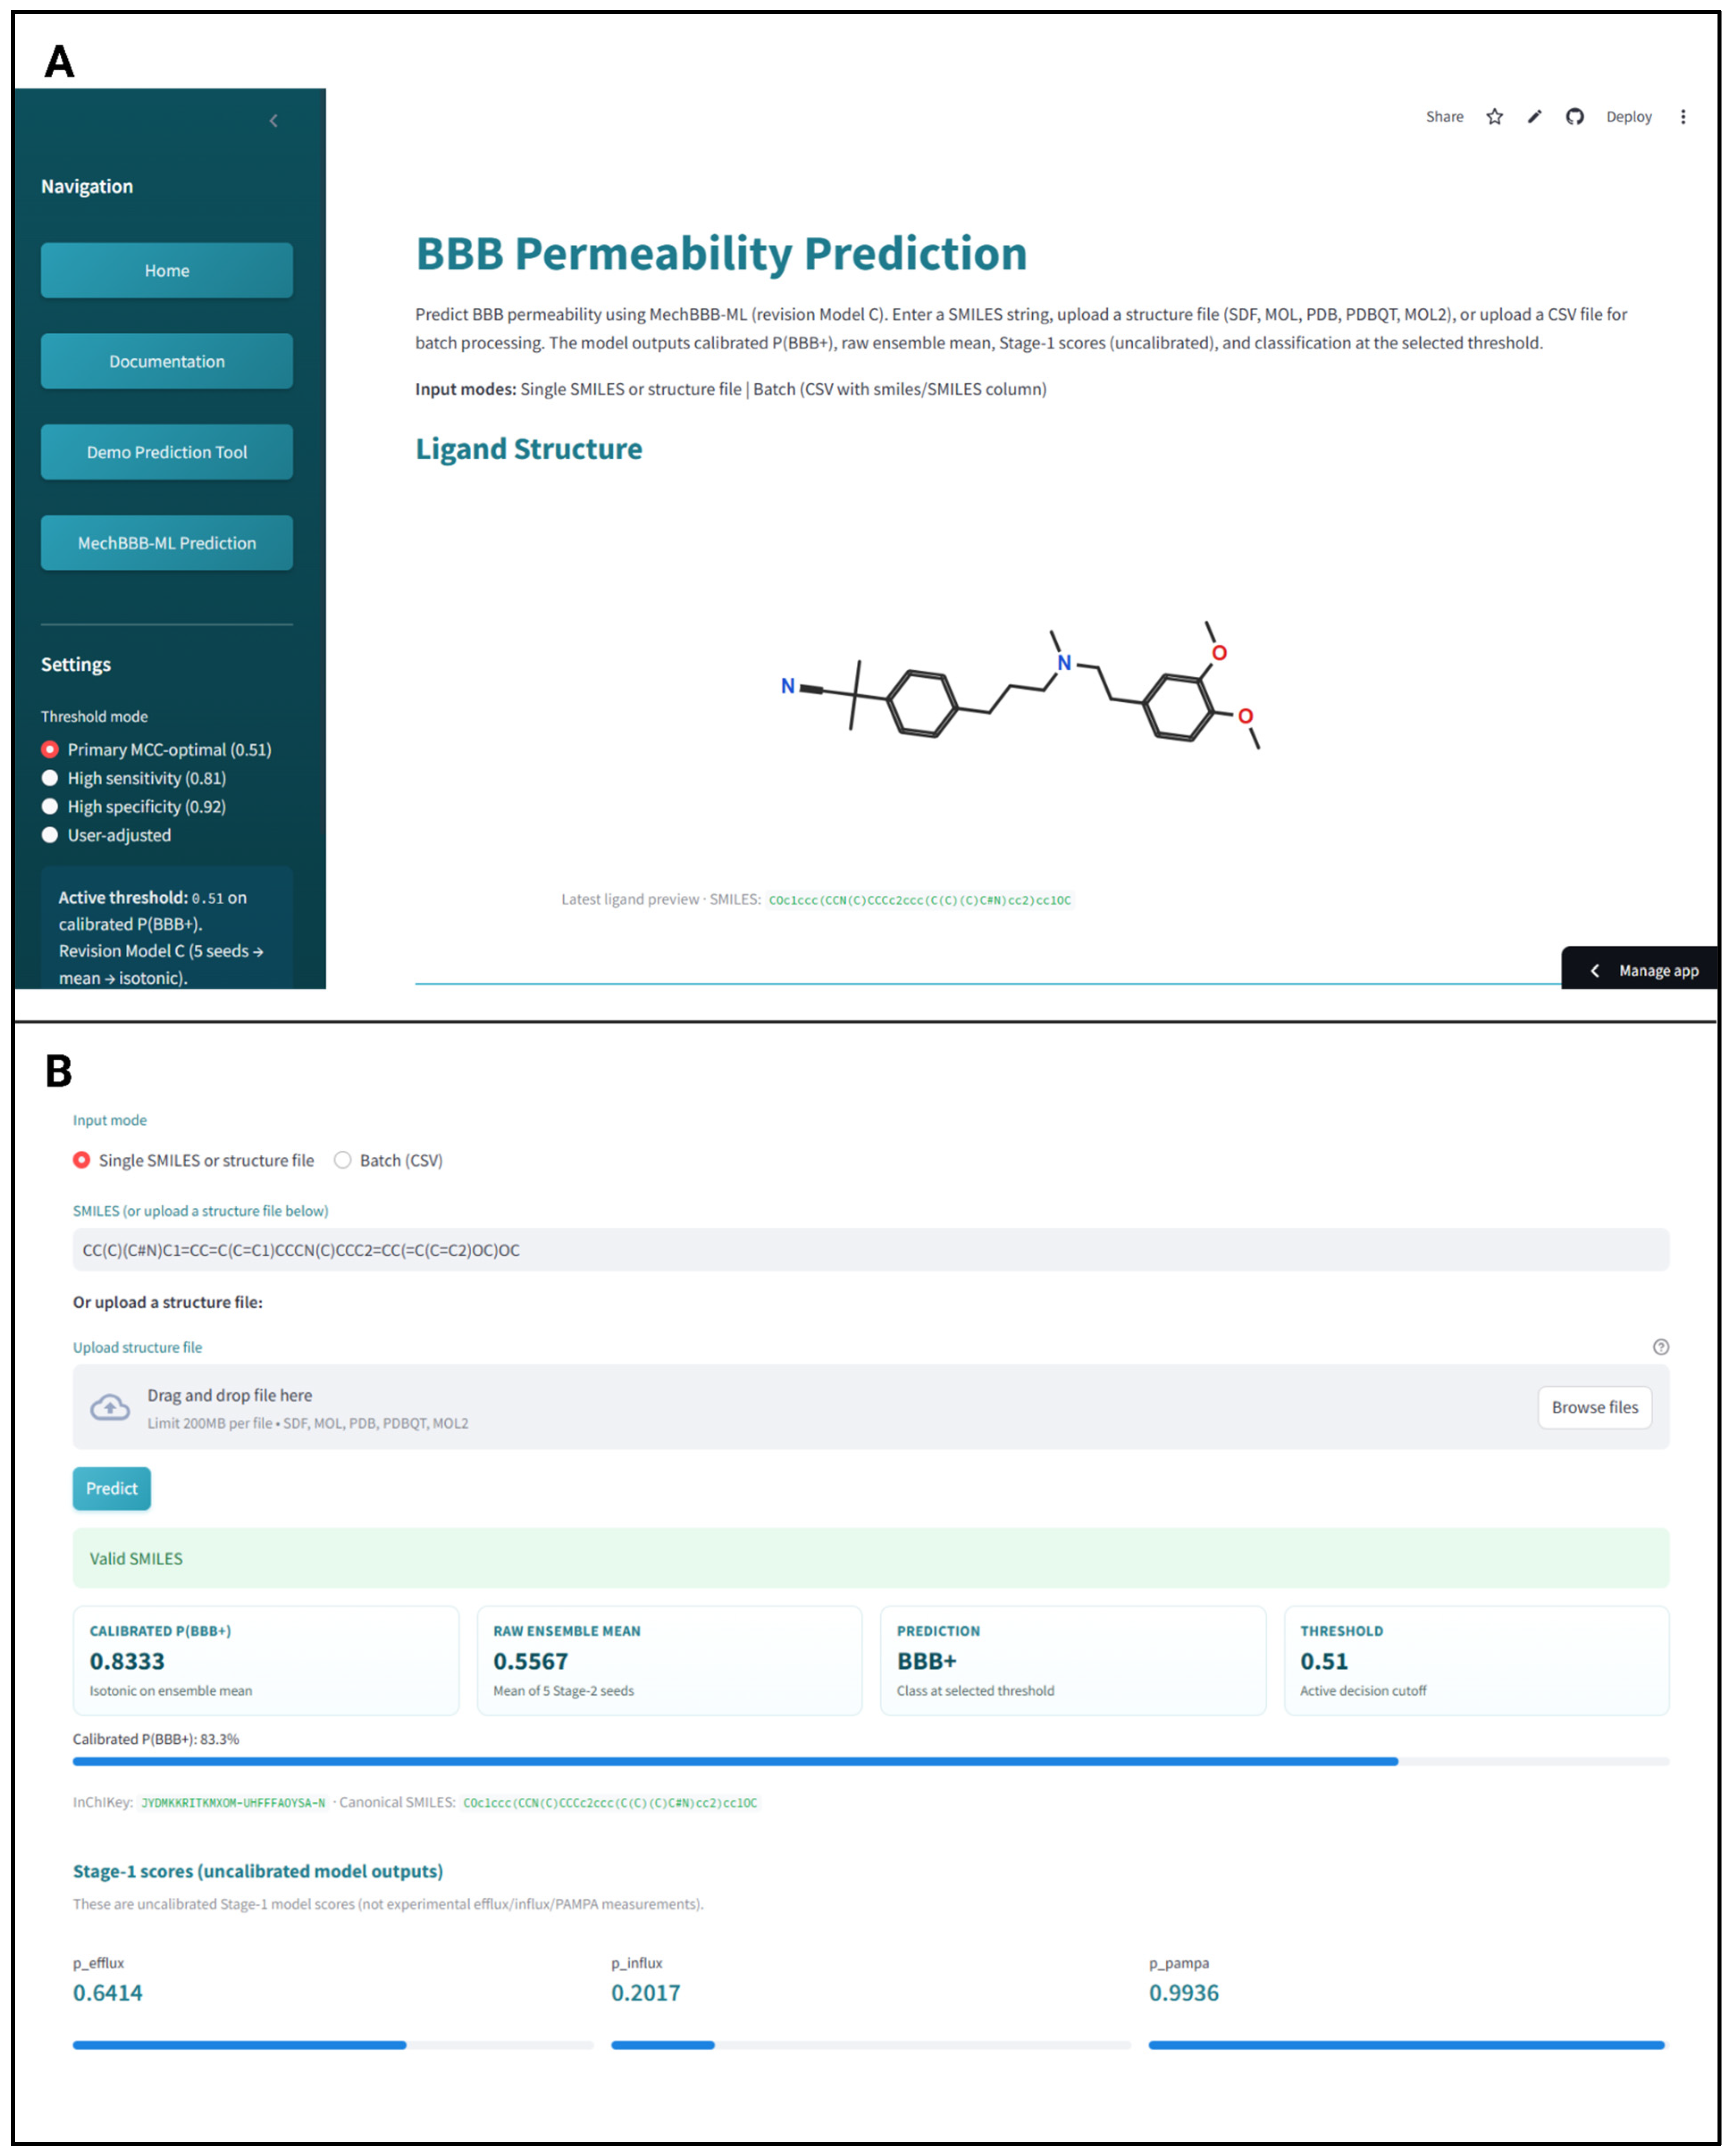
MechBBB interface illustrated with verapamil. (A) Home page showing the molecular structure, canonical SMILES, navigation, and threshold controls. (B) Prediction page showing the calibrated P(BBB+), raw ensemble mean, classification at the selected threshold, and the three uncalibrated Stage 1 scores. The interface supports single molecule and batch prediction.
Figure 15.
MechBBB interface illustrated with verapamil. (A) Home page showing the molecular structure, canonical SMILES, navigation, and threshold controls. (B) Prediction page showing the calibrated P(BBB+), raw ensemble mean, classification at the selected threshold, and the three uncalibrated Stage 1 scores. The interface supports single molecule and batch prediction.
Table 1.
Dataset sizes and class balance. MoleculeNet BBBP was divided into training, validation, and test partitions using Murcko scaffold grouping. The strict B3DB external set was constructed by removing InChIKey and nonempty Murcko scaffold overlap against all BBBP partitions. BBB+ fraction denotes the proportion of compounds labeled BBB+.
Table 1.
Dataset sizes and class balance. MoleculeNet BBBP was divided into training, validation, and test partitions using Murcko scaffold grouping. The strict B3DB external set was constructed by removing InChIKey and nonempty Murcko scaffold overlap against all BBBP partitions. BBB+ fraction denotes the proportion of compounds labeled BBB+.
| Dataset | Partition | N | BBB+ | BBB− | BBB+ Fraction |
|---|
| BBBP | Training | 1365 | 1014 | 351 | 0.743 |
| BBBP | Validation | 292 | 238 | 54 | 0.815 |
| BBBP | Test | 293 | 239 | 54 | 0.816 |
| B3DB | Before overlap filtering | 7804 | 4955 | 2849 | 0.635 |
| B3DB | Strict external set | 4080 | 2170 | 1910 | 0.532 |
Table 2.
Model performance on the held out BBBP scaffold test set (
n = 293). Model A uses ECFP4 fingerprints, Model B adds ten physicochemical descriptors, and Model C adds the three Stage 1 scores to Model B. AUROC and AUPRC were calculated from raw ensemble mean scores. MCC and balanced accuracy were calculated from calibrated probabilities at each model’s validation selected threshold. Values in brackets are 95% class stratified bootstrap confidence intervals [
38]. The bootstrap procedure is described in
Section 3.8.1. Complete BBBP test metrics are provided in
Supplementary Table S9.
Table 2.
Model performance on the held out BBBP scaffold test set (
n = 293). Model A uses ECFP4 fingerprints, Model B adds ten physicochemical descriptors, and Model C adds the three Stage 1 scores to Model B. AUROC and AUPRC were calculated from raw ensemble mean scores. MCC and balanced accuracy were calculated from calibrated probabilities at each model’s validation selected threshold. Values in brackets are 95% class stratified bootstrap confidence intervals [
38]. The bootstrap procedure is described in
Section 3.8.1. Complete BBBP test metrics are provided in
Supplementary Table S9.
| Measure | Model A | Model B | Model C |
|---|
| Threshold | 0.58 | 0.42 | 0.51 |
| AUROC | 0.916 [0.862–0.959] | 0.922 [0.879–0.959] | 0.932 [0.895–0.963] |
| AUPRC | 0.974 [0.954–0.990] | 0.980 [0.967–0.990] | 0.983 [0.974–0.991] |
| MCC | 0.687 [0.579–0.793] | 0.660 [0.539–0.767] | 0.737 [0.632–0.834] |
| Balanced accuracy | 0.848 [0.786–0.905] | 0.817 [0.751–0.878] | 0.866 [0.805–0.921] |
Table 3.
Model C performance at three fixed operating points on the held-out BBBP scaffold test set. Thresholds were selected using calibrated probabilities on the BBBP validation set. The primary threshold maximized MCC. The high sensitivity threshold maximized specificity subject to validation sensitivity ≥ 0.90, and the high specificity threshold maximized sensitivity subject to validation specificity ≥ 0.90. Thresholds were applied unchanged to the test set. The reported sensitivity, specificity, and MCC are test set results.
Table 3.
Model C performance at three fixed operating points on the held-out BBBP scaffold test set. Thresholds were selected using calibrated probabilities on the BBBP validation set. The primary threshold maximized MCC. The high sensitivity threshold maximized specificity subject to validation sensitivity ≥ 0.90, and the high specificity threshold maximized sensitivity subject to validation specificity ≥ 0.90. Thresholds were applied unchanged to the test set. The reported sensitivity, specificity, and MCC are test set results.
| Operating Point | Threshold | Sensitivity | Specificity | MCC |
|---|
| MCC optimal | 0.51 | 0.954 | 0.778 | 0.737 |
| High Sensitivity | 0.81 | 0.900 | 0.815 | 0.656 |
| High Specificity | 0.92 | 0.703 | 0.926 | 0.495 |
Table 4.
Stage 1 performance under fair random and Murcko scaffold-based testing. Both evaluations used the corrected leak safe datasets and matched training procedures. Δ values were calculated as scaffold minus random performance. The holdouts contained different compounds, so no paired statistical test was performed. AUPRC differences should be interpreted alongside positive class prevalence, particularly for the influx task [
32].
Table 4.
Stage 1 performance under fair random and Murcko scaffold-based testing. Both evaluations used the corrected leak safe datasets and matched training procedures. Δ values were calculated as scaffold minus random performance. The holdouts contained different compounds, so no paired statistical test was performed. AUPRC differences should be interpreted alongside positive class prevalence, particularly for the influx task [
32].
| Stage 1 Task | N | Metric | Random | Scaffold | Δ |
|---|
| Efflux | 2236 | AUROC | 0.8182 | 0.7639 | −0.0543 |
| Efflux | 2236 | AUPRC | 0.8743 | 0.8284 | −0.0459 |
| Influx | 807 | AUROC | 0.9463 | 0.9369 | −0.0094 |
| Influx | 807 | AUPRC | 0.8539 | 0.9079 | +0.0540 |
| PAMPA | 1442 | AUROC | 0.8998 | 0.9006 | +0.0008 |
| PAMPA | 1442 | AUPRC | 0.9697 | 0.9665 | −0.0032 |
Table 5.
Five-fold Murcko scaffold-grouped cross-validation on the combined BBBP training and validation partitions (n = 1657). Values are mean ± standard deviation across folds. Model A uses ECFP4 fingerprints, Model B adds ten physicochemical descriptors, and Model C adds the three Stage 1 scores to Model B. The held out BBBP test set was excluded. This analysis assessed ranking stability using locked hyperparameters and was not used for further model selection.
Table 5.
Five-fold Murcko scaffold-grouped cross-validation on the combined BBBP training and validation partitions (n = 1657). Values are mean ± standard deviation across folds. Model A uses ECFP4 fingerprints, Model B adds ten physicochemical descriptors, and Model C adds the three Stage 1 scores to Model B. The held out BBBP test set was excluded. This analysis assessed ranking stability using locked hyperparameters and was not used for further model selection.
| Model | AUROC | AUPRC |
|---|
| Model A | 0.874 ± 0.064 | 0.948 ± 0.027 |
| Model B | 0.892 ± 0.043 | 0.958 ± 0.013 |
| Model C | 0.890 ± 0.043 | 0.956 ± 0.014 |
Table 6.
External validation results on the strict B3DB set (n = 4080) after InChIKey and nonempty Murcko scaffold overlap removal against the full BBBP dataset. Model predictions were made without retraining on B3DB. AUROC and AUPRC were computed from raw five seed mean scores before isotonic adjustment. MCC and balanced accuracy were computed from adjusted scores at the fixed validation set thresholds. Bootstrap 95% confidence intervals are shown in brackets.
Table 6.
External validation results on the strict B3DB set (n = 4080) after InChIKey and nonempty Murcko scaffold overlap removal against the full BBBP dataset. Model predictions were made without retraining on B3DB. AUROC and AUPRC were computed from raw five seed mean scores before isotonic adjustment. MCC and balanced accuracy were computed from adjusted scores at the fixed validation set thresholds. Bootstrap 95% confidence intervals are shown in brackets.
| Model | Threshold | AUROC | AUPRC | MCC | Balanced Accuracy |
|---|
| Model A | 0.58 | 0.883 [0.873–0.893] | 0.887 [0.876–0.897] | 0.595 [0.571–0.620] | 0.794 [0.782–0.807] |
| Model B | 0.42 | 0.895 [0.885–0.904] | 0.894 [0.882–0.905] | 0.630 [0.608–0.652] | 0.803 [0.792–0.815] |
| Model C | 0.51 | 0.894 [0.884–0.904] | 0.893 [0.881–0.904] | 0.634 [0.611–0.656] | 0.808 [0.797–0.820] |
Table 7.
Physicochemical properties and Stage 1 scores by Model C prediction outcome on the held out BBBP test set at threshold 0.51. Except for N, values are median (interquartile range). MolWt is expressed in Da and TPSA in Å2. All listed variables were available for every compound. TP, true positive; TN, true negative; FP, false positive; FN, false negative. Stage 1 scores are learned transport-related outputs rather than experimental measurements.
Table 7.
Physicochemical properties and Stage 1 scores by Model C prediction outcome on the held out BBBP test set at threshold 0.51. Except for N, values are median (interquartile range). MolWt is expressed in Da and TPSA in Å2. All listed variables were available for every compound. TP, true positive; TN, true negative; FP, false positive; FN, false negative. Stage 1 scores are learned transport-related outputs rather than experimental measurements.
| Variable | TP | TN | FP | FN |
|---|
| N | 228 | 42 | 12 | 11 |
| MolWt | 335.01 (129.09) | 446.98 (171.16) | 341.42 (85.47) | 427.46 (152.83) |
| MolLogP | 3.513 (1.855) | 1.268 (2.746) | 3.545 (2.440) | 1.847 (1.608) |
| TPSA | 47.06 (48.64) | 156.26 (80.30) | 68.29 (39.29) | 112.74 (68.96) |
| p_efflux | 0.384 (0.394) | 0.614 (0.278) | 0.286 (0.344) | 0.746 (0.221) |
| p_influx | 0.080 (0.133) | 0.151 (0.287) | 0.037 (0.120) | 0.113 (0.500) |
| p_pampa | 0.944 (0.277) | 0.097 (0.334) | 0.538 (0.841) | 0.202 (0.377) |
Table 8.
Blood–brain barrier classification performance of MechBBB Model C and published models under scaffold-based evaluation. Model C values are from the present study, covering the held out BBBP scaffold test set (
n = 293) and the strict external B3DB set (
n = 4080). The three published BBBP scaffold AUROC values are reported in Table 1 of Qin et al. [
52]. References [
15,
53] identify the original FP-GNN and Chemprop methods. Published studies used an 8:1:1 scaffold split, whereas the present study used 70:15:15. A dash indicates a metric not reported in the cited source. Cross-study values provide context and do not establish a direct ranking.
Table 8.
Blood–brain barrier classification performance of MechBBB Model C and published models under scaffold-based evaluation. Model C values are from the present study, covering the held out BBBP scaffold test set (
n = 293) and the strict external B3DB set (
n = 4080). The three published BBBP scaffold AUROC values are reported in Table 1 of Qin et al. [
52]. References [
15,
53] identify the original FP-GNN and Chemprop methods. Published studies used an 8:1:1 scaffold split, whereas the present study used 70:15:15. A dash indicates a metric not reported in the cited source. Cross-study values provide context and do not establish a direct ranking.
| Method | Reference | Dataset | Split | AUROC | Accuracy | F1 |
|---|
| Model C (ours) | This work | BBBP | Scaffold 70:15:15 | 0.932 | 0.922 | 0.952 |
| Model C (ours) | This work | B3DB external | External overlap controlled, n = 4080 | 0.894 | 0.815 | 0.839 |
| MoleculeFormer | [52] | BBBP | Scaffold 8:1:1 | 0.924 | - | - |
| FP-GNN | [52,53] | BBBP | Scaffold 8:1:1 | 0.916 | - | - |
| Chemprop (optimized) | [15,52] | BBBP | Scaffold 8:1:1 | 0.886 | - | - |
Table 9.
Head-to-head comparison of MechBBB Model C and the official SwissADME BOILED-Egg method on the chemically verified matched strict B3DB subset (
n = 4043; BBB+
n = 2166; BBB−
n = 1877) [
54,
55]. Model C used the frozen calibrated predictions and validation selected threshold of 0.51. BOILED-Egg was evaluated using its official exported binary BBB classification. AUROC and AUPRC are not reported for BOILED-Egg because the exported output is binary rather than a continuous prediction score.
Table 9.
Head-to-head comparison of MechBBB Model C and the official SwissADME BOILED-Egg method on the chemically verified matched strict B3DB subset (
n = 4043; BBB+
n = 2166; BBB−
n = 1877) [
54,
55]. Model C used the frozen calibrated predictions and validation selected threshold of 0.51. BOILED-Egg was evaluated using its official exported binary BBB classification. AUROC and AUPRC are not reported for BOILED-Egg because the exported output is binary rather than a continuous prediction score.
| Method | N | Accuracy | Balanced Accuracy | Sensitivity | Specificity | MCC |
|---|
| MechBBB | 4043 | 0.814 | 0.806 | 0.910 | 0.703 | 0.631 |
| SwissADME BOILED-Egg | 4043 | 0.682 | 0.693 | 0.541 | 0.845 | 0.401 |