
Repurposing Nirmatrelvir for Hepatocellular Carcinoma: Network Pharmacology and Molecular Dynamics Simulations Identify HDAC3 as a Key Molecular Target

 ,
,  , ,
, ,  and
and 
Abstract
1. Introduction
2. Results and Discussion
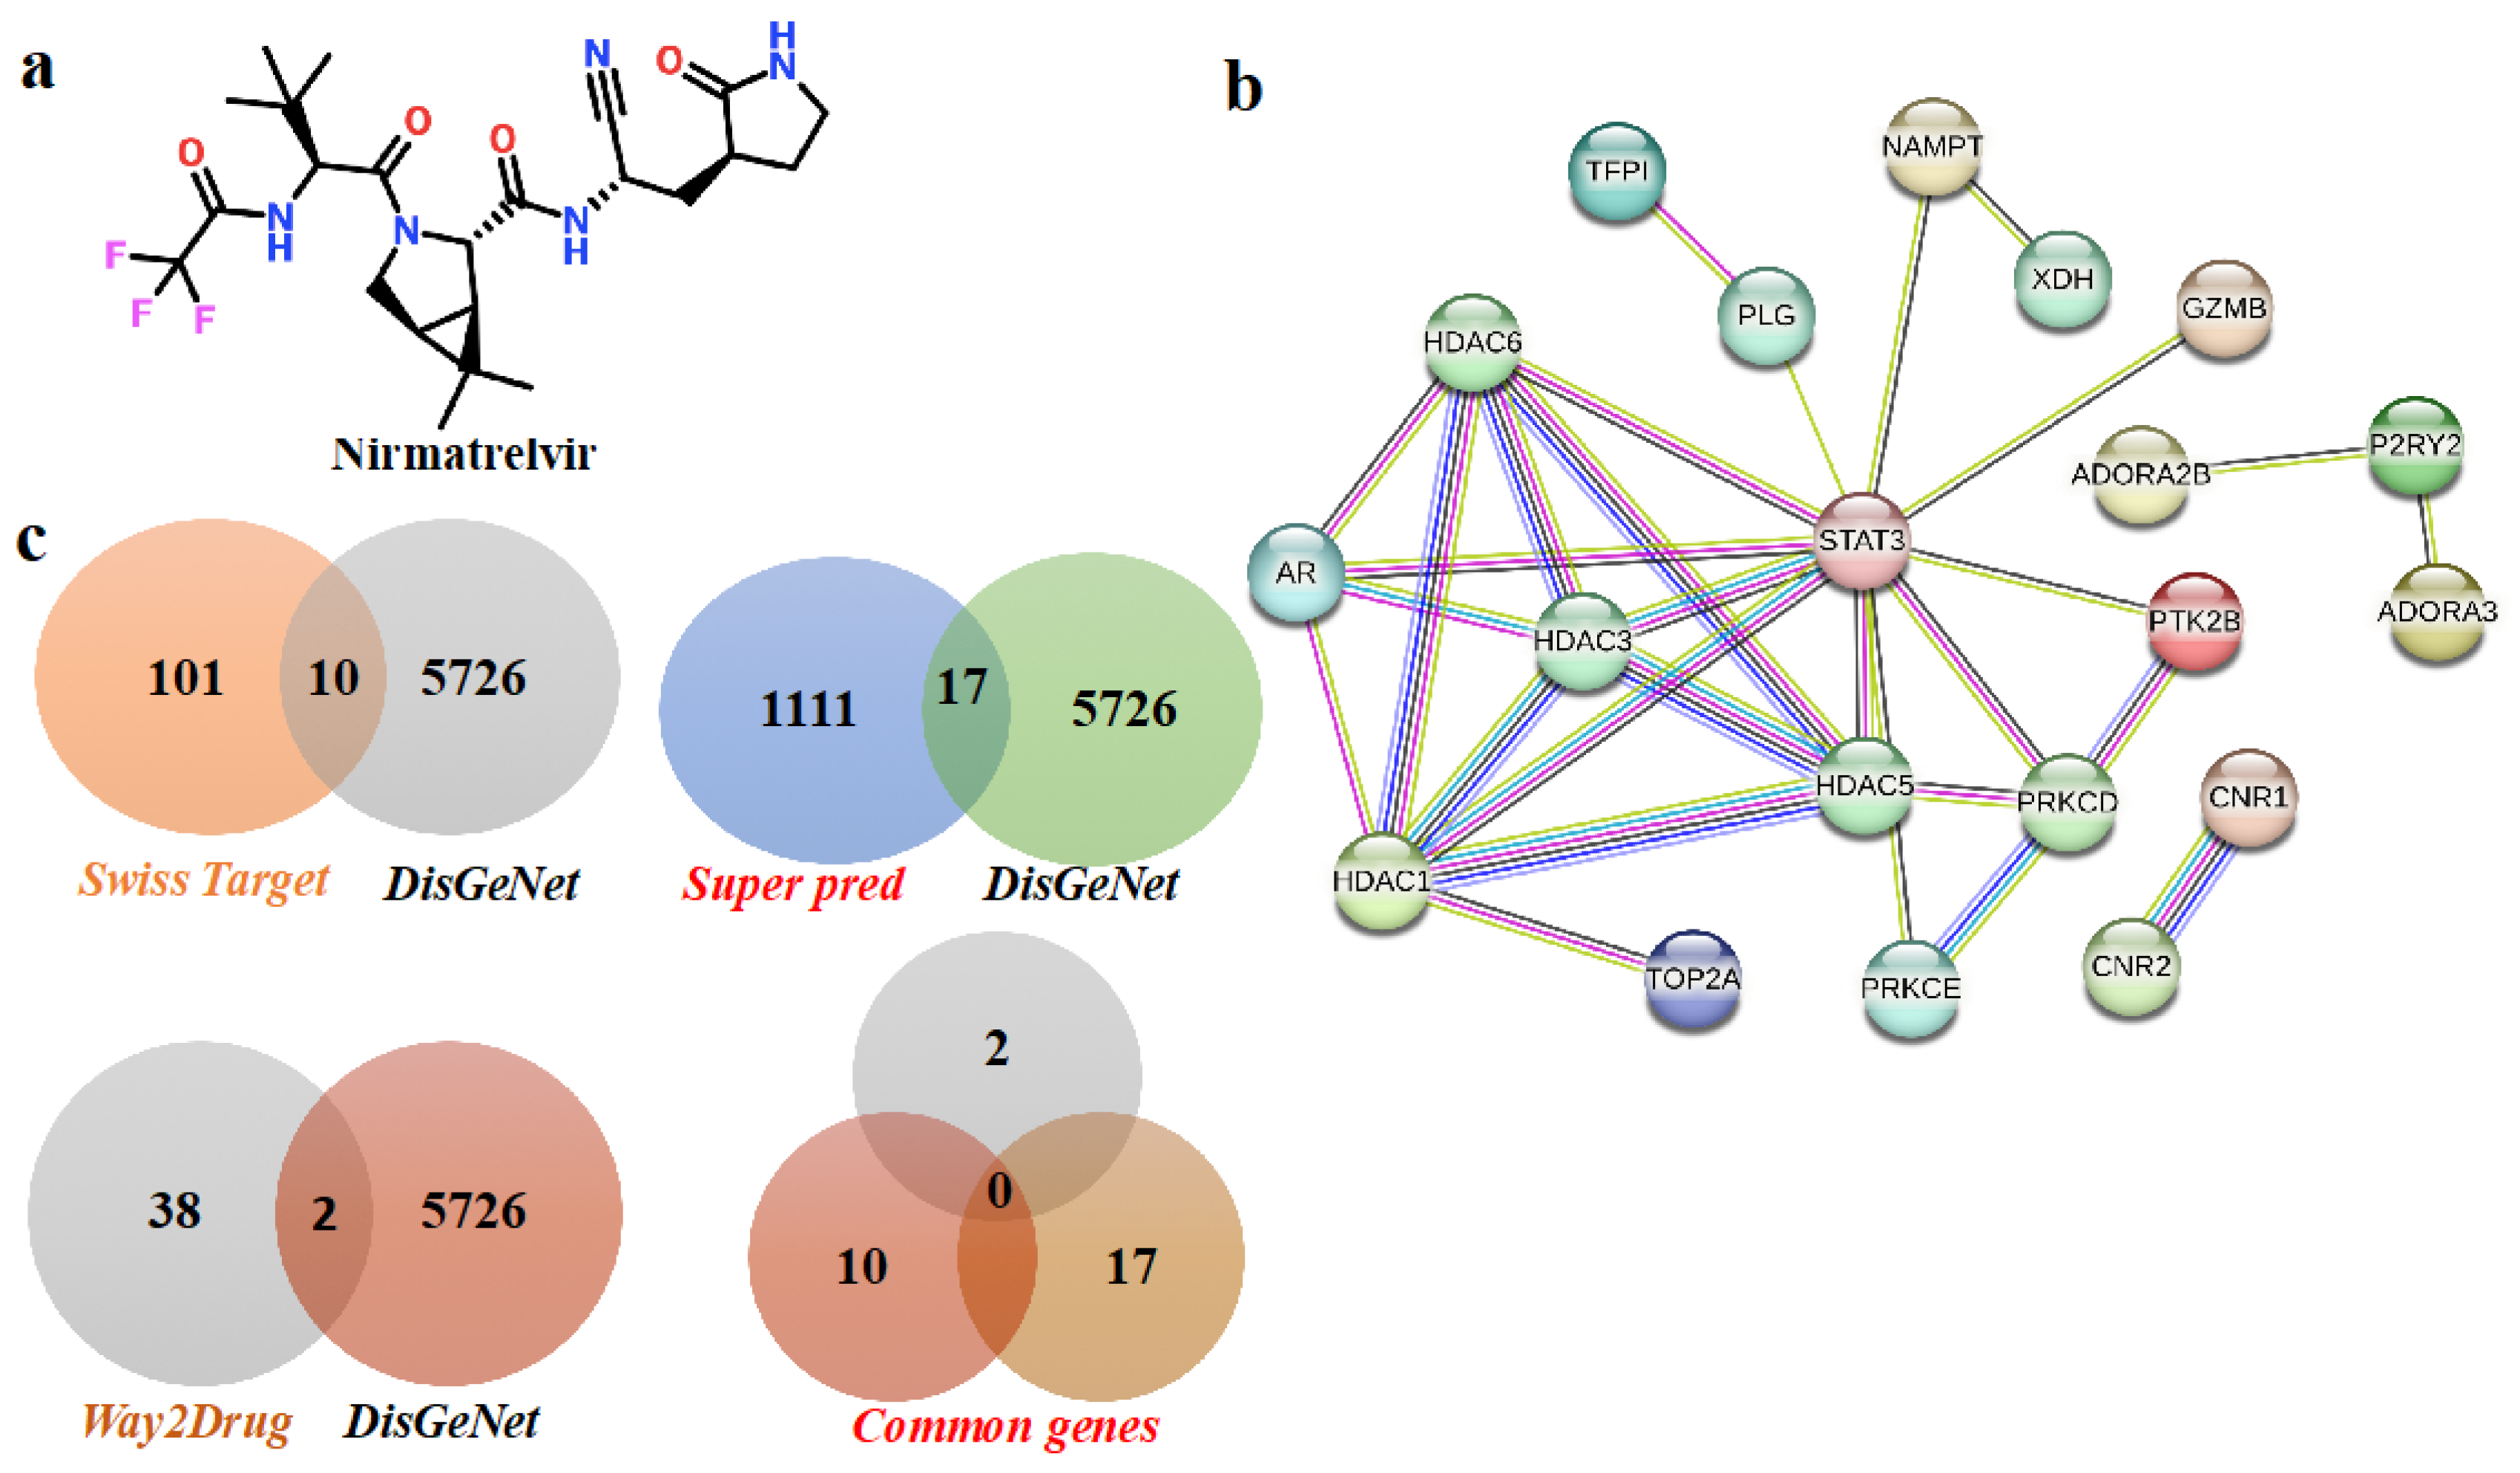
2.1. Nirmatrelvir Targets and HCC-Associated Target Identification
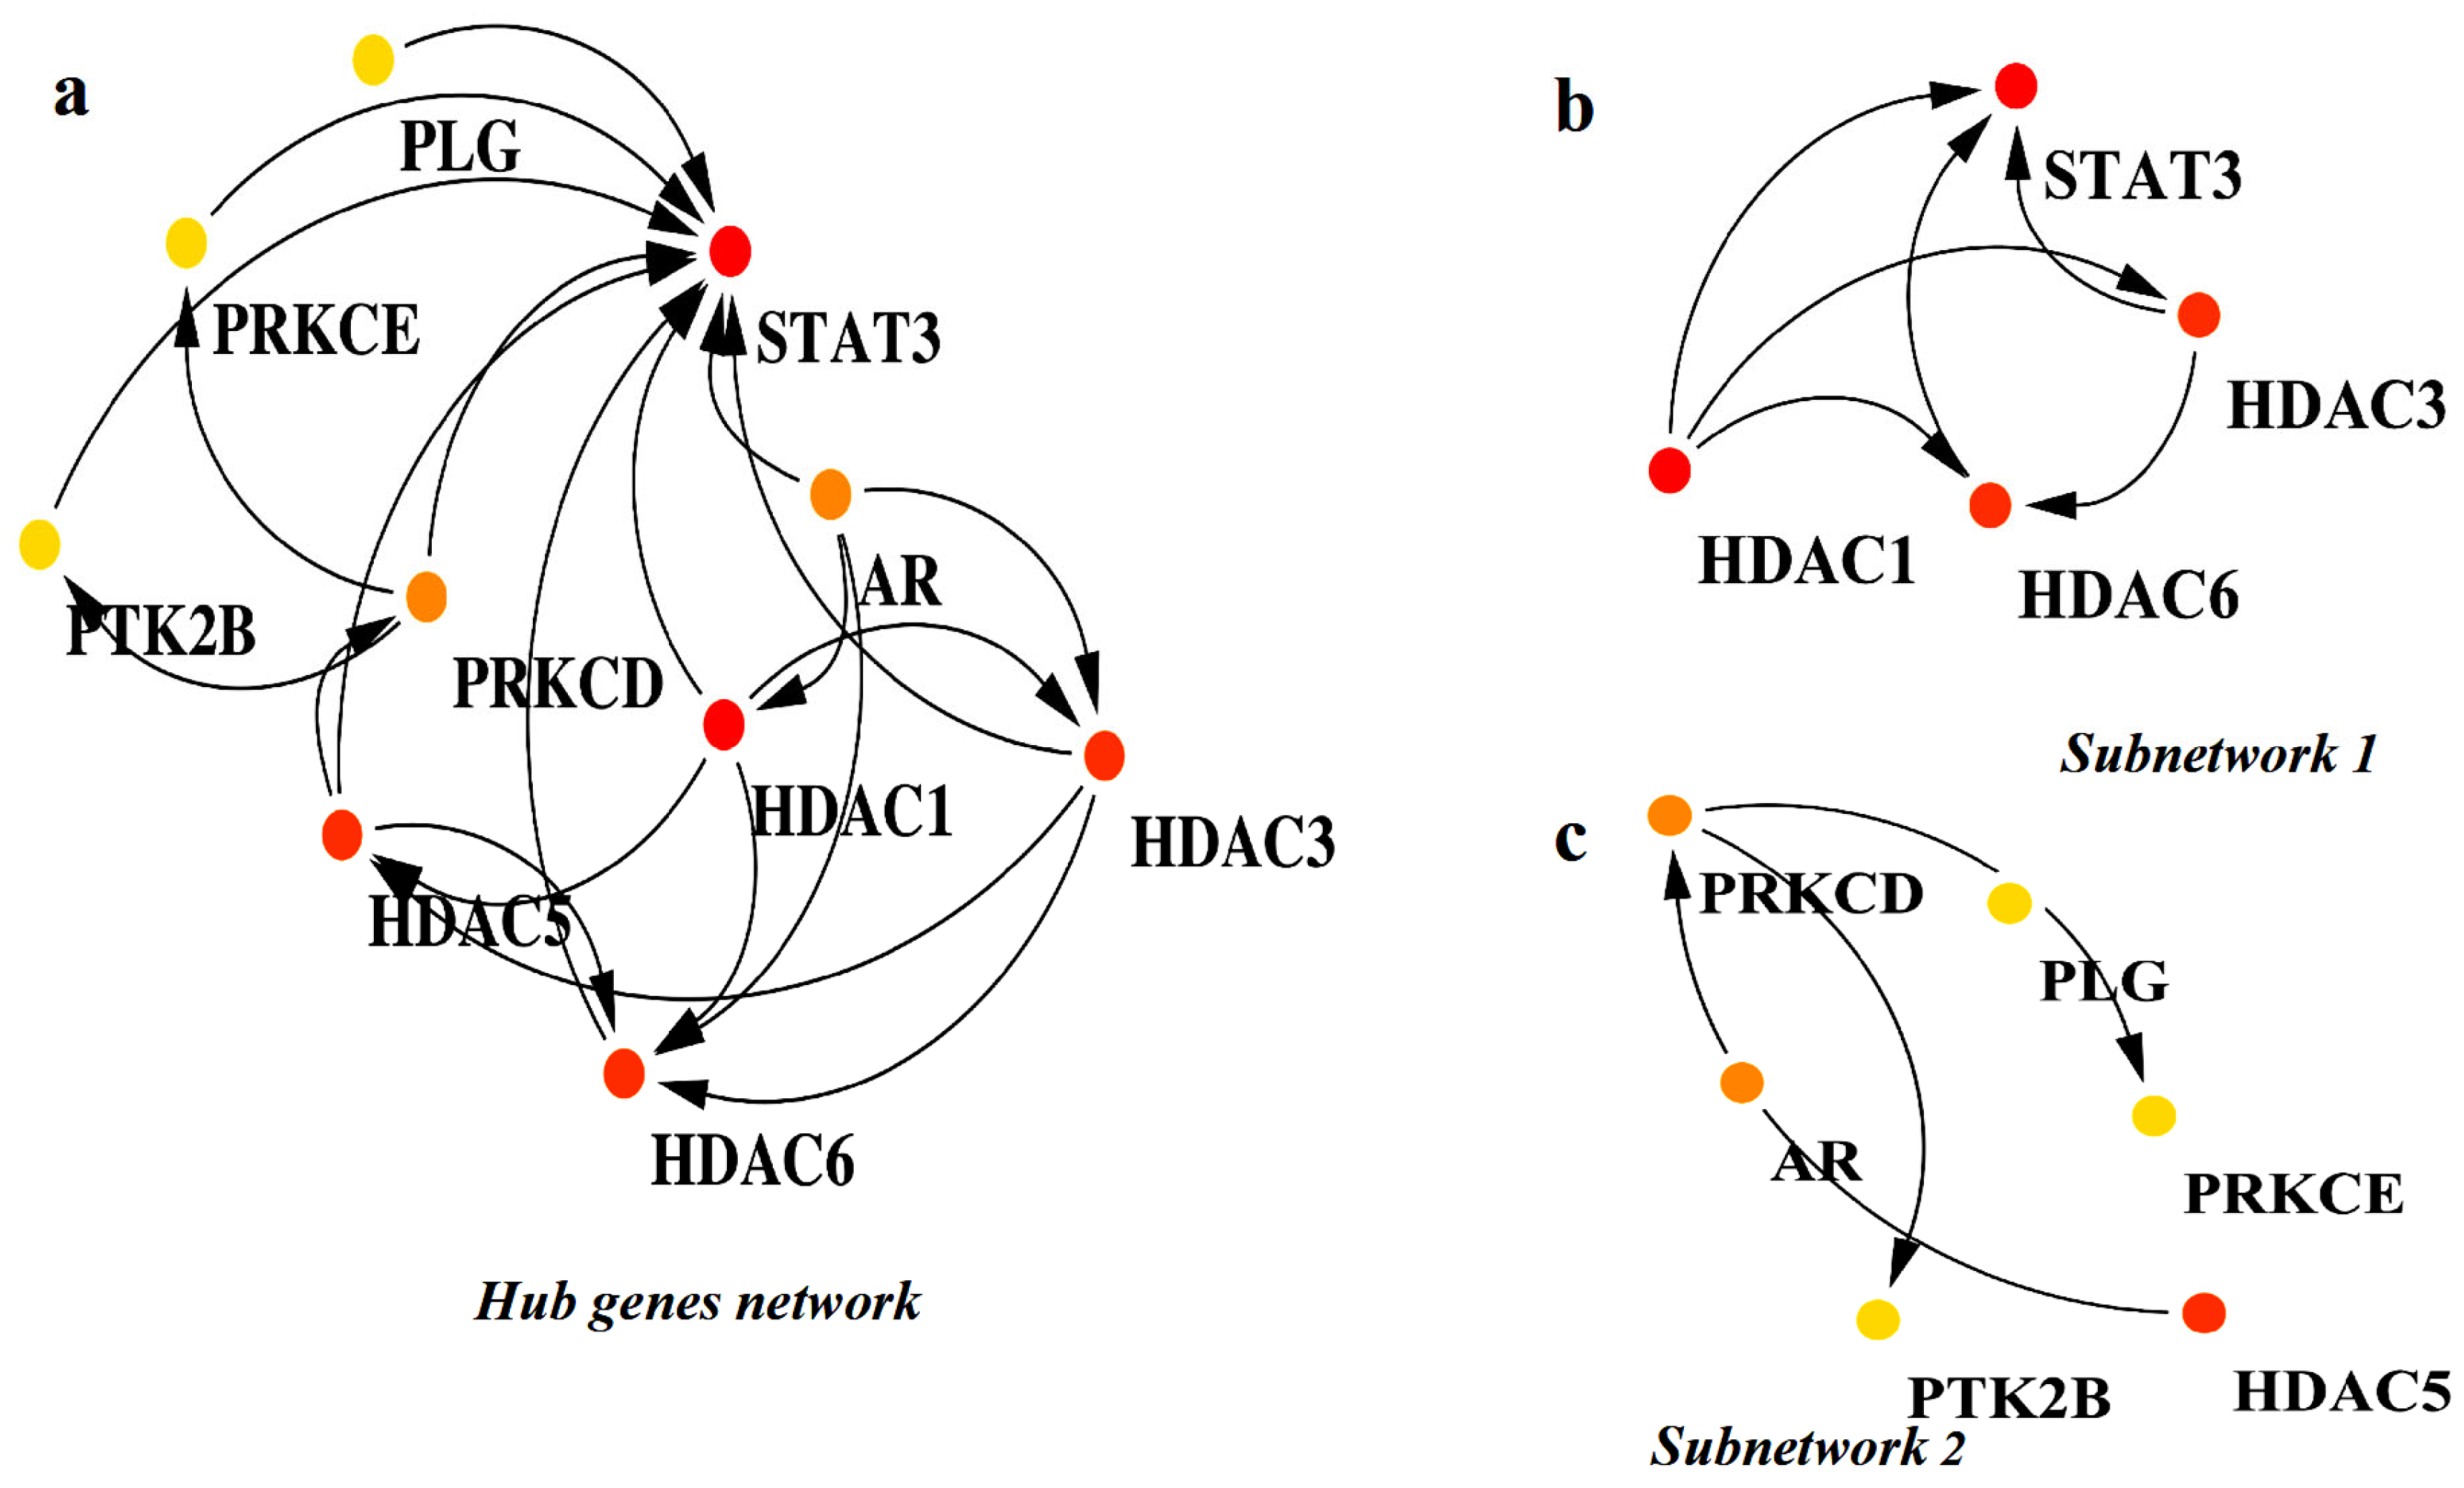
2.2. Identification of Hub Genes and Small Subnetworks
2.3. Analysis of the KEGG Pathway and Gene Ontology (GO) Function Enrichment
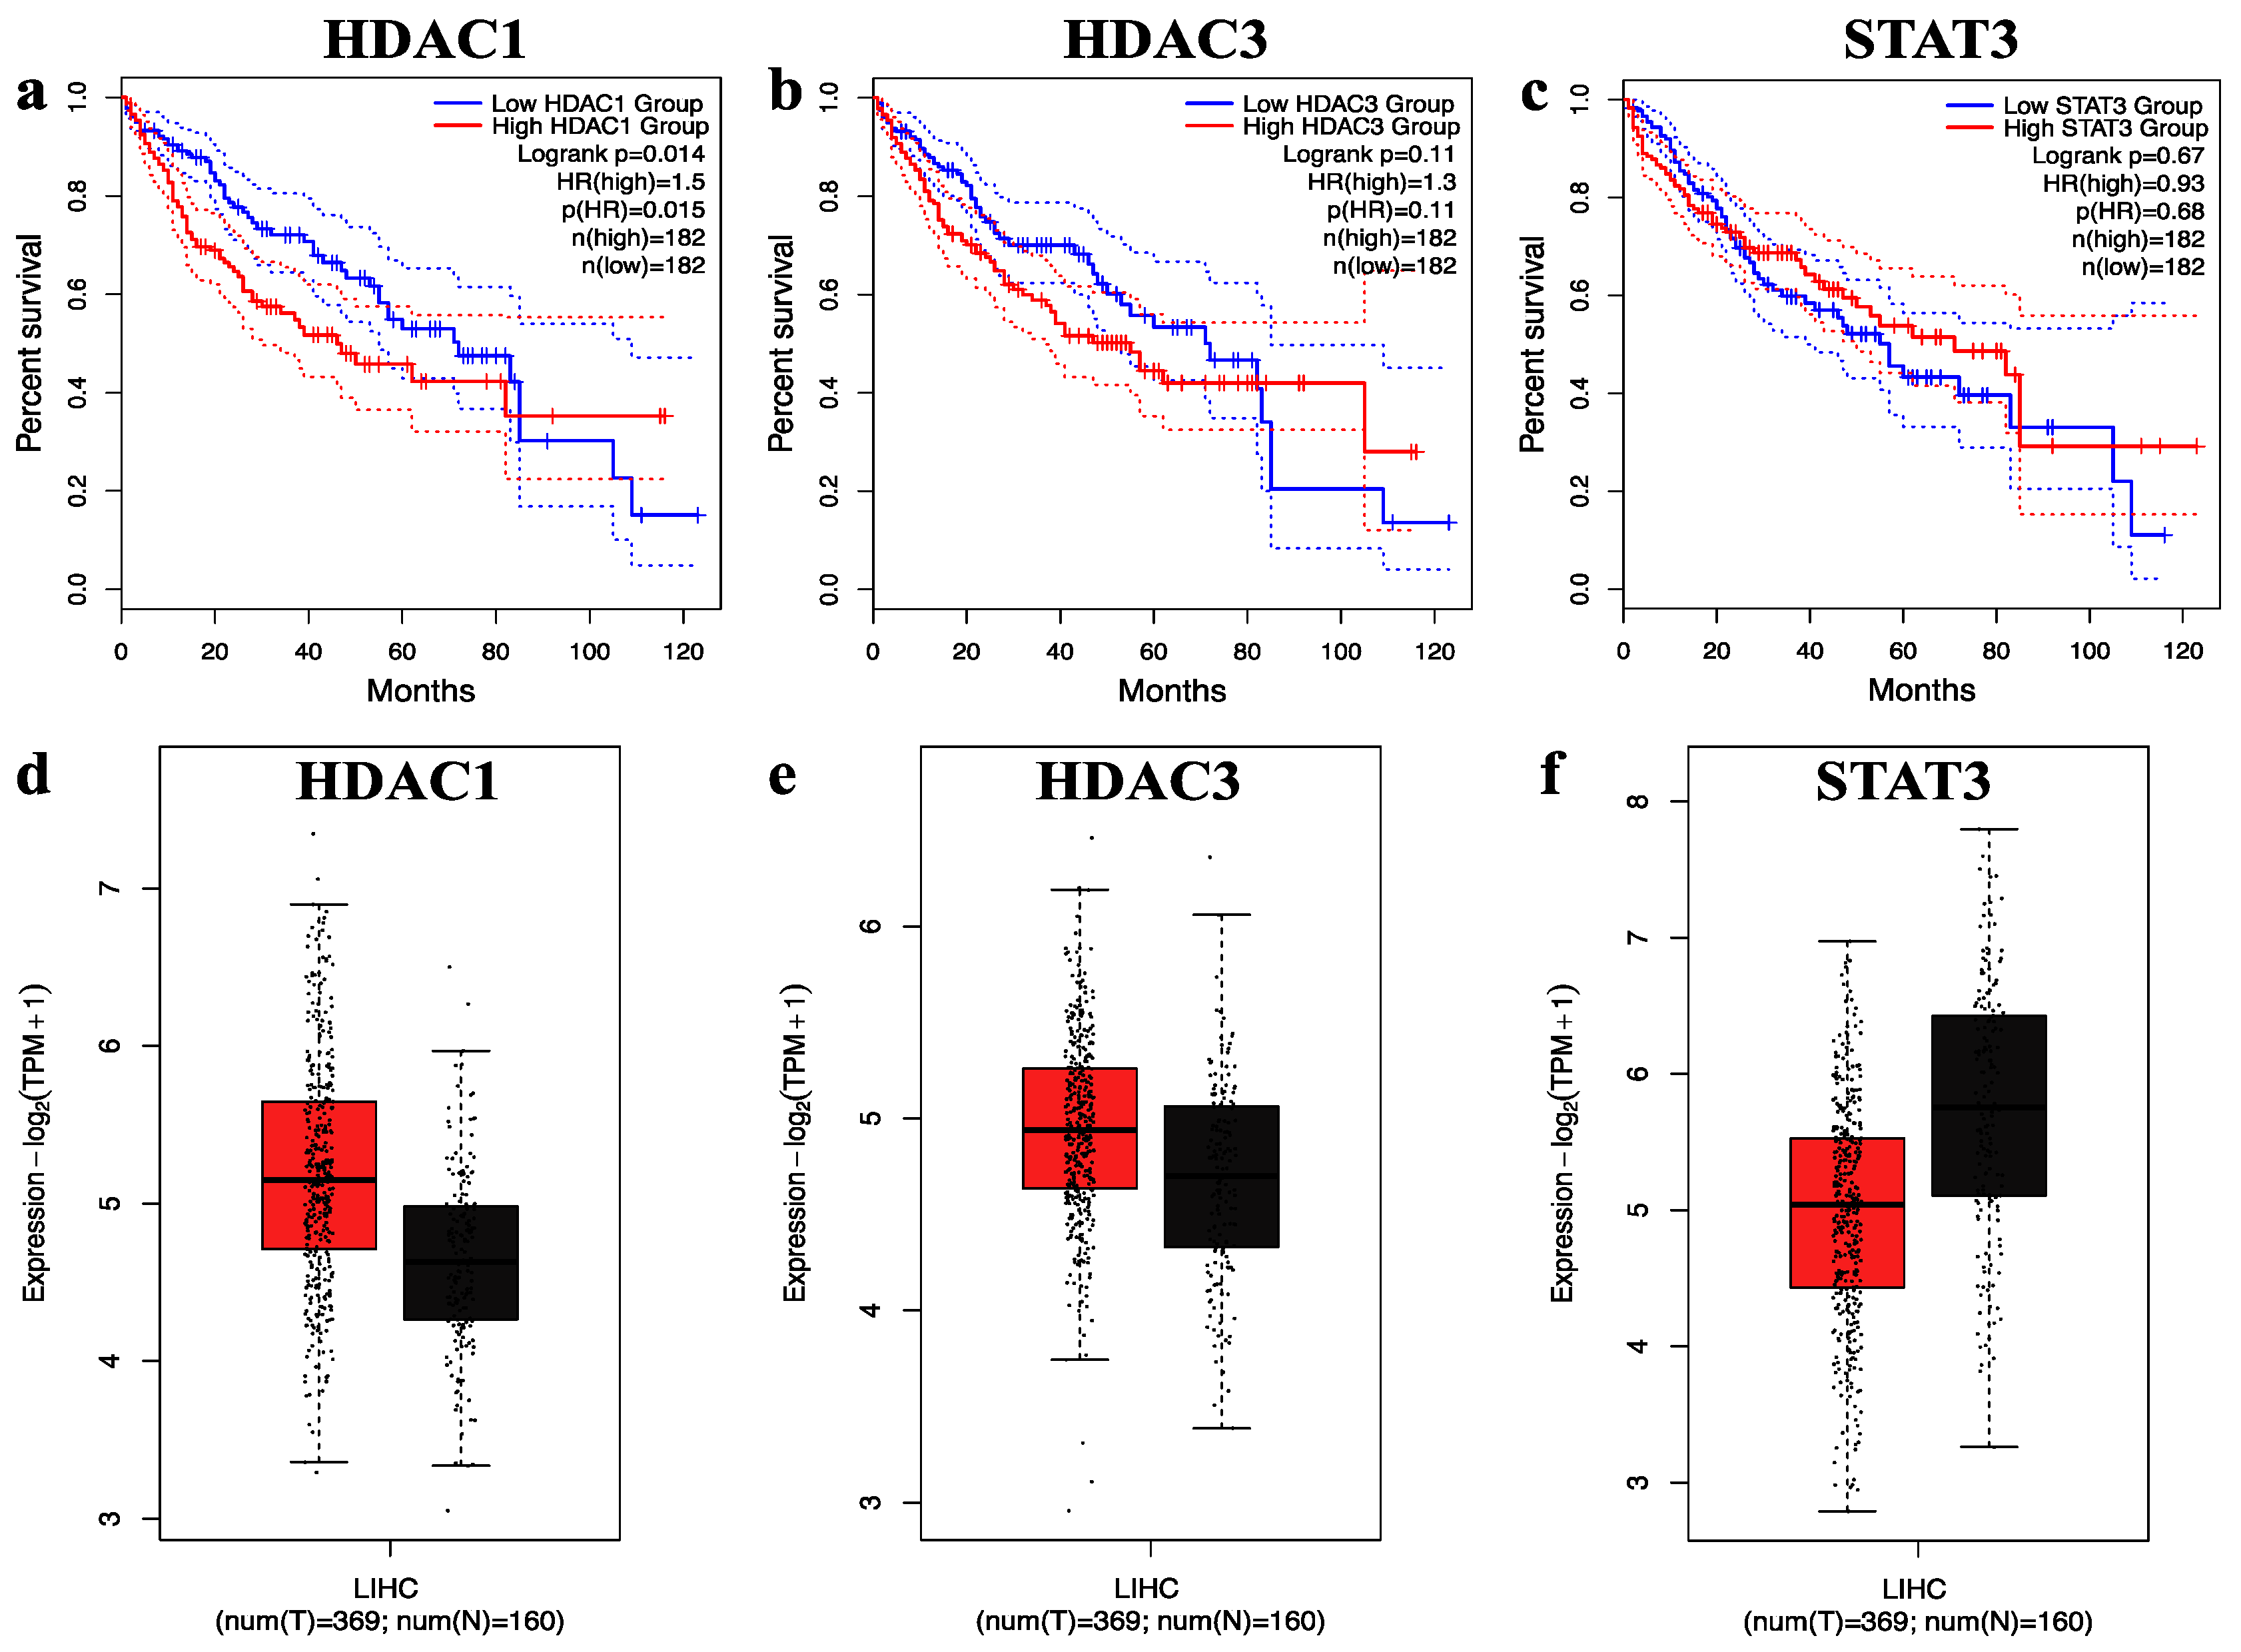
2.4. Survival and Expression Analysis of Hub Genes
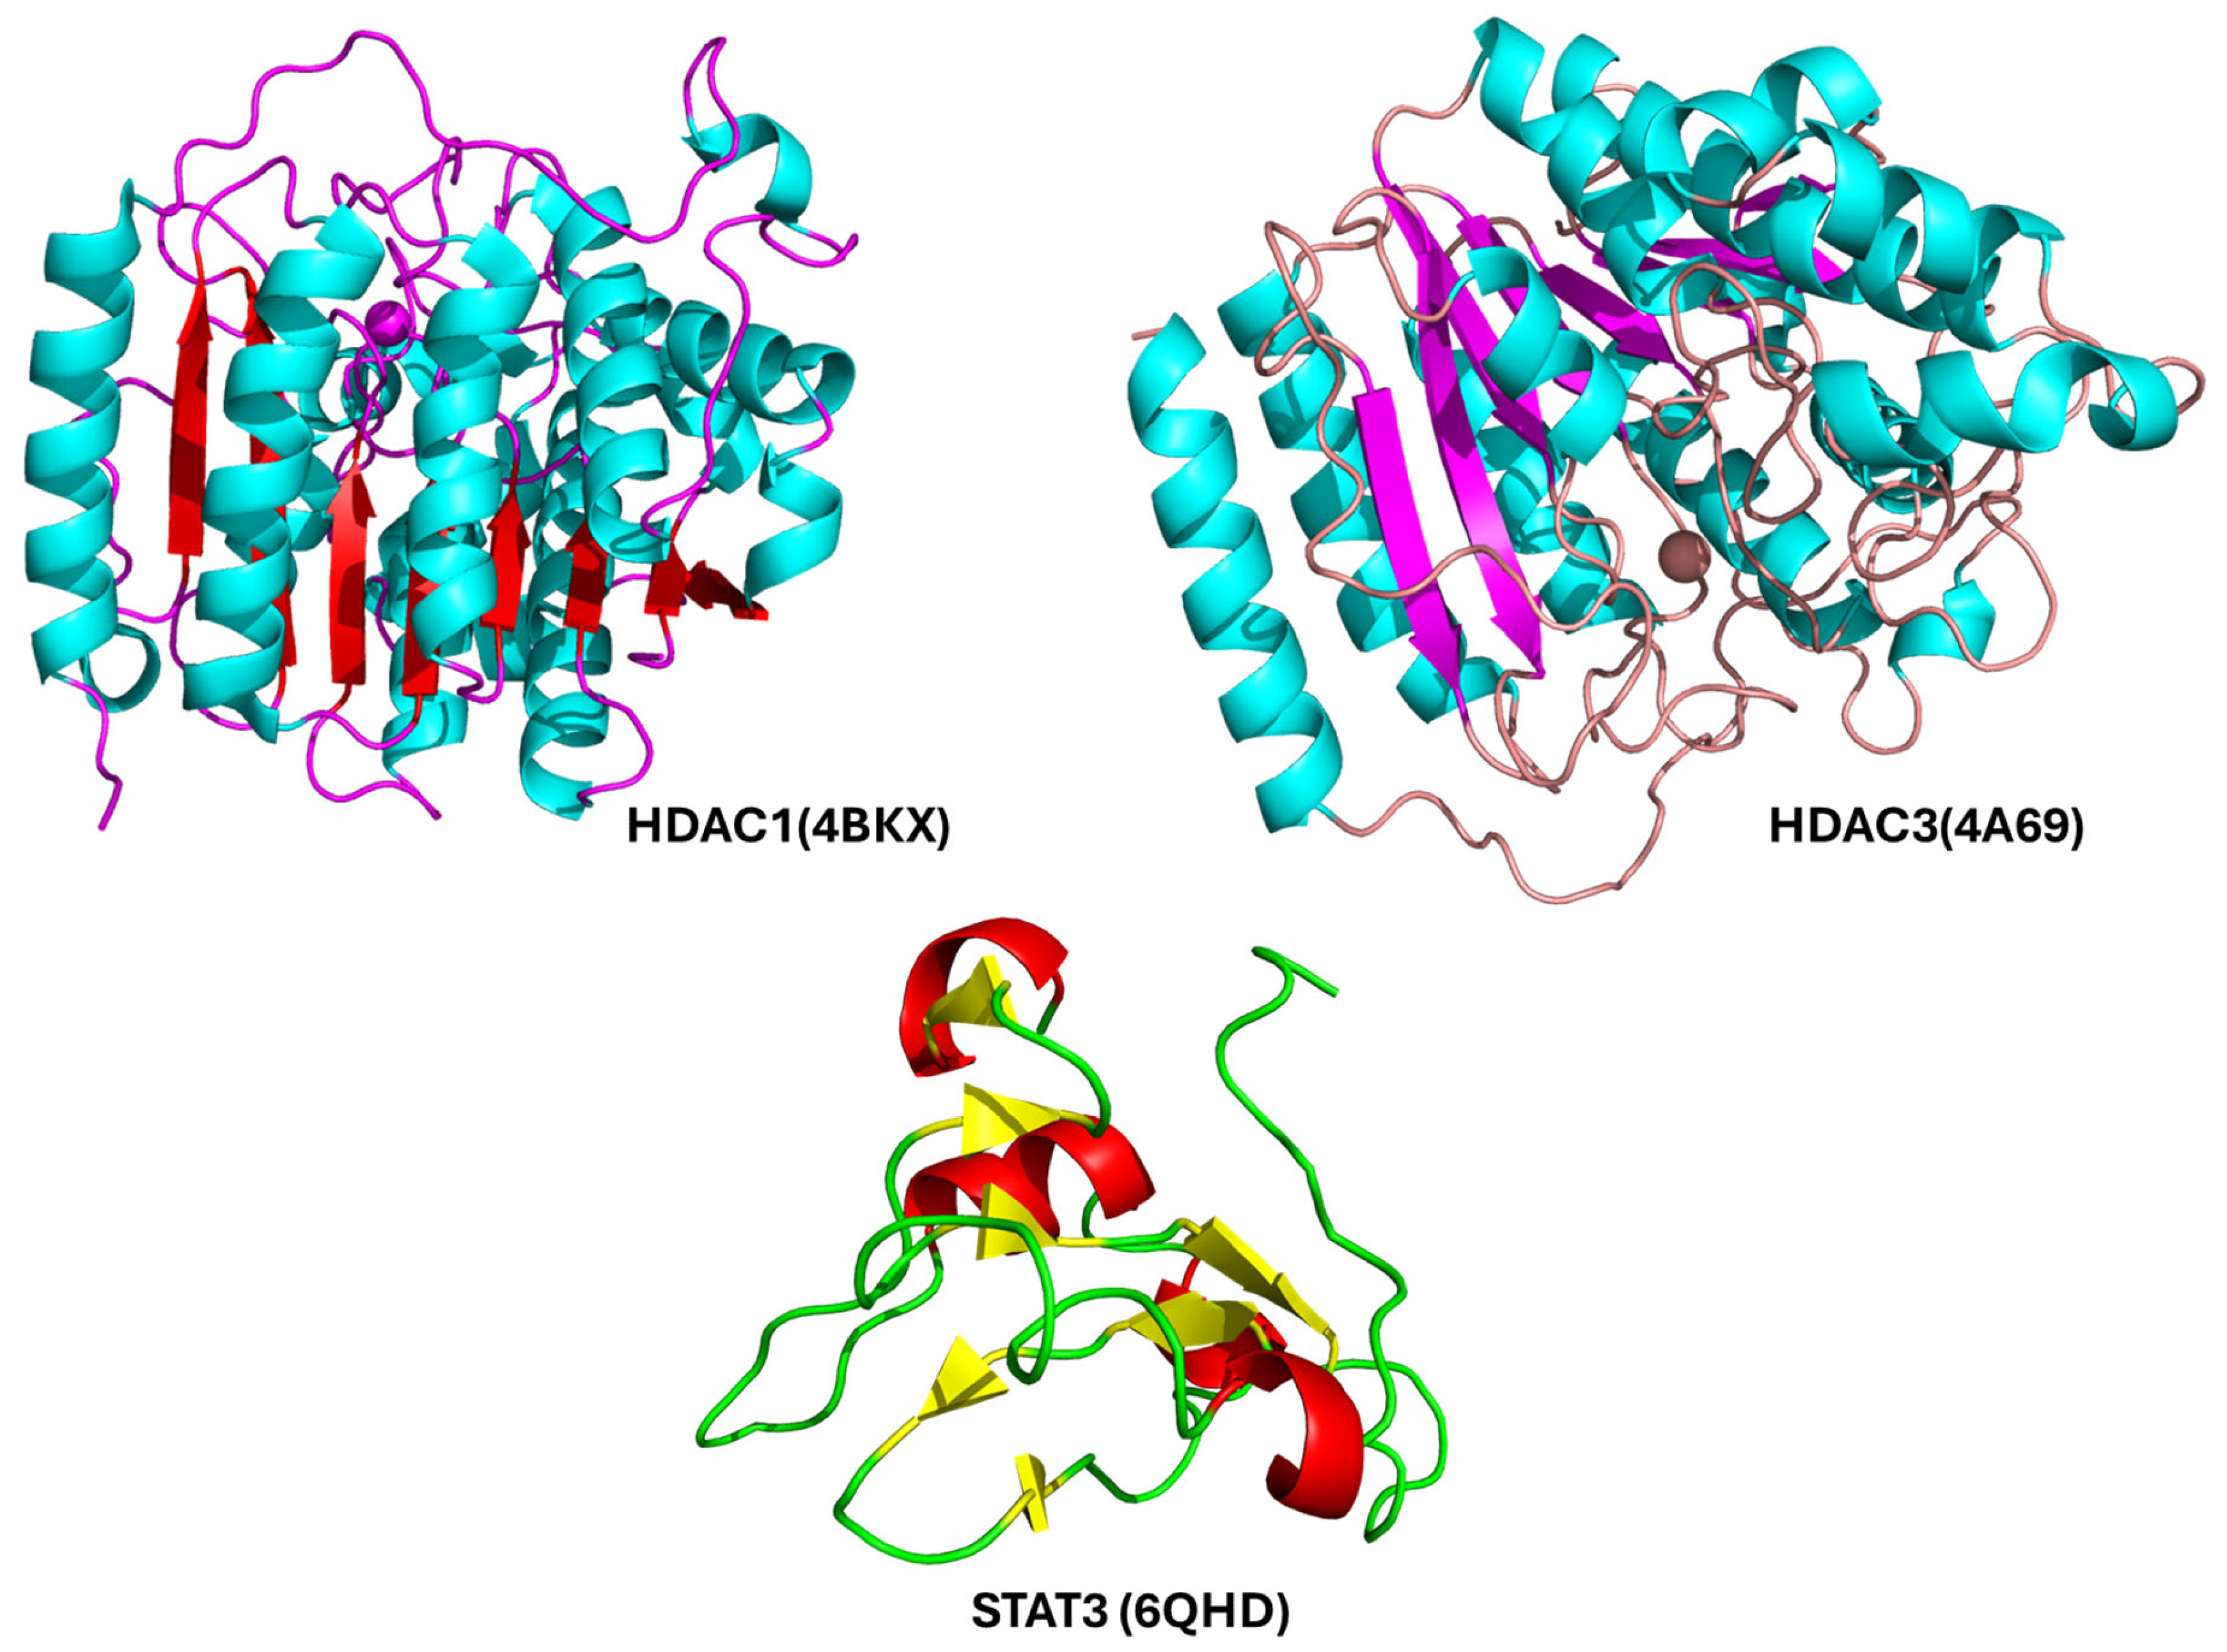
2.5. Molecular Docking Analysis of Nirmatrelvir and Selected Target Proteins
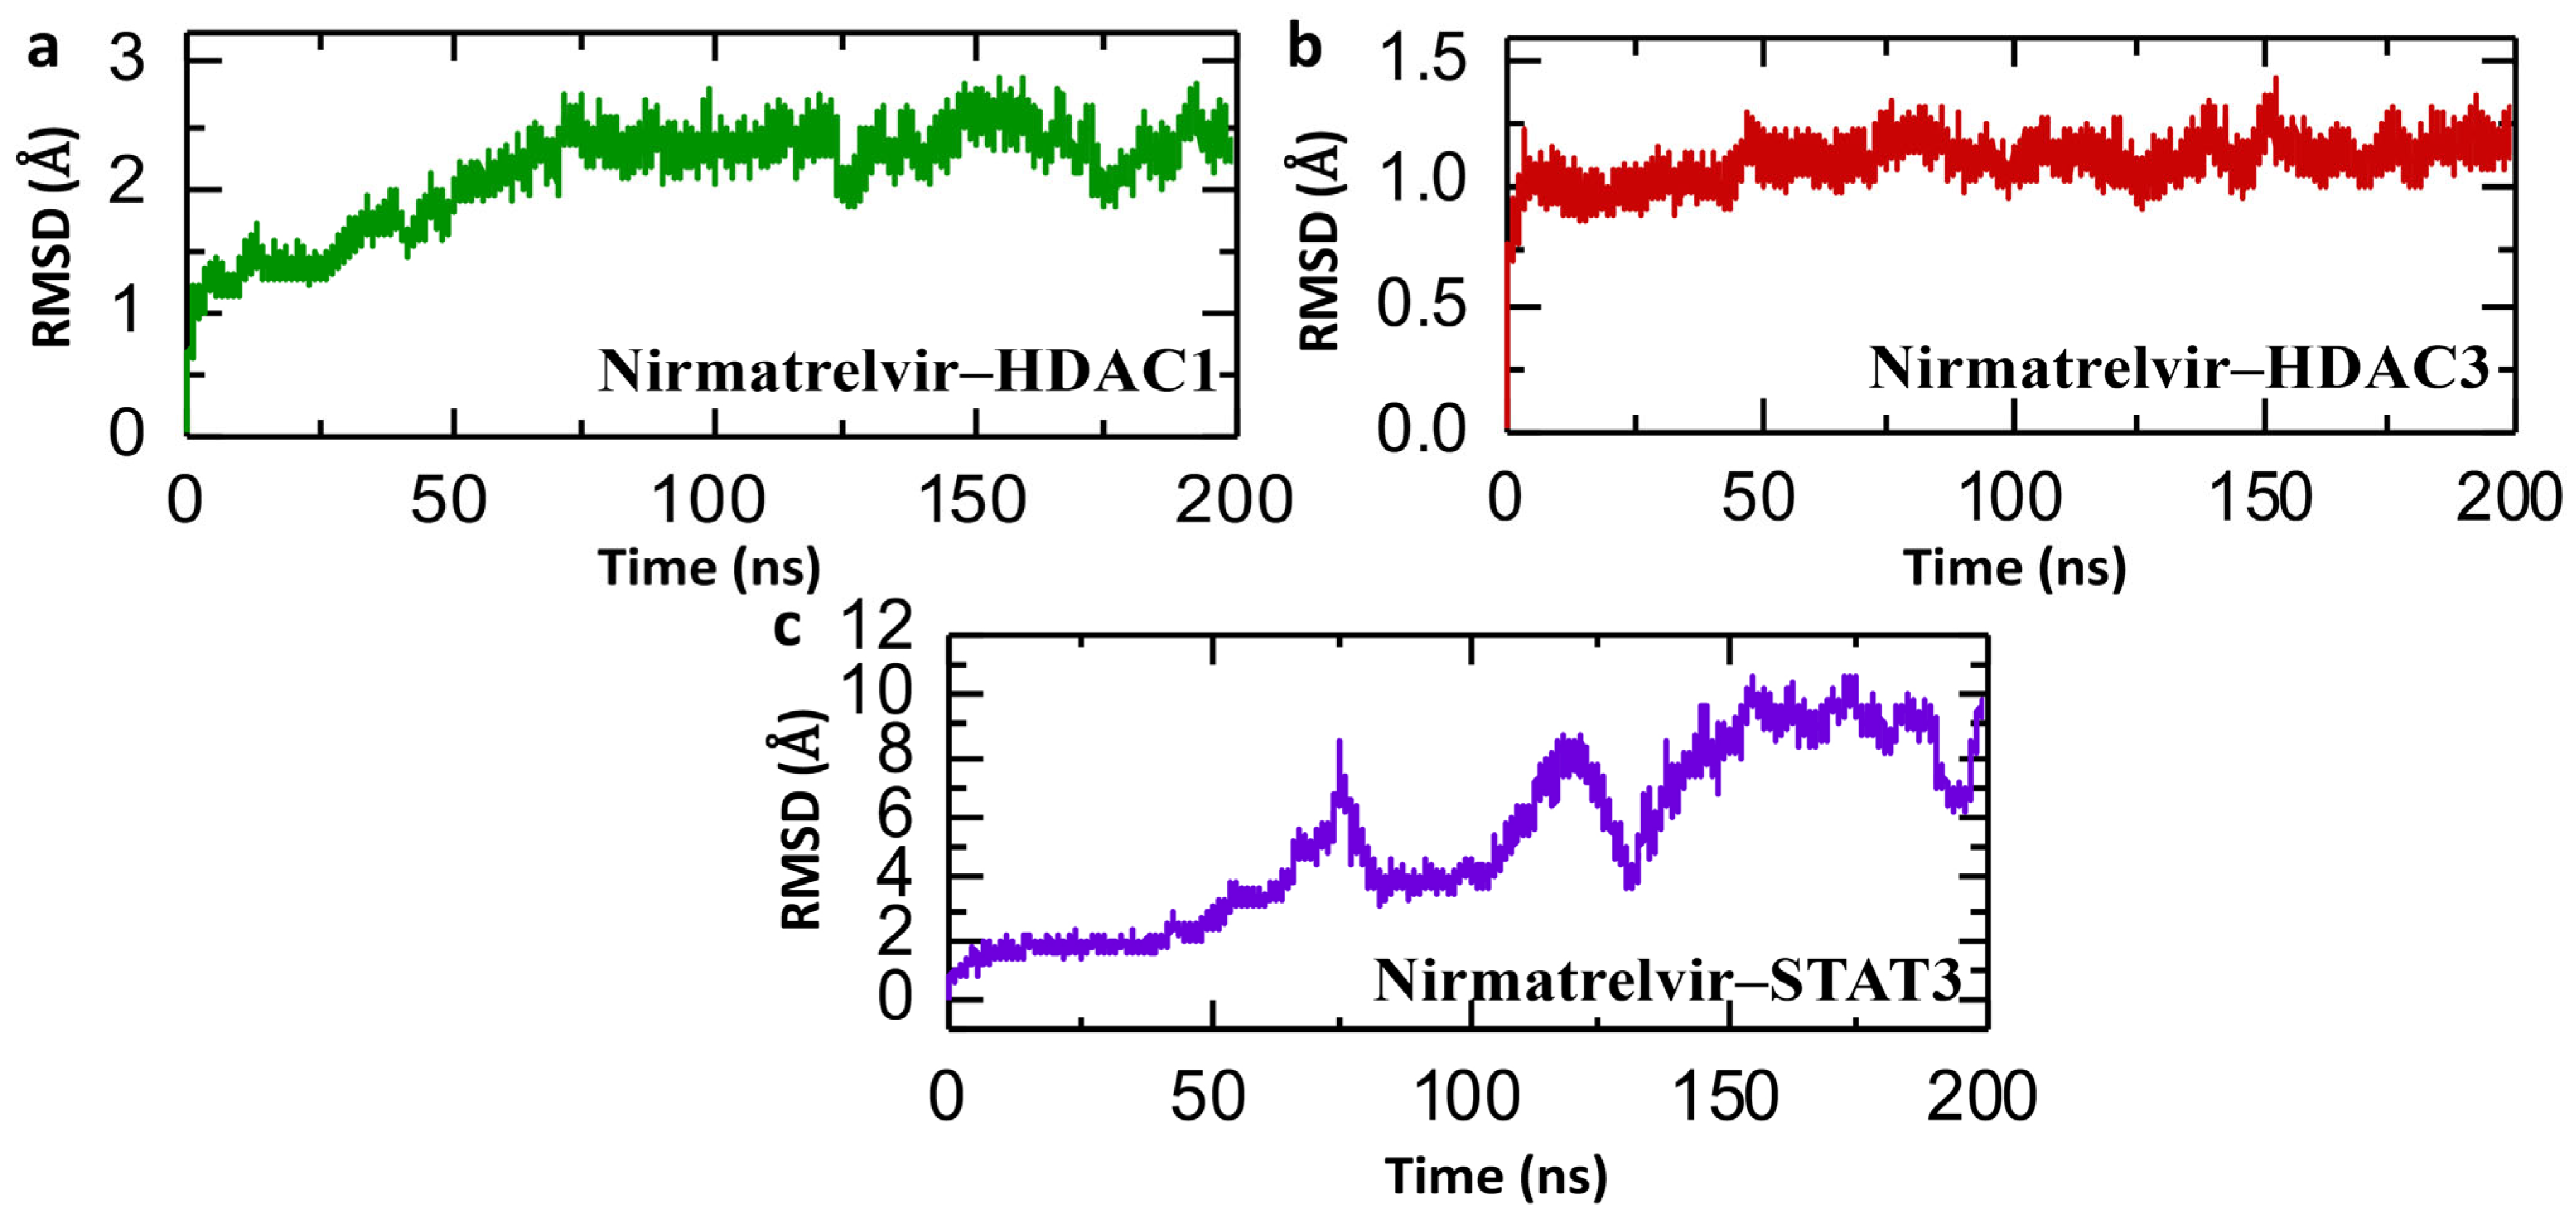
2.6. Simulation of Dynamic Stability in Nirmatrelvir–Protein Complexes
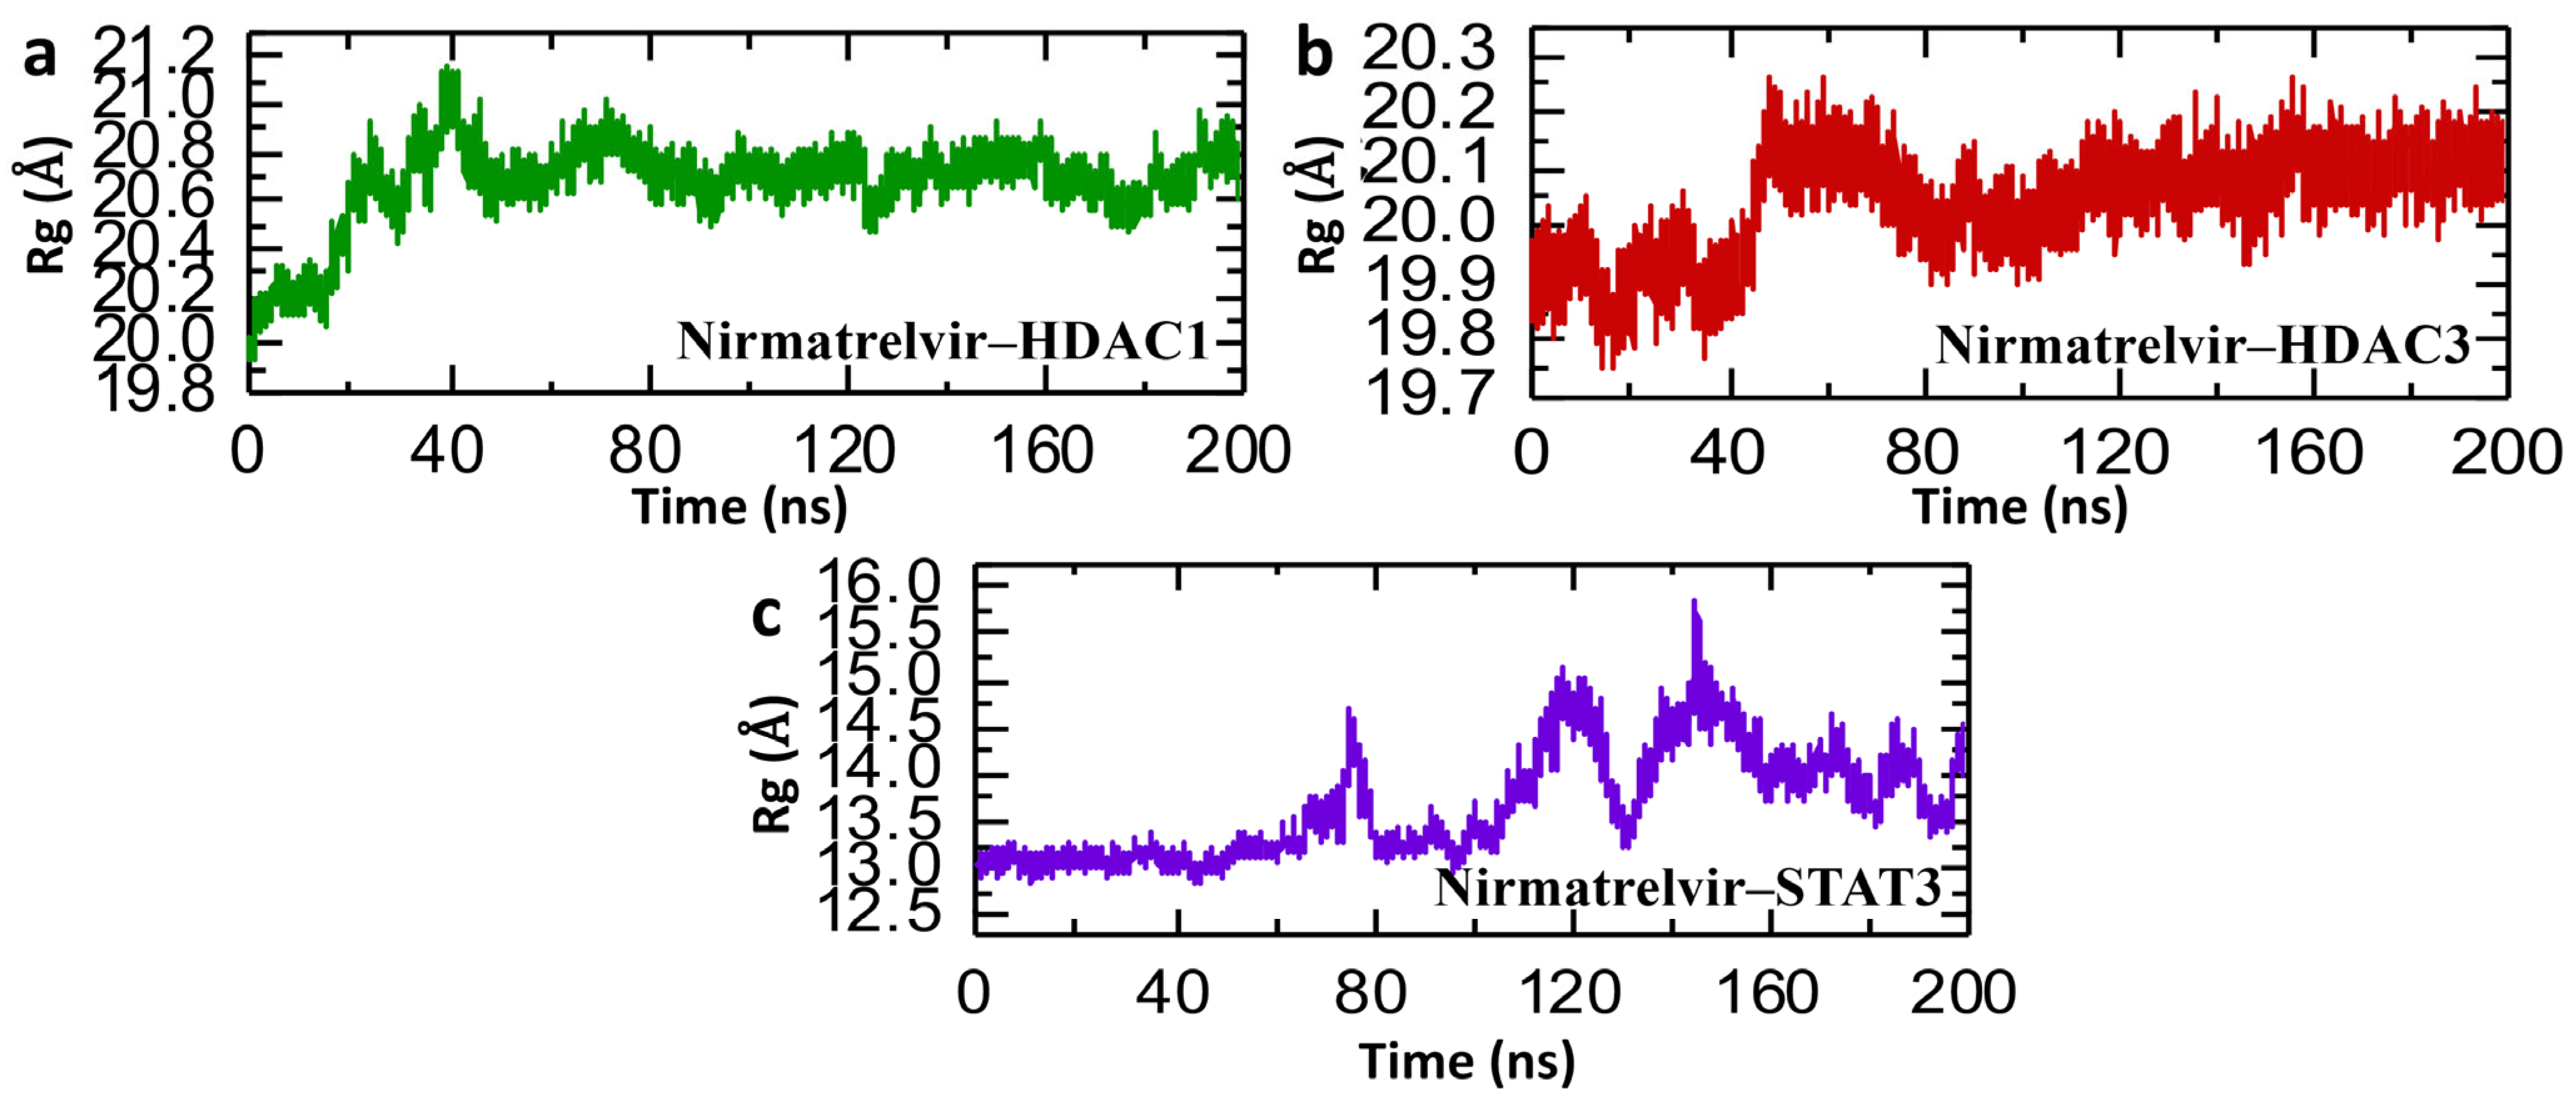
2.7. Post-Simulation Structural Compactness Analysis of Nirmatrelvir–Protein Complexes
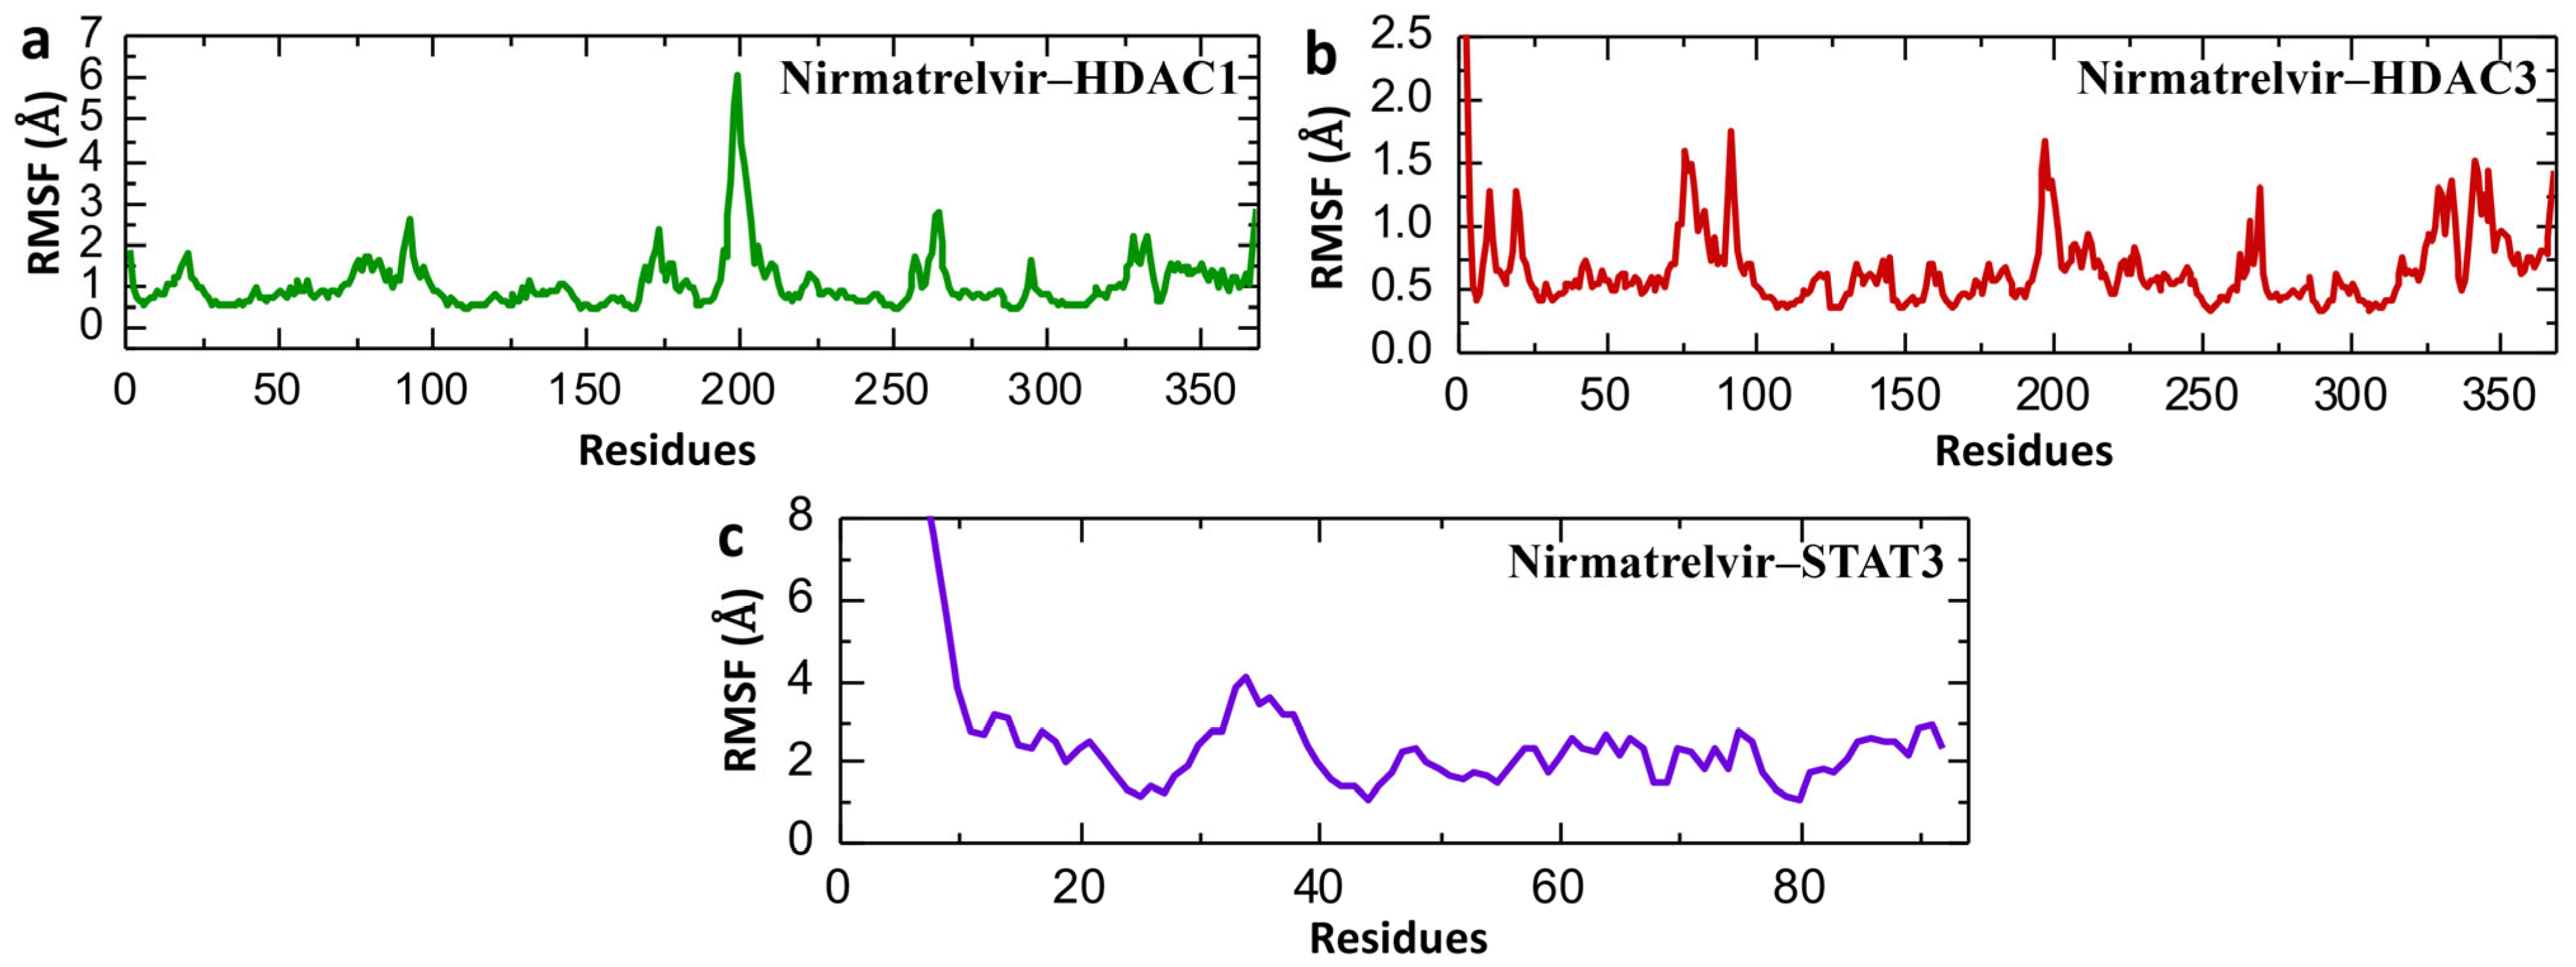
2.8. Post-Simulation Residual Fluctuation Analysis of Nirmatrelvir–Protein Complexes
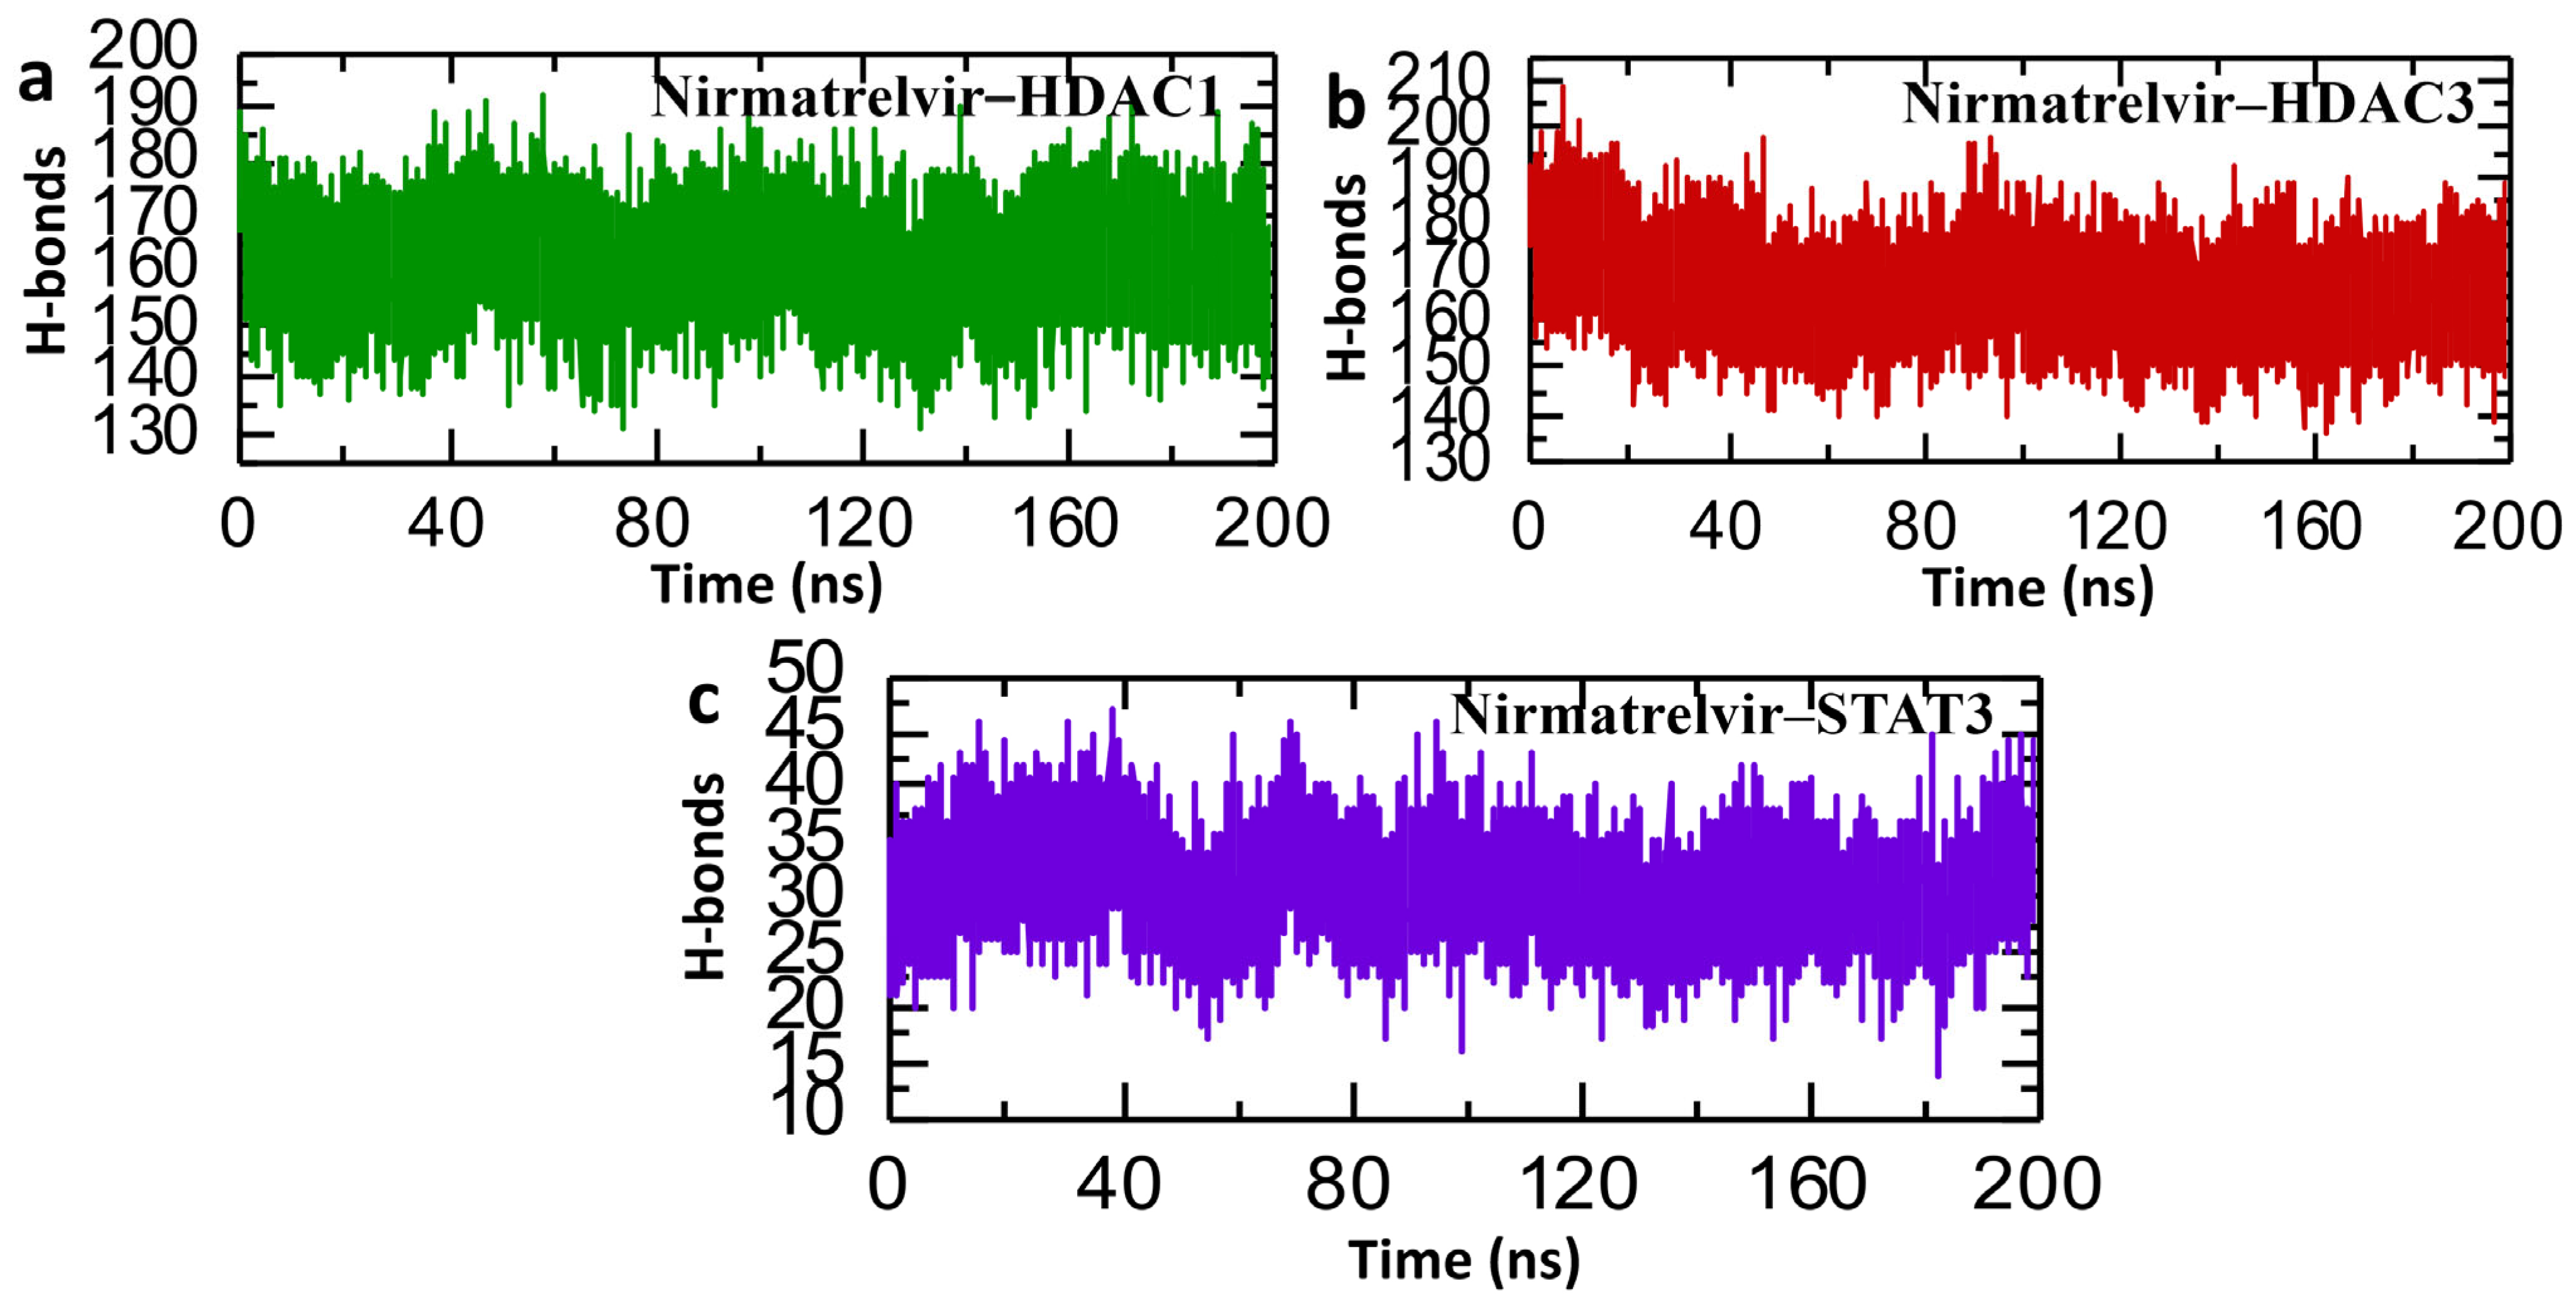
2.9. Post-Simulation Analysis of Hydrogen Bonding in Nirmatrelvir–Protein Complexes
2.10. Binding Free Energy Calculation of Nirmatrelvir–Protein Complex
3. Materials and Methods
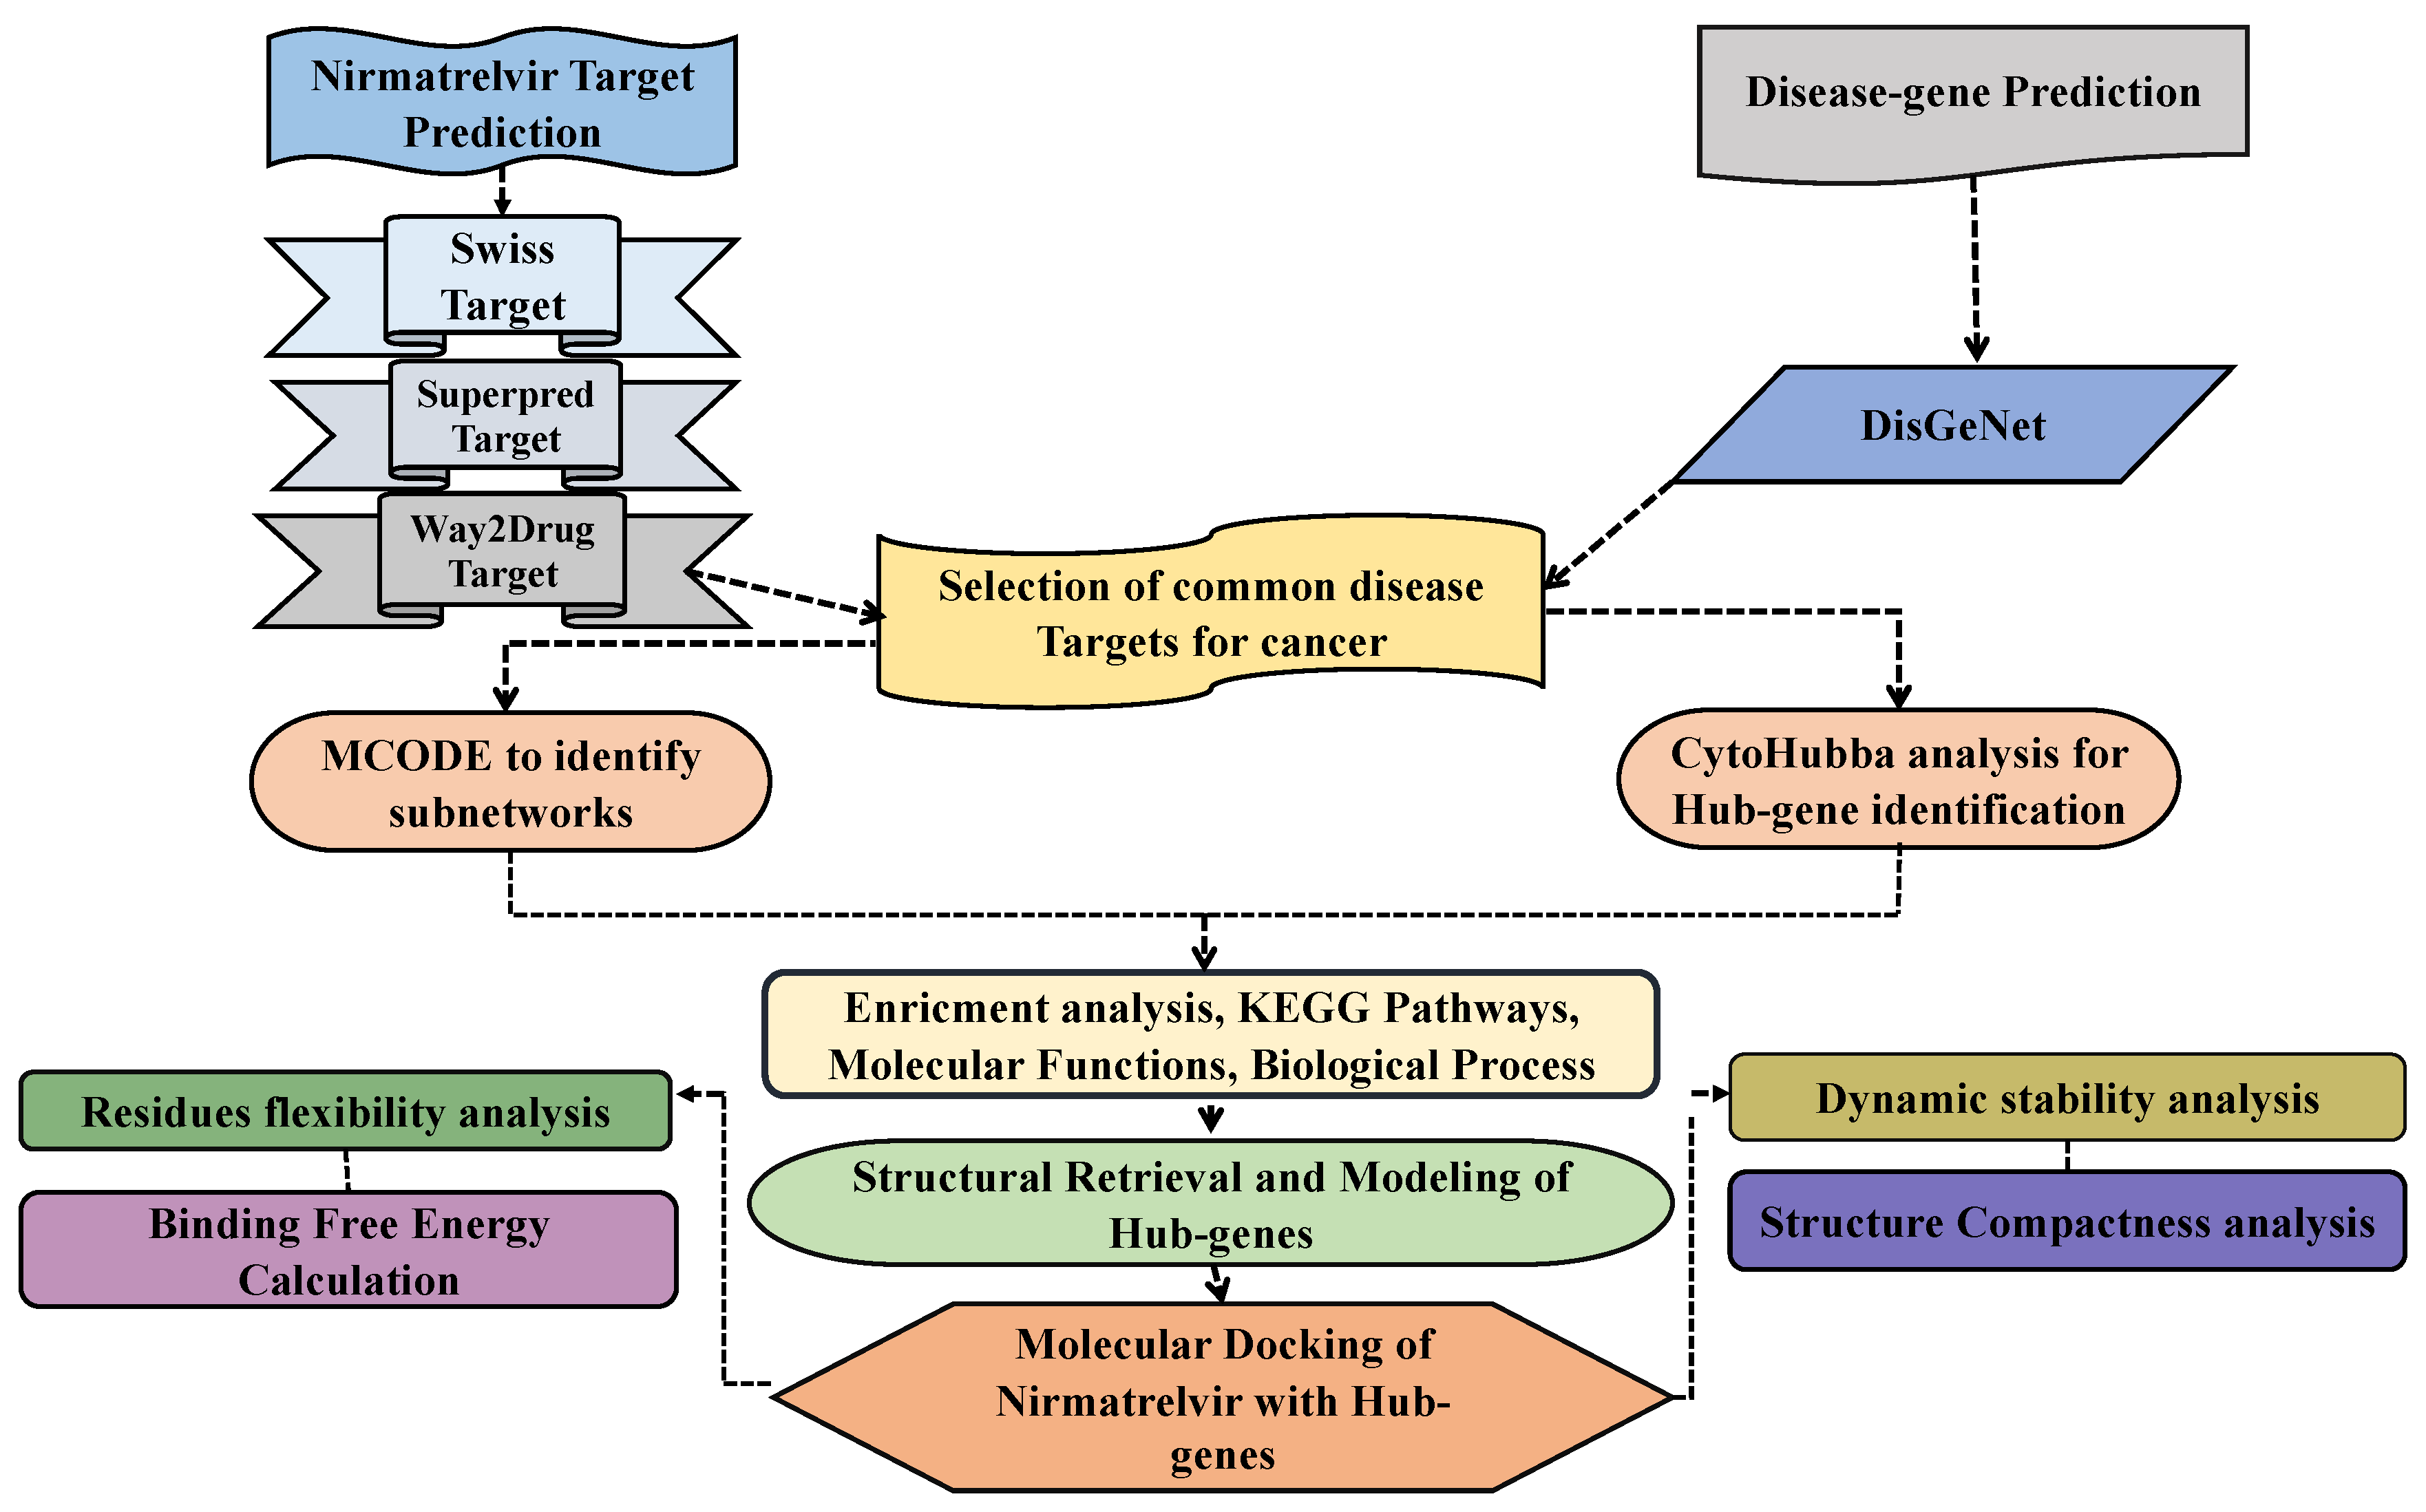
3.1. Prediction of Drug Targets and Disease-Associated Targets
3.2. Protein–Protein Interaction Network Analysis of Common Targets
3.3. Enrichment Analysis of Top 10 Hub Genes
3.4. Survival and Expression Analysis of Selected Genes in Control and Cancer Patients
3.5. Retrieval and Preparation of Target Proteins and Nirmatrelvir Structures
3.6. Molecular Docking of Nirmatrelvir with Selected Hub Genes
3.7. Docking Visualization and Analysis
3.8. Molecular Dynamics Simulations of Drug–Protein Complexes
3.9. Post-Simulation Analysis of Drug–Protein Complexes
3.10. Estimating Binding Free Energy Using MM/GBSA and MM/PBSA Approaches
4. Conclusions
Author Contributions
Funding
Institutional Review Board Statement
Informed Consent Statement
Data Availability Statement
Acknowledgments
Conflicts of Interest
References
- Zheng, J.; Wang, S.; Xia, L.; Sun, Z.; Chan, K.M.; Bernards, R.; Qin, W.; Chen, J.; Xia, Q.; Jin, H. Hepatocellular carcinoma: Signaling pathways and therapeutic advances. Signal Transduct. Target. Ther. 2025, 10, 35. [Google Scholar] [CrossRef]
- Llovet, J.; Kelley, R.; Villanueva, A.; Singal, A.; Pikarsky, E.; Roayaie, S.; Lencioni, R.; Koike, K.; Zucman-Rossi, J.; Finn, R. Hepatocellular carcinoma. Nat. Rev. Dis. Primers 2021, 7, 6. [Google Scholar] [CrossRef] [PubMed]
- Siegel, R.L.; Giaquinto, A.N.; Jemal, A. Cancer statistics, 2024. CA A Cancer J. Clin. 2024, 74, 12–49. [Google Scholar] [CrossRef] [PubMed]
- Rumgay, H.; Arnold, M.; Ferlay, J.; Lesi, O.; Cabasag, C.J.; Vignat, J.; Laversanne, M.; McGlynn, K.A.; Soerjomataram, I. Global burden of primary liver cancer in 2020 and predictions to 2040. J. Hepatol. 2022, 77, 1598–1606. [Google Scholar] [CrossRef] [PubMed]
- Lakkis, N.A.; Mokalled, N.M.; Osman, M.H.; Musharrafieh, U.M.; Eljammal, M. Liver Cancer and Risk Factors in the MENA Region: Epidemiology and Temporal Trends Based on the 2019 Global Burden of Disease Data. Cancer Control 2024, 31, 10732748241297346. [Google Scholar] [CrossRef]
- Jemal, A.; Bray, F.; Center, M.M.; Ferlay, J.; Ward, E.; Forman, D. Global cancer statistics. CA A Cancer J. Clin. 2011, 61, 69–90. [Google Scholar] [CrossRef]
- Llovet, J.M.; Burroughs, A.; Bruix, J. Risk factors and prevention. Lancet 2003, 362, 1907–1917. [Google Scholar] [CrossRef]
- Elbahrawy, A.; Atalla, H.; Alboraie, M.; Alwassief, A.; Madian, A.; El Fayoumie, M.; Tabll, A.A.; Aly, H.H. Recent Advances in Protective Vaccines against Hepatitis Viruses: A Narrative Review. Viruses 2023, 15, 214. [Google Scholar] [CrossRef]
- Anstee, Q.M.; Reeves, H.L.; Kotsiliti, E.; Govaere, O.; Heikenwalder, M. From NASH to HCC: Current concepts and future challenges. Nat. Rev. Gastroenterol. Hepatol. 2019, 16, 411–428. [Google Scholar] [CrossRef]
- Zhang, P.; Yang, Y.; Wen, F.; He, X.; Tang, R.; Du, Z.; Zhou, J.; Zhang, J.; Li, Q. Cost-effectiveness of sorafenib as a first-line treatment for advanced hepatocellular carcinoma. Eur. J. Gastroenterol. Hepatol. 2015, 27, 853–859. [Google Scholar] [CrossRef]
- Colagrande, S.; Inghilesi, A.L.; Aburas, S.; Taliani, G.G.; Nardi, C.; Marra, F. Challenges of advanced hepatocellular carcinoma. World J. Gastroenterol. 2016, 22, 7645. [Google Scholar] [CrossRef]
- Xu, Y.; Poggio, M.; Jin, H.Y.; Shi, Z.; Forester, C.M.; Wang, Y.; Stumpf, C.R.; Xue, L.; Devericks, E.; So, L. Translation control of the immune checkpoint in cancer and its therapeutic targeting. Nat. Med. 2019, 25, 301–311. [Google Scholar] [CrossRef] [PubMed]
- Nevola, R.; Ruocco, R.; Criscuolo, L.; Villani, A.; Alfano, M.; Beccia, D.; Imbriani, S.; Claar, E.; Cozzolino, D.; Sasso, F.C. Predictors of early and late hepatocellular carcinoma recurrence. World J. Gastroenterol. 2023, 29, 1243. [Google Scholar] [CrossRef] [PubMed]
- Sperandio, R.C.; Pestana, R.C.; Miyamura, B.V.; Kaseb, A.O. Hepatocellular carcinoma immunotherapy. Annu. Rev. Med. 2022, 73, 267–278. [Google Scholar] [CrossRef] [PubMed]
- Qin, S.; Chen, M.; Cheng, A.-L.; Kaseb, A.O.; Kudo, M.; Lee, H.C.; Yopp, A.C.; Zhou, J.; Wang, L.; Wen, X. Atezolizumab plus bevacizumab versus active surveillance in patients with resected or ablated high-risk hepatocellular carcinoma (IMbrave050): A randomised, open-label, multicentre, phase 3 trial. Lancet 2023, 402, 1835–1847. [Google Scholar] [CrossRef]
- Raoul, J.-L.; Forner, A.; Bolondi, L.; Cheung, T.T.; Kloeckner, R.; de Baere, T. Updated use of TACE for hepatocellular carcinoma treatment: How and when to use it based on clinical evidence. Cancer Treat. Rev. 2019, 72, 28–36. [Google Scholar] [CrossRef]
- Abou-Alfa, G.K.; Lau, G.; Kudo, M.; Chan, S.L.; Kelley, R.K.; Furuse, J.; Sukeepaisarnjaroen, W.; Kang, Y.-K.; Van Dao, T.; De Toni, E.N. Tremelimumab plus durvalumab in unresectable hepatocellular carcinoma. NEJM Evid. 2022, 1, EVIDoa2100070. [Google Scholar] [CrossRef]
- Kudo, M.; Finn, R.S.; Qin, S.; Han, K.-H.; Ikeda, K.; Piscaglia, F.; Baron, A.; Park, J.-W.; Han, G.; Jassem, J. Lenvatinib versus sorafenib in first-line treatment of patients with unresectable hepatocellular carcinoma: A randomised phase 3 non-inferiority trial. Lancet 2018, 391, 1163–1173. [Google Scholar] [CrossRef]
- Yang, C.; Zhang, H.; Zhang, L.; Zhu, A.X.; Bernards, R.; Qin, W.; Wang, C. Evolving therapeutic landscape of advanced hepatocellular carcinoma. Nat. Rev. Gastroenterol. Hepatol. 2023, 20, 203–222. [Google Scholar] [CrossRef]
- Chandran, U.; Mehendale, N.; Patil, S.; Chaguturu, R.; Patwardhan, B. Network Pharmacology. In Innovative Approaches in Drug Discovery; Elsevier: Amsterdam, The Netherlands, 2017; pp. 127–164. [Google Scholar]
- Zhang, S.; Lin, T.; Xiong, X.; Chen, C.; Tan, P.; Wei, Q. Targeting histone modifiers in bladder cancer therapy—Preclinical and clinical evidence. Nat. Rev. Urol. 2024, 21, 495–511. [Google Scholar] [CrossRef]
- Li, Y.; Seto, E. HDACs and HDAC Inhibitors in Cancer Development and Therapy. Cold Spring Harb Perspect Med. 2016, 6, a026831. [Google Scholar] [CrossRef]
- He, G.; Karin, M. NF-κB and STAT3–key players in liver inflammation and cancer. Cell Res. 2011, 21, 159–168. [Google Scholar] [CrossRef] [PubMed]
- Hin Tang, J.J.; Hao Thng, D.K.; Lim, J.J.; Toh, T.B. JAK/STAT signaling in hepatocellular carcinoma. Hepatic. Oncol. 2020, 7, HEP18. [Google Scholar] [CrossRef]
- Kan, Z.; Zheng, H.; Liu, X.; Li, S.; Barber, T.D.; Gong, Z.; Gao, H.; Hao, K.; Willard, M.D.; Xu, J. Whole-genome sequencing identifies recurrent mutations in hepatocellular carcinoma. Genome Res. 2013, 23, 1422–1433. [Google Scholar] [CrossRef] [PubMed]
- Siveen, K.S.; Sikka, S.; Surana, R.; Dai, X.; Zhang, J.; Kumar, A.P.; Tan, B.K.; Sethi, G.; Bishayee, A. Targeting the STAT3 signaling pathway in cancer: Role of synthetic and natural inhibitors. Biochim. Et Biophys. Acta (BBA)-Rev. Cancer 2014, 1845, 136–154. [Google Scholar] [CrossRef] [PubMed]
- Xia, Y.; Sun, M.; Huang, H.; Jin, W.-L. Drug repurposing for cancer therapy. Signal Transduct. Target. Ther. 2024, 9, 92. [Google Scholar] [CrossRef]
- Reina, J.; Iglesias, C. Nirmatrelvir plus ritonavir (Paxlovid) a potent SARS-CoV-2 3CLpro protease inhibitor combination. Rev. Esp. De Quimioter. Publ. Of. De La Soc. Esp. De Quimioter. 2022, 35, 236–240. [Google Scholar] [CrossRef]
- Chakraborty, C.; Bhattacharya, M.; Alshammari, A.; Alharbi, M.; Albekairi, T.H.; Zheng, C. Exploring the structural and molecular interaction landscape of nirmatrelvir and Mpro complex: The study might assist in designing more potent antivirals targeting SARS-CoV-2 and other viruses. J. Infect. Public Health 2023, 16, 1961–1970. [Google Scholar] [CrossRef]
- Zhang, W.; Yang, Z.; Zhou, F.; Wei, Y.; Ma, X. Network pharmacology and bioinformatics analysis identifies potential therapeutic targets of paxlovid against LUAD/COVID-19. Front. Endocrinol. 2022, 13, 935906. [Google Scholar] [CrossRef]
- Haddad, A.J.; Hachem, R.Y.; Moussa, M.; Jiang, Y.; Dagher, H.R.; Chaftari, P.; Chaftari, A.-M.; Raad, I.I. Comparing molnupiravir to nirmatrelvir/ritonavir (Paxlovid) in the treatment of mild-to-moderate COVID-19 in immunocompromised cancer patients. Cancers 2024, 16, 1055. [Google Scholar] [CrossRef]
- Zhuang, D.-Y.; Jiang, L.; He, Q.-Q.; Zhou, P.; Yue, T. Identification of hub subnetwork based on topological features of genes in breast cancer. Int. J. Mol. Med. 2015, 35, 664–674. [Google Scholar] [CrossRef]
- Safari-Alighiarloo, N.; Taghizadeh, M.; Rezaei-Tavirani, M.; Goliaei, B.; Peyvandi, A.A. Protein-protein interaction networks (PPI) and complex diseases. Gastroenterol. Hepatol. Bed. Bench. 2014, 7, 17. [Google Scholar]
- Laudisi, F.; Cherubini, F.; Monteleone, G.; Stolfi, C. STAT3 interactors as potential therapeutic targets for cancer treatment. Int. J. Mol. Sci. 2018, 19, 1787. [Google Scholar] [CrossRef]
- Senese, S.; Zaragoza, K.; Minardi, S.; Muradore, I.; Ronzoni, S.; Passafaro, A.; Bernard, L.; Draetta, G.F.; Alcalay, M.; Seiser, C. Role for histone deacetylase 1 in human tumor cell proliferation. Mol. Cell. Biol. 2007, 27, 4784–4795. [Google Scholar] [CrossRef]
- Cao, L.-L.; Song, X.; Pei, L.; Liu, L.; Wang, H.; Jia, M. Histone deacetylase HDAC1 expression correlates with the progression and prognosis of lung cancer: A meta-analysis. Medicine 2017, 96, e7663. [Google Scholar] [CrossRef] [PubMed]
- Park, J.H.; Hong, Y.S.; Choi, P.J.; Kim, N.Y.; Lee, K.E.; Roh, M.S. The overexpression of histone deacetylase 1 and its relationship with p16INK4a gene hypermethylation in pulmonary squamous cell carcinoma and adenocarcinoma. Korean J. Pathol. 2009, 43, 107. [Google Scholar] [CrossRef]
- Adhikari, N.; Amin, S.A.; Trivedi, P.; Jha, T.; Ghosh, B. HDAC3 is a potential validated target for cancer: An overview on the benzamide-based selective HDAC3 inhibitors through comparative SAR/QSAR/QAAR approaches. Eur. J. Med. Chem. 2018, 157, 1127–1142. [Google Scholar] [CrossRef] [PubMed]
- Tang, Z.; Li, C.; Kang, B.; Gao, G.; Li, C.; Zhang, Z. GEPIA: A web server for cancer and normal gene expression profiling and interactive analyses. Nucleic Acids Res. 2017, 45, W98–W102. [Google Scholar] [CrossRef]
- Agu, P.; Afiukwa, C.; Orji, O.; Ezeh, E.; Ofoke, I.; Ogbu, C.; Ugwuja, E.; Aja, P. Molecular docking as a tool for the discovery of molecular targets of nutraceuticals in diseases management. Sci. Rep. 2023, 13, 13398. [Google Scholar] [CrossRef]
- Zhou, H.; Wang, C.; Ye, J.; Chen, H.; Tao, R. Design, virtual screening, molecular docking and molecular dynamics studies of novel urushiol derivatives as potential HDAC2 selective inhibitors. Gene 2017, 637, 63–71. [Google Scholar] [CrossRef]
- Nkansah, E. In Vitro Studies of STAT3 Dimerisation and DNA Binding; University of London; University College London: London, UK, 2011. [Google Scholar]
- Timofeeva, O.A.; Chasovskikh, S.; Lonskaya, I.; Tarasova, N.I.; Khavrutskii, L.; Tarasov, S.G.; Zhang, X.; Korostyshevskiy, V.R.; Cheema, A.; Zhang, L. Mechanisms of unphosphorylated STAT3 transcription factor binding to DNA. J. Biol. Chem. 2012, 287, 14192–14200. [Google Scholar] [CrossRef] [PubMed]
- Ullrich, S.; Nitsche, C. The SARS-CoV-2 main protease as drug target. Bioorganic Med. Chem. Lett. 2020, 30, 127377. [Google Scholar] [CrossRef] [PubMed]
- Asmamaw, M.D.; He, A.; Zhang, L.R.; Liu, H.M.; Gao, Y. Histone deacetylase complexes: Structure, regulation and function. Biochim. Biophys. Acta Rev. Cancer 2024, 1879, 189150. [Google Scholar] [CrossRef] [PubMed]
- Yu, T.; Sudhakar, N.; Okafor, C.D. Illuminating ligand-induced dynamics in nuclear receptors through MD simulations. Biochim. Et Biophys. Acta (BBA)-Gene Regul. Mech. 2024, 1867, 195025. [Google Scholar] [CrossRef]
- Bagewadi, Z.K.; Khan, T.Y.; Gangadharappa, B.; Kamalapurkar, A.; Shamsudeen, S.M.; Yaraguppi, D.A. Molecular dynamics and simulation analysis against superoxide dismutase (SOD) target of Micrococcus luteus with secondary metabolites from Bacillus licheniformis recognized by genome mining approach. Saudi J. Biol. Sci. 2023, 30, 103753. [Google Scholar] [CrossRef]
- Fatriansyah, J.F.; Boanerges, A.G.; Kurnianto, S.R.; Pradana, A.F.; Surip, S.N. Molecular Dynamics Simulation of Ligands from Anredera cordifolia (Binahong) to the Main Protease (M pro) of SARS-CoV-2. J. Trop. Med. 2022, 2022, 1178228. [Google Scholar] [CrossRef]
- Ghufran, M.; Khan, H.A.; Ullah, M.; Ghufran, S.; Ayaz, M.; Siddiq, M.; Bungau, S. In silico strategies for designing of peptide inhibitors of oncogenic K-ras G12V mutant: Inhibiting cancer growth and proliferation. Cancers 2022, 14, 4884. [Google Scholar] [CrossRef]
- Suleman, M.; Yousafi, Q.; Ali, J.; Ali, S.S.; Hussain, Z.; Ali, S.; Waseem, M.; Iqbal, A.; Ahmad, S.; Khan, A. Bioinformatics analysis of the differences in the binding profile of the wild-type and mutants of the SARS-CoV-2 spike protein variants with the ACE2 receptor. Comput. Biol. Med. 2021, 138, 104936. [Google Scholar] [CrossRef]
- Wang, E.; Sun, H.; Wang, J.; Wang, Z.; Liu, H.; Zhang, J.Z.; Hou, T. End-point binding free energy calculation with MM/PBSA and MM/GBSA: Strategies and applications in drug design. Chem. Rev. 2019, 119, 9478–9508. [Google Scholar] [CrossRef]
- Association, K.L.C. 2022 KLCA-NCC Korea practice guidelines for the management of hepatocellular carcinoma. Korean J. Radiol. 2022, 23, 1126. [Google Scholar] [CrossRef]
- Marrero, J.A.; Kulik, L.M.; Sirlin, C.B.; Zhu, A.X.; Finn, R.S.; Abecassis, M.M.; Roberts, L.R.; Heimbach, J.K. Diagnosis, staging, and management of hepatocellular carcinoma: 2018 practice guidance by the American Association for the Study of Liver Diseases. Hepatology 2018, 68, 723–750. [Google Scholar] [CrossRef]
- Omata, M.; Cheng, A.-L.; Kokudo, N.; Kudo, M.; Lee, J.M.; Jia, J.; Tateishi, R.; Han, K.-H.; Chawla, Y.K.; Shiina, S. Asia–Pacific clinical practice guidelines on the management of hepatocellular carcinoma: A 2017 update. Hepatol. Int. 2017, 11, 317–370. [Google Scholar] [CrossRef] [PubMed]
- Szklarczyk, D.; Gable, A.L.; Nastou, K.C.; Lyon, D.; Kirsch, R.; Pyysalo, S.; Doncheva, N.T.; Legeay, M.; Fang, T.; Bork, P. The STRING database in 2021: Customizable protein–protein networks, and functional characterization of user-uploaded gene/measurement sets. Nucleic Acids Res. 2021, 49, D605–D612. [Google Scholar] [CrossRef] [PubMed]
- Doncheva, N.T.; Morris, J.H.; Holze, H.; Kirsch, R.; Nastou, K.C.; Cuesta-Astroz, Y.; Rattei, T.; Szklarczyk, D.; von Mering, C.; Jensen, L.J. Cytoscape stringApp 2.0: Analysis and visualization of heterogeneous biological networks. J. Proteome Res. 2022, 22, 637–646. [Google Scholar] [CrossRef]
- Otasek, D.; Morris, J.H.; Bouças, J.; Pico, A.R.; Demchak, B. Cytoscape automation: Empowering workflow-based network analysis. Genome Biol. 2019, 20, 185. [Google Scholar] [CrossRef] [PubMed]
- Lotia, S.; Montojo, J.; Dong, Y.; Bader, G.D.; Pico, A.R. Cytoscape app store. Bioinformatics 2013, 29, 1350–1351. [Google Scholar] [CrossRef]
- Chin, C.-H.; Chen, S.-H.; Wu, H.-H.; Ho, C.-W.; Ko, M.-T.; Lin, C.-Y. cytoHubba: Identifying hub objects and sub-networks from complex interactome. BMC Syst. Biol. 2014, 8, S11. [Google Scholar] [CrossRef]
- Ashburner, M.; Ball, C.A.; Blake, J.A.; Botstein, D.; Butler, H.; Cherry, J.M.; Davis, A.P.; Dolinski, K.; Dwight, S.S.; Eppig, J.T.; et al. Gene ontology: Tool for the unification of biology. Nat. Genet. 2000, 25, 25–29. [Google Scholar] [CrossRef]
- Alqahtani, S.M.; Altharawi, A.; Alabbas, A.; Ahmad, F.; Ayaz, H.; Nawaz, A.; Rahman, S.; Alossaimi, M.A. System biology approach to identify the novel biomarkers in glioblastoma multiforme tumors by using computational analysis. Front. Pharmacol. 2024, 15, 1364138. [Google Scholar] [CrossRef]
- Yang, L.; Wang, P.; Chen, J. 2dGBH: Two-dimensional group Benjamini–Hochberg procedure for false discovery rate control in two-way multiple testing of genomic data. Bioinformatics 2024, 40, btae035. [Google Scholar] [CrossRef]
- Hu, M.; Fu, X.; Si, Z.; Li, C.; Sun, J.; Du, X.; Zhang, H. Identification of differently expressed genes associated with prognosis and growth in colon adenocarcinoma based on integrated bioinformatics analysis. Front. Genet. 2019, 10, 1245. [Google Scholar] [CrossRef]
- Arabsalmani, M.; Mirzaei, M.; Ghoncheh, M.; Soroush, A.; Towhidi, F.; Salehiniya, H. Incidence and mortality of liver cancer and their relationship with the human development index in the world. Biomed. Res. Ther. 2016, 3, 2041–2047. [Google Scholar] [CrossRef]
- Batista-Silva, J.; Gomes, D.; Sousa, S.; Sousa, Â.; Passarinha, L. Advances in structure-based drug design targeting membrane protein markers in prostate cancer. Drug Discov. Today 2024, 29, 104130. [Google Scholar] [CrossRef] [PubMed]
- Koliopoulos, M.G.; Lethier, M.; van der Veen, A.G.; Haubrich, K.; Hennig, J.; Kowalinski, E.; Stevens, R.V.; Martin, S.R.; Reis e Sousa, C.; Cusack, S. Molecular mechanism of influenza A NS1-mediated TRIM25 recognition and inhibition. Nat. Commun. 2018, 9, 1820. [Google Scholar] [CrossRef] [PubMed]
- Zhang, S.; Krumberger, M.; Morris, M.A.; Parrocha, C.M.T.; Kreutzer, A.G.; Nowick, J.S. Structure-based drug design of an inhibitor of the SARS-CoV-2 (COVID-19) main protease using free software: A tutorial for students and scientists. Eur. J. Med. Chem. 2021, 218, 113390. [Google Scholar] [CrossRef]
- Sayaf, A.M.; Khalid, S.U.; Hameed, J.A.; Alshammari, A.; Khan, A.; Mohammad, A.; Alghamdi, S.; Wei, D.-Q.; Yeoh, K. Exploring the natural products chemical space through a molecular search to discover potential inhibitors that target the hypoxia-inducible factor (HIF) prolyl hydroxylase domain (PHD). Front. Pharmacol. 2023, 14, 1202128. [Google Scholar] [CrossRef]
- Makhloufi, A.; Ghemit, R.; El Kolli, M.; Baitiche, M. Computational investigation into Nirematrelvir/Ritonavir synergetic efficiency compared with some approved antiviral drugs targeting main protease (Mpro) SARS-CoV-2 Omicron variant. J. Indian Chem. Soc. 2023, 100, 100891. [Google Scholar] [CrossRef]
- Lagunin, A.A.; Rudik, A.V.; Pogodin, P.V.; Savosina, P.I.; Tarasova, O.A.; Dmitriev, A.V.; Ivanov, S.M.; Biziukova, N.Y.; Druzhilovskiy, D.S.; Filimonov, D.A. CLC-Pred 2.0: A freely available web application for in silico prediction of human cell line cytotoxicity and molecular mechanisms of action for druglike compounds. Int. J. Mol. Sci. 2023, 24, 1689. [Google Scholar] [CrossRef]
- Sayaf, A.M.; Kousar, K.; Suleman, M.; Albekairi, N.A.; Alshammari, A.; Mohammad, A.; Khan, A.; Agouni, A.; Yeoh, K.K. Molecular exploration of natural and synthetic compounds databases for promising hypoxia inducible factor (HIF) Prolyl-4-hydroxylase domain (PHD) inhibitors using molecular simulation and free energy calculations. BMC Chem. 2024, 18, 236. [Google Scholar] [CrossRef]
- Salomon-Ferrer, R.; Gotz, A.W.; Poole, D.; Le Grand, S.; Walker, R.C. Routine microsecond molecular dynamics simulations with AMBER on GPUs. 2. Explicit solvent particle mesh Ewald. J. Chem. Theory Comput. 2013, 9, 3878–3888. [Google Scholar] [CrossRef]
- Ryckaert, J.-P.; Ciccotti, G.; Berendsen, H.J. Numerical integration of the cartesian equations of motion of a system with constraints: Molecular dynamics of n-alkanes. J. Comput. Phys. 1977, 23, 327–341. [Google Scholar] [CrossRef]
- Luty, B.A.; Davis, M.E.; Tironi, I.G.; Van Gunsteren, W.F. A comparison of particle-particle, particle-mesh and Ewald methods for calculating electrostatic interactions in periodic molecular systems. Mol. Simul. 1994, 14, 11–20. [Google Scholar] [CrossRef]
- Lobanov, M.Y.; Bogatyreva, N.; Galzitskaya, O. Radius of gyration as an indicator of protein structure compactness. Mol. Biol. 2008, 42, 623–628. [Google Scholar] [CrossRef]

| GO ID | Description of Terms | Matching Proteins in the Network | False Discovery Rate (FDR) |
|---|---|---|---|
| Go Biological Processes | |||
| GO:0006476~ | protein deacetylation | HDAC3, HDAC1, HDAC6 | 0.004203419 |
| GO:0040029~ | epigenetic regulation of gene expression | HDAC5, HDAC3, HDAC6 | 0.027060077 |
| GO:0000165~ | MAPK cascade | AR, PRKCE, PTK2B | 0.088593245 |
| GO:2000273~ | positive regulation of signaling receptor activity | HDAC1, HDAC6 | 0.204044592 |
| GO:0006468~ | protein phosphorylation | PRKCE, PRKCD, PTK2B | 0.224965856 |
| GO:0080090~ | regulation of primary metabolic process | PRKCE, PRKCD | 0.224965856 |
| GO:0051279~ | regulation of release of sequestered calcium ions into cytosol | PRKCE, PTK2B | 0.224965856 |
| GO:0032930~ | positive regulation of superoxide anion generation | PRKCE, PRKCD | 0.259158844 |
| GO:0040014~ | regulation of multicellular organism growth | HDAC3, STAT3 | 0.261175273 |
| GO:0035902~ | response to immobilization stress | PTK2B, HDAC6 | 0.277327388 |
| GO:0030522~ | intracellular receptor signaling pathway | AR, STAT3 | 0.304683589 |
| GO:0051968~ | positive regulation of synaptic transmission, glutamatergic | PTK2B, HDAC6 | 0.304683589 |
| GO:0010634~ | positive regulation of epithelial cell migration | PRKCE, HDAC6 | 0.318624474 |
| GO:0042307~ | positive regulation of protein import into nucleus | HDAC3, PRKCD | 0.33956092 |
| GO:0010628~ | positive regulation of gene expression | AR, HDAC1, STAT3 | 0.33956092 |
| GO:0043066~ | negative regulation of apoptotic process | HDAC3, HDAC1, PTK2B | 0.33956092 |
| GO:0008284~ | positive regulation of cell population proliferation | AR, HDAC1, PTK2B | 0.33956092 |
| Go Cellular Components | |||
| GO:0005829~ | cytosol | HDAC5, AR, HDAC3, HDAC1, PRKCE, STAT3, PRKCD, PTK2B, HDAC6 | 0.005745823 |
| GO:0005737~ | cytoplasm | HDAC5, AR, HDAC3, HDAC1, PRKCE, STAT3, PRKCD, PTK2B, HDAC6 | 0.005810795 |
| GO:0005634~ | nucleus | HDAC5, AR, HDAC3, HDAC1, PRKCE, STAT3, PRKCD, PTK2B, HDAC6 | 0.005999562 |
| GO:0005654~ | nucleoplasm | HDAC5, AR, HDAC3, HDAC1, STAT3, PRKCD, HDAC6 | 0.030761078 |
| GO:0005886~ | plasma membrane | AR, HDAC3, PRKCE, STAT3, PRKCD, PTK2B, PLG | 0.106703595 |
| GO:0005794~ | Golgi apparatus | HDAC5, HDAC3, PRKCE | 0.43544037 |
| Go Molecular Function | |||
| GO:0019899~ | enzyme binding | AR, HDAC3, HDAC1, PRKCE, PRKCD, PLG, HDAC6 | 1.14 × 10⁻⁷ |
| GO:0033558~ | protein lysine deacetylase activity | HDAC5, HDAC3, HDAC1, HDAC6 | 1.80 × 10⁻⁷ |
| GO:0004407~ | histone deacetylase activity | HDAC5, HDAC3, HDAC1, HDAC6 | 5.49 × 10⁻⁷ |
| GO:0001222~ | transcription corepressor binding | HDAC5, HDAC3, HDAC1, HDAC6 | 1.00 × 10⁻⁵ |
| GO:0042903~ | tubulin deacetylase activity | HDAC3, HDAC1, HDAC6 | 2.73 × 10⁻⁵ |
| GO:0042826~ | histone deacetylase binding | HDAC5, HDAC3, HDAC1, HDAC6 | 1.49 × 10⁻⁴ |
| GO:0140297~ | DNA-binding transcription factors | HDAC5, HDAC3, HDAC1, STAT3 | 3.26 × 10⁻⁴ |
| GO:0061629~ | RNA polymerase II-specific DNA-binding transcription factors | HDAC5, AR, HDAC1, STAT3 | 3.71 × 10⁻⁴ |
| GO:0160216~ | protein lysine deacetylase activity | HDAC3, HDAC1 | 0.006927449 |
| GO:0000978~ | RNA polymerase II cis-regulatory region sequence-specific DNA binding | HDAC5, AR, HDAC1, STAT3, HDAC6 | 0.006927449 |
| GO:0160008~ | protein decrotonylase activity | HDAC3, HDAC1 | 0.00788652 |
| GO:0160009~ | histone decrotonylase activity | HDAC3, HDAC1 | 0.00788652 |
| GO:0000976~ | transcription cis-regulatory region binding | HDAC5, AR, STAT3 | 0.021646237 |
| GO:0004699~ | diacylglycerol-dependent, calcium-independent serine/threonine kinase activity | PRKCE, PRKCD | 0.025483135 |
| KEGG Pathways | |||
| hsa05203: | viral carcinogenesis | HDAC5, HDAC3, HDAC1, STAT3, HDAC6 | 0.002396235 |
| hsa05206: | microRNAs in cancer | HDAC5, HDAC1, PRKCE, STAT3 | 0.058065466 |
| hsa04933: | AGE-RAGE signaling pathway in diabetic complications | PRKCE, STAT3, PRKCD | 0.063717187 |
| hsa04931: | insulin resistance | PRKCE, STAT3, PRKCD | 0.063717187 |
| hsa04062: | chemokine signaling pathway | STAT3, PRKCD, PTK2B | 0.164458095 |
| hsa04930: | type II diabetes mellitus | PRKCE, PRKCD | 0.438158384 |
| hsa04912: | GnRH signaling pathway | PRKCD, PTK2B | 0.613147394 |
| hsa04750: | inflammatory mediator regulation of TRP channels | PRKCE, PRKCD | 0.613147394 |
| hsa04666: | Fc-gamma R-mediated phagocytosis | PRKCE, PRKCD | 0.613147394 |
| hsa05200: | pathways in cancer | AR, HDAC1, STAT3 | 0.613147394 |
| Complex | Docking Score | Ligand Functional Group | P300 (1P4Q) | Interaction | Distance (Å) |
|---|---|---|---|---|---|
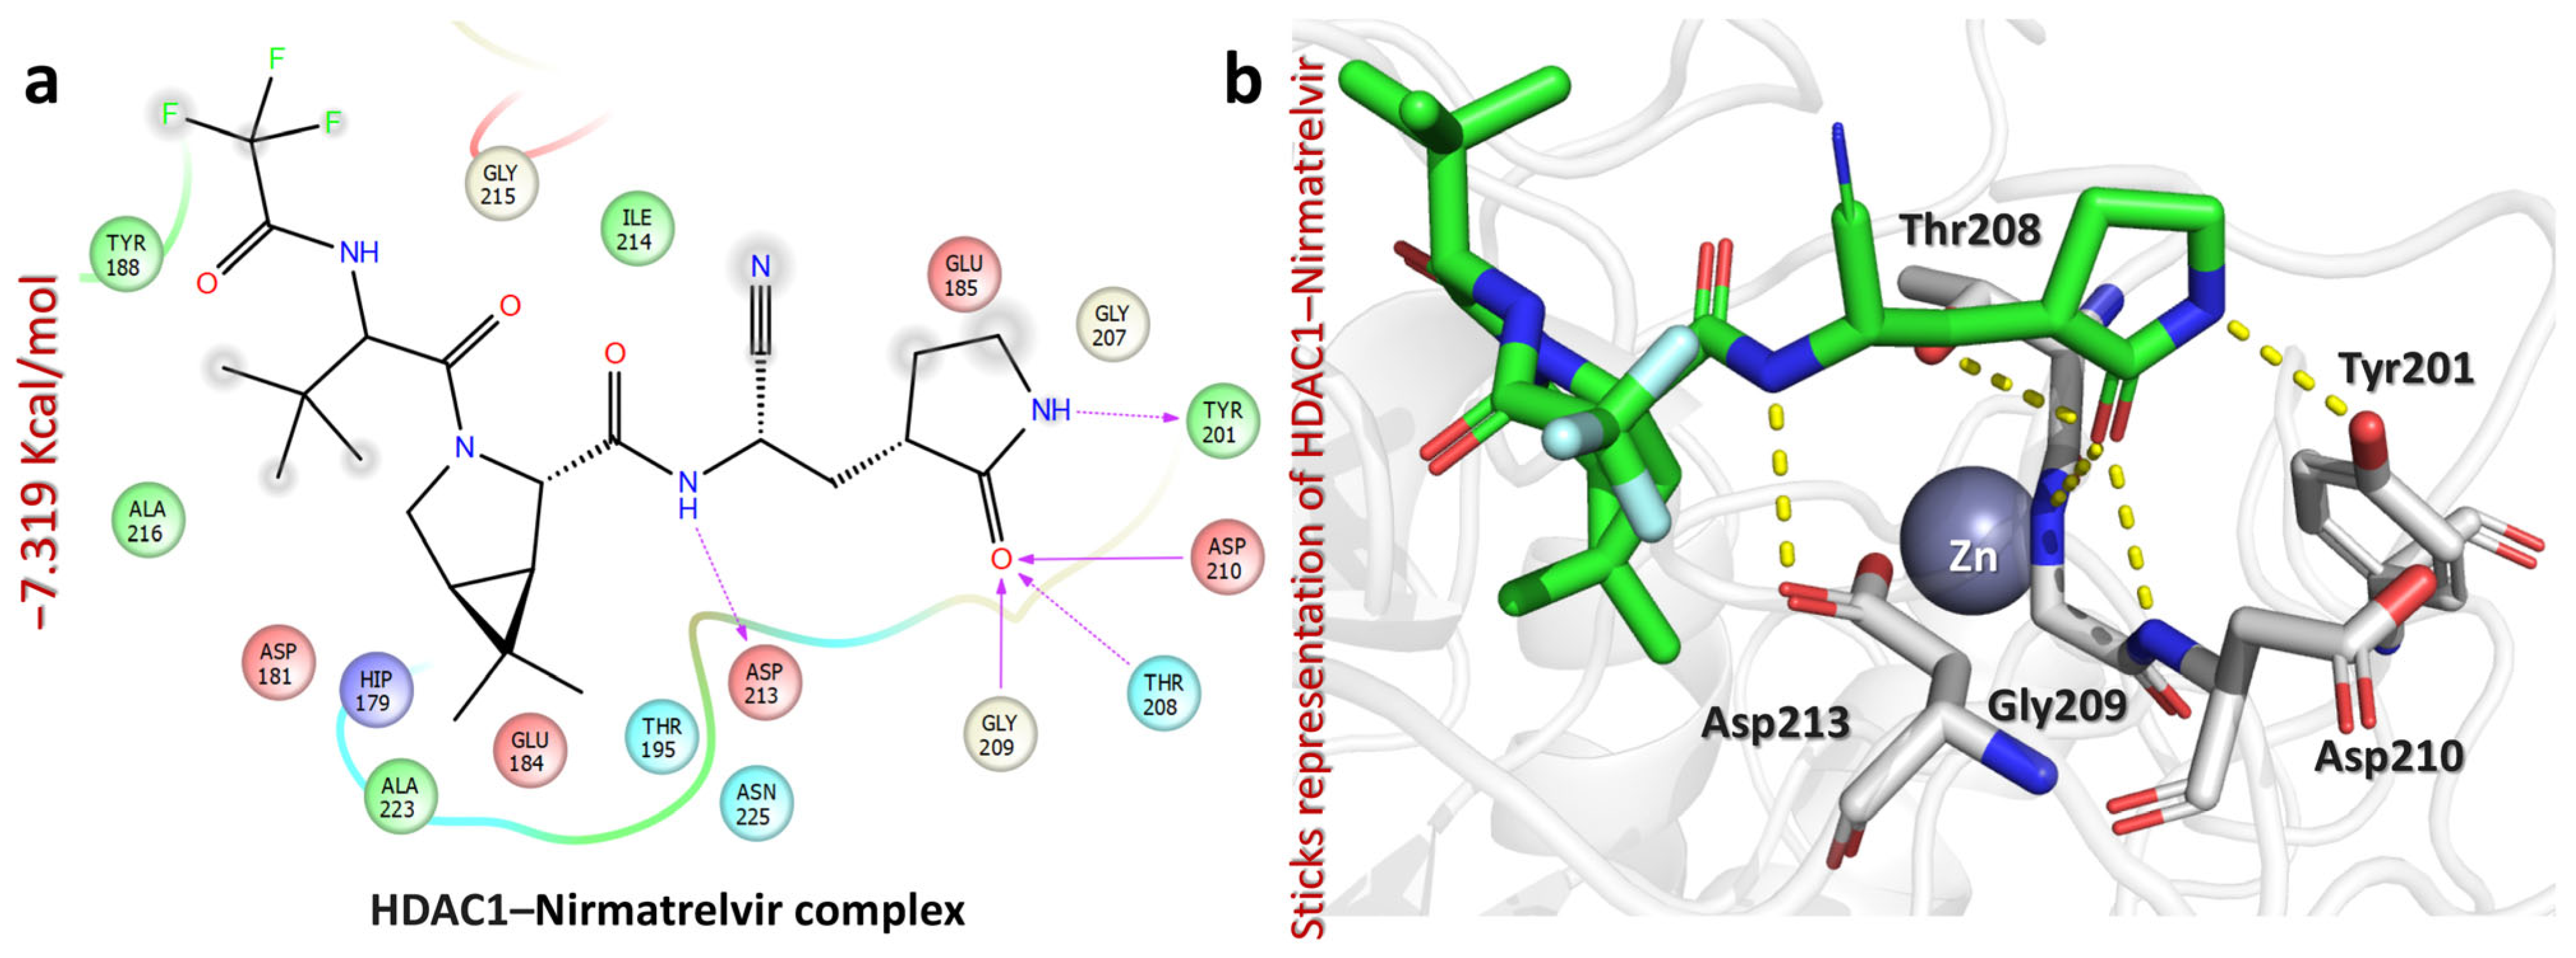
| HDAC1–Nirmatrelvir complex | −7.319 | NH(pyrrolidin-2-one) | Tyr201 | HB | 2.06 |
| CO(pyrrolidin-2-one) | Thr208 | HB | 2.39 | ||
| CO(pyrrolidin-2-one) | Gly209 | HB | 2.10 | ||
| CO(pyrrolidin-2-one) | Asp210 | HB | 2.17 | ||
| NH(amide) | Asp213 | HB | 2.00 | ||
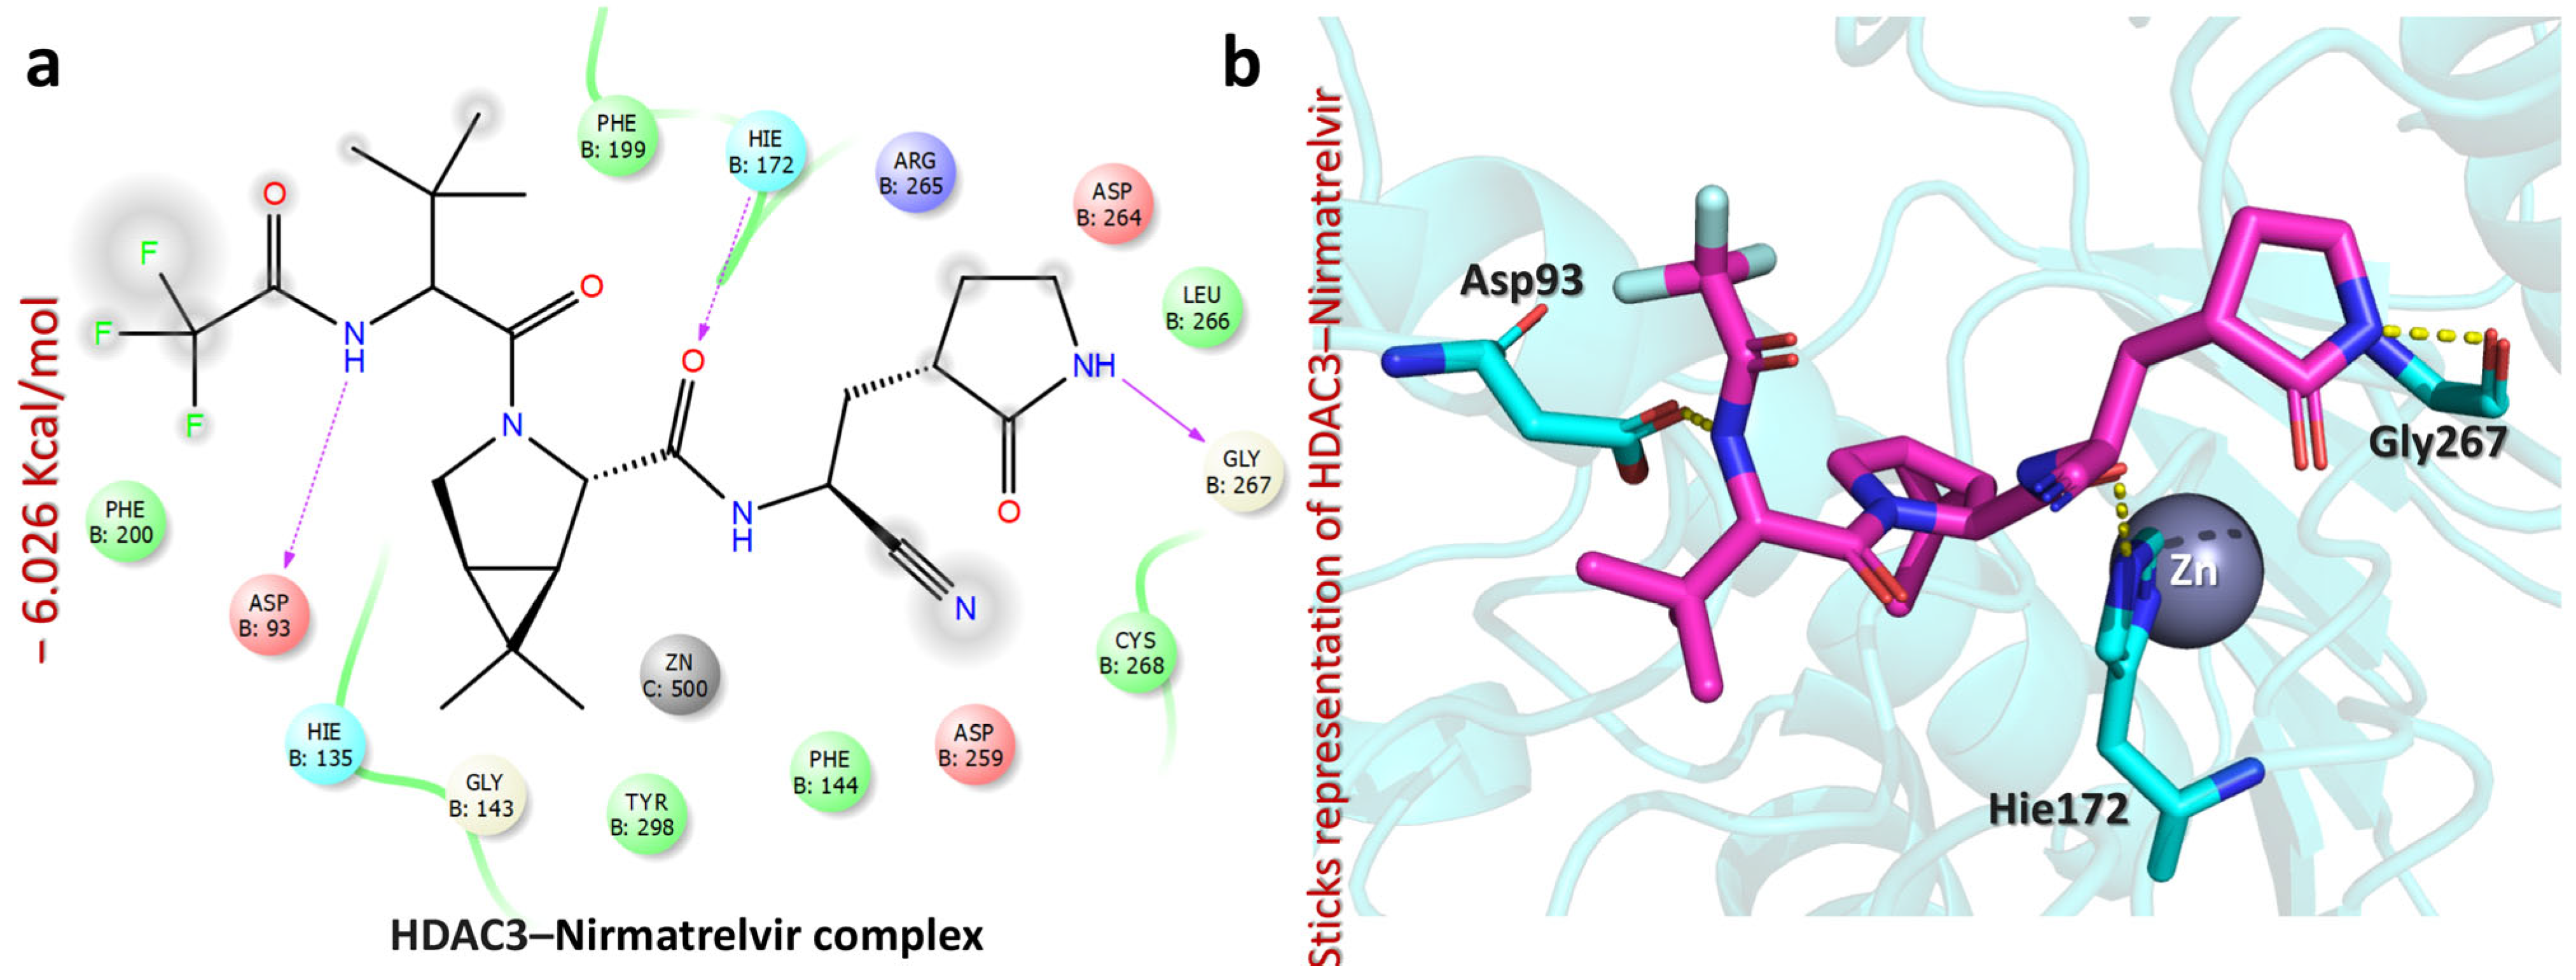
| HDAC3–Nirmatrelvir complex | −6.026 | CO(trifluoroacetamide) | Asp93 | HB | 1.92 |
| CO(cyanoethyl)acetamide | Hie172 | HB | 1.93 | ||
| NH(pyrrolidin-2-one) | Gly267 | HB | 2.05 | ||
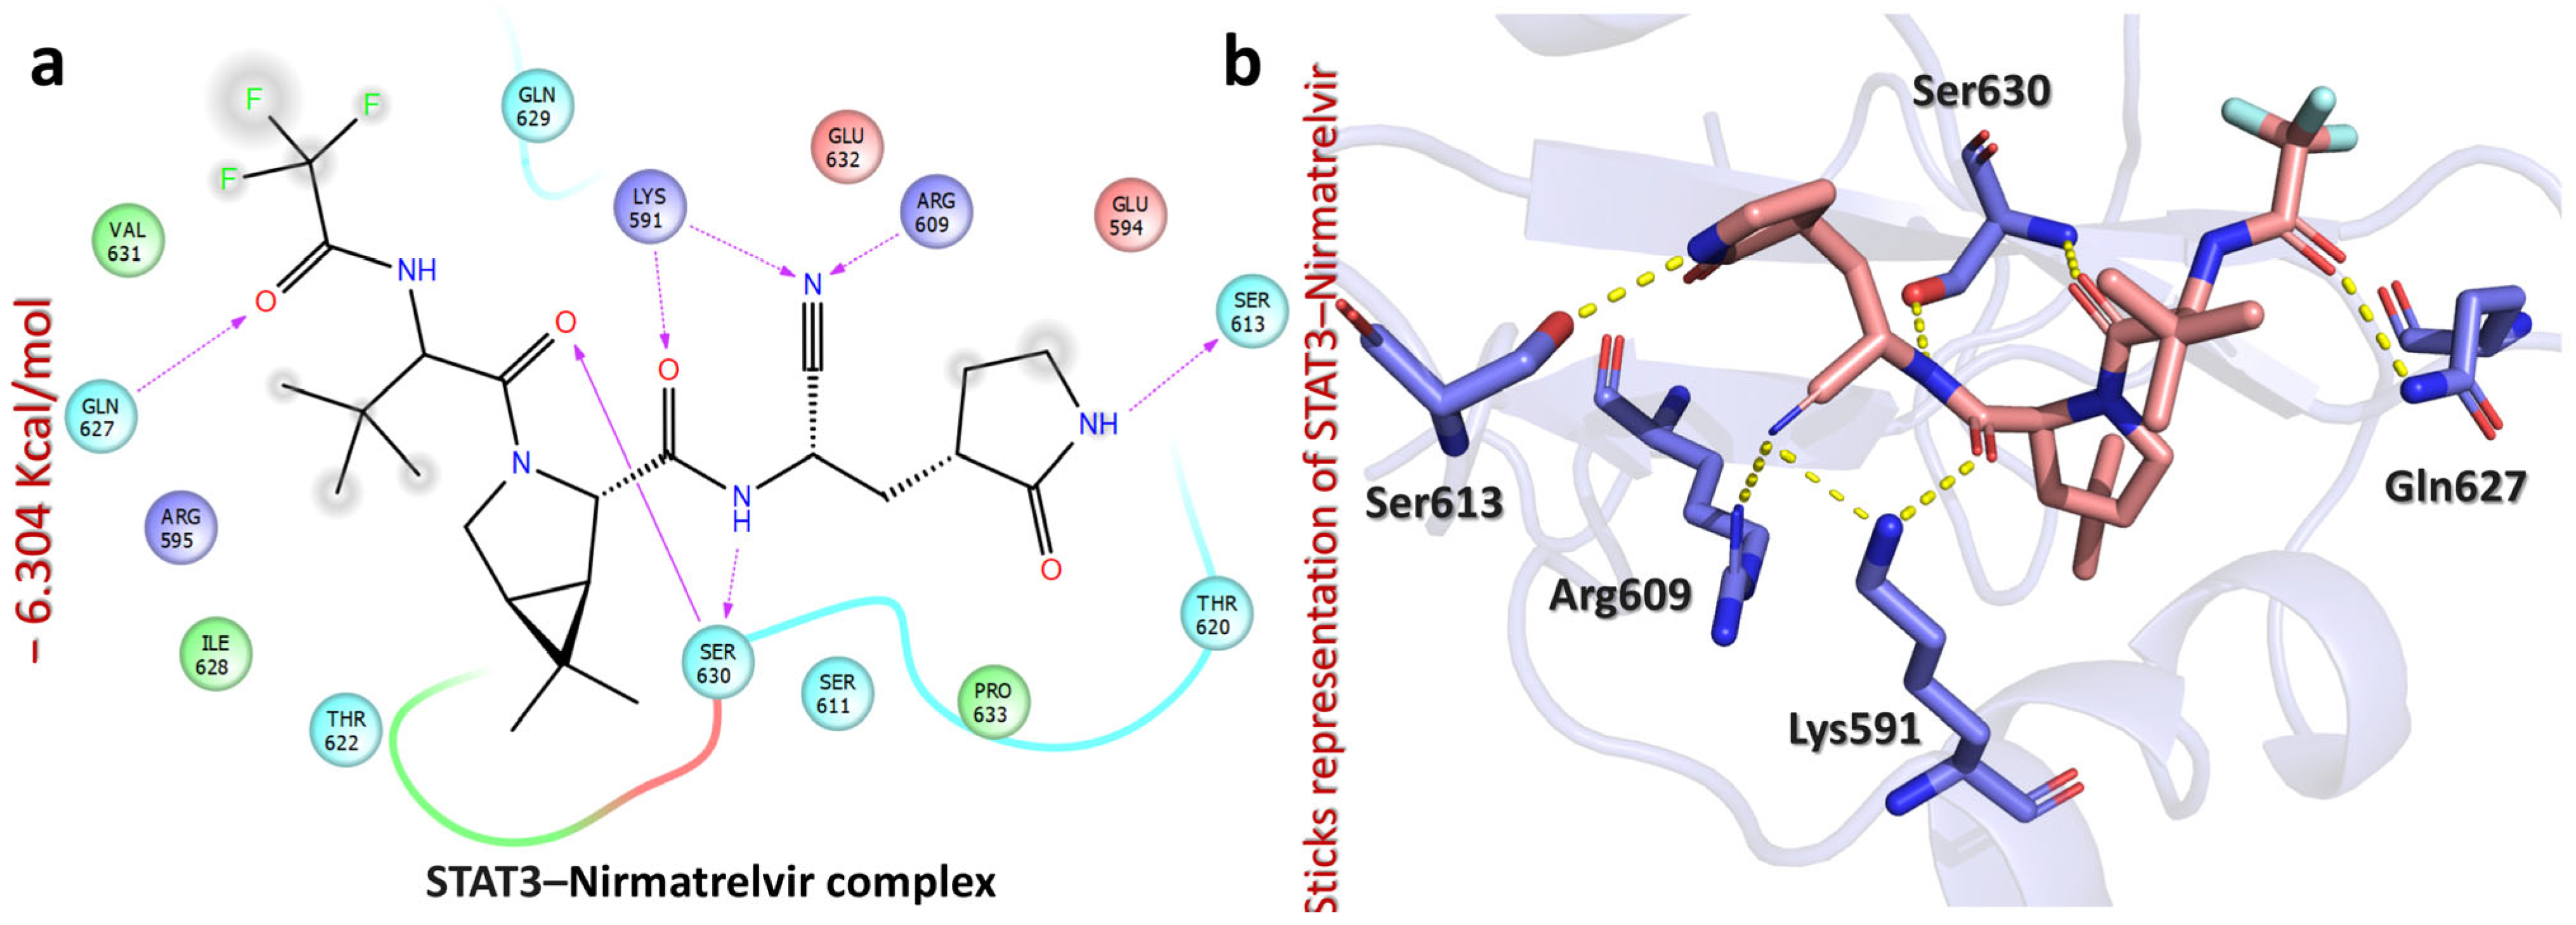
| STAT3–Nirmatrelvir complex | −6.304 | CO(cyanoethyl)acetamide | Lys591 | HB | 2.05 |
| N(cyanoethyl)acetamide | Lys591 | HB | 2.41 | ||
| N(cyanoethyl)acetamide | Arg609 | HB | 2.24 | ||
| N(cyanoethyl)acetamide | Ser630 | HB | 1.83 | ||
| CO(amide) | Ser630 | HB | 2.31 | ||
| NH(pyrrolidin-2-one) | Ser613 | HB | 1.92 | ||
| CO(trifluoroacetamide) | Gln627 | HB | 1.74 |
| MM/GBSA | |||
| Parameters | Nirmatrelvir–HDAC1 | Nirmatrelvir–HDAC3 | Nirmatrelvir–STAT3 |
| ΔEvdw | −31.5788 ± 0.61 | −40.0338 ± 0.55 | −27.4311 ± 0.38 |
| ΔEele | −2.4940 ± 0.40 | −0.9344 ± 0.28 | −2.2372 ± 0.37 |
| EGB | 14.2238 ± 0.52 | 12.4600 ± 0.36 | 11.4875 ± 0.33 |
| ESURF | −3.8437 ± 0.08 | −4.8585 ± −0.05 | −2.9870 ± 0.03 |
| Delta G Gas | −34.0728 ± 0.71 | −40.9682 ± 0.75 | −29.6683 ± 0.63 |
| Delta G Solv | 10.3801 ± 0.47 | 7.6014 ± 0.32 | 8.5005 ± 0.32 |
| ∆G total | −23.6927 ± 0.42 | −33.3667 ± 0.50 | −21.1677 ± 0.39 |
| MM/PBSA | |||
| Parameters | Nirmatrelvir–HDAC1 | Nirmatrelvir–HDAC3 | Nirmatrelvir–STAT3 |
| ΔEvdw | −31.5788 ± 0.61 | −40.0338 ± 0.55 | −27.4311 ± 0.38 |
| ΔEele | −2.4940 ± 0.40 | −0.9344 ± 0.28 | −2.2372 ± 0.37 |
| EPB | 19.0255 ± 0.84 | 16.6451 ± 0.58 | 15.0775 ± 0.45 |
| ENPOLAR | −2.9402 ± 0.05 | −3.4440 ± 0.02 | −2.3957 ± 0.02 |
| Delta G Gas | −34.0728 ± 0.71 | −40.9682 ± 0.75 | −29.6683 ± 0.63 |
| Delta G Solv | 16.0853 ± 0.80 | 13.2011 ± 0.56 | 12.6818 ± 0.44 |
| ∆G total | −17.9875 ± 0.56 | −27.7671 ± 0.64 | −16.9865 ± 0.49 |
Disclaimer/Publisher’s Note: The statements, opinions and data contained in all publications are solely those of the individual author(s) and contributor(s) and not of MDPI and/or the editor(s). MDPI and/or the editor(s) disclaim responsibility for any injury to people or property resulting from any ideas, methods, instructions or products referred to in the content. |
© 2025 by the authors. Licensee MDPI, Basel, Switzerland. This article is an open access article distributed under the terms and conditions of the Creative Commons Attribution (CC BY) license (https://creativecommons.org/licenses/by/4.0/).
Share and Cite
Suleman, M.; Arbab, H.; Yassine, H.M.; Sayaf, A.M.; Ilahi, U.; Alissa, M.; Alghamdi, A.; Alghamdi, S.A.; Crovella, S.; Shaito, A.A. Repurposing Nirmatrelvir for Hepatocellular Carcinoma: Network Pharmacology and Molecular Dynamics Simulations Identify HDAC3 as a Key Molecular Target. Pharmaceuticals 2025, 18, 1144. https://doi.org/10.3390/ph18081144
Suleman M, Arbab H, Yassine HM, Sayaf AM, Ilahi U, Alissa M, Alghamdi A, Alghamdi SA, Crovella S, Shaito AA. Repurposing Nirmatrelvir for Hepatocellular Carcinoma: Network Pharmacology and Molecular Dynamics Simulations Identify HDAC3 as a Key Molecular Target. Pharmaceuticals. 2025; 18(8):1144. https://doi.org/10.3390/ph18081144
Chicago/Turabian StyleSuleman, Muhammad, Hira Arbab, Hadi M. Yassine, Abrar Mohammad Sayaf, Usama Ilahi, Mohammed Alissa, Abdullah Alghamdi, Suad A. Alghamdi, Sergio Crovella, and Abdullah A. Shaito. 2025. "Repurposing Nirmatrelvir for Hepatocellular Carcinoma: Network Pharmacology and Molecular Dynamics Simulations Identify HDAC3 as a Key Molecular Target" Pharmaceuticals 18, no. 8: 1144. https://doi.org/10.3390/ph18081144
APA StyleSuleman, M., Arbab, H., Yassine, H. M., Sayaf, A. M., Ilahi, U., Alissa, M., Alghamdi, A., Alghamdi, S. A., Crovella, S., & Shaito, A. A. (2025). Repurposing Nirmatrelvir for Hepatocellular Carcinoma: Network Pharmacology and Molecular Dynamics Simulations Identify HDAC3 as a Key Molecular Target. Pharmaceuticals, 18(8), 1144. https://doi.org/10.3390/ph18081144