Article

Secondary Metabolites from Rehmannia glutinosa Protect Mitochondrial Function in LPS-Injured Endothelial Cells

1
State Key Laboratory of Bioactive Substances and Function of Natural Medicines, Institute of Medicinal Plant Development, Chinese Academy of Medical Sciences and Peking Union Medical College, Beijing 100193, China
2
College of Traditional Chinese Medicine, Shandong University of Traditional Chinese Medicine, Jinan 250355, China
3
Xiyuan Hospital, China Academy of Chinese Medical Sciences, Beijing 100091, China
*
Authors to whom correspondence should be addressed.
These authors contributed equally to this work.
Pharmaceuticals 2025, 18(8), 1125; https://doi.org/10.3390/ph18081125
Submission received: 1 July 2025 / Revised: 18 July 2025 / Accepted: 24 July 2025 / Published: 27 July 2025

Abstract

Background: Rehmannia glutinosa, a traditional Chinese herb, is commonly used to treat vascular-related disorders. Sepsis-associated vascular endothelial dysfunction is closely associated with mitochondrial damage. This study investigated the protective effects of secondary metabolites from R. glutinosa against LPS-induced mitochondrial dysfunction in endothelial cells, providing potential therapeutic insights into sepsis-related vascular complications. Methods: Phytochemical profiling of fresh R. glutinosa roots was conducted, and the structures of new secondary metabolites (1 and 2) were elucidated through comprehensive spectroscopic analysis and ECD calculations. UPLC-Q-TOF-MS/MS characterized phenylethanoid glycosides. Mitochondrial function was assessed by measuring the membrane potential, ROS levels, and TOM20/DRP1 expression in LPS-injured HUVECs. Results: Two novel eremophilane-type sesquiterpenes, remophilanetriols J (1) and K (2), along with five known phenylethanoid glycosides (37), were isolated from the fresh roots of R. glutinosa. UPLC-Q-TOF-MS/MS analysis revealed unique fragmentation pathways for phenylethanoid glycosides (37). In LPS-injured HUVECs, all compounds collectively restored the mitochondrial membrane potential, attenuated ROS accumulation, and modulated TOM20/DRP1 expression. In particular, remophilanetriol K (2) exhibited potent protective effects at a low concentration (1.5625 μM). Conclusions: This study identifies R. glutinosa metabolites as potential therapeutics for sepsis-associated vascular dysfunction by preserving mitochondrial homeostasis. This study provides a mechanistic basis for the traditional use of R. glutinosa and offers valuable insights into the development of novel therapeutics targeting mitochondrial dysfunction in sepsis.

Graphical Abstract

1. Introduction

Rehmannia glutinosa Libosch., a classical medicinal herb belonging to the Scrophulariaceae family, was first recorded in Shennong’s Classic of Materia Medica for its efficacy in “dispelling blood stasis and replenishing marrow essence” [1]. Contemporary pharmacological investigations have demonstrated that fresh R. glutinosa rhizomes contain various bioactive constituents that possess significant antioxidant, anti-inflammatory, and vasculoprotective properties [2,3]. These pharmacological properties are consistent with its traditional indications for vascular-related disorders, such as heat entering the nutritive blood level, and hemorrhagic symptoms, including macules, eruptions, hematemesis, and epistaxis [4].
In recent years, studies have demonstrated that sepsis-associated vascular endothelial dysfunction serves as a pivotal contributor to pathological conditions, such as circulatory instability, immune dysregulation, and multi-organ dysfunction [5,6]. Lipopolysaccharide (LPS)-triggered mitochondrial impairment intensifies endothelial barrier damage by promoting excessive reactive oxygen species (ROS) generation and disrupting energy metabolism [7,8,9]. While previous studies have demonstrated the efficacy of R. glutinosa extracts in mitigating sepsis-associated renal injury [10] and the clinical utility of related compound formulations such as Xijiao Dihuang Decoction [11], the specific effects of its bioactive constituents on LPS-induced vascular endothelial injury remain unknown.
To bridge this knowledge gap, phytochemical profiling of fresh R. glutinosa roots was conducted, leading to the isolation and structural characterization of two novel eremophilane-type sesquiterpenes (12) and five known phenylethanol glycosides (37). Eremophilane-type sesquiterpenes, characterized by a trans-decalin core bearing a transannular isopropenyl group, are predominantly reported in the Asteraceae family, with only a limited number identified in the Scrophulariaceae family [12]. To date, merely 12 structurally distinct eremophilane-type sesquiterpenes have been isolated from R. glutinosa (Table S1). Existing evidence indicates that eremophilane-type sesquiterpenes and phenylethanol glycosides exhibit diverse pharmacological properties, including antibacterial, anti-inflammatory, and antioxidant activities, implying their potential therapeutic value in the management of sepsis [13,14]. To further characterize the pharmacological potential of these compounds, an LPS-induced injury model in human umbilical vein endothelial cells (HUVECs) was employed to systematically evaluate the effects of these compounds on mitochondrial morphology, membrane potential dynamics, reactive oxygen species (ROS) accumulation, and expression patterns of key mitochondrial proteins. These results provide new insights into the classical “cooling blood and dispersing stasis” action of R. glutinosa and reveal potential molecular targets that could inform the future development of mitochondria-targeted therapies for sepsis-associated vascular dysfunction.

2. Results and Discussion

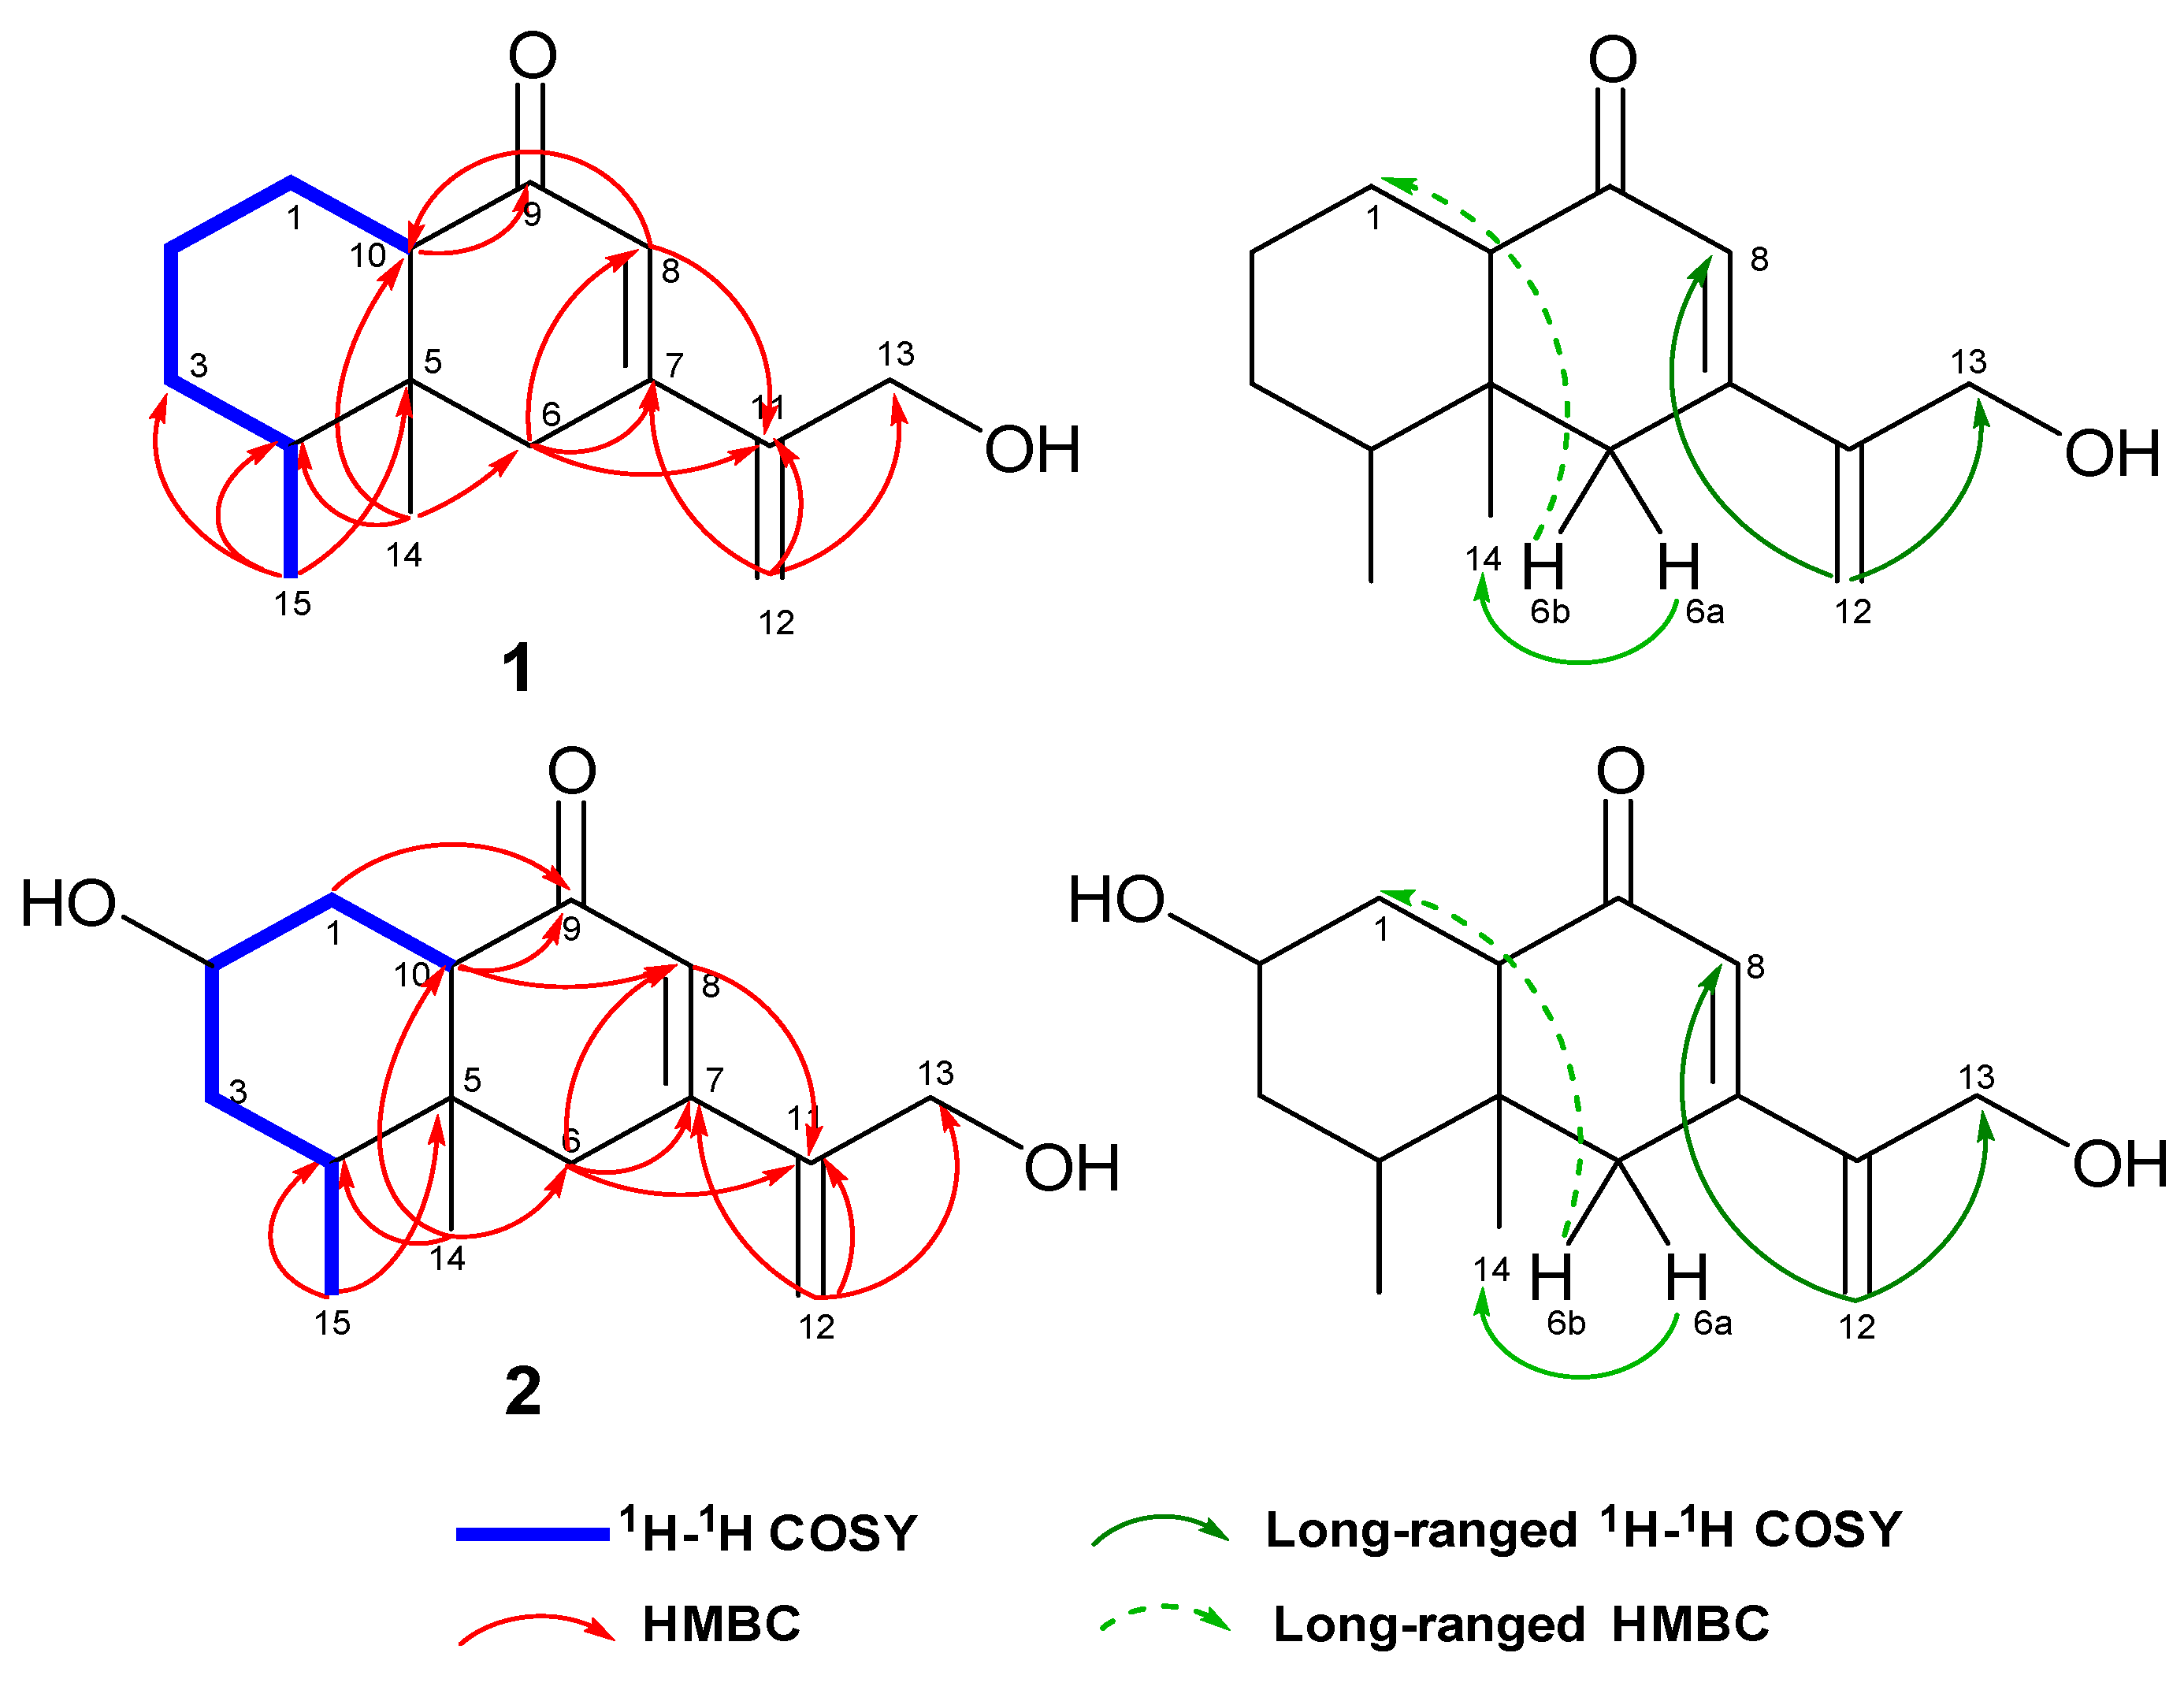
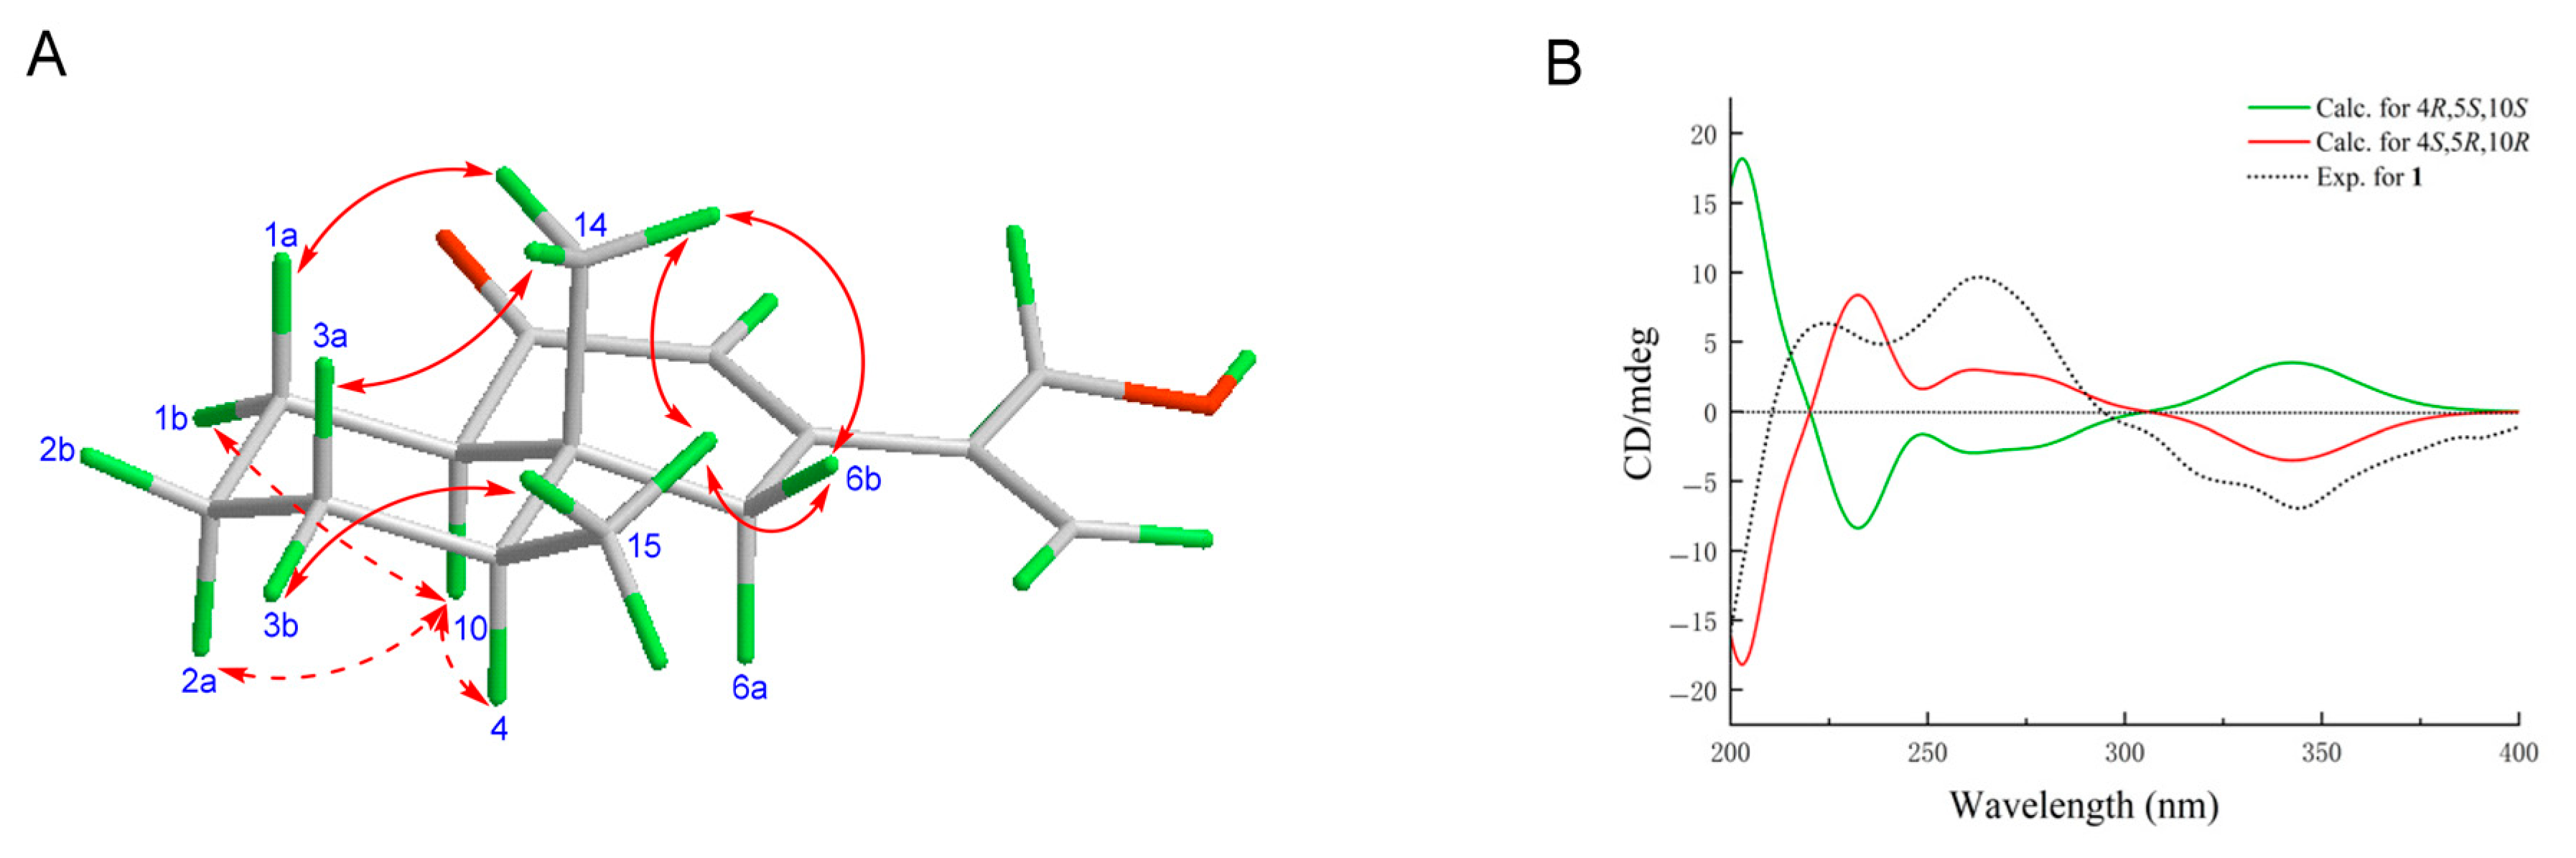
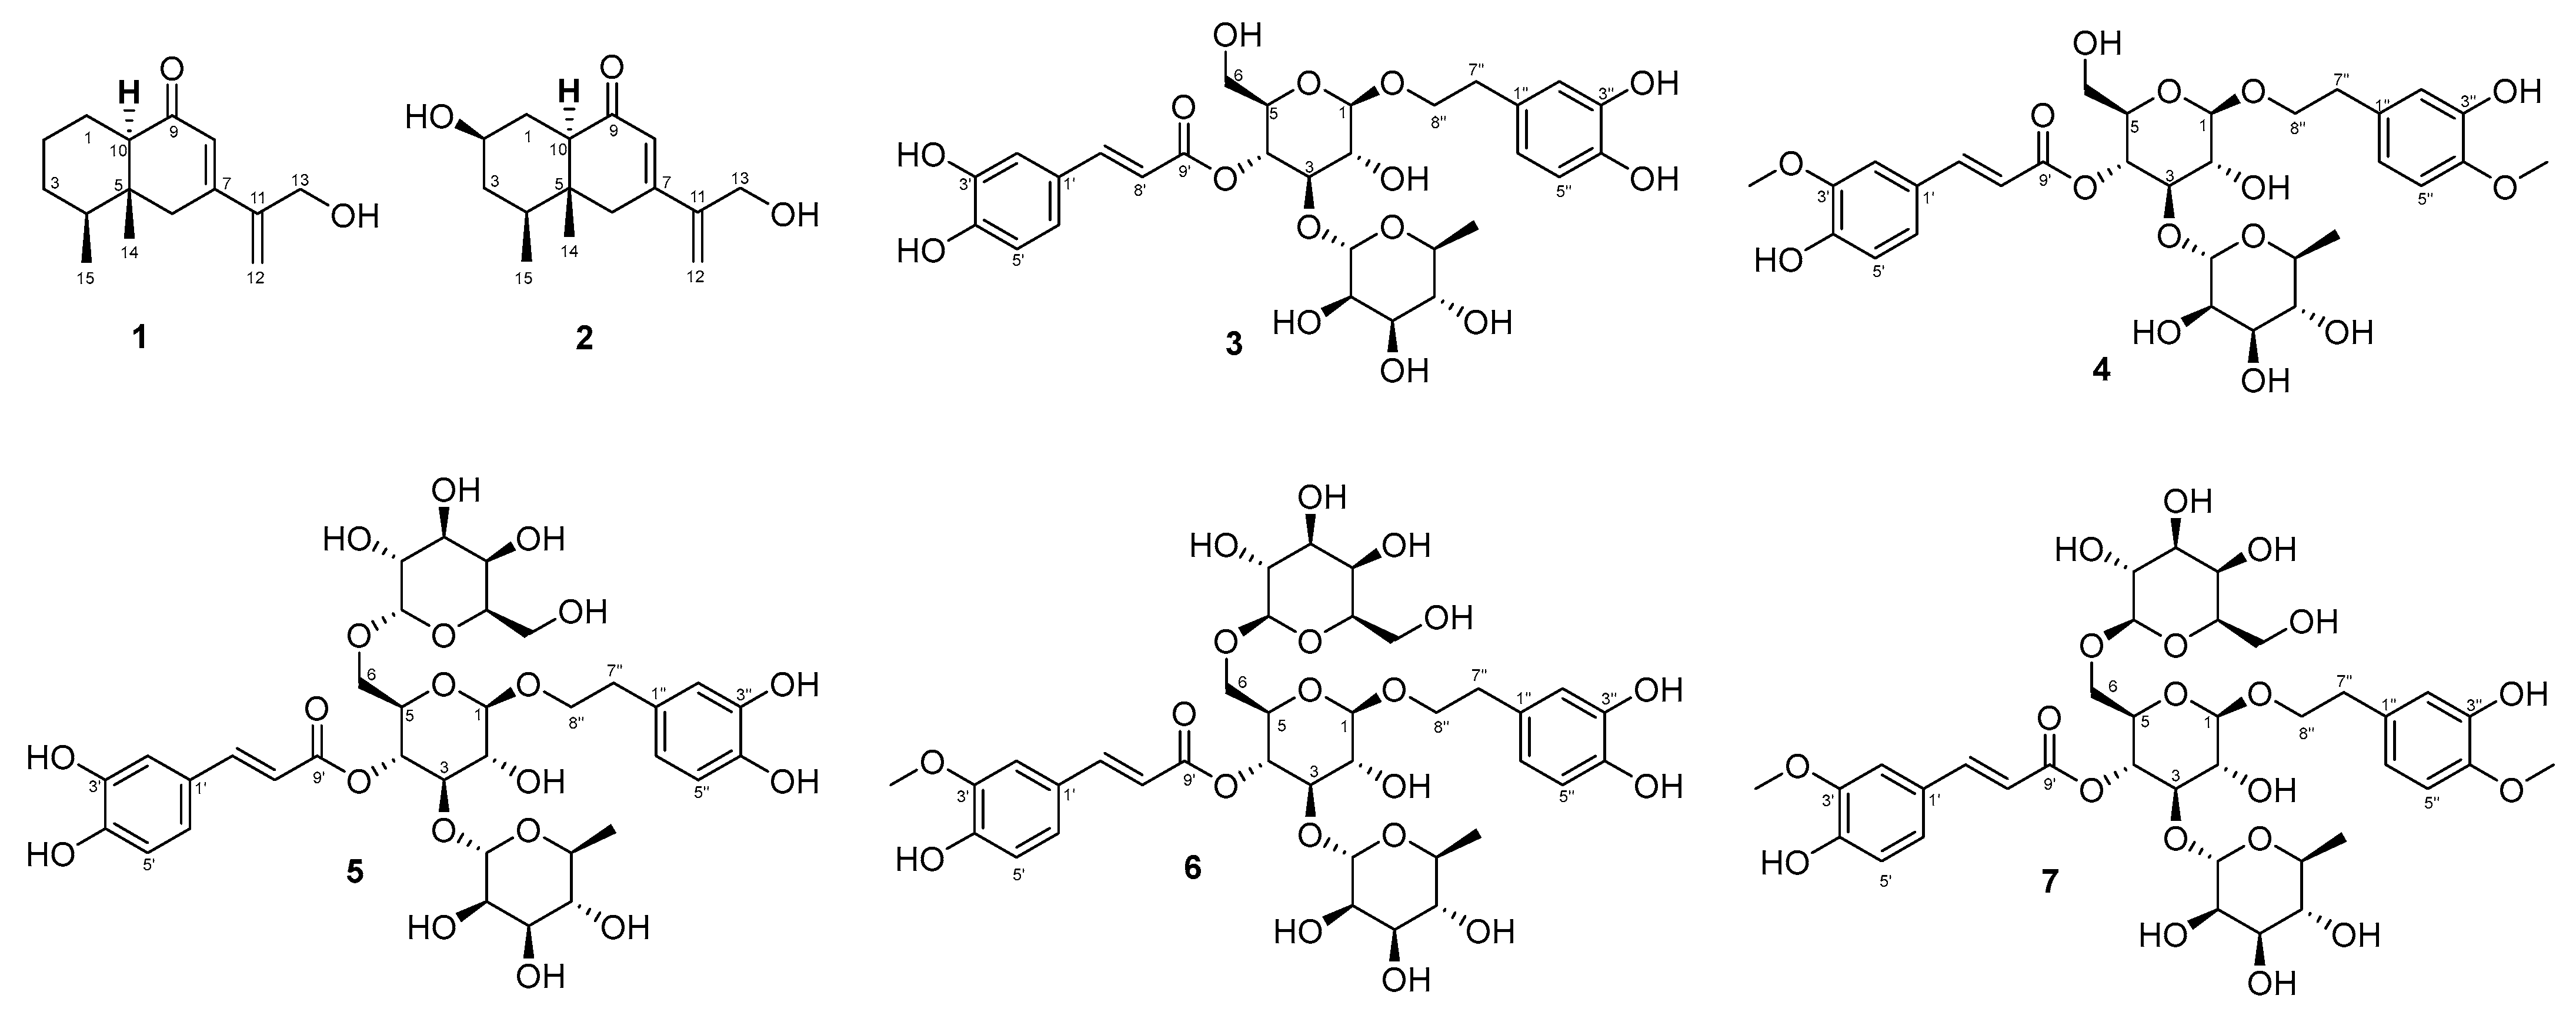
2.1. Structure Determination

Compound 1, with a chemical composition of C15H22O2, was established based on HR-ESI-MS ([M + H]+, m/z 235.1708, calcd. for 235.1698), indicating five degrees of unsaturation in the structure (Figure S7). The IR spectrum of 1 exhibited characteristic absorptions for conjugated carbonyl (1666 cm−1), methylene (2925 and 2854 cm−1), and hydroxyl (3363 cm−1) groups (Figure S8). A comprehensive analysis of the 1H NMR and HSQC spectra (Figures S1 and S4) revealed that the 13C NMR spectrum of 1 (Table 1) exhibited a total of fifteen carbon signals, including two methyls (δC 11.9, 15.4), six methylenes (alkyl carbons at δC 20.7, 25.3, 30.2, 41.1; O-substituted carbon at δC 63.8 and olefinic carbon at δC 117.3), three methines (alkyl carbons at δC 43.3, 55.2; olefinic carbon at δC 124.0), and four quaternary carbons (alkyl carbon at δC 40.0; olefinic carbons at δC 146.4, 151.8 and carbonyl carbon at δC 201.9). In addition to featuring one carbonyl and two double bonds, the bicyclic framework of 1 was essential for fulfilling the unsaturation degree requirement.
Based on the 1H–1H COSY correlations (Figure 1 and Figure S3) of H-10/H2-1/H2-2/H2-3/H-4/H3-15, the connection of C-10/C-1/C-2/C-3/C-4/C-15 was confirmed. The HMBC correlations from H3-15 to C-5 and from H3-14 to C-4/C-5/C-10 corroborated the connection of C-5 to C-4/C-10/C-14, constructing the ortho-dimethyl-substituted cyclohexane unit of compound 1. The attachment between C-6 and C-5 was deduced from the HMBC correlations between H3-14 and C-6. The HMBC correlations between H2-12 and C-11/C-13/C-7 confirmed the presence of an oxymethyl-substituted terminal alkenyl. The attachment between C-7 and C-6/C-8/C-11 was verified through the HMBC correlations from Hb-6 (δH 2.68) to C-7/C-11/C-8 and from H-8 to C-11. Notably, the 1H−1H COSY data indicated significant long-range correlations from H2-12 (δH 5.59, 5.60) to both H2-13 (δH 4.38) and H-8 (δH 6.05), and the signal of H2-12/H2-13 was stronger than H2-12/H-8, providing additional valuable information for elucidating the structure (Figure 1). The attachments between C-9 and C-10/C-8 to form another closed ring were inferred from the HMBC correlations between H-10 and C-9 and between H-8 and C-10. Moreover, the C-8/H-8 in 1 exhibited a significant downfield shift attributed to the deshielding effect caused by the carbonyl group. A hydroxyl group was proposed to be attached to C-13 (δC 63.8) based on the molecular formula C15H22O2. The planar structure of compound 1, analogous to remophilanetriol [15], an eremophilane-type metabolite isolated from R. glutinosa, was established (Figure 1).
The relative configuration of 1 was established by analyzing the coupling constants and conducting NOE experiments. The observed NOE effects from CH3-14 (δH 0.77) to CH3-15 (δH 0.90)/Ha-1 (δH 1.29)/Ha-3 (δH 1.25)/Hb-6 (δH 2.68), as well as from H-10 (δH 2.21) to Ha-6 (δH 2.30)/Hb-1 (δH 2.00)/H-4 (δH 1.55)/Ha-2 (δH 1.30), indicated that CH3-14/CH3-15/Ha-1/Hb-2/Ha-3/Hb-6 were situated on one side of the structure, while H-10/Hb-1/Ha-2/Hb-3/H-4/Ha-6 were positioned on the opposite side (Figure S6 and Figure 2A). The trans configuration between H-10 and CH3-14 revealed a trans-decalin structure for 1. Calculations using Chem3D demonstrated that the chair conformation, with CH3-14 and H-10 oriented axially, was essential to satisfy the energy minimization criteria and the coupling constant of 11.5 Hz for H-10 (Figure 2A and Table 1) [15]. Accordingly, the groups Ha-1/Ha-2/Ha-3/H-4/Ha-6 were positioned axially. Furthermore, the observed w-type long-range correlation between Ha-6 (δH 2.30) and H3-14 (δH 0.77) in the 1H−1H COSY spectrum, as well as the w-type long-range coupling from Hb-6 (δH 2.68) to C-1 (δc 20.7) in the HMBC spectrum, further substantiates this conclusion (Figure 1). The absolute configuration of 1 (4S, 5R, 10R) was established by comparing the experimental and TD-DFT-calculated (B3LYP/6-311+G (2d,p)) ECD spectra (Figure 2B and Figure 3) [16,17].
Compound 2 (C15H22O3, five degrees of unsaturation) was identified by HR-ESI-MS ([M + H]+, calcd. 251.1647) (Figure S15). The 13C NMR and HMQC data of compound 2 revealed two methyls (δC 11.7, 14.9), five methylenes (δC 30.1, 39.1, 40.7, 63.4, 117.5), four methines (δC 41.4, 53.1, 69.9, 123.6), and four quaternary carbons (δC 38.9, 145.9, 151.9, 200.2), demonstrating a close structural similarity to compound 1 (Figures S11 and S13). Based on the 1H spectrum and 2D NMR data of compounds 2 and 1, the primary structural difference is the presence of the OH group at C-2 (δH 3.70/δC 69.9) (Table 1). The axial orientation of H-2 (with OH-2 in the equatorial position) was confirmed by the large axial-axial coupling constants (J = 11.5 Hz) observed in the 1H NMR spectrum, indicating that the OH-2 orientation was aligned with CH3-14 and CH3-15 (Table 1 and Figure 3). This evidence suggests the 2R, 4S, 5R, 10R absolute configuration of 2 (Figure 3). A comparison of the NMR data and shared biosynthetic origins between 2 and remophilanetriol B, a known compound from fresh R. glutinosa roots, further supports this conclusion [18].
In addition to compounds 1 and 2, five known phenylethanoid glycosides were isolated, including acteoside (3) [19], martynoside (4) [20], purpureaside C (5) [20], jionoside A1 (6) [21], and jionoside B1 (7) [21]. The structural identities of these compounds were established by correlating their MS and NMR spectral characteristics with those reported in the existing literature.

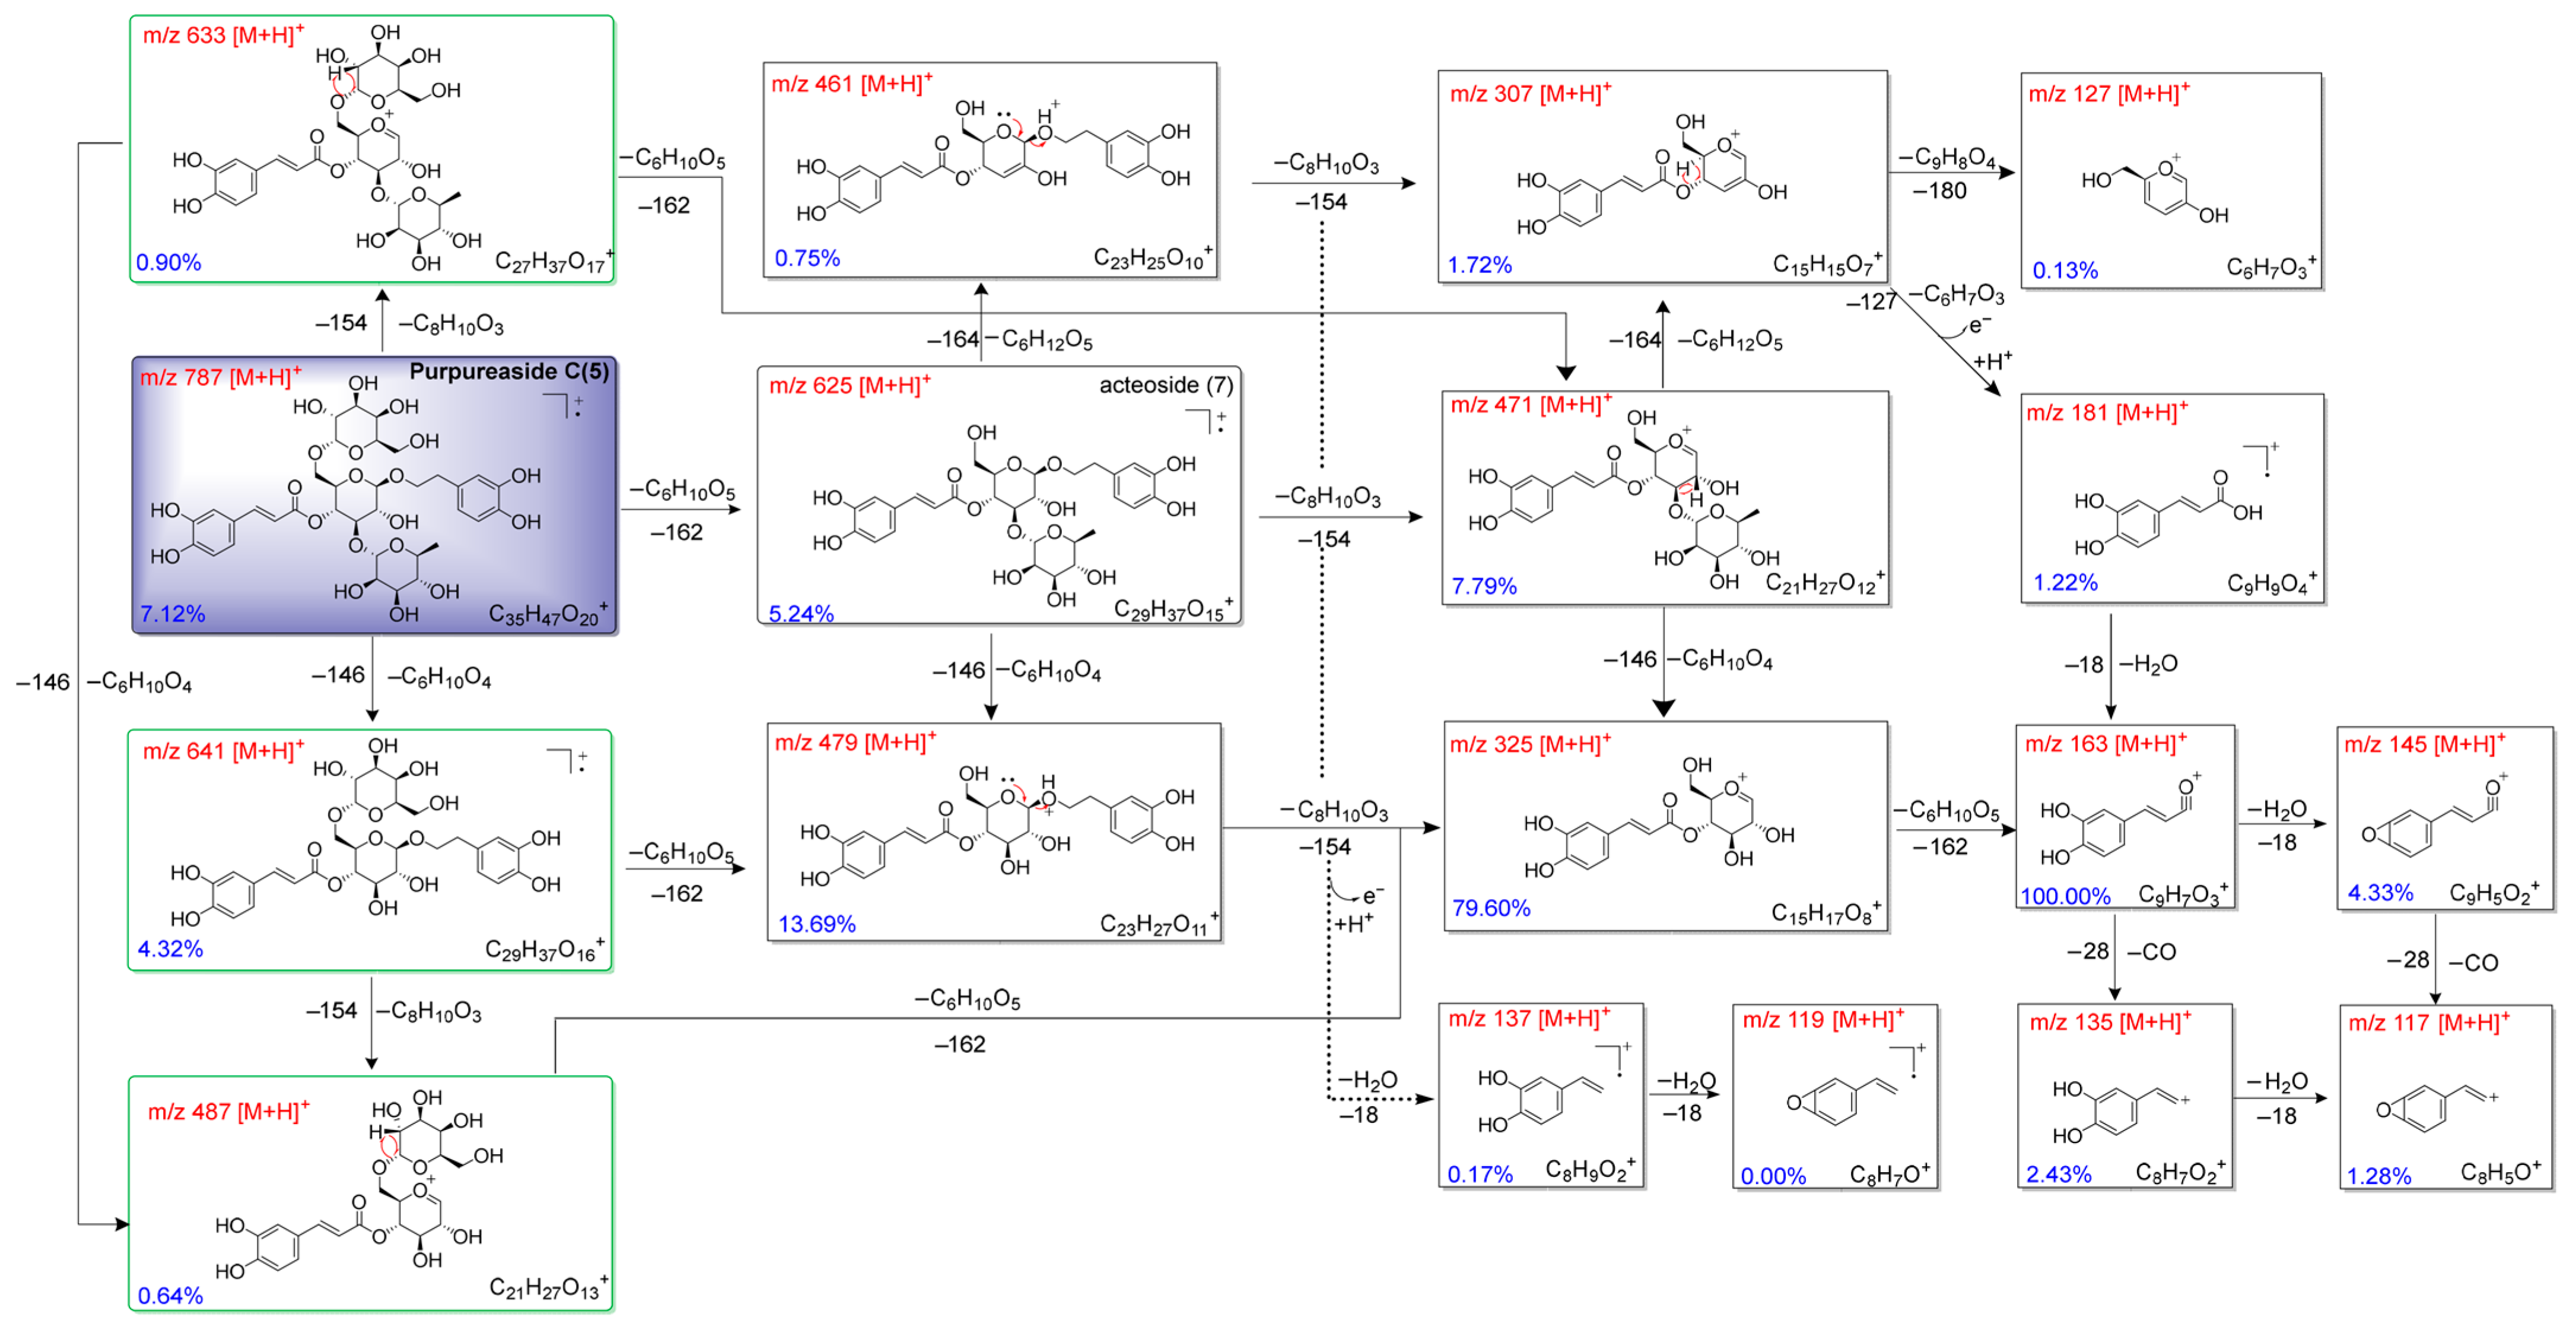
2.2. Fragmentation Mechanisms of Compounds (37)

UPLC-Q-TOF-MS/MS analysis of acteoside (3) detected its protonated molecular ion ([M + H]+) at m/z 625, with a relatively low signal intensity. The fragment ions and elemental constituents combined with the high-resolution mass analysis of acteoside (3) are shown in Figure S18 and Table S2, respectively. According to mass analysis, the cleavage routes of 3 were described in Figure S23, in which typical charge-induced heterolysis, quadric rearrangement, and neutral loss were the main cleavage ways of compound 3 [22,23]. As shown in Figure S23, the ion (C9H7O3+, m/z = 163) of caffeoyl exhibited the highest relative abundance. The mass spectra indicated that this ion was primarily formed via two cleavage pathways. One was the parent ion m/z 625 of 3 by losing a rhamnose molecule (C6H12O5, −164 Da, quadric rearrangement) and a 3,4-dihydroxyphenylethanol molecule (C8H10O3, −154 Da, charge-induced heterolysis) in a specific sequence to yield the daughter ion (C15H15O7+, m/z = 307). Then the precursor ion m/z 307 produced the ion (m/z 127, C6H7O3+) and a caffeic acid molecule (180 Da) through rearrangement. The caffeic acid molecule (180 Da) was first ionized to produce protonated ions (m/z 181, C9H9O4+), and then lost one molecule of H2O (−18 Da) to generate the caffeoyl ion m/z 163. The other cleavage pathway indicated that the daughter ion of m/z 163 was formed from the parent ion m/z 625 by losing one rhamnosyl moiety (C6H10O4, -146 Da), one molecule of 3,4-dihydroxyphenylethanol (C8H10O3, −154 Da), and one inner glucosyl moiety (C6H10O6, −162 Da) in a specific order through charge-induced heterolysis. The relative abundance of the m/z 479 ion (9.58%) was higher than that of the m/z 471 ion (7.61%), indicating that the rhamnosyl group at C-3 was more easily lost than the phenethyl group at C-1. The base peak ion m/z 163 yields the fragment ion m/z 117 by losing CO (−28 Da) and H2O (−18 Da) in a specific sequence. It is worth mentioning that the caffeoyl ion (m/z 163, C9H7O3+) could not be directly yielded from the parent ion ([M + H]+, m/z 625) by losing the C20H30O12 molecule (−462 Da) through heterolysis, as the absence of m/z 463, 317 and 309 in the MS spectra indicates that caffeoyl at C-4 is more difficult to lose than the phenylethanol molecule at C-1 or rhamnosyl at C-3. The fragmentation pattern of martynoside (4) resembled that of acteoside (3), with methyl substitutions at the 3′-OH and 4″-OH positions, introducing a mass difference of 28 Da or 14 Da in the corresponding fragment ions (Table S3 and Figures S19 and S24).
The ESI-MS spectra of purpureaside C (5) and acteoside (3) showed notable similarities in their fragmentation patterns (Figures S18 and S20). Specifically, the purpureaside C (5) ion m/z 787 (C35H47O20+) generated the acteoside (3) ion (m/z 625, C29H37O15+) by the loss of a galactosyl group (−162 Da), indicating an additional galactose in the structure of purpureaside C (5) (Figure 4). Compared to the cleavage pathway of acteoside (3), purpureaside C (5) exhibited an additional cleavage route for intermediate ions at m/z 471, 479, and 325. As depicted in Figure 4, the parent ion m/z 787 consequently lost C8H10O3 (−154 Da) and C6H10O5 (−162 Da) to yield m/z 471, and C6H10O4 (−146 Da) and C6H10O5 (−162 Da) in a specific sequence to yield m/z 479. The daughter ion of m/z 325 was derived from the parent ion m/z 787 by the loss of one rhamnosyl moiety (C6H10O4, −146 Da), one molecule of 3,4-dihydroxyphenylethanol (C8H10O3, −154 Da), and one galactosyl moiety (C6H10O5, −162 Da) in a certain order, through charge-induced heterolysis and quadric rearrangement. The ease of side chain moiety loss can be summarized as follows: loss of the galactosyl group at C-6 (−162 Da) > loss of the rhamnosyl at C-3 group (−146 Da) > loss of the phenethyl molecule at C-1 (−154 Da) > loss of the caffeoyl group at C-4 (−162 Da). This conclusion was based on the relative abundances of daughter ions m/z 625 (5.24%), 641 (4.32%), 633 (0.90%), and 471 (0.00%), which were derived from the parent ion (m/z 787, C35H47O20+) (Figure 4 and Table S4). Moreover, the presence of a galactosyl group at C-6 enhanced the relative intensities of the m/z 625, 479, and 325 ions in purpureaside C (5) compared to those in acteoside (3). The relevant data about elemental compositions and fragment ions of compound 5 are displayed in Table S4.
The abundance of the parent ion of jionoside A1 (6) ([M + H]+, m/z 801) was relatively low according to the mass profile (Figure S25). The relevant data regarding elemental compositions and fragment ions of compound 6 are presented in Table S5. The presence of the feruloyl group caused most of the fragment ions in the mass spectrum of jionoside A1 (6) to be 14 Da heavier than those in purpureaside C (5), except for m/z 127, 137, 119, 145, and 117. Notably, the m/z 145 (C9H5O2+) and m/z 117 (C8H5O+) ions in the ESI-MS spectrum of jionoside A1 (6) originated directly from the precursor ions m/z 177 and 149 by losing a methanol molecule (32 Da), respectively, bypassing intermediate ions such as C9H7O3+ (−14 Da, losing CH2) and C10H7O3+ (−2 Da, losing H2), because the m/z 163 and m/z 175 ions were absent from the spectrum (Figures S21 and S25 and Table S5). The cleavage pathways of jionoside B1 (7) were analogous to those of 6 (Table S6 and Figures S22 and S26).

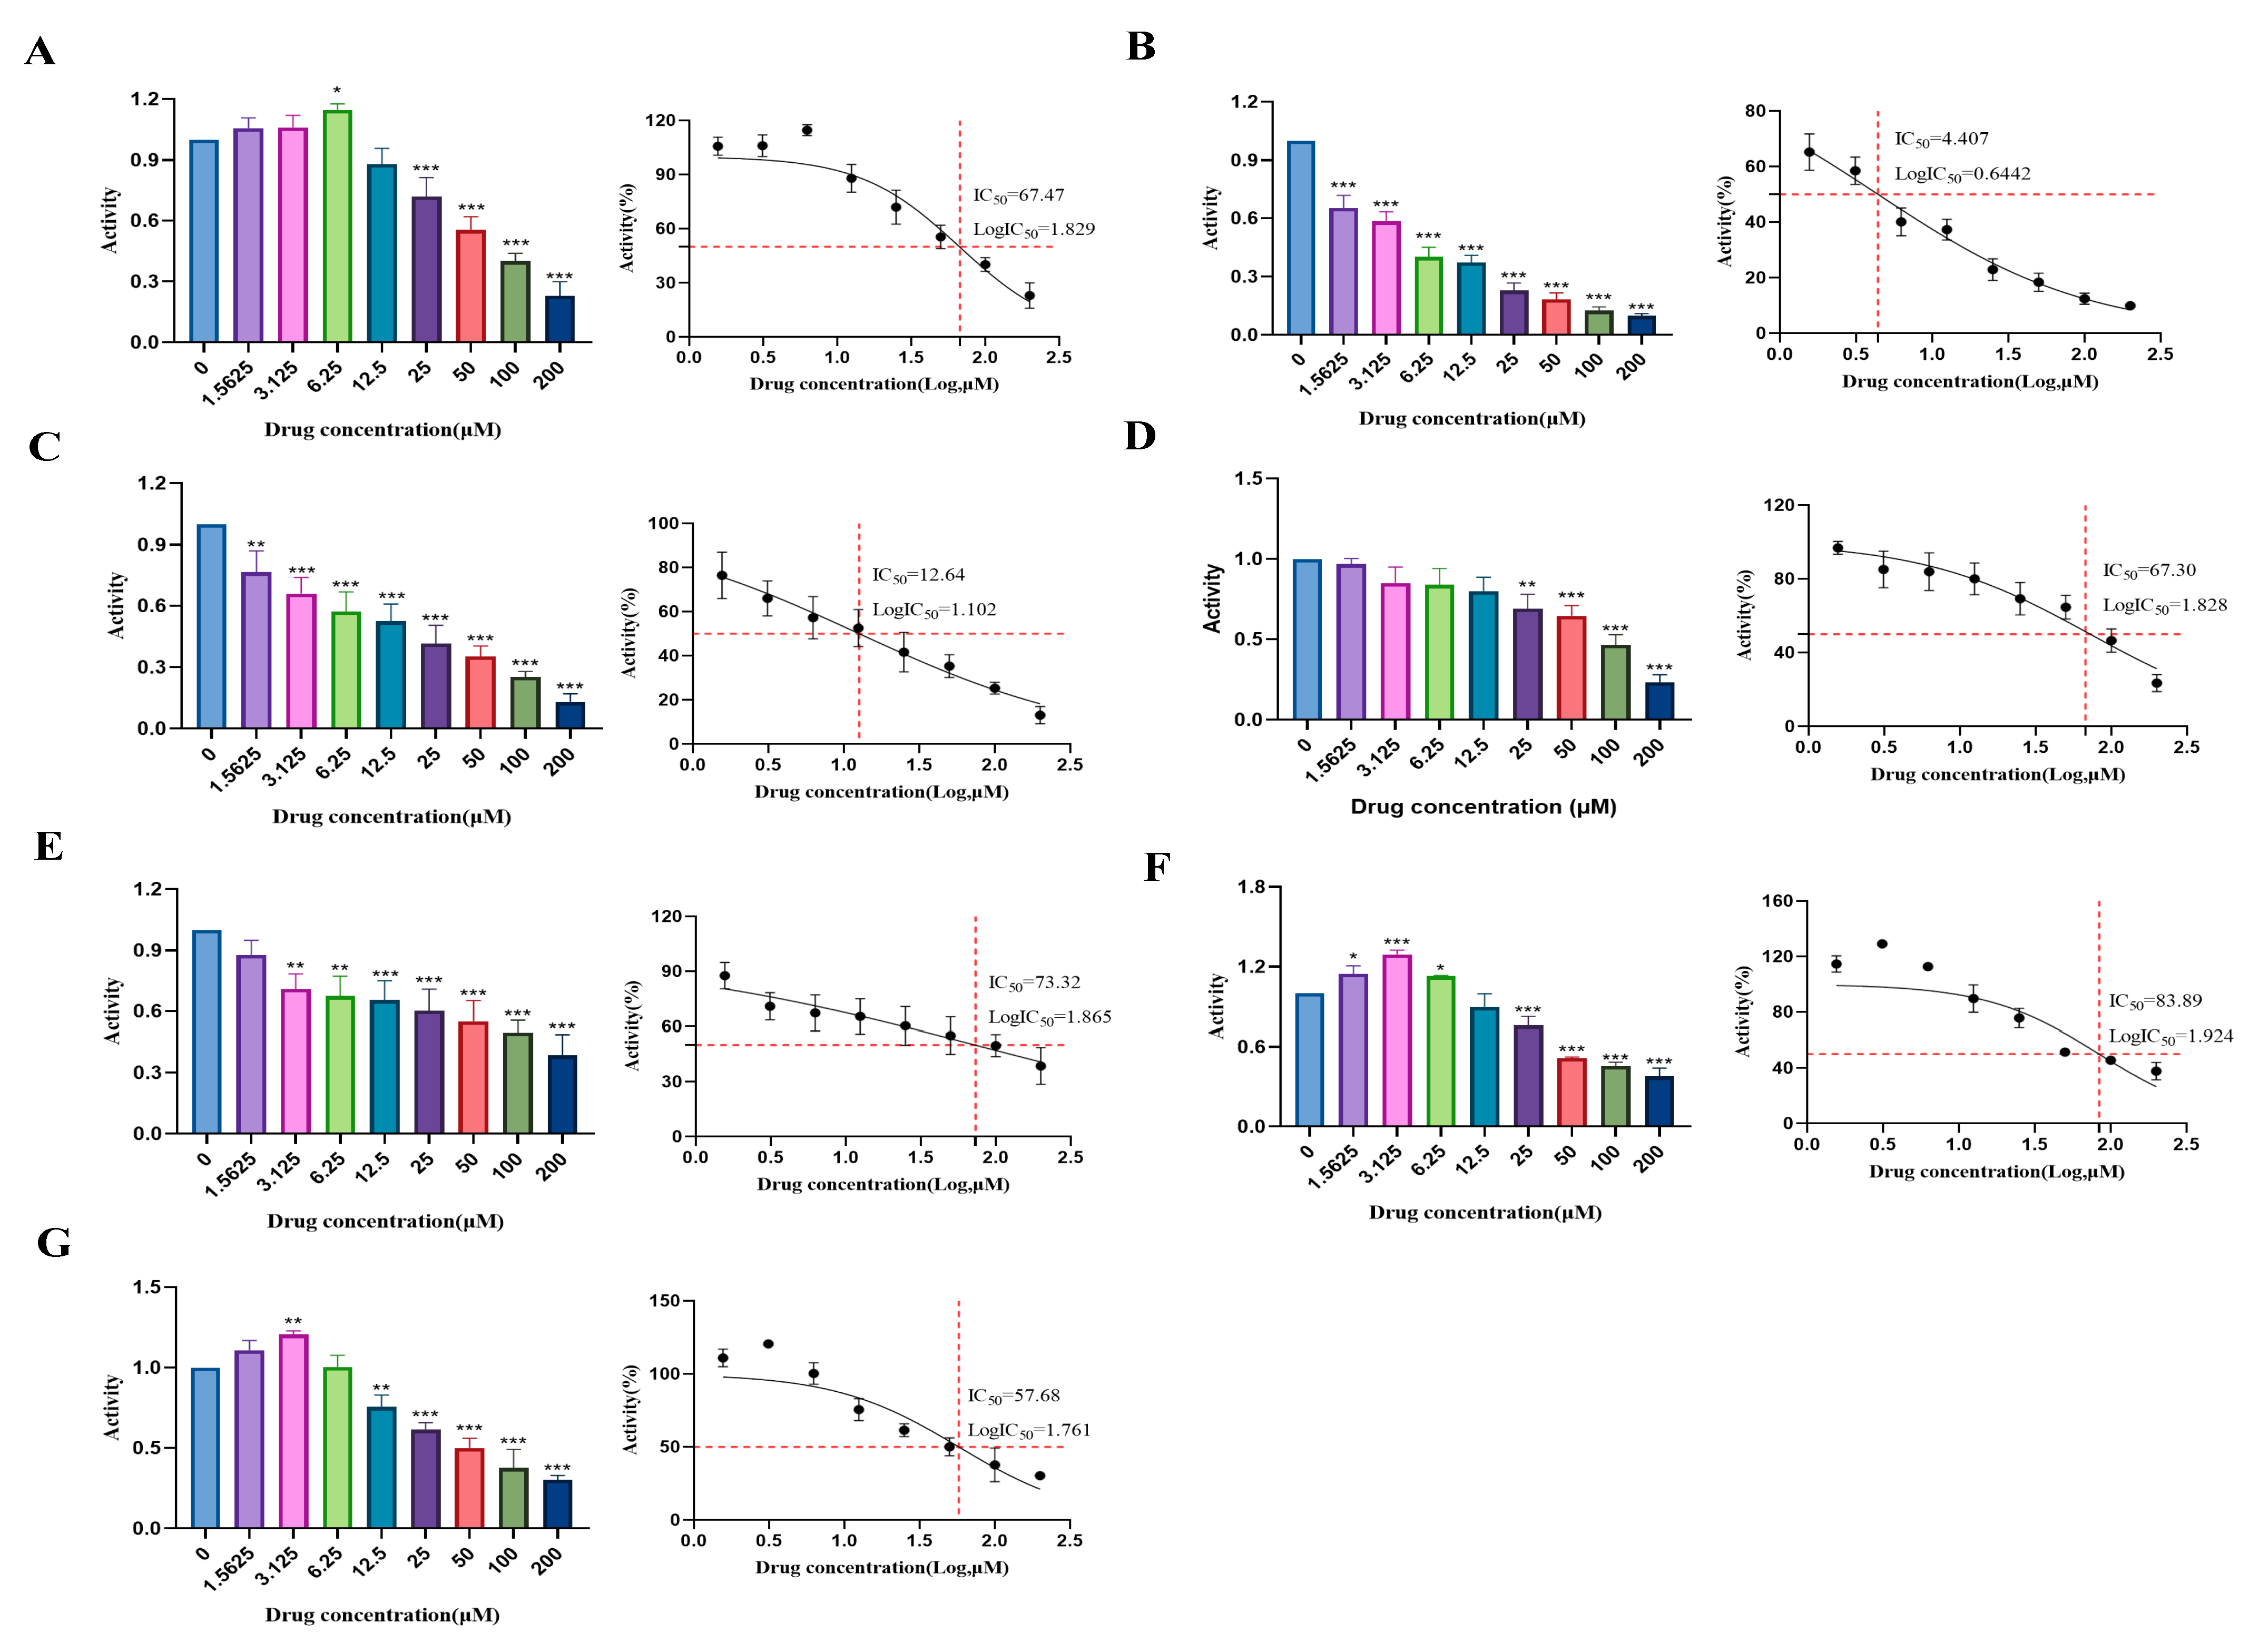
2.3. Determination of Cytotoxic Effects and Experimental Concentrations of Compounds (17) in HUVECs

The cytotoxicity of compounds (17) in HUVECs was evaluated using the CCK-8 assay to determine the experimental concentrations (Figure 5). Concentration-dependent viability effects were observed, with compounds 25 exhibiting progressive inhibition. Remophilanetriol J (1) and jionoside A1 (6) exhibited minimal effects at low concentrations but significant inhibition at higher doses (Figure 5).
Structural activity analysis revealed marked differences between the eremophilane-type metabolites. Remophilanetriol J (1) (IC50 = 67.47 μM) enhanced viability (1.56–6.25 μM), whereas the C-2 hydroxylated analog remophilanetriol K (2) showed significantly greater cytotoxicity (IC50 = 4.407 μM) (Figure 5 and Table S7). Among the phenylethanoid glycosides (37), methyl/glycosyl substitutions in compounds 47 may be correlated with reduced cytotoxicity compared to compound 3.
Based on the dose–response profiles and IC50 values, three intervention concentrations (low, medium, and high) were selected for each compound (Table S8).

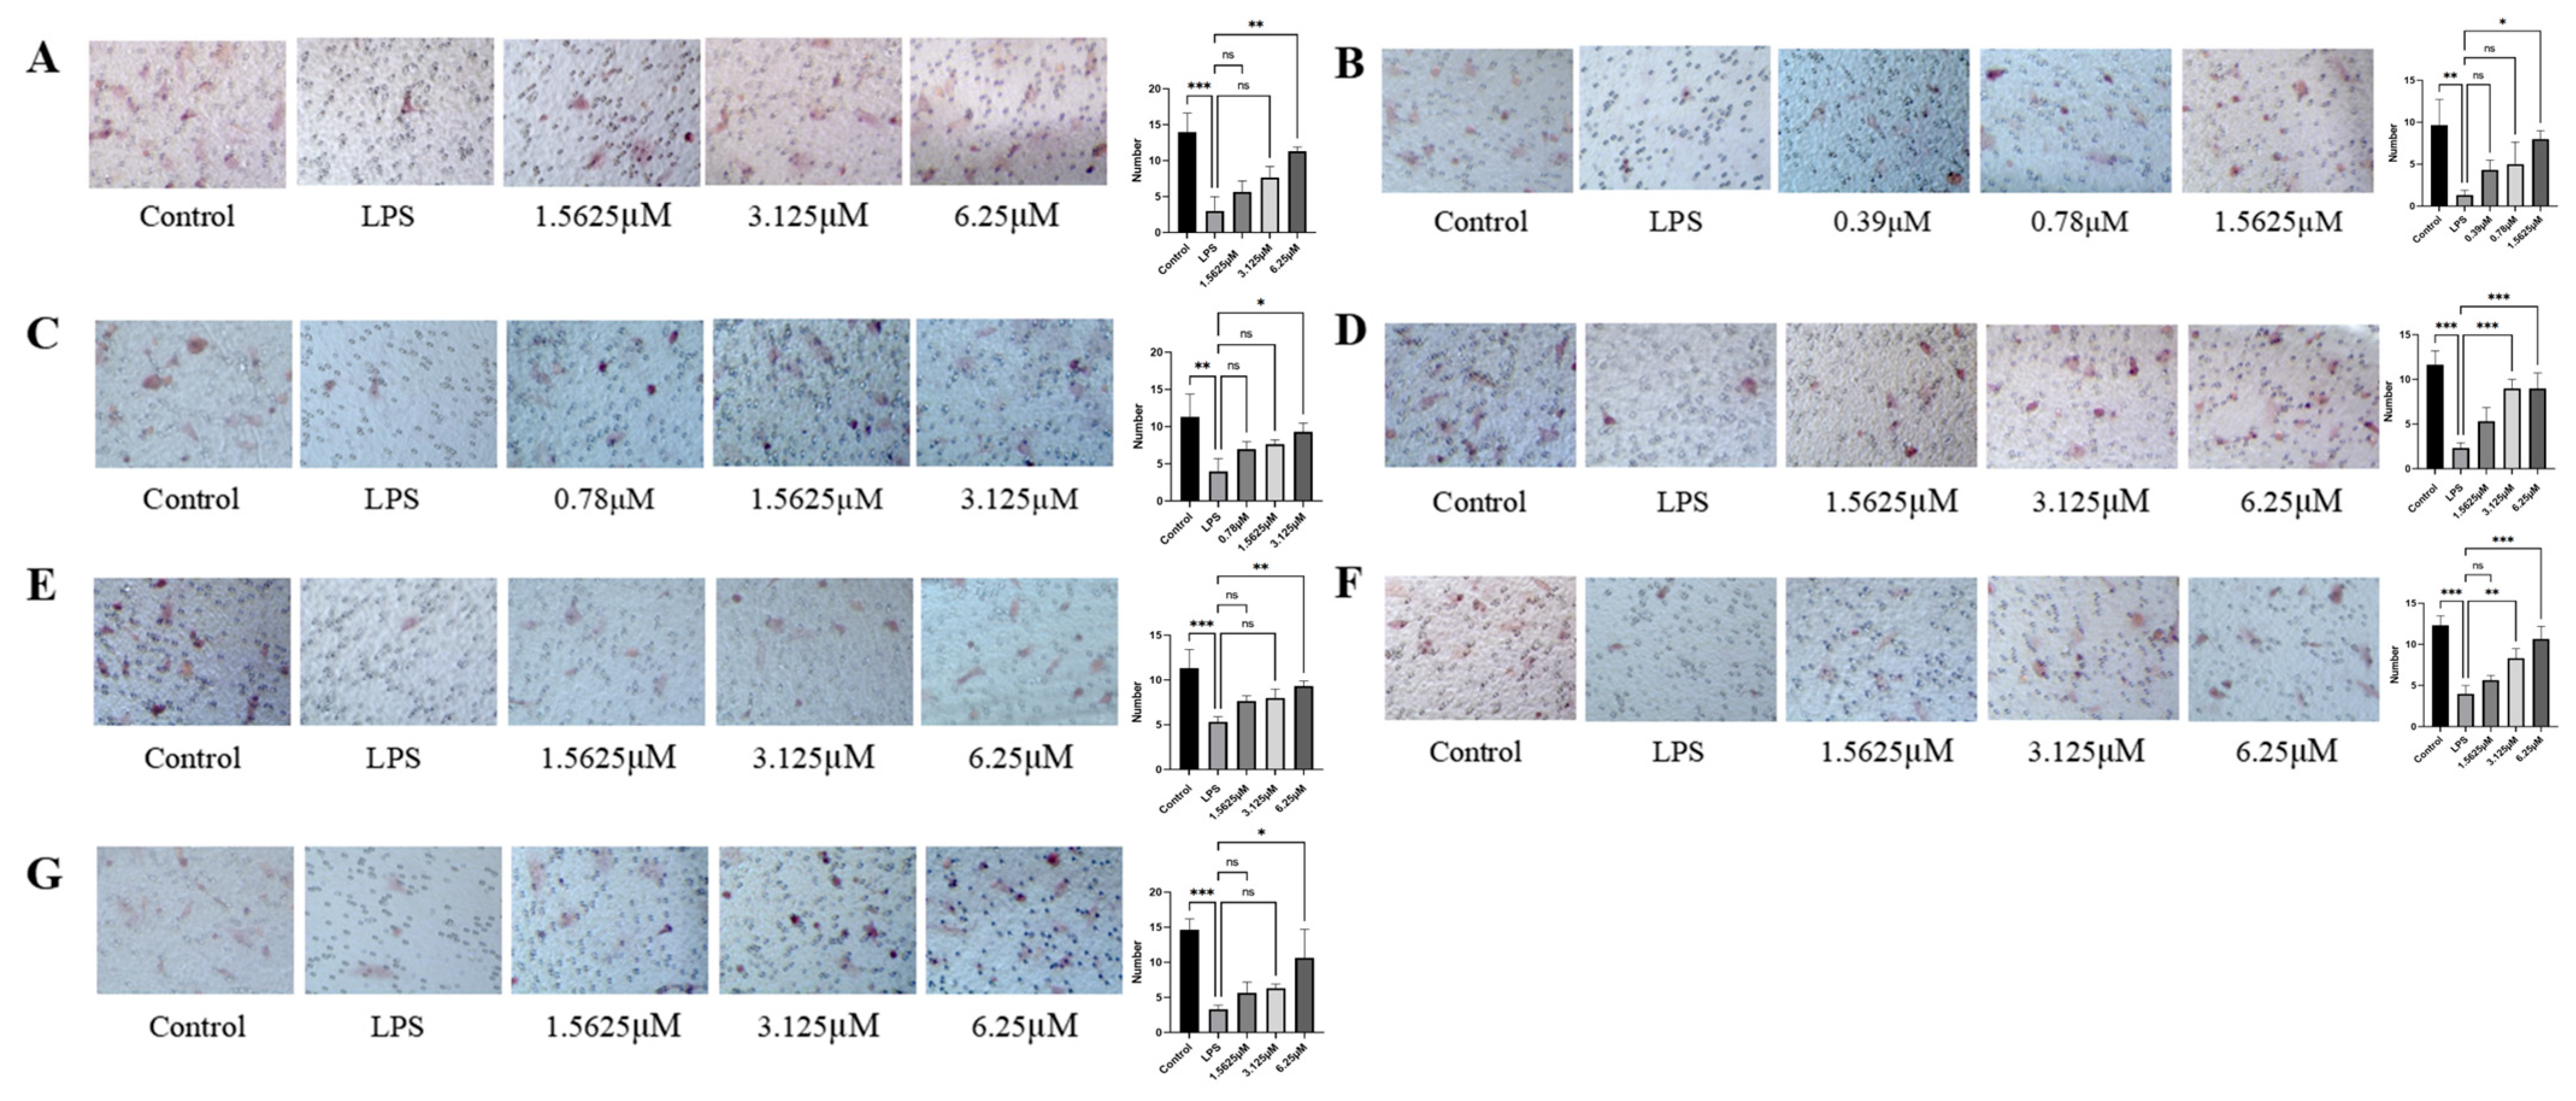
2.4. Effects of Diverse Compound Interventions on LPS-Induced Endothelial Cell Migration Impairment

LPS treatment significantly inhibited endothelial cell migration compared to the control (p < 0.01), establishing a valid model of migratory impairment in endothelial cells (Figure 6). As shown in Figure 6, all tested compounds enhanced the migration of LPS-injured HUVECs in a dose-dependent manner. The protective effects of compounds 17 against LPS-impaired HUVEC migration were quantified (Table S9). As shown in Table S9, at a concentration of 1.5625 μM, remophilanetriol K (2) (80.00 ± 6.93%) exhibited the most potent cytoprotective activity among the seven tested compounds, with acteoside (3) (50.00 ± 4.55%) showing the second highest efficacy.

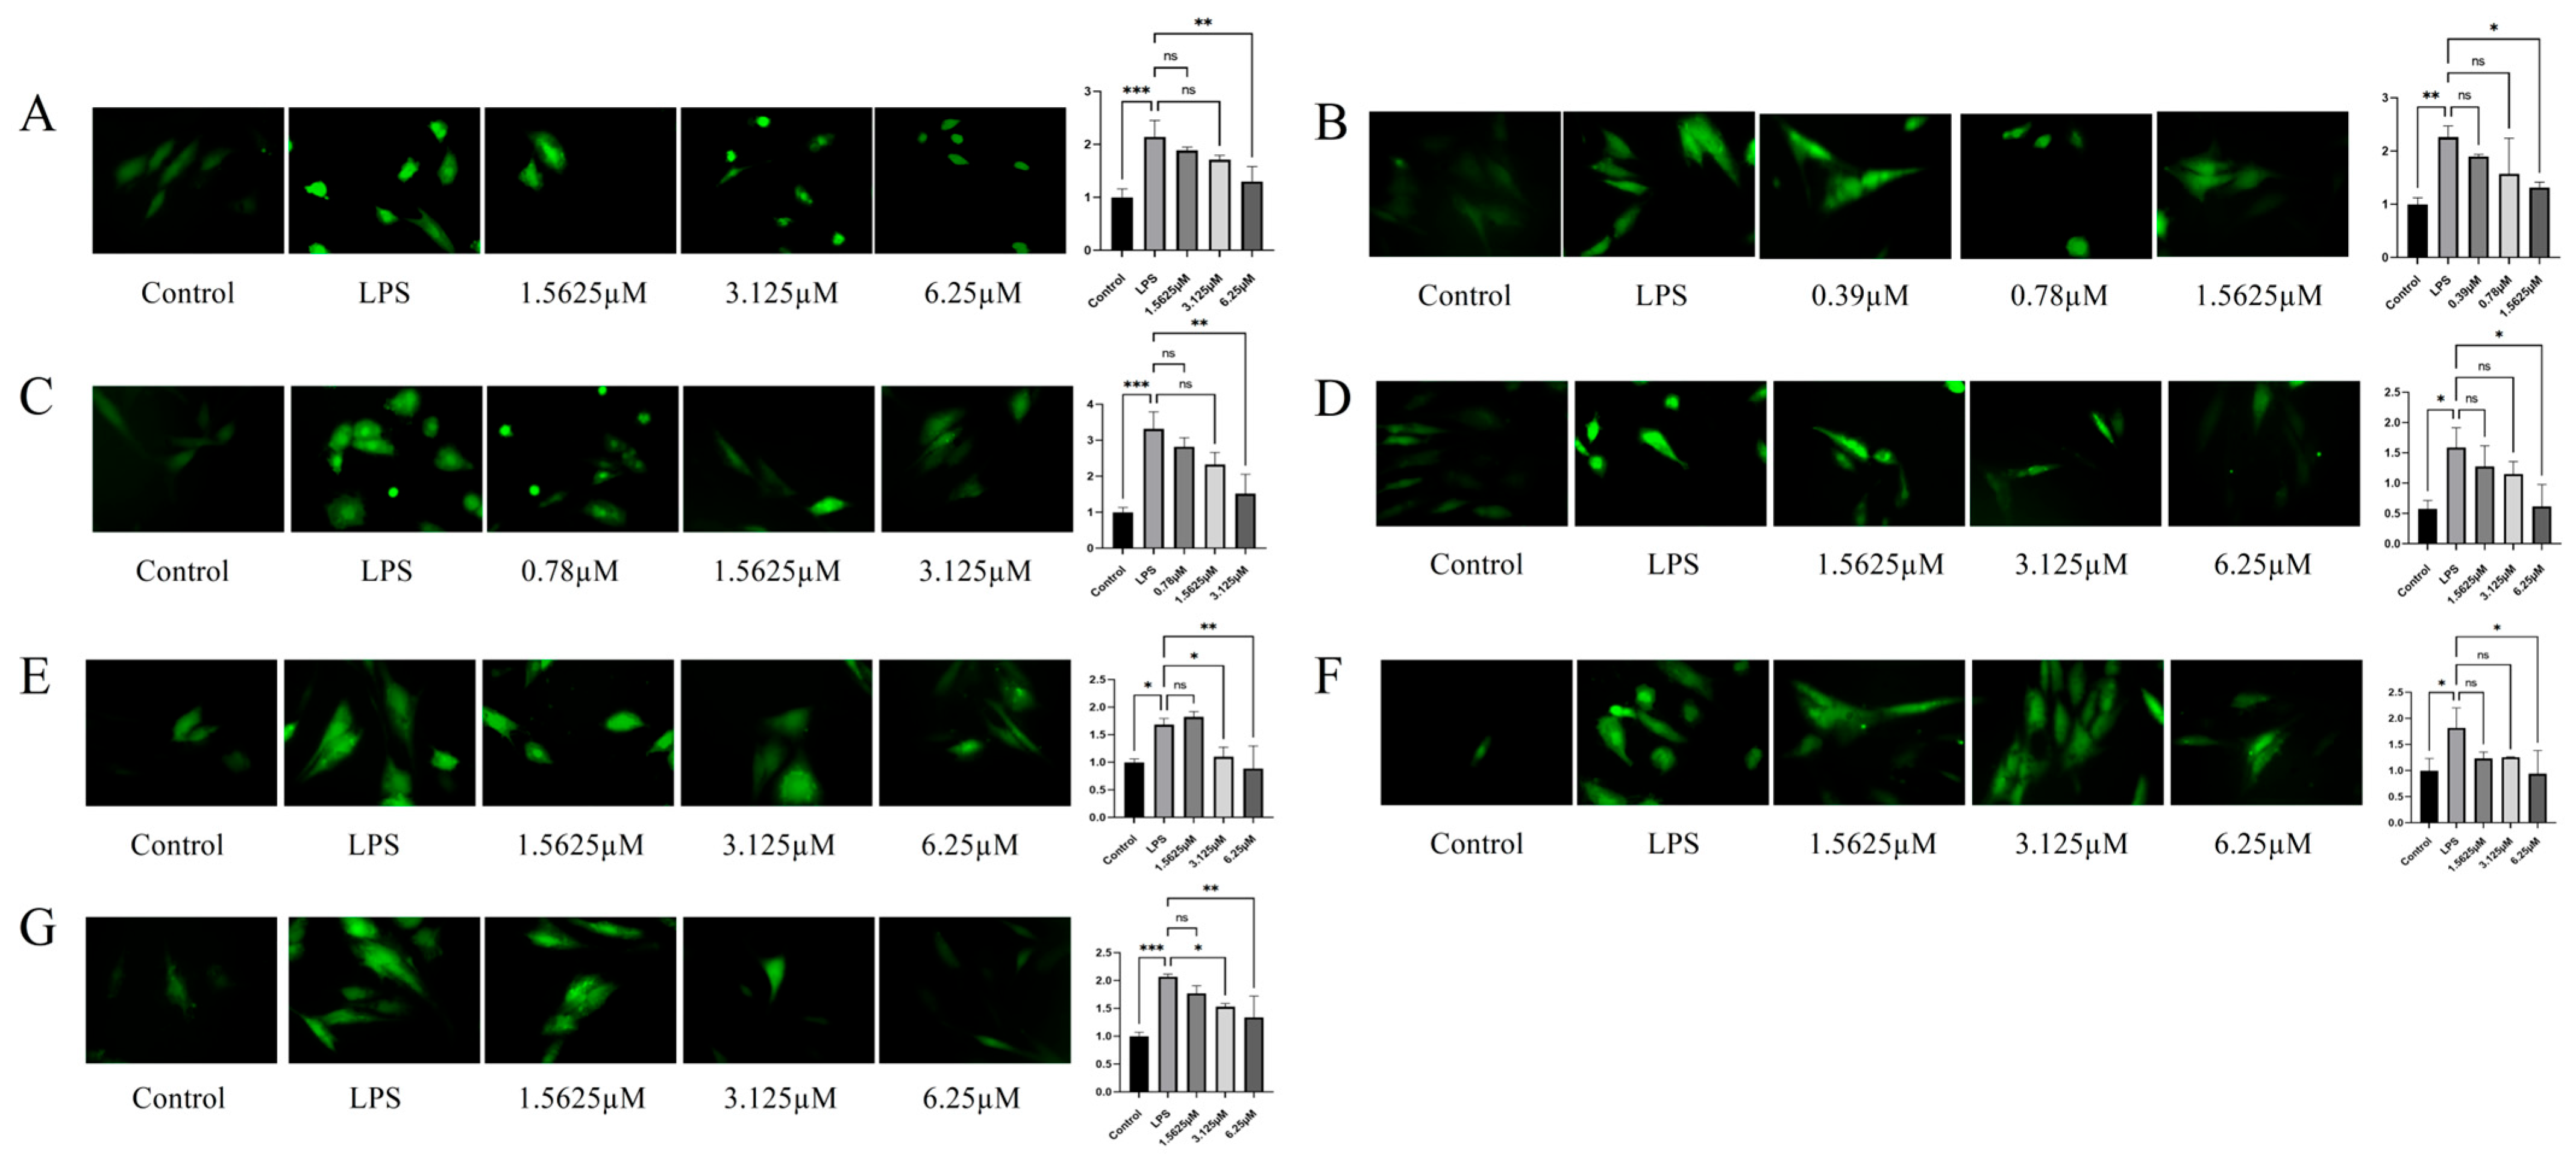
2.5. Inhibitory Potency of Compounds Against ROS Levels in LPS-Induced HUVECs

The intracellular ROS levels in LPS-stimulated HUVECs were assessed for seven compounds (17). LPS treatment significantly increased ROS generation compared to that in the control group (p < 0.05). Dose-dependent ROS reduction was observed for most compounds, with purpureaside C (5) and jionoside B1 (7) demonstrating significant suppression at medium and high concentrations (p < 0.05, vs. LPS-treated group). All compounds exhibited significant inhibitory effects at high doses (p < 0.05, vs. LPS-treated group) (Figure 7 and Table S10). Comparative analysis at 1.5625 μM (Table S10) revealed that among the seven tested compounds, remophilanetriol K (2) (74.78 ± 4.56%) displayed the most potent ROS scavenging activity, followed by jionoside A1 (6) (71.69 ± 8.75%), and acteoside (3) (42.54 ± 8.39%) ranked third.
Structural activity analysis revealed significant differences in ROS modulation among the compounds despite their shared skeletons (Table S10). Remophilanetriol K (2) (1.56 μM, 74.8 ± 4.6%) demonstrated superior ROS clearance versus remophilanetriol J (1) (6.25 μM, 73.5 ± 14.1%), suggesting C-2 hydroxylation enhances antioxidant capacity. Among the phenylethanoid glycosides (37), martynoside (4) (6.25 μM, 83.6 ± 9.1%) showed significantly greater activity than jionoside B1 (7) (6.25 μM, 65.8 ± 18.4%), indicating that C-6 glycosylation reduces efficacy, potentially through impaired membrane permeability or target binding [24,25]. Comparative analysis at 3.125 μM confirmed structure-dependent activity: purpureaside C (5) (80.45 ± 10.01%) > jionoside A1 (6) (68.55 ± 0.40%) > jionoside B1 (7) (50.25 ± 3.05%) and acteoside (3) (76.43 ± 12.32%) > martynoside (4) (42.84 ± 11.52%), demonstrating that phenolic hydroxyl methylation decreases antioxidant capacity by disrupting molecular planarity and hydrogen bonding [25,26,27].

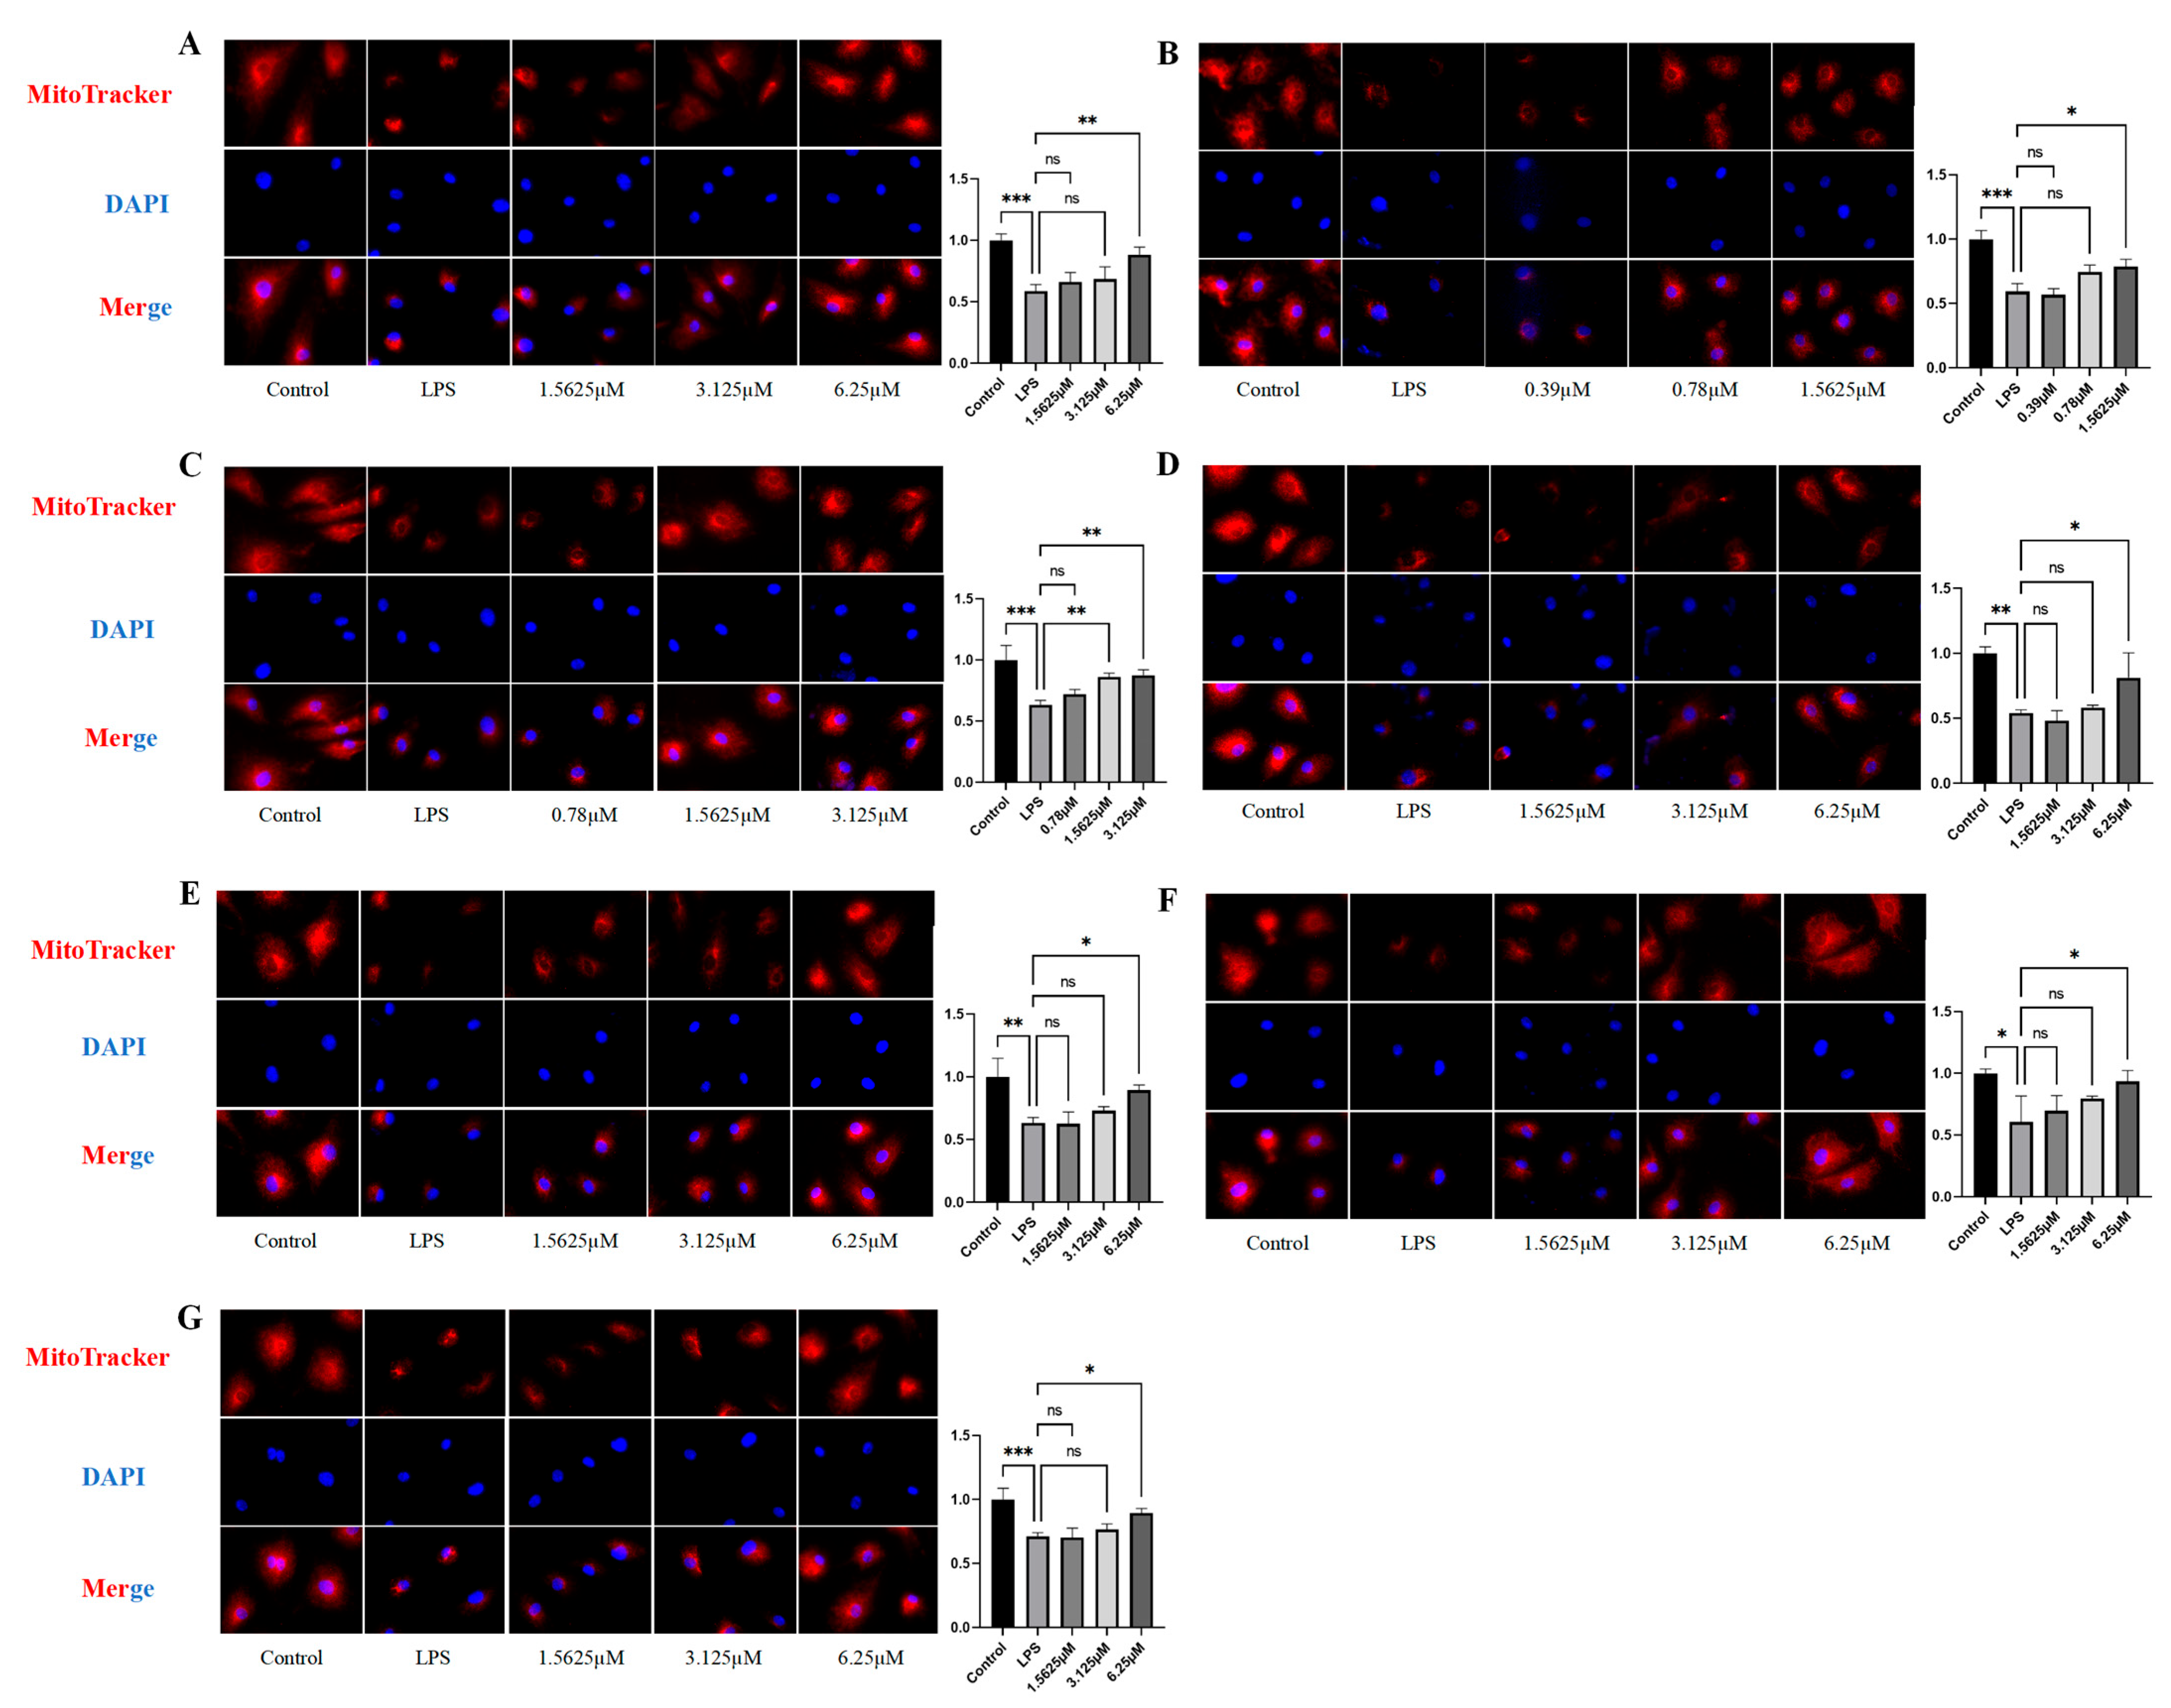
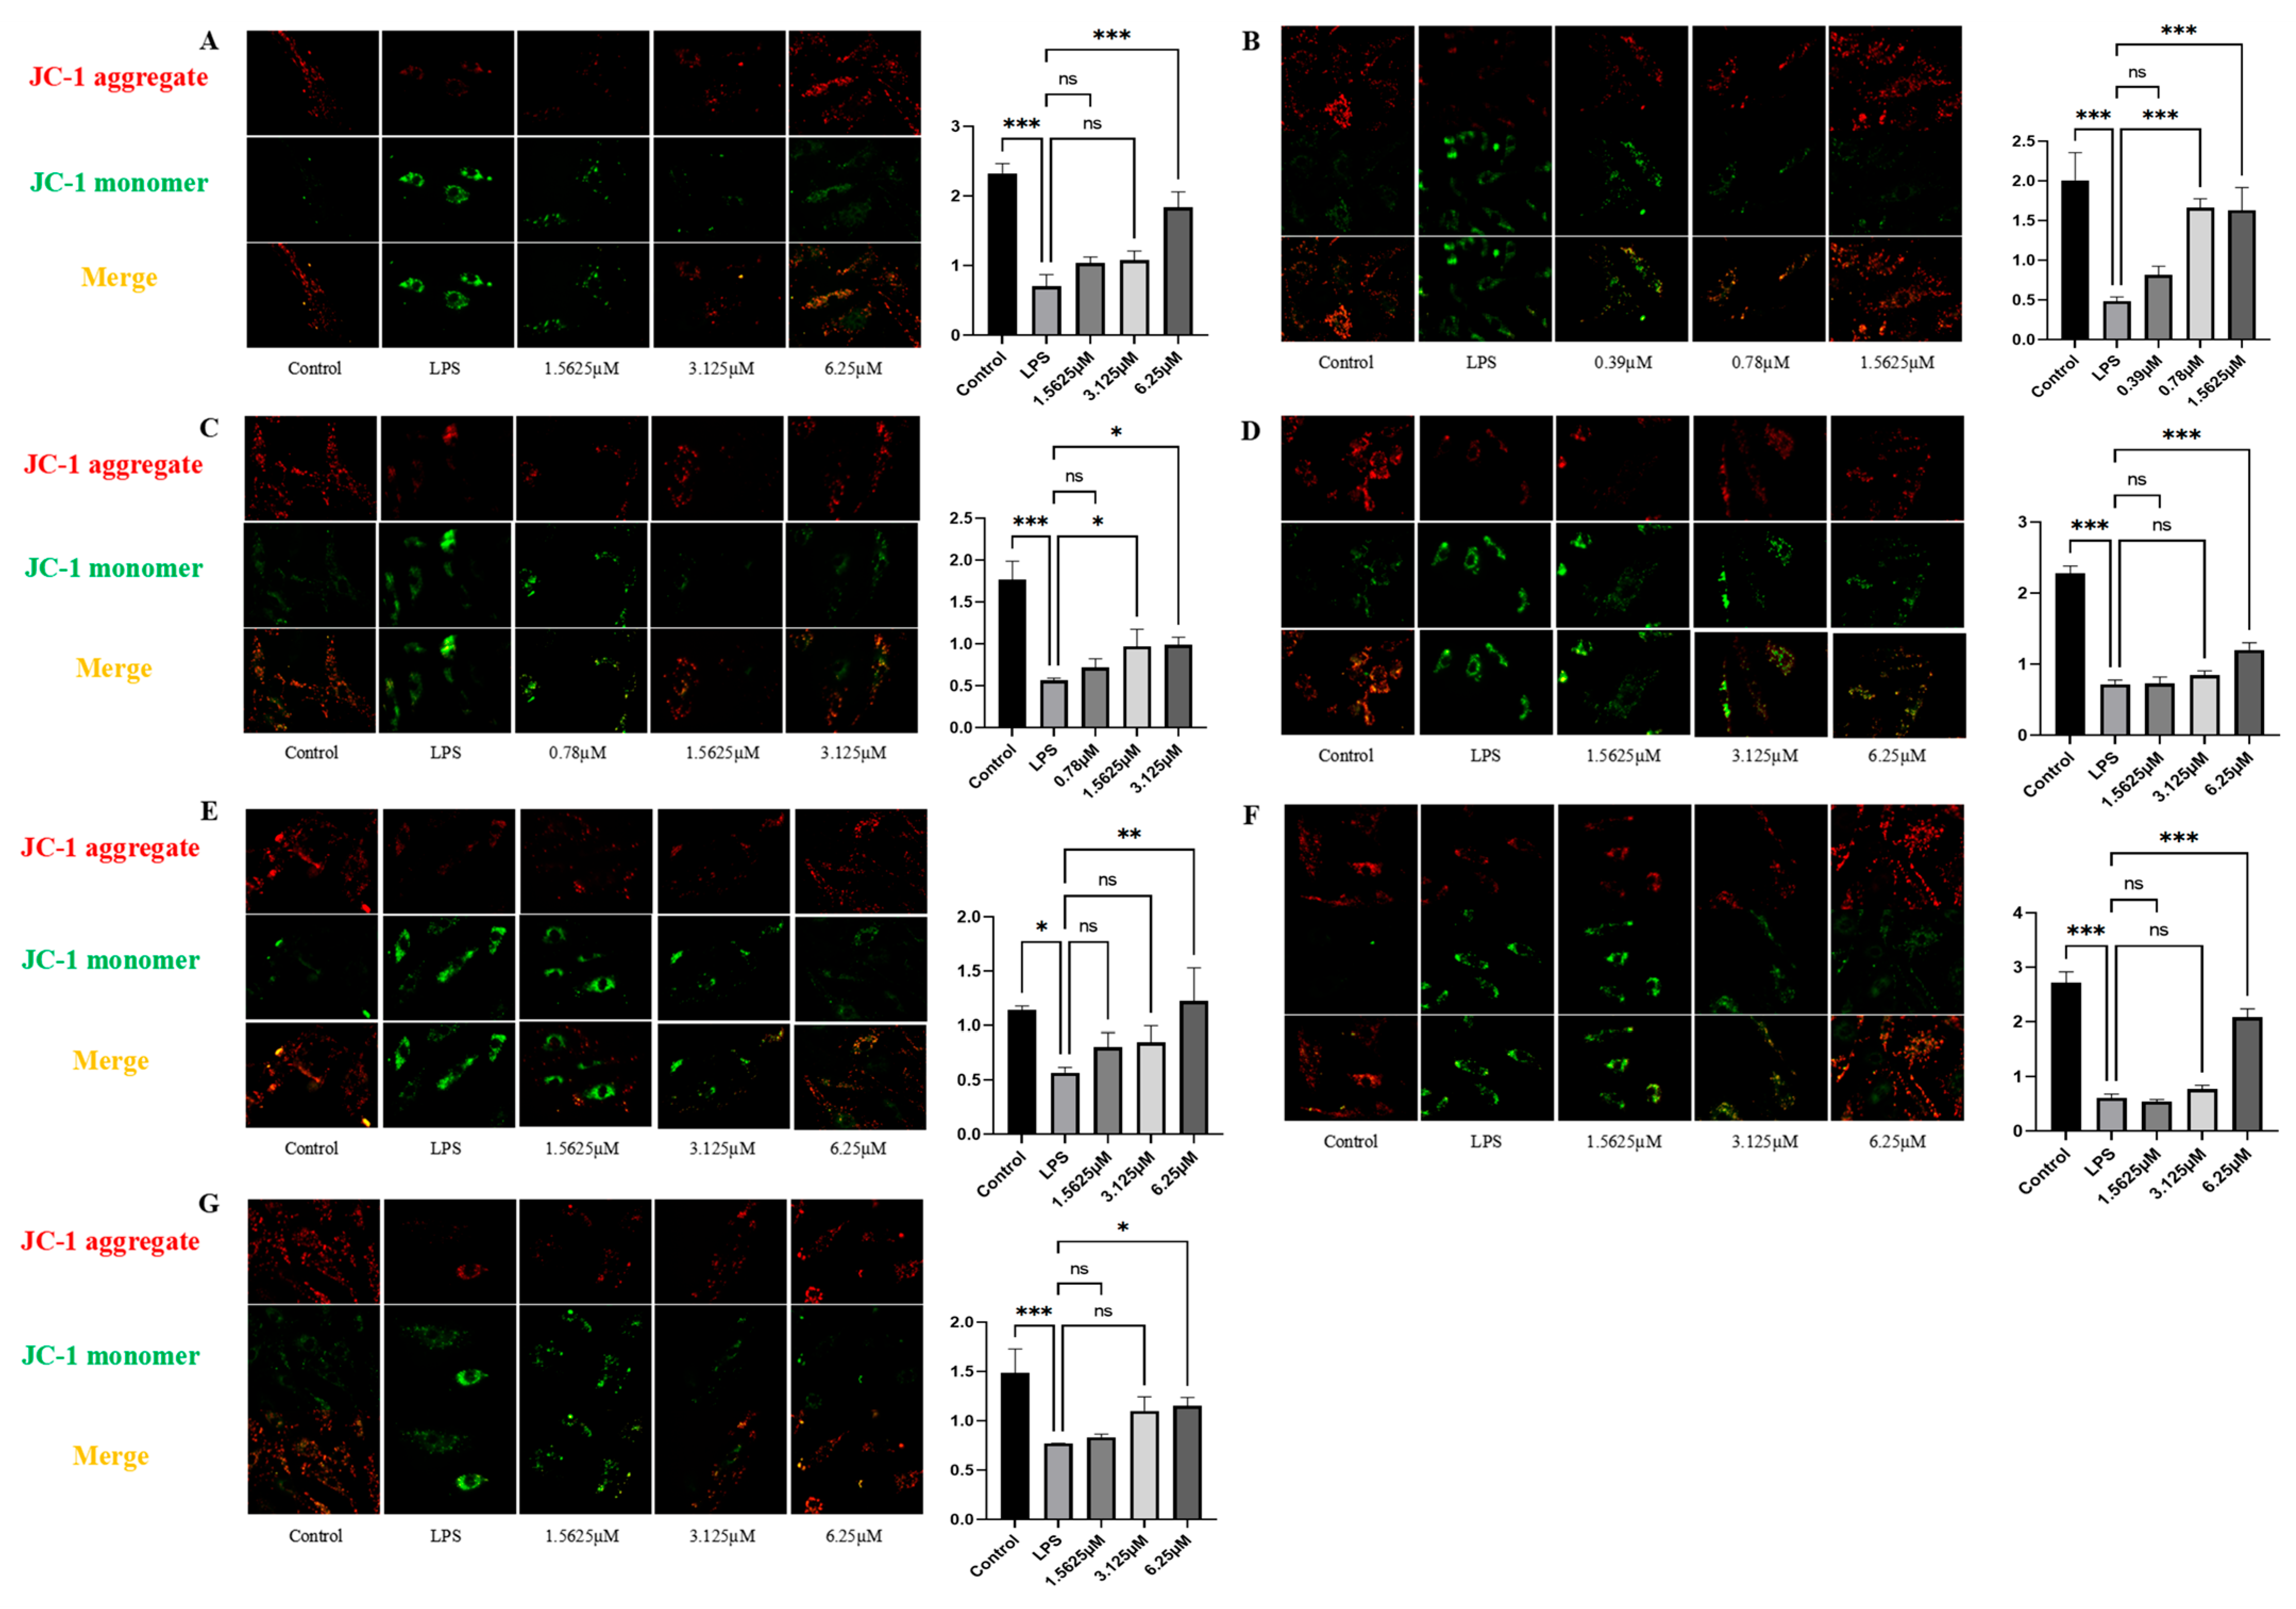
2.6. Effects of Compound Intervention on Mitochondrial Function in LPS-Induced HUVECs

This study evaluated seven compounds (17) for their effects on mitochondrial activity in LPS-stimulated HUVECs using MitoTracker staining. LPS significantly reduced mitochondrial fluorescence intensity (p < 0.05) and induced a clustering-to-granulation transition (Figure 8), indicating damage [8]. Compared to the LPS-treated group, all compounds exhibited dose-dependent protection (p < 0.05) (Figure 8). Acteoside (3) showed significant protection at medium (1.56 μM, 62.17 ± 5.01%) and high doses (3.13 μM, 65.97 ± 7.04%) (p < 0.01). Comparative evaluation at 1.5625 μM revealed that acteoside (3) (62.17 ± 5.01%) exhibited the most significant cytoprotective effect among the seven compounds tested, with remophilanetriol K (2) (47.48 ± 8.24%) showing the second highest activity (Table S11).
The mitochondrial membrane potential (ΔΨm), which is critical for cellular homeostasis [28], was assessed by JC-1 staining. JC-1 staining showed that LPS significantly decreased ΔΨm (p < 0.05 vs. control), with a reduced red/green fluorescence ratio (Figure 9). All compounds significantly protected against mitochondrial depolarization at high doses (p < 0.05) (Table S12), with remophilanetriol J (1), remophilanetriol K (2), purpureaside C (5), jionoside A1 (6), and jionoside B1 (7) restoring ΔΨm by more than 50%. Comparative evaluation at 1.5625 μM indicated that among the seven compounds tested, remophilanetriol K (2) exhibited the highest cytoprotective efficacy (75.36 ± 10.82%). Purpureaside C (5) and acteoside (3) ranked second and third, with activities of 40.63 ± 13.42% and 33.64 ± 9.77%, respectively (Table S12).

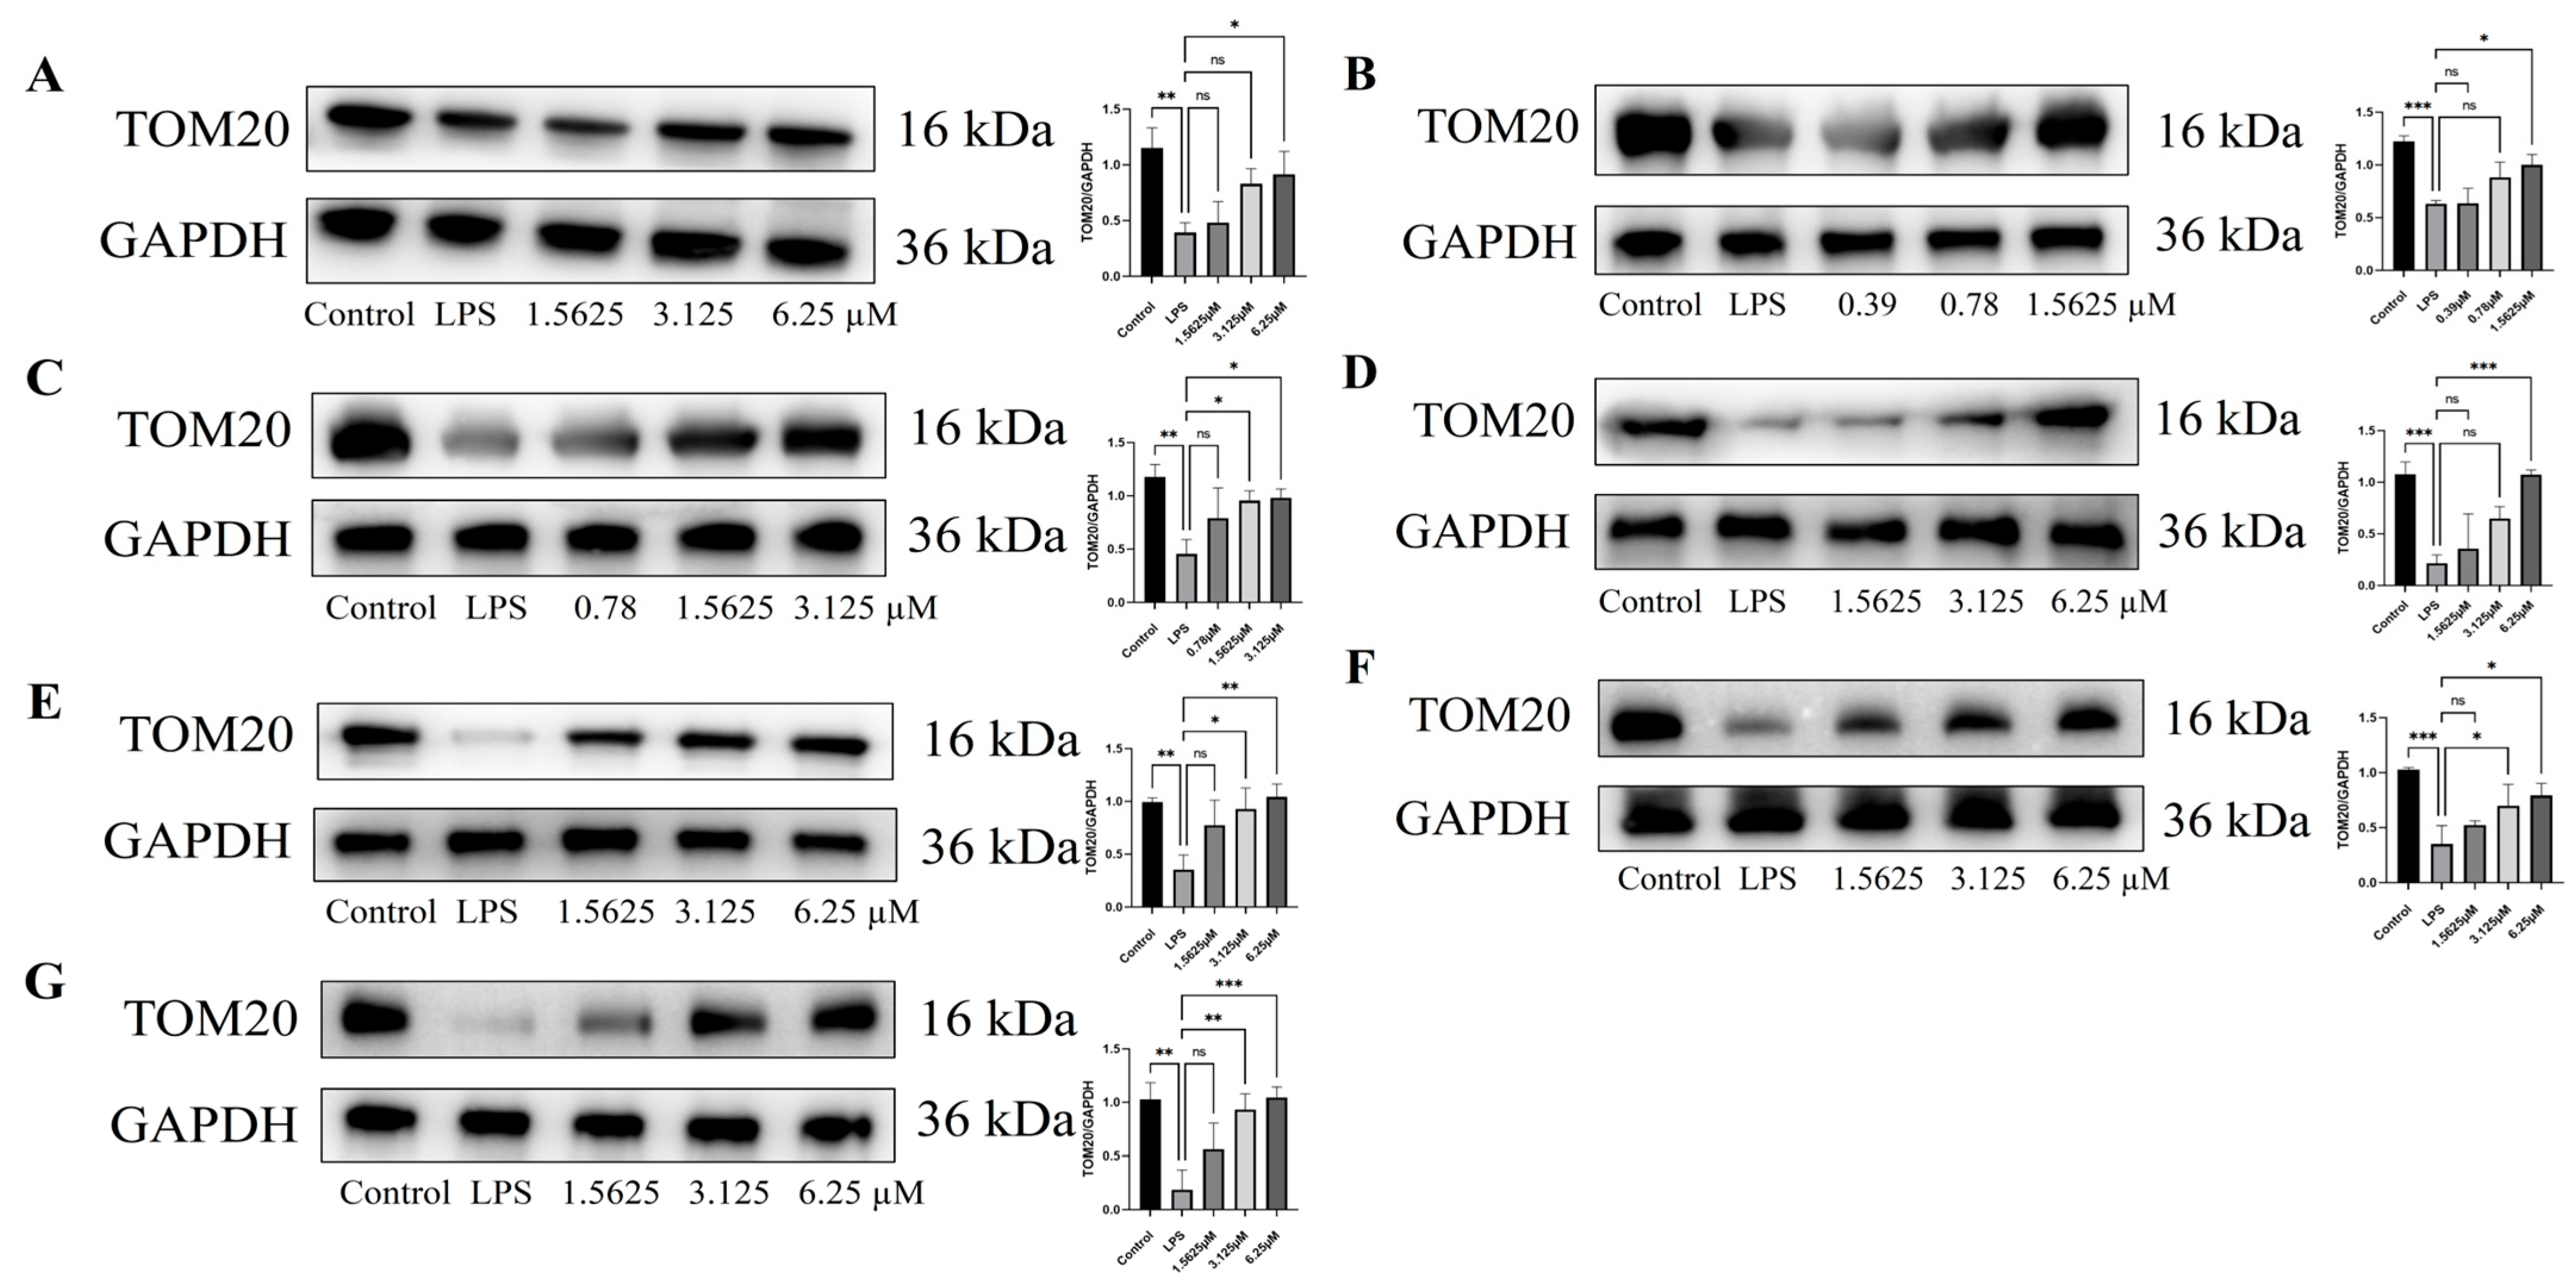
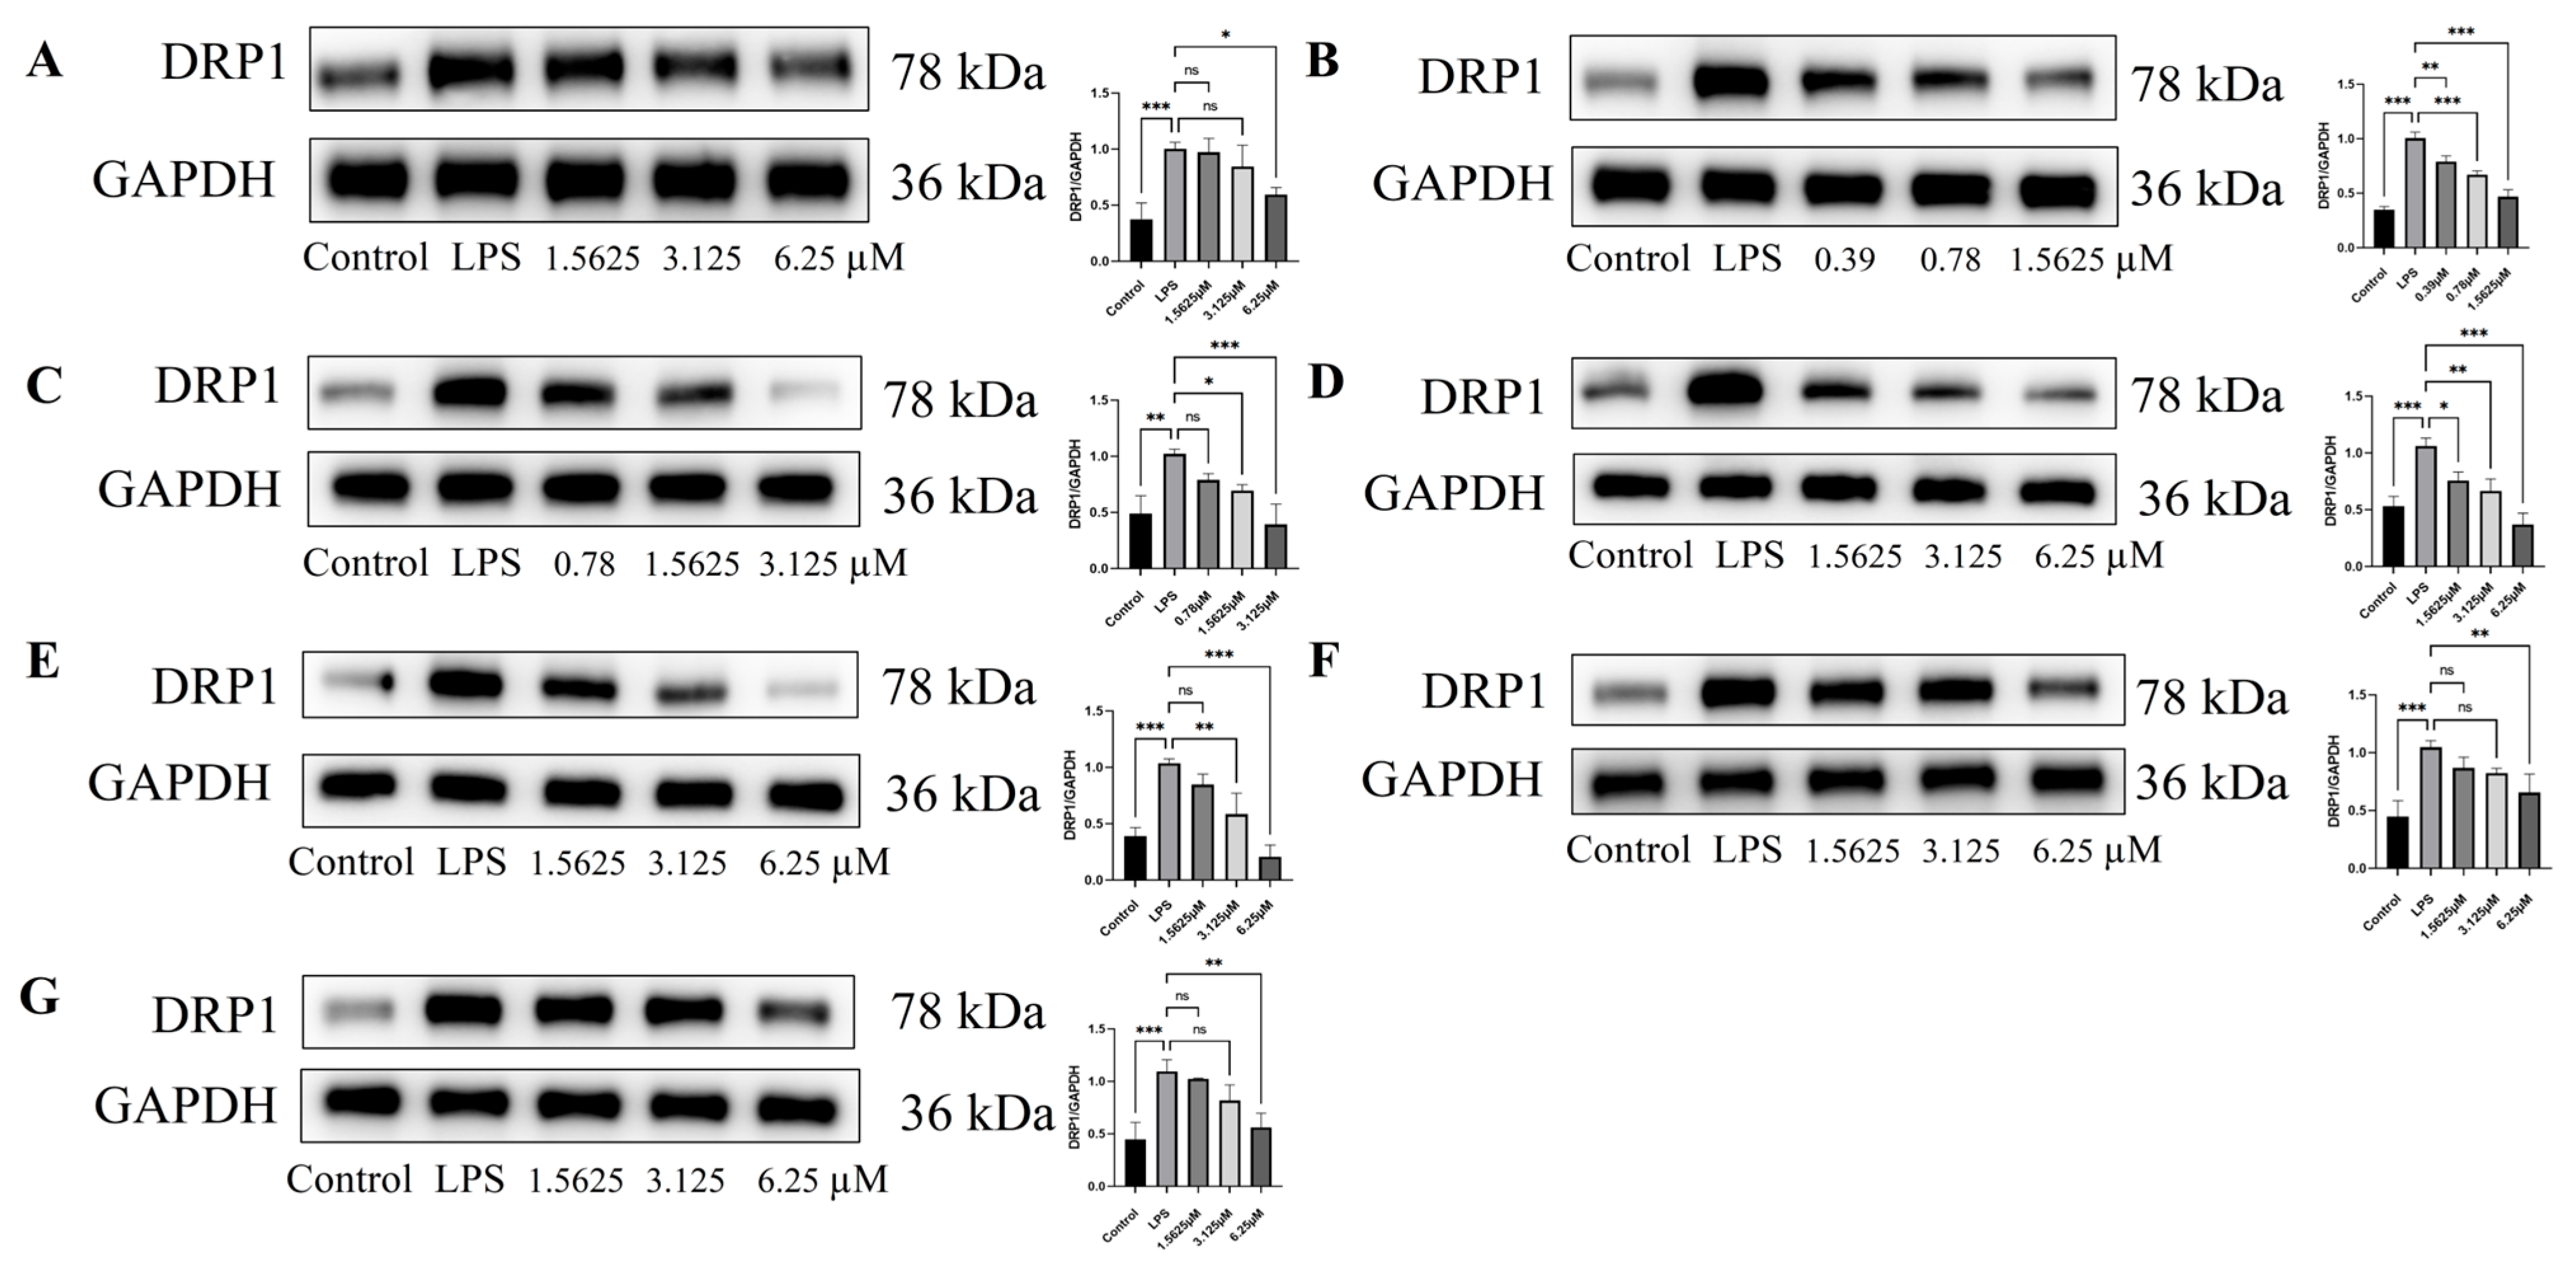
2.7. Effect of Compound Intervention on LPS-Induced Mitochondrial Homeostasis in Endothelial Cells

Thanslocase TOM20, which is essential for mitochondrial protein import and homeostasis [29,30,31], and DRP1, a key mediator of mitochondrial fission and dysfunction [32,33], were evaluated to assess the effects of the compounds on LPS-induced mitochondrial impairment.
LPS treatment significantly impairs mitochondrial homeostasis in endothelial cells, as evidenced by decreased TOM20 expression and increased DRP1 levels compared to the control (p < 0.05) [32,33,34,35]. In HUVECs, all tested compounds significantly increased TOM20 expression and reduced DRP1 levels in a dose-dependent manner compared to the LPS-treated model group (p < 0.05), demonstrating potent protective effects on mitochondrial homeostasis (Figure 10 and Figure 11). Among all tested compounds (at 1.5625 μM, vs. LPS-treated model group), remophilanetriol K (2) and acteoside (3) exhibited superior mitochondrial protective effects, as evidenced by their ability to upregulate TOM20 expression (reversing LPS-induced suppression by 62.25 ± 9.69% and 69.18 ± 7.31%, respectively) and downregulate DRP1 levels (attenuating LPS-induced overexpression by 81.81 ± 5.68% and 61.25 ± 5.60%, respectively) (Tables S13 and S14).
Comparative analysis revealed that LPS-treated endothelial cells (model group) exhibited significantly impaired migratory capacity, elevated ROS levels, ΔΨm depolarization, downregulated expression of the mitochondrial import protein TOM20, and upregulated expression of the fission-regulating protein DRP1 compared to the normal control group (p < 0.05). Existing evidence indicates that excessive ROS accumulation compromises mitochondrial integrity through multiple pathways, including membrane structural damage (manifested as ΔΨm dissipation) and DRP1 overexpression, ultimately leading to mitochondrial dysfunction and subsequent cellular apoptosis [33,36]. The experimental observations of concurrent ROS elevation, ΔΨm depolarization, and DRP1 upregulation in LPS-stimulated endothelial cells demonstrate a mechanistic correlation among these pathological alterations.
Mitotracker staining analysis (Figure 8) demonstrated that LPS-treated endothelial cells exhibited fragmented mitochondrial morphology, likely resulting from excessive mitochondrial fission mediated by upregulated DRP1 expression [32,37]. Mitochondrial fragmentation represents a hallmark of disrupted mitochondrial homeostasis, which in turn promotes excessive ROS generation and impairs both mitochondrial energy production and normal endothelial cell function [32,37]. Concurrently, the observed downregulation of TOM20 protein expression compromises mitochondrial protein import machinery, leading to disturbances in energy metabolism and quality control mechanisms, thereby further exacerbating mitochondrial dysfunction [29,30,31].
The differential ROS-scavenging capacities observed among the tested compounds may be attributed to their structural variations, particularly hydroxyl substitution and methylation patterns. The potent reducing properties conferred by hydroxyl groups likely enable direct ROS neutralization, thereby providing protection to the mitochondrial [38,39]. This aligns with reports that eremophilane-type sesquiterpenes reduce ROS and apoptosis in TGF-β1-induced BEAS-2B cells [40] and inhibit ROS production in activated neutrophils [41]. Molecular docking analyses by Gao et al. demonstrated strong binding interactions of phenylethanol glycosides with key molecular targets, including GSTP1, EGFR, and MAPK8 [42]. Qi et al. reported their neuroprotective effects against H2O2-induced oxidative stress and apoptosis through NOX2/ROS/MAPK pathway modulation [43], suggesting potential activation of endogenous antioxidant defense systems by these compounds, although their precise mechanisms require further investigation.
The experimental results demonstrated that all seven compounds conferred dose-dependent protection against LPS-induced mitochondrial damage in endothelial cells through multiple pathways. Notably, remophilanetriol K (2) and acteoside (3) exhibited significant protective effects against LPS-induced mitochondrial injury in endothelial cells by effectively suppressing ROS accumulation and preserving mitochondrial function through multiple mechanisms. These findings suggest their potential as molecular targets for treating sepsis-associated vascular mitochondrial dysfunction, although the detailed protective mechanisms require further investigation.

3. Materials and Methods

3.1. Experimental Protocols

NMR spectra were recorded on a Bruker AVANCE III 500 MHz spectrometer using CDCl3 as the reference (δH 7.26/δC 77.2). Semi-preparative HPLC was performed using a YMC ODS-A column (5 μm, 250 × 10 mm, YMC, Kyoto, Japan) with a SEP LC-52 system. UV (UV-2102, Unico, Shanghai, China) and IR (FTIR-8400S, Shimadzu, Kyoto, Japan) spectra were obtained. Optical rotations and CD spectra were measured using a 241 polarimeter (PerkinElmer, Waltham, MA, USA) and J-815 spectropolarimeter (JASCO, Tokyo, Japan), respectively. HR-ESI-MS data were acquired using a Xevo G2-S QTOF system (Waters, Milford, CT, USA).

3.2. UPLC-Q-TOF-MS/MS Parameters

For the analysis of mass spectrometry fragmentation behavior, compounds 710 were dissolved in methanol. The analysis was performed using a Waters Acquity UPLC-PDA system (Waters, Milford, CT, USA) equipped with a BEH C18 column (2.1 × 100 mm, 1.7 μm, Acquity BEH, Waters). The mobile phase comprised 0.1% formic acid/water (A) and 0.1% formic acid/acetonitrile (B) with the following gradient: 5% B (0–1 min), 5–95% B (1–13 min), 95% B (13–15 min), 95–5% B (15–16 min), and 5% B (16–18 min) at 0.3 mL/min. The UV absorbance (200–400 nm) and column temperature (40 °C) were set. For MS/MS analysis, full MS scans were conducted in positive ion mode from m/z 50 to 1500, with leucine-enkephalin ([M + H]+ = 556.2771, 200 ng/mL) as the lock mass. The ion source was maintained at 100 °C with desolvation at 450 °C (gas flow: 900 L/h), using 3.0 kV capillary and 40 V cone voltages. Low-energy scans used a collision energy of 4.0 eV, while high-energy scans were ramped from 20 to 40 eV. MassLynx 4.1 software was used to control the instruments.

3.3. Plant Material

In March 2024, fresh R. glutinosa roots were harvested in Wuzhi County (Jiaozuo City, Henan Province, China). Dr. Gang Ding from the Institute of Medicinal Plant Development identified the species. Triple EtOAc extraction of the root tuber phloem, followed by solvent evaporation, yielded 30.6 g of extract.

3.4. Purification of Compounds

The EtOAc extract (30.6 g) was fractionated using silica gel CC (100–200 mesh) with a CH2Cl2-MeOH gradient (1:0–0:1) to afford 15 fractions (Fr. 1–15). Through C-18 chromatography (MeOH/H2O, 1:9−1:0), sixteen fractions (Fr. 4.1–Fr. 4.16) were obtained from Fr. 4 (3.6 g). Fr. 4.10 (6.9 mg) was separated by semi-preparative HPLC (MeOH/H2O, 67–69% for 30 min and eluting in 69% for 15 min) to obtain compound 2 (1.2 mg, tR = 25.6 min) and 1 (2.0 mg, tR = 32.5 min). Fr. 12 (5.7 g) was eluted with MeOH in H2O (10−100%) from ODS chromatography to obtain two fractions (Fr. 12.1–Fr. 12.2). Under the HPLC conditions with MeOH in H2O 35–43% for 25 min and followed by 43% for 20 min, Fr. 12.1 (232.9 mg) was purified to obtain 5 (3.9 mg, tR = 14.3 min), 6 (7.4 mg, tR = 19.5 min), 3 (7.5 mg, tR = 28.4 min), and 7 (11.3 mg, tR = 29.8 min). Fr. 15 (642.5 mg) was loaded onto a Sephadex LH-20 column (MeOH) to afford five separations (Fr. 15.1–Fr. 15.5). And then Fr. 15.5 (75.6 mg) was eluted with 47% MeOH in H2O for 50 min by semi-preparative HPLC to yield 4 (25.1 mg, tR = 26.1 min).
Remophilanetriol J (1): [α ] D 25 −4.0 (c 0.05, MeOH); UV (MeOH) λmax (log ε) 266 (3.79) nm; IR (neat) νmax 3363, 2925, 2854, 1665, 1590, 1377, 1229, and 1039 cm−1; 1H NMR (500 MHz, CDCl3) and 13C NMR (125 MHz, CDCl3), shown in Table 1; (+)-HR-ESI-MS: m/z 235.1708 [M+H]+ (calcd. for C15H23O2, 235.1698).
Remophilanetriol K (2): [α ] D 25 −15.0 (c 0.1, MeOH); UV (MeOH) λmax (log ε) 237 (4.56) nm; IR (neat) νmax 3356, 2937, 1667, 1387, and 1031 cm−1; 1H NMR (500 MHz, CDCl3) and 13C NMR (125 MHz, CDCl3), shown in Table 1; (+)-HR-ESI-MS: m/z 251.1645 [M + H]+ (calcd. for C15H23O3, 251.1647).

3.5. ECD Calculations

MMFF94S-based conformational sampling was performed, followed by DFT optimization of conformers within 10 kcal/mol of the global minimum. The benchmark results demonstrate that the dispersion-corrected functional B3LYP-D3BJ exhibits high accuracy, suggesting that it is suitable for biochemically relevant systems. Conformers within 0–10 kcal/mol were optimized at the B3LYP-D3BJ/6-31G (d) level, and those within 0–4 kcal/mol were reoptimized at the B3LYP-D3BJ/6-311G (2d, p) level. ECD calculations were conducted using TDDFT/B3LYP/6-311G (2d, p)/SMD. All computations were performed using Gaussian 09 software.

3.6. HUVEC Cultivation and Compound Treatment

HUVECs (ZQXZBIO, Shanghai, China) were maintained in Endothelial Cell Medium (Catalog #1001, ScienCell, Carlsbad, CA, USA) containing 100 U/mL penicillin–streptomycin at 37 °C/5% CO2. For cytotoxicity evaluation, cells were treated with graded drug concentrations (0, 1.5625, 3.125, 6.25, 12.5, 25, 50, 100, and 200 μM; 48 h) and analyzed by CCK-8 assay. To induce endothelial injury, HUVECs were stimulated with LPS (100 ng/mL, 48 h). For drug intervention studies, cells were pretreated with low/medium/high drug doses (12 h) prior to co-exposure to LPS (48 h). DMSO (0.1%) was used to improve the drug’s solubility and bioavailability.

3.7. CCK-8 Assay

HUVEC proliferation was assessed by CCK-8 assay (SparkJade, Jinan, China, CT0001-D). Cells (5 × 10³/well) were seeded in 96-well plates, treated, and incubated with CCK-8 reagent (10% in serum/antibiotic-free medium) (4 h, 37 °C). Absorbance at 450 nm was measured in triplicates using a microplate reader.

3.8. Transwell Assay

Treated HUVECs were resuspended in serum-free ECM and seeded into the upper chambers of the Transwell, while complete ECM was added to the lower chambers. After 6 h of migration, the cells were washed, fixed (20 min), and stained with H&E (hematoxylin: 10 min; eosin: 5 min). Migrated cells were quantified by counting the number of cells in multiple fields.

3.9. ROS Detection

Intracellular ROS levels were quantified using an assay kit (Beyotime, Shanghai, China, S0033S) following the manufacturer’s protocol. Cells subjected to different treatments were stained with 10 μM HDCFDA and incubated (20 min, 37 °C).

3.10. Mitotracker Staining

HUVECs were stained with 500 nmol/L MitoTracker Red CMXRos solution (9082, Cell Signaling Technology, Danvers, MA, USA) for 30 min. Images were acquired using a Leica M205FA stereofluorescence microscope. ImageJ 1 software was used to assess mitochondrial fluorescence intensity.

3.11. JC-1 Mitochondrial Membrane Potential Staining

Treated HUVECs were resuspended in serum-free ECM medium, allowed to adhere, and stained with 2 μM JC-1 (C2006, Beyotime) (20 min, 37 °C, dark). Following two washes with JC-1 buffer, cells were imaged using fluorescence microscopy in 1 mL culture medium.

3.12. Western Blot

HUVECs were lysed in RIPA buffer (Beyotime, P0013C) containing protease/phosphatase inhibitors. Protein concentration was determined using a BCA kit (Beyotime, P0012). After separation by 10% SDS-PAGE, the proteins were transferred to PVDF membranes (Millipore, Burlington, MA, USA, R1DB92457). Membranes were probed with primary antibodies against TOM20 (Proteintech, Chicago, IL, USA, 11802-1-AP, 1:1000) and DRP1 (CST, Danvers, MA, USA, 8570S, 1:1000) at 4 °C overnight, followed by HRP-conjugated secondary antibody (SparkJade, Jinan, China, EF0014, 1:10,000) for 1 h at RT. GAPDH (1:10,000, ZB15004-HRP-100, Servicebio, Wuhan, China) was used as the loading control, without the need for additional secondary antibody incubation. Protein bands were visualized using an Ultra-Sensitive Chemiluminescent Substrate Kit (ED0015-B, SparkJade, Jinan, China) and quantified using ImageJ 1 software.

4. Conclusions

This study reports the isolation and characterization of two novel eremophilane-type sesquiterpenes, remophilanetriol J (1) and remophilanetriol K (2), along with five known phenylethanol glycosides (37), from the fresh roots of R. glutinosa. Additionally, the diagnostic mass spectrometric fragmentation pathways for phenylethanol glycosides (37) were elucidated for the first time, establishing a reliable analytical method for identifying analogous compounds in complex botanical extracts.
The protective effects of all seven isolated compounds (17) against LPS-induced damage in HUVECs were investigated, revealing significant dose-dependent cytoprotective activity. Treatment with these compounds reduced intracellular ROS levels, ameliorated mitochondrial membrane potential depolarization, alleviated TOM20 expression suppression, and inhibited DRP1 overexpression, collectively attenuating mitochondrial dysfunction and endothelial cell apoptosis. Notably, remophilanetriol K (2) exhibited potent protective effects at a low concentration (1.5625 μM), significantly improving LPS-induced endothelial cell viability (80.00 ± 6.93%) compared to the LPS model group. This compound effectively reduced intracellular ROS levels (74.78 ± 4.56%), mitigated mitochondrial membrane potential depolarization (75.36 ± 10.82%), restored TOM20 expression (62.25 ± 9.69%), and suppressed DRP1 overexpression (81.81 ± 5.68%), demonstrating strong protection against LPS-induced mitochondrial damage in vascular endothelial cells. These findings provide a mechanistic foundation for the traditional use of R. glutinosa and offer valuable insights into the development of novel therapeutic agents targeting mitochondrial dysfunction in sepsis.

Supplementary Materials

The following supporting information can be downloaded at https://www.mdpi.com/article/10.3390/ph18081125/s1, Figure S1: 1H NMR spectrum (500 MHz) of compound 1 in CDCl3. Figure S2: 13C NMR spectrum (125 MHz) of compound 1 in CDCl3. Figure S3: 1H-1H COSY spectrum (500 MHz) of compound 1 in CDCl3. Figure S4: HSQC spectrum (500 MHz) of compound 1 in CDCl3. Figure S5: HMBC spectrum (500 MHz) of compound 1 in CDCl3. Figure S6: NOE spectrum (500 MHz) of compound 1 in CDCl3. Figure S7: UPLC-Q-TOF-MS/MS spectra of compound 1 in CH3OH. Figure S8: IR spectrum of compound 1. Figure S9: UV spectrum of compound 2 in CH3OH. Figure S10: 1H NMR spectrum (500 MHz) of compound 2 in CDCl3. Figure S11: 13C NMR spectrum (125 MHz) of compound 2 in CDCl3. Figure S12: 1H-1H COSY spectrum (500 MHz) of compound 2 in CDCl3. Figure S13: HSQC spectrum (500 MHz) of compound 2 in CDCl3. Figure S14: HMBC spectrum (500 MHz) of compound 2 in CDCl3. Figure S15: UPLC-Q-TOF-MS/MS spectra of compound 2 in CH3OH. Figure S16: IR spectrum of compound 2. Figure S17: UV spectrum of compound 2 in CH3OH. Figure S18: UPLC-Q-TOF-MS/MS spectra of compound 3 in CH3OH. Figure S19: UPLC-Q-TOF-MS/MS spectra of compound 4 in CH3OH. Figure S20: UPLC-Q-TOF-MS/MS spectra of compound 5 in CH3OH. Figure S21: UPLC-Q-TOF-MS/MS spectra of compound 6 in CH3OH. Figure S22: UPLC-Q-TOF-MS/MS spectra of compound 7 in CH3OH. Figure S23: Possible mass fragmentation pathways of 3. Figure S24: Possible mass fragmentation pathways of 4. Figure S25: Possible mass fragmentation pathways of 6. Figure S26: Possible mass fragmentation pathways of 7. Table S1: Eremophilane-type sesquiterpenes isolated from Rehmannia glutinosa. Table S2: Elemental constituents of major ions from UPLC-Q-TOF-MS/MS spectra for acteoside (3). Table S3: Elemental constituents of major ions from UPLC-Q-TOF-MS/MS spectra for compound (4). Table S4: Elemental constituents of major ions from UPLC-Q-TOF-MS/MS spectra for compound (5). Table S5: Elemental constituents of major ions from UPLC-Q-TOF-MS/MS spectra for compound (6). Table S6: Elemental constituents of major ions from UPLC-Q-TOF-MS/MS spectra for compound (7). Table S7: IC50 values for cytotoxic effect of 17 on endothelial cells. Table S8: Experimental concentrations of compounds (17) (μM). Table S9: The extent to which compounds (17) alleviate LPS-induced impairment of HUVEC migration (p < 0.05). Table S10: Effects of compounds (17) on ROS levels in LPS-induced HUVECs (p < 0.05). Table S11: The extent to which compounds (17) restore LPS-induced reduction in mitochondrial fluorescence intensity in HUVECs (via MitoTracker staining) (p < 0.05). Table S12: The extent to which compounds (17) restore the LPS-induced reduction in mitochondrial red/green fluorescence intensity ratios in HUVECs (via JC-1 staining) (p < 0.05). Table S13: The extent to which compounds (17) restore the LPS-induced reduction in TOM20 protein expression in HUVECs (p < 0.05). Table S14: The extent to which compounds (17) reverse the LPS-induced upregulation of DRP1 protein expression in HUVECs (p < 0.05). References [15,18,40,44,45] are cited in the supplementary materials.

Author Contributions

Data curation, writing—original draft, methodology, investigation, L.Z.; methodology, investigation, M.L.; investigation, H.F.; writing—review and editing, C.L.; writing—review and editing, H.Q.; writing—review and editing, resources, G.D. All authors have read and agreed to the published version of the manuscript.

Funding

This study was funded by the CAMS Innovation Fund for Medical Sciences (CIFMS) (grant no. 2023-I2M-2-006) and the National Natural Science Foundation of China (No. 22373030).

Institutional Review Board Statement

Not applicable.

Informed Consent Statement

Not applicable.

Data Availability Statement

The original contributions presented in this study are included in the article/Supplementary Material. Further inquiries can be directed to the corresponding authors.

Conflicts of Interest

The authors declare no conflicts of interest.

Abbreviations

The following abbreviations are used in this manuscript:
IRInfrared Radiation
UVUltraviolet
MSMass Spectrum
NMRNuclear Magnetic Resonance
LPSLipopolysaccharide
ECDElectronic Circular Dichroism
HUVECsHuman Umbilical Vein Endothelial Cells
ROSReactive Oxygen Species
DFTDensity Functional Theory
ECMEndothelial Cell Medium

References

  1. Qin, Y.; Zhu, J.G. Textual research on the efficacy of Rehmanniae Radix. Chin. J. Tradit. Chin. Med. 2018, 33, 114–118. [Google Scholar] [CrossRef]
  2. Chen, J.P.; Zhang, K.X.; Liu, Y.; Gai, X.H.; Ren, T.; Liu, S.X.; Tian, C.W. Research progress on chemical constituents and pharmacological actions of Rehmannia glutinosa. Chin. Tradit. Herb. Drugs 2021, 52, 1772–1784. [Google Scholar] [CrossRef]
  3. Li, M.; Jiang, H.; Hao, Y.; Du, K.; Du, H.; Ma, C.; Tu, H.; He, Y. A systematic review on botany, processing, application, phytochemistry and pharmacological action of Radix Rehmnniae. J. Ethnopharmacol. 2022, 285, 114820. [Google Scholar] [CrossRef] [PubMed]
  4. Chinese Pharmacopoeia Commission. Pharmacopoeia of the People’s Republic of China; 2020 ed.; China Medical Science Press: Beijing, China, 2020; Volume 1, p. 129. [Google Scholar]
  5. Volk, T.; Kox, W.J. Endothelium function in sepsis. Inflamm. Res. 2000, 49, 185–198. [Google Scholar] [CrossRef] [PubMed] [PubMed Central]
  6. Dolmatova, E.V.; Wang, K.; Mandavilli, R.; Griendling, K.K. The effects of sepsis on endothelium and clinical implications. Cardiovasc. Res. 2021, 117, 60–73. [Google Scholar] [CrossRef] [PubMed] [PubMed Central]
  7. Zou, Q.L.; Feng, L.N.; Fan, S.Y.; He, C.; Zhang, D.D.; Kong, P. Mitochondrial dynamics homeostasis and vascular remodeling diseases. Chem. Life 2024, 44, 1923–1932. [Google Scholar] [CrossRef]
  8. Zhang, Z.; Jiang, X.S.; Yang, S.; Chen, X.M. Role of mitochondrial injury in lipopolysaccharide-induced vascular endothelial cell apoptosis. J. Chongqing Med. Univ. 2020, 45, 1137–1143. [Google Scholar] [CrossRef]
  9. Wang, D.X.; Zhang, T.G.; Miao, C.Y. Mitochondrial oxidative stress in vascular endothelial cell and atherosclerosis. Pharm. Pract. Serv. 2023, 41, 329–334+388. [Google Scholar] [CrossRef]
  10. Zhang, B.B.; Zeng, M.N.; Kan, Y.X.; Zhang, Q.Q.; Jia, J.F.; Liu, M.; Guo, P.L.; Wang, R.; Feng, W.S.; Zheng, X.K. Effects of Rehmannia glutinosa on LPS-induced septic acute kidney injury through estrogen receptors. Chin. J. New Drugs Clin. Rem. 2023, 42, 240–248. [Google Scholar] [CrossRef]
  11. Zhang, A.P. Clinical Study of Xijiao Dihuang Decoction in the Treatment of Sepsis (Tipe of Terrific Heat In Vivo). Master’s Thesis, Nanjing University of Traditional Chinese Medicine, Nanjing, China, 2015. [Google Scholar]
  12. Hou, C.; Kulka, M.; Zhang, J.; Li, Y.; Guo, F. Occurrence and biological activities of eremophilane-type sesquiterpenes. Mini-Rev. Med. Chem. 2014, 14, 664–677. [Google Scholar] [CrossRef] [PubMed]
  13. Yuyama, K.T.; Fortkamp, D.; Abraham, W.R. Eremophilane-type sesquiterpenes from fungi and their medicinal potential. Biol. Chem. 2018, 399, 13–28. [Google Scholar] [CrossRef] [PubMed]
  14. Zheng, X.K.; Liu, Y.Y.; Feng, W.S.; Wang, Y.Z.; Guo, Y.H. Development in research of natural phenylethanoid glycosides. Chin. J. New Drugs. 2011, 20, 230–234. [Google Scholar]
  15. Oh, H. Remophilanetriol: A new eremophilane from the roots of Rehmannia glutinosa. Bull. Korean Chem. Soc. 2005, 26, 1303–1305. [Google Scholar] [CrossRef]
  16. Liu, J.Z.; Wang, Y.D.; Fang, H.Q.; Sun, G.B.; Ding, G. UPLC-Q-TOF-MS/MS-based targeted discovery of chetomin analogues from Chaetomium cochliodes. J. Nat. Prod. 2024, 87, 1660–1665. [Google Scholar] [CrossRef] [PubMed]
  17. Wang, Y.; Zhong, L.; Fang, H.; Liu, Z.; Wang, P.; Li, L.; Chen, L.; Ding, G. Bioactive metabolites from the dusty seeds of Gastrodia elata Bl., based on metabolomics and UPLC-Q-TOF-MS combined with molecular network strategy. Plants 2025, 14, 916. [Google Scholar] [CrossRef] [PubMed]
  18. Liu, Y.L.; Cao, Y.G.; Kan, Y.X.; Ren, Y.J.; Zeng, M.N.; Wang, M.N.; He, C.; Chen, X.; Zheng, X.K.; Feng, W.S. Two new eremophilane-type sesquiterpenes from the fresh roots of Rehmannia glutinosa. Phytochem. Lett. 2021, 42, 125–128. [Google Scholar] [CrossRef]
  19. Guo, W.; Fu, H.Z.; Zhou, G.P.; Liao, Y.Y.; Yuan, M.M.; Guo, Q.; Yan, Q.W. Chemical constituents of Callicarpa kwangtungensis. Chin. J. Exp. Tradit. Med. Form. 2015, 21, 30–33. [Google Scholar] [CrossRef]
  20. Li, X.N.; Zhou, M.Y.; Shen, P.Q.; Zhang, J.B.; Chu, C.; Ge, Z.W.; Yan, J.Z. Chemical constituents from Rehmannia glutinosa. Chin. J. Chin. Mater. Med. 2011, 36, 3125–3129. [Google Scholar]
  21. Sasaki, H.; Nishimura, H.; Chin, M.; Mitsuhashi, H. Hydroxycinnamic acid esters of phenethylalcohol glycosides from Rehmannia glutinosa var. purpurea. Phytochemistry 1989, 28, 875–879. [Google Scholar] [CrossRef]
  22. Cai, T.; Guo, Z.Q.; Xu, X.Y.; Wu, Z.J. Recent (2000-2015) developments in the analysis of minor unknown natural products based on characteristic fragment information using LC-MS. Mass Spectrom. Rev. 2018, 37, 202–216. [Google Scholar] [CrossRef]
  23. Liu, Y. Study on the Mass Spectrometric Analytical Method and Correlation Spectroscopy of LC-MS/NMR of Phenylethanoid Glycosides and Their Complex Mixtures. Master’s Thesis, Peking Union Medical College, Beijing, China, 2009. [Google Scholar]
  24. Heim, K.E.; Tagliaferro, A.R.; Bobilya, D.J. Flavonoid antioxidants: Chemistry, metabolism and structure-activity relationships. J. Nutr. Biochem. 2002, 13, 572–584. [Google Scholar] [CrossRef]
  25. Xiao, J.; Muzashvili, T.S.; Georgiev, M.I. Advances in the biotechnological glycosylation of valuable flavonoids. Biotechnol. Adv. 2014, 32, 1145–1156. [Google Scholar] [CrossRef]
  26. Lai, R.; Zhao, W.; Huang, Y.; Zhou, W.; Wu, C.L.; Lai, X.F.; Zhao, W.X.; Zhang, M. The synthesis of methylated epigallocatechin gallate. Chem. Nat. Compd. 2015, 51, 472–475. [Google Scholar] [CrossRef]
  27. Wang, J.; Tang, H.; Hou, B.; Zhang, P.; Wang, Q.; Zhang, B.-L.; Huang, Y.-W.; Wang, Y.; Xiang, Z.-M.; Zi, C.-T.; et al. Synthesis, antioxidant activity, and density functional theory study of catechin derivatives. RSC Adv. 2017, 7, 54136–54141. [Google Scholar] [CrossRef]
  28. Zorova, L.D.; Popkov, V.A.; Plotnikov, E.Y.; Silachev, D.N.; Pevzner, I.B.; Jankauskas, S.S.; Babenko, V.A.; Zorov, S.D.; Balakireva, A.V.; Juhaszova, M.; et al. Mitochondrial membrane potential. Anal. Biochem. 2018, 552, 50–59. [Google Scholar] [CrossRef] [PubMed]
  29. Bhagawati, M.; Arroum, T.; Webeling, N.; Montoro, A.G.; Mootz, H.D.; Busch, K.B. The receptor subunit Tom20 is dynamically associated with the TOM complex in mitochondria of human cells. Mol. Biol. Cell. 2021, 32, br1. [Google Scholar] [CrossRef]
  30. Araiso, Y.; Imai, K.; Endo, T. Role of the TOM complex in protein import into mitochondria: Structural views. Annu. Rev. Biochem. 2022, 91, 679–703. [Google Scholar] [CrossRef]
  31. Chacinska, A.; Koehler, C.M.; Milenkovic, D.; Lithgow, T.; Pfanner, N. Importing mitochondrial proteins: Machineries and mechanisms. Cell 2009, 138, 628–644. [Google Scholar] [CrossRef]
  32. Luan, Y.; Ren, K.D.; Luan, Y.; Chen, X.; Yang, Y. Mitochondrial dynamics: Pathogenesis and therapeutic targets of vascular diseases. Front. Cardiovasc. Med. 2021, 8, 770574. [Google Scholar] [CrossRef]
  33. Tong, M.; Zablocki, D.; Sadoshima, J. The role of Drp1 in mitophagy and cell death in the heart. J. Mol. Cell. Cardiol. 2020, 142, 138–145. [Google Scholar] [CrossRef]
  34. Grey, J.Y.; Connor, M.K.; Gordon, J.W.; Yano, M.; Mori, M.; Hood, D.A. Tom20-mediated mitochondrial protein import in muscle cells during differentiation. Am. J. Physiol. Cell Physiol. 2000, 279, C1393–C1400. [Google Scholar] [CrossRef]
  35. Xue, Q.; Pei, H.F.; Duan, H.X.; Wei, F.P.; Yan, B.W.; Wang, W.; Tao, L. Research on mitochondrial translocase of outer mitochondrial membrane complex in cardiovascular diseases. Chin. Heart J. 2014, 26, 214–217+221. [Google Scholar] [CrossRef]
  36. Youle, R.J.; van der Bliek, A.M. Mitochondrial fission, fusion, and stress. Science 2012, 337, 1062–1065. [Google Scholar] [CrossRef] [PubMed]
  37. Nandan, P.K.; Job, A.T.; Ramasamy, T. DRP1 association in inflammation and metastasis: A review. Curr. Drug Targets 2024, 25, 909–918. [Google Scholar] [CrossRef] [PubMed]
  38. Wang, X.F.; Chen, L.; Ning, E.J.; Gui, R.; Wang, W.; Fan, Y.; Wang, X.B.; Li, X. Study on antioxidant activity of seven components in Forsythia suspensa leaves. Feed Res. 2023, 46, 94–99. [Google Scholar] [CrossRef]
  39. Pacifico, S.; D’Abrosca, B.; Pascarella, M.T.; Letizia, M.; Uzzo, P.; Piscopo, V.; Fiorentino, A. Antioxidant efficacy of iridoid and phenylethanoid glycosides from the medicinal plant Teucrium chamaedris in cell-free systems. Bioorg. Med. Chem. 2009, 17, 6173–6179. [Google Scholar] [CrossRef]
  40. Li, X.D.; Cao, Y.G.; Zhang, Y.H.; Ren, Y.J.; Zeng, M.N.; Liu, Y.L.; Chen, X.; Ma, X.Y.; Zhao, B.X.; Zheng, X.K.; et al. Five new eremophilane-type sesquiterpenes from the fresh roots of Rehmannia glutinosa. Fitoterapia 2024, 175, 105960. [Google Scholar] [CrossRef]
  41. Gubiani, J.R.; Zeraik, M.L.; Oliveira, C.M.; Ximenes, V.F.; Nogueira, C.R.; Fonseca, L.M.; Silva, D.H.; Bolzani, V.S.; Araujo, A.R. Biologically active eremophilane-type sesquiterpenes from Camarops sp., an endophytic fungus isolated from Alibertia macrophylla. J. Nat. Prod. 2014, 77, 668–672. [Google Scholar] [CrossRef]
  42. Gao, Y.; Tao, P.; Wang, Y.J.; Hou, Y.F.; He, S.M. Molecular mechanism of antioxidant activity of phenylethanoid glycosides from Cistanches Herba based on network pharmacology. Chin. J. Mod. Appl. Pharm. 2022, 39, 2204–2215. [Google Scholar] [CrossRef]
  43. Qi, Z.L.; Liu, Y.H.; Qi, S.M.; Ling, L.F.; Feng, Z.Y.; Li, Q. Salidroside protects PC12 cells from H2O2-induced apoptosis via suppressing NOX2-ROS-MAPKs signaling pathway. J. South. Med. Univ. 2016, 37, 178–183. [Google Scholar] [CrossRef]
  44. Liu, Y.L.; Cao, Y.G.; Zeng, M.N.; Wang, M.N.; Chen, X.; Fang, X.L.; He, C.; Ren, Y.J.; Zheng, X.K.; Feng, W.S. A new eremophilanolide from the fresh roots of Rehmannia glutinosa. R. Nat. Prod. 2022, 16, 509–514. [Google Scholar] [CrossRef]
  45. Feng, W.S.; Li, M.; Zheng, X.K.; Song, K.; Wang, J.C.; Li, C.G.; Zhang, M.H. Study on chemical constituents of immunosuppressive parts from the roots of Rehmannia glutinosa. Chin. Pharm. J. 2014, 49, 1496–1502. [Google Scholar]
Figure 1. Key 2D-NMR correlations for compounds 1 and 2.
Pharmaceuticals 18 01125 g001
Figure 2. Key NOE correlations of 1 (A) and calculated and experimental ECD spectra of 1 (B).
Pharmaceuticals 18 01125 g002
Figure 3. Structures of 17.
Pharmaceuticals 18 01125 g003
Figure 4. Possible mass fragmentation pathways of purpureaside C (5).
Pharmaceuticals 18 01125 g004
Figure 5. Cytotoxic effects (AG) of compounds (17) on HUVECs (n = 3). The tests were performed in triplicate, and the data are presented as the mean ± SEM. Statistical significance is indicated as * p < 0.05, ** p < 0.01, and *** p < 0.001 vs. the drug-untreated control group.
Pharmaceuticals 18 01125 g005
Figure 6. HUVEC staining results and quantitative analysis (AG) of each compound (17) intervention on LPS-induced HUVEC migration capacity (n = 3). All images were captured at a magnification of 10×. Data are presented as mean ± SEM. Statistical significance is defined as * p < 0.05, ** p < 0.01, and *** p < 0.001, compared to the LPS-treated group.
Pharmaceuticals 18 01125 g006
Figure 7. ROS staining results and quantitative analysis (AG) of each compound (17) intervention in LPS-induced HUVECs (n = 3). All images were captured at a magnification of 20×. Data are presented as mean ± SEM. Statistical significance is indicated as * p < 0.05, ** p < 0.01, and *** p < 0.001 vs. the LPS-treated group.
Pharmaceuticals 18 01125 g007
Figure 8. The Mitotracker staining results and fluorescence intensity quantitative analysis (AG) of each compound (17) intervention on LPS-induced HUVECs (n = 3). All images were captured at a magnification of 20×. Data are expressed as mean ± SEM. Statistical significance is indicated as * p < 0.05, ** p < 0.01, and *** p < 0.001 vs. the LPS-treated group.
Pharmaceuticals 18 01125 g008
Figure 9. JC-1 staining results and bar charts of red/green fluorescence intensity ratios in LPS-induced HUVECs treated with each compound (17) (AG), n = 3. All images were captured at a magnification of 20×. Data are displayed as mean ± SEM. Statistical significance is indicated as * p < 0.05, ** p < 0.01, and *** p < 0.001 vs. the LPS-treated group.
Pharmaceuticals 18 01125 g009
Figure 10. Effect of compounds (17) on LPS-induced TOM20 protein expression in endothelial cells (AG), n = 3. Data are exhibited as mean ± SEM. Statistical significance is indicated as * p < 0.05, ** p < 0.01, and *** p < 0.001 vs. the LPS-treated group.
Pharmaceuticals 18 01125 g010
Figure 11. Effect of compounds (17) on LPS-induced DRP1 protein expression in endothelial cells (AG), n = 3. Data are shown as mean ± SEM. Statistical significance is indicated as * p < 0.05, ** p < 0.01, and *** p < 0.001 vs. the LPS-treated group.
Pharmaceuticals 18 01125 g011
Table 1. 1H and 13C NMR data of compounds 1 and 2 in CDCl3.
Position12
δH a (mult, J in Hz)δC b, TypeδH a (mult, J in Hz)δC b, Type
1a1.29, overlapped20.7, CH21.32, dd, (11.5, 13.0)30.1, CH2
1b2.00, ddd, (11.5, 3.0, 1.5)2.31, ddd, (13.0, 4.5, 2.5)
2a1.30, overlapped25.3, CH23.70, tt, (11.5, 4.5)69.9, CH
2b1.83, m
3a1.25, overlapped30.2, CH21.28, td, (13.0, 11.5)39.1, CH2
3b1.44, ddd, (13.0, 5.0, 2.5)1.78, ddd, (13.0, 4.5, 2.5)
41.55, m43.3, CH1.63, overlapped41.4, CH
5 40.0, C 38.9, C
6a2.30, dd, (2.5, 17.5)41.1, CH22.27, overlapped40.7, CH2
6b2.68, d, (17.5)2.70, d, (17.5)
7 151.8, C 151.9, C
86.05, d, (2.5)124.0, CH6.08, d, (2.5)123.6, CH
9 201.9, C 200.2, C
102.21, dd, (3.5, 11.5)55.2, CH2.26, overlapped53.1, CH
11 146.4, C 145.9, C
125.58, s
5.60, s
117.3, CH25.60, s
5.61, s
117.5, CH2
134.38, s63.8, CH24.39, s63.4, CH2
140.77, s11.9, CH30.78, s11.7, CH3
150.90, d, (7.0)15.4, CH30.96, d, (7.0)14.9, CH3
a Recorded at 500 MHz, b Recorded at 125 MHz.
Disclaimer/Publisher’s Note: The statements, opinions and data contained in all publications are solely those of the individual author(s) and contributor(s) and not of MDPI and/or the editor(s). MDPI and/or the editor(s) disclaim responsibility for any injury to people or property resulting from any ideas, methods, instructions or products referred to in the content.

