
Semaglutide in MASLD Patients: Improved Survival and Liver Outcomes

 ,
,  , and
, and
Abstract
1. Introduction
2. Results
2.1. Baseline Characteristics
2.1.1. Demographics (Table 1a)
2.1.2. Comorbidities (Table 1a)
2.1.3. Laboratory Parameters (Table 1b)
2.1.4. Medications (Table 1c)
2.2. Clinical Outcomes
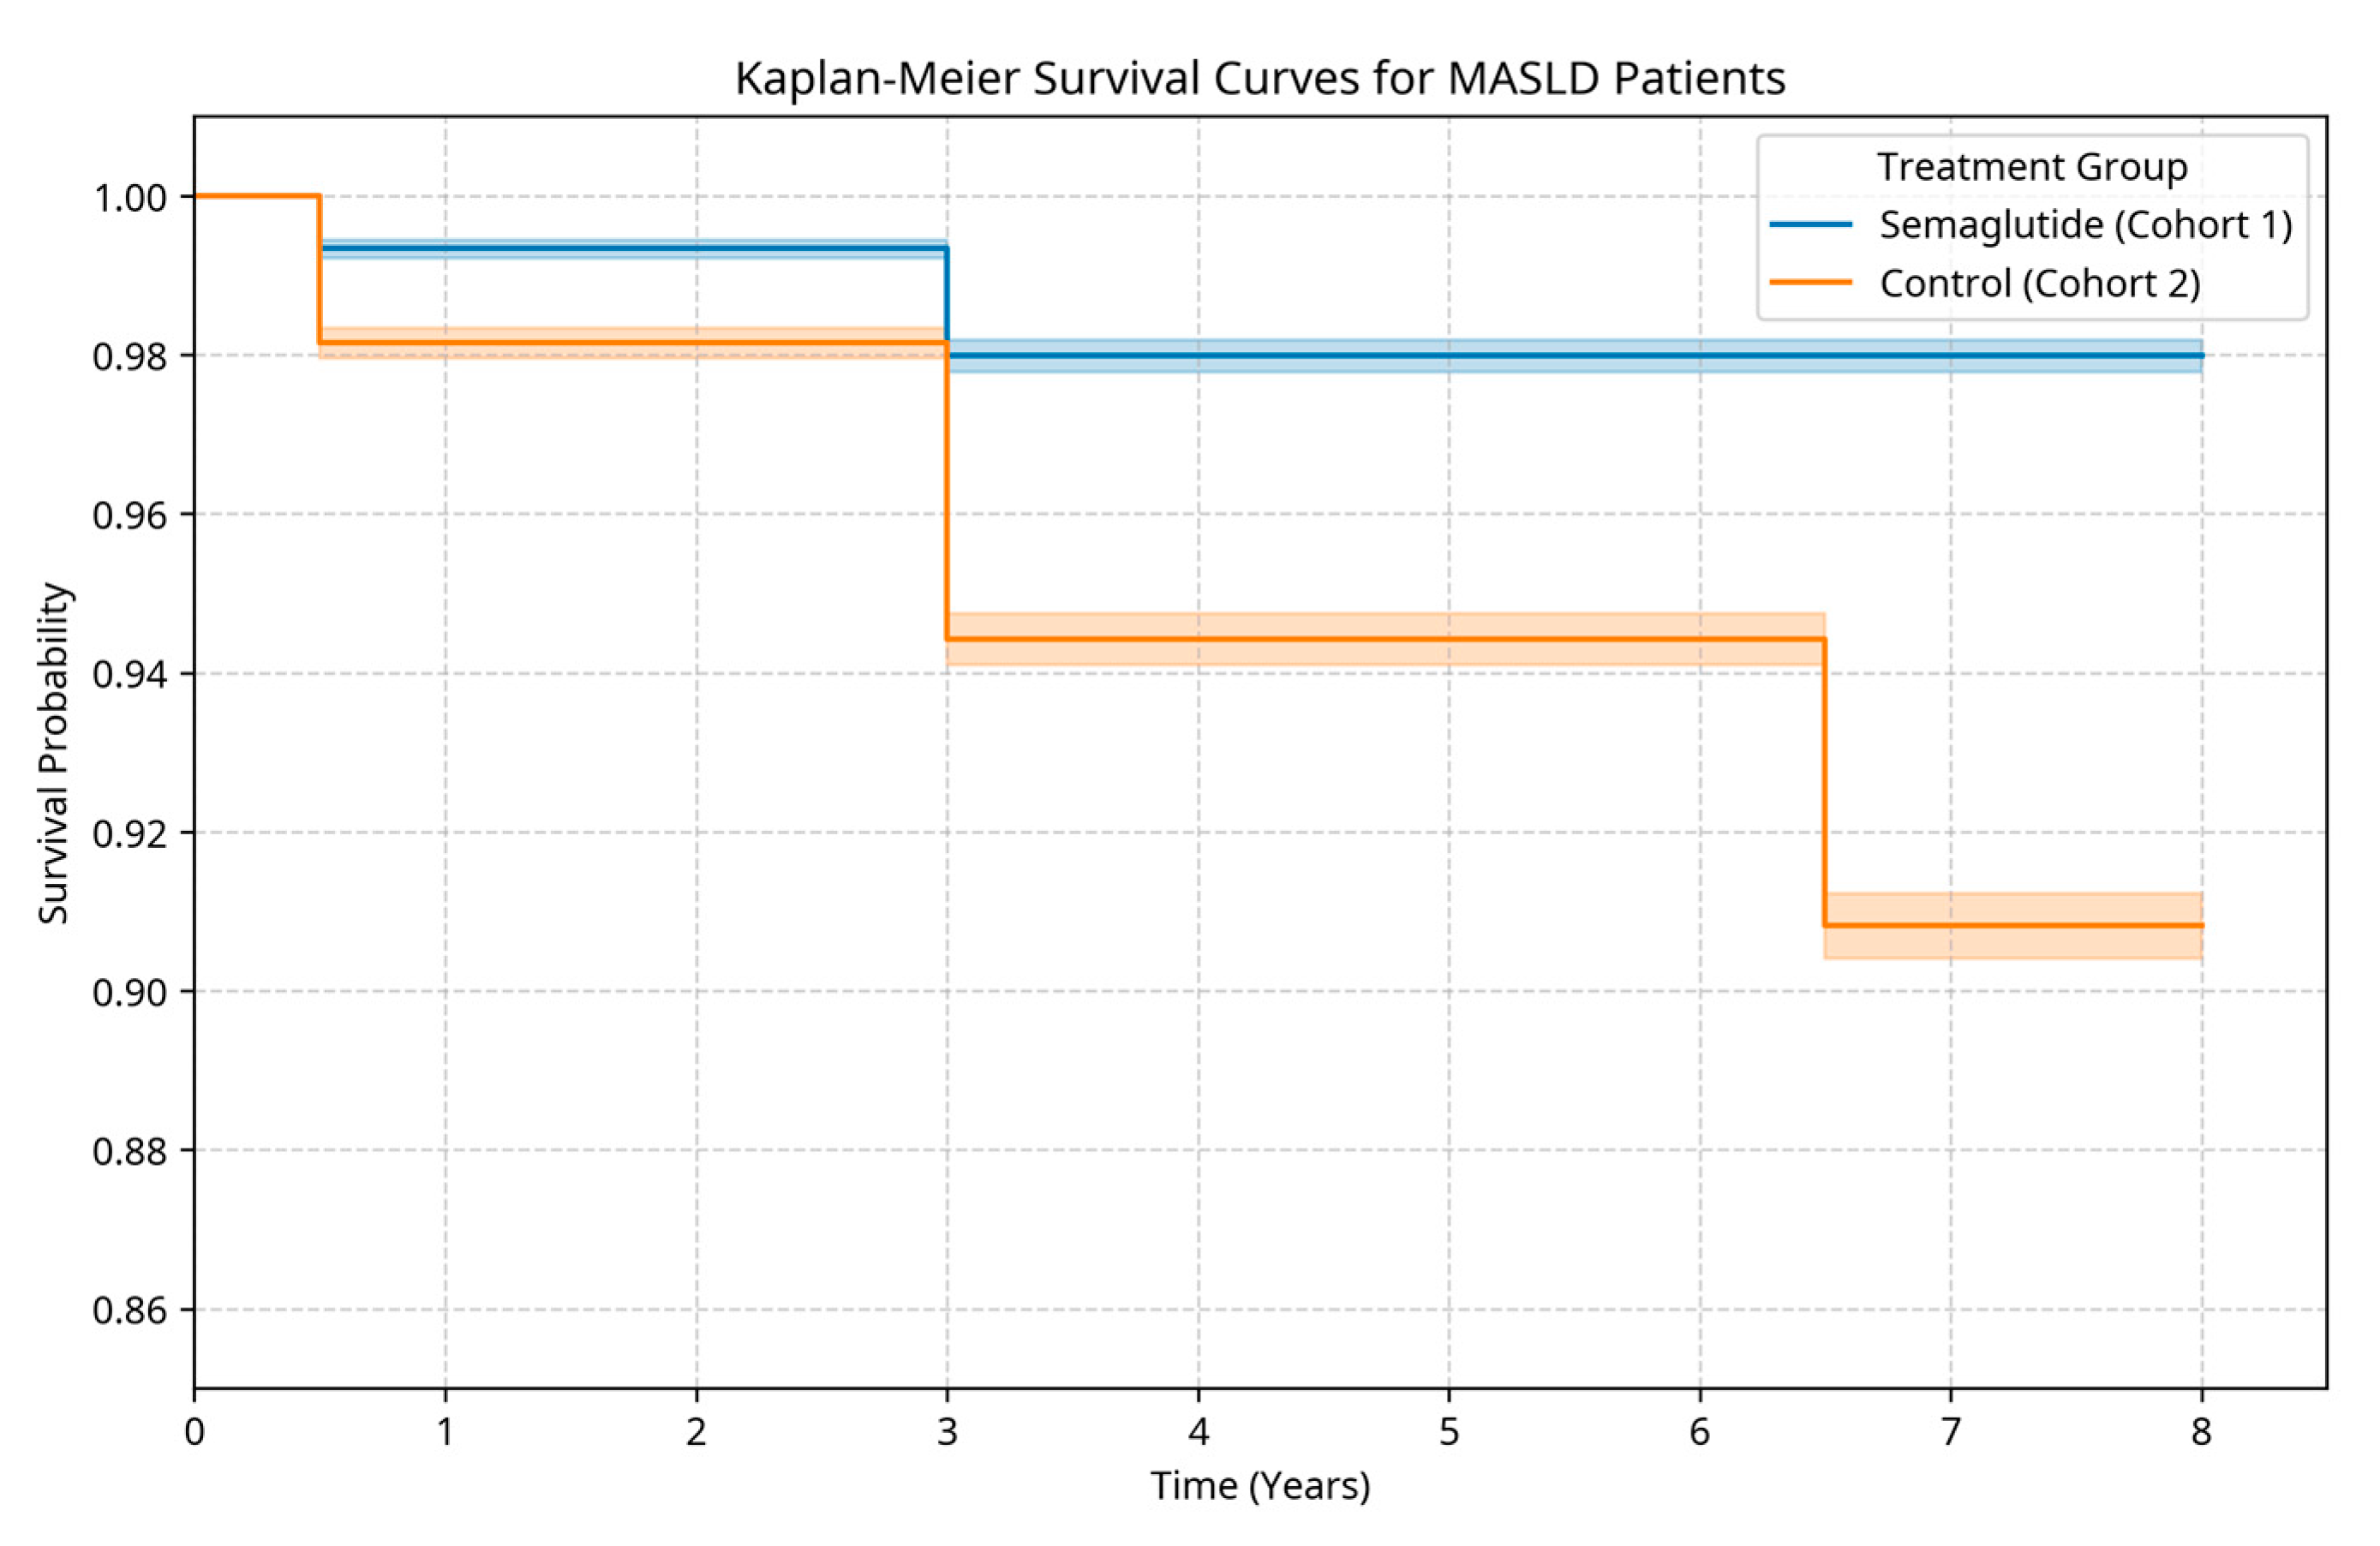
2.2.1. Mortality and Survival (Table 2a, Figure 1)
2.2.2. Metabolic Profile (Table 2a,b)
2.2.3. Cardiovascular Events (Table 2a)
2.2.4. Liver Function Parameters (Table 2b,c, Figure 3)

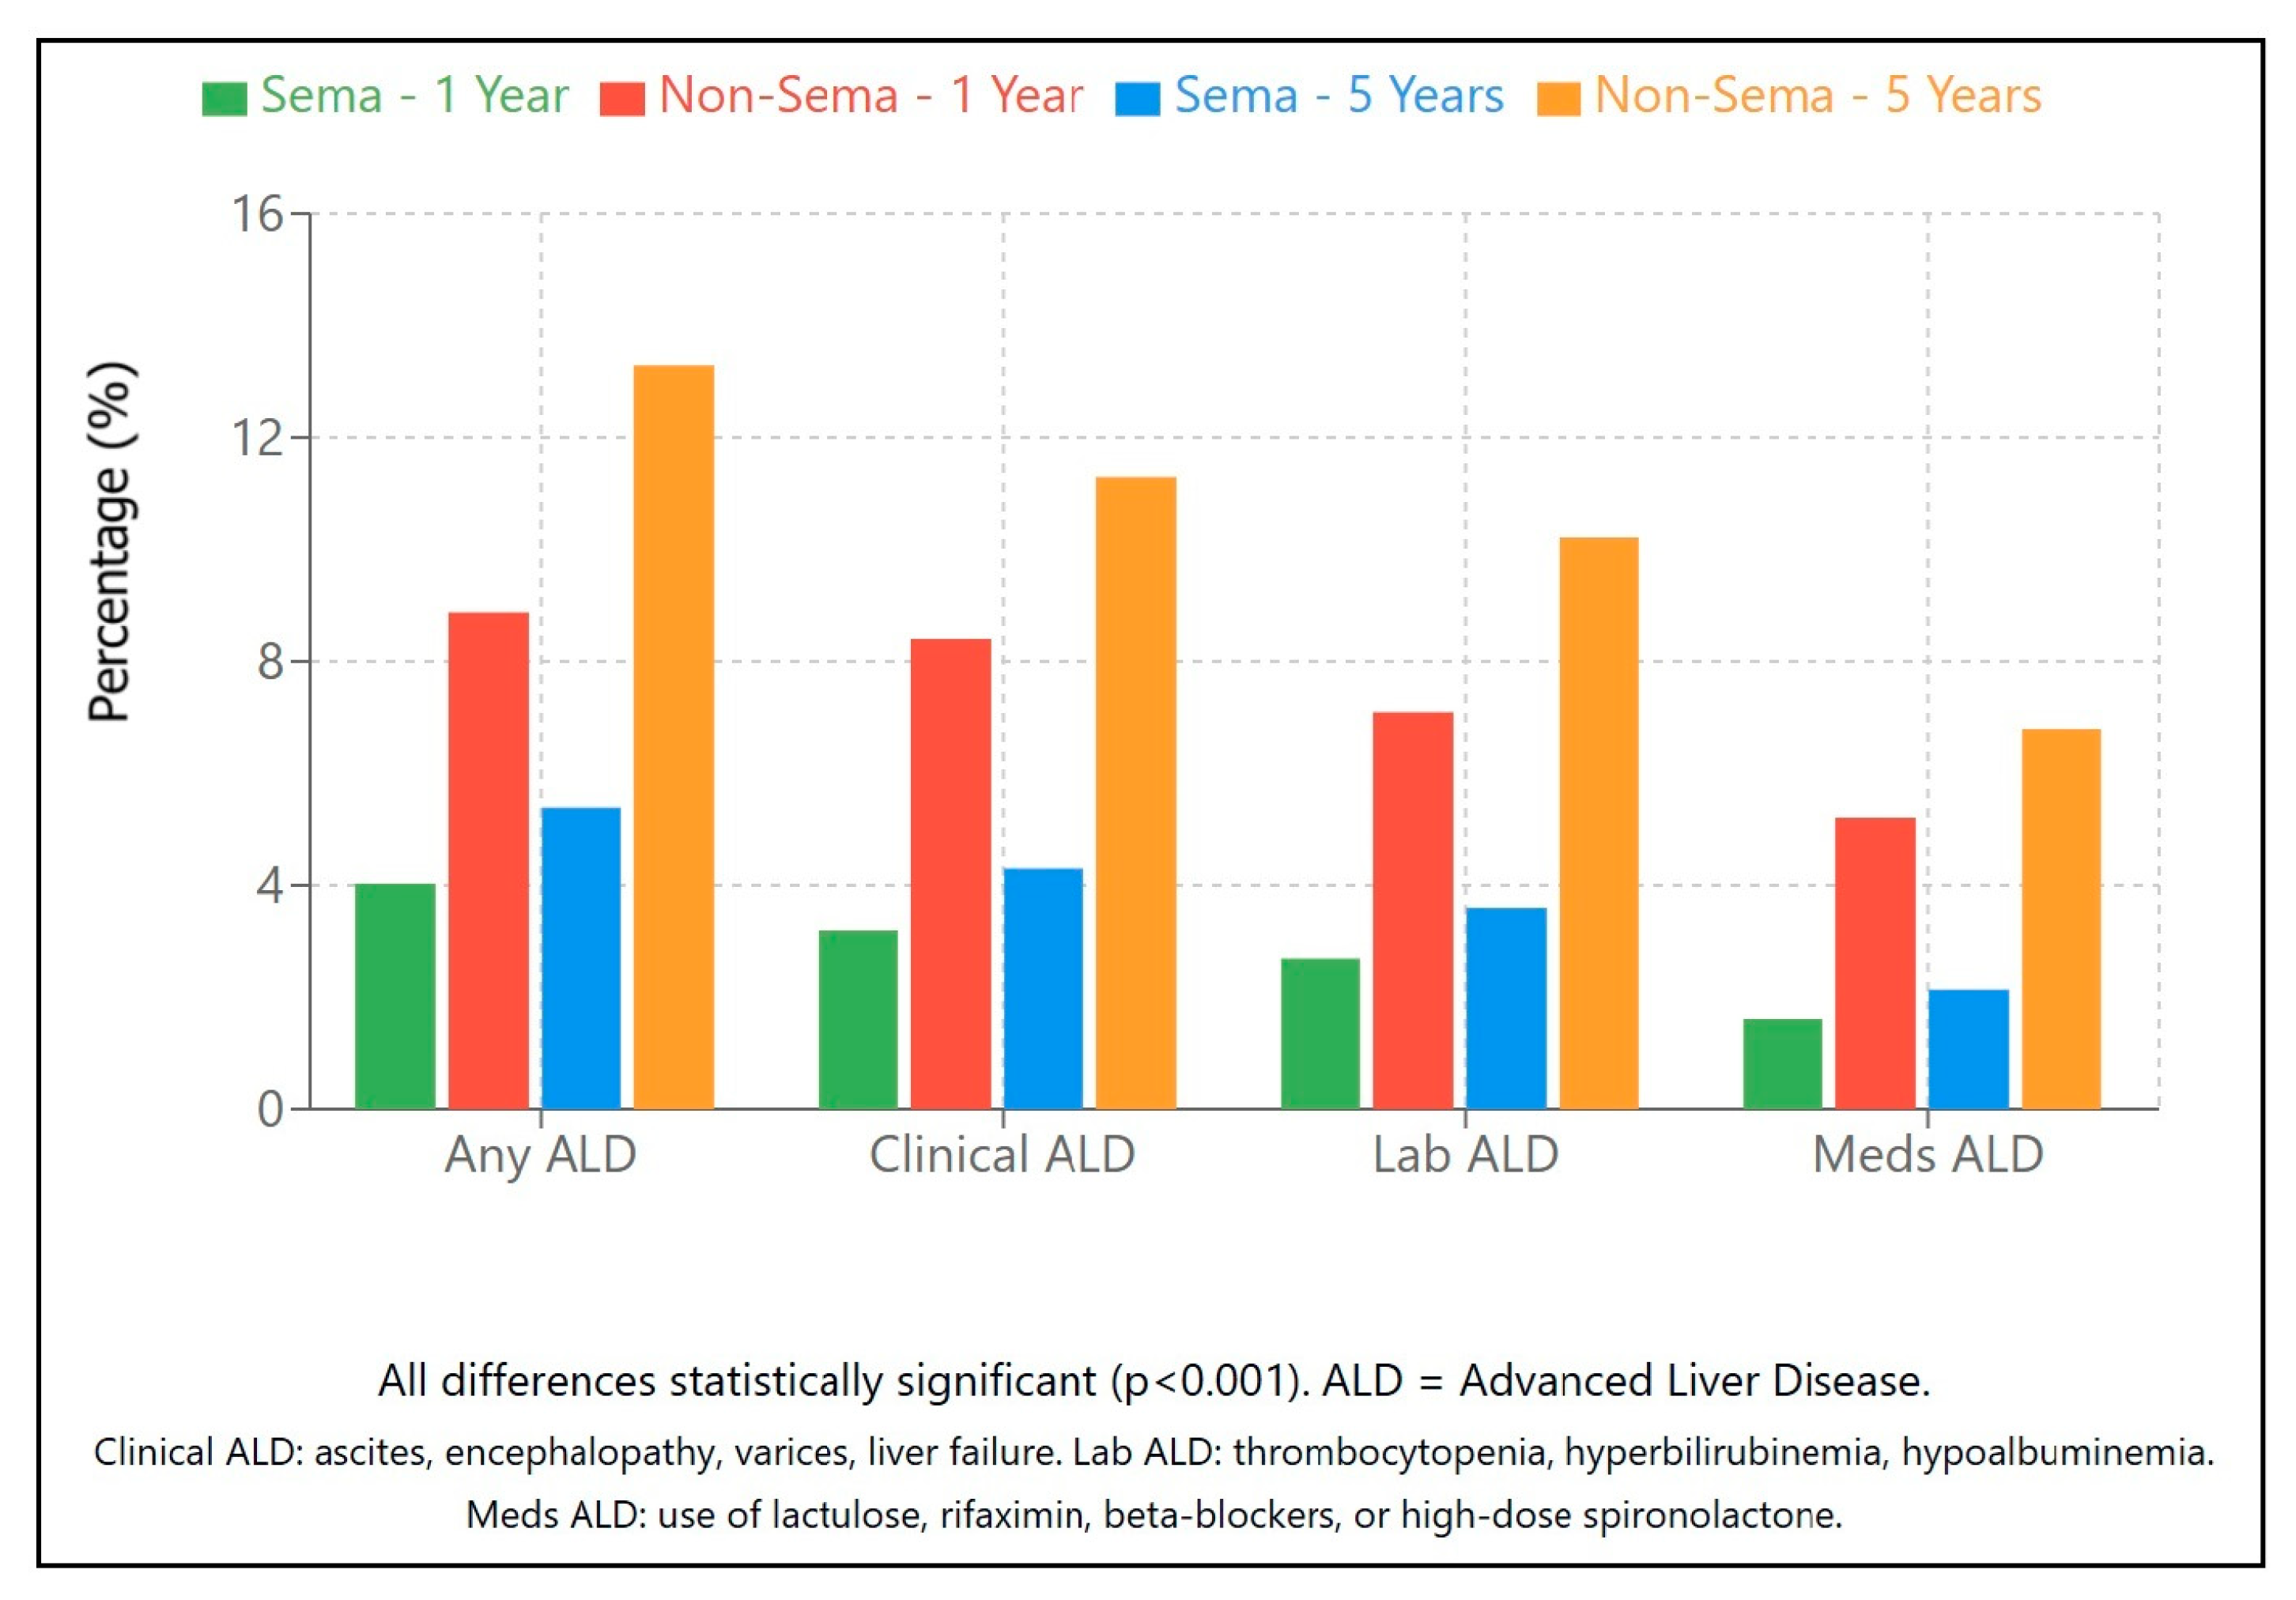
2.2.5. Advanced Liver Disease (Table 2a–c)
2.2.6. Other Outcomes and Subgroup Analyses (Table 2a)
3. Discussion
4. Materials and Methods
4.1. Data Source
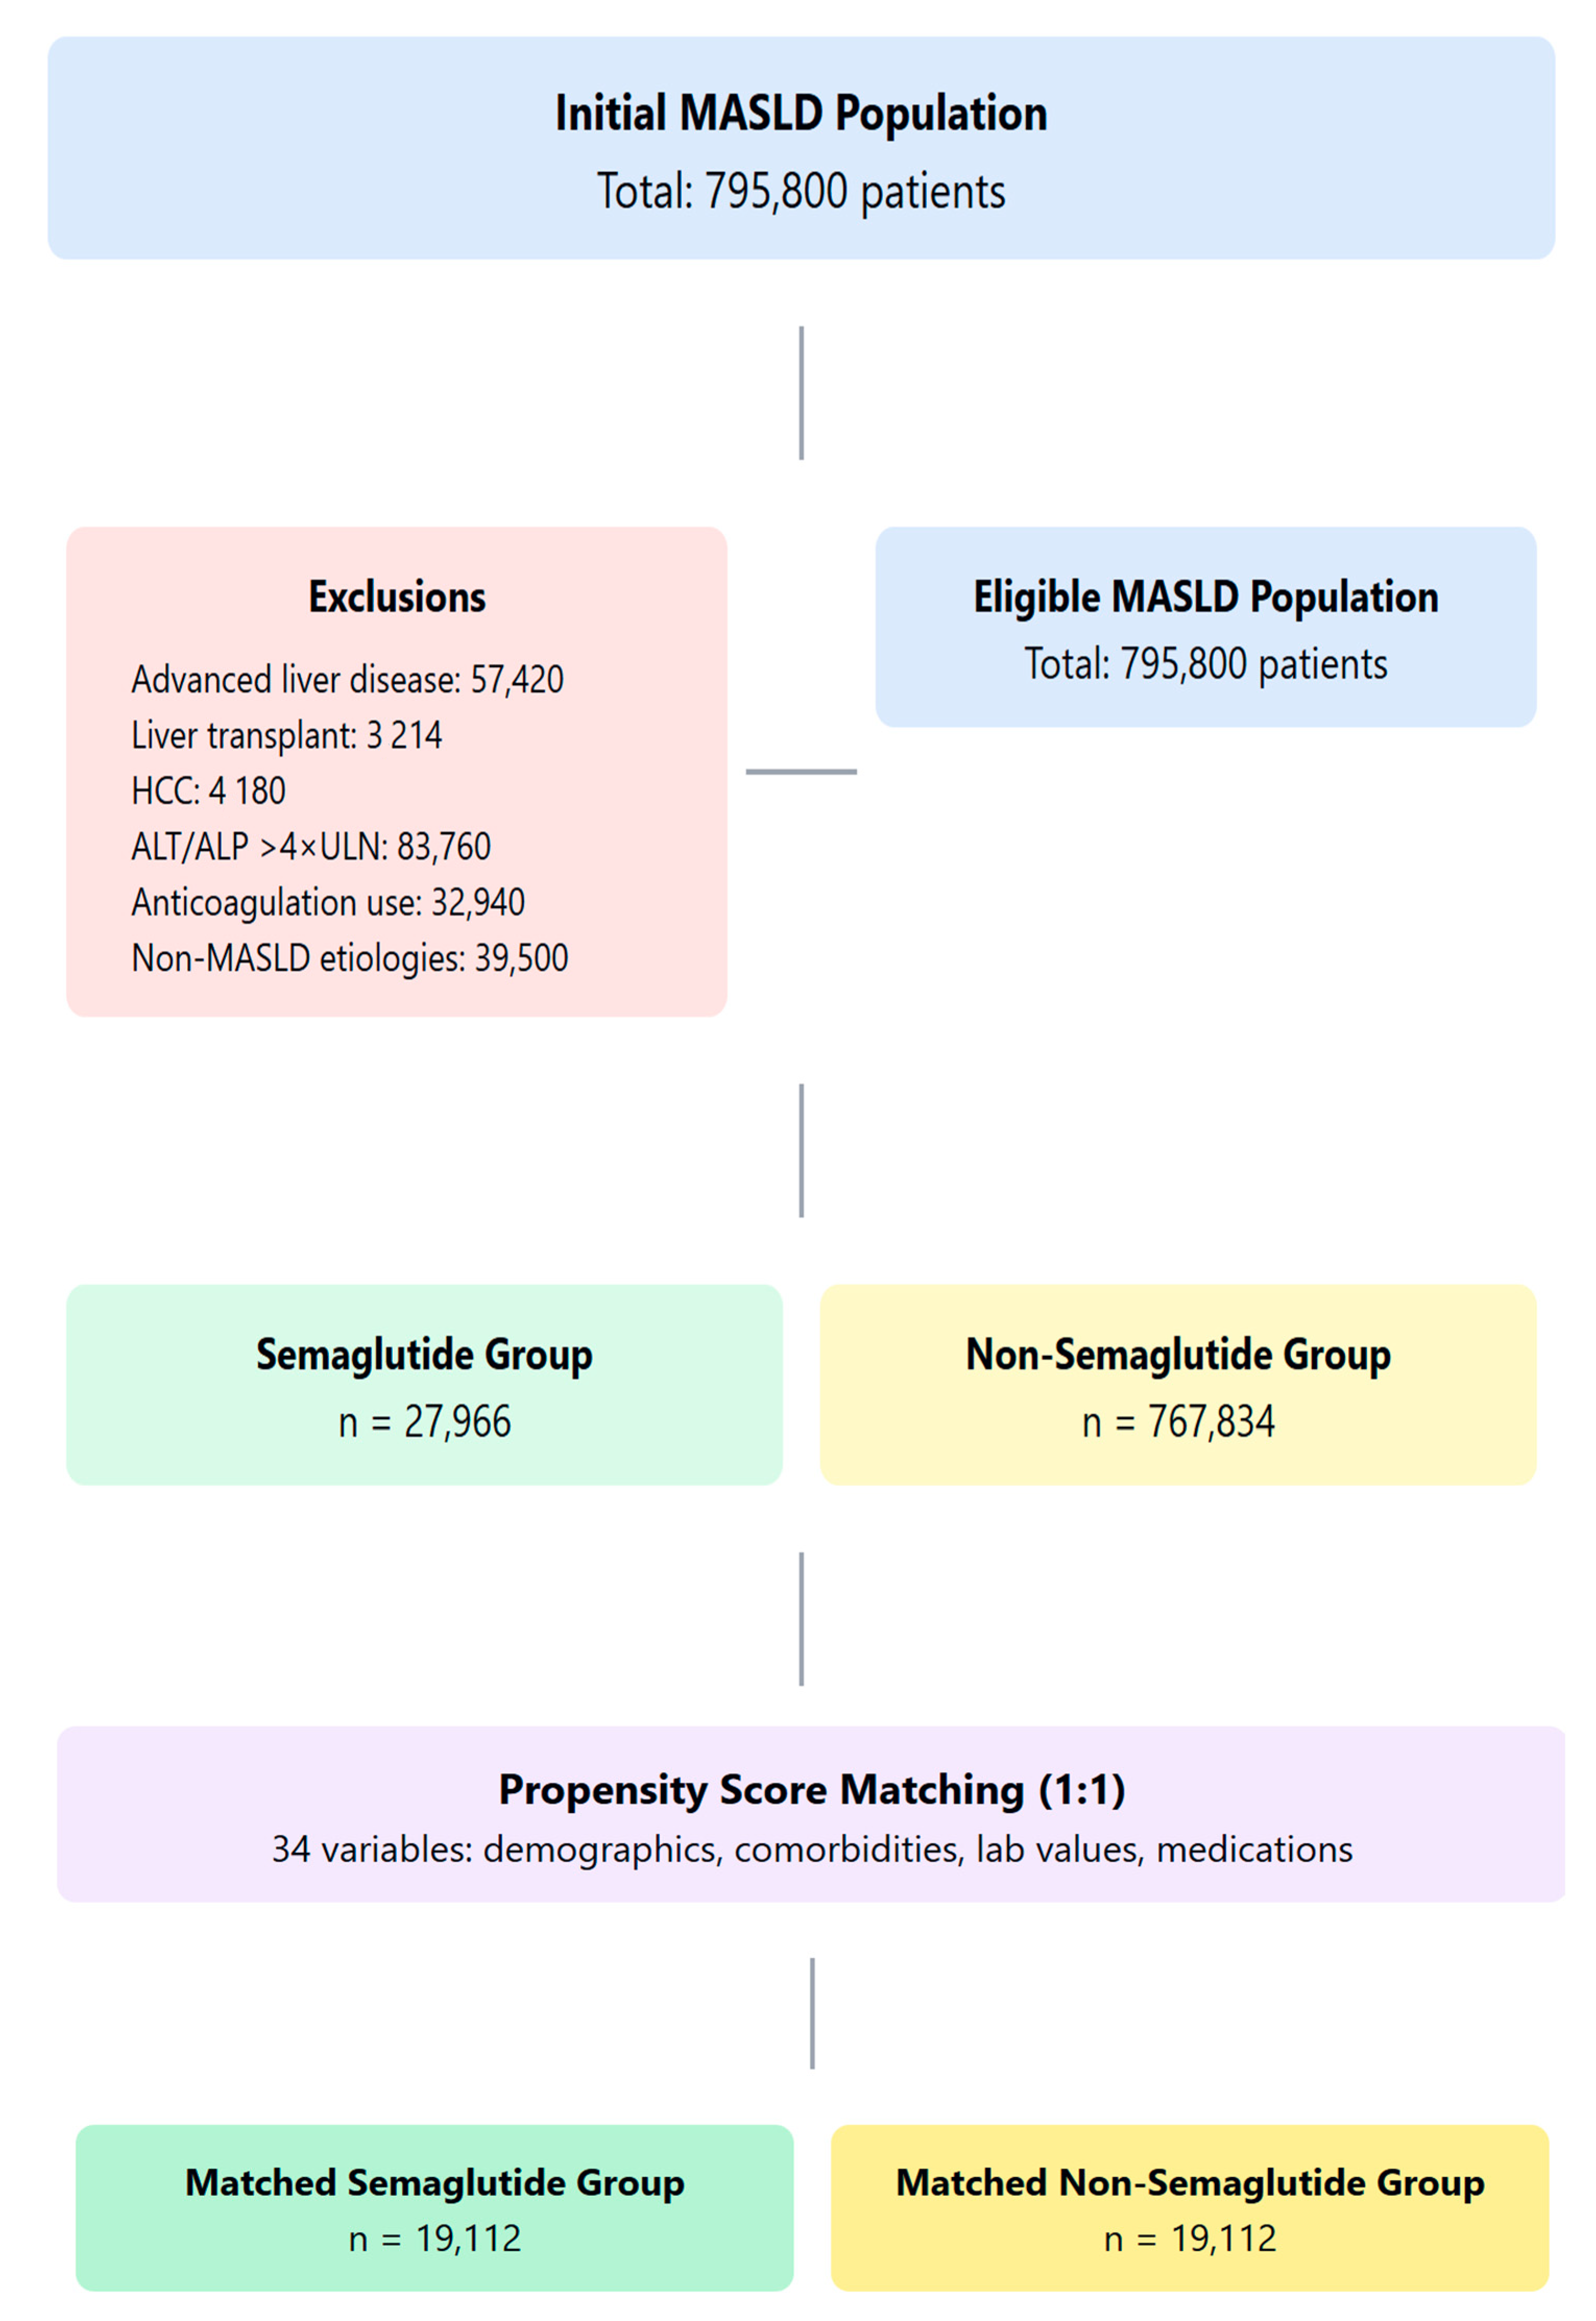
4.2. Study Population and Cohort Definitions
4.3. Exclusion Criteria
4.4. Propensity Score Matching
4.5. Outcomes
- Primary outcomes: all-cause mortality and overall survival
- Liver-related outcomes: advanced liver disease (ALD) was defined according to clinical diagnoses (e.g., portal hypertension, ascites, varices, hepatic encephalopathy), laboratory abnormalities (e.g., thrombocytopenia, hyperbilirubinemia, hypoalbuminemia, hyperammonemia), or dispensed medications used specifically for cirrhosis (e.g., propranolol, lactulose, rifaximin, spironolactone).
- Cardiovascular events: myocardial infarction, stroke, atrial fibrillation, and heart failure
- Metabolic parameters: LDL, HDL, triglycerides, HbA1c, BMI
- Disease progression: changes in liver enzymes, liver synthetic function, and the development of liver-related complications
4.6. Statistical Analysis
5. Conclusions
Author Contributions
Funding
Institutional Review Board Statement
Informed Consent Statement
Data Availability Statement
Conflicts of Interest
Appendix A

| Group | Cohorts | Criteria | Codes |
|---|---|---|---|
| Inclusion Criteria | |||
| Age | Both | Between 18 and 80 years | Age (TNX:9074) |
| MASLD diagnosis | Both | Non-alcoholic steatohepatitis or fatty liver | UMLS:ICD10CM:K75.81 (NASH), UMLS:ICD10CM:K76.0 (Fatty liver) |
| Exposure to Semaglutide | Semaglutide-exposed | Prescription for semaglutide | NLM:RXNORM:1991302 (semaglutide) |
| Semaglutide-unexposed | No prescription for semaglutide | ||
| Exclusion criteria | |||
| Advanced liver disease | Both | No anticoagulants, esophageal varices, ascites, encephalopathy, medications for liver complications, hepatomegaly, liver fibrosis/cirrhosis, or abnormal laboratory values prior to index date | ANTICOAGULANTS: NLM:VA:BL110, Esophageal varices: UMLS:ICD10CM:I85, Ascites: UMLS:ICD10CM:R18, Encephalopathy: UMLS:ICD10CM:G93.40, Medications: neomycin (NLM:RXNORM:7299), rifaximin (NLM:RXNORM:35619), propranolol (NLM:RXNORM:8787), spironolactone (NLM:RXNORM:9997), carvedilol (NLM:RXNORM:20352), Hepatomegaly: UMLS:ICD10CM:R16, Fibrosis/cirrhosis: UMLS:ICD10CM:K74, UMLS:ICD10CM:K74.60, Low platelets: TNX:9020 (≤100 × 103/uL), High bilirubin: TNX:9050 (≥2 mg/dL) |
| Liver cancer/transplantation | Both | No liver transplantation procedures, liver cell carcinoma, or liver transplant status | Liver Transplantation: UMLS:CPT:1007811, Liver cell carcinoma: UMLS:ICD10CM:C22.0, Transplant status: UMLS:ICD10CM:Z94.4 |
| Viral hepatitis | Both | No viral hepatitis | Hepatitis B: UMLS:ICD10CM:B19.1, UMLS:ICD10CM:B18.1, Hepatitis C: UMLS:ICD10CM:B19.2, UMLS:ICD10CM:B18.2 |
| Other liver etiologies | Both | No other causes of liver disease | Primary sclerosing cholangitis: UMLS:ICD10CM:K83.01, Primary biliary cirrhosis: UMLS:ICD10CM:K74.3, Hemochromatosis: UMLS:ICD10CM:E83.11, Portal vein thrombosis: UMLS:ICD10CM:I81, Wilson’s disease: UMLS:ICD10CM:E83.01, Budd-Chiari syndrome: UMLS:ICD10CM:I82.0, Autoimmune hepatitis: UMLS:ICD10CM:K75.4, Toxic liver disease: UMLS:ICD10CM:K71, Alcoholic liver disease: UMLS:ICD10CM:K70 |
| Abnormal labs/complications | Both | No elevated ammonia, abnormal liver function, or portal complications | Ammonia: TNX:LG4629-4 (≥50 umol/L), Liver conditions: UMLS:ICD10CM:K76.1, UMLS:ICD10CM:K76.5, UMLS:ICD10CM:K76.6, UMLS:ICD10CM:K76.7, UMLS:ICD10CM:K76.81, UMLS:ICD10CM:K76.82, Gastric varices: UMLS:ICD10CM:I86.4, Gilbert syndrome: UMLS:ICD10CM:E80.4, Biliary tract diseases: UMLS:ICD10CM:K83, INR: TNX:9032 (≥1.70) |
Appendix B
| Outcome | Definition | Code(s) |
|---|---|---|
| Mortality | Deceased status | Deceased |
| CV events | Cerebrovascular disease, myocardial infarction, heart failure, or atrial fibrillation/flutter | Cerebrovascular: ICD10:I60-I69, Myocardial infarction: ICD10:I21-I24, Heart failure: ICD10:I50, Atrial fibrillation/flutter: ICD10:I48 |
| Liver transplantation | Liver transplant status or procedure | Status: ICD10:Z94.4, Procedure: CPT:1007811, Procedure: ICD10PCS:0FY0 |
| HCC | Hepatocellular carcinoma diagnosis | ICD10:C22.0 |
| Ascites | Ascites diagnosis | ICD10:R18 |
| Encephalopathy | Hepatic encephalopathy diagnosis | ICD10:G93.40, ICD10:K76.82 |
| Varices | Esophageal or gastric varices diagnosis | Esophageal: ICD10:I85, Gastric: ICD10:I86.4 |
| Ammonia-lowering agents | Rifaximin, lactulose, or neomycin prescription | Rifaximin: RXNORM:35619, Lactulose: RXNORM:6218, Neomycin: RXNORM:7299 |
| Diuretics | Furosemide or spironolactone prescription | Furosemide: RXNORM:4603, Spironolactone: RXNORM:9997 |
| NSBB | Carvedilol or propranolol prescription | Carvedilol: RXNORM:20352, Propranolol: RXNORM:8787 |
| Liver inflammatory markers | Elevated ALT, AST, ALP, or GGT | ALT ≥ 50 U/L: TNX:9044, AST ≥ 50 U/L: TNX:9047, ALP ≥ 80 U/L: TNX:9046, GGT ≥ 80 U/L: TNX:9051 |
| Synthetic impairment | Hyperbilirubinemia, hypoalbuminemia or prolonged INR | Bilirubin ≥ 2 mg/dL: TNX:9050, Albumin ≤ 2.8 g/dL: TNX:9045, INR ≥ 1.7: TNX:9032 |
| Cirrhosis (decompensated) | Ascites, hepatic encephalopathy, hepatorenal syndrome, spontaneous bacterial peritonitis, thrombocytopenia, hyperbilirubinemia, hypoalbuminemia | Ascites: ICD10:R18, Encephalopathy: ICD10:G93.40, Hepatorenal Syndrome: ICD10:K76.7, SBP: ICD10:K65.2, Platelets ≤ 100 × 103/uL: TNX:9020, Bilirubin ≥ 2 mg/dL: TNX:9050, Albumin ≤ 2.8 g/dL: TNX:9045 |
| Cirrhosis (compensated) | Portal hypertension, varices without decompensation | Portal Hypertension: ICD10:K76.6, Esophageal Varices: ICD10:I85, Gastric Varices: ICD10:I86.4, Carvedilol: RXNORM:20352, Propranolol: RXNORM:8787, Cirrhosis: ICD10:K74.6 |
| ALD (clinical) | Portal hypertension, ascites, encephalopathy, hepatorenal syndrome, hepatopulmonary syndrome, SBP, varices, liver failure, or cirrhosis | Portal hypertension: ICD10:K76.6, Ascites: ICD10:R18, Encephalopathy: ICD10:G93.40, Hepatorenal syndrome: ICD10:K76.7, Hepatopulmonary syndrome: ICD10:K76.81, SBP: ICD10:K65.2, Varices: ICD10:I85, I86.4, Liver failure: ICD10:K72.9, Cirrhosis: ICD10:K74.6 |
| ALD (lab) | Thrombocytopenia, hyperbilirubinemia, hypoalbuminemia, or hyperammonemia | Platelets: TNX:9020 ≤ 100 × 103/uL, Bilirubin: TNX:9050 ≥ 2 mg/dL, Albumin: TNX:9045 ≤ 2.8 g/dL, Ammonia: TNX:LG4629-4 ≥ 50 umol/L |
| ALD (medications) | Neomycin, rifaximin, propranolol, carvedilol, or high-dose spironolactone prescription | Neomycin: RXNORM:7299, Rifaximin: RXNORM:35619, Propranolol: RXNORM:8787, Carvedilol: RXNORM:20352, Spironolactone 100mg: RXNORM:9997 |
Appendix C
| Outcome | Definition | Code(s) |
|---|---|---|
| ALT | Alanine aminotransferase | TNX:9044 [U/L] |
| ALT > 50 | Alanine aminotransferase ≥ 50 | TNX:9044 ≥ 50 U/L |
| AST | Aspartate aminotransferase | TNX:9047 [U/L] |
| ALP | Alkaline phosphatase | TNX:9046 [U/L] |
| GGT | Gamma-glutamyl transferase | TNX:9051 [U/L] |
| Bilirubin | Total bilirubin [mg/dL] | TNX:9050 [mg/dL] |
| Bilirubin > 2 | Total bilirubin ≥ 2 mg/dL | TNX:9050 ≥ 2 mg/dL |
| Albumin | Albumin | TNX:9045 [g/dL] |
| Albumin < 2.8 | Albumin ≤ 2.8 g/dL | TNX:9045 ≤ 2.8 g/dL |
| INR | INR | TNX:9032 |
| INR > 1.7 | INR ≥ 1.7 | TNX:9032 ≥ 1.7 |
| Platelets | Platelets | TNX:9020 [103/uL] |
| Platelets < 150 | Platelets ≤ 150 ×103/uL | TNX:9020 ≤ 150 × 103/uL |
| Platelets < 100 | Platelets ≤ 100 ×103/uL | TNX:9020 ≤ 100 × 103/uL |
| Ammonia | Blood ammonia | TNX:LG4629-4 [umol/L] |
| Ammonia > 50 | Blood ammonia ≥ 50 umol/L | TNX:LG4629-4 ≥ 50 umol/L |
| Creatinine | Serum creatinine | TNX:9024 [mg/dL] |
| BMI | BMI | TNX:9083 |
| Total cholesterol | Total cholesterol | TNX:9000 [mg/dL] |
| LDL | LDL cholesterol | TNX:9002 [mg/dL] |
| HDL | HDL cholesterol | TNX:9001 [mg/dL] |
| Triglycerides | Triglycerides | TNX:9004 [mg/dL] |
| Hemoglobin A1c | Hemoglobin A1c | TNX:9037 [%] |
| Hemoglobin A1c > 8.5 | Hemoglobin A1c ≥ 8.5% | TNX:9037 ≥ 8.5% |
| AFP | Alpha fetoprotein | TNX:LG5597-2 [IU/mL] |
| Poor metabolic markers | Elevated LDL, low HDL, elevated triglycerides, or elevated hemoglobin A1c | LDL ≥ 130 mg/dL: TNX:9002, HDL ≤ 40 mg/dL: TNX:9001, Triglycerides ≥ 200 mg/dL: TNX:9004, Hemoglobin A1c ≥ 8%: TNX:9037 |
References
- Younossi, Z.M.; Koenig, A.B.; Abdelatif, D.; Fazel, Y.; Henry, L.; Wymer, M. Global epidemiology of nonalcoholic fatty liver disease-Meta-analytic assessment of prevalence, incidence, and outcomes. Hepatology 2016, 64, 73–84. [Google Scholar] [CrossRef] [PubMed]
- Paik, J.M.; Golabi, P.; Younossi, Y.; Mishra, A.; Younossi, Z.M. Changes in the global burden of chronic liver diseases from 2012 to 2017: The growing impact of NAFLD. Hepatology 2020, 72, 1605–1616. [Google Scholar] [CrossRef] [PubMed]
- Eslam, M.; Newsome, P.N.; Sarin, S.K.; Anstee, Q.M.; Targher, G.; Romero-Gomez, M.; Zelber-Sagi, S.; Wai-Sun Wong, V.; Dufour, J.F.; Schattenberg, J.M.; et al. A new definition for metabolic dysfunction-associated fatty liver disease: An international expert consensus statement. J. Hepatol. 2020, 73, 202–209. [Google Scholar] [CrossRef] [PubMed]
- Stefan, N.; Häring, H.U.; Cusi, K. Non-alcoholic fatty liver disease: Causes, diagnosis, cardiometabolic consequences, and treatment strategies. Lancet Diabetes Endocrinol. 2019, 7, 313–324. [Google Scholar] [CrossRef] [PubMed]
- Marchesini, G.; Brizi, M.; Forlani, G.; Melchionda, N.; Marchesini Reggiani, G.; Bugianesi, E.; McCullough, A.J.; Valgimigli, M. Nonalcoholic fatty liver, steatohepatitis, and the metabolic syndrome. Hepatology 2003, 37, 917–923. [Google Scholar] [CrossRef] [PubMed]
- Vilar-Gomez, E.; Martinez-Perez, Y.; Calzadilla-Bertot, L.; Torres-Gonzalez, A.; Gra-Oramas, B.; Gonzalez-Fabian, L.; Friedman, S.L.; Diago, M.; Romero-Gomez, M. Weight loss through lifestyle modification significantly reduces features of nonalcoholic steatohepatitis. Gastroenterology 2015, 149, 367–378.e5. [Google Scholar] [CrossRef] [PubMed]
- Sanyal, A.J.; Chalasani, N.; Kowdley, K.V.; McCullough, A.; Diehl, A.M.; Bass, N.M.; Neuschwander-Tetri, B.A.; Lavine, J.E.; Tonascia, J.; Unalp, A.; et al. Pioglitazone, vitamin E, or placebo for nonalcoholic steatohepatitis. N. Engl. J. Med. 2010, 362, 1675–1685. [Google Scholar] [CrossRef] [PubMed]
- Neuschwander-Tetri, B.A.; Loomba, R.; Sanyal, A.J.; Lavine, J.E.; Van Natta, M.L.; Abdelmalek, M.F.; Chalasani, N.; Dasarathy, S.; Diehl, A.M.; Hameed, B.; et al. Farnesoid X nuclear receptor ligand obeticholic acid for non-cirrhotic, non-alcoholic steatohepatitis (FLINT): A multicentre, randomised, placebo-controlled trial. Lancet 2015, 385, 956–965. [Google Scholar] [CrossRef] [PubMed]
- Armstrong, M.J.; Gaunt, P.; Aithal, G.P.; Barton, D.; Hull, D.; Parker, R.; Hazlehurst, J.M.; Guo, K.; Abouda, G.; Aldersley, M.A.; et al. Liraglutide safety and efficacy in patients with non-alcoholic steatohepatitis (LEAN): A multicentre, double-blind, randomised, placebo-controlled phase 2 study. Lancet 2016, 387, 679–690. [Google Scholar] [CrossRef] [PubMed]
- Wilding, J.P.H.; Batterham, R.L.; Calanna, S.; Davies, M.; Van Gaal, L.F.; Lingvay, I.; McGowan, B.M.; Rosenstock, J.; Tran, M.T.D.; Wadden, T.A.; et al. Once-weekly semaglutide in adults with overweight or obesity. N. Engl. J. Med. 2021, 384, 989–1002. [Google Scholar] [CrossRef] [PubMed]
- Mantovani, A.; Petracca, G.; Beatrice, G.; Csermely, A.; Lonardo, A.; Targher, G. Glucagon-Like Peptide-1 Receptor Agonists for Treatment of Nonalcoholic Fatty Liver Disease and Nonalcoholic Steatohepatitis: An Updated Meta-Analysis of Randomized Controlled Trials. Metabolites 2021, 11, 73. [Google Scholar] [CrossRef] [PubMed]
- Newsome, P.N.; Buchholtz, K.; Cusi, K.; Linder, M.; Okanoue, T.; Ratziu, V.; Sanyal, A.J.; Sejling, A.S.; Harrison, S.A.; NN9931-4296 Investigators. A placebo-controlled trial of subcutaneous semaglutide in nonalcoholic steatohepatitis. N. Engl. J. Med. 2021, 384, 1113–1124. [Google Scholar] [CrossRef] [PubMed]
- Davies, M.; Færch, L.; Jeppesen, O.K.; Pakseresht, A.; Pedersen, S.D.; Perreault, L.; Rosenstock, J.; Shimomura, I.; Viljoen, A.; Wadden, T.A.; et al. Semaglutide 2·4 mg once a week in adults with overweight or obesity, and type 2 diabetes (STEP 2): A randomised, double-blind, double-dummy, placebo-controlled, phase 3 trial. Lancet 2021, 397, 971–984. [Google Scholar] [CrossRef] [PubMed]
- Sherman, R.E.; Anderson, S.A.; Dal Pan, G.J.; Gray, G.W.; Gross, T.; Hunter, N.L.; LaVange, L.; Marinac-Dabic, D.; Marks, P.W.; Robb, M.A.; et al. Real-world evidence—What is it and what can it tell us? N. Engl. J. Med. 2016, 375, 2293–2297. [Google Scholar] [CrossRef] [PubMed]
- Marso, S.P.; Daniels, G.H.; Brown-Frandsen, K.; Kristensen, P.; Mann, J.F.; Nauck, M.A.; Nissen, S.E.; Pocock, S.; Poulter, N.R.; Ravn, L.S.; et al. Liraglutide and cardiovascular outcomes in type 2 diabetes. N. Engl. J. Med. 2016, 375, 311–322. [Google Scholar] [CrossRef] [PubMed]
- Zinman, B.; Wanner, C.; Lachin, J.M.; Fitchett, D.; Bluhmki, E.; Hantel, S.; Mattheus, M.; Devins, T.; Johansen, O.E.; Woerle, H.J.; et al. Empagliflozin, cardiovascular outcomes, and mortality in type 2 diabetes. N. Engl. J. Med. 2015, 373, 2117–2128. [Google Scholar] [CrossRef] [PubMed]
- Garvey, W.T.; Frias, J.P.; Jastreboff, A.M.; le Roux, C.W.; Sattar, N.; Aizenberg, D.; Mao, H.; Zhang, S.; Ahmad, N.N.; Bunck, M.C.; et al. Tirzepatide once weekly for the treatment of obesity in people with type 2 diabetes (SURMOUNT-2): A double-blind, randomised, multicentre, placebo-controlled, phase 3 trial. Lancet 2023, 402, 613–626. [Google Scholar] [CrossRef] [PubMed]
- Marso, S.P.; Bain, S.C.; Consoli, A.; Eliaschewitz, F.G.; Jódar, E.; Leiter, L.A.; Lingvay, I.; Rosenstock, J.; Seufert, J.; Warren, M.L.; et al. Semaglutide and cardiovascular outcomes in patients with type 2 diabetes. N. Engl. J. Med. 2016, 375, 1834–1844. [Google Scholar] [CrossRef] [PubMed]
- Husain, M.; Birkenfeld, A.L.; Donsmark, M.; Dungan, K.; Eliaschewitz, F.G.; Franco, D.R.; Jeppesen, O.K.; Lingvay, I.; Mosenzon, O.; Pedersen, S.D.; et al. Oral semaglutide and cardiovascular outcomes in patients with type 2 diabetes. N. Engl. J. Med. 2019, 381, 841–851. [Google Scholar] [CrossRef] [PubMed]
- Lee, Y.S.; Jun, H.S. Anti-inflammatory effects of GLP-1-based therapies beyond glucose control. Mediat. Inflamm. 2016, 2016, 3094642. [Google Scholar] [CrossRef] [PubMed]
- Trevaskis, J.L.; Griffin, P.S.; Wittmer, C.; Neuschwander-Tetri, B.A.; Brunt, E.M.; Dolman, C.S.; Erickson, M.R.; Napora, J.; Parkes, D.G.; Roth, J.D. Glucagon-like peptide-1 receptor agonism improves metabolic, biochemical, and histopathological indices of nonalcoholic steatohepatitis in mice. Am. J. Physiol.-Gastrointest. Liver Physiol. 2012, 302, G762–G772. [Google Scholar] [CrossRef] [PubMed]
- Harrison, S.A.; Bashir, M.R.; Guy, C.D.; Zhou, R.; Moylan, C.A.; Frias, J.P.; Alkhouri, N.; Bansal, M.B.; Baum, S.; Neuschwander-Tetri, B.A.; et al. Resmetirom (MGL-3196) for the treatment of non-alcoholic steatohepatitis: A multicentre, randomised, double-blind, placebo-controlled, phase 2 trial. Lancet 2019, 394, 2012–2024. [Google Scholar] [CrossRef] [PubMed]
- Turkistani, Y. Glucagon-like peptide-1 receptor agonists: A review from a cardiovascular perspective. Front. Cardiovasc. Med. 2025, 12, 1535134. [Google Scholar] [CrossRef] [PubMed]
- Drucker, D.J. The GLP-1 journey: From discovery science to therapeutic impact. J. Clin. Investig. 2024, 134, e175634. [Google Scholar] [CrossRef] [PubMed]
- Ratziu, V.; Sanyal, A.; Harrison, S.A.; Wong, V.W.; Francque, S.; Goodman, Z.; Aithal, G.P.; Kowdley, K.V.; Seyedkazemi, S.; Fischer, L.; et al. Cenicriviroc Treatment for Adults With Nonalcoholic Steatohepatitis and Fibrosis: Final Analysis of the Phase 2b CENTAUR Study. Hepatology 2020, 72, 892–905. [Google Scholar] [CrossRef] [PubMed]
- Lassailly, G.; Caiazzo, R.; Ntandja-Wandji, L.C.; Gnemmi, V.; Baud, G.; Verkindt, H.; Ningarhari, M.; Louvet, A.; Emmanuelle Leteurtre, E.; Raverdy, V.; et al. Bariatric surgery provides long-term resolution of nonalcoholic steatohepatitis and regression of fibrosis. Gastroenterology 2020, 159, 1290–1301.e5. [Google Scholar] [CrossRef] [PubMed]
- Jiang, Y.; Liu, J.; Chen, D.; Yan, L.; Zheng, Y.; Wang, Q. GLP-1 improves adipocyte insulin sensitivity following induction of endoplasmic reticulum stress. Front. Pharmacol. 2018, 9, 1168. [Google Scholar] [CrossRef] [PubMed]
- Katsuyama, H.; Hakoshima, M.; Kaji, E.; Mino, M.; Kakazu, E.; Iida, S.; Adachi, H.; Kanto, T.; Yanai, H. Effects of Once-Weekly Semaglutide on Cardiovascular Risk Factors and Metabolic Dysfunction-Associated Steatotic Liver Disease in Japanese Patients with Type 2 Diabetes: A Retrospective Longitudinal Study Based on Real-World Data. Biomedicines 2024, 12, 1001. [Google Scholar] [CrossRef] [PubMed]
- Chalasani, N.; Younossi, Z.; Lavine, J.E.; Charlton, M.; Cusi, K.; Rinella, M.; Harrison, S.A.; Brunt, E.M.; Sanyal, A.J. The diagnosis and management of nonalcoholic fatty liver disease: Practice guidance from the American Association for the Study of Liver Diseases. Hepatology 2018, 67, 328–357. [Google Scholar] [CrossRef] [PubMed]
- European Association for the Study of the Liver (EASL); European Association for the Study of Diabetes (EASD); European Association for the Study of Obesity (EASO). EASL-EASD-EASO Clinical Practice Guidelines on the management of metabolic dysfunction-associated steatotic liver disease (MASLD). J. Hepatol. 2024, 81, 492–542. [Google Scholar] [CrossRef] [PubMed]
- Austin, P.C. An Introduction to Propensity Score Methods for Reducing the Effects of Confounding in Observational Studies. Multivar. Behav. Res. 2011, 46, 399–424. [Google Scholar] [CrossRef] [PubMed] [PubMed Central]
- Stuart, E.A. Matching methods for causal inference: A review and a look forward. Stat Sci. 2010, 25, 1–21. [Google Scholar] [CrossRef] [PubMed] [PubMed Central]
- Sanyal, A.J.; Newsome, P.N.; Kliers, I.; Østergaard, L.H.; Long, M.T.; Kjær, M.S.; Cali, A.M.G.; Bugianesi, E.; Rinella, M.E.; Roden, M.; et al. Phase 3 Trial of Semaglutide in Metabolic Dysfunction-Associated Steatohepatitis. N. Engl. J. Med. 2025, 392, 2089–2099. [Google Scholar] [CrossRef] [PubMed]
| (a) | ||||
|---|---|---|---|---|
| Characteristic | Semaglutide Group (n = 19,112) | Non-Semaglutide Group (n = 19,112) | p-Value | St. Diff. |
| Demographics | ||||
| Age (years), mean ± SD | 51.06 ± 12.79 | 51.26 ± 13.60 | 0.13 | 0.0154 |
| Female, n (%) | 11,506 (60.2%) | 11,500 (60.2%) | 0.95 | 0.0006 |
| Race (%) | ||||
| - White | 13,167 (68.9%) | 13,118 (68.6%) | 0.59 | 0.0055 |
| - Black | 1718 (8.99%) | 1696 (8.87%) | 0.69 | 0.0040 |
| - Asian | 842 (4.4%) | 824 (4.3%) | 0.65 | 0.0046 |
| BMI (kg/m2), mean ± SD | 36.60 ± 6.25 | 34.89 ± 6.84 | <0.001 | 0.2607 |
| Comorbidities (%) | ||||
| - Diabetes mellitus | 11,644 (60.9%) | 12,010 (62.8%) | 0.00012 | 0.0394 |
| - Hypertension | 11,046 (57.8%) | 11,027 (57.7%) | 0.84 | 0.0020 |
| - Ischemic heart disease | 1336 (7.0%) | 1291 (6.8%) | 0.36 | 0.0093 |
| - Cerebrovascular disease | 403 (2.11%) | 390 (2.04%) | 0.64 | 0.0048 |
| (b) | ||||
| Laboratory Parameter | Semaglutide Group (n = 19,112) | Non-Semaglutide Group (n = 19,112) | p-Value | St. Diff. |
| Liver function tests | ||||
| ALT (U/L), mean ± SD | 47.76 ± 54.48 (n = 14,573, 76%) | 58.15 ± 144.01 (n = 14,273, 74%) | <0.001 | 0.0955 |
| AST (U/L), mean ± SD | 35.92 ± 53.02 (n = 14,197, 74%) | 54.24 ± 332.76 (n = 13,944, 73%) | <0.001 | 0.0769 |
| ALP (U/L), mean ± SD | 85.62 ± 40.17 (n = 14,092, 73%) | 89.71 ± 53.52 (n = 13,763, 72%) | <0.001 | 0.0865 |
| GGT (U/L), mean ± SD | 80.21 ± 121.66 (n = 873, 4.6%) | 111.70 ± 198.84 (n = 819, 4.3%) | <0.001 | 0.1910 |
| Total bilirubin (mg/dL), mean ± SD | 0.555 ± 0.436 (n = 13,901, 73%) | 0.646 ± 1.049 (n = 13,616, 71%) | <0.001 | 0.1139 |
| Albumin (g/dL), mean ± SD | 4.254 ± 0.413 (n = 14,094, 74%) | 4.151 ± 0.512 (n = 13,723, 72%) | <0.001 | 0.2217 |
| Metabolic parameters | ||||
| HbA1c (%), mean ± SD | 7.132 ± 1.829 (n = 12,928, 68%) | 7.311 ± 1.915 (n = 12,705, 66%) | <0.001 | 0.0958 |
| Total cholesterol (mg/dL), mean ± SD | 177.99 ± 46.77 (n = 11,682, 61%) | 181.52 ± 50.89 (n = 11,331, 59%) | <0.001 | 0.0722 |
| LDL (mg/dL), mean ± SD | 100.32 ± 37.51 (n = 12,008, 63%) | 101.43 ± 38.35 (n = 11,677, 61%) | 0.025 | 0.0292 |
| HDL (mg/dL), mean ± SD | 43.05 ± 15.01 (n = 12,277, 64%) | 42.71 ± 16.05 (n = 11,873, 62%) | 0.089 | 0.0219 |
| Triglycerides (mg/dL), mean ± SD | 185.2 ± 164.9 (n = 12,291, 64%) | 199.9 ± 283.0 (n = 11,909, 62%) | <0.001 | 0.0635 |
| Hematologic parameters | ||||
| Platelet count (×103/μL), mean ± SD | 271.1 ± 73.1 (n = 12,483, 65%) | 261.5 ± 80.2 (n = 12,269, 64%) | <0.001 | 0.1253 |
| INR, mean ± SD | 1.037 ± 0.174 (n = 1931, 10%) | 1.126 ± 0.498 (n = 2021, 11%) | <0.001 | 0.2372 |
| Other markers | ||||
| AFP (ng/mL), mean ± SD | 3.556 ± 1.841 (n = 117, 0.61%) | 3.749 ± 3.292 (n = 105, 0.55%) | 0.587 | 0.0721 |
| Creatinine (mg/dL), mean ± SD | 0.867 ± 1.812 (n = 14,754, 77%) | 0.876 ± 1.411 (n = 14,443, 76%) | 0.63 | 0.0056 |
| (c) | ||||
| Medication | Semaglutide Group (n = 19,112) | Non-Semaglutide Group (n = 19,112) | p-Value | St. Diff. |
| Any glucose-lowering agents (non-GLP-1) | 18,656 (97.61%) | 18,479 (96.69%) | <0.001 | 0.056 |
| Lipid-lowering agents (any) | 8389 (43.89%) | 8321 (43.54%) | 0.48 | 0.007 |
| Low-dose aspirin (anti-platelet) | 1468 (7.68%) | 1493 (7.81%) | 0.63 | 0.005 |
| (a) | ||||||
|---|---|---|---|---|---|---|
| Clinical Outcomes | Semaglutide Status | 1 Year | 5 Years | 8 Years | HR (95% CI) Over Study | p-Value |
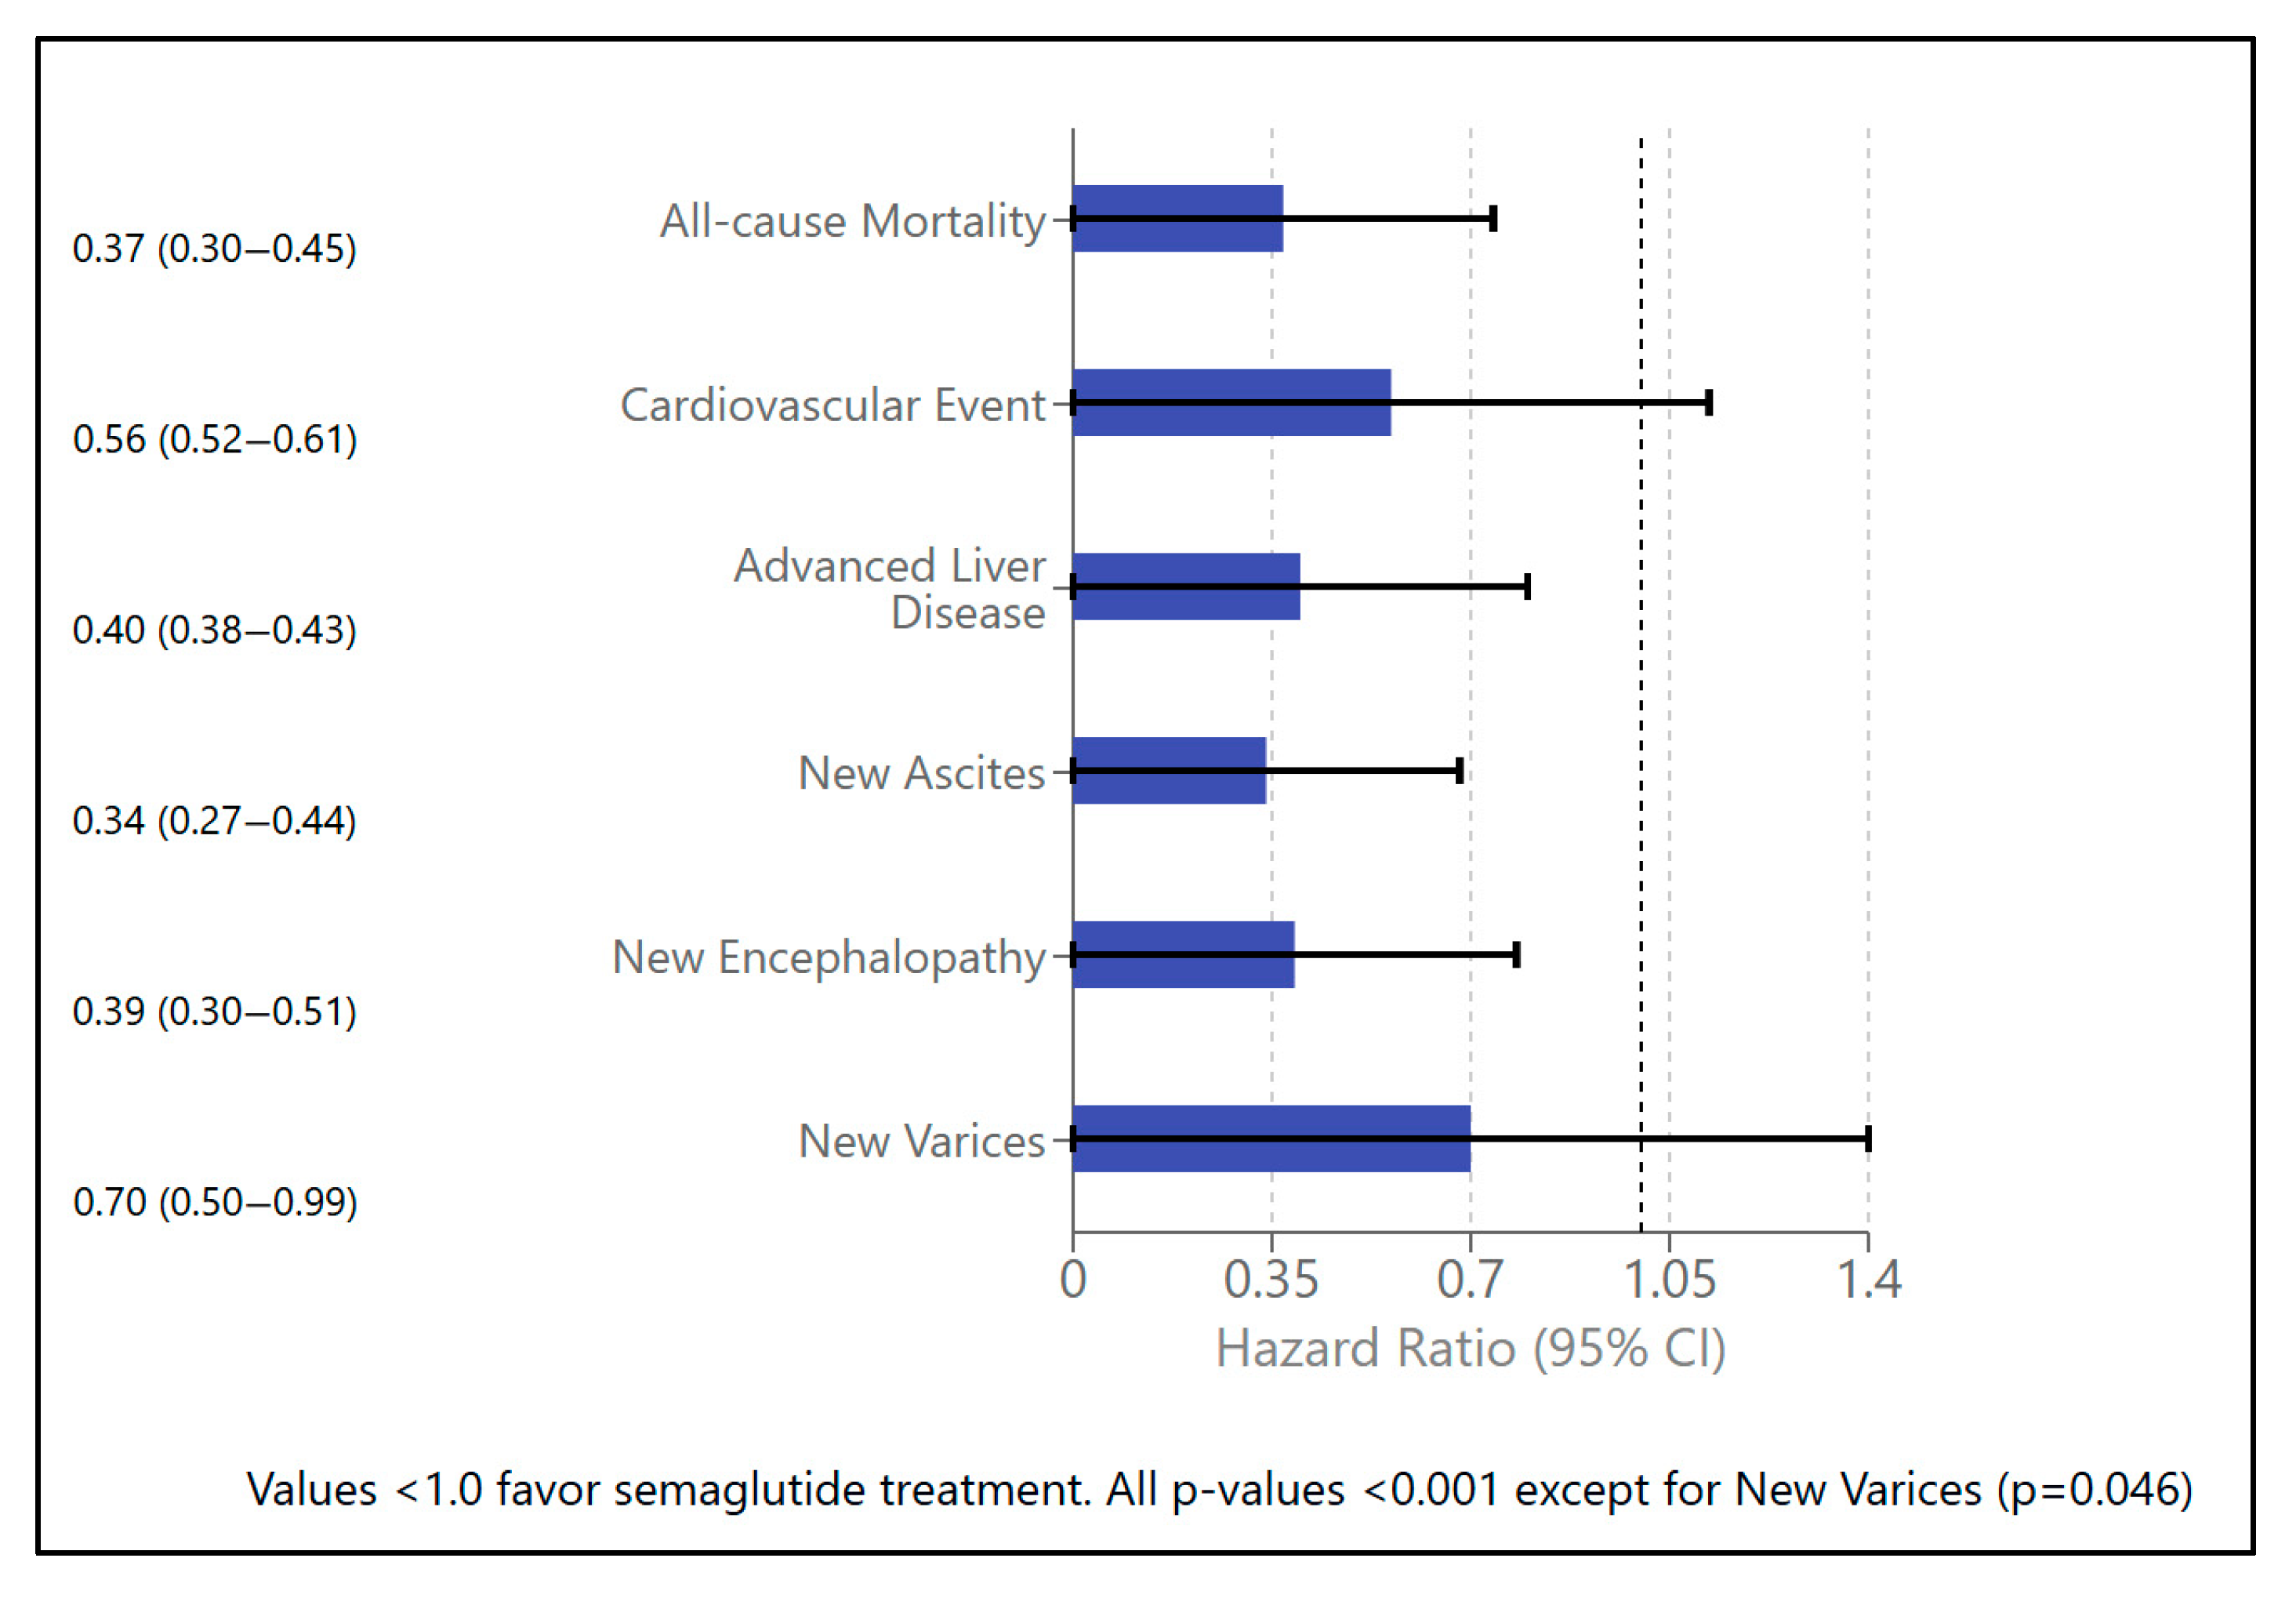
| Mortality | Exposed | 0.46% | 0.68% | 0.68% | 0.37 (0.30–0.45) | <0.001 |
| Unexposed | 1.57% | 3.07% | 3.53% | |||
| p-value | <0.001 | <0.001 | <0.001 | |||
| Survival | Exposed | 99.34% | 98.00% | 97.99% | -- | -- |
| Unexposed | 98.15% | 94.43% | 90.82% | |||
| p-value | <0.001 | <0.001 | <0.001 | |||
| Cardiovascular events | Exposed | 3.99% | 5.09% | 5.10% | 0.56 (0.52–0.61) | <0.001 |
| Unexposed | 5.21% | 9.02% | 9.75% | |||
| p-value | <0.001 | <0.001 | <0.001 | |||
| Advanced liver disease (any) | Exposed | 4.03% | 5.38% | 5.39% | 0.40 (0.38–0.43) | <0.001 |
| Unexposed | 8.87% | 13.28% | 14.15% | |||
| p-value | <0.001 | <0.001 | <0.001 | |||
| ALD (clinical) | Exposed | 3.20% | 4.30% | 4.35% | 0.38 (0.35–0.42) | <0.001 |
| Unexposed | 8.40% | 11.30% | 12.10% | |||
| p-value | <0.001 | <0.001 | <0.001 | |||
| ALD (lab) | Exposed | 2.70% | 3.60% | 3.65% | 0.36 (0.33–0.40) | <0.001 |
| Unexposed | 7.10% | 10.20% | 10.90% | |||
| p-value | <0.001 | <0.001 | <0.001 | |||
| ALD (medications) | Exposed | 1.60% | 2.15% | 2.20% | 0.32 (0.28–0.36) | <0.001 |
| Unexposed | 5.20% | 6.80% | 7.10% | |||
| p-value | <0.001 | <0.001 | <0.001 | |||
| Liver enzyme abnormalities | Exposed | 33.41% | 39.20% | 39.30% | 0.78 (0.76–0.81) | <0.001 |
| Unexposed | 39.42% | 47.40% | 47.50% | |||
| p-value | <0.001 | <0.001 | <0.001 | |||
| Synthetic liver markers | Exposed | 1.40% | 1.90% | 1.95% | 0.22 (0.20–0.25) | <0.001 |
| Unexposed | 6.00% | 7.30% | 8.90% | |||
| p-value | <0.001 | <0.001 | <0.001 | |||
| Liver transplantation | Exposed | 0.05% | 0.05% | 0.05% | 1.00 (0.40–2.50) | 1.000 |
| Unexposed | 0.05% | 0.05% | 0.05% | |||
| p-value | 1.000 | 1.000 | 1.000 | |||
| Hepatocellular carcinoma | Exposed | 0.08% | 0.09% | 0.09% | 0.75 (0.40–1.40) | 0.370 |
| Unexposed | 0.09% | 0.15% | 0.15% | |||
| p-value | 0.860 | 0.077 | 0.077 | |||
| Ascites | Exposed | 0.33% | 0.45% | 0.45% | 0.34 (0.27–0.44) | <0.001 |
| Unexposed | 0.87% | 1.31% | 1.38% | |||
| p-value | <0.001 | <0.001 | <0.001 | |||
| Encephalopathy | Exposed | 0.27% | 0.37% | 0.37% | 0.39 (0.30–0.51) | <0.001 |
| Unexposed | 0.58% | 0.91% | 1.02% | |||
| p-value | <0.001 | <0.001 | <0.001 | |||
| Varices | Exposed | 0.21% | 0.29% | 0.29% | 0.70 (0.50–0.99) | 0.046 |
| Unexposed | 0.27% | 0.41% | 0.42% | |||
| p-value | 0.250 | 0.045 | 0.031 | |||
| Ammonia-lowering agents | Exposed | 1.29% | 1.95% | 1.96% | 0.39 (0.35–0.44) | <0.001 |
| Unexposed | 5.40% | 4.26% | 4.64% | |||
| p-value | <0.001 | <0.001 | <0.001 | |||
| Diuretics | Exposed | 2.30% | 6.00% | 6.00% | 0.60 (0.55–0.65) | <0.001 |
| Unexposed | 4.80% | 10.20% | 10.90% | |||
| p-value | <0.001 | <0.001 | <0.001 | |||
| NSBB | Exposed | 0.47% | 1.45% | 1.45% | 0.35 (0.30–0.41) | <0.001 |
| Unexposed | 0.87% | 4.26% | 4.64% | |||
| p-value | 0.002 | <0.001 | <0.001 | |||
| (b) | ||||||
| Laboratory Parameter | Semaglutide Status | 1 Year | 5 Years | 8 Years | p-Value (8 Years) | |
| ALT (U/L) | Exposed | 38.2 ± 32.5 | 37.4 ± 69.2 | 37.4 ± 69.2 | 0.001 | |
| Unexposed | 46.4 ± 140.7 | 41.9 ± 128.1 | 42.1 ± 138.4 | |||
| p-value | <0.001 | 0.001 | 0.001 | |||
| AST (U/L) | Exposed | 29.9 ± 23.0 | 30.7 ± 145.5 | 30.7 ± 145.4 | <0.001 | |
| Unexposed | 39.9 ± 197.7 | 37.6 ± 189.1 | 39.6 ± 243.2 | |||
| p-value | <0.001 | 0.002 | <0.001 | |||
| ALP (U/L) | Exposed | 83.7 ± 42.2 | 83.7 ± 42.1 | 83.7 ± 42.1 | <0.001 | |
| Unexposed | 88.3 ± 60.9 | 88.3 ± 60.7 | 88.9 ± 63.2 | |||
| p-value | <0.001 | <0.001 | <0.001 | |||
| GGT (U/L) | Exposed | 74.0 ± 128.6 | 74.7 ± 123.7 | 74.7 ± 123.6 | <0.001 | |
| Unexposed | 116.6 ± 222.4 | 110.2 ± 207.2 | 107.9 ± 204.9 | |||
| p-value | <0.001 | <0.001 | <0.001 | |||
| Bilirubin (mg/dL) | Exposed | 0.56 ± 0.58 | 0.57 ± 0.65 | 0.57 ± 0.65 | <0.001 | |
| Unexposed | 0.66 ± 1.48 | 0.67 ± 1.77 | 0.68 ± 1.85 | |||
| p-value | <0.001 | <0.001 | <0.001 | |||
| Albumin (g/dL) | Exposed | 4.23 ± 0.46 | 4.22 ± 0.46 | 4.22 ± 0.46 | <0.001 | |
| Unexposed | 4.07 ± 0.59 | 4.08 ± 0.57 | 4.07 ± 0.58 | |||
| p-value | <0.001 | <0.001 | <0.001 | |||
| INR | Exposed | 1.05 ± 0.13 | 1.07 ± 0.15 | 1.09 ± 0.18 | 0.07 | |
| Unexposed | 1.09 ± 0.20 | 1.12 ± 0.22 | 1.14 ± 0.26 | |||
| p-value | 0.045 | 0.031 | 0.07 | |||
| Platelets (×103/μL) | Exposed | 273.5 ± 71.8 | 271.0 ± 69.4 | 268.7 ± 66.9 | <0.001 | |
| Unexposed | 262.4 ± 78.3 | 256.9 ± 75.6 | 250.8 ± 74.5 | |||
| p-value | <0.001 | <0.001 | <0.001 | |||
| HbA1c (%) | Exposed | 6.73 ± 1.56 | 6.68 ± 1.55 | 6.68 ± 1.55 | <0.001 | |
| Unexposed | 7.11 ± 1.70 | 7.10 ± 1.76 | 7.08 ± 1.74 | |||
| p-value | <0.001 | <0.001 | <0.001 | |||
| LDL (mg/dL) | Exposed | 92.5 ± 36.1 | 92.2 ± 36.2 | 92.2 ± 36.3 | 0.836 | |
| Unexposed | 94.3 ± 36.9 | 92.7 ± 37.1 | 92.3 ± 37.3 | |||
| p-value | 0.003 | 0.345 | 0.836 | |||
| HDL (mg/dL) | Exposed | 42.9 ± 15.2 | 43.5 ± 15.0 | 43.5 ± 15.0 | 0.188 | |
| Unexposed | 42.4 ± 16.3 | 43.6 ± 16.8 | 43.8 ± 16.9 | |||
| p-value | 0.047 | 0.543 | 0.188 | |||
| Triglycerides (mg/dL) | Exposed | 167.5 ± 154.2 | 165.2 ± 129.2 | 165.3 ± 129.2 | <0.001 | |
| Unexposed | 183.2 ± 175.3 | 178.0 ± 169.2 | 176.2 ± 160.5 | |||
| p-value | <0.001 | <0.001 | <0.001 | |||
| BMI (kg/m2) | Exposed | 35.51 ± 6.34 | 35.28 ± 6.42 | 35.27 ± 6.42 | <0.001 | |
| Unexposed | 34.11 ± 6.64 | 33.76 ± 6.73 | 33.71 ± 6.75 | |||
| p-value | <0.001 | <0.001 | <0.001 | |||
| (c) | ||||||
| Categorical Outcome | Semaglutide Status | 1 Year | 5 Years | 8 Years | p-Value (8 Years) | |
| ALT > 50 U/L | Exposed | 15.36% | 18.25% | 18.27% | <0.001 | |
| Unexposed | 20.51% | 27.56% | 28.26% | |||
| p-value | <0.001 | <0.001 | <0.001 | |||
| AST > 40 U/L | Exposed | 19.6% | 22.4% | 22.5% | <0.001 | |
| Unexposed | 25.1% | 30.8% | 32.6% | |||
| p-value | <0.001 | <0.001 | <0.001 | |||
| Bilirubin ≥ 2 mg/dL | Exposed | 0.63% | 0.80% | 0.80% | <0.001 | |
| Unexposed | 2.06% | 2.61% | 2.75% | |||
| p-value | <0.001 | <0.001 | <0.001 | |||
| Albumin ≤ 2.8 g/dL | Exposed | 0.97% | 1.30% | 1.30% | <0.001 | |
| Unexposed | 4.23% | 5.69% | 6.04% | |||
| p-value | <0.001 | <0.001 | <0.001 | |||
| INR ≥ 1.7 | Exposed | 0.21% | 0.37% | 0.58% | 0.002 | |
| Unexposed | 0.54% | 0.87% | 1.20% | |||
| p-value | 0.003 | <0.001 | 0.002 | |||
| Platelets < 150 × 103/μL | Exposed | 8.50% | 9.70% | 9.80% | <0.001 | |
| Unexposed | 13.30% | 15.40% | 16.20% | |||
| p-value | <0.001 | <0.001 | <0.001 | |||
| Platelets < 100 × 103/μL | Exposed | 3.20% | 3.60% | 3.65% | <0.001 | |
| Unexposed | 5.80% | 6.40% | 6.70% | |||
| p-value | <0.001 | <0.001 | <0.001 | |||
| HbA1c > 8.5% | Exposed | 8.22% | 10.70% | 10.74% | <0.001 | |
| Unexposed | 10.95% | 18.00% | 18.76% | |||
| p-value | <0.001 | <0.001 | <0.001 | |||
| Poor metabolic markers | Exposed | 31.13% | 36.32% | 36.36% | <0.001 | |
| Unexposed | 34.32% | 45.80% | 46.46% | |||
| p-value | <0.001 | <0.001 | <0.001 | |||
| Outcome | NNT at 1 Year | NNT at 5 Years | NNT at 8 Years |
|---|---|---|---|
| All-cause mortality | 83 | 38 | 28 |
| Advanced liver disease | 20 | 17 | 14 |
| Cardiovascular event | 71 | 56 | 43 |
| Clinical ALD manifestations | 19 | 16 | 14 |
| Laboratory-defined ALD | 23 | 19 | 16 |
| ALD requiring medications | 28 | 23 | 19 |
| Ascites | 143 | 111 | 83 |
| Encephalopathy | 167 | 143 | 111 |
| Varices | 167 | 125 | 100 |
Disclaimer/Publisher’s Note: The statements, opinions and data contained in all publications are solely those of the individual author(s) and contributor(s) and not of MDPI and/or the editor(s). MDPI and/or the editor(s) disclaim responsibility for any injury to people or property resulting from any ideas, methods, instructions or products referred to in the content. |
© 2025 by the authors. Licensee MDPI, Basel, Switzerland. This article is an open access article distributed under the terms and conditions of the Creative Commons Attribution (CC BY) license (https://creativecommons.org/licenses/by/4.0/).
Share and Cite
Suki, M.; Amer, J.; Milgrom, Y.; Massarwa, M.; Hazou, W.; Tiram, Y.; Perzon, O.; Sharif, Y.; Sackran, J.; Alon, R.; et al. Semaglutide in MASLD Patients: Improved Survival and Liver Outcomes. Pharmaceuticals 2025, 18, 1075. https://doi.org/10.3390/ph18071075
Suki M, Amer J, Milgrom Y, Massarwa M, Hazou W, Tiram Y, Perzon O, Sharif Y, Sackran J, Alon R, et al. Semaglutide in MASLD Patients: Improved Survival and Liver Outcomes. Pharmaceuticals. 2025; 18(7):1075. https://doi.org/10.3390/ph18071075
Chicago/Turabian StyleSuki, Mohamad, Johnny Amer, Yael Milgrom, Muhammad Massarwa, Wadi Hazou, Yariv Tiram, Ofer Perzon, Yousra Sharif, Joseph Sackran, Revital Alon, and et al. 2025. "Semaglutide in MASLD Patients: Improved Survival and Liver Outcomes" Pharmaceuticals 18, no. 7: 1075. https://doi.org/10.3390/ph18071075
APA StyleSuki, M., Amer, J., Milgrom, Y., Massarwa, M., Hazou, W., Tiram, Y., Perzon, O., Sharif, Y., Sackran, J., Alon, R., Lourie, N. E. E., Raz, I., Imam, A., Khalaileh, A., & Safadi, R. (2025). Semaglutide in MASLD Patients: Improved Survival and Liver Outcomes. Pharmaceuticals, 18(7), 1075. https://doi.org/10.3390/ph18071075