
Chitosan Nanoparticles for Topical Drug Delivery in Chemotherapy-Induced Alopecia: A Comparative Study of Five Repurposed Pharmacological Agents

 ,
,  , ,
, ,  and
and
Abstract
1. Introduction
2. Results
2.1. Characterization of Drug-Loaded Chitosan Nanoparticles
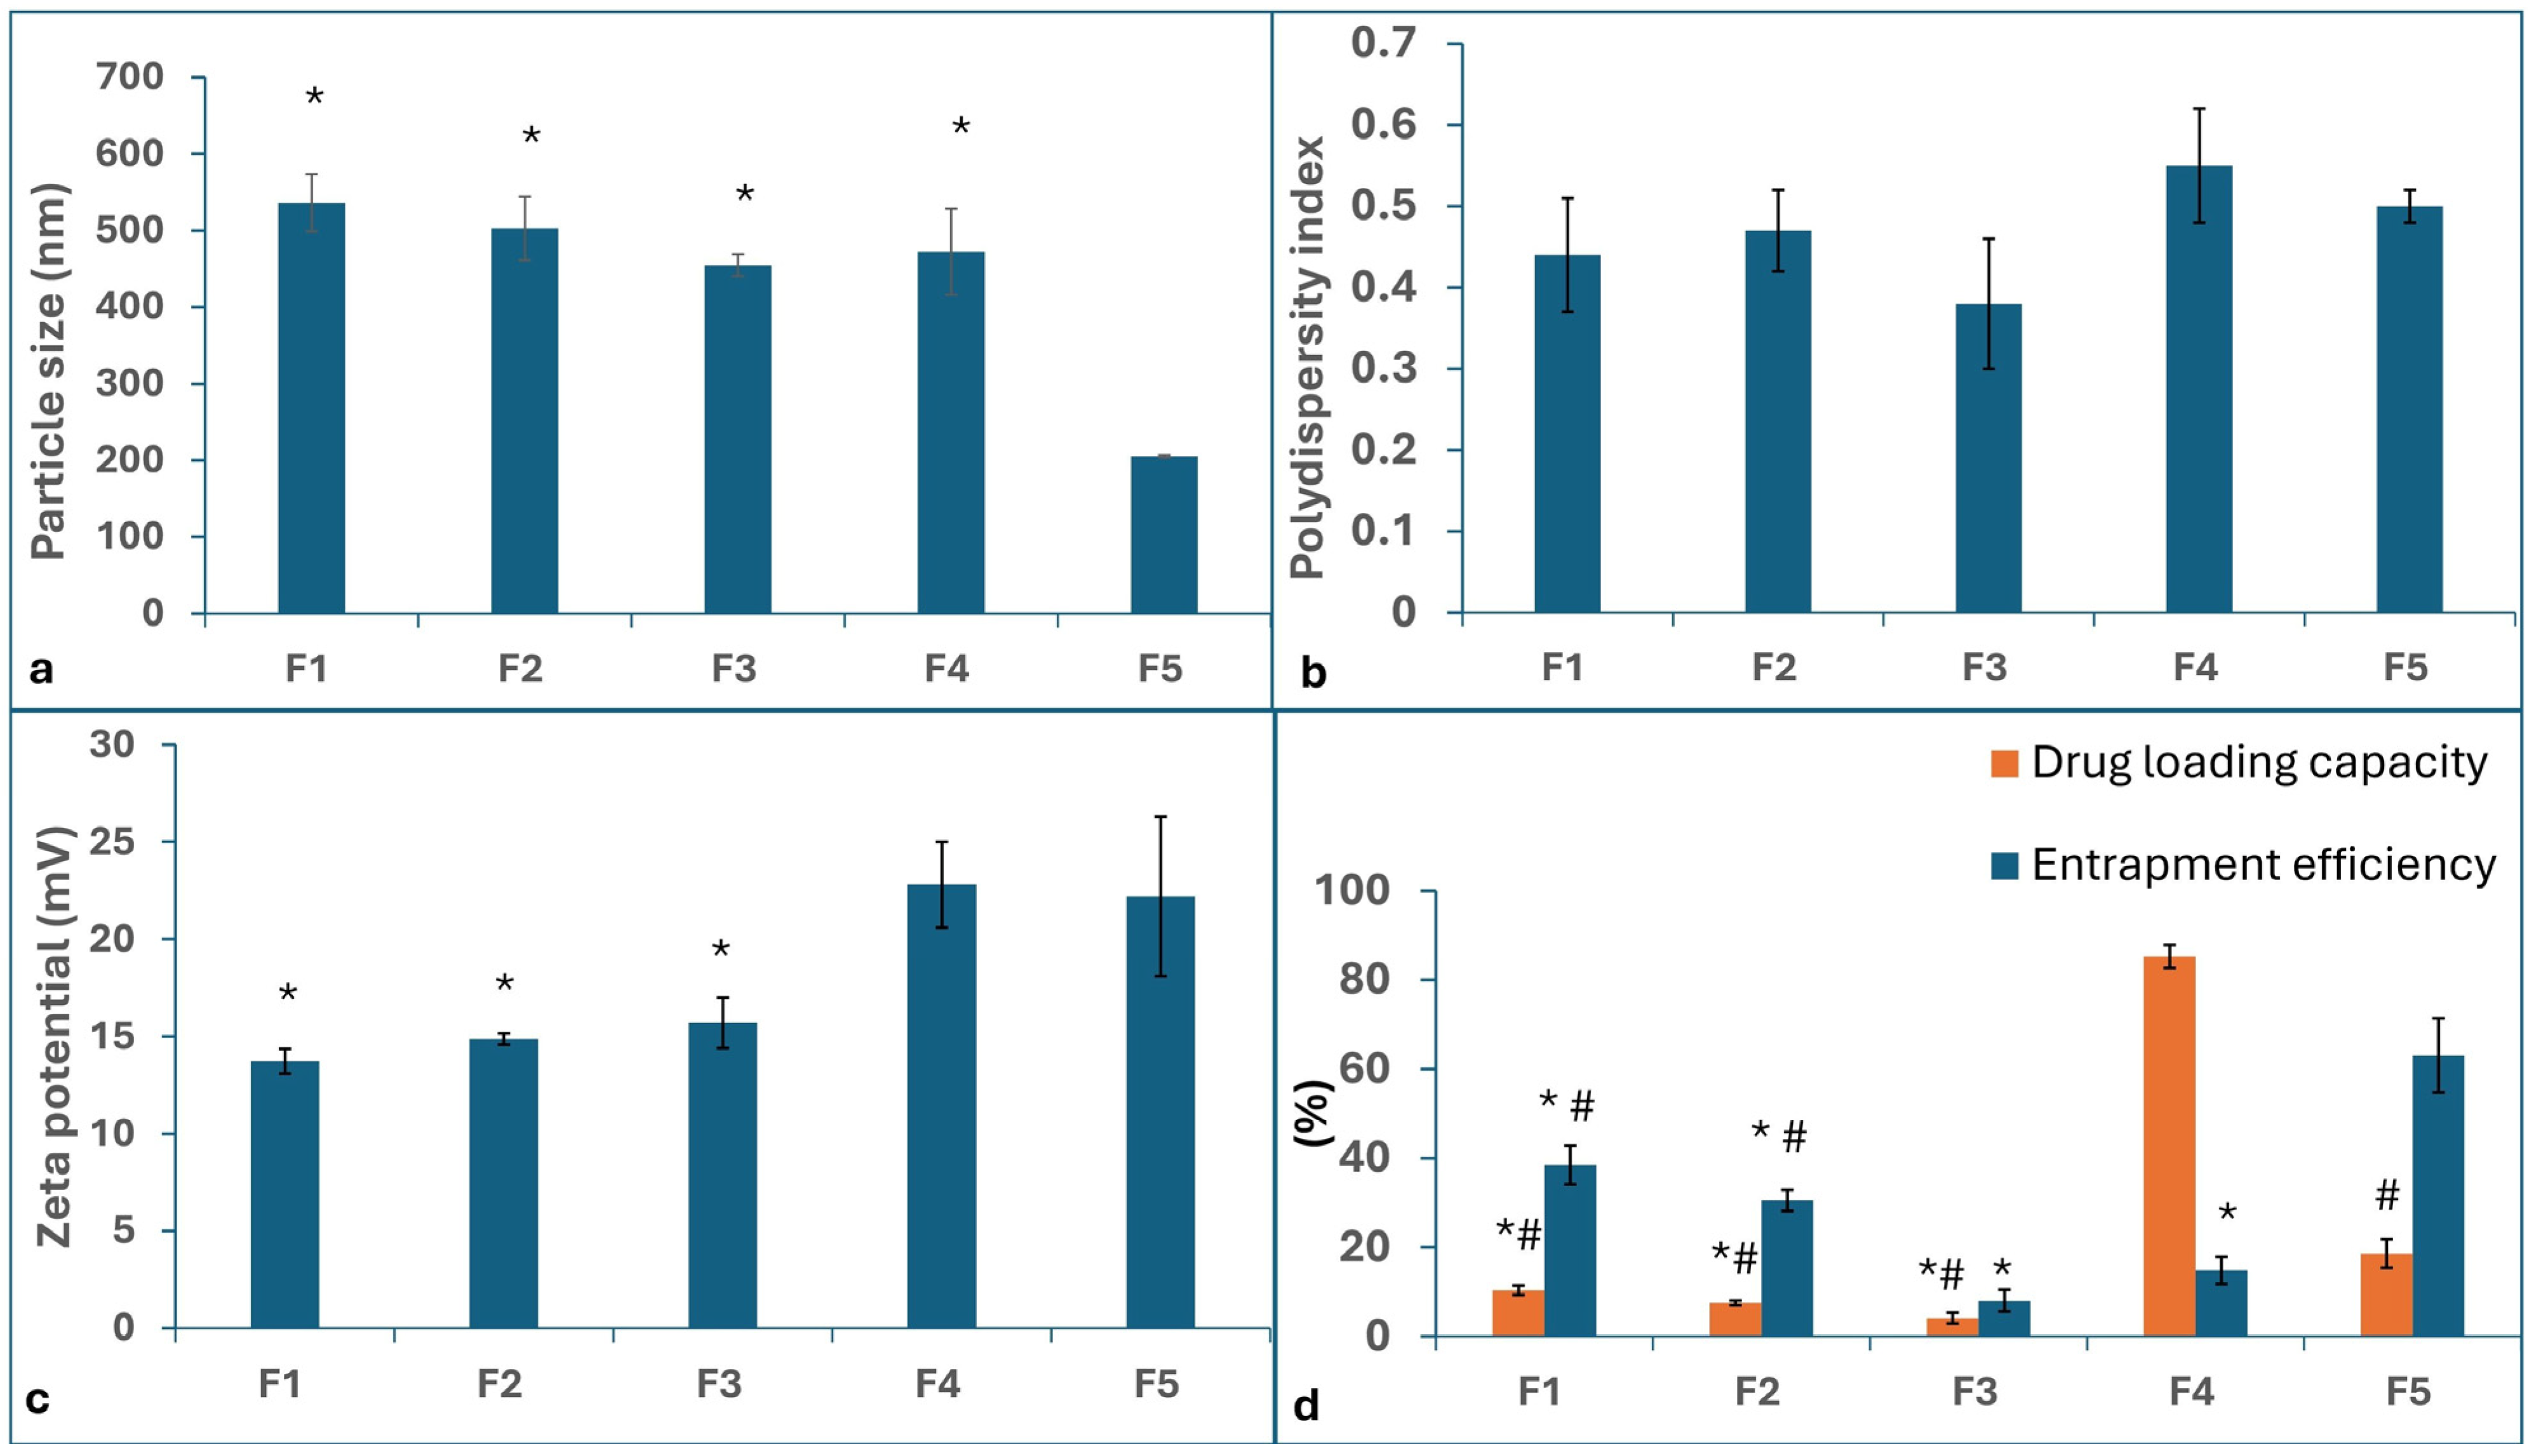
2.1.1. Particle Size (PS), Polydispersity Index (PDI), and Zeta Potential (ZP)
2.1.2. Entrapment Efficiency (EE%) and Drug Loading (DL%)
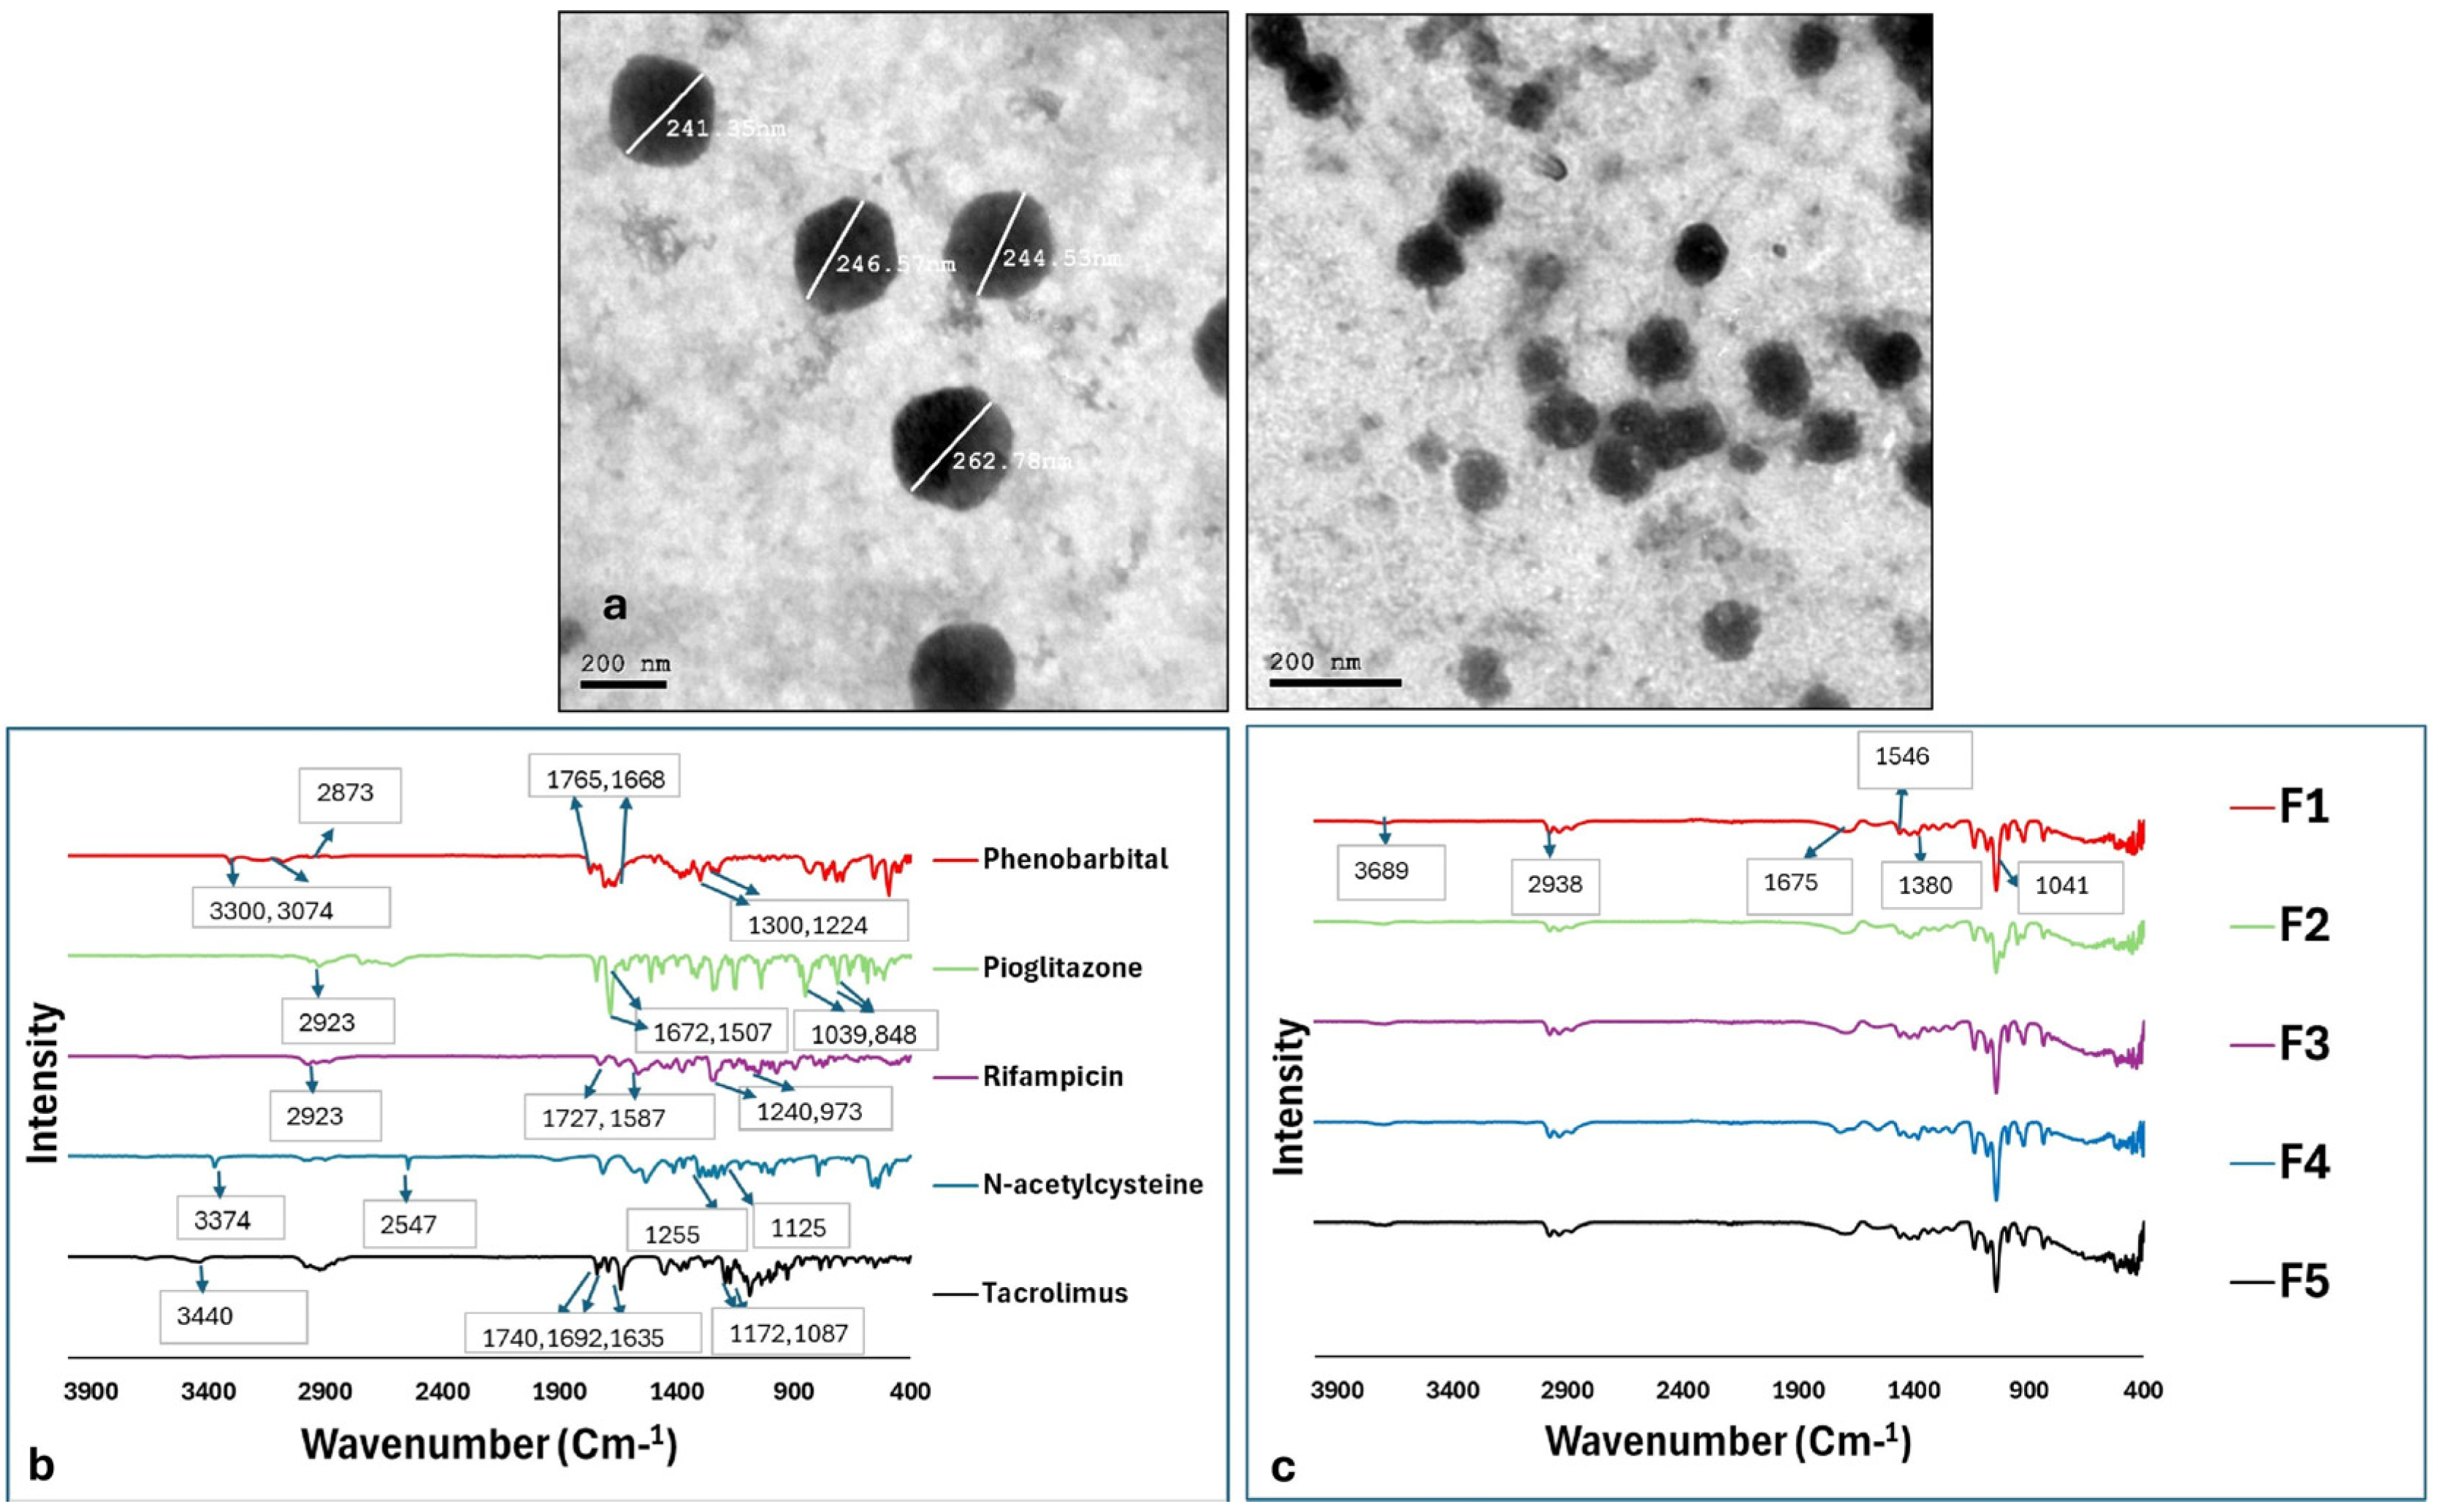
2.1.3. Morphological Examination Using Transmission Electron Microscopy (TEM)
2.2. Fourier-Transform Infrared (FT-IR) Analysis
2.3. In Vivo Comparison of the Efficacy of Chitosan Nanoparticles Loaded with Different Agents in the Prevention and/or Treatment of Chemotherapy-Induced Alopecia in an Animal Model
2.3.1. Induction of Anagen VI to Induce Chemotherapy-Induced Alopecia
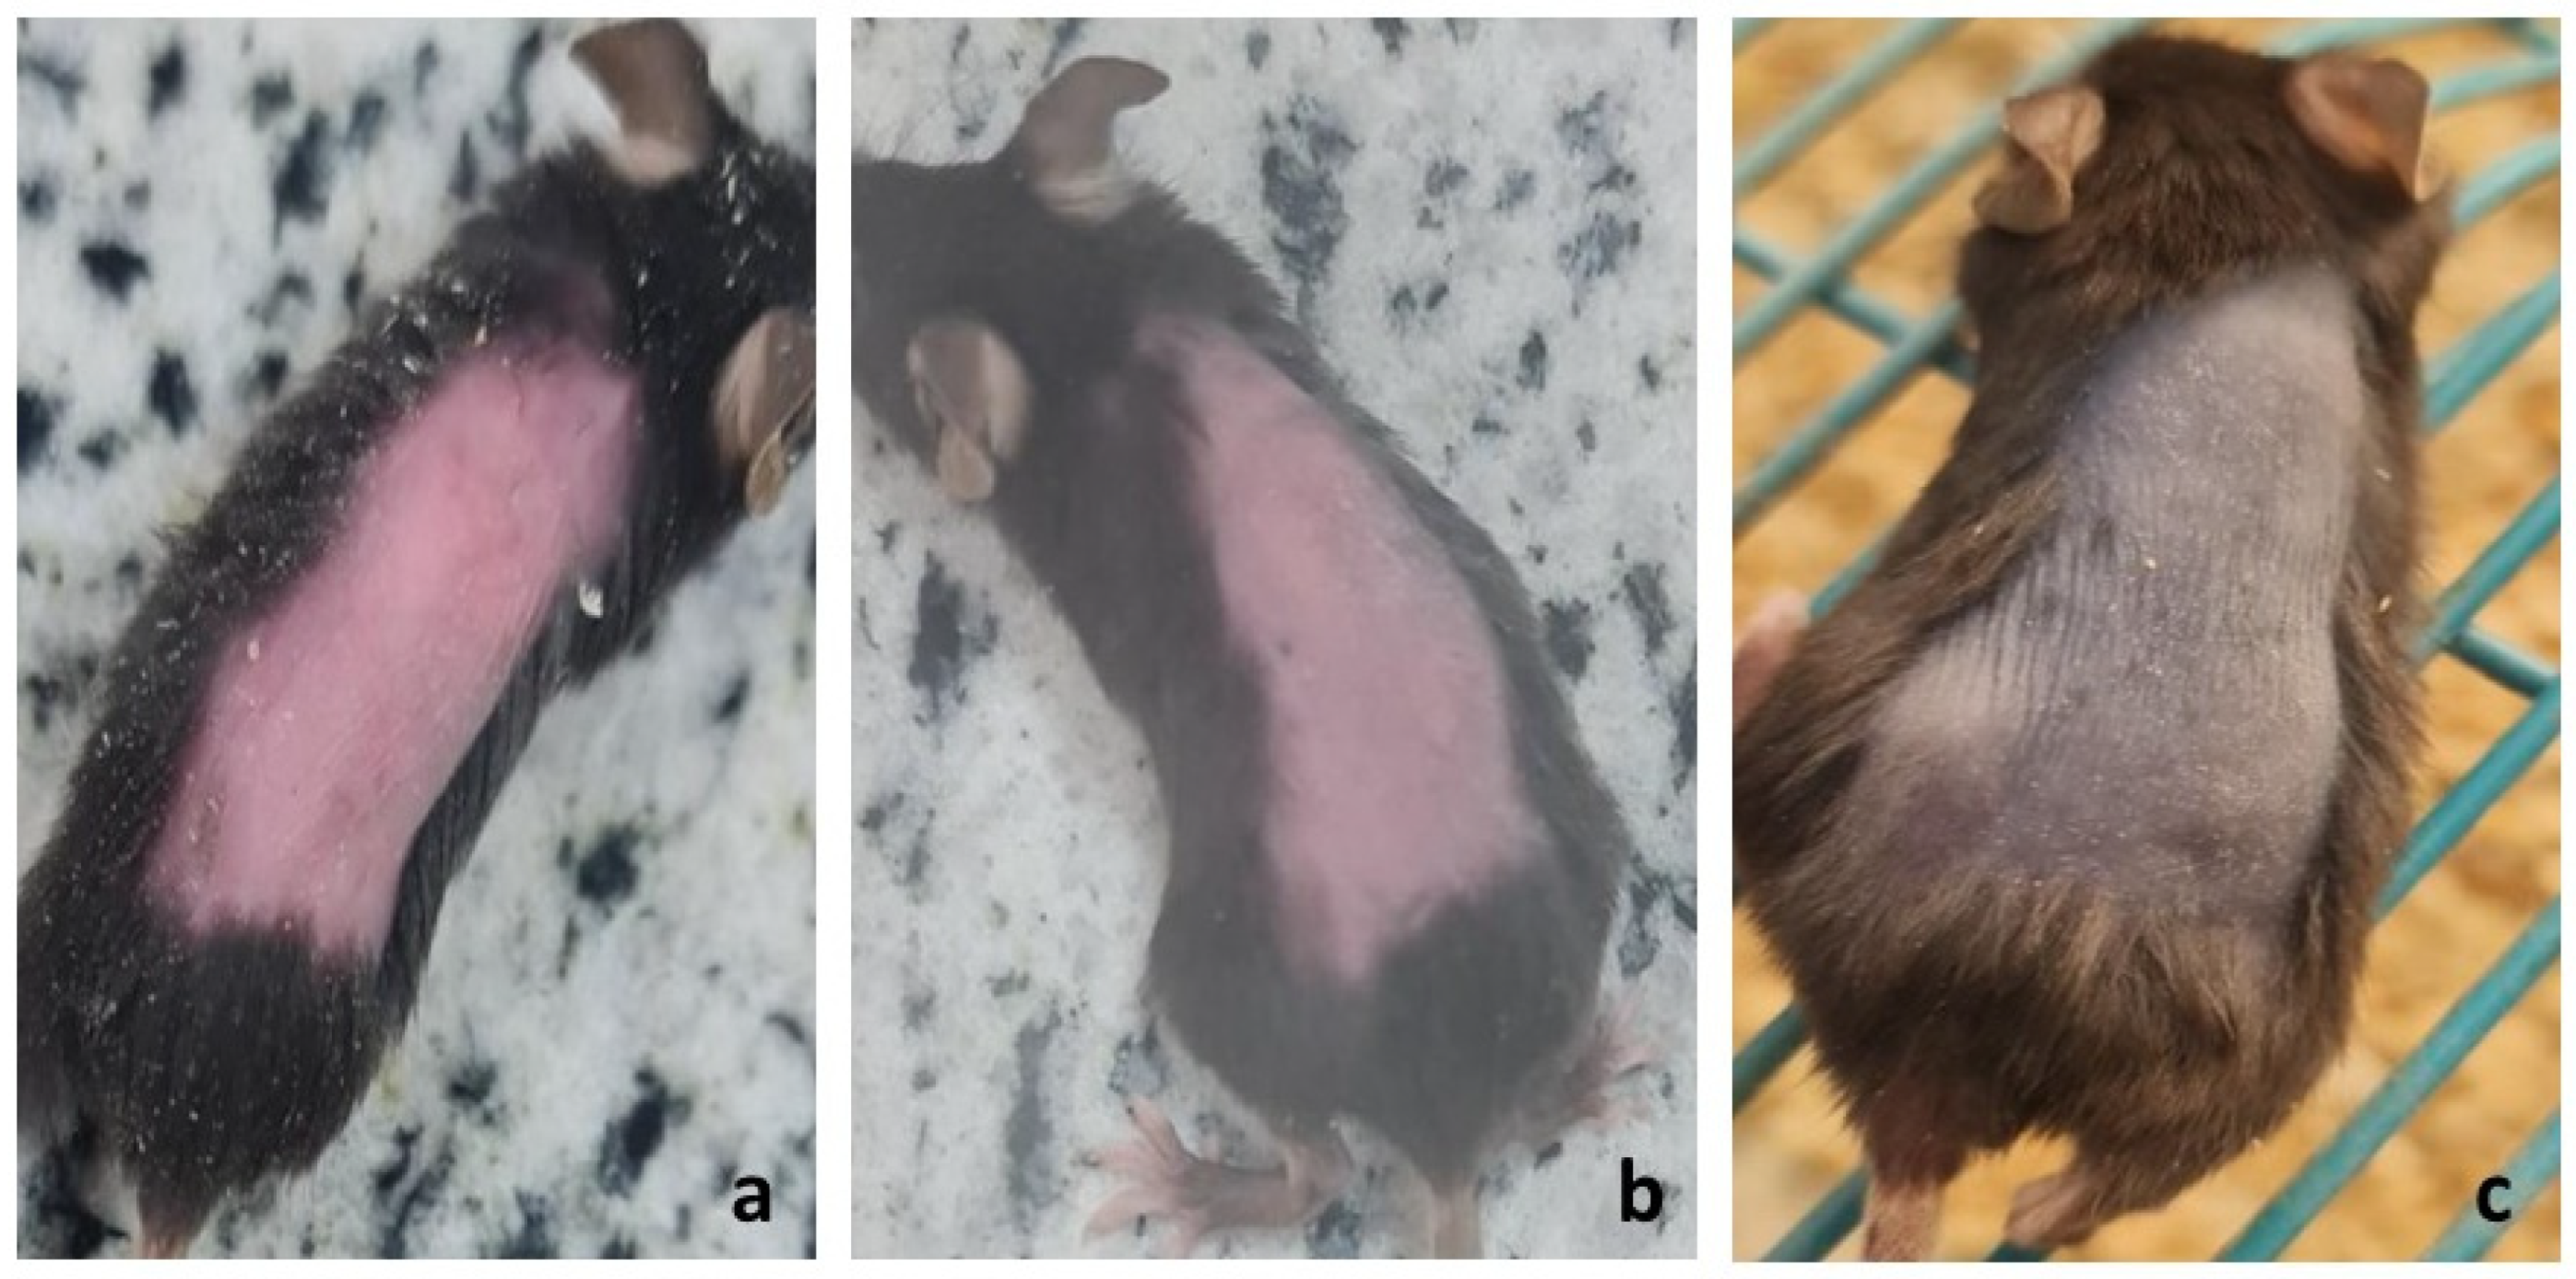
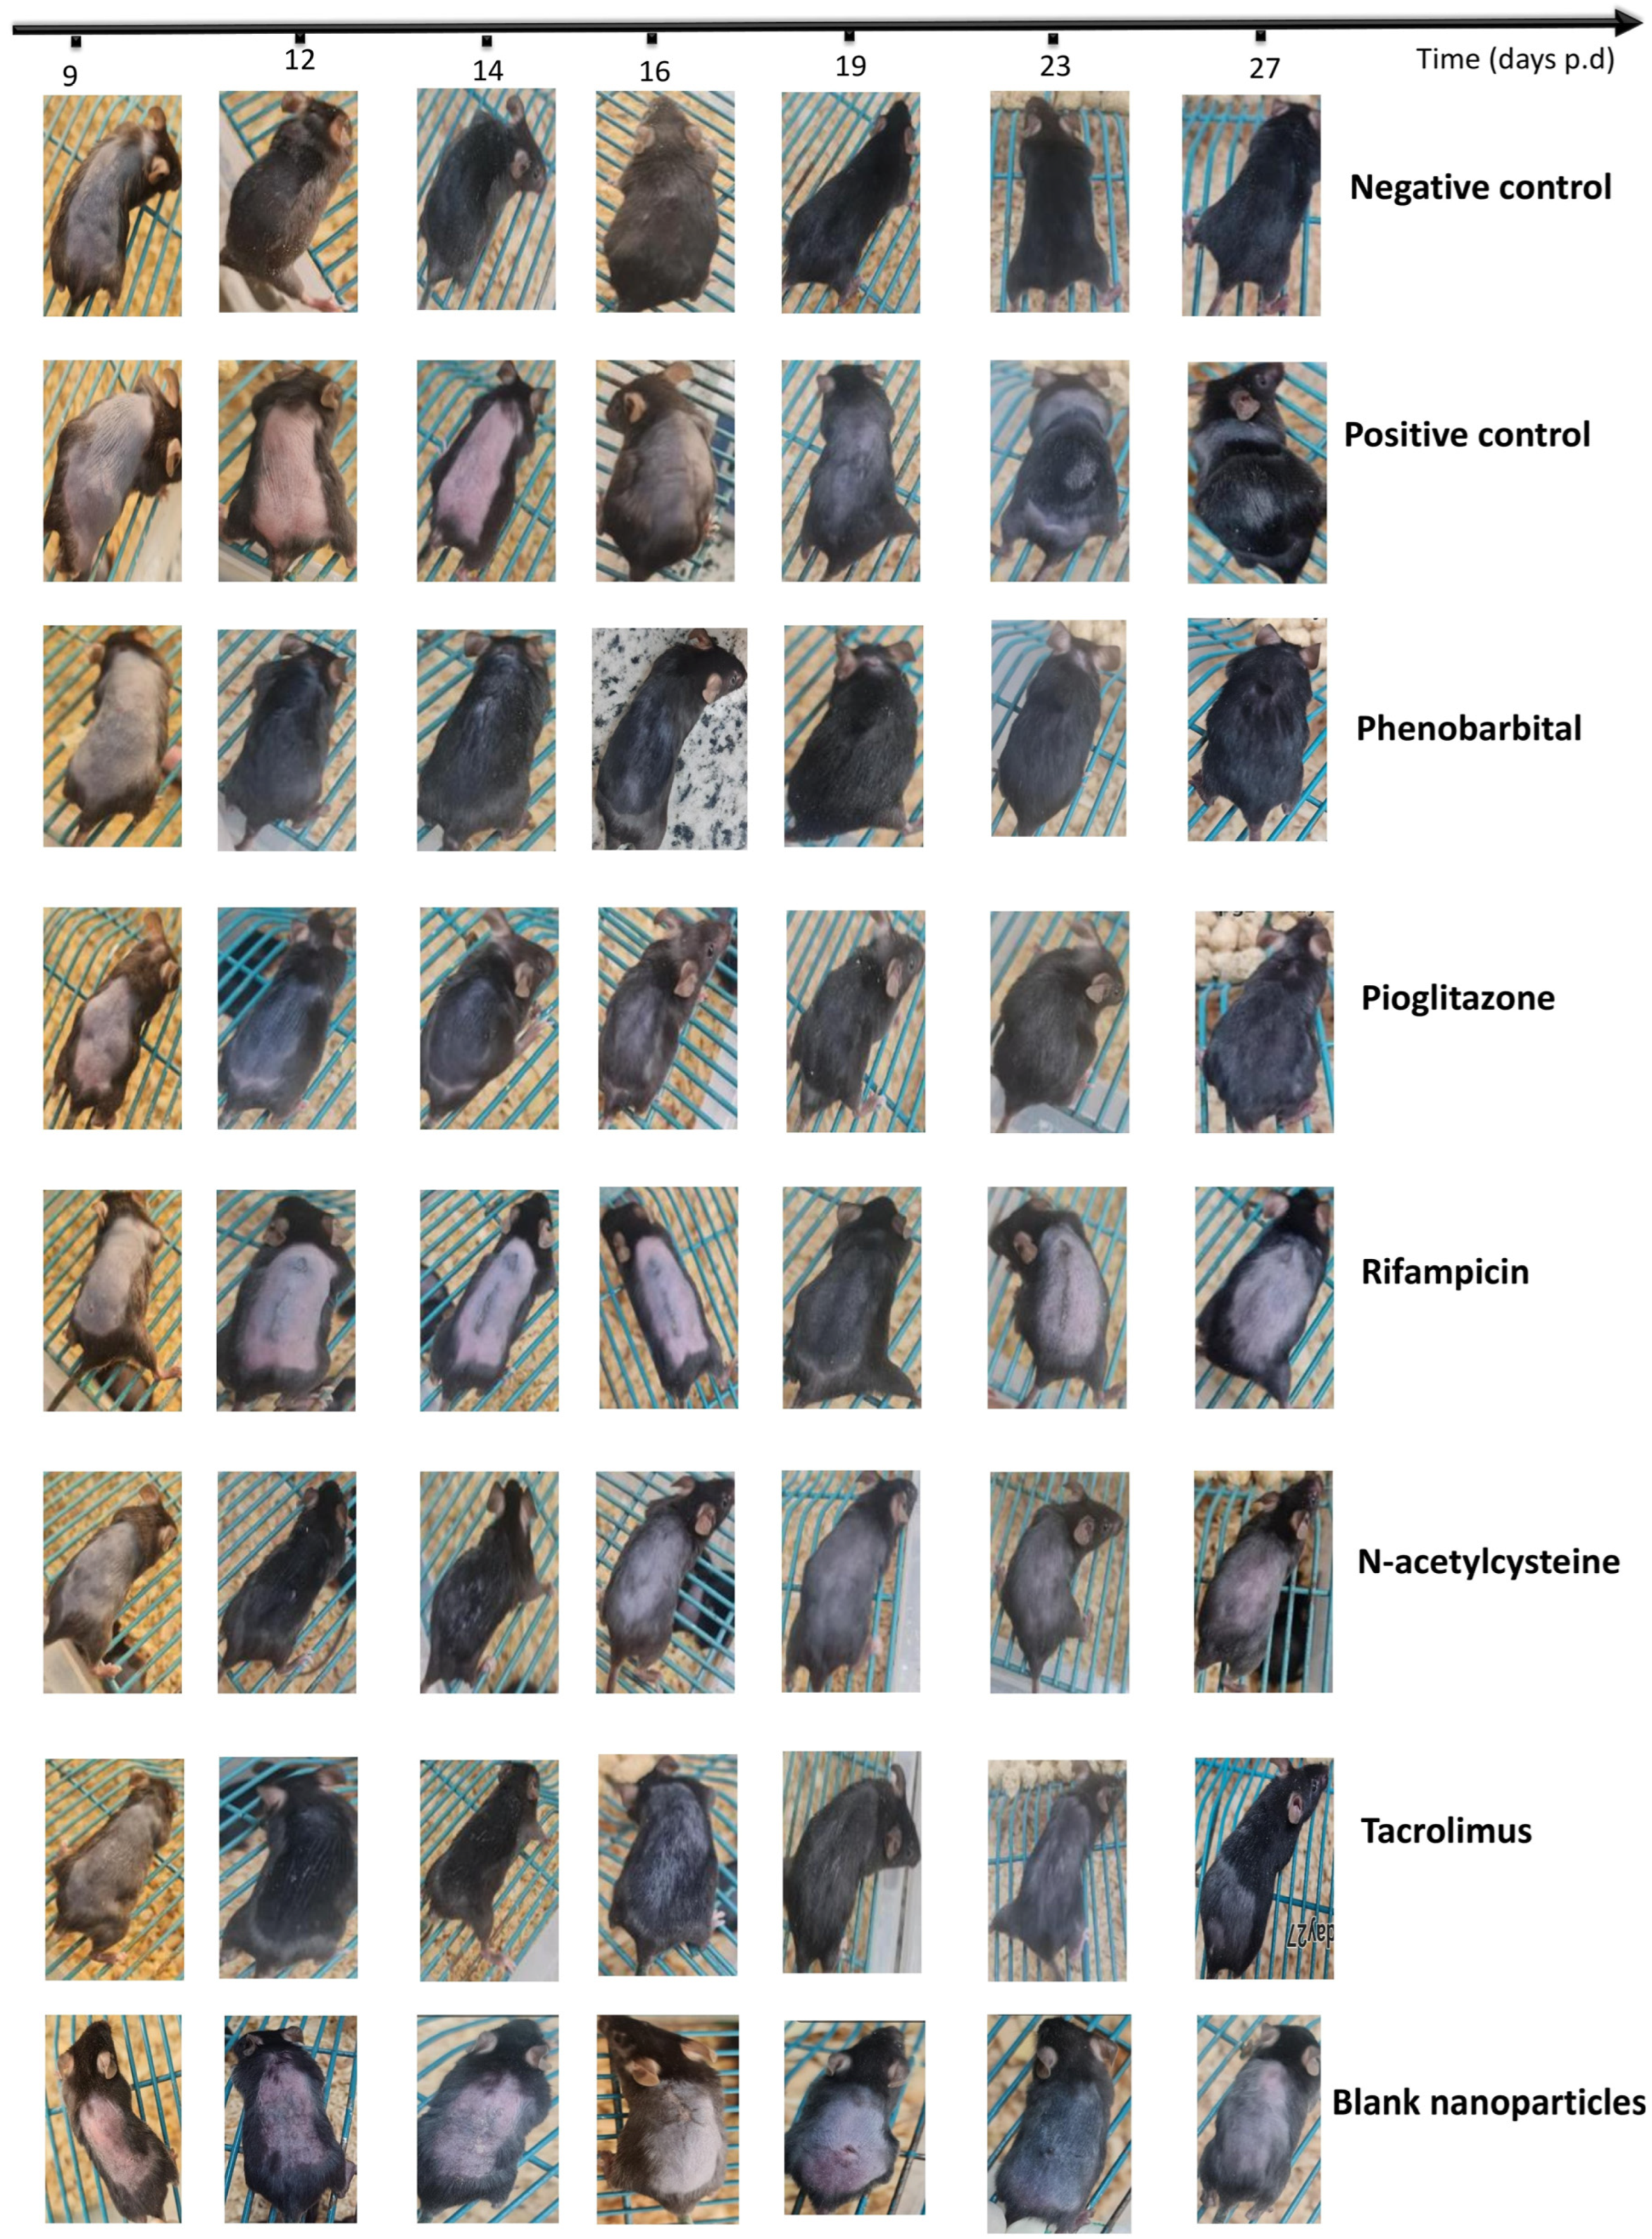
2.3.2. Visual Assessment of Hair Loss and Regrowth Pattern
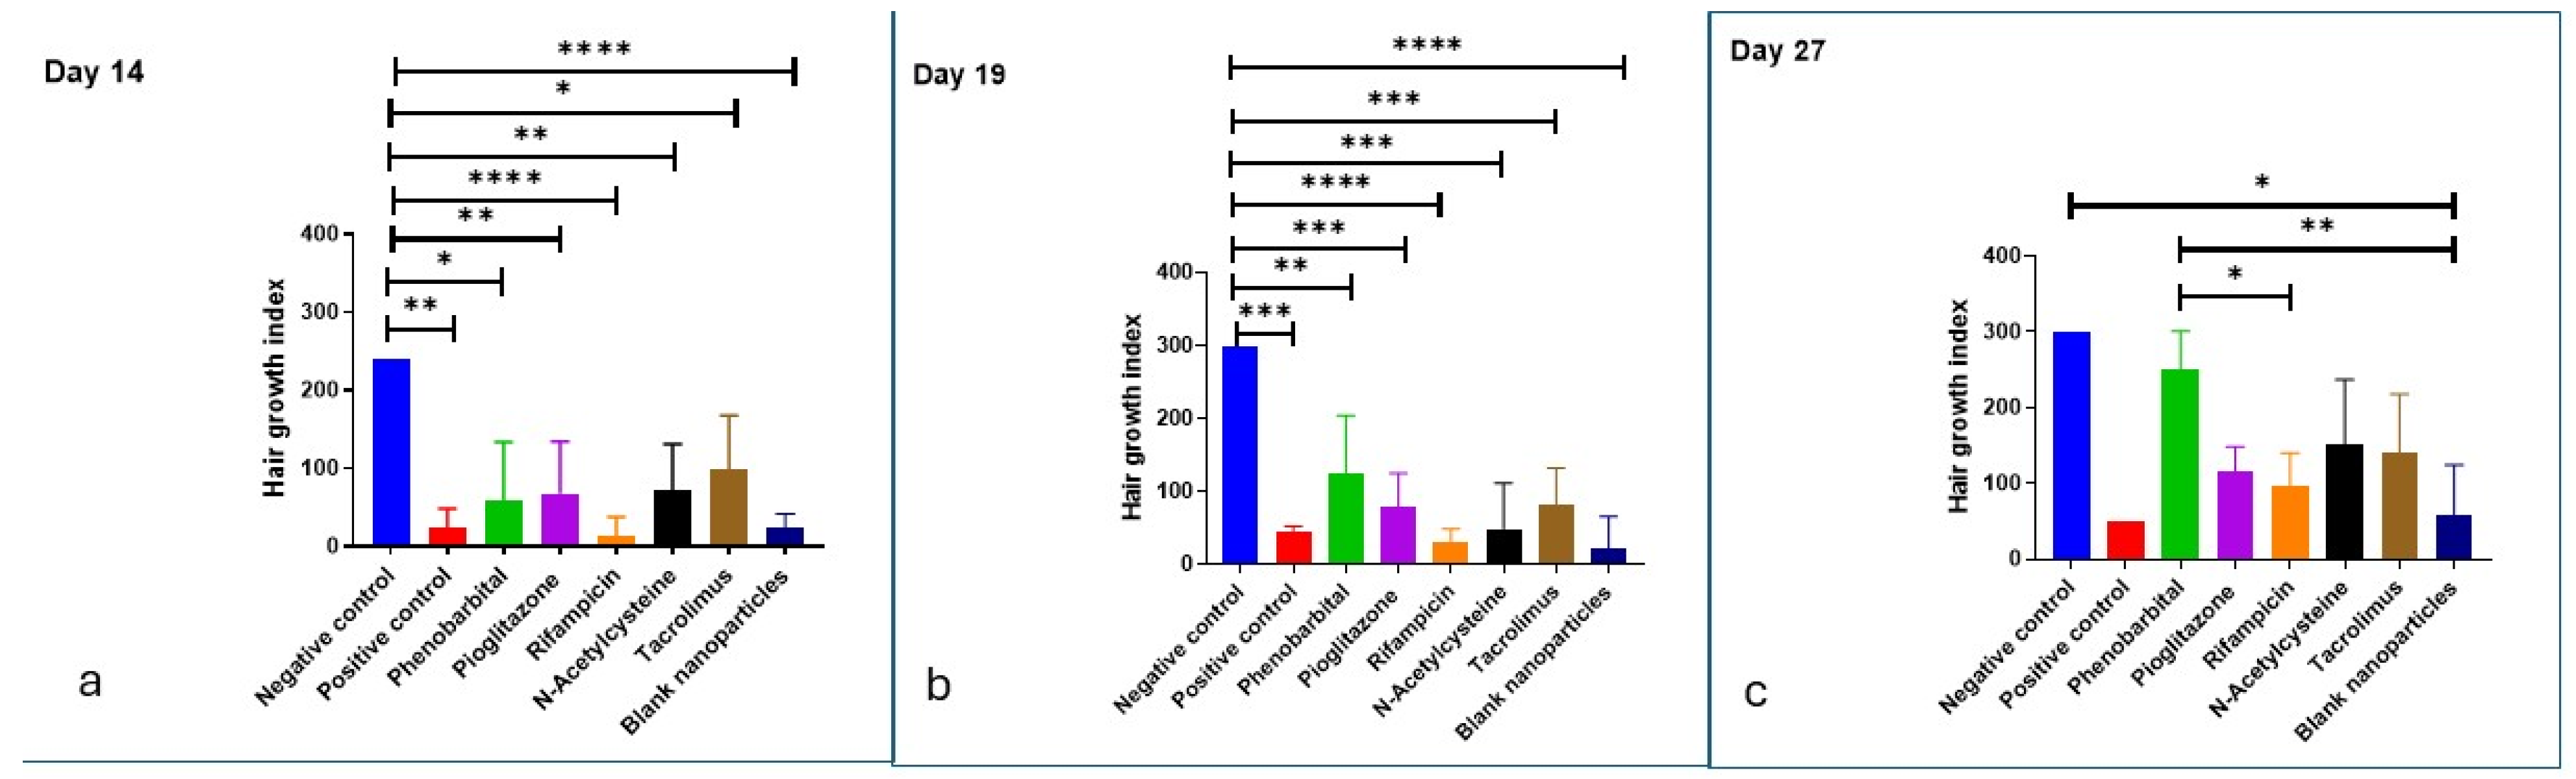
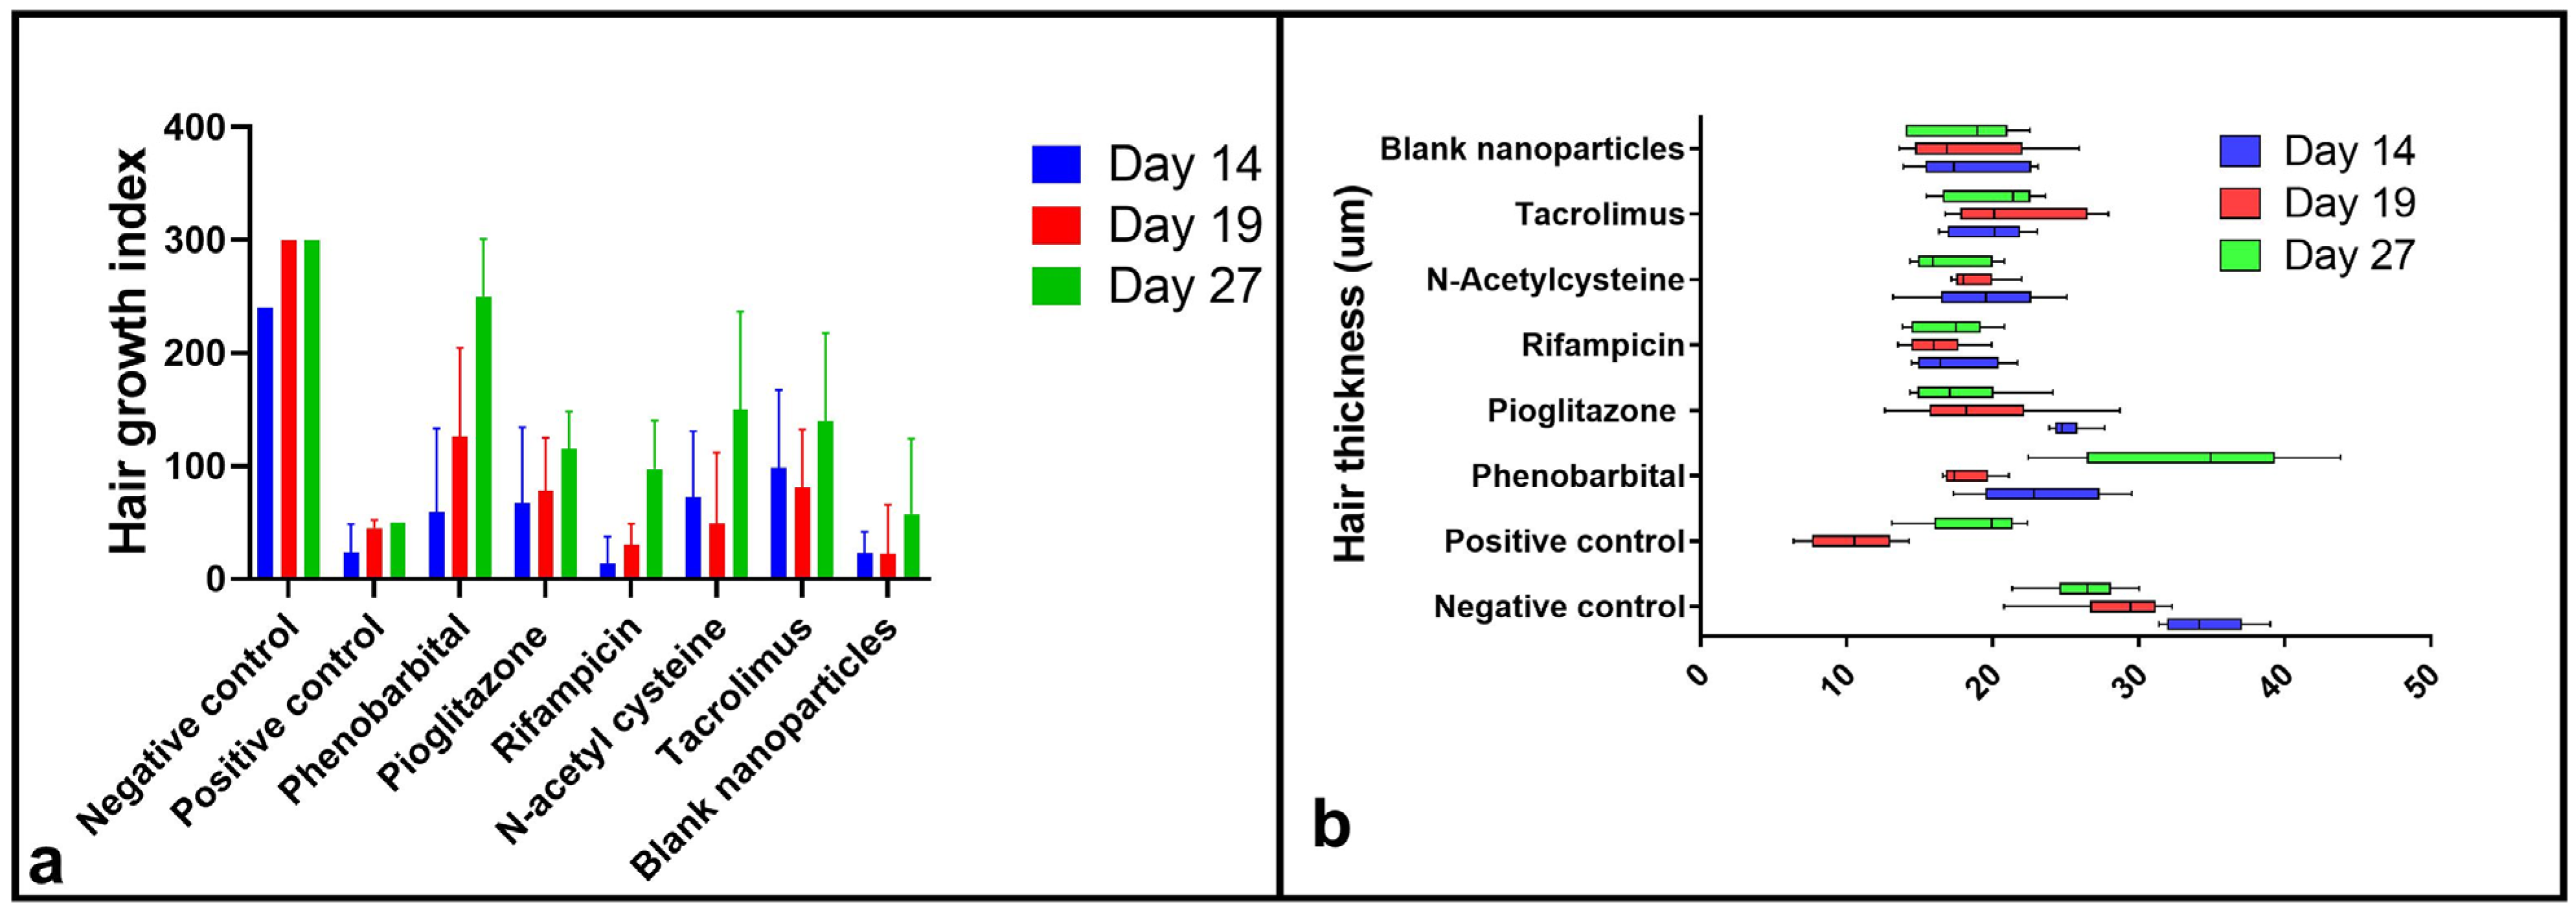
2.3.3. Hair Growth Index Score
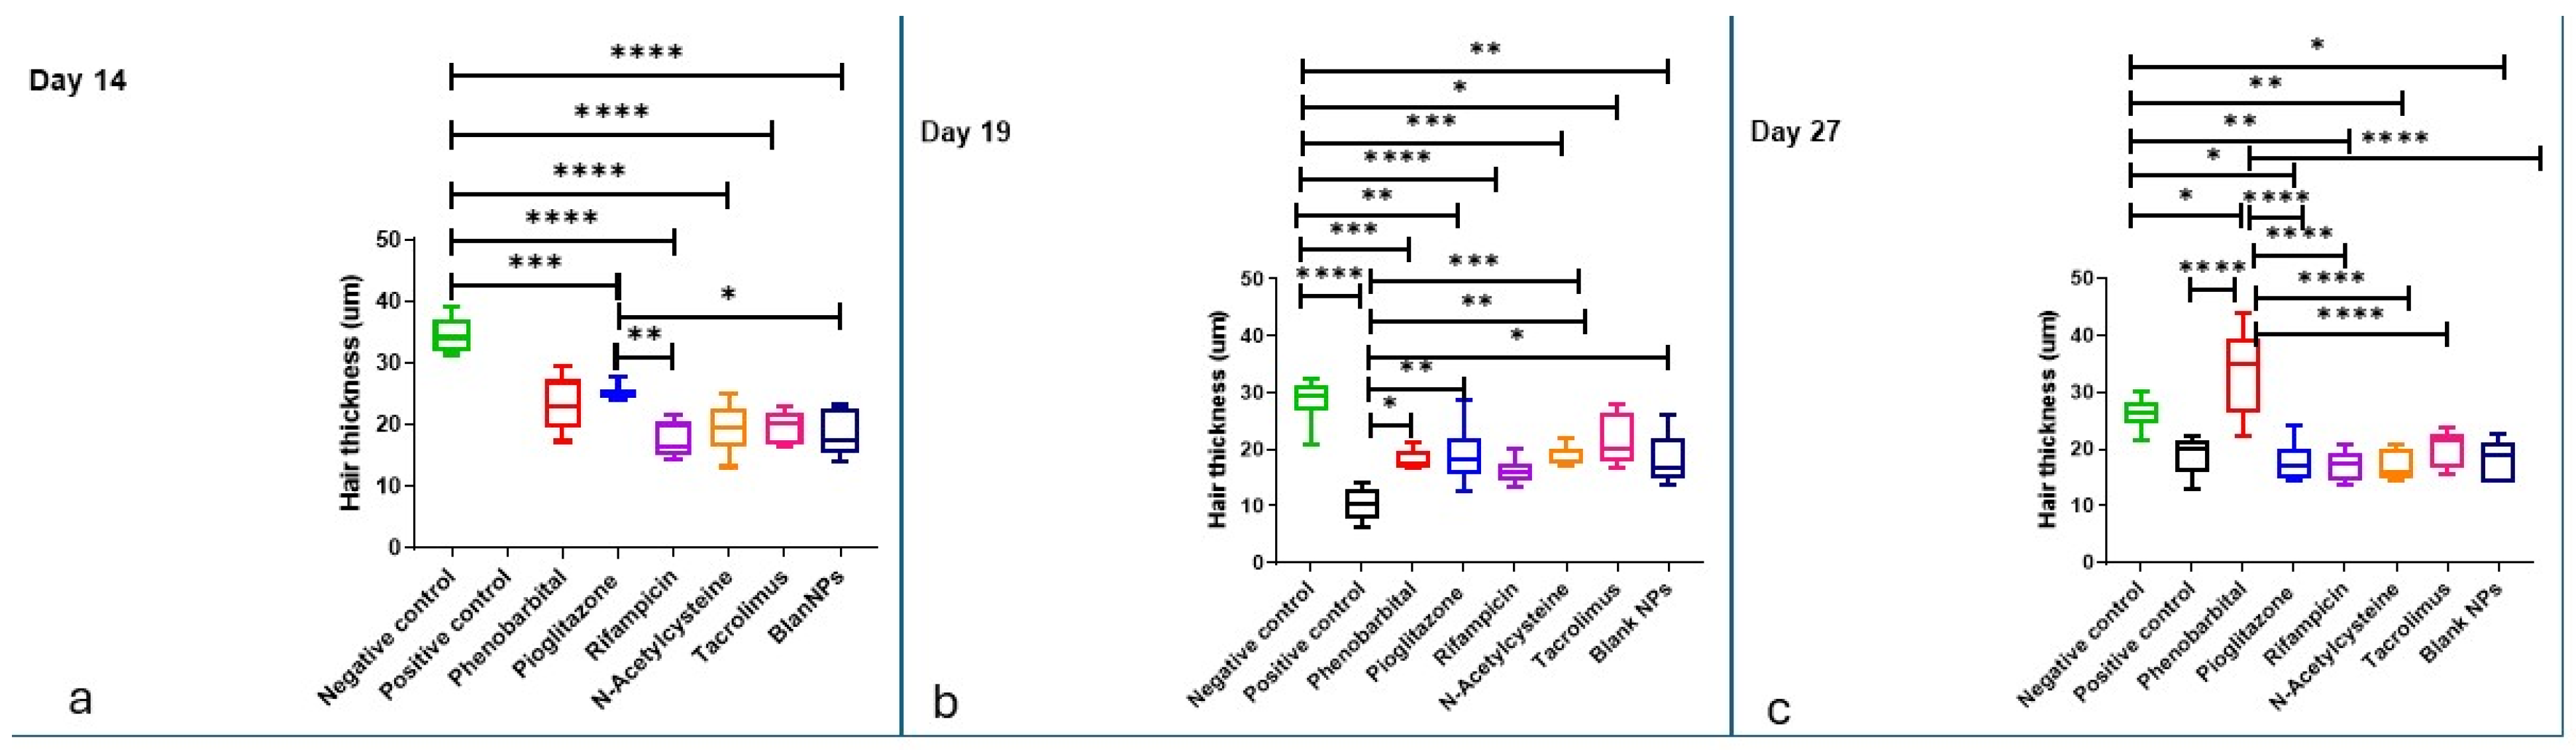
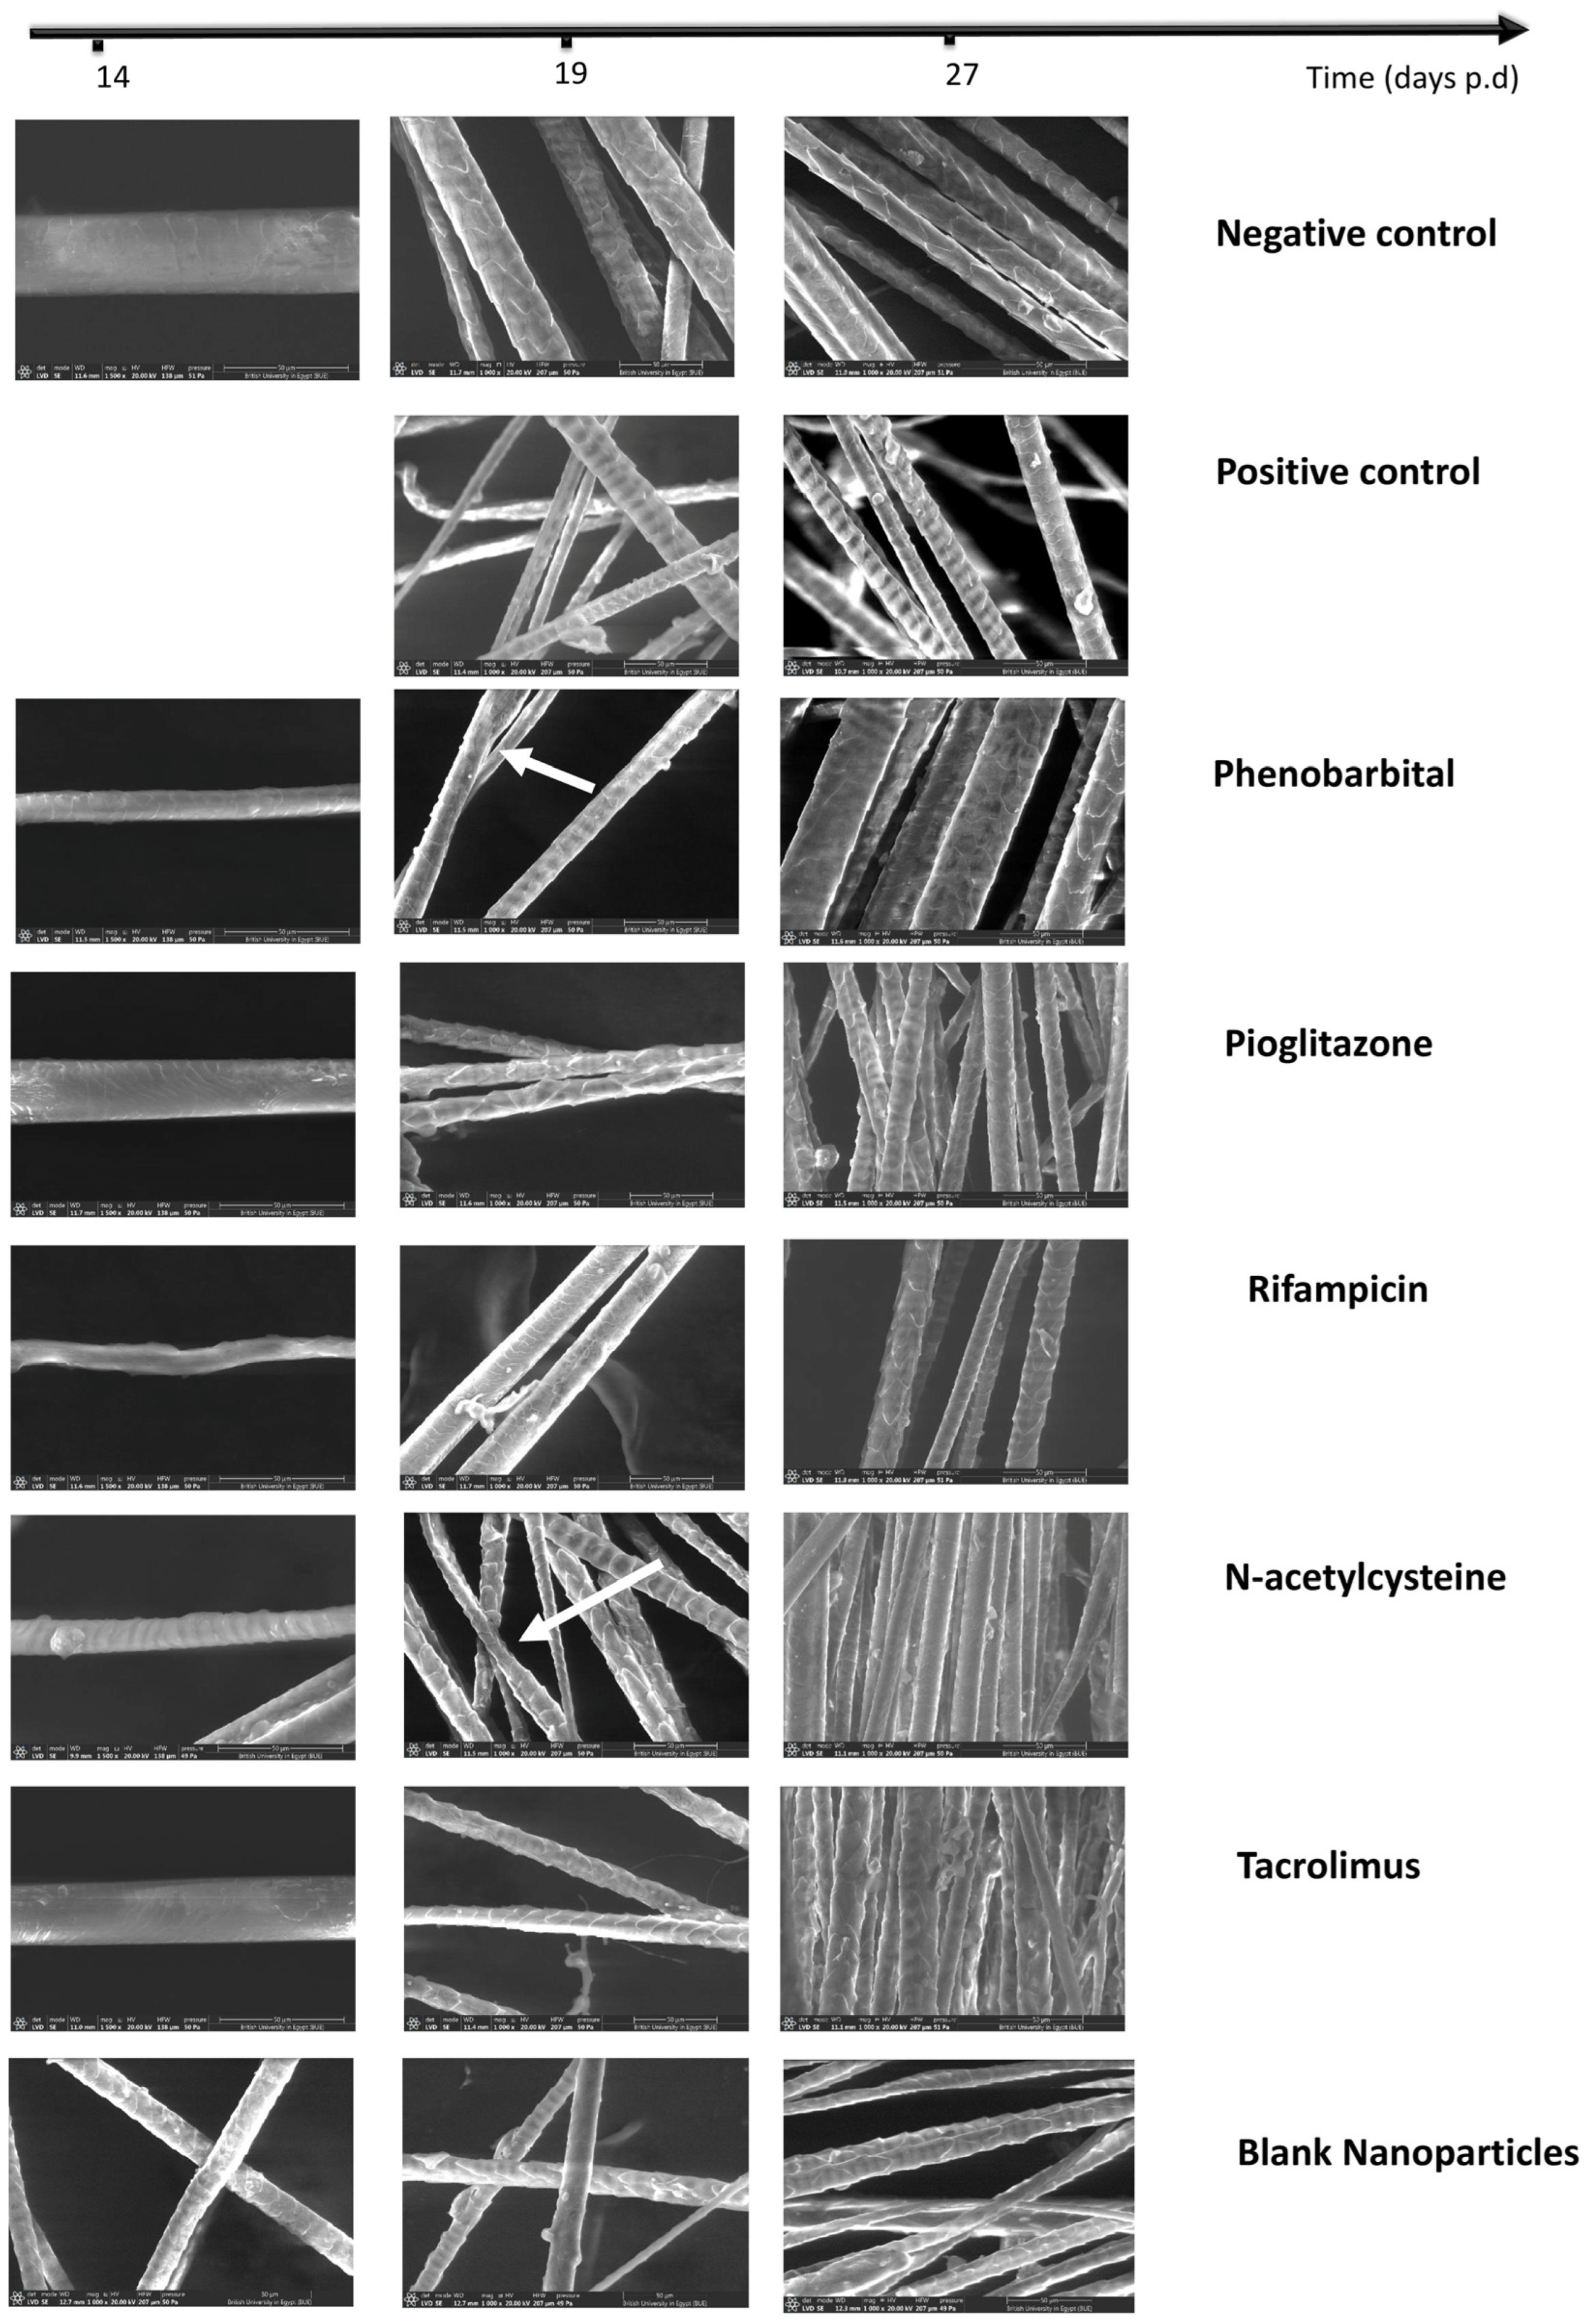
2.3.4. Hair Examination by Scanning Electron Microscope and Hair Thickness Measurement
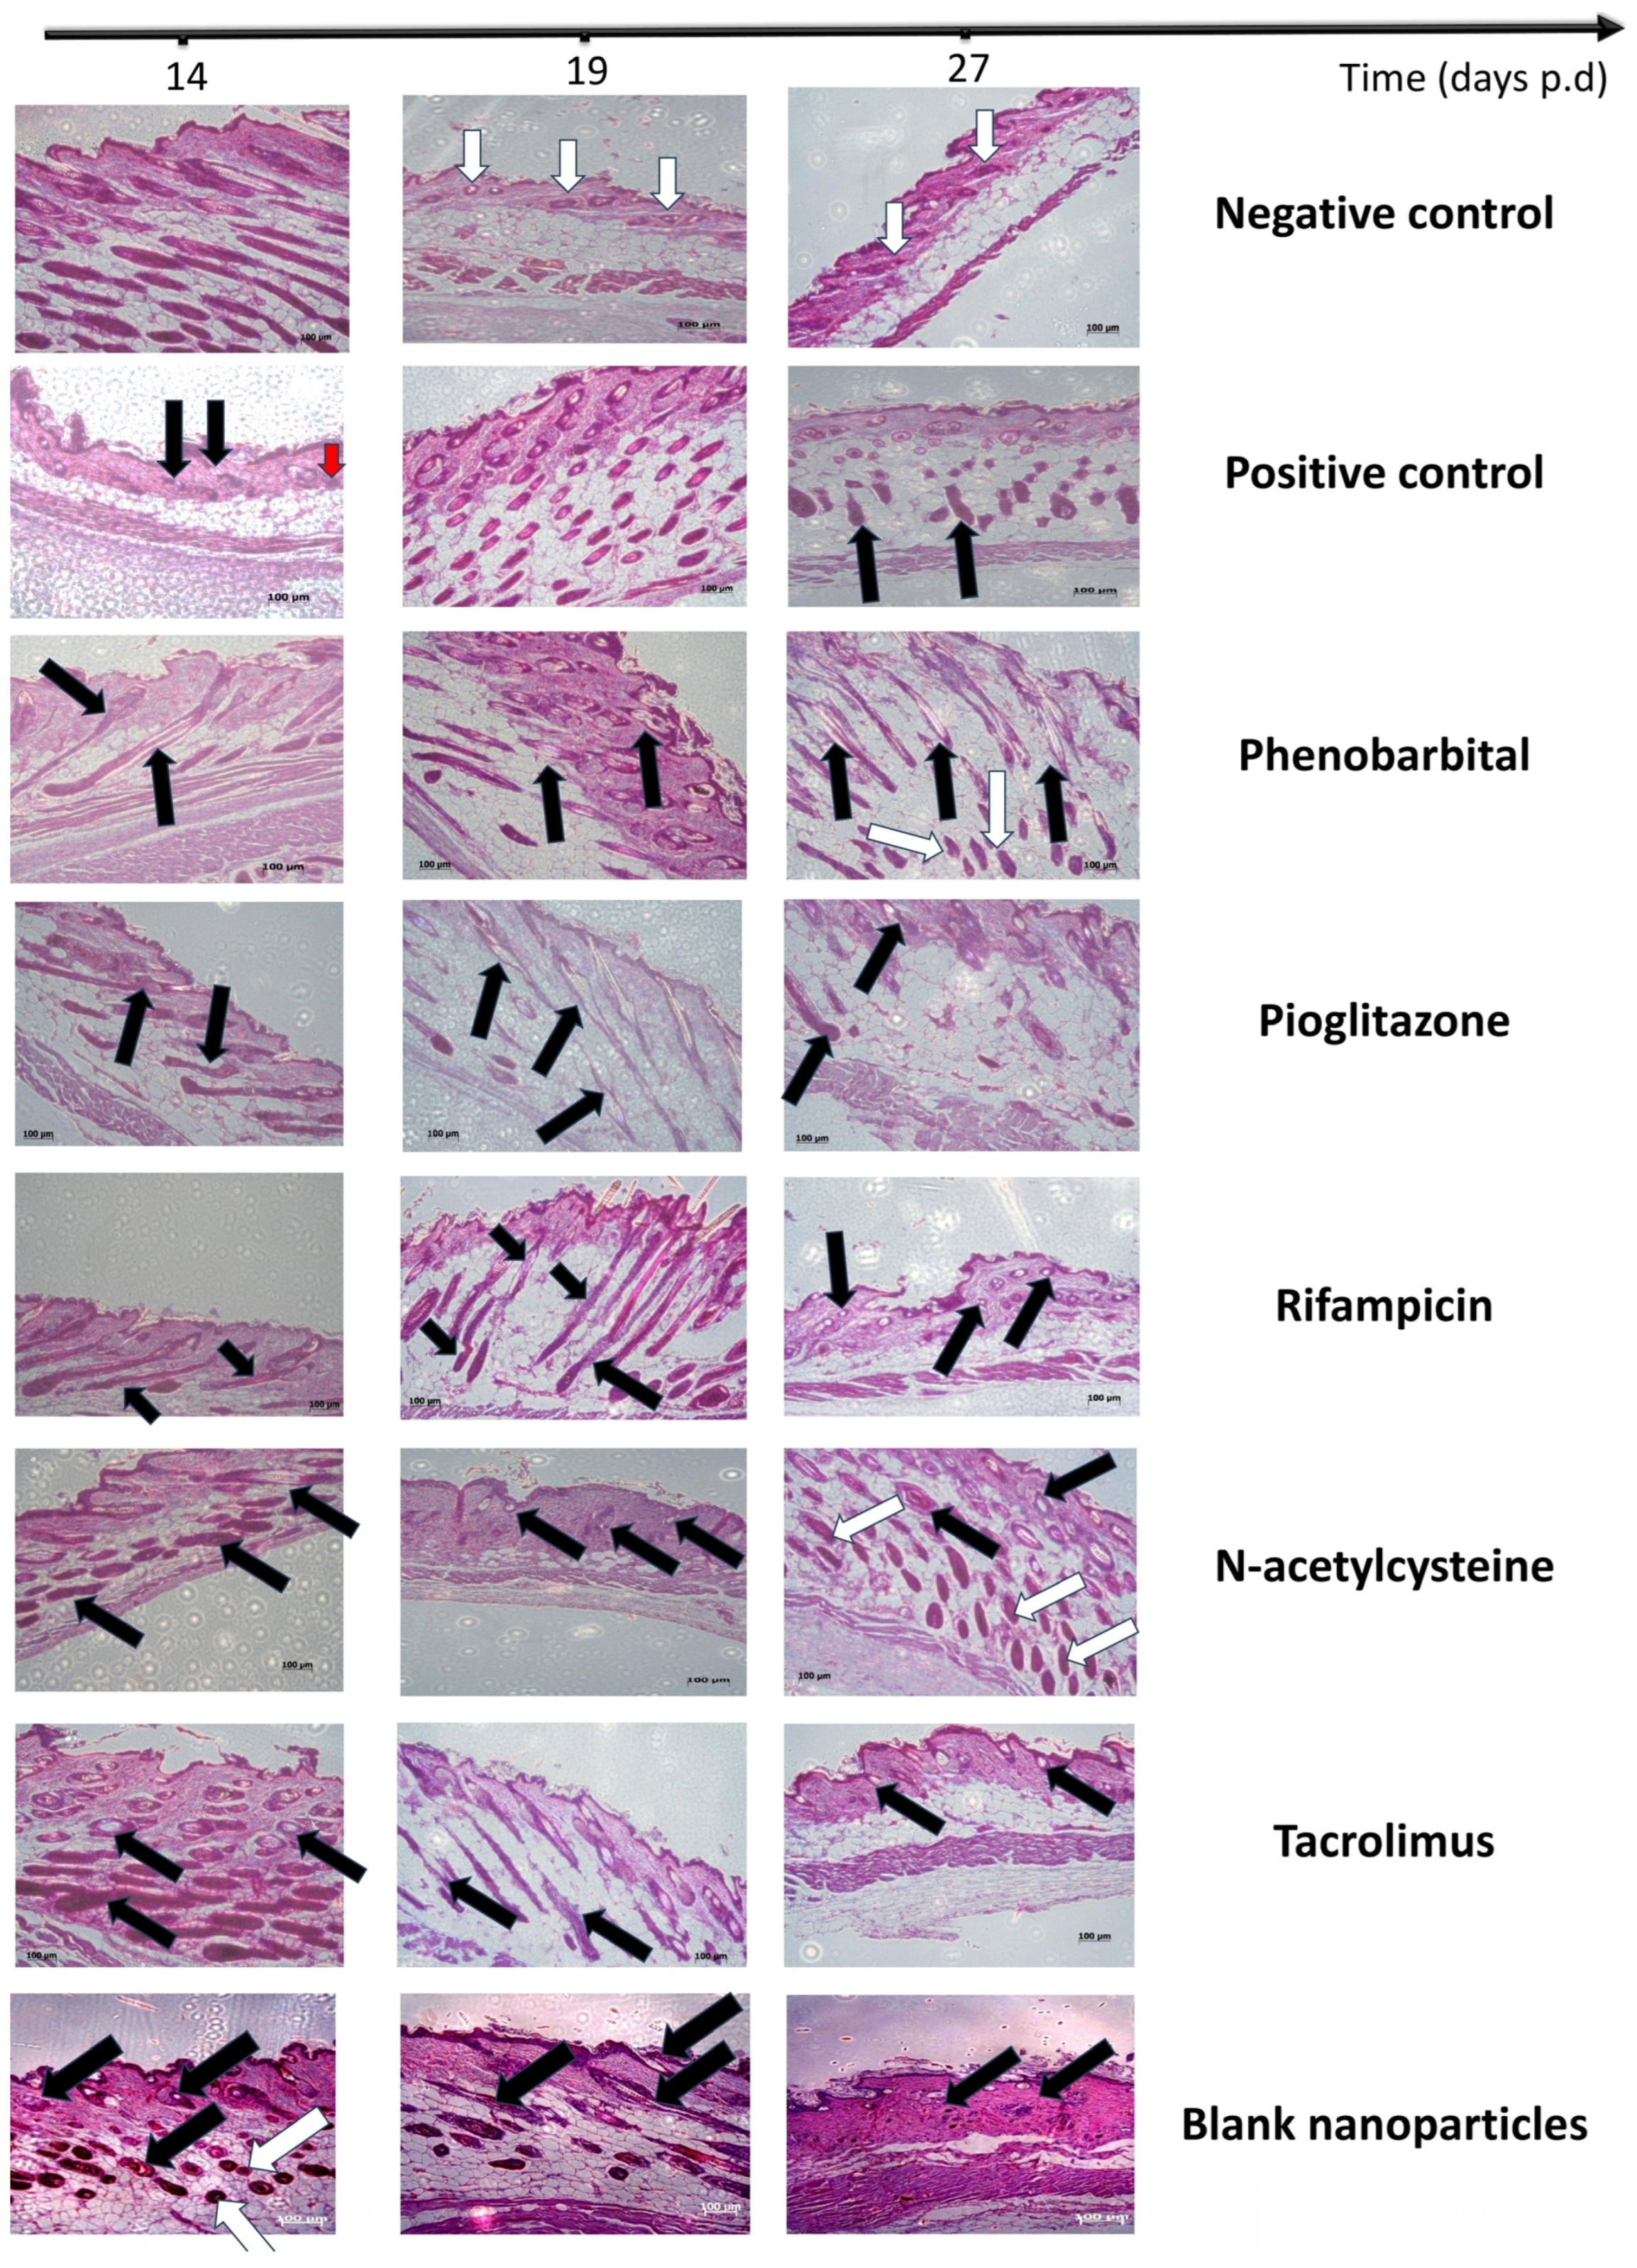
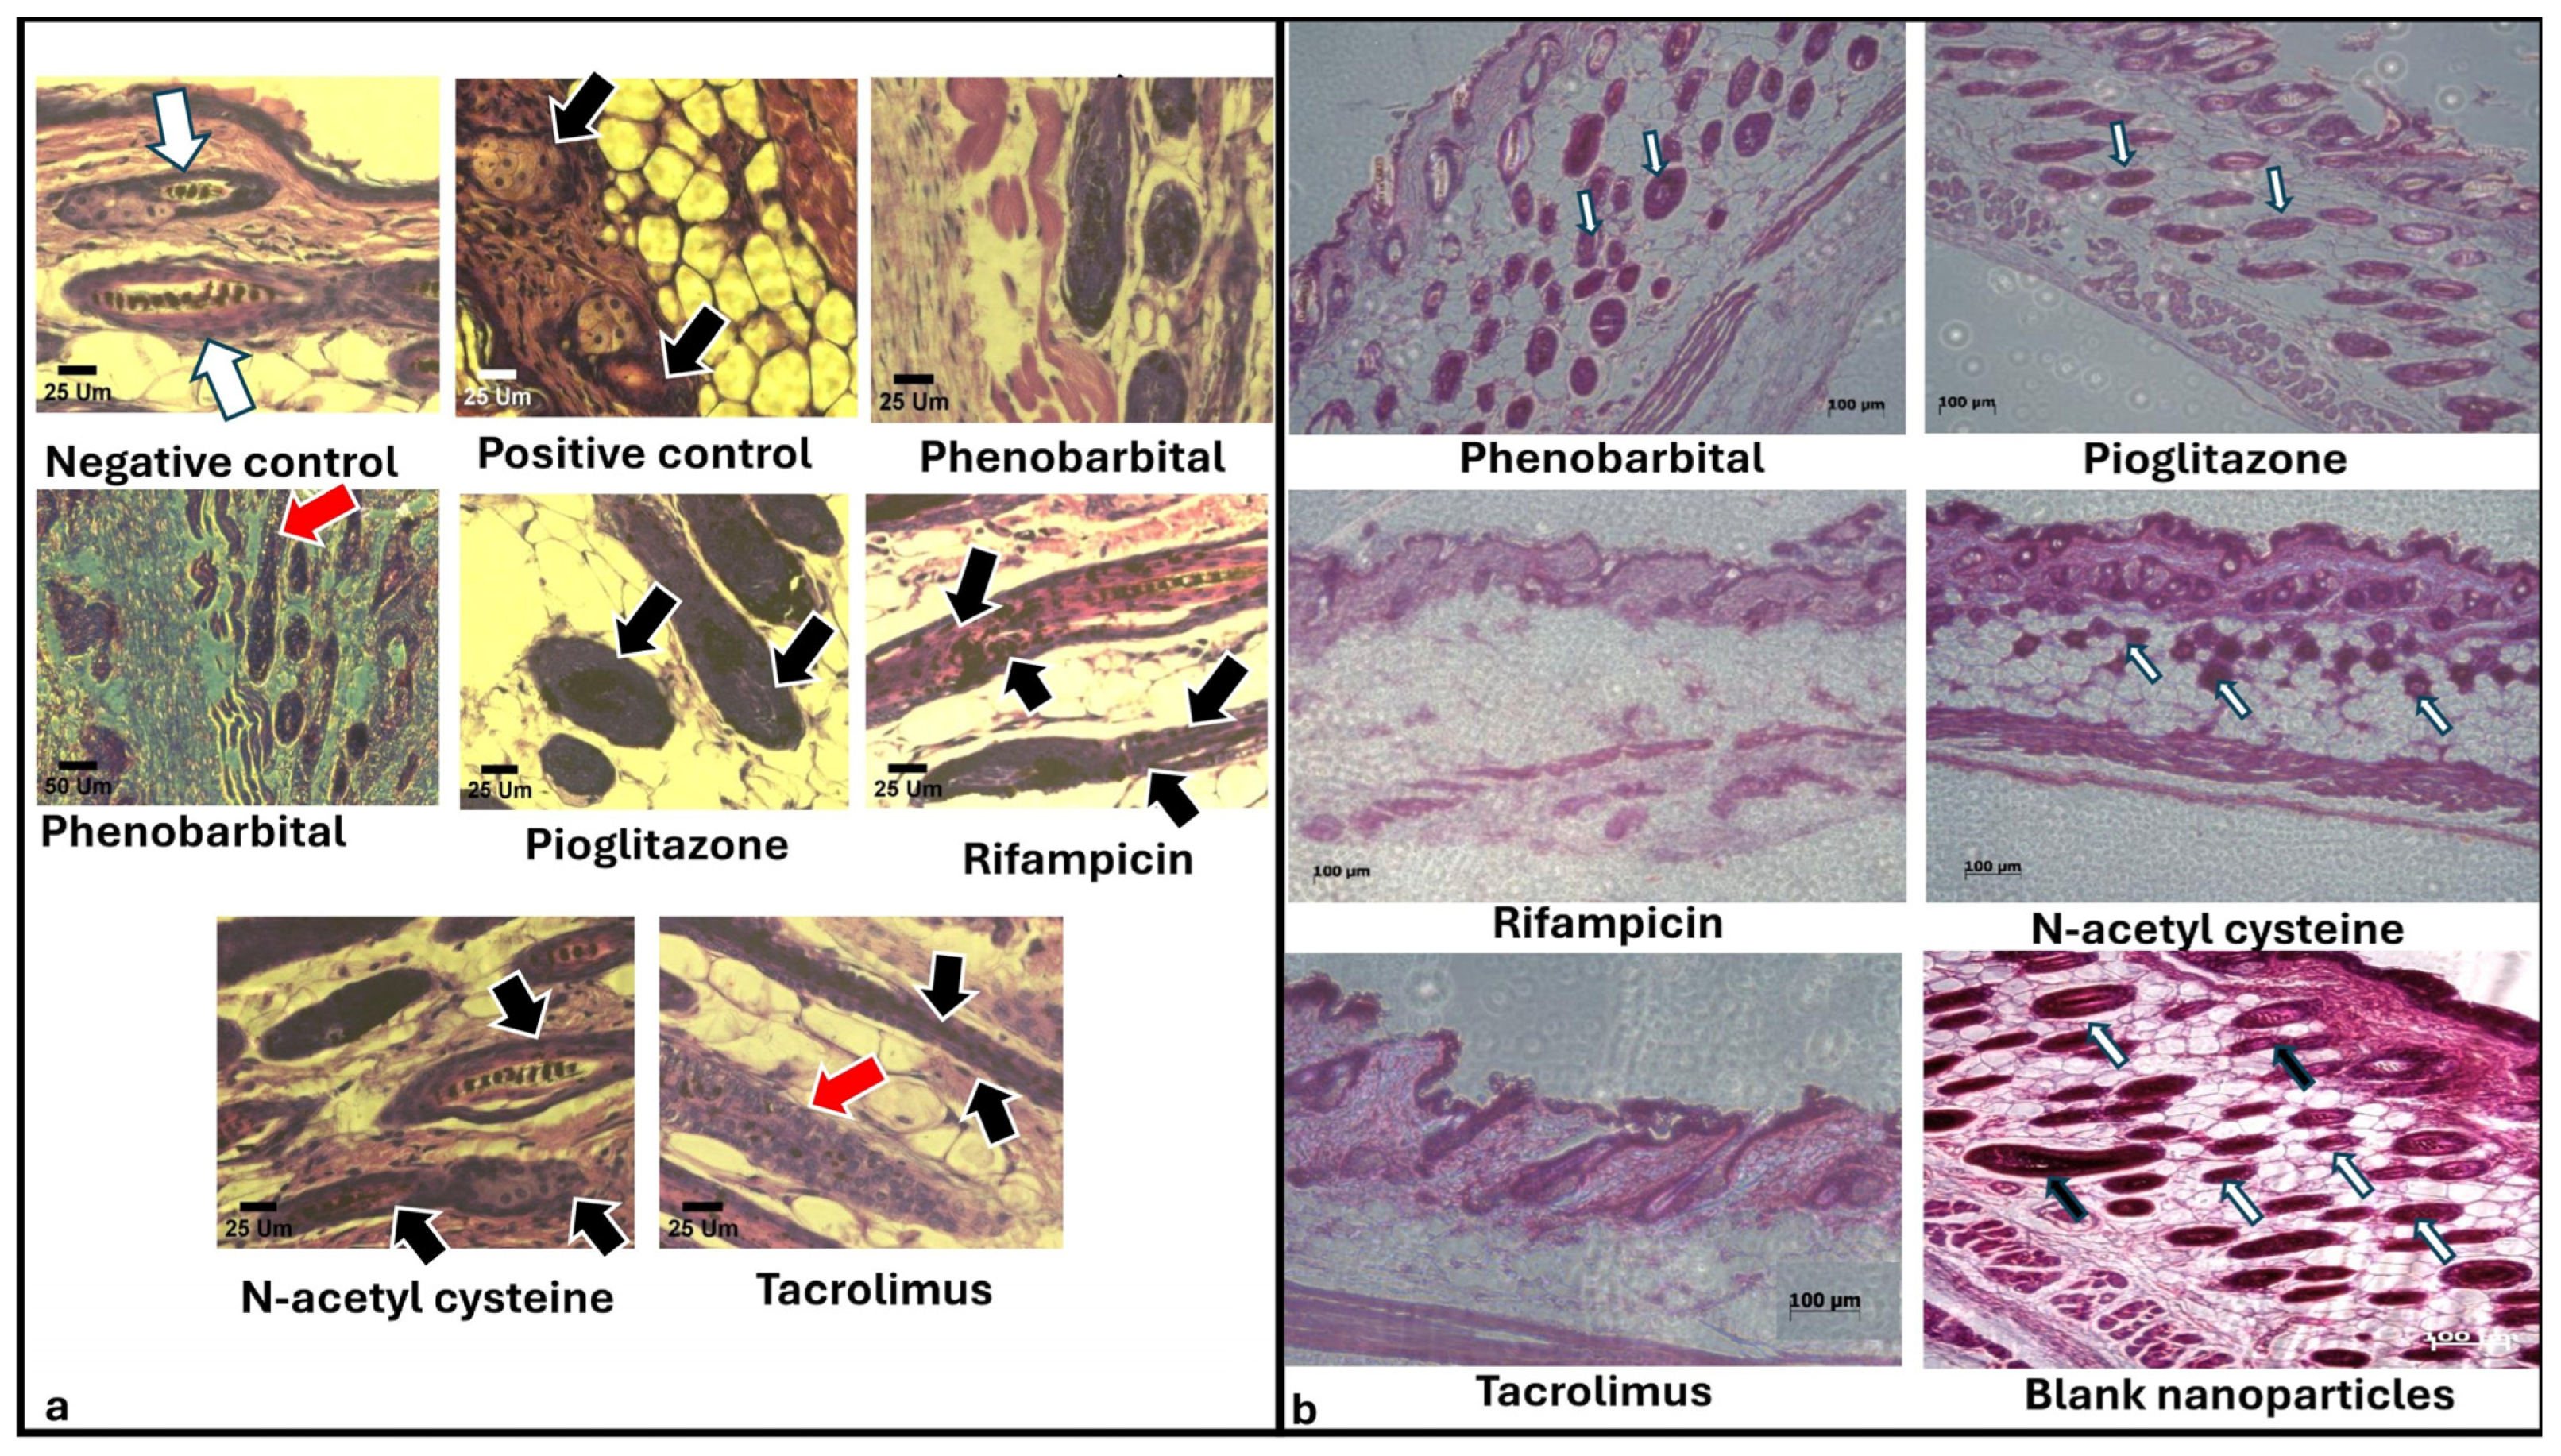
2.3.5. Histopathological Examination
3. Discussion
4. Materials and Methods
4.1. Materials
4.2. Methods
4.2.1. Preparation of Drug-Loaded Chitosan Nanoparticles
4.2.2. Nanoparticles’ Characterization
Microscopic Examination of Prepared Particles
Fourier-Transform Infrared Analysis (FT-IR)
4.2.3. In Vivo Comparison of the Efficacy of Chitosan Nanoparticles Loaded with Different Agents in the Prevention and/or Treatment of Chemotherapy-Induced Alopecia in an Animal Model
Animals
Induction of Anagen VI
Induction of Chemotherapy-Induced Alopecia
Prevention and/or Treatment of Chemotherapy-Induced Alopecia
Evaluation of the Protective/Therapeutic Effects of the Formulae Against Chemotherapy-Induced Alopecia
- Observational analysis and hair growth index scoring
- Scanning electron microscope examination
- Histopathological analysis
Statistical Analysis
5. Conclusions
Author Contributions
Funding
Institutional Review Board Statement
Informed Consent Statement
Data Availability Statement
Conflicts of Interest
Abbreviations
| ABC | ATP-binding cassette |
| ARA-c | Cytarabine |
| CAR | Constitutive androstane receptor |
| CIA | Chemotherapy-induced alopecia |
| CS | Chitosan |
| CS NPs | Chitosan nanoparticles |
| CYP | Cyclophosphamide |
| DL% | Drug loading percentage |
| EE% | Entrapment efficiency percentage |
| FT-IR | Fourier-transform infrared |
| HF | Hair follicle |
| NAC | N-acetyl cysteine |
| PGZ | Pioglitazone |
| PHB | Phenobarbital |
| PPARγ | Peroxisome proliferator-activated receptor gamma |
| PXR | Pregnane X receptor |
| PS | Particle size |
| RIF | Rifampicin |
| S.C. | Subcutaneous |
| TAC | Tacrolimus |
| TEM | Transmission electron microscope |
| ZP | Zeta potential |
Appendix A

| Drug | Chromatogram | Calibration Curve |
|---|---|---|
| Phenobarbital (PHB) | 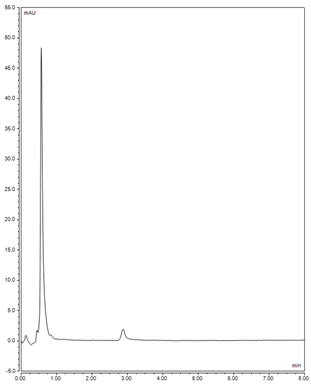 | 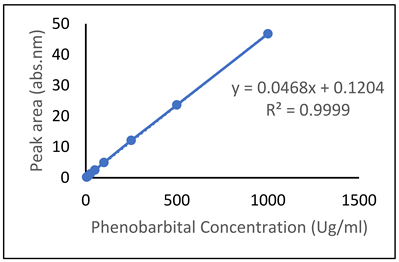 |
| Pioglitazone (PGZ) | 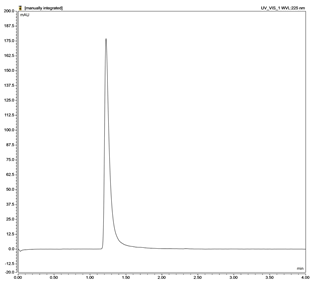 | 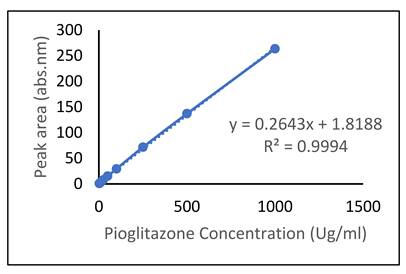 |
| Rifampicin (RIF) | 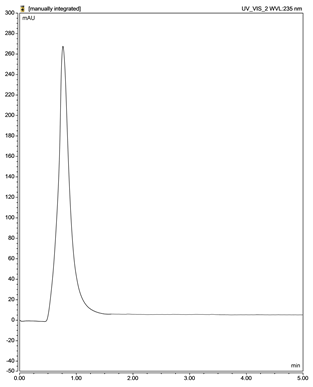 | 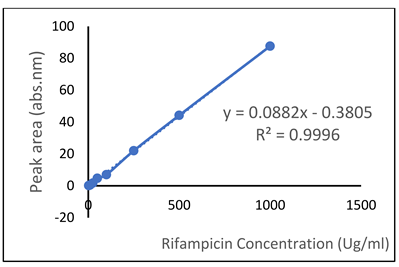 |
| N-acetylcysteine (NAC) | 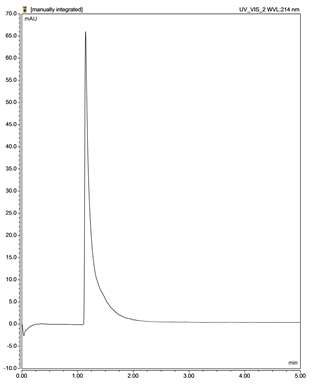 | 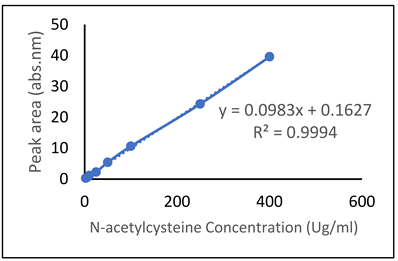 |
| Tacrolimus (TAC) | 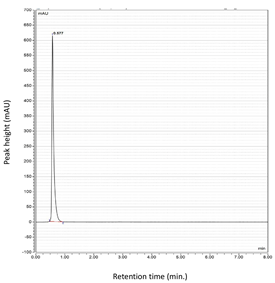 | 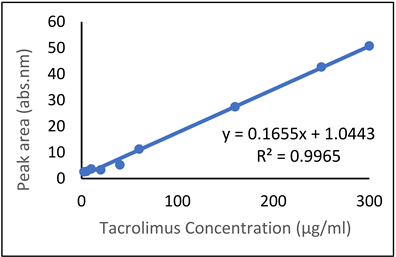 |
Appendix B
References
- Kremer, L.C.M.; Mulder, R.L.; Oeffinger, K.C.; Bhatia, S.; Landier, W.; Levitt, G.; Constine, L.S.; Wallace, W.H.; Caron, H.N.; Armenian, S.H.; et al. A Worldwide Collaboration to Harmonize Guidelines for the Long-Term Follow-up of Childhood and Young Adult Cancer Survivors: A Report from the International Late Effects of Childhood Cancer Guideline Harmonization Group. Pediatr. Blood Cancer 2013, 60, 543–549. [Google Scholar] [CrossRef] [PubMed]
- Amarillo, D.; De Boni, D.; Cuello, M. [Translated Article] Chemotherapy, Alopecia, and Scalp Cooling Systems. Actas Dermo-Sifiliogr. 2022, 113, T278–T283. [Google Scholar] [CrossRef]
- Novice, M.; Novice, T.; Henry, N.L.; Johnson, K.; Jeruss, J.S.; Kidwell, K.M.; Burness, M.L. Identifying Barriers and Facilitators to Scalp Cooling Therapy Through a National Survey of the Awareness, Practice Patterns, and Attitudes of Oncologists. JCO Oncol. Pract. 2022, 18, e225–e234. [Google Scholar] [CrossRef] [PubMed]
- Munzone, E.; Bagnardi, V.; Campennì, G.; Mazzocco, K.; Pagan, E.; Tramacere, A.; Masiero, M.; Iorfida, M.; Mazza, M.; Montagna, E.; et al. Preventing Chemotherapy-Induced Alopecia: A Prospective Clinical Trial on the Efficacy and Safety of a Scalp-Cooling System in Early Breast Cancer Patients Treated with Anthracyclines. Br. J. Cancer 2019, 121, 325–331. [Google Scholar] [CrossRef] [PubMed]
- Mitric, C.; How, B.; Matanes, E.; Amajoud, Z.; Zaaroura, H.; Nguyen, H.-H.; Tatar, A.; Salvador, S.; Gotlieb, W.H.; Lau, S. Scalp Cooling for Reducing Alopecia in Gynecology Oncology Patients Treated with Dose-Dense Chemotherapy: A Pilot Project. Gynecol. Oncol. Rep. 2021, 37, 100842. [Google Scholar] [CrossRef] [PubMed]
- Shen, X.; Ru, L.; Yao, X. Efficacy of Scalp Cooling for Prevention of Chemotherapy Induced Alopecia: A Systematic Review and Meta-Analysis. Eur. Rev. Med. Pharmacol. Sci. 2021, 25, 5090–5103. [Google Scholar] [PubMed]
- Wang, S.; Yang, T.; Shen, A.; Qiang, W.; Zhao, Z.; Zhang, F. The Scalp Cooling Therapy for Hair Loss in Breast Cancer Patients Undergoing Chemotherapy: A Systematic Review and Meta-Analysis. Support. Care Cancer 2021, 29, 6943–6956. [Google Scholar] [CrossRef] [PubMed]
- Balsari, A.; Morelli, D.; Menard, S.; Tagliabue, E.; Colnaghi, M.; Ghione, M. A New Monoclonal Antibody Recognizing Anthracyclinic Molecule. Anticancer Res. 1990, 10, 129–132. [Google Scholar] [PubMed]
- Jimenez, J.J.; Huang, H.-S.; Yunis, A.A. Treatment with ImuVert/JV-Acetylcysteine Protects Rats from Cyclophosphamide/ Cytarabine-Induced Alopecia. Cancer Investig. 1992, 10, 271–276. [Google Scholar] [CrossRef] [PubMed]
- Oguz, A.; Uslukaya, O.; Alabalık, U.; Turkoglu, A.; Kapan, M.; Bozdag, Z. Topical N-Acetylcysteine Improves Wound Healing Comparable to Dexpanthenol: An Experimental Study. Int. Surg. 2015, 100, 656–661. [Google Scholar] [CrossRef] [PubMed]
- Hussein, A.; Stuart, A.; Peters, W. Protection against Chemotherapy-Induced Alopecia by Cyclosporin A in the Newborn Rat Animal Model. Dermatology 1995, 190, 192–196. [Google Scholar] [CrossRef] [PubMed]
- Sredni, B.; Xu, R.; Albeck, M.; Gafter, U.; Gal, R.; Shani, A.; Tichler, T.; Shapira, J.; Bruderman, I.; Catane, R. The Protective Role of the Immunomodulator AS101 against Chemotherapy-induced Alopecia Studies on Human and Animal Models. Int. J. Cancer 1996, 65, 97–103. [Google Scholar] [CrossRef]
- Duvic, M.; Lemak, N.A.; Valero, V.; Hymes, S.R.; Farmer, K.L.; Hortobagyi, G.N.; Trancik, R.J.; Bandstra, B.A.; Compton, L.D. A Randomized Trial of Minoxidil in Chemotherapy-Induced Alopecia. J. Am. Acad. Dermatol. 1996, 35, 74–78. [Google Scholar] [CrossRef] [PubMed]
- Wang, J. Broad-Spectrum Protection Against Chemotherapy-Induced Alopecia by Acidic and Basic Fibroblast Growth Factors. Ph.D. Thesis, The Ohio State University, Columbus, OH, USA, 2005. [Google Scholar]
- Jimenez, J.J.; Roberts, S.M.; Mejia, J.; Mauro, L.M.; Munson, J.W.; Elgart, G.W.; Connelly, E.A.; Chen, Q.; Zou, J.; Goldenberg, C. Prevention of Chemotherapy-Induced Alopecia in Rodent Models. Cell Stress Chaperones 2008, 13, 31–38. [Google Scholar] [CrossRef] [PubMed]
- Wirta, D.; Baumann, L.; Bruce, S.; Ahluwalia, G.; Weng, E.; Daniels, S. Safety and Efficacy of Bimatoprost for Eyelash Growth in Postchemotherapy Subjects. J. Clin. Aesthetic Dermatol. 2015, 8, 11. [Google Scholar]
- Soref, C.M.; Fahl, W.E. A New Strategy to Prevent Chemotherapy and Radiotherapy-Induced Alopecia Using Topically Applied Vasoconstrictor. Int. J. Cancer 2015, 136, 195–203. [Google Scholar] [CrossRef] [PubMed]
- Patsner, B.; Harti, S. A Botanical Compound for the Treatment of Alopecia Areata and Chemotherapy-Induced Alopecia. J. Investig. Dermatol. Symp. Proc. 2020, 20, S69–S70. [Google Scholar] [CrossRef] [PubMed]
- Chon, S.Y.; Champion, R.W.; Geddes, E.R.; Rashid, R.M. Chemotherapy-Induced Alopecia. J. Am. Acad. Dermatol. 2012, 67, e37–e47. [Google Scholar] [CrossRef] [PubMed]
- Hesketh, P.J.; Batchelor, D.; Golant, M.; Lyman, G.H.; Rhodes, N.; Yardley, D. Chemotherapy-Induced Alopecia: Psychosocial Impact and Therapeutic Approaches. Support. Care Cancer 2004, 12, 543–549. [Google Scholar] [CrossRef] [PubMed]
- Wang, J.; Lu, Z.; Au, J.L.-S. Protection against Chemotherapy-Induced Alopecia. Pharm. Res. 2006, 23, 2505–2514. [Google Scholar] [CrossRef] [PubMed]
- Yeager, C.E.; Olsen, E.A. Treatment of Chemotherapy-induced Alopecia. Dermatol. Ther. 2011, 24, 432–442. [Google Scholar] [CrossRef] [PubMed]
- Rossi, A.; Caro, G.; Fortuna, M.C.; Pigliacelli, F.; D’Arino, A.; Carlesimo, M. Prevention and Treatment of Chemotherapy-Induced Alopecia. Dermatol. Pract. Concept. 2020, 10, e2020074. [Google Scholar] [CrossRef] [PubMed]
- Rubio-González, B.; Juhász, M.; Fortman, J.; Mesinkovska, N. Pathogenesis and Treatment Options for Chemotherapy-Induced Alopecia: A Systematic Review. Int. J. Dermatol. 2018, 57, 1417–1424. [Google Scholar] [CrossRef] [PubMed]
- Saleh, D.; Nassereddin, A.; Saleh, H.M.; Cook, C. Anagen Effluvium. In StatPearls [Internet]; StatPearls Publishing: Treasure Island, FL, USA, 2024. [Google Scholar]
- Shah, A.; Aftab, S.; Nisar, J.; Ashiq, M.N.; Iftikhar, F.J. Nanocarriers for Targeted Drug Delivery. J. Drug Deliv. Sci. Technol. 2021, 62, 102426. [Google Scholar] [CrossRef]
- Ghasemiyeh, P.; Mohammadi-Samani, S. Potential of Nanoparticles as Permeation Enhancers and Targeted Delivery Options for Skin: Advantages and Disadvantages. Drug Des. Dev. Ther. 2020, 14, 3271. [Google Scholar] [CrossRef] [PubMed]
- Guzmán, E.; Ortega, F.; Rubio, R.G. Chitosan: A Promising Multifunctional Cosmetic Ingredient for Skin and Hair Care. Cosmetics 2022, 9, 99. [Google Scholar] [CrossRef]
- Azuma, K.; Koizumi, R.; Izawa, H.; Morimoto, M.; Saimoto, H.; Osaki, T.; Ito, N.; Yamashita, M.; Tsuka, T.; Imagawa, T.; et al. Hair Growth-Promoting Activities of Chitosan and Surface-Deacetylated Chitin Nanofibers. Int. J. Biol. Macromol. 2019, 126, 11–17. [Google Scholar] [CrossRef] [PubMed]
- Sultankulov, B.; Berillo, D.; Sultankulova, K.; Tokay, T.; Saparov, A. Progress in the Development of Chitosan-Based Biomaterials for Tissue Engineering and Regenerative Medicine. Biomolecules 2019, 9, 470. [Google Scholar] [CrossRef] [PubMed]
- Antypenko, L.; Meyer, F.; Sadyk, Z.; Shabelnyk, K.; Kovalenko, S.; Steffens, K.G.; Garbe, L.-A. Combined Application of Tacrolimus with Cyproconazole, Hymexazol and Novel {2-(3-R-1H-1, 2, 4-Triazol-5-Yl) Phenyl} Amines as Antifungals: In Vitro Growth Inhibition and In Silico Molecular Docking Analysis to Fungal Chitin Deacetylase. J. Fungi 2023, 9, 79. [Google Scholar] [CrossRef] [PubMed]
- Price, V.H. Therapy of Alopecia Areata: On the Cusp and in the Future. J. Investig. Dermatol. Symp. Proc. 2003, 8, 207–211. [Google Scholar] [CrossRef] [PubMed]
- Price, V.H.; Willey, A.; Chen, B.K. Topical Tacrolimus in Alopecia Areata. J. Am. Acad. Dermatol. 2005, 52, 138–139. [Google Scholar] [CrossRef] [PubMed]
- Matos, B.N.; Reis, T.A.; Gratieri, T.; Gelfuso, G.M. Chitosan Nanoparticles for Targeting and Sustaining Minoxidil Sulphate Delivery to Hair Follicles. Int. J. Biol. Macromol. 2015, 75, 225–229. [Google Scholar] [CrossRef] [PubMed]
- Umar, Z.; ul Rasool, M.H.; Muhammad, S.; Yousaf, S.; Nassar, M.; Ilyas, U.; Hosna, A.U.; Parikh, A.; Bhangal, R.; Ahmed, N. Phenobarbital and Alcohol Withdrawal Syndrome: A Systematic Review and Meta-Analysis. Cureus 2023, 15, e33695. [Google Scholar] [CrossRef] [PubMed]
- Bell, D.S.; Jerkins, T. In Praise of Pioglitazone: An Economically Efficacious Therapy for Type 2 Diabetes and Other Manifestations of the Metabolic Syndrome. Diabetes Obes. Metab. 2023, 25, 3093–3102. [Google Scholar] [CrossRef] [PubMed]
- Dutta, D.; Bhattacharya, S.; Kumar, M.; Datta, P.K.; Mohindra, R.; Sharma, M. Efficacy and Safety of Novel Thiazolidinedione Lobeglitazone for Managing Type-2 Diabetes a Meta-Analysis. Diabetes Metab. Syndr. Clin. Res. Rev. 2023, 17, 102697. [Google Scholar] [CrossRef] [PubMed]
- Dan Córdoba, A.V.; Aiassa, V.; Dimmer, J.A.; Barrionuevo, C.N.; Quevedo, M.A.; Longhi, M.R.; Zoppi, A. Development and Characterization of Pharmaceutical Systems Containing Rifampicin. Pharmaceutics 2023, 15, 198. [Google Scholar] [CrossRef] [PubMed]
- Goldstein, B.P. Resistance to Rifampicin: A Review. J. Antibiot. 2014, 67, 625–630. [Google Scholar] [CrossRef] [PubMed]
- Ebert, B.; Seidel, A.; Lampen, A. Identification of BCRP as Transporter of Benzo[a]Pyrene Conjugates Metabolically Formed in Caco-2 Cells and Its Induction by Ah-Receptor Agonists. Carcinogenesis 2005, 26, 1754–1763. [Google Scholar] [CrossRef] [PubMed]
- Haslam, I.S.; Jones, K.; Coleman, T.; Simmons, N.L. Induction of P-Glycoprotein Expression and Function in Human Intestinal Epithelial Cells (T84). Biochem. Pharmacol. 2008, 76, 850–861. [Google Scholar] [CrossRef] [PubMed]
- Szatmari, I.; Vámosi, G.; Brazda, P.; Balint, B.L.; Benko, S.; Széles, L.; Jeney, V.; Özvegy-Laczka, C.; Szántó, A.; Barta, E.; et al. Peroxisome Proliferator-Activated Receptor γ-Regulated ABCG2 Expression Confers Cytoprotection to Human Dendritic Cells*. J. Biol. Chem. 2006, 281, 23812–23823. [Google Scholar] [CrossRef] [PubMed]
- Engle, K.; Kumar, G. Cancer Multidrug-Resistance Reversal by ABCB1 Inhibition: A Recent Update. Eur. J. Med. Chem. 2022, 239, 114542. [Google Scholar] [CrossRef] [PubMed]
- Sun, Y.-L.; Patel, A.; Kumar, P.; Chen, Z.-S. Role of ABC Transporters in Cancer Chemotherapy. Chin. J. Cancer 2012, 31, 51. [Google Scholar] [CrossRef] [PubMed]
- Theile, D.; Wizgall, P. Acquired ABC-Transporter Overexpression in Cancer Cells: Transcriptional Induction or Darwinian Selection? Naunyn-Schmiedeberg’s Arch. Pharmacol. 2021, 394, 1621–1632. [Google Scholar] [CrossRef] [PubMed]
- Haslam, I.S.; Pitre, A.; Schuetz, J.D.; Paus, R. Protection against Chemotherapy-Induced Alopecia: Targeting ATP-Binding Cassette Transporters in the Hair Follicle? Trends Pharmacol. Sci. 2013, 34, 599–604. [Google Scholar] [CrossRef] [PubMed]
- Kelly, G.S. Clinical Applications of N-Acetylcysteine. Altern. Med. Rev. J. Clin. Ther. 1998, 3, 114–127. [Google Scholar]
- D’Agostini, F.; Bagnasco, M.; Giunciuglio, D.; Albini, A.; De Flora, S. Inhibition by Oral N-Acetylcysteine of Doxorubicin-Induced Clastogenicity and Alopecia, and Prevention of Primary Tumors and Lung Micrometastases in Mice. Int. J. Oncol. 1998, 13, 217–241. [Google Scholar] [CrossRef] [PubMed]
- Bentata, Y. Tacrolimus: 20 Years of Use in Adult Kidney Transplantation. What We Should Know about Its Nephrotoxicity. Artif. Organs 2020, 44, 140–152. [Google Scholar] [CrossRef] [PubMed]
- Qi, X.; Wang, L.; Zhang, X.; Liu, M.; Gao, H. Topical Administration of Tacrolimus and Corticosteroids in Tapering Doses Is Effective in Preventing Immune Rejection in High-Risk Keratoplasty: A 5-Year Follow-up Study. BMC Ophthalmol. 2022, 22, 101. [Google Scholar] [CrossRef] [PubMed]
- Fereig, S.A.; El-Zaafarany, G.M.; Arafa, M.G.; Abdel-Mottaleb, M.M. Boosting the Anti-Inflammatory Effect of Self-Assembled Hybrid Lecithin–Chitosan Nanoparticles via Hybridization with Gold Nanoparticles for the Treatment of Psoriasis: Elemental Mapping and in Vivo Modeling. Drug Deliv. 2022, 29, 1726–1742. [Google Scholar] [CrossRef] [PubMed]
- Fereig, S.A.; El-Zaafarany, G.M.; Arafa, M.G.; Abdel-Mottaleb, M.M. Tacrolimus-Loaded Chitosan Nanoparticles for Enhanced Skin Deposition and Management of Plaque Psoriasis. Carbohydr. Polym. 2021, 268, 118238. [Google Scholar] [CrossRef] [PubMed]
- Fereig, S.A.; El-Zaafarany, G.M.; Arafa, M.G.; Abdel-Mottaleb, M.M. Self-Assembled Tacrolimus-Loaded Lecithin-Chitosan Hybrid Nanoparticles for in Vivo Management of Psoriasis. Int. J. Pharm. 2021, 608, 121114. [Google Scholar] [CrossRef] [PubMed]
- Gauthier, Y.; Almasi-Nasrabadi, M.; Cario-André, M.; Pain, C.; Rakhshan, A.; Ghalamkarpour, F. Tacrolimus (FK506) Ointment Combined with Nb-UVB Could Activate Both Hair Follicle (HF) and Dermal Melanocyte Precursors in Vitiligo: The First Histopathological and Clinical Study. Arch. Dermatol. Res. 2021, 313, 383–388. [Google Scholar] [CrossRef] [PubMed]
- Barton, V.R.; Toussi, A.; Awasthi, S.; Kiuru, M. Treatment of Pediatric Alopecia Areata: A Systematic Review. J. Am. Acad. Dermatol. 2022, 86, 1318–1334. [Google Scholar] [CrossRef] [PubMed]
- Ullah, F.; Dawood, M.; Noor, N.; Hameed, S. Efficacy of Topical Clobetasol Propionate 0.05% Ointment and Topical Tacrolimus 0.1% Ointment in Treatment of Alopecia Areata.: RCT. Pak. J. Med. Health Sci. 2022, 16, 133. [Google Scholar] [CrossRef]
- Mounessa, J.; Caravaglio, J.V.; Domozych, R.; Chapman, S.; Dellavalle, R.P.; Dunnick, C.A.; Norris, D. Commonly Prescribed Medications Associated with Alopecia. J. Am. Acad. Dermatol. 2023, 88, 1326–1337.e2. [Google Scholar] [CrossRef] [PubMed]
- Tran, Q.H.D.; Guay, E.; Chartier, S.; Tousignant, J. Tacrolimus in Dermatology. J. Cutan. Med. Surg. 2001, 5, 329–335. [Google Scholar] [CrossRef] [PubMed]
- Balsari, A.L.; Morelli, D.; Ménard, S.; Veronesi, U.; Colnaghi, M.I. Protection against Doxorubicin-Induced Alopecia in Rats by Liposome-Entrapped Monoclonal Antibodies. FASEB J. 1994, 8, 226–230. [Google Scholar] [CrossRef] [PubMed]
- Villasante, A.; Herskovitz, I.; Mauro, L.; Jimenez, J. Chemotherapy-Induced Alopecia. J. Clin. Investig. Dermatol. 2014, 2, 8. [Google Scholar]
- Yoshizawa, K.; Nambu, H.; Yamamoto, D.; Yang, J.; Kiyozuka, Y.; Shikata, N.; Tsubura, A. Time-specific Occurrence of Alopecia in Neonatal C57BL Mice Treated with N-methyl-N-nitrosourea and the Therapeutic Efficacy of Tacrolimus Hydrate. Pathol. Int. 2000, 50, 175–184. [Google Scholar] [CrossRef] [PubMed]
- Scioli-Montoto, S.; Sbaraglini, M.L.; Cisneros, J.S.; Chain, C.Y.; Ferretti, V.; León, I.E.; Alvarez, V.A.; Castro, G.R.; Islan, G.A.; Talevi, A. Novel Phenobarbital-Loaded Nanostructured Lipid Carriers for Epilepsy Treatment: From QbD to in Vivo Evaluation. Front. Chem. 2022, 10, 908386. [Google Scholar] [CrossRef] [PubMed]
- Faiz, S.; Arshad, S.; Kamal, Y.; Imran, S.; Asim, M.H.; Mahmood, A.; Inam, S.; Irfan, H.M.; Riaz, H. Pioglitazone-Loaded Nanostructured Lipid Carriers: In-Vitro and in-Vivo Evaluation for Improved Bioavailability. J. Drug Deliv. Sci. Technol. 2023, 79, 104041. [Google Scholar] [CrossRef]
- Esmaeili, A.; Khodaei, M. Encapsulation of Rifampin in a Polymeric Layer-by-layer Structure for Drug Delivery. J. Biomed. Mater. Res. Part A 2018, 106, 905–913. [Google Scholar] [CrossRef] [PubMed]
- Puri, V.; Chaudhary, K.R.; Singh, A.; Singh, C. Inhalation Potential of N-Acetylcysteine Loaded PLGA Nanoparticles for the Management of Tuberculosis: In Vitro Lung Deposition and Efficacy Studies. Curr. Res. Pharmacol. Drug Discov. 2022, 3, 100084. [Google Scholar] [CrossRef] [PubMed]
- Mohamad, E.A.; Ali, A.A.; Sharaky, M.; El-Gebaly, R.H. Niosomes Loading N-Acetyl-L-Cysteine for Cancer Treatment in Vivo Study. Naunyn-Schmiedeberg’s Arch. Pharmacol. 2024, 397, 4339–4353. [Google Scholar] [CrossRef] [PubMed]
- Ponnammal, P.; Kanaujia, P.; Yani, Y.; Ng, W.K.; Tan, R.B.H. Orally Disintegrating Tablets Containing Melt Extruded Amorphous Solid Dispersion of Tacrolimus for Dissolution Enhancement. Pharmaceutics 2018, 10, 35. [Google Scholar] [CrossRef] [PubMed]
- Sasirekha, R.; Sivasankari, G.; Gunasekaran, S.; Manimaran, N.; Santhanalakshmi, K.; Gomathi, T. Biosorption Studies on the Removal of Heavy Metals Copper and Chromium Using Chitosan Nanoparticles Based Biocomposite. Eur. Chem. Bull. 2023, 12, 1173–1203. [Google Scholar]
- Hendrix, S.; Handjiski, B.; Peters, E.M.J.; Paus, R. A Guide to Assessing Damage Response Pathways of the Hair Follicle: Lessons From Cyclophosphamide-Induced Alopecia in Mice. J. Investig. Dermatol. 2005, 125, 42–51. [Google Scholar] [CrossRef] [PubMed]
- Müller-Röver, S.; Foitzik, K.; Paus, R.; Handjiski, B.; van der Veen, C.; Eichmüller, S.; McKay, I.A.; Stenn, K.S. A Comprehensive Guide for the Accurate Classification of Murine Hair Follicles in Distinct Hair Cycle Stages. J. Investig. Dermatol. 2001, 117, 3–15. [Google Scholar] [CrossRef] [PubMed]
- Hammond, N.; Headon, D.; Dixon, J. The Cell Cycle Regulator Protein 14-3-3 Is Essential for Hair Follicle Integrity and Epidermal Homeostasis. J. Investig. Dermatol. 2012, 132, 1543–1553. [Google Scholar] [CrossRef] [PubMed]
- Behrendt, K.; Klatte, J.; Pofahl, R.; Bloch, W.; Smyth, N.; Tscharntke, M.; Krieg, T.; Paus, R.; Niessen, C.; Niemann, C.; et al. A Function for Rac1 in the Terminal Differentiation and Pigmentation of Hair. J. Cell Sci. 2012, 125, 896–905. [Google Scholar] [CrossRef] [PubMed]
- Ohnemus, U.; Paus, R.; Ünalan, M.; Handjiski, B. Topical Estrogen Accelerates Hair Regrowth in Mice After Chemotherapy-Induced Alopecia by Favoring the Dystrophic Catagen Response Pathway to Damage. J. Investig. Dermatol. 2004, 122, 7–13. [Google Scholar] [CrossRef] [PubMed]
- Nwe, N.; Furuike, T.; Tamura, H. The Mechanical and Biological Properties of Chitosan Scaffolds for Tissue Regeneration Templates Are Significantly Enhanced by Chitosan from Gongronella Butleri. Materials 2009, 2, 374–398. [Google Scholar] [CrossRef]
- Ribeiro, J.C.V.; Vieira, R.S.; Melo, I.M.; Araújo, V.M.A.; Lima, V. Versatility of Chitosan-Based Biomaterials and Their Use as Scaffolds for Tissue Regeneration. Sci. World J. 2017, 2017, 8639898. [Google Scholar] [CrossRef] [PubMed]
- Sukpaita, T.; Chirachanchai, S.; Pimkhaokham, A.; Ampornaramveth, R.S. Chitosan-Based Scaffold for Mineralized Tissues Regeneration. Mar. Drugs 2021, 19, 551. [Google Scholar] [CrossRef] [PubMed]
- Xu, C.; Lei, C.; Meng, L.; Wang, C.; Song, Y. Chitosan as a Barrier Membrane Material in Periodontal Tissue Regeneration. J. Biomed. Mater. Res. Part B Appl. Biomater. 2012, 100, 1435–1443. [Google Scholar] [CrossRef] [PubMed]
- Calvo, P.; Remunan-Lopez, C.; Vila-Jato, J.L.; Alonso, M. Novel Hydrophilic Chitosan-polyethylene Oxide Nanoparticles as Protein Carriers. J. Appl. Polym. Sci. 1997, 63, 125–132. [Google Scholar] [CrossRef]
- Phenobarbital, CID 4763. 2023. Available online: https://pubchem.ncbi.nlm.nih.gov/compound/4763 (accessed on 29 May 2025).
- Pioglitazone, CID 4829. 2023. Available online: https://pubchem.ncbi.nlm.nih.gov/compound/4829 (accessed on 29 May 2025).
- Rifampin, CID 135398735. 2023. Available online: https://pubchem.ncbi.nlm.nih.gov/compound/135398735 (accessed on 29 May 2025).
- Acetylcysteine, CID 12035. 2023. Available online: https://pubchem.ncbi.nlm.nih.gov/compound/12035 (accessed on 29 May 2025).
- Tacrolimus, CID 445643. 2023. Available online: https://pubchem.ncbi.nlm.nih.gov/compound/445643 (accessed on 29 May 2025).
- Martínez, F.; Jouyban, A.; Acree, W.E. Solubility of Phenobarbital in Aqueous Cosolvent Mixtures Revisited: IKBI Preferential Solvation Analysis. Phys. Chem. Liq. 2017, 55, 432–443. [Google Scholar] [CrossRef]
- Yu, S.; Xu, X.; Feng, J.; Liu, M.; Hu, K. Chitosan and Chitosan Coating Nanoparticles for the Treatment of Brain Disease. Int. J. Pharm. 2019, 560, 282–293. [Google Scholar] [CrossRef] [PubMed]
- Jouyban, A.; Soltanpour, S. Solubility of Pioglitazone Hydrochloride in Binary and Ternary Mixtures of Water, Propylene Glycol, and Polyethylene Glycols 200, 400, and 600 at 298.2 K. AAPS PharmSciTech 2010, 11, 1713–1717. [Google Scholar] [CrossRef] [PubMed]
- Sharma, D.K.; Pattnaik, G.; Behera, A. Preparation and In-Vitro, in-Vivo Characterisation of Pioglitazone Loaded Chitosan/PEG Blended PLGA Biocompatible Nanoparticles. J. Biomater. Sci. Polym. Ed. 2022, 33, 1623–1643. [Google Scholar] [CrossRef] [PubMed]
- Lupascu, F.; Constantin, S.M.; Profire, B.S.; Vasincu, I.; Ionescu, O.M.; Iacob, A.T.; Iurascu, T.; Ababei, A.; Aprotosoaei, M.; Jitareanu, A. Design and optimization method for obtaining pioglitazone and curcumin-loaded chitosan nanoparticles. Med.-Surg. J. 2022, 126, 126–134. [Google Scholar] [CrossRef]
- Jojo, G.M.; Kuppusamy, G. Scope of New Formulation Approaches in the Repurposing of Pioglitazone for the Management of Alzheimer’s Disease. J. Clin. Pharm. Ther. 2019, 44, 337–348. [Google Scholar] [CrossRef] [PubMed]
- Holstege, C.P. Rifampin. In Encyclopedia of Toxicology, 3rd ed.; Wexler, P., Ed.; Academic Press: Oxford, UK, 2014; pp. 134–136. ISBN 978-0-12-386455-0. [Google Scholar]
- Chaubey, P.; Mishra, B. Mannose-Conjugated Chitosan Nanoparticles Loaded with Rifampicin for the Treatment of Visceral Leishmaniasis. Carbohydr. Polym. 2014, 101, 1101–1108. [Google Scholar] [CrossRef] [PubMed]
- Dhamane, S.P.; Jagdale, S.C. Development of Rifampicin Loaded Chitosan Nanoparticles by 32 Full Factorial Design. Res. J. Pharm. Technol. 2020, 13, 2545–2550. [Google Scholar] [CrossRef]
- Ghosh, R.; Mondal, S.; Mukherjee, D.; Adhikari, A.; Ahmed, S.A.; Alsantali, R.I.; Khder, A.S.; Altass, H.M.; Moussa, Z.; Das, R. Oral Drug Delivery Using a Polymeric Nanocarrier: Chitosan Nanoparticles in the Delivery of Rifampicin. Mater. Adv. 2022, 3, 4622–4628. [Google Scholar] [CrossRef]
- Patel, B.K.; Parikh, R.H.; Aboti, P.S. Development of Oral Sustained Release Rifampicin Loaded Chitosan Nanoparticles by Design of Experiment. J. Drug Deliv. 2013, 2013, 370938. [Google Scholar] [CrossRef] [PubMed]
- Petkar, K.C.; Chavhan, S.; Kunda, N.; Saleem, I.; Somavarapu, S.; Taylor, K.M.; Sawant, K.K. Development of Novel Octanoyl Chitosan Nanoparticles for Improved Rifampicin Pulmonary Delivery: Optimization by Factorial Design. AAPS PharmSciTech 2018, 19, 1758–1772. [Google Scholar] [CrossRef] [PubMed]
- Rawal, T.; Parmar, R.; Tyagi, R.K.; Butani, S. Rifampicin Loaded Chitosan Nanoparticle Dry Powder Presents an Improved Therapeutic Approach for Alveolar Tuberculosis. Colloids Surf. B Biointerfaces 2017, 154, 321–330. [Google Scholar] [CrossRef] [PubMed]
- Scolari, I.R.; Páez, P.L.; Musri, M.M.; Petiti, J.P.; Torres, A.; Granero, G.E. Rifampicin Loaded in Alginate/Chitosan Nanoparticles as a Promising Pulmonary Carrier against Staphylococcus Aureus. Drug Deliv. Transl. Res. 2020, 10, 1403–1417. [Google Scholar] [CrossRef] [PubMed]
- Paulazzi, A.R.; Alves, B.O.; Zilli, G.A.L.; dos Santos, A.E.; Petry, F.; Soares, K.D.; Danielli, L.J.; Pedroso, J.; Apel, M.A.; Aguiar, G.P.S.; et al. Curcumin and N-Acetylcysteine Cocrystal Produced with Supercritical Solvent: Characterization, Solubility, and Preclinical Evaluation of Antinociceptive and Anti-Inflammatory Activities. Inflammopharmacology 2022, 30, 327–341. [Google Scholar] [CrossRef] [PubMed]
- Loh, J.W.; Schneider, J.; Carter, M.; Saunders, M.; Lim, L.-Y. Spinning Disc Processing Technology: Potential for Large-Scale Manufacture of Chitosan Nanoparticles. J. Pharm. Sci. 2010, 99, 4326–4336. [Google Scholar] [CrossRef] [PubMed]
- Picchi, V.; Gobbi, S.; Fattizzo, M.; Zefelippo, M.; Faoro, F. Chitosan Nanoparticles Loaded with N-Acetyl Cysteine to Mitigate Ozone and Other Possible Oxidative Stresses in Durum Wheat. Plants 2021, 10, 691. [Google Scholar] [CrossRef] [PubMed]
- Singh, S.; Wairkar, S. Long-Circulating Thiolated Chitosan Nanoparticles of Nintedanib with N-Acetyl Cysteine for Treating Idiopathic Pulmonary Fibrosis: In Vitro Assessment of Cytotoxicity, Antioxidant, and Antifibrotic Potential. Int. J. Pharm. 2023, 644, 123322. [Google Scholar] [CrossRef] [PubMed]
- Li, J.; Tan, G.; Cheng, B.; Liu, D.; Pan, W. Transport Mechanism of Chitosan-N-Acetylcysteine, Chitosan Oligosaccharides or Carboxymethyl Chitosan Decorated Coumarin-6 Loaded Nanostructured Lipid Carriers across the Rabbit Ocular. Eur. J. Pharm. Biopharm. 2017, 120, 89–97. [Google Scholar] [CrossRef] [PubMed]
- Schuerer, N.; Stein, E.; Inic-Kanada, A.; Ghasemian, E.; Stojanovic, M.; Montanaro, J.; Bintner, N.; Hohenadl, C.; Sachsenhofer, R.; Barisani-Asenbauer, T. Effects of Chitosan and Chitosan N-Acetylcysteine Solutions on Conjunctival Epithelial Cells. J. EuCornea 2018, 1, 12–18. [Google Scholar] [CrossRef]
- Taheri, S.L.; Rezazadeh, M.; Hassanzadeh, F.; Akbari, V.; Dehghani, A.; Talebi, A.; Mostafavi, S.A. Preparation, Physicochemical, and Retinal Anti-Angiogenic Evaluation of Poloxamer Hydrogel Containing Dexamethasone/Avastin-Loaded Chitosan-N-Acetyl-L-Cysteine Nanoparticles. Int. J. Biol. Macromol. 2022, 220, 1605–1618. [Google Scholar] [CrossRef] [PubMed]
- Wang, X.; Zheng, C.; Wu, Z.; Teng, D.; Zhang, X.; Wang, Z.; Li, C. Chitosan-NAC Nanoparticles as a Vehicle for Nasal Absorption Enhancement of Insulin. J. Biomed. Mater. Res. Part B Appl. Biomater. 2009, 88, 150–161. [Google Scholar] [CrossRef] [PubMed]
- Deng, Q.; Zhou, C.; Luo, B. Preparation and Characterization of Chitosan Nanoparticles Containing Lysozyme. Pharm. Biol. 2006, 44, 336–342. [Google Scholar] [CrossRef]
- Zhang, H.; Wu, F.; Li, Y.; Yang, X.; Huang, J.; Lv, T.; Zhang, Y.; Chen, J.; Chen, H.; Gao, Y. Chitosan-Based Nanoparticles for Improved Anticancer Efficacy and Bioavailability of Mifepristone. Beilstein J. Nanotechnol. 2016, 7, 1861–1870. [Google Scholar] [CrossRef] [PubMed]
- Hoover, E.; Alhajj, M.; Flores, J.L. Physiology, Hair; StatPearls Publishing: Treasure Island, FL, USA, 2022. [Google Scholar]
- Foitzik, K.; Krause, K.; Conrad, F.; Nakamura, M.; Funk, W.; Paus, R. Human Scalp Hair Follicles Are Both a Target and a Source of Prolactin, Which Serves as an Autocrine and/or Paracrine Promoter of Apoptosis-Driven Hair Follicle Regression. Am. J. Pathol. 2006, 168, 748–756. [Google Scholar] [CrossRef] [PubMed]
- Paus, R.; Handjiski, B.; Eichmüller, S.; Czarnetzki, B.M. Chemotherapy-Induced Alopecia in Mice. Induction by Cyclophosphamide, Inhibition by Cyclosporine A, and Modulation by Dexamethasone. Am. J. Pathol. 1994, 144, 719. [Google Scholar] [PubMed]
- Mutoh, S.; Sobhany, M.; Moore, R.; Perera, L.; Pedersen, L.; Sueyoshi, T.; Negishi, M. Phenobarbital Indirectly Activates the Constitutive Active Androstane Receptor (CAR) by Inhibition of Epidermal Growth Factor Receptor Signaling. Sci. Signal. 2013, 6, ra31. [Google Scholar] [CrossRef] [PubMed]
- Haslam, I.; El-Chami, C.; Faruqi, H.; Shahmalak, A.; O’Neill, C.; Paus, R. Differential Expression and Functionality of ATP Binding Cassette Transporters in the Human Hair Follicle. Br. J. Dermatol. 2014, 172, 1562–1572. [Google Scholar] [CrossRef] [PubMed]
- Lauterburg, B.H.; Corcoran, G.B.; Mitchell, J.R. Mechanism of Action of N-Acetylcysteine in the Protection against the Hepatotoxicity of Acetaminophen in Rats in Vivo. J. Clin. Investig. 1983, 71, 980–991. [Google Scholar] [CrossRef] [PubMed]
- Colvin, O.M.; Friedman, H.S.; Gamcsik, M.P.; Fenselau, C.; Hilton, J. Role of Glutathione in Cellular Resistance to Alkylating Agents. Adv. Enzym. Regul. 1993, 33, 19–26. [Google Scholar] [CrossRef] [PubMed]
- Garattini, S.; Palma, V.; Innocenti, I.R.-D.; Guaitani, A. Effect of Radioprotectors on Damage Induced by Alkylating Agents on Tumoural and Normal Tissues. Eur. J. Cancer (1965) 1966, 2, 237–244. [Google Scholar] [CrossRef]
- Karnik, P.; Tekeste, Z.; McCormick, T.S.; Gilliam, A.C.; Price, V.H.; Cooper, K.D.; Mirmirani, P. Hair Follicle Stem Cell-Specific PPARγ Deletion Causes Scarring Alopecia. J. Investig. Dermatol. 2009, 129, 1243–1257. [Google Scholar] [CrossRef] [PubMed]
- Ramot, Y.; Bertolini, M.; Boboljova, M.; Uchida, Y.; Paus, R. PPAR-γ Signalling as a Key Mediator of Human Hair Follicle Physiology and Pathology. Exp. Dermatol. 2020, 29, 312–321. [Google Scholar] [CrossRef] [PubMed]
- Mahmoud, A.M. Hesperidin Protects against Cyclophosphamide-Induced Hepatotoxicity by Upregulation of PPARγ and Abrogation of Oxidative Stress and Inflammation. Can. J. Physiol. Pharmacol. 2014, 92, 717–724. [Google Scholar] [CrossRef] [PubMed]
- Yousefi, B.; Zarghami, N.; Samadi, N.; Majidinia, M. Peroxisome Proliferator-Activated Receptors and Their Ligands in Cancer Drug-Resistance: Opportunity or Challenge. Anti-Cancer Agents Med. Chem. 2016, 16, 1541–1548. [Google Scholar] [CrossRef] [PubMed]
- Maurer, M.; Handjiski, B.; Paus, R. Hair Growth Modulation by Topical Immunophilin Ligands: Induction of Anagen, Inhibition of Massive Catagen Development, and Relative Protection from Chemotherapy-Induced Alopecia. Am. J. Pathol. 1997, 150, 1433. [Google Scholar] [PubMed]
- Singh, A.; Naidu, P.S.; Patil, C.S.; Kulkarni, S.K. Effect of FK506 (Tacrolimus) in Animal Models of Inflammation. InflammoPharmacology 2003, 11, 249–257. [Google Scholar] [CrossRef] [PubMed]
- Jimenez, J.J.; Yunis, A.A. Protection from 1-β-d-Arabinofuranosylcytosine-Induced Alopecia by Epidermal Growth Factor and Fibroblast Growth Factor in the Rat Model. Cancer Res. 1992, 52, 413–415. [Google Scholar] [PubMed]
- Hendrix, S.; Rossiter, H.; Paus, R.; Handjiski, B.; Peters, E.; Murphy, J.-E.; Mecklenburg, L.; Kupper, T. Overexpression of Bcl-2 Protects from Ultraviolet B-Induced Apoptosis but Promotes Hair Follicle Regression and Chemotherapy-Induced Alopecia. Am. J. Pathol. 2000, 156, 1395–1405. [Google Scholar] [CrossRef]
- Zhao, Y.; Tian, Y.; Ye, W.; Wang, X.; Huai, Y.; Huang, Q.; Chu, X.; Deng, X.; Qian, A. A Lipid–Polymer Hybrid Nanoparticle (LPN)-Loaded Dissolving Microneedle Patch for Promoting Hair Regrowth by Transdermal miR-218 Delivery. Biomater. Sci. 2023, 11, 140–152. [Google Scholar] [CrossRef] [PubMed]
- Yaripour, S.; Ebrahimi, S.; Mohammadi, A. Quantitative Analysis of Phenobarbital in Biological Fluids: Analyte Enrichment by an Electrically-Assisted Microextraction Technique. Braz. J. Pharm. Sci. 2020, 56, e17839. [Google Scholar] [CrossRef]
- Rifampin. Tuberculosis 2008, 88, 151–154. [CrossRef] [PubMed]
- Ghareeb, M.; Gohh, R.Y.; Akhlaghi, F. Tacrolimus Concentration in Saliva of Kidney Transplant Recipients: Factors Influencing the Relationship with Whole Blood Concentrations. Clin. Pharmacokinet. 2018, 57, 1199–1210. [Google Scholar] [CrossRef] [PubMed]
- Sugita, M.; Kataoka, M.; Sugihara, M.; Takeuchi, S.; Yamashita, S. Effect of Excipients on the Particle Size of Precipitated Pioglitazone in the Gastrointestinal Tract: Impact on Bioequivalence. AAPS J. 2014, 16, 1119–1127. [Google Scholar] [CrossRef] [PubMed]
- Ashour, H.K.; Kamel, S.M.; El-Yazbi, F.; Maher, H.M. A Green Sustainable Approach for the Determination of a Complex Quintet Hepatoprotective Mixture Using Dual Wavelength HPLC Coupled with Diode Array Detection: Compliance with Greenness and Whiteness Metrics. Sustain. Chem. Pharm. 2023, 35, 101163. [Google Scholar] [CrossRef]
- Espinoza, L.C.; Vera-García, R.; Silva-Abreu, M.; Domènech, Ò.; Badia, J.; Rodríguez-Lagunas, M.J.; Clares, B.; Calpena, A.C. Topical Pioglitazone Nanoformulation for the Treatment of Atopic Dermatitis: Design, Characterization and Efficacy in Hairless Mouse Model. Pharmaceutics 2020, 12, 255. [Google Scholar] [CrossRef] [PubMed]
- Pannatier, A.; Testa, B.; Etter, J.-C. Effect of Topically Applied Phenobarbital on O-Dealkylase Activity in Mouse Skin. Experientia 1982, 38, 604–605. [Google Scholar] [CrossRef] [PubMed]
- Rabia, S.; Khaleeq, N.; Batool, S.; Dar, M.J.; Kim, D.W.; Din, F.-U.; Khan, G.M. Rifampicin-Loaded Nanotransferosomal Gel for Treatment of Cutaneous Leishmaniasis: Passive Targeting via Topical Route. Nanomedicine 2020, 15, 183–203. [Google Scholar] [CrossRef] [PubMed]
- El-Zaafarany, G.M.; Abdel-Aziz, R.T.A.; Montaser, M.H.A.; Nasr, M. Coenzyme Q10 Phospholipidic Vesicular Formulations for Treatment of Androgenic Alopecia: Ex Vivo Permeation and Clinical Appraisal. Expert Opin. Drug Deliv. 2021, 18, 1513–1522. [Google Scholar] [CrossRef] [PubMed]
- Pecora, R. Dynamic Light Scattering: Applications of Photon Correlation Spectroscopy; Springer Science & Business Media: Berlin/Heidelberg, Germany, 2013; ISBN 1-4613-2389-4. [Google Scholar]
- Bhattacharjee, S. DLS and Zeta Potential—What They Are and What They Are Not? J. Control. Release 2016, 235, 337–351. [Google Scholar] [CrossRef] [PubMed]
- Şenyiğit, T.; Sonvico, F.; Barbieri, S.; Özer, Ö.; Santi, P.; Colombo, P. Lecithin/Chitosan Nanoparticles of Clobetasol-17-Propionate Capable of Accumulation in Pig Skin. J. Control. Release 2010, 142, 368–373. [Google Scholar] [CrossRef] [PubMed]
- Ajemni, M.; Balde, I.-B.; Kabiche, S.; Carret, S.; Fontan, J.-E.; Cisternino, S.; Schlatter, J. Stability-Indicating Assay for the Determination of Pentobarbital Sodium in Liquid Formulations. Int. J. Anal. Chem. 2015, 2015, 697937. [Google Scholar] [CrossRef] [PubMed]
- Calleri, E.; De Lorenzi, E.; Furlanetto, S.; Massolini, G.; Caccialanza, G. Validation of a RP-LC Method for the Simultaneous Determination of Isoniazid, Pyrazinamide and Rifampicin in a Pharmaceutical Formulation. J. Pharm. Biomed. Anal. 2002, 29, 1089–1096. [Google Scholar] [CrossRef] [PubMed]
- Ghule, S.S.; Tamboli, A.; Kale, S.; Landage, S.; Patil, S. Analytical method development and validation of uv spectrophotometric method for simultaneous estimation of pyridoxamine dihydrochloride and acetylcysteine in tablet dosage form. Asian J. Pharm. Educ. Res. 2021, 10, 2021–2030. [Google Scholar] [CrossRef]
- Lee, N.H.; Park, S.H.; Park, S.N. Preparation and Characterization of Novel Pseudo Ceramide-Based Nanostructured Lipid Carriers for Transdermal Delivery of Apigenin. J. Drug Deliv. Sci. Technol. 2018, 48, 245–252. [Google Scholar] [CrossRef]
- Morley, E.J.; Elrod, L., Jr. Determination of Pentobarbital and Pentobarbital Sodium in Bulk Drug Substance and Dosage Forms by High-Performance Liquid Chromatography. J. Pharm. Biomed. Anal. 1997, 16, 119–129. [Google Scholar] [CrossRef] [PubMed]
- Naveed, S.; Ashraf, Z.; Mukhtar, T. Assay of Pioglitazone HCL by Using UV Visible Spectrophotometer. Br. J. Res. 2015, 2, 24–29. [Google Scholar]
- Satheeshkumar, N.; Shantikumar, S.; Srinivas, R. Pioglitazone: A Review of Analytical Methods. J. Pharm. Anal. 2014, 4, 295–302. [Google Scholar] [CrossRef] [PubMed]
- Shah, U.; Patel, S.; Raval, M. Stability Indicating Reverse Phase HPLC Method for Estimation of Rifampicin and Piperine in Pharmaceutical Dosage Form. Curr. Drug Discov. Technol. 2018, 15, 54–64. [Google Scholar] [CrossRef] [PubMed]
- Srinivasulu, D.; Sastry, B.; Omprakash, G. Development and Validation of New RPHPLC Method for Determination of Pioglitazone Hcl in Pharmaceutical Dosage Forms. Int. J. Chem. Res. 2010, 1, 18–20. [Google Scholar]
- Swamy, N.; Basavaiah, K.; Vamsikrishna, P. Stability-Indicating HPLC Determination of Rifampicin in Bulk Drug and Dosage Form. Pharm. Chem. J. 2019, 53, 580–588. [Google Scholar] [CrossRef]
- Toussaint, B.; Pitti, C.; Streel, B.; Ceccato, A.; Hubert, P.; Crommen, J. Quantitative Analysis of N-Acetylcysteine and Its Pharmacopeial Impurities in a Pharmaceutical Formulation by Liquid Chromatography–UV Detection–Mass Spectrometry. J. Chromatogr. A 2000, 896, 191–199. [Google Scholar] [CrossRef] [PubMed]
- Gaikwad, V.L.; Choudhari, P.B.; Bhatia, N.M.; Bhatia, M.S. Characterization of Pharmaceutical Nanocarriers: In Vitro and in Vivo Studies. In Nanomaterials for Drug Delivery and Therapy; Elsevier: Amsterdam, The Netherlands, 2019; pp. 33–58. [Google Scholar]
- Papadimitriou, S.; Bikiaris, D.; Avgoustakis, K.; Karavas, E.; Georgarakis, M. Chitosan Nanoparticles Loaded with Dorzolamide and Pramipexole. Carbohydr. Polym. 2008, 73, 44–54. [Google Scholar] [CrossRef]
- Hussein, A.; Abdel-Mottaleb, M.M.A.; El-assal, M.; Sammour, O. Novel Biocompatible Essential Oil-Based Lipid Nanocapsules with Antifungal Properties. J. Drug Deliv. Sci. Technol. 2020, 56, 101605. [Google Scholar] [CrossRef]
- Sarmento, B.; Ferreira, D.; Veiga, F.; Ribeiro, A. Characterization of Insulin-Loaded Alginate Nanoparticles Produced by Ionotropic Pre-Gelation through DSC and FTIR Studies. Carbohydr. Polym. 2006, 66, 1–7. [Google Scholar] [CrossRef]
- Botchkarev, V.A. Molecular Mechanisms of Chemotherapy-Induced Hair Loss; Elsevier: Amsterdam, The Netherlands, 2003; Volume 8, pp. 72–75. [Google Scholar]
- Botchkarev, V.A.; Komarova, E.A.; Siebenhaar, F.; Botchkareva, N.V.; Sharov, A.A.; Komarov, P.G.; Maurer, M.; Gudkov, A.V.; Gilchrest, B.A. P53 Involvement in the Control of Murine Hair Follicle Regression. Am. J. Pathol. 2001, 158, 1913–1919. [Google Scholar] [CrossRef] [PubMed]
- Botchkarev, V.A.; Komarova, E.A.; Siebenhaar, F.; Botchkareva, N.V.; Komarov, P.G.; Maurer, M.; Gilchrest, B.A.; Gudkov, A.V. P53 Is Essential for Chemotherapy-Induced Hair Loss. Cancer Res. 2000, 60, 5002–5006. [Google Scholar] [PubMed]
- Brosh, R.; Sarig, R.; Natan, E.B.; Molchadsky, A.; Madar, S.; Bornstein, C.; Buganim, Y.; Shapira, T.; Goldfinger, N.; Paus, R.; et al. P53-Dependent Transcriptional Regulation of EDA2R and Its Involvement in Chemotherapy-Induced Hair Loss. FEBS Lett. 2010, 584, 2473–2477. [Google Scholar] [CrossRef] [PubMed]
- Shin, H.; Park, S.; Song, H.; Hwang, E.; Lee, D.; Yi, T. The Androgenic Alopecia Protective Effects of forsythiaside-A and the Molecular Regulation in a Mouse Model. Phytother. Res. 2015, 29, 870–876. [Google Scholar] [CrossRef] [PubMed]
- Schwartzberg, L.; Navari, R. Safety of Polysorbate 80 in the Oncology Setting. Adv. Ther. 2018, 35, 754–767. [Google Scholar] [CrossRef] [PubMed]
- Tang, L.; Cao, L.; Sundberg, J.; Lui, H.; Shapiro, J. Restoration of Hair Growth in Mice with an Alopecia Areata-like Disease Using Topical Anthralin. Exp. Dermatol. 2004, 13, 5–10. [Google Scholar] [CrossRef] [PubMed]
- Murata, K.; Noguchi, K.; Kondo, M.; Onishi, M.; Watanabe, N.; Okamura, K.; Matsuda, H. Promotion of Hair Growth by Rosmarinus Officinalis Leaf Extract. Phytother. Res. 2013, 27, 212–217. [Google Scholar] [CrossRef] [PubMed]
- Kim, M.H.; Kim, K.; Lee, H.; Yang, W.M. Human Placenta Induces Hair Regrowth in Chemotherapy-Induced Alopecia via Inhibition of Apoptotic Factors and Proliferation of Hair Follicles. BMC Complement. Med. Ther. 2020, 20, 230. [Google Scholar] [CrossRef] [PubMed]
- Kim, M.J.; Seong, K.-Y.; Jeong, J.S.; Kim, S.Y.; Lee, S.; Yang, S.Y.; An, B.-S. Minoxidil-Loaded Hyaluronic Acid Dissolving Microneedles to Alleviate Hair Loss in an Alopecia Animal Model. Acta Biomater. 2022, 143, 189–202. [Google Scholar] [CrossRef] [PubMed]
| Group | CIA 1 Induction | Treatment (Topical Application from Day 7 to Day 14 p.d. 2) | Primary Recovery (Day) | Secondary Recovery (Day) | Average HGI on Day 27 | Hair Thickness on Day 27 | Recovery Pathway | Additional Notes |
|---|---|---|---|---|---|---|---|---|
| Negative control | None | None | 14 | None | 300 ± 0.00 | 26.25 ± 2.86 | Normal anagen | Normal hair cycle timeline |
| Positive control | 120 mg/kg cyclophosphamide by I.P. 9 injection on day 9 post-depilation | None | None | 19 | 50 ± 0.00 | 18.89 ± 3.40 | Dystrophic catagen | Secondary recovery still showed defective HFs 10 and shafts |
| PHB 3 | F1 | 14 | 27 | 250 ± 50.99 | 33.62 ± 7.54 | Dystrophic anagen | Most comparable to negative control | |
| PGZ 4 | F2 | 35 | 115 ± 33.17 | 17.72 ± 3.50 | Best hair quality in primary recovery | |||
| RIF 5 | F3 | Not observed | 97.5 ± 42.72 | 17.15 ± 2.62 | Slowest recovery; white hair with poor morphology | |||
| NAC 6 | F4 | 27 | 150 ± 86.79 | 16.96 ± 2.67 | The second most effective | |||
| TAC 7 | F5 | Not observed | 140 ± 77.78 | 20.18 ± 3.22 | Effective primary recovery but delayed secondary recovery | |||
| Blank CS NPs 8 | Blank CS NPs 8 | Not observed | 57.5 ± 66.52 | 26.25 ± 2.86 | Minimal effect; regenerative role of chitosan only |
| Drug | Conc. * (% w/v) | Polymer ** | Crosslinker | Co-Solvent | |
|---|---|---|---|---|---|
| F1 | Phenobarbital | 0.023 | 0.1% Chitosan in 1% acetic acid aqueous solution | 0.05% Tripolyphosphate sodium | Propylene glycol |
| F2 | Pioglitazone | 0.020 | |||
| F3 | Rifampicin | 0.040 | |||
| F4 | N-acetylcysteine | 0.300 | |||
| F5 | Tacrolimus | 0.030 |
| Formula (Drug) | Stationary Phase | Mobile Phase | Flow Rate (mL/min) | Oven Temperature | Photodiode-Array Detector Wavelength (nm) | Retention Time (min) | Reference |
|---|---|---|---|---|---|---|---|
| F1 (Phenobarbital) | Hypersil Gold column with dimensions 100 × 4.6, particle size 3 µm | Isocratic 100% acetonitrile | 1.6 | 40 | 214 | 0.7 | [137,141] |
| F2 (Pioglitazone) | Isocratic 100% methanol | 1 | 25 | 225 | 1.227 | [142,143,145] | |
| F3 (Rifampicin) | 1.3 | 235 | 0.7 | [138,144,146] | |||
| F4 (N-acetyl cysteine) | Isocratic 95% acidic phosphate buffer, 5% acetonitrile | 1 | 40 | 214 | 1.3 | [139,147] | |
| F5 (Tacrolimus) | Isocratic 100% acetonitrile | 1.6 | 40 | 214 | 0.7 | [137,141] |
Disclaimer/Publisher’s Note: The statements, opinions and data contained in all publications are solely those of the individual author(s) and contributor(s) and not of MDPI and/or the editor(s). MDPI and/or the editor(s) disclaim responsibility for any injury to people or property resulting from any ideas, methods, instructions or products referred to in the content. |
© 2025 by the authors. Licensee MDPI, Basel, Switzerland. This article is an open access article distributed under the terms and conditions of the Creative Commons Attribution (CC BY) license (https://creativecommons.org/licenses/by/4.0/).
Share and Cite
Fereig, S.A.; Youshia, J.; El-Zaafarany, G.M.; Arafa, M.G.; Abdel-Mottaleb, M.M.A. Chitosan Nanoparticles for Topical Drug Delivery in Chemotherapy-Induced Alopecia: A Comparative Study of Five Repurposed Pharmacological Agents. Pharmaceuticals 2025, 18, 1071. https://doi.org/10.3390/ph18071071
Fereig SA, Youshia J, El-Zaafarany GM, Arafa MG, Abdel-Mottaleb MMA. Chitosan Nanoparticles for Topical Drug Delivery in Chemotherapy-Induced Alopecia: A Comparative Study of Five Repurposed Pharmacological Agents. Pharmaceuticals. 2025; 18(7):1071. https://doi.org/10.3390/ph18071071
Chicago/Turabian StyleFereig, Salma A., John Youshia, Ghada M. El-Zaafarany, Mona G. Arafa, and Mona M. A. Abdel-Mottaleb. 2025. "Chitosan Nanoparticles for Topical Drug Delivery in Chemotherapy-Induced Alopecia: A Comparative Study of Five Repurposed Pharmacological Agents" Pharmaceuticals 18, no. 7: 1071. https://doi.org/10.3390/ph18071071
APA StyleFereig, S. A., Youshia, J., El-Zaafarany, G. M., Arafa, M. G., & Abdel-Mottaleb, M. M. A. (2025). Chitosan Nanoparticles for Topical Drug Delivery in Chemotherapy-Induced Alopecia: A Comparative Study of Five Repurposed Pharmacological Agents. Pharmaceuticals, 18(7), 1071. https://doi.org/10.3390/ph18071071