Figure 1.
Experimental protocol for the preparation of control serum and serum containing YQZM.
Figure 1.
Experimental protocol for the preparation of control serum and serum containing YQZM.
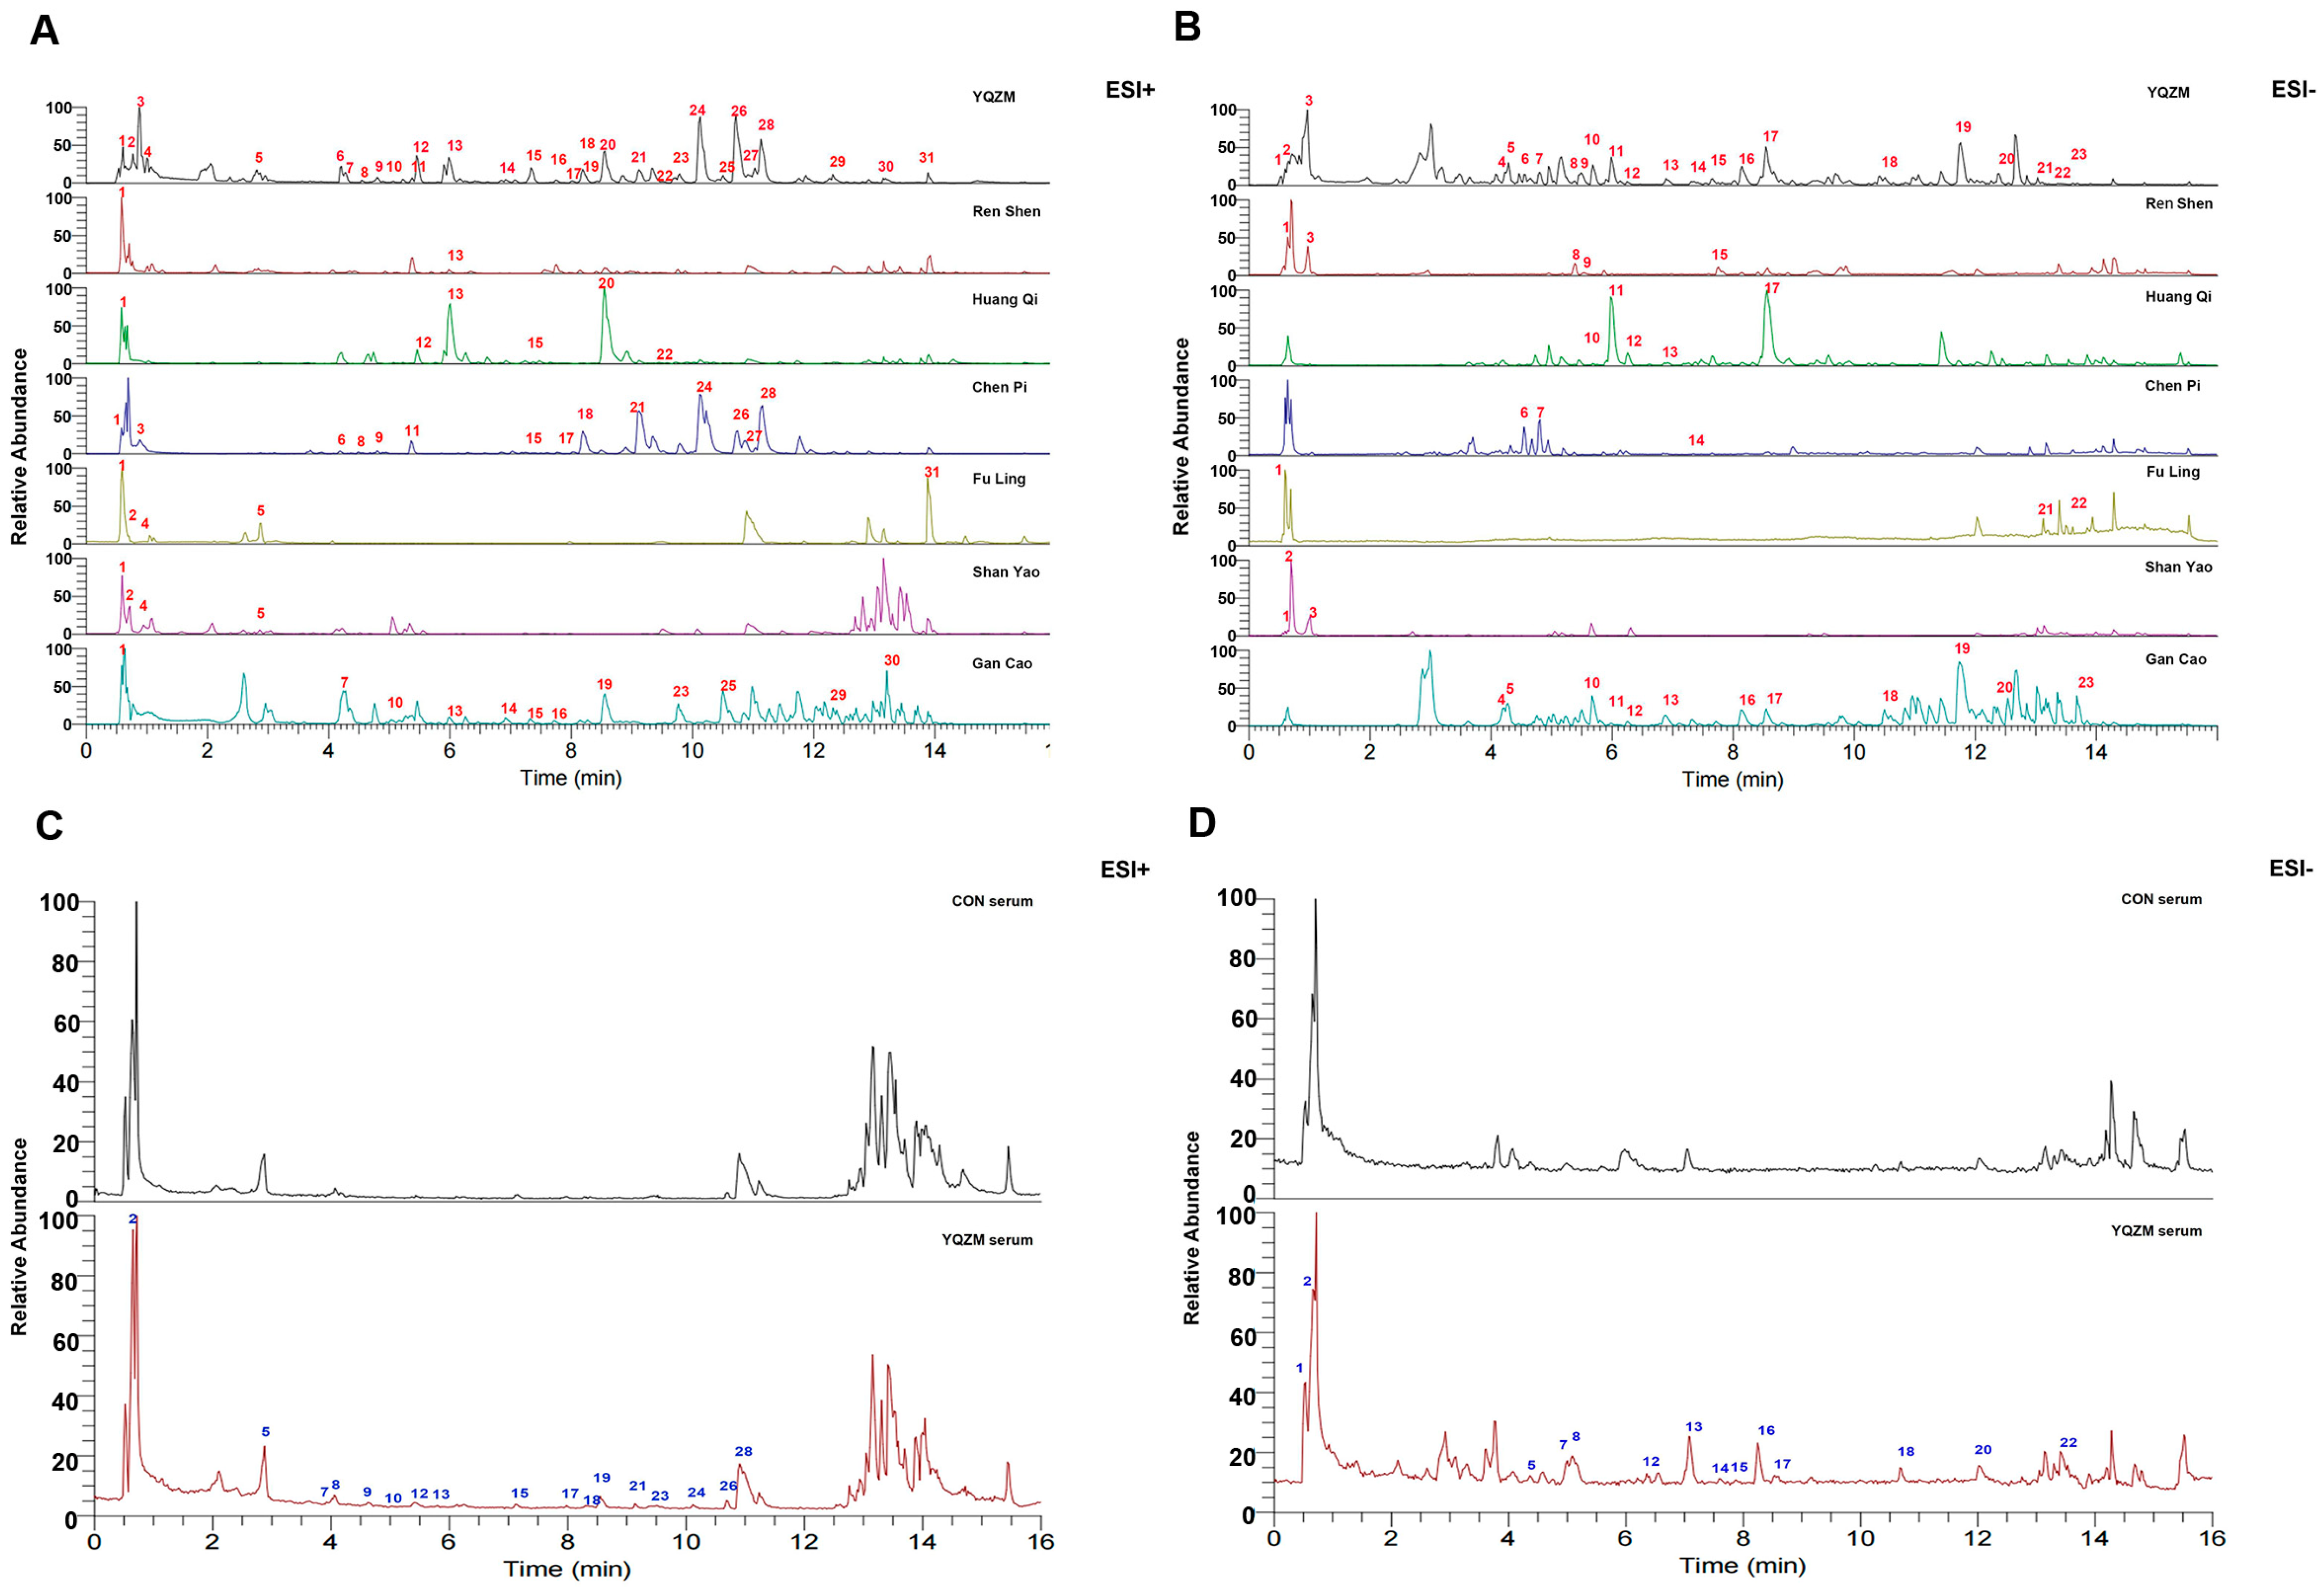
Figure 2.
Chromatograms of YQZM extract and serum detected by UPLC-MS/MS. The x-axis represents retention time, and the y-axis represents the relative abundance of compounds. (A) Total ion chromatogram (TIC) of YQZM and single botanical drug (ESI+). (B) TIC of YQZM and single botanical drug (ESI−). (C) TIC of control serum and serum containing YQZM (ESI+). (D) TIC of control serum and serum containing YQZM (ESI−).
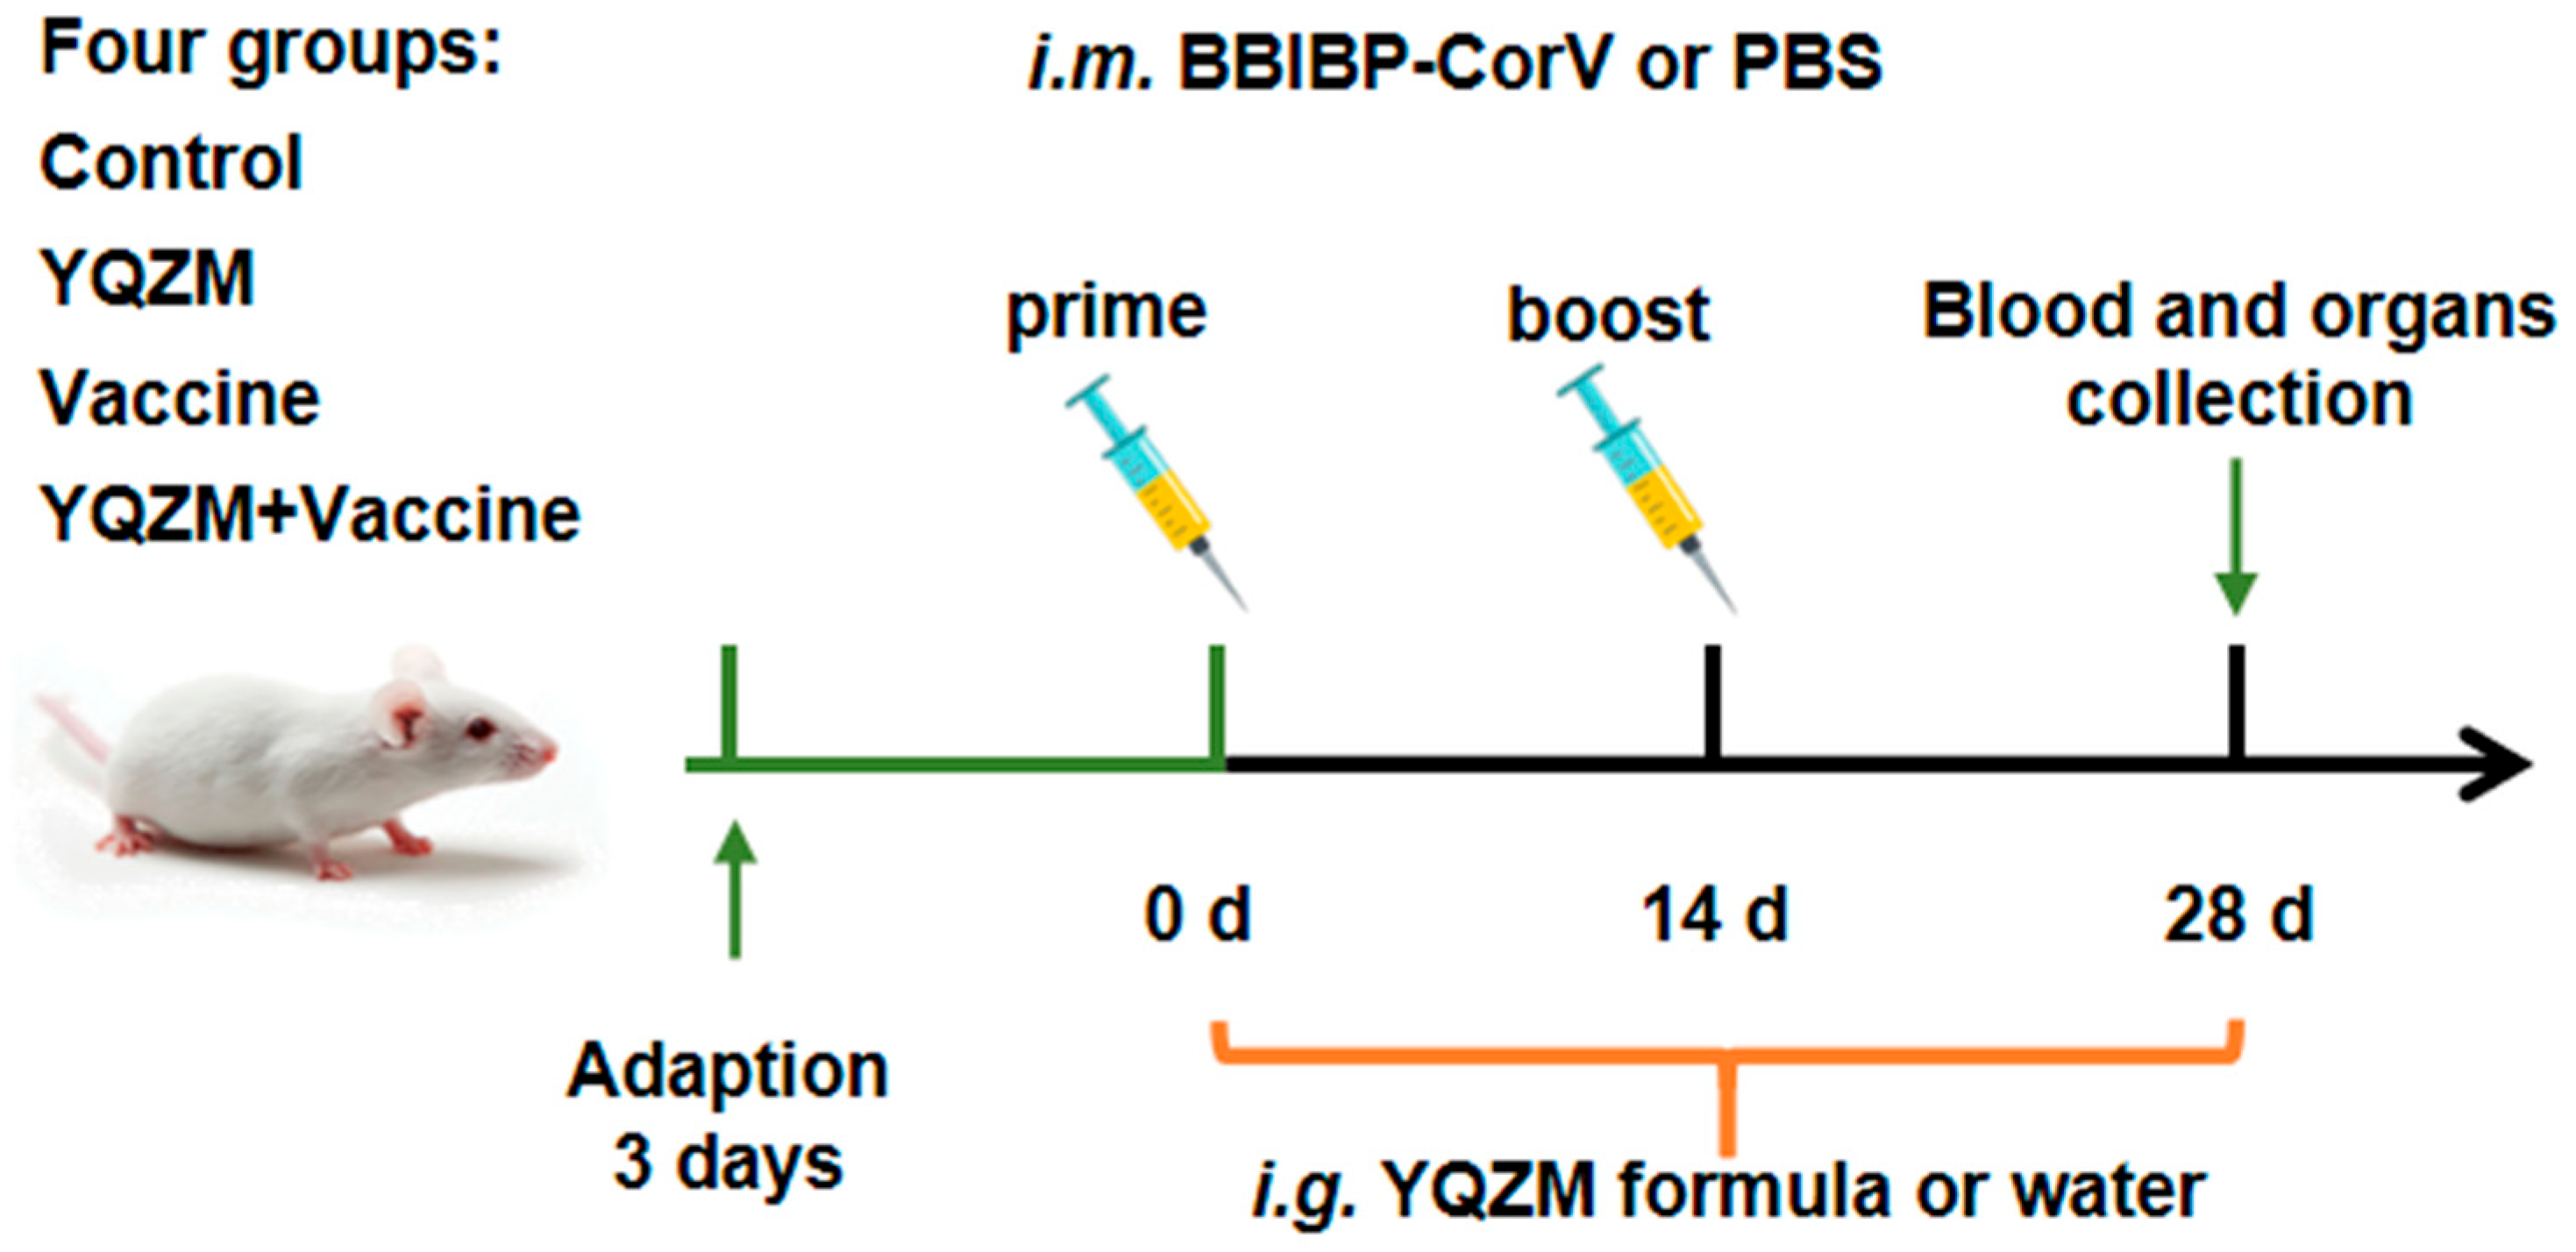
Figure 3.
Experimental protocol for the immunization of mice with the BBIBP-CorV and the treatment schedule with YQZM.
Figure 3.
Experimental protocol for the immunization of mice with the BBIBP-CorV and the treatment schedule with YQZM.
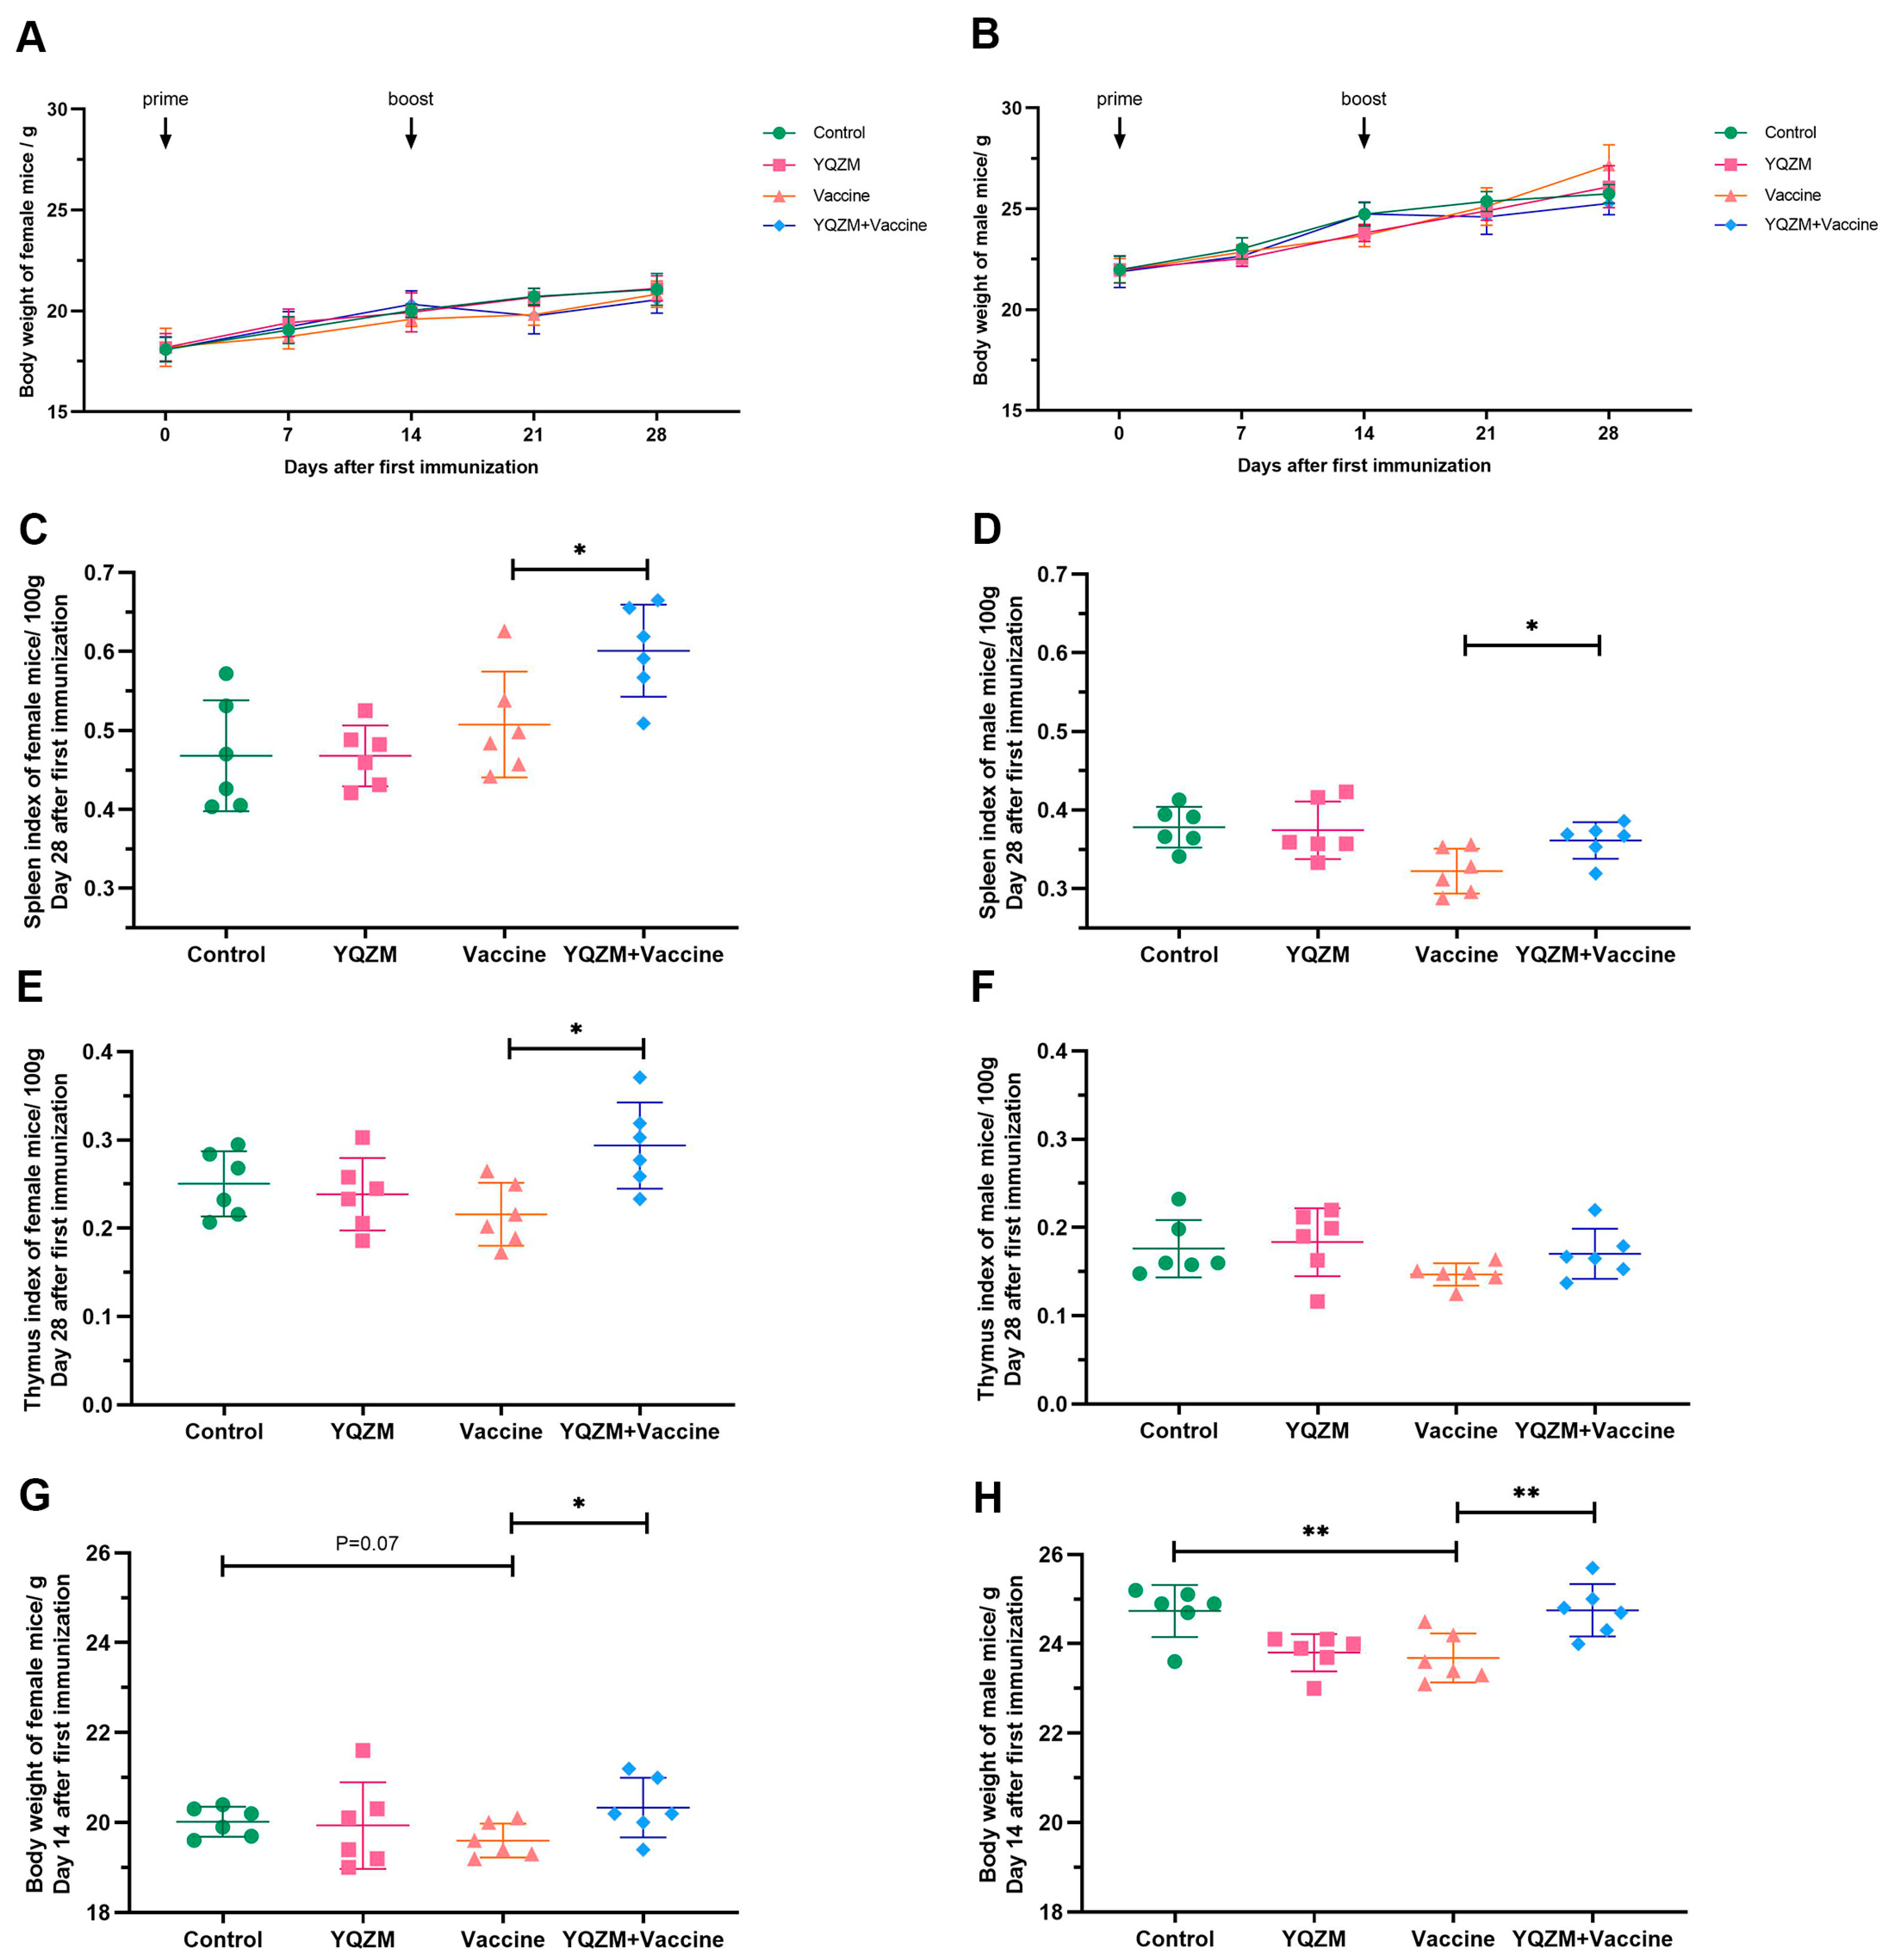
Figure 4.
The immune organ index and body weight of immune mice with BBIBP-CorV. (A,B) The body weight change of female and male mice over 28 days following the administration of YQZM. (C,D) The spleen index (mg/100 g body weight) of female and male mice. (E,F) The thymus index (mg/100 g body weight) of female and male mice. (G,H) The body weight of female and male mice over 14 days following the administration of YQZM. * p < 0.05, ** p < 0.01.
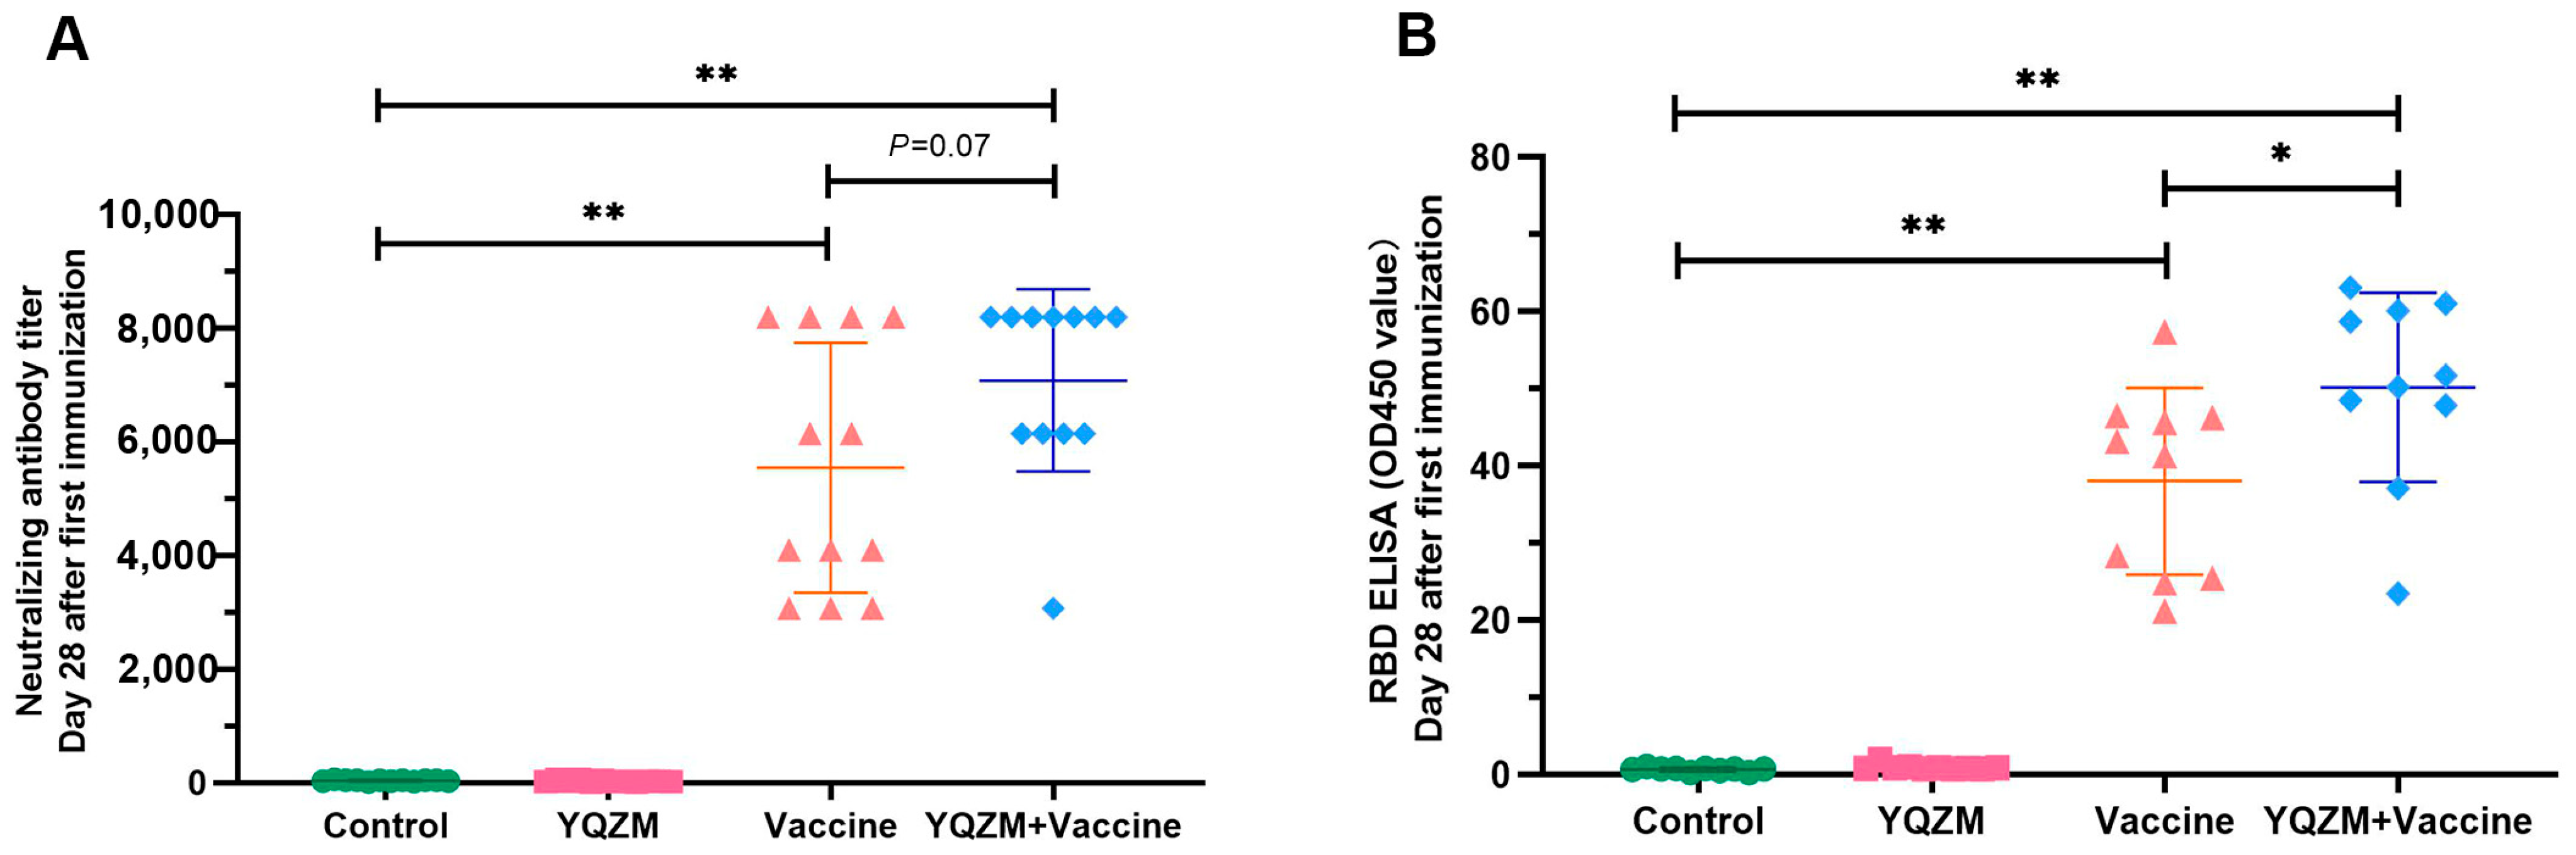
Figure 5.
Antigen-specific antibody titers on immune mice with BBIBP-CorV. (A) Nabs titers in serum of immune mice with BBIBP-CorV over 28 days following administration of YQZM. Neutralization test used fixed virus-diluted anti-serum method. (B) Anti-RBD antibody levels in serum of immune mice with BBIBP-CorV over 28 days following administration of YQZM via ELISA test. * p < 0.05, ** p < 0.01.
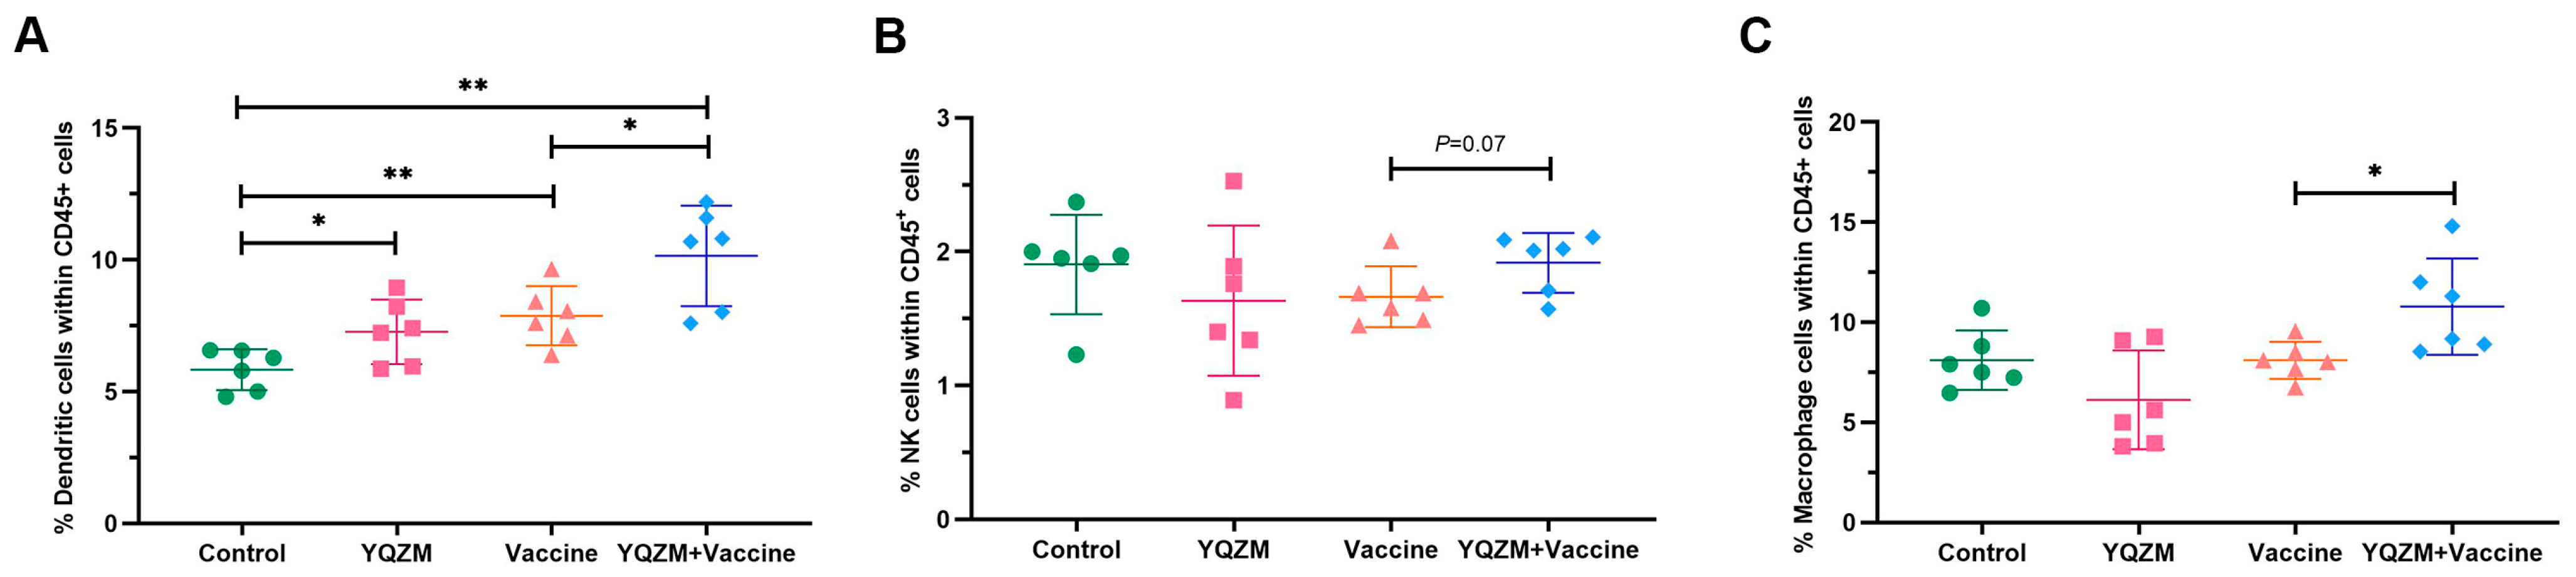
Figure 6.
Innate immune cell subsets on immune mice with BBIBP-CorV. (A) Percentage of DCs in mice spleen (CD45+ CD11c+ MHC-II+). (B) Percentage of NK cells in mice spleen (CD45+ CD49b+ CD3−). (C) Percentage of Mø in mice spleen (CD45+ CD11b+ F4/80+). * p < 0.05, ** p < 0.01.
Figure 6.
Innate immune cell subsets on immune mice with BBIBP-CorV. (A) Percentage of DCs in mice spleen (CD45+ CD11c+ MHC-II+). (B) Percentage of NK cells in mice spleen (CD45+ CD49b+ CD3−). (C) Percentage of Mø in mice spleen (CD45+ CD11b+ F4/80+). * p < 0.05, ** p < 0.01.
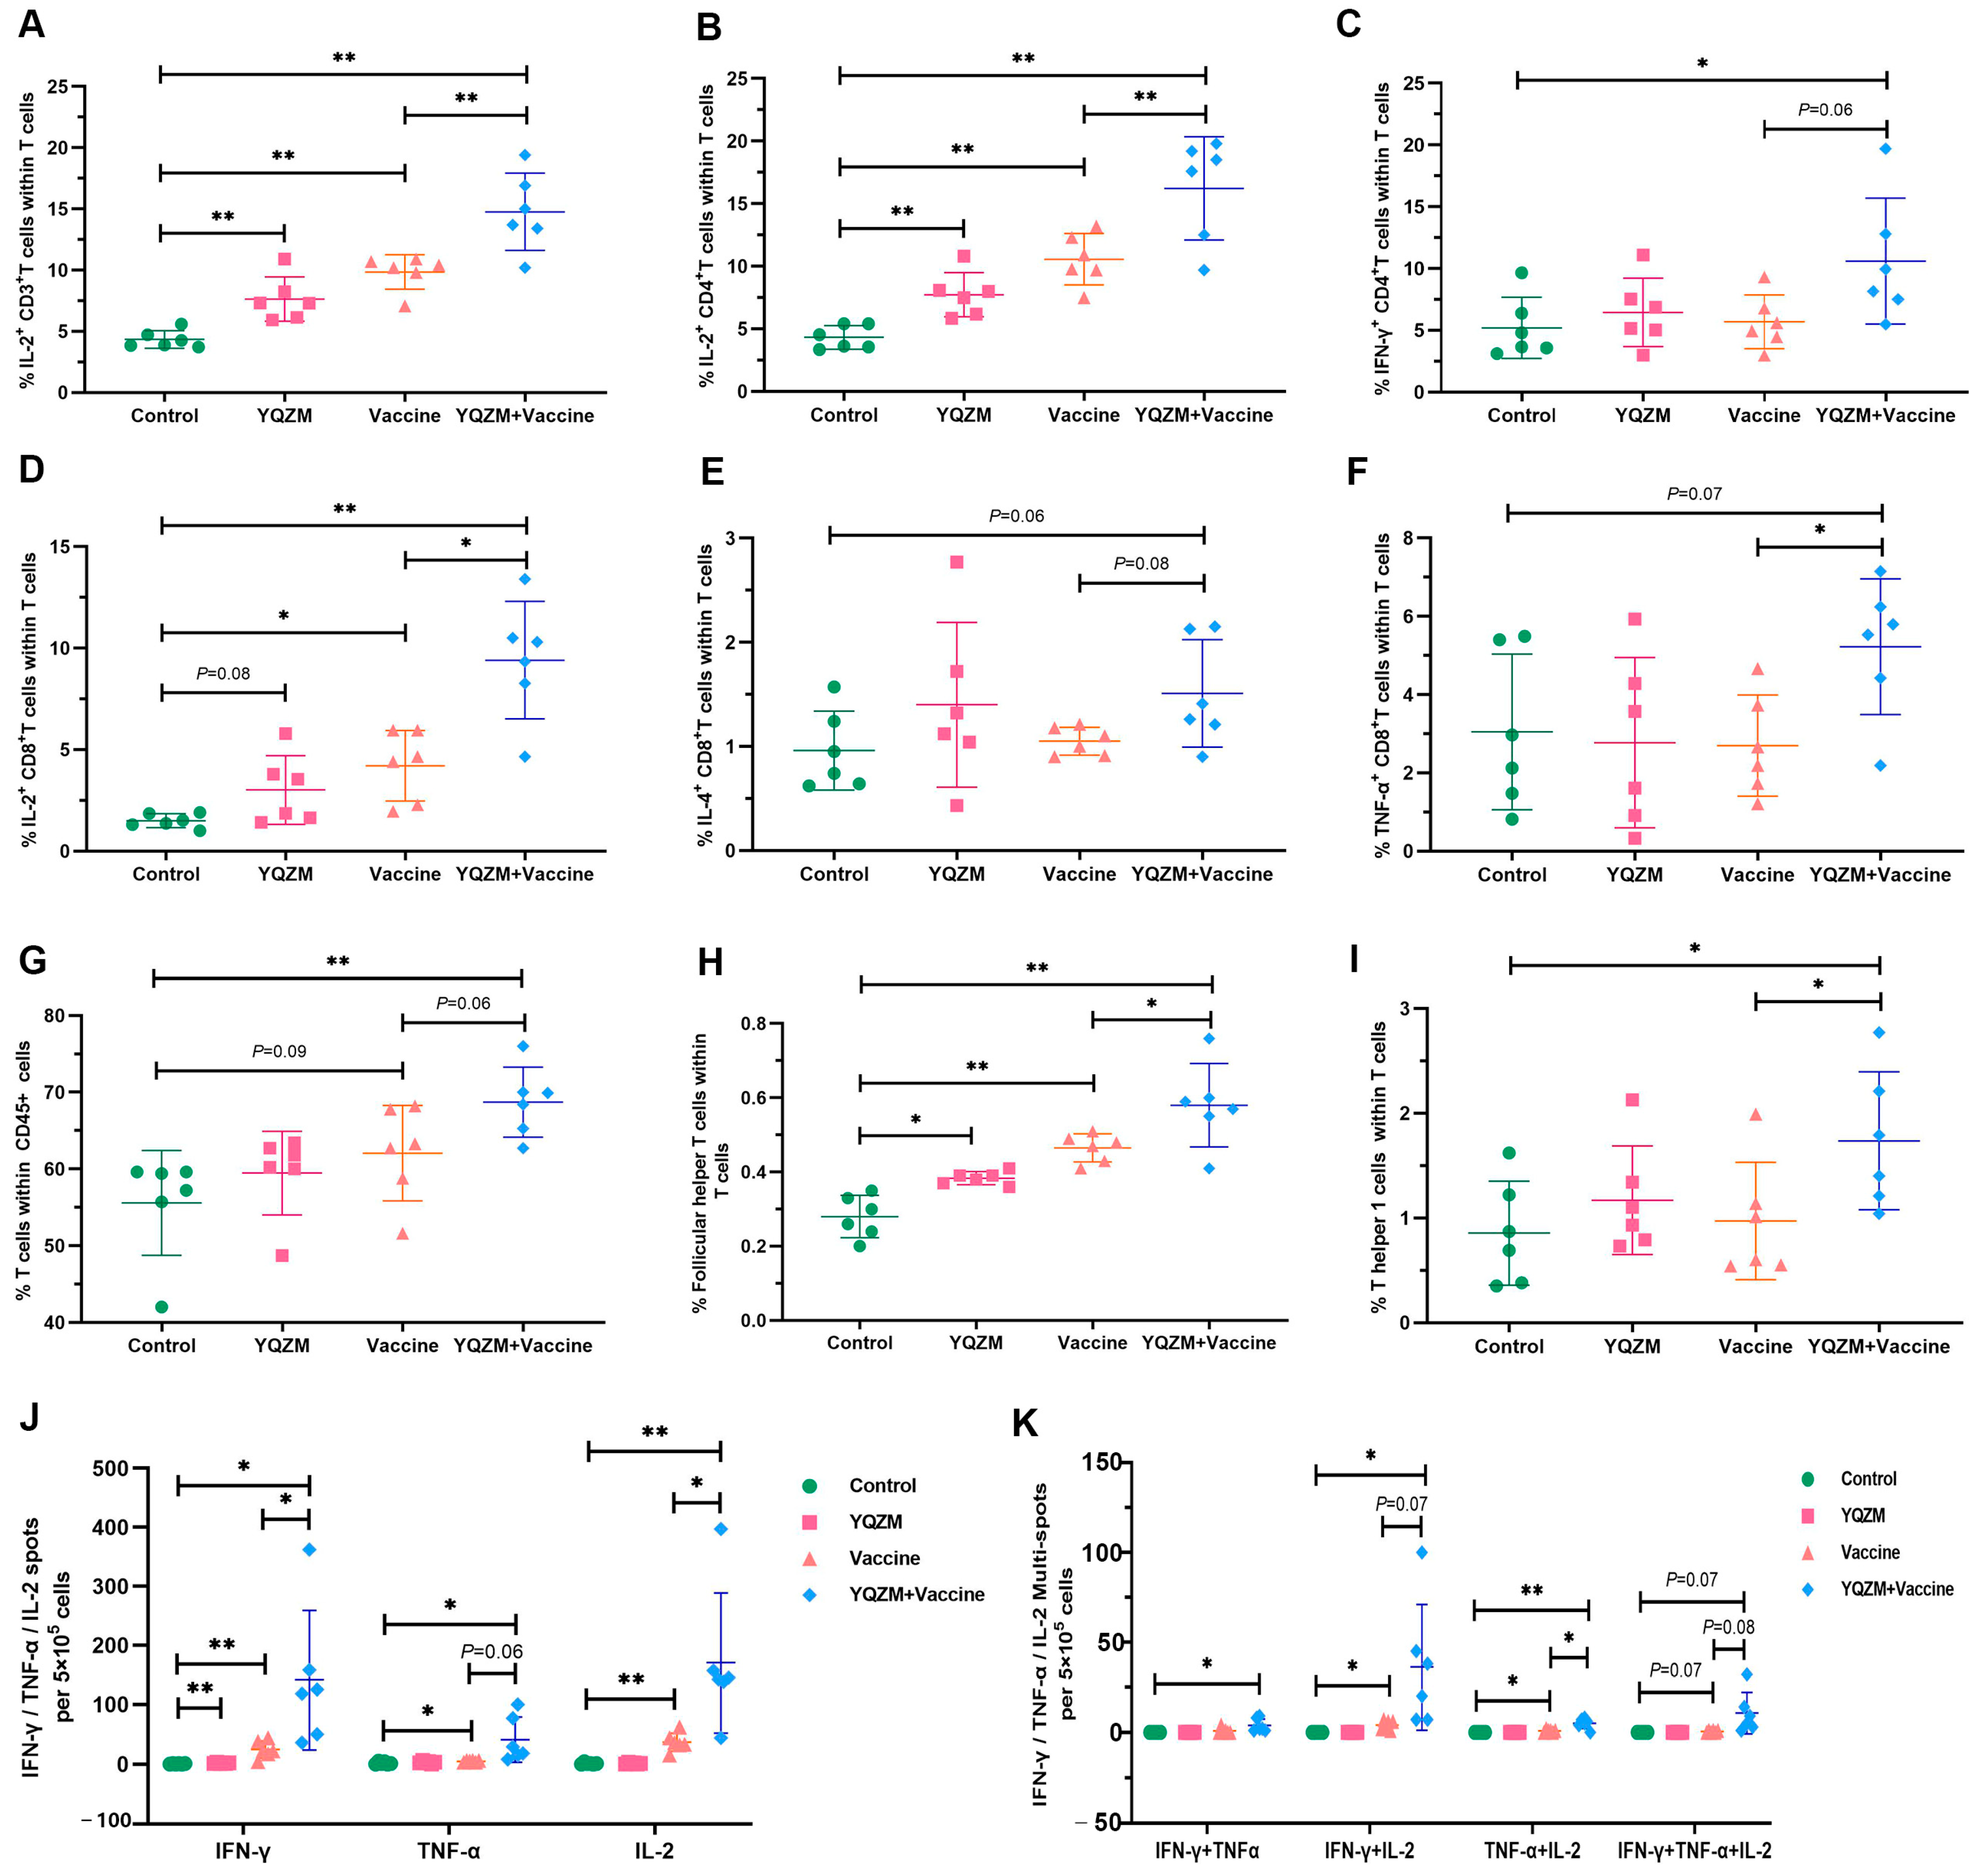
Figure 7.
Subsets of T cells and their cytokine in immune mice with BBIBP-CorV. Antigen-specific T cytokine production analysis in T cells by flow cytometry. Cells were stained with anti-CD3 plus anti-IL-2 (A), triple–stained with anti-CD3 plus anti-CD4 plus anti-IL-2 (B) plus anti--IFN-γ (C), or triple-stained anti-CD3 plus anti-CD8 plus anti-IL-2 (D) plus anti-IL-4 (E) plus anti--TNF-α (F). Percentages of T cells in CD45+ cells (CD45+ CD3+), Tfh cells (CD3+ CD44+ CXCR5+), and Th1 cells (CD3+ CD44+ CXCR3+) in total T cells are shown in (G), (H), and (I), respectively. Results of ELISpot of S-specific IL-2, IFN-γ, and TNF-α for memory T cells are shown in (J), and multiple fluorescent spots are shown in (K). * p < 0.05, ** p < 0.01.
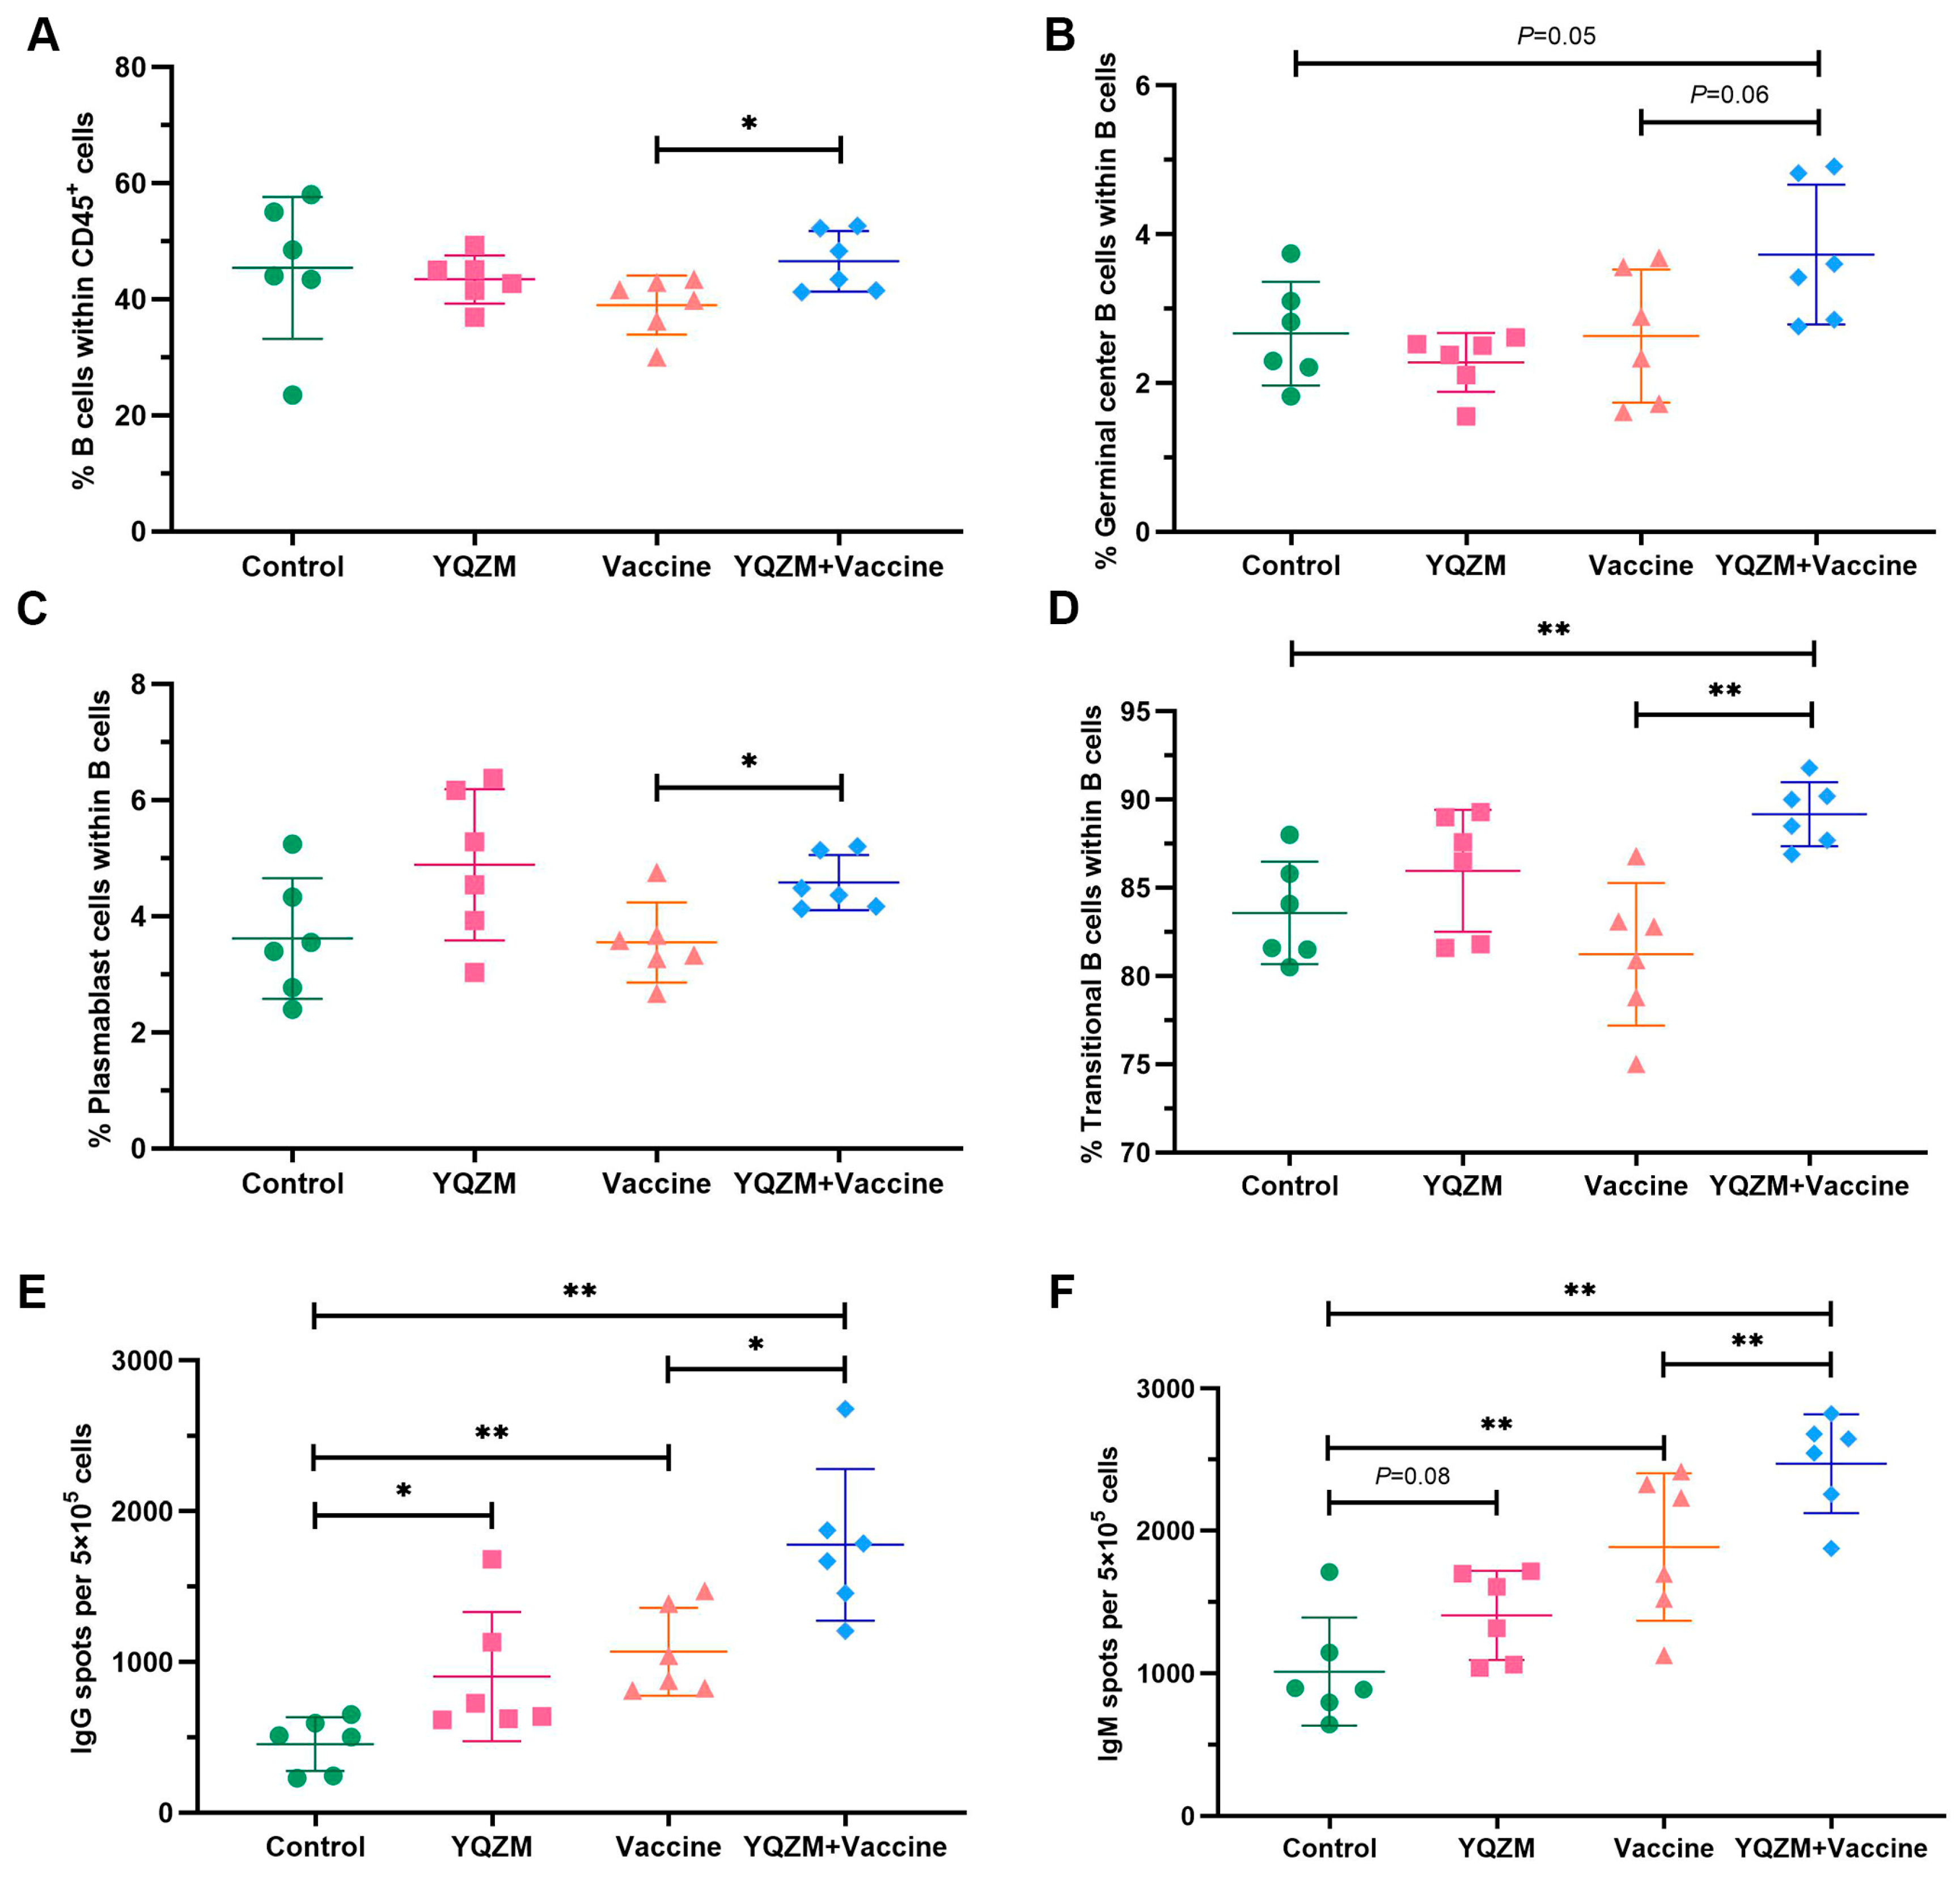
Figure 8.
The subsets of B cells and their immunoglobulins in immune mice with the BBIBP-CorV. The percentage of B cells (CD45+ CD19+), germinal center B cells (Fas+ GL7+), plasmablast cells (CD138+ B220+), and transitional B cells (CD19+ CD40−) are shown in (A), (B), (C), and (D), respectively. The results of ELISpot of S-specific IgG and IgM of memory B cells are shown in (E,F). * p < 0.05, ** p < 0.01.
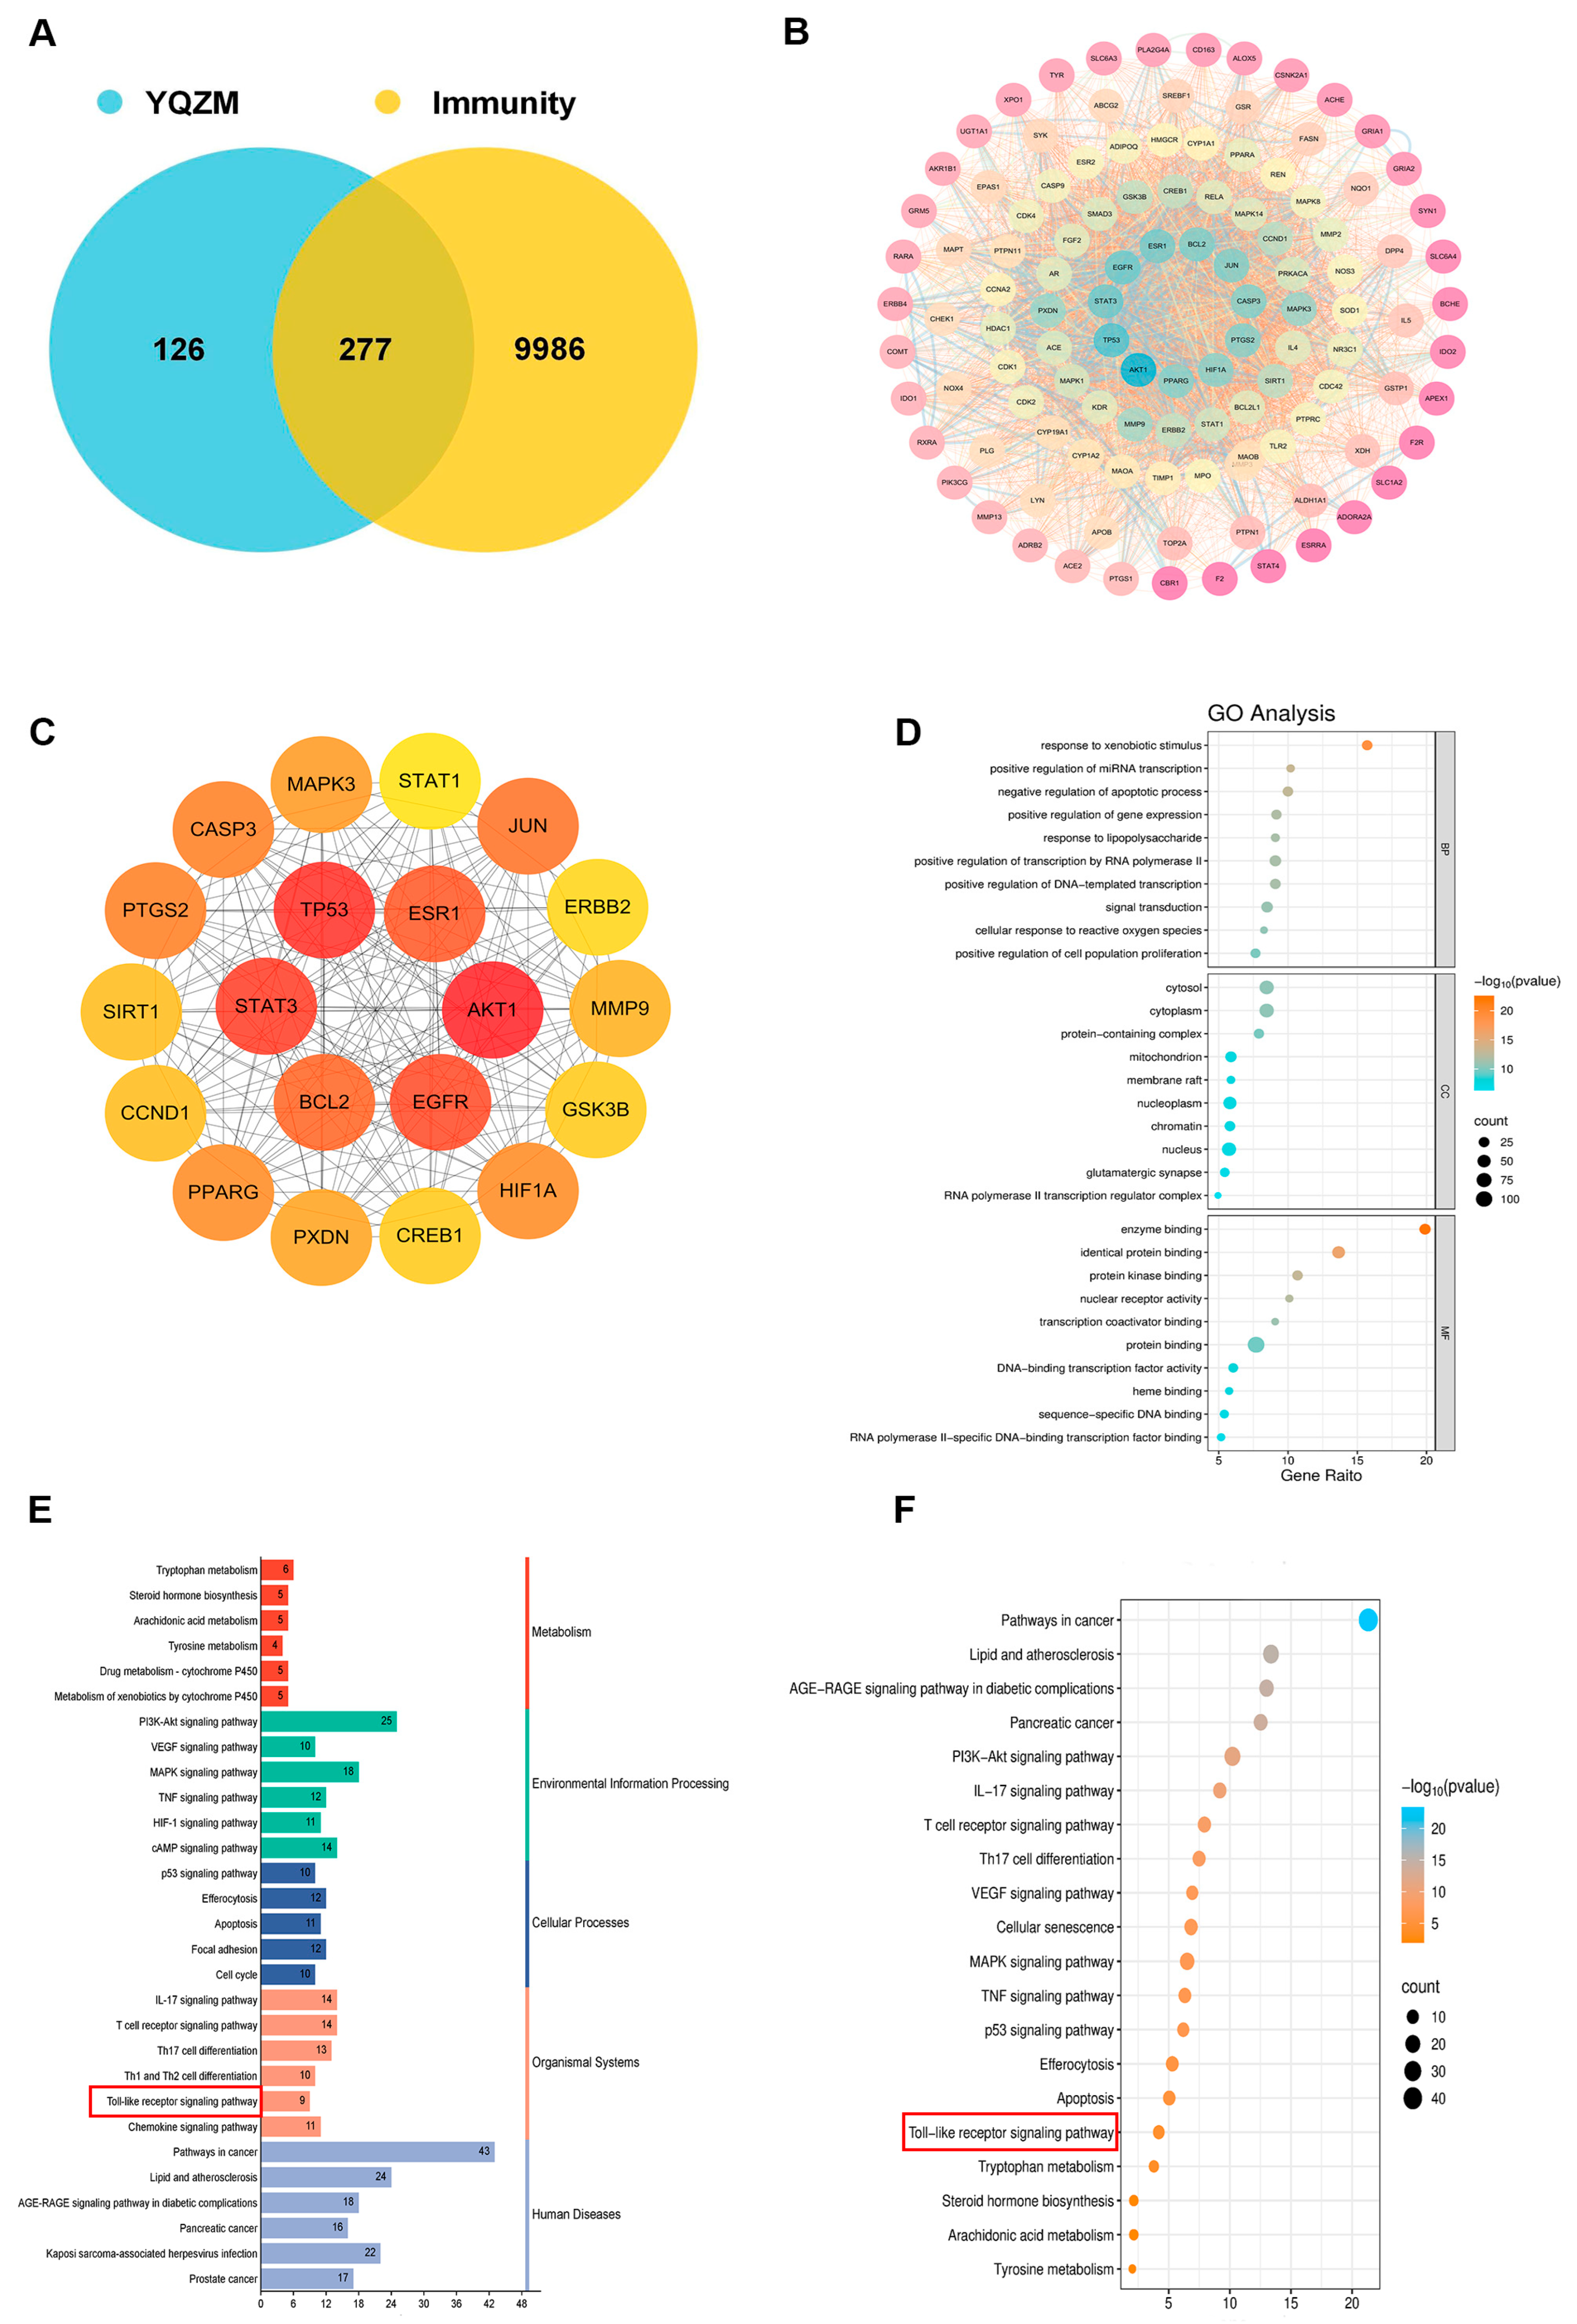
Figure 9.
Analysis of potential YQZM action targets and pathways in enhancing immunity. (A) Venn diagram of potential YQZM action targets and immunity targets. (B) Core protein–protein interaction (PPI) network of potential YQZM action targets (114 targets). (C) Top 20 targets of YQZM action targets in enhancing immunity. (D) The top 20 significantly enriched terms of GO analysis are shown in the BP, CC, and MF categories. The X-axis shows the enrichment score, and the size of the circles reflects the number of genes associated with each pathway. (E) The secondary classification of KEGG pathways was selected, with X-axis representing the gene number, the left Y-axis representing the KEGG pathway, and the right Y-axis meaning secondary classification. (F) The top 15 significantly enriched third classification of KEGG pathways were selected, with the X-axis representing the enrichment score.
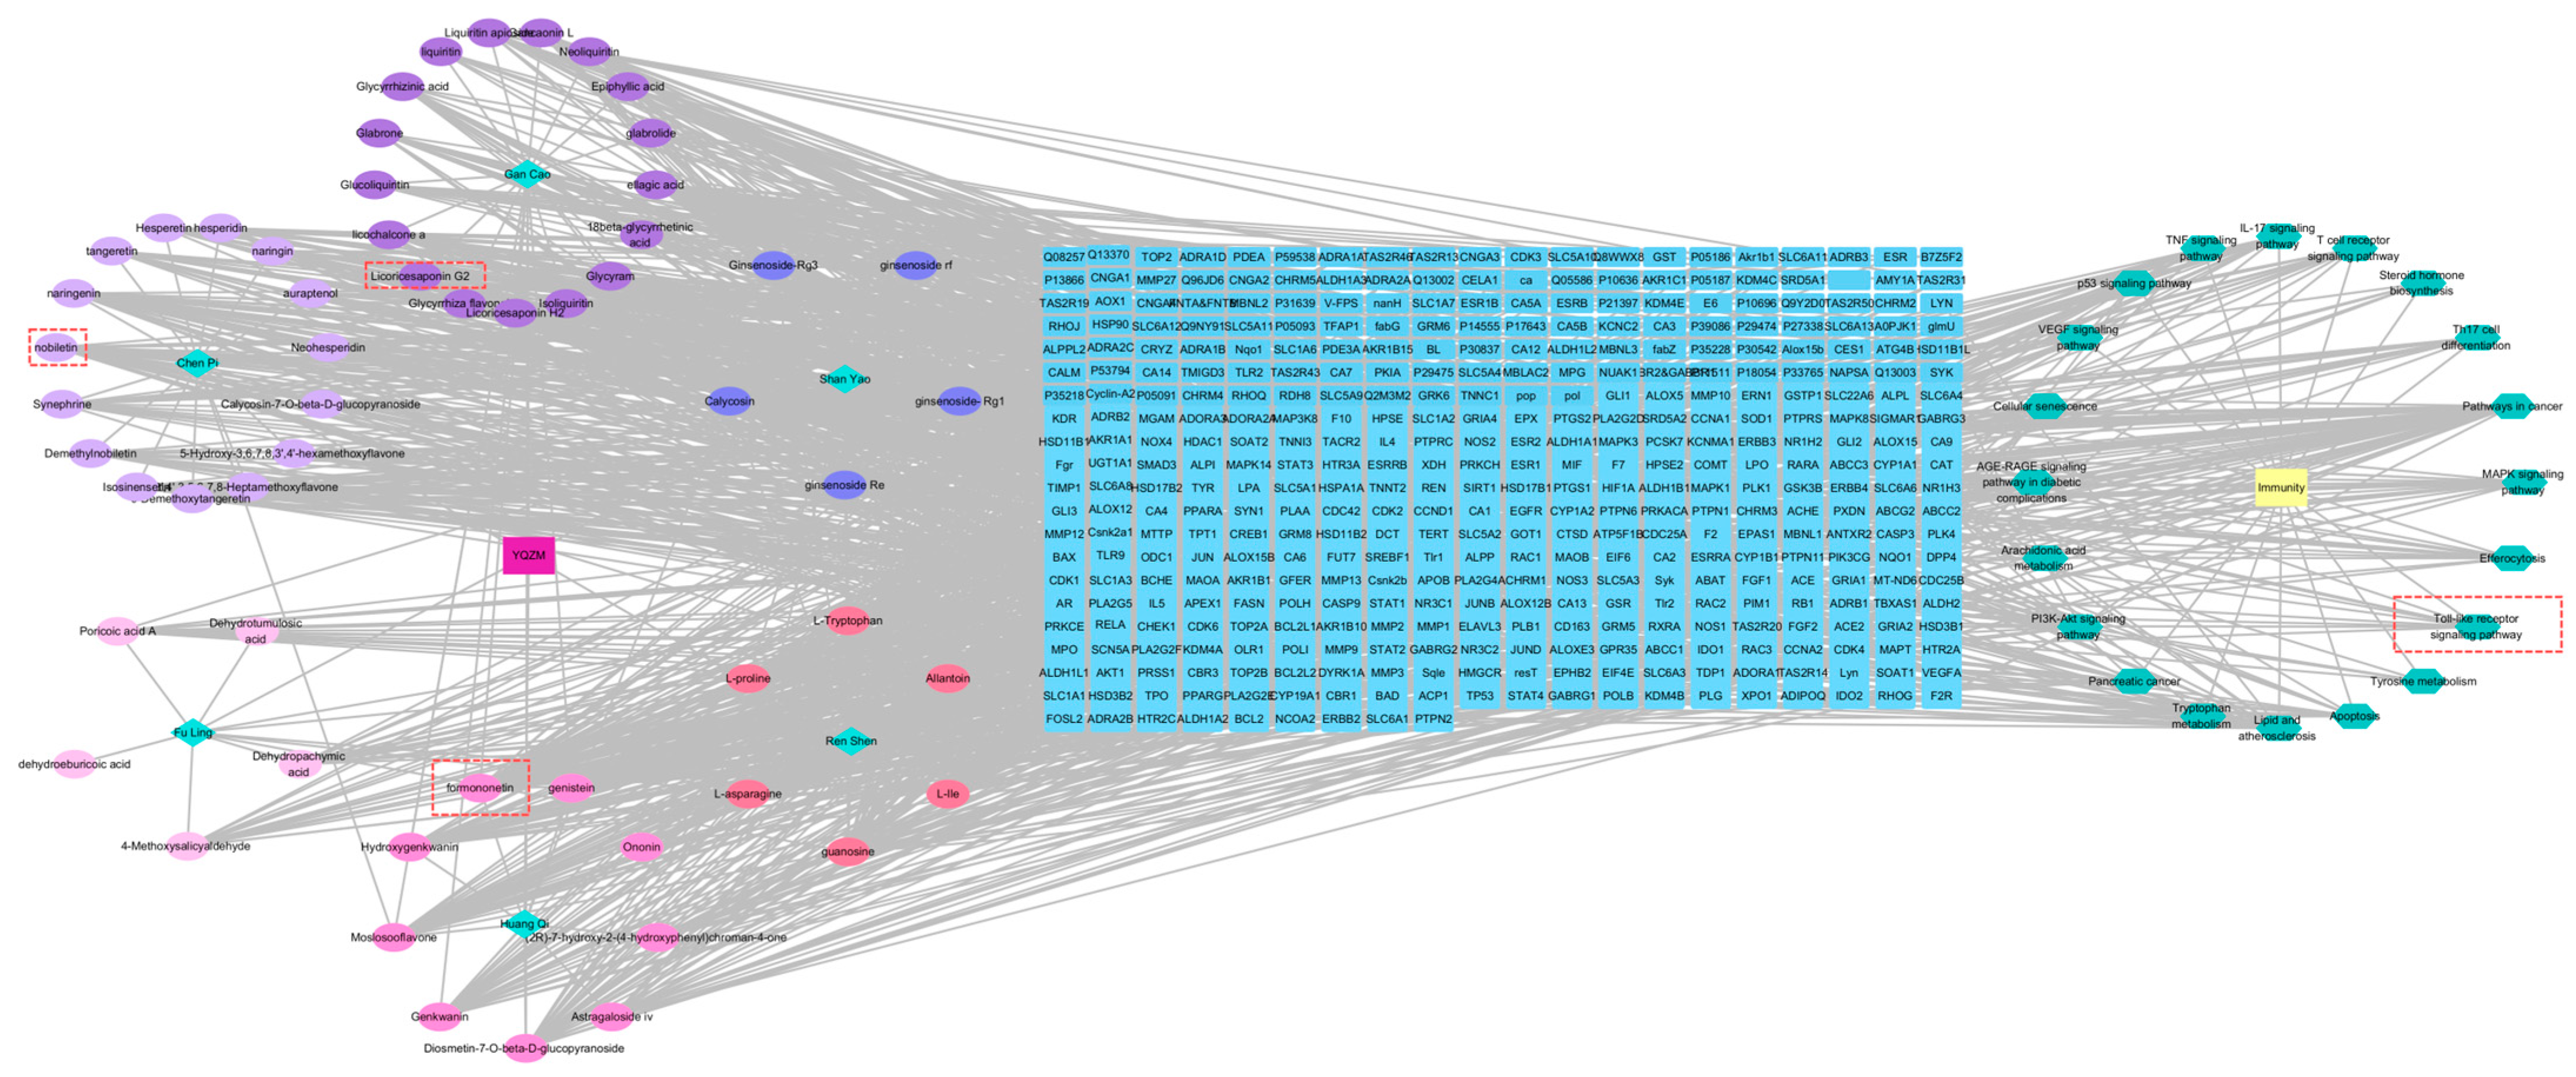
Figure 10.
The drug-compound-target-pathway-disease network. The left-side illustrated the chemical compounds of YQZM and single botanical drug, while the right-side highlighted immunity-related functions and the top 10 KEGG pathways. The intersection gene connecting the two was displayed in the middle.
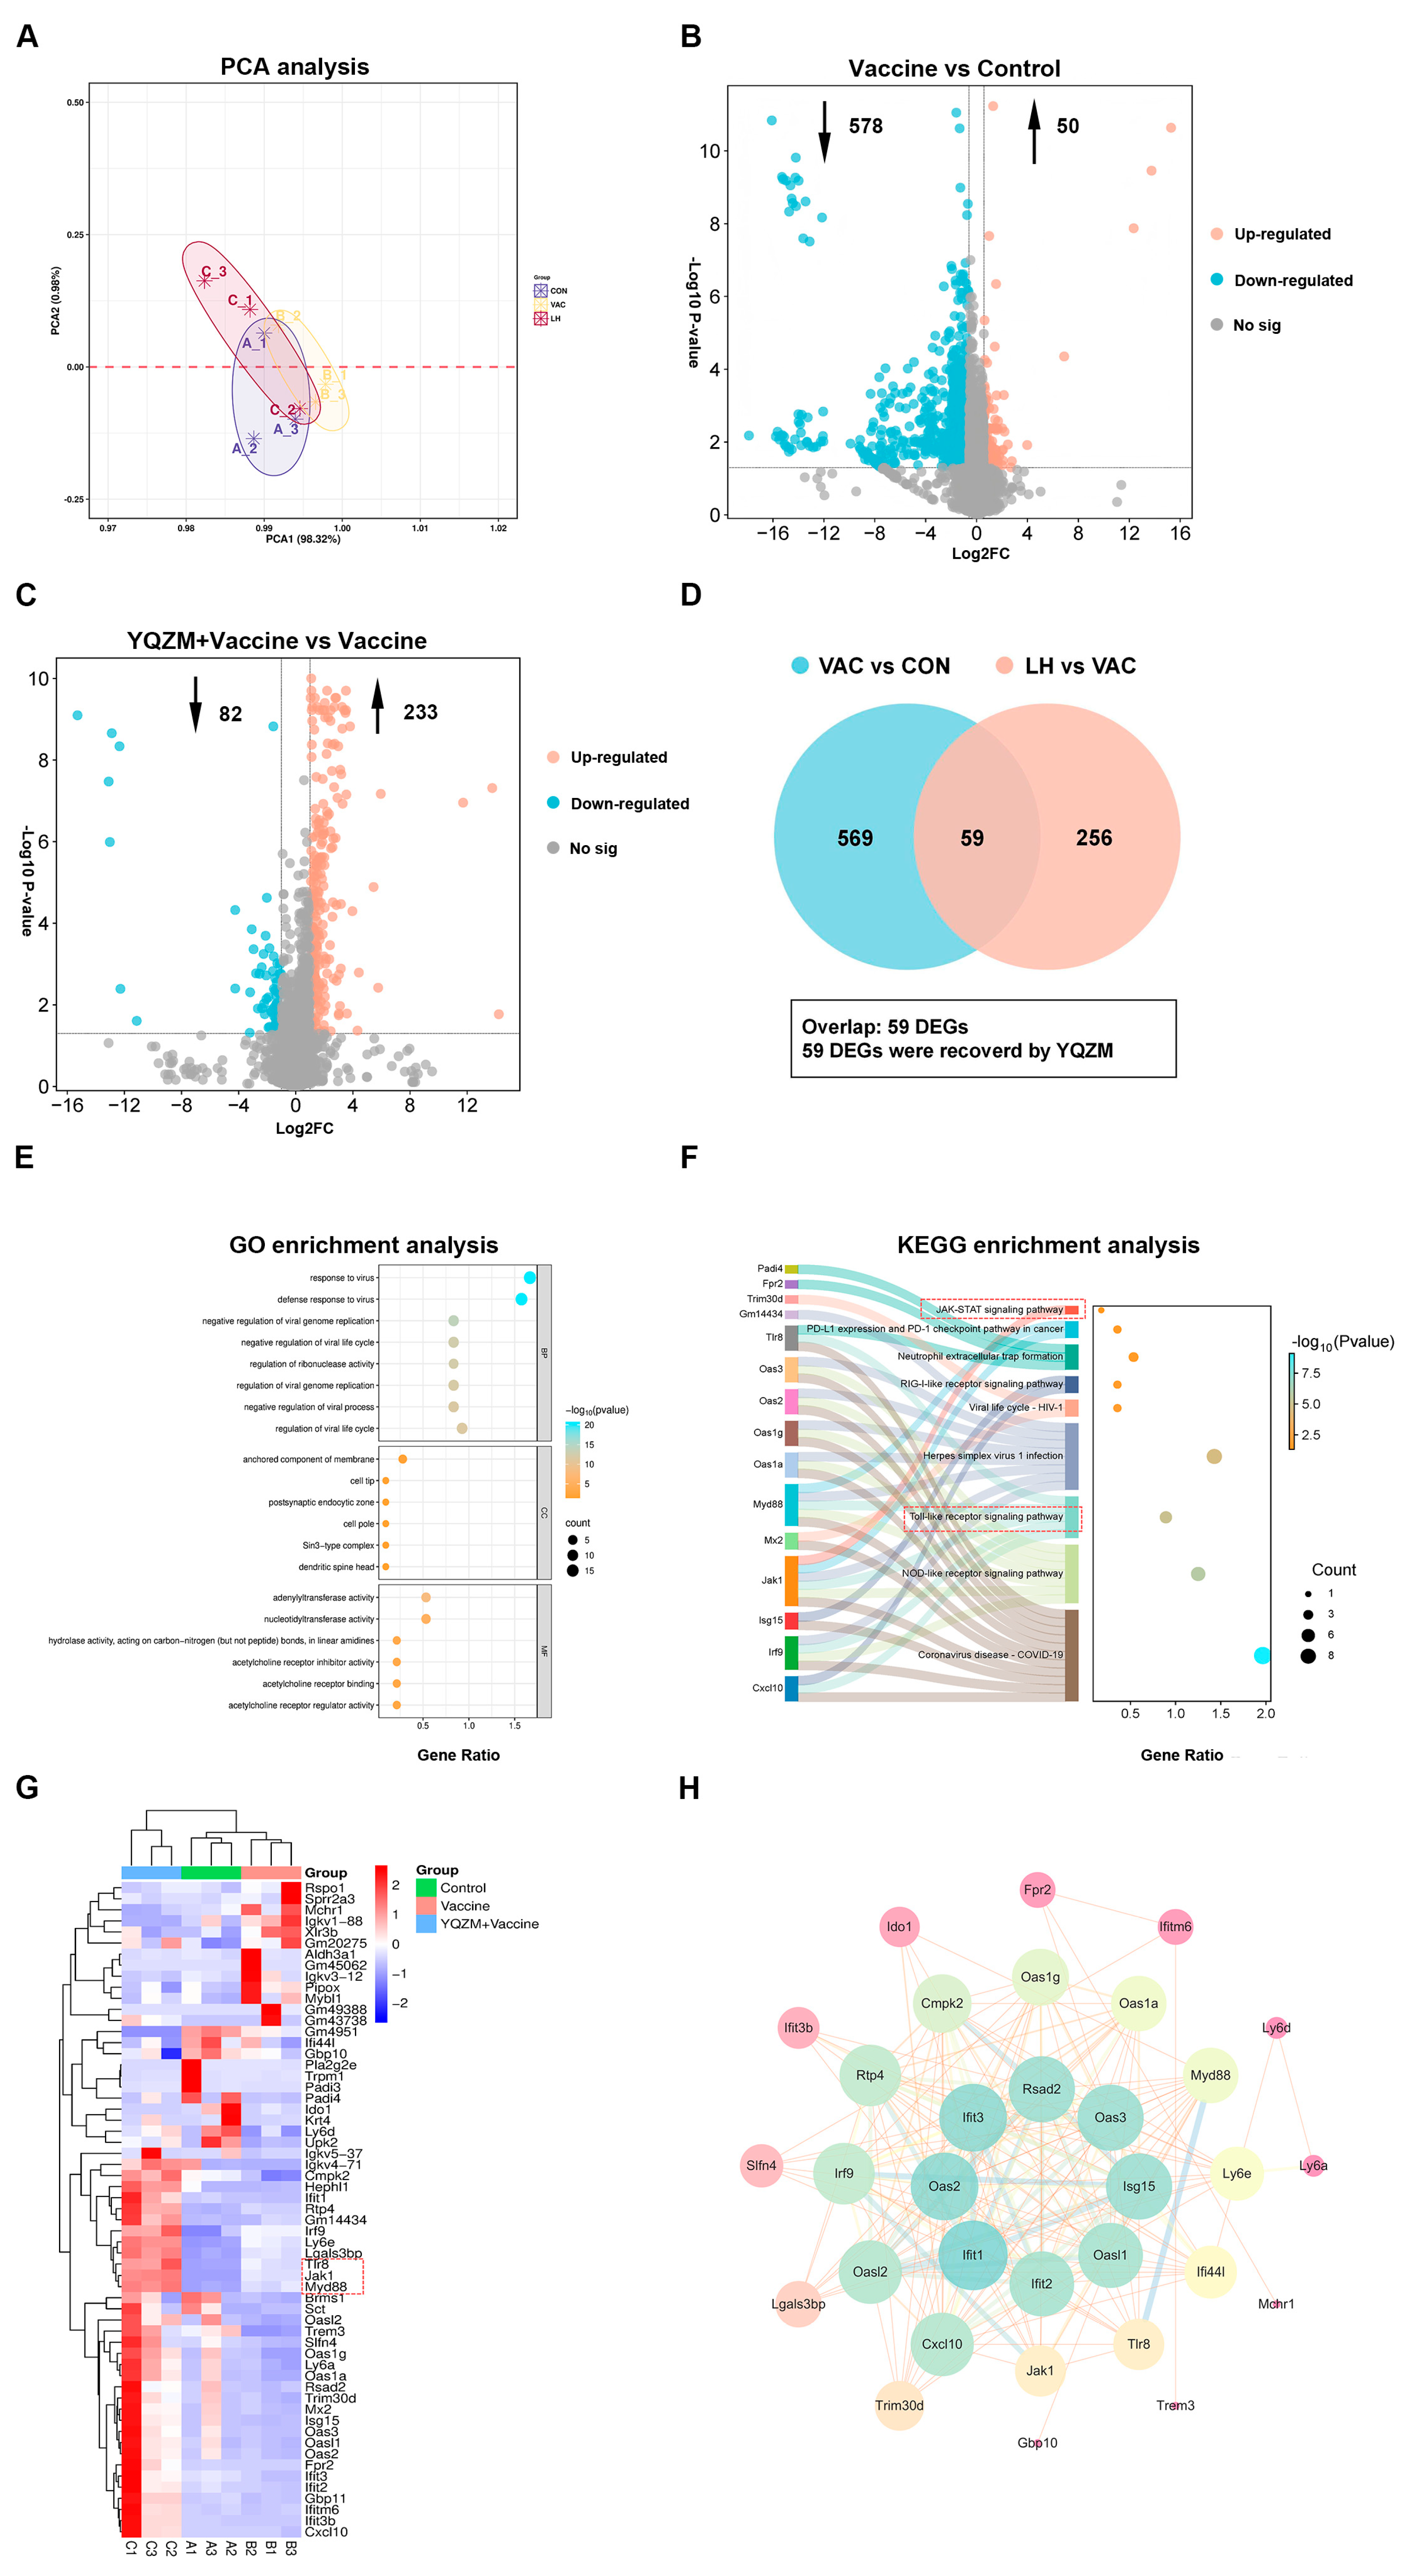
Figure 11.
Screening for differentially expressed genes (DEGs) and functional enrichment analysis. (A) PCA analysis of genes in Control, Vaccine, and YQZM+ Vaccine groups. (B) Volcano map of DEGs between Vaccine and Control groups. (C) Volcano map of DEGs between YQZM+ Vaccine and Vaccine groups. (D) Venn diagram of DEGs between Control, Vaccine, and YQZM+ Vaccine groups. GO and KEGG enrichment analysis in Control, Vaccine, and YQZM+ Vaccine groups are shown in (E) and (F), respectively. (G) Heatmap of DEGs in Control, Vaccine, and YQZM+ Vaccine groups. (H) Protein–protein interaction network of core genes.
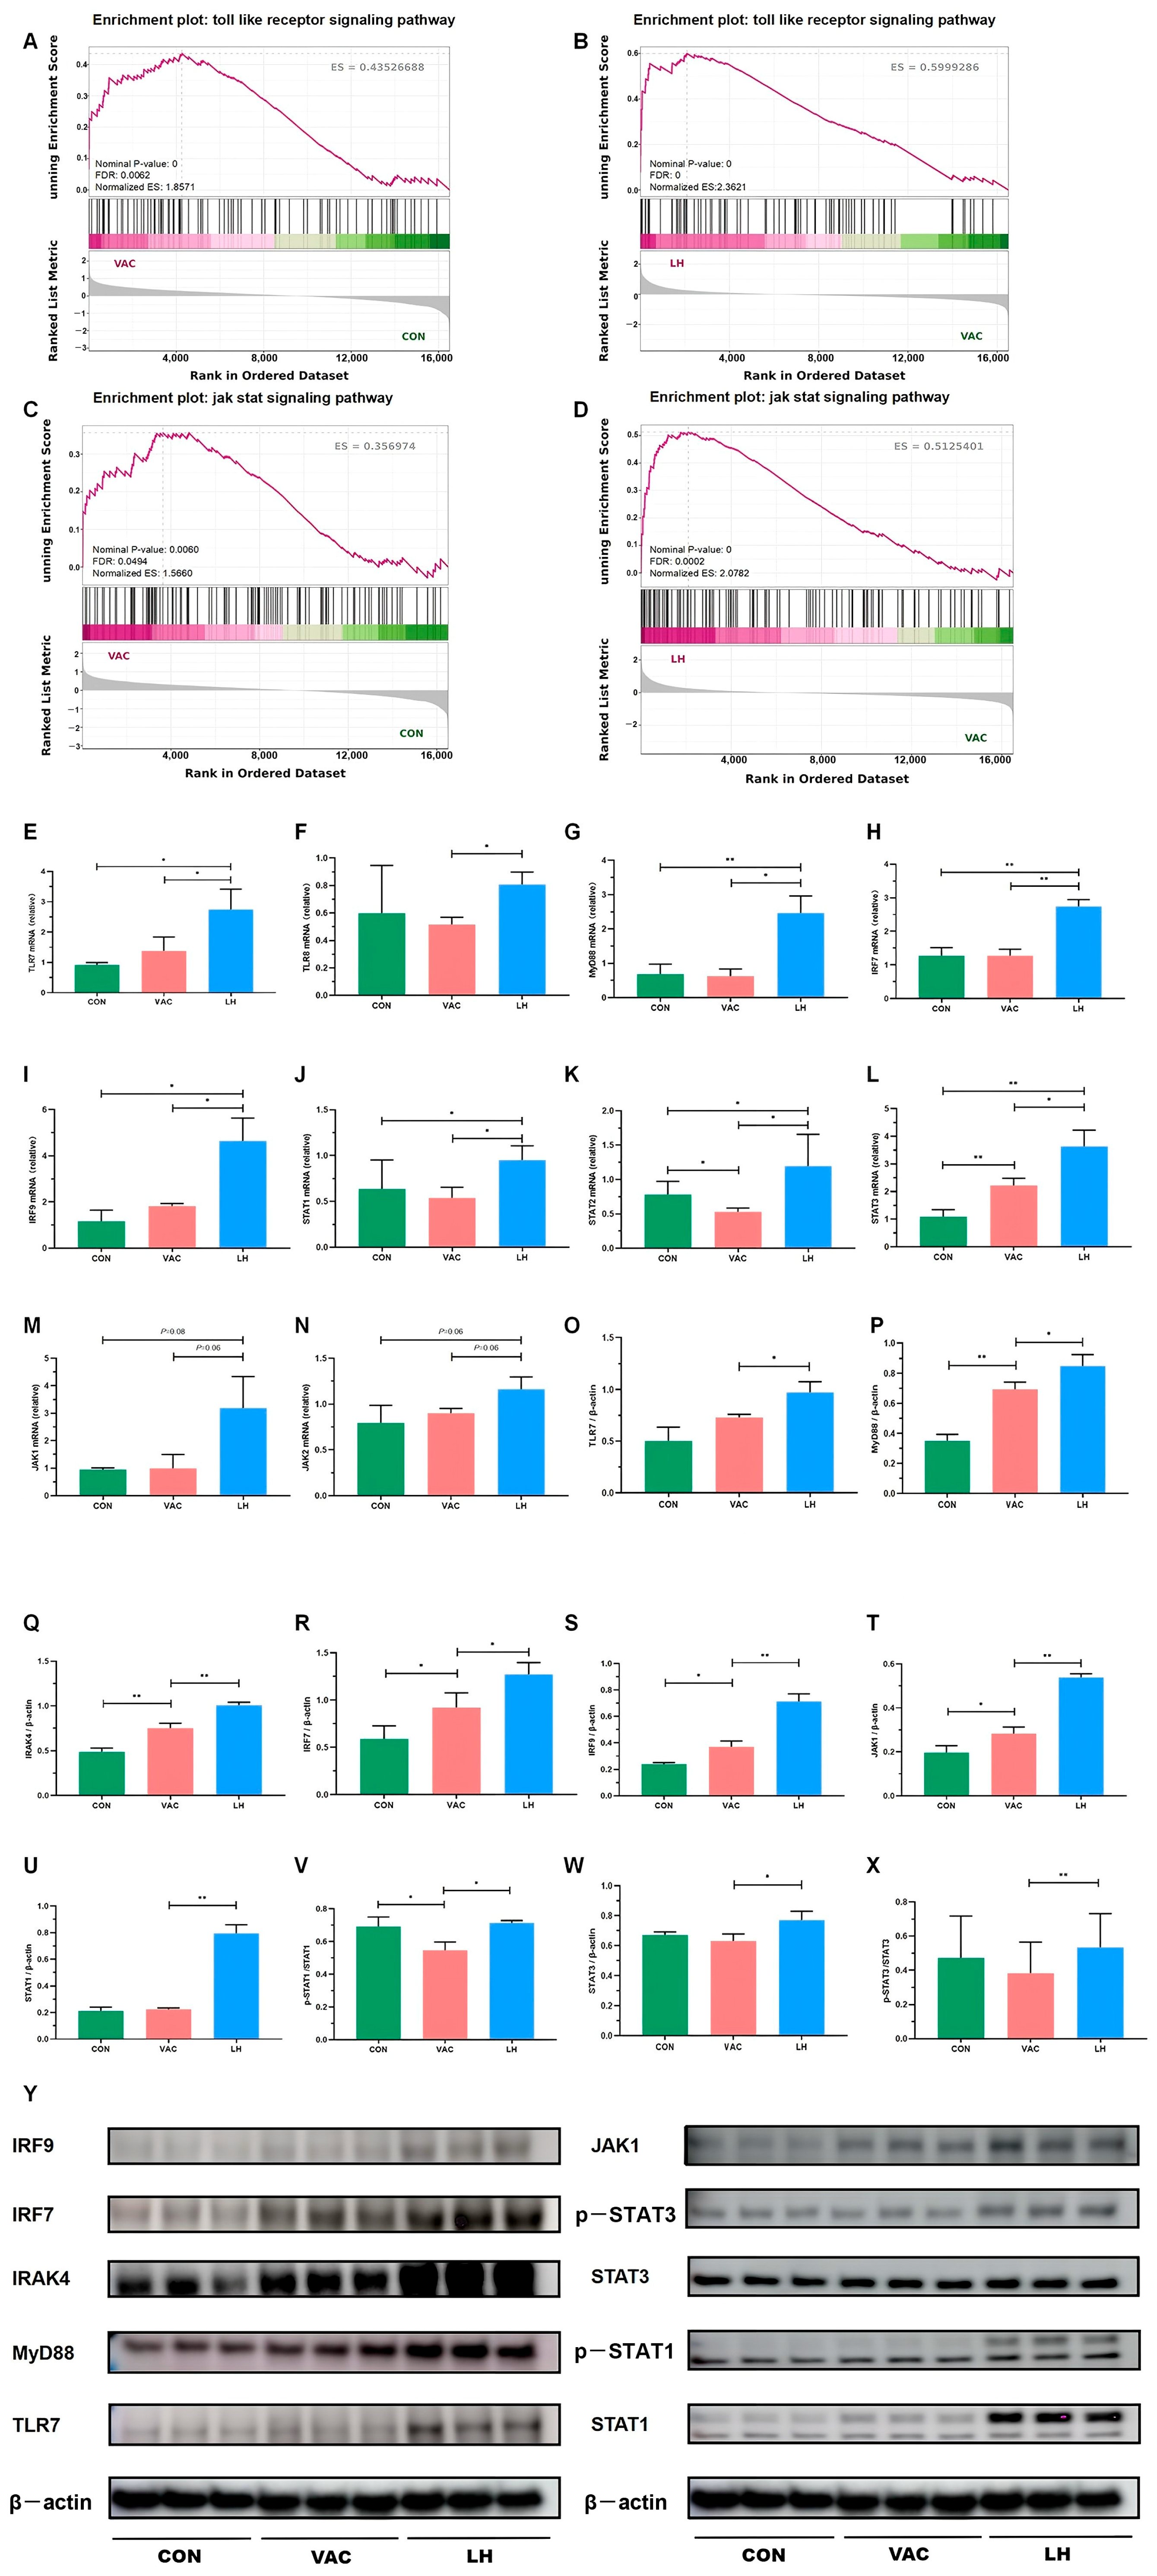
Figure 12.
Validation of key DEGs and DEPs in the Toll-JAK-STAT signaling pathway. (A–D) GSEA analysis of the Toll-like receptor and JAK-STAT signaling pathways in the VAC vs. CON and LH vs. VAC groups. (E–N) RT-qPCR analysis showing mRNA expression levels of TLR7, TLR8, MyD88, IRF7, IRF9, STAT1, STAT2, STAT3, JAK1, and JAK2 (n = 3). (O–X) Western blot analysis of protein expression for TLR7, MyD88, IRAK4, IRF7, IRF9, JAK1, pSTAT1, STAT1, pSTAT3, and STAT3 in the CON, VAC, and LH groups (n = 3). (Y) WB analysis of TLR7, MyD88, IRAK4, IRF7, IRF9, JAK1, pSTAT1, STAT1, pSTAT3, and STAT3 expression across all groups. * p < 0.05, ** p < 0.01.
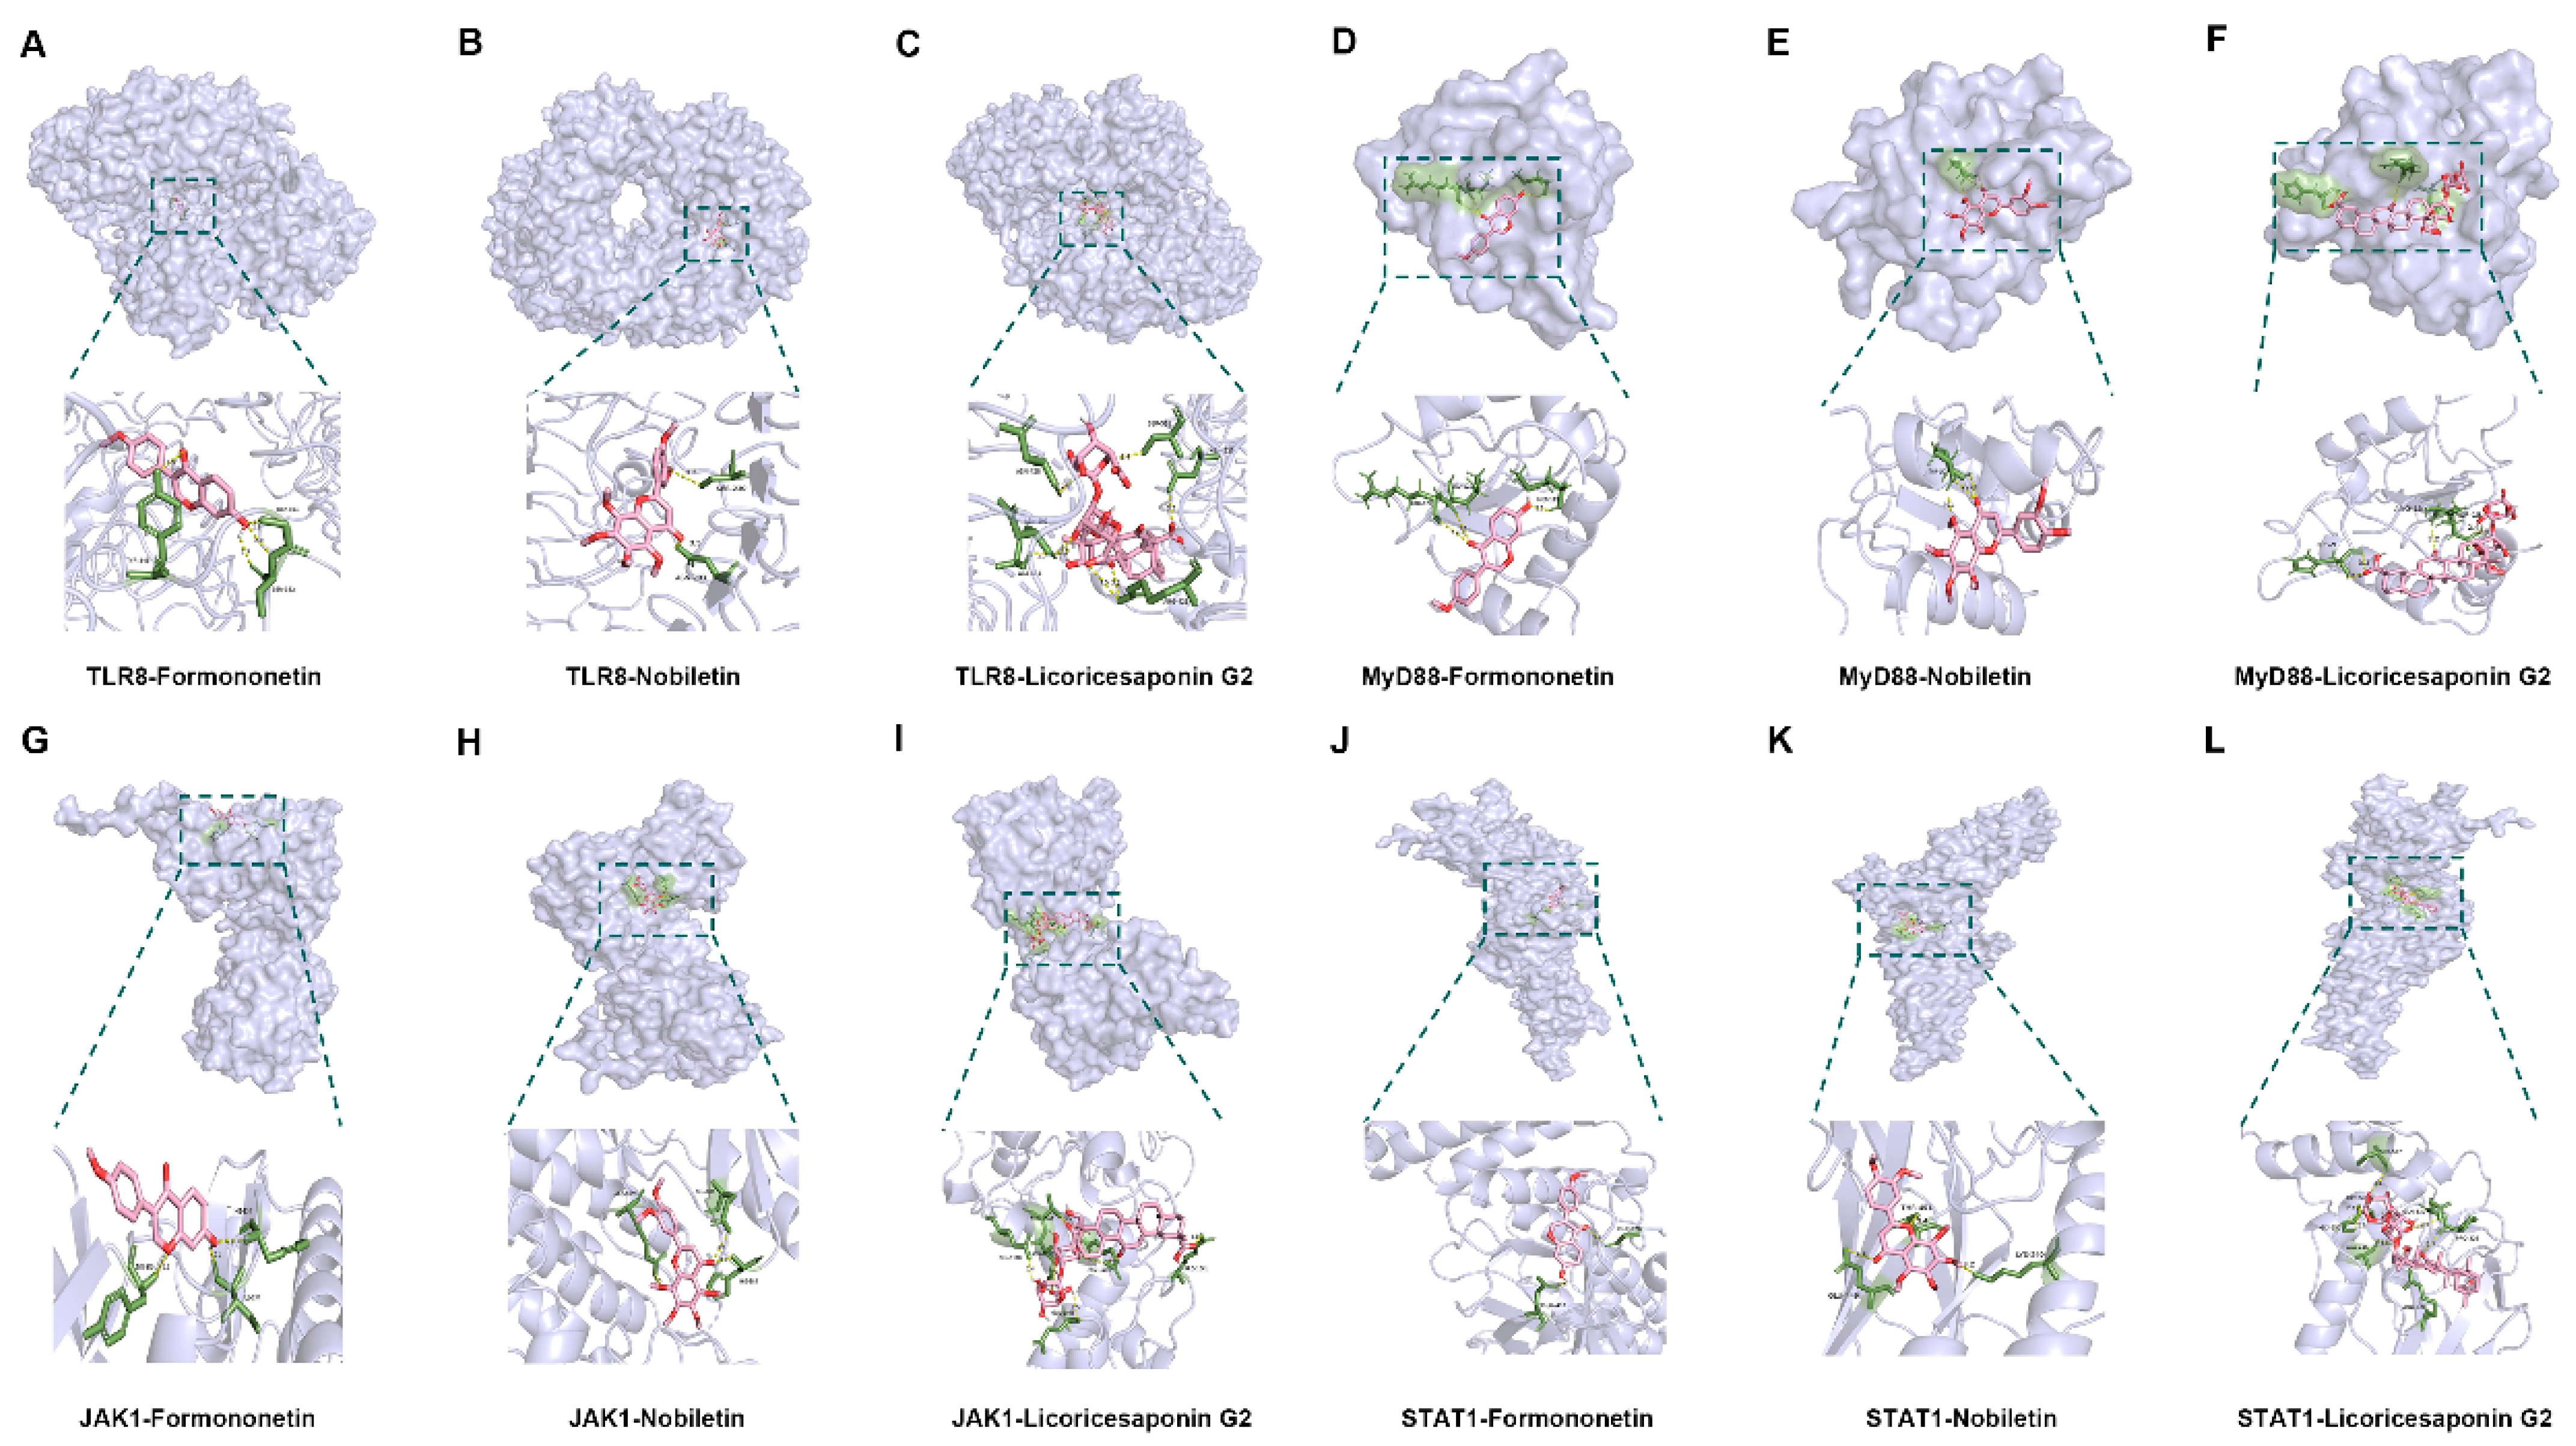
Figure 13.
Visualization of molecular docking. (A–C) Visualization of docking results between TRL8 and Formononetin, Nobiletin, and Licoricesaponin G2. (D–F) Visualization of docking results between MyD88 and Formononetin, Nobiletin, and Licoricesaponin G2. (G–I) Visualization of docking results between JAK1 and Formononetin, Nobiletin, and Licoricesaponin G2. (J–L) Visualization of docking results between STAT1 and Formononetin, Nobiletin, and Licoricesaponin G2.
Table 1.
Chemical composition of YQZM in positive ion mode (ESI+).
Table 1.
Chemical composition of YQZM in positive ion mode (ESI+).
| No. | RT/min | Name | m/z | CAS | Source |
|---|
| 1 | 0.63 | sucrose | 365.11 | 57-50-1 | Ren shen, Huang qi, Fu Ling, Shan yao, Chen pi, Gan cao |
| 2 | 0.65 | L-Proline | 116.07 | 147-85-3 | Shan yao, Fu Ling |
| 3 | 0.88 | Synephrine | 168.10 | 94-07-5 | Chen pi |
| 4 | 1.11 | L-Isoleucine | 132.10 | 73-32-5 | Fu Ling, Shan yao |
| 5 | 2.84 | L-Tryptophan | 205.10 | 73-22-3 | Shan yao, Fu Ling |
| 6 | 4.21 | Calycosin-7-O-beta-D-glucoside | 447.13 | 20633-67-4 | Chen pi |
| 7 | 4.28 | Liquiritin | 419.13 | 551-15-5 | Gan cao |
| 8 | 4.55 | Naringenin | 273.08 | 480-41-1 | Chen pi |
| 9 | 4.79 | Neohesperidin | 611.20 | 13241-33-3 | Chen pi |
| 10 | 5.24 | Isoliquiritoside | 419.13 | 5041-81-6 | Gan cao |
| 11 | 5.36 | Auraptenol | 261.11 | 1221-43-8 | Chen pi |
| 12 | 5.46 | Ononin | 431.13 | 486-62-4 | Huang qi |
| 13 | 5.98 | Calycosin | 285.08 | 20575-57-9 | Huang qi, Ren shen, Gan cao |
| 14 | 7.07 | Glucoliquiritin | 581.19 | 93446-18-5 | Gan cao |
| 15 | 7.20 | Moslosooflavone | 299.09 | 3570-62-5 | Gan cao, Huang qi, Chen pi |
| 16 | 7.45 | Gancaonin L | 355.12 | 129145-50-2 | Gan cao |
| 17 | 8.02 | 5-O-Demethylnobiletin | 389.12 | 2174-59-6 | Chen pi |
| 18 | 8.20 | Isosinensetin | 373.13 | 17290-70-9 | Chen pi |
| 19 | 8.56 | Licoricesaponin G2 | 839.41 | 118441-84-2 | Gan cao |
| 20 | 8.99 | Formononetin | 267.07 | 485-72-3 | Huang qi |
| 21 | 9.33 | 6-Demethoxytangeretin | 343.12 | 6601-66-7 | Chen pi |
| 22 | 9.51 | Astragaloside IV | 802.49 | 84687-43-4 | Huang qi |
| 23 | 9.69 | Glycyrrhizic acid | 823.41 | 1405-86-3 | Gan cao |
| 24 | 10.14 | Nobiletin | 403.14 | 478-01-3 | Chen pi |
| 25 | 10.23 | Licoflavone A | 323.13 | 61153-77-3 | Gan cao |
| 26 | 10.73 | 3’-Hydroxy-3,5,6,7,8,4′,5′-heptamethoxyflavone | 433.15 | 5244-28-0 | Chen pi |
| 27 | 11.04 | 5-OH-HxMF | 419.13 | 1176-88-1 | Chen pi |
| 28 | 11.15 | Tangeretin | 373.13 | 481-53-8 | Chen pi |
| 29 | 12.37 | Glabrone | 337.11 | 60008-02-8 | Gan cao |
| 30 | 13.43 | Glycyrrhetinic acid | 471.35 | 471-53-4 | Gan cao |
| 31 | 13.93 | Poricoic acid A | 497.33 | 137551-38-3 | Fu Ling |
Table 2.
Chemical composition of YQZM in negative ion mode (ESI−).
Table 2.
Chemical composition of YQZM in negative ion mode (ESI−).
| No. | RT/min | Name | m/z | CAS | Source |
|---|
| 1 | 0.58 | L-asparagine | 131.05 | 70-47-3 | Ren shen, Shan yao, Fu Ling |
| 2 | 0.64 | allantoin | 157.04 | 97-59-6 | Shan yao |
| 3 | 1.08 | Guanosine | 282.08 | 118-00-3 | Ren shen, Shan yao, Fu Ling |
| 4 | 4.22 | Liquiritin apioside | 549.16 | 74639-14-8 | Gan cao |
| 5 | 4.29 | Liquiritin | 417.12 | 5088-75-5 | Gan cao |
| 6 | 4.54 | Naringin | 579.17 | 10236-47-2 | Chen pi |
| 7 | 4.81 | Hesperidin | 609.18 | 520-26-3 | Chen pi |
| 8 | 5.35 | Ginsenoside Re | 991.55 | 52286-59-6 | Ren shen |
| 9 | 5.38 | Ginsenoside Rg1 | 845.49 | 22427-39-0 | Ren shen |
| 10 | 5.60 | Hydroxygenkwanin | 299.06 | 20243-59-8 | Gan cao, Huang qi |
| 11 | 5.99 | Genkwanin | 283.06 | 437-64-9 | Huang qi, Gan cao |
| 12 | 6.23 | Diosmetin-7-O-beta-D-glucopyranoside | 461.11 | 20126-59-4 | Huang qi, Gan cao |
| 13 | 6.88 | Genistein | 269.05 | 446-72-0 | Huang qi, Gan cao |
| 14 | 7.41 | Hesperetin | 301.07 | 520-33-2 | Chen pi |
| 15 | 7.75 | Ginsenoside Rf | 845.49 | 52286-58-5 | Ren shen |
| 16 | 8.15 | Ellagic acid | 357.06 | 476-66-4 | Gan cao |
| 17 | 8.55 | Formononetin | 267.07 | 485-72-3 | Huang qi, Gan cao |
| 18 | 10.43 | Licoricesaponin H2 | 821.40 | 118441-85-3 | Gan cao |
| 19 | 11.91 | Licochalcone A | 337.14 | 58749-22-7 | Gan cao |
| 20 | 12.34 | Ginsenoside Rg3 | 829.50 | 14197-60-5 | Ren shen |
| 21 | 13.26 | Poricoic acid A | 497.33 | 137551-38-3 | Fu Ling |
| 22 | 13.52 | Pachymic acid | 483.35 | 29070-92-6 | Fu Ling |
| 23 | 13.68 | 3β,22β-Dihydroxy-11-oxoolean-12-en-30-oic acid γ-lactone | 467.32 | 10401-33-9 | Gan cao |
Table 3.
Chemical composition of serum containing YQZM in positive ion mode (ESI+).
Table 3.
Chemical composition of serum containing YQZM in positive ion mode (ESI+).
| No. | RT/min | Name | m/z | CAS | Source |
|---|
| 2 | 0.65 | L-Proline | 116.07 | 147-85-3 | Shan yao, Fu Ling |
| 5 | 2.84 | L-Tryptophan | 205.10 | 73-22-3 | Shan yao, Fu Ling |
| 7 | 4.28 | Liquiritin | 419.13 | 551-15-5 | Gan cao |
| 8 | 4.55 | Naringenin | 273.08 | 480-41-1 | Chen pi |
| 9 | 4.79 | Neohesperidin | 611.20 | 13241-33-3 | Chen pi |
| 10 | 5.24 | Isoliquiritoside | 419.13 | 5041-81-6 | Gan cao |
| 12 | 5.46 | Ononin | 431.13 | 486-62-4 | Huang qi |
| 13 | 5.98 | Calycosin | 285.08 | 20575-57-9 | Huang qi, Ren shen, Gan cao |
| 15 | 7.20 | Moslosooflavone | 299.09 | 3570-62-5 | Gan cao, Huang qi, Chen pi |
| 17 | 8.02 | 5-O-Demethylnobiletin | 389.12 | 2174-59-6 | Chen pi |
| 18 | 8.20 | Isosinensetin | 373.13 | 17290-70-9 | Chen pi |
| 19 | 8.56 | Licoricesaponin G2 | 839.41 | 118441-84-2 | Gan cao |
| 21 | 9.33 | 6-Demethoxytangeretin | 343.12 | 6601-66-7 | Chen pi |
| 23 | 9.69 | Glycyrrhizic acid | 823.41 | 1405-86-3 | Gan cao |
| 24 | 10.14 | Nobiletin | 403.14 | 478-01-3 | Chen pi |
| 26 | 10.73 | 3′-Hydroxy-3,5,6,7,8,4′,5′-heptamethoxyflavone | 433.15 | 5244-28-0 | Chen pi |
| 28 | 11.15 | Tangeretin | 373.13 | 481-53-8 | Chen pi |
Table 4.
Chemical composition of serum containing YQZM in negative ion mode (ESI−).
Table 4.
Chemical composition of serum containing YQZM in negative ion mode (ESI−).
| No. | RT/min | Name | m/z | CAS | Source |
|---|
| 1 | 0.58 | L-asparagine | 131.05 | 70-47-3 | Ren shen, Shan yao, Fu Ling |
| 2 | 0.64 | allantoin | 157.04 | 97-59-6 | Shan yao |
| 5 | 4.29 | Liquiritin | 417.12 | 5088-75-5 | Gan cao |
| 7 | 4.81 | Hesperidin | 609.18 | 520-26-3 | Chen pi |
| 8 | 5.35 | Ginsenoside Re | 991.55 | 52286-59-6 | Ren shen |
| 12 | 6.23 | Diosmetin-7-O-beta-D-glucopyranoside | 461.11 | 20126-59-4 | Huang qi, Gan cao |
| 13 | 6.88 | Genistein | 269.05 | 446-72-0 | Huang qi, Gan cao |
| 14 | 7.41 | Hesperetin | 301.07 | 520-33-2 | Chen pi |
| 15 | 7.75 | Ginsenoside Rf | 845.49 | 52286-58-5 | Ren shen |
| 16 | 8.15 | Ellagic acid | 357.06 | 476-66-4 | Gan cao |
| 17 | 8.55 | Formononetin | 267.07 | 485-72-3 | Huang qi, Gan cao |
| 18 | 10.43 | Licoricesaponin H2 | 821.40 | 118441-85-3 | Gan cao |
| 20 | 12.34 | Ginsenoside Rg3 | 829.50 | 14197-60-5 | Ren shen |
| 22 | 13.52 | Pachymic acid | 483.35 | 29070-92-6 | Fu Ling |
Table 5.
Composition of YQZM.
Table 5.
Composition of YQZM.
| Chinese Name | Latin Name | Medicinal Part | Source | Weights/g |
|---|
| Ren Shen | Panax ginseng | Radix and rhizome | Panax ginseng C. A. Mey. | 10 |
| Huang Qi | Astragalus membranaceus | Radix | Astragalus membranaceus (Fisch.) Bge.var.mongholicus (Bge.) Hsiao | 15 |
| Chen Pi | Citri Reticulatae Pericarpium | Peel | Citrus reticulata Blanco | 15 |
| Fu Ling | Poria cocos | Sclerotium | Poria cocos (Schw.) Wolf | 9 |
| Shan Yao | Dioscorea opposita | Rhizome | Dioscorea polystachya Turcz. | 9 |
| Gan Cao | Glycyrrhiza glabra | Radix and rhizome | Glycyrrhiza uralensis Fisch. | 7 |
Table 6.
Primer sequence.
Table 6.
Primer sequence.
| Name | Upstream (5′-3′) | Downstream (5′-3′) |
|---|
| GAPDH | AAATTCAACGGCACAGTCAA | TAGACTCCACGACATACTCAGCA |
| IRF7 | GCGTACCCTGGAAGCATTTC | GCACAGCGGAAGTTGGTCT |
| IRF9 | CCTCAGGCAAAGTACGCTG | GGGGTGTCCTATGTCCCCA |
| JAK1 | CTCTGGTATGCTCCAAATCG | TGTCCATCCTGCTCGGTC |
| JAK2 | GAGCTACTGAAGAACAACGG | TGAAAGAGGGACGTTGGTTGA |
| MyD88 | GGCCCCGGTCTCCTCCACA | GCCACCTGTGTCCGCACGTT |
| STAT1 | CTATGATGTCTCGTTTGCG | CTTTTCCGTATGTTGTGCTG |
| STAT2 | CCAGCTTTACTCGCACAGC | AGCCTTGGAATCATCACTCCC |
| STAT3 | AGCAGCAGGAAAATGGCTCCTCCAG | GTTCACTCAAAGGCGAGGGTTGTGG |
| TLR7 | AAGGGGTATCAGCGTCTA | GTATGCTCTGGGAAAGGT |
| TLR8 | TCGTCTTGACCGTTTGTGGAATG | CCATTTGGGATTTGTTGAAGGTTATT |


 ,
, 

