
Recent HPLC-UV Approaches for Cannabinoid Analysis: From Extraction to Method Validation and Quantification Compliance


Abstract
1. Introduction
2. Cannabinoids
2.1. Δ9-Tetrahydrocannabinol (Δ9-THC)
2.2. Cannabidiol (CBD)
2.3. Cannabinol (CBN)
2.4. Cannabigerol (CBG)
2.5. Tetrahydrocannabivarin (THCV)
2.6. Cannabidivarin (CBDV)
3. Extraction of Cannabinoids
3.1. Extraction of Cannabinoids from Plant Material
3.2. Extraction of Cannabinoids from Oils and Resins
3.3. Extraction of Cannabinoids from Food Products
3.4. Extraction of Cannabinoids from Pharmaceutical and Other Formulated Products
3.5. Extraction of Cannabinoids from Biological Materials
4. HPLC-UV Analysis
4.1. Stationary Phases
- (i) particle size > 2 μm: Ascentis Express C18 (150 × 3.0 mm, 2.7 μm), Waters Cortecs Shield RP18 (150 × 4.6 mm, 2.7 μm), InfinityLab Poroshell 120 EC-C18 (150 × 3 mm, 2.7 μm), NexLeaf CBX for Potency C18 (150 × 4.6 mm, 2.7 μm), Phenomenex Kinetex C18 (150 × 4.6 mm, 2.6 μm), and Phenomenex Luna C18(2) (150 × 4.6 mm, 5.0 μm), all with a length of 150 mm.
- (ii) particle size < 2 μm: Waters Cortecs UPLC C18 (100 × 2.1 mm, 1.6 μm) and Phenomenex Kinetex C18 (150 × 2.1 mm, 1.7 μm).
4.2. Mobile Phases and Type of Elution
4.3. UV Detection
4.4. Retention Time and Difficult Resolutions
- CBDV(A) and THCV(A) have shorter retention times than their homologous CBD(A) and Δ9-THC(A) due to their shorter C3-side chains (n = 3 vs. 5, respectively), which leads to decreased lipophilicity.
- Cannabinoids with two hydroxyl groups are more polar than their one-hydroxyl chromane or chromene counterpart, leading to shorter retention times (e.g., CBD, CBDV, and CBG vs. Δ9-THC, THCV, and CBC, respectively).
- Δ9-THC tends to elute slower than its oxidative product, CBN, due to a decrease in lipophilicity caused by the two extra double bonds formed during ring aromatization.
- CBC(A), which has two aliphatic side chains, is slightly less polar than Δ9-THC(A), resulting in longer retention times.
5. Analytical Method Validation
5.1. Validation Guidelines
- Association of Official Analytical Collaboration (AOAC) International guidelines: Appendix F: Guidelines for Standard Method Performance Requirements [285]; Appendix K: Guidelines for Dietary Supplements and Botanicals [290]; Standard Method Performance Requirements (SMPRs®) for Quantitation of Cannabinoids in Plant Materials of Hemp (Low THC Varieties Cannabis sp.) [291]—10 papers.
- International Organization for Standardization (ISO) 17025: General requirements for the competence of testing and calibration laboratories [292]—9 papers.
- Agência Nacional de Vigilância Sanitária (ANVISA) RDC Nº 166/2017 [295]—3 papers.
- Eurachem group—The Fitness for Purpose of Analytical Methods [296]—3 papers.
- United States Pharmacopeia (USP) (e.g., [297])—3 papers.
- American Academy of Forensic Science: Standard Practices for Method Validation in Forensic Toxicology (ANSI/ASB Standard 036) [298]—2 papers.
- SANTE 11312/2021—Analytical Quality Control and Method Validation Procedures for Pesticide Residues Analysis in Food and Feed [299]—2 papers.
- United Nations Office on Drugs and Crime (UNODC): Guidance For the Implementation of a Quality Management System in Drug Testing Laboratories [300]—1 paper.
- Scientific Working Group for Forensic Toxicology (SWGTOX): standard practices for method validation in forensic toxicology [301]—1 paper.
5.2. Precision
5.3. Accuracy
- Comparison to a reference standard or to an already validated procedure.
- Recovery of the analyte spiked into blank matrix or surrogate matrix.
- Standard addition method.
5.4. Lower Range Limits
- Based on signal-to-noise ratio (S/N).
- Based on visual evaluation/Based on accuracy and precision at lower range limits.
- Based on standard deviation of a linear response and a slope.
5.5. General Matrix Interference Considerations
6. Green Analytical Chemistry Considerations
7. Materials and Methods
8. Conclusions and Future Directions
Supplementary Materials
Author Contributions
Funding
Institutional Review Board Statement
Informed Consent Statement
Data Availability Statement
Conflicts of Interest
Abbreviations
| AC | Acidic cannabinoids |
| ACN | Acetonitrile |
| AOAC | Association of Official Analytical Collaboration |
| C18 | Octadecyl |
| C8 | Octyl |
| CB | Cannabinoid receptor |
| CBC | Cannabichromene |
| CBCA | Cannabichromenic acid |
| CBCO | Cannabichromeorcin |
| CBCT | Cannabicitran |
| CBCV | Cannabichromevarin |
| CBCVA | Cannabichromivarinic acid |
| CBD | Cannabidiol |
| CBDA | Cannabidiolic acid |
| CBDA-ME | Cannabidiolic acid methyl ester |
| CBDP | Cannabidiphorol |
| CBDV | Cannabidivarin |
| CBDVA | Cannabidivarinic acid |
| CBE | Cannabielsoin |
| CBEA | Cannabielsoic acid |
| CBG | Cannabigerol |
| CBGA | Cannabigerolic acid |
| CBGQA | Cannabigerol quinone acid |
| CBGV | Cannabigerovarin |
| CBGVA | Cannabigerovarinic acid |
| CBL | Cannabicyclol |
| CBLA | Cannabicyclolic acid |
| CBN | Cannabinol |
| CBNA | Cannabinolic acid |
| CBT | Cannabitriol |
| CV | Coefficient of variation |
| CINV | Chemotherapy-induced nausea and vomiting |
| DAD | Diode array detector |
| DES | Deep eutectic solvent |
| DM | Dynamic maceration |
| DoE | Design of Experiments |
| DSLME | Dispersive solid–liquid microextraction |
| Δ4(8)-iso-THC | Δ4(8)-iso-tetrahydrocannabinol |
| Δ8-iso-THC | Δ8-iso-tetrahydrocannabinol |
| Δ8-THC | ∆8-tetrahydrocannabinol |
| Δ9-THC | ∆9-tetrahydrocannabinol |
| Δ8-THCA | ∆8-tetrahydrocannabinolic acid |
| DHC | Dihydrocannabinol |
| ES | Eutectic solvent |
| EtOH | Ethanol |
| FA | Formic acid |
| GC | Gas chromatography |
| HBA | Hydrogen bond acceptor |
| HBD | Hydrogen bond donor |
| HPLC | High-performance liquid chromatography |
| ICH | International Council of Harmonisation |
| LC | Liquid chromatography |
| LOD | Limit of detection |
| LOQ | Limit of quantification |
| MeOH | Methanol |
| MS | Mass spectrometry |
| MTBE | Methyl tert-butyl ether |
| MWD | Multiple wavelength detector |
| NC | Neutral cannabinoids |
| NR | Not reported |
| PFP | Pentafluorophenyl |
| QC | Quality Control |
| RP | Reversed-phase |
| RSD | Relative standard deviation |
| RT | Room temperature |
| scCO2 | Supercritical carbon dioxide |
| SE | Soxhlet extraction |
| SFE | Supercritical fluid extraction |
| SLE | Solid–liquid extraction |
| S/N | Signal to noise ratio |
| SPE | Solid phase extraction |
| THCA | ∆9-tetrahydrocannabinolic acid |
| THCB | ∆9-tetrahydrocannabutol |
| THCH | ∆9-tetrahydrocannabihexol |
| THCP | ∆9-tetrahydrocannabiphorol |
| THCV | ∆9-Tetrahydrocannabivarin |
| THCVA | ∆9-Tetrahydrocannabivarinic acid |
| TUV | Tunable ultraviolet |
| UAE | Ultrasound-assisted extraction |
| US | Ultrasound |
| US-LLE | Ultrasound-assisted liquid–liquid extraction |
| US-SLE | Ultrasound-assisted solid–liquid extraction |
| UV | Ultraviolet |
| VWD | Variable wavelength detector |
References
- Berning, A.; Compton, R.; Wochinger, K. Results of the 2013–2014 National Roadside Study of Alcohol and Drug Use by Drivers [Traffic Safety Facts]; United States. Department of Transportation. National Highway Traffic Safety Administration: Washington, DC, USA, 2015. [Google Scholar]
- Farag, S.; Kayser, O. The Cannabis Plant: Botanical Aspects. In Handbook of Cannabis and Related Pathologies; Preedy, V.R., Ed.; Academic Press: San Diego, CA, USA, 2017; pp. 3–12. ISBN 978-0-12-800756-3. [Google Scholar]
- Andre, C.M.; Hausman, J.-F.; Guerriero, G. Cannabis sativa: The Plant of the Thousand and One Molecules. Front. Plant Sci. 2016, 7, 19. [Google Scholar] [CrossRef] [PubMed]
- Ferber, S.G.; Namdar, D.; Hen-Shoval, D.; Eger, G.; Koltai, H.; Shoval, G.; Shbiro, L.; Weller, A. The “Entourage Effect”: Terpenes Coupled with Cannabinoids for the Treatment of Mood Disorders and Anxiety Disorders. Curr. Neuropharmacol. 2020, 18, 87–96. [Google Scholar] [CrossRef] [PubMed]
- Bilbao, A.; Spanagel, R. Medical Cannabinoids: A Pharmacology-Based Systematic Review and Meta-Analysis for All Relevant Medical Indications. BMC Med. 2022, 20, 259. [Google Scholar] [CrossRef] [PubMed]
- Sznitman, S.R.; Zolotov, Y. Cannabis for Therapeutic Purposes and Public Health and Safety: A Systematic and Critical Review. Int. J. Drug Policy 2015, 26, 20–29. [Google Scholar] [CrossRef]
- Fiorini, D.; Molle, A.; Nabissi, M.; Santini, G.; Benelli, G.; Maggi, F. Valorizing Industrial Hemp (Cannabis sativa L.) by-Products: Cannabidiol Enrichment in the Inflorescence Essential Oil Optimizing Sample Pre-Treatment Prior to Distillation. Ind. Crops Prod. 2019, 128, 581–589. [Google Scholar] [CrossRef]
- Duchateau, C.; Stévigny, C.; Waeytens, J.; Deconinck, E. Chromatographic and Spectroscopic Analyses of Cannabinoids: A Narrative Review Focused on Cannabis Herbs and Oily Products. Molecules 2025, 30, 490. [Google Scholar] [CrossRef]
- Inamassu, C.H.; Raspini E Silva, L.; Marchioni, C. Recent Advances in the Chromatographic Analysis of Endocannabinoids and Phytocannabinoids in Biological Samples. J. Chromatogr. A 2024, 1732, 465225. [Google Scholar] [CrossRef]
- Madden, O.; Walshe, J.; Kishore Patnala, P.; Barron, J.; Meaney, C.; Murray, P. Phytocannabinoids—An Overview of the Analytical Methodologies for Detection and Quantification of Therapeutically and Recreationally Relevant Cannabis Compounds. Crit. Rev. Anal. Chem. 2023, 53, 211–231. [Google Scholar] [CrossRef]
- Antunes, M.; Barroso, M.; Gallardo, E. Analysis of Cannabinoids in Biological Specimens: An Update. Int. J. Environ. Res. Public Health 2023, 20, 2312. [Google Scholar] [CrossRef]
- Stefkov, G.; Cvetkovikj Karanfilova, I.; Stoilkovska Gjorgievska, V.; Trajkovska, A.; Geskovski, N.; Karapandzova, M.; Kulevanova, S. Analytical Techniques for Phytocannabinoid Profiling of Cannabis and Cannabis-Based Products—A Comprehensive Review. Molecules 2022, 27, 975. [Google Scholar] [CrossRef]
- Deidda, R.; Dispas, A.; De Bleye, C.; Hubert, P.; Ziemons, É. Critical Review on Recent Trends in Cannabinoid Determination on Cannabis Herbal Samples: From Chromatographic to Vibrational Spectroscopic Techniques. Anal. Chim. Acta 2022, 1209, 339184. [Google Scholar] [CrossRef]
- Micalizzi, G.; Vento, F.; Alibrando, F.; Donnarumma, D.; Dugo, P.; Mondello, L. Cannabis sativa L.: A Comprehensive Review on the Analytical Methodologies for Cannabinoids and Terpenes Characterization. J. Chromatogr. A 2021, 1637, 461864. [Google Scholar] [CrossRef] [PubMed]
- Pourseyed Lazarjani, M.; Torres, S.; Hooker, T.; Fowlie, C.; Young, O.; Seyfoddin, A. Methods for Quantification of Cannabinoids: A Narrative Review. J. Cannabis Res. 2020, 2, 35. [Google Scholar] [CrossRef]
- Karschner, E.L.; Swortwood-Gates, M.J.; Huestis, M.A. Identifying and Quantifying Cannabinoids in Biological Matrices in the Medical and Legal Cannabis Era. Clin. Chem. 2020, 66, 888–914. [Google Scholar] [CrossRef]
- Citti, C.; Braghiroli, D.; Vandelli, M.A.; Cannazza, G. Pharmaceutical and Biomedical Analysis of Cannabinoids: A Critical Review. J. Pharm. Biomed. Anal. 2018, 147, 565–579. [Google Scholar] [CrossRef] [PubMed]
- Leghissa, A.; Hildenbrand, Z.L.; Schug, K.A. A Review of Methods for the Chemical Characterization of Cannabis Natural Products. J. Sep. Sci. 2018, 41, 398–415. [Google Scholar] [CrossRef]
- Nahar, L.; Gavril, G.-L.; Sarker, S.D. Application of Gas Chromatography in the Analysis of Phytocannabinoids: An Update (2020–2023). Phytochem. Anal. 2023, 34, 903–924. [Google Scholar] [CrossRef] [PubMed]
- Nahar, L.; Guo, M.; Sarker, S.D. Gas Chromatographic Analysis of Naturally Occurring Cannabinoids: A Review of Literature Published during the Past Decade. Phytochem. Anal. 2020, 31, 135–146. [Google Scholar] [CrossRef]
- Nahar, L.; Onder, A.; Sarker, S.D. A Review on the Recent Advances in HPLC, UHPLC and UPLC Analyses of Naturally Occurring Cannabinoids (2010–2019). Phytochem. Anal. 2020, 31, 413–457. [Google Scholar] [CrossRef]
- Felletti, S.; De Luca, C.; Buratti, A.; Bozza, D.; Cerrato, A.; Capriotti, A.L.; Laganà, A.; Cavazzini, A.; Catani, M. Potency Testing of Cannabinoids by Liquid and Supercritical Fluid Chromatography: Where We Are, What We Need. J. Chromatogr. A 2021, 1651, 462304. [Google Scholar] [CrossRef]
- Nicolaou, A.G.; Christodoulou, M.C.; Stavrou, I.J.; Kapnissi-Christodoulou, C.P. Analysis of Cannabinoids in Conventional and Alternative Biological Matrices by Liquid Chromatography: Applications and Challenges. J. Chromatogr. A 2021, 1651, 462277. [Google Scholar] [CrossRef] [PubMed]
- Nahar, L.; Chaiwut, P.; Sangthong, S.; Theansungnoen, T.; Sarker, S.D. Progress in the Analysis of Phytocannabinoids by HPLC and UPLC (or UHPLC) during 2020–2023. Phytochem. Anal. 2024, 35, 927–989. [Google Scholar] [CrossRef] [PubMed]
- ElSohly, H.N.; ElSohly, M.A. Marijuana Smoke Condensate: Chemistry and Pharmacology. In Marijuana and the Cannabinoids; Springer: Berlin/Heidelberg, Germany, 2007; pp. 67–96. [Google Scholar]
- Castillo, P.E.; Younts, T.J.; Chávez, A.E.; Hashimotodani, Y. Endocannabinoid Signaling and Synaptic Function. Neuron 2012, 76, 70–81. [Google Scholar] [CrossRef]
- Roque-Bravo, R.; Silva, R.S.; Malheiro, R.F.; Carmo, H.; Carvalho, F.; da Silva, D.D.; Silva, J.P. Synthetic Cannabinoids: A Pharmacological and Toxicological Overview. Annu. Rev. Pharmacol. Toxicol. 2023, 63, 187–209. [Google Scholar] [CrossRef] [PubMed]
- Radwan, M.M.; Chandra, S.; Gul, S.; ElSohly, M.A. Cannabinoids, Phenolics, Terpenes and Alkaloids of Cannabis. Molecules 2021, 26, 2774. [Google Scholar] [CrossRef]
- Wang, M.; Wang, Y.-H.; Avula, B.; Radwan, M.M.; Wanas, A.S.; Van Antwerp, J.; Parcher, J.F.; ElSohly, M.A.; Khan, I.A. Decarboxylation Study of Acidic Cannabinoids: A Novel Approach Using Ultra-High-Performance Supercritical Fluid Chromatography/Photodiode Array-Mass Spectrometry. Cannabis Cannabinoid Res. 2016, 1, 262–271. [Google Scholar] [CrossRef]
- Morales, P.; Hurst, D.P.; Reggio, P.H. Molecular Targets of the Phytocannabinoids: A Complex Picture. In Phytocannabinoids: Unraveling the Complex Chemistry and Pharmacology of Cannabis sativa; Kinghorn, A.D., Falk, H., Gibbons, S., Kobayashi, J., Eds.; Springer International Publishing: Cham, Switzerland, 2017; pp. 103–131. ISBN 978-3-319-45541-9. [Google Scholar]
- Pagano, C.; Navarra, G.; Coppola, L.; Avilia, G.; Bifulco, M.; Laezza, C. Cannabinoids: Therapeutic Use in Clinical Practice. Int. J. Mol. Sci. 2022, 23, 3344. [Google Scholar] [CrossRef]
- Weizman, L.; Dayan, L.; Brill, S.; Nahman-Averbuch, H.; Hendler, T.; Jacob, G.; Sharon, H. Cannabis Analgesia in Chronic Neuropathic Pain Is Associated with Altered Brain Connectivity. Neurology 2018, 91, e1285–e1294. [Google Scholar] [CrossRef]
- Van Amerongen, G.; Kanhai, K.; Baakman, A.C.; Heuberger, J.; Klaassen, E.; Beumer, T.L.; Strijers, R.L.M.; Killestein, J.; Van Gerven, J.; Cohen, A.; et al. Effects on Spasticity and Neuropathic Pain of an Oral Formulation of Δ9-Tetrahydrocannabinol in Patients with Progressive Multiple Sclerosis. Clin. Ther. 2018, 40, 1467–1482. [Google Scholar] [CrossRef]
- Bisaga, A.; Sullivan, M.A.; Glass, A.; Mishlen, K.; Pavlicova, M.; Haney, M.; Raby, W.N.; Levin, F.R.; Carpenter, K.M.; Mariani, J.J.; et al. The Effects of Dronabinol during Detoxification and the Initiation of Treatment with Extended Release Naltrexone. Drug Alcohol Depend. 2015, 154, 38–45. [Google Scholar] [CrossRef]
- Lofwall, M.R.; Babalonis, S.; Nuzzo, P.A.; Elayi, S.C.; Walsh, S.L. Opioid Withdrawal Suppression Efficacy of Oral Dronabinol in Opioid Dependent Humans. Drug Alcohol Depend. 2016, 164, 143–150. [Google Scholar] [CrossRef] [PubMed]
- Childs, E.; Lutz, J.A.; De Wit, H. Dose-Related Effects of Delta-9-THC on Emotional Responses to Acute Psychosocial Stress. Drug Alcohol Depend. 2017, 177, 136–144. [Google Scholar] [CrossRef] [PubMed]
- Zabik, N.L.; Rabinak, C.A.; Peters, C.A.; Iadipaolo, A. Cannabinoid Modulation of Corticolimbic Activation during Extinction Learning and Fear Renewal in Adults with Posttraumatic Stress Disorder. Neurobiol. Learn. Mem. 2023, 201, 107758. [Google Scholar] [CrossRef]
- Carley, D.W.; Prasad, B.; Reid, K.J.; Malkani, R.; Attarian, H.; Abbott, S.M.; Vern, B.; Xie, H.; Yuan, C.; Zee, P.C. Pharmacotherapy of Apnea by Cannabimimetic Enhancement, the PACE Clinical Trial: Effects of Dronabinol in Obstructive Sleep Apnea. Sleep 2018, 41, zsx184. [Google Scholar] [CrossRef] [PubMed]
- DeJesus, E.; Rodwick, B.M.; Bowers, D.; Cohen, C.J.; Pearce, D. Use of Dronabinol Improves Appetite and Reverses Weight Loss in HIV/AIDS-Infected Patients. J. Int. Assoc. Provid. AIDS Care 2007, 6, 95–100. [Google Scholar] [CrossRef]
- Bathula, P.P.; Maciver, M.B. Cannabinoids in Treating Chemotherapy-Induced Nausea and Vomiting, Cancer-Associated Pain, and Tumor Growth. Int. J. Mol. Sci. 2023, 25, 74. [Google Scholar] [CrossRef]
- Yau, G.T.Y.; Tai, W.; Arnold, J.C.; Chan, H.-K.; Kwok, P.C.L. Cannabidiol for the Treatment of Brain Disorders: Therapeutic Potential and Routes of Administration. Pharm. Res. 2023, 40, 1087–1114. [Google Scholar] [CrossRef]
- Singh, K.; Bhushan, B.; Chanchal, D.K.; Sharma, S.K.; Rani, K.; Yadav, M.K.; Porwal, P.; Kumar, S.; Sharma, A.; Virmani, T.; et al. Emerging Therapeutic Potential of Cannabidiol (CBD) in Neurological Disorders: A Comprehensive Review. Behav. Neurol. 2023, 2023, 8825358. [Google Scholar] [CrossRef]
- Rapin, L.; Gamaoun, R.; El Hage, C.; Arboleda, M.F.; Prosk, E. Cannabidiol Use and Effectiveness: Real-World Evidence from a Canadian Medical Cannabis Clinic. J. Cannabis Res. 2021, 3, 19. [Google Scholar] [CrossRef]
- Scheffer, I.E.; Halford, J.J.; Miller, I.; Nabbout, R.; Sanchez-Carpintero, R.; Shiloh-Malawsky, Y.; Wong, M.; Zolnowska, M.; Checketts, D.; Dunayevich, E.; et al. Add-on Cannabidiol in Patients with Dravet Syndrome: Results of a Long-Term Open-Label Extension Trial. Epilepsia 2021, 62, 2505–2517. [Google Scholar] [CrossRef]
- Patel, A.D.; Mazurkiewicz-Bełdzińska, M.; Chin, R.F.; Gil-Nagel, A.; Gunning, B.; Halford, J.J.; Mitchell, W.; Scott Perry, M.; Thiele, E.A.; Weinstock, A.; et al. Long-term Safety and Efficacy of Add-On Cannabidiol in Patients with Lennox–Gastaut Syndrome: Results of a Long-term Open-label Extension Trial. Epilepsia 2021, 62, 2228–2239. [Google Scholar] [CrossRef]
- Thiele, E.A.; Bebin, E.M.; Bhathal, H.; Jansen, F.E.; Kotulska, K.; Lawson, J.A.; O’Callaghan, F.J.; Wong, M.; Sahebkar, F.; Checketts, D.; et al. Add-on Cannabidiol Treatment for Drug-Resistant Seizures in Tuberous Sclerosis Complex: A Placebo-Controlled Randomized Clinical Trial. JAMA Neurol. 2021, 78, 285. [Google Scholar] [CrossRef]
- Leehey, M.A.; Liu, Y.; Hart, F.; Epstein, C.; Cook, M.; Sillau, S.; Klawitter, J.; Newman, H.; Sempio, C.; Forman, L.; et al. Safety and Tolerability of Cannabidiol in Parkinson Disease: An Open Label, Dose-Escalation Study. Cannabis Cannabinoid Res. 2020, 5, 326–336. [Google Scholar] [CrossRef]
- Solowij, N.; Broyd, S.J.; Beale, C.; Prick, J.-A.; Greenwood, L.; Van Hell, H.; Suo, C.; Galettis, P.; Pai, N.; Fu, S.; et al. Therapeutic Effects of Prolonged Cannabidiol Treatment on Psychological Symptoms and Cognitive Function in Regular Cannabis Users: A Pragmatic Open-Label Clinical Trial. Cannabis Cannabinoid Res. 2018, 3, 21–34. [Google Scholar] [CrossRef]
- Bergamaschi, M.M.; Queiroz, R.H.C.; Chagas, M.H.N.; De Oliveira, D.C.G.; De Martinis, B.S.; Kapczinski, F.; Quevedo, J.; Roesler, R.; Schröder, N.; Nardi, A.E.; et al. Cannabidiol Reduces the Anxiety Induced by Simulated Public Speaking in Treatment-Naïve Social Phobia Patients. Neuropsychopharmacology 2011, 36, 1219–1226. [Google Scholar] [CrossRef]
- Berger, M.; Li, E.; Rice, S.; Davey, C.G.; Ratheesh, A.; Adams, S.; Jackson, H.; Hetrick, S.; Parker, A.; Spelman, T.; et al. Cannabidiol for Treatment-Resistant Anxiety Disorders in Young People: An Open-Label Trial. J. Clin. Psychiatry 2022, 83, 21m14130. [Google Scholar] [CrossRef] [PubMed]
- Leweke, F.M.; Piomelli, D.; Pahlisch, F.; Muhl, D.; Gerth, C.W.; Hoyer, C.; Klosterkötter, J.; Hellmich, M.; Koethe, D. Cannabidiol Enhances Anandamide Signaling and Alleviates Psychotic Symptoms of Schizophrenia. Transl. Psychiatry 2012, 2, e94. [Google Scholar] [CrossRef]
- McGuire, P.; Robson, P.; Cubala, W.J.; Vasile, D.; Morrison, P.D.; Barron, R.; Taylor, A.; Wright, S. Cannabidiol (CBD) as an Adjunctive Therapy in Schizophrenia: A Multicenter Randomized Controlled Trial. Am. J. Psychiatry 2018, 175, 225–231. [Google Scholar] [CrossRef] [PubMed]
- Hurd, Y.L.; Spriggs, S.; Alishayev, J.; Winkel, G.; Gurgov, K.; Kudrich, C.; Oprescu, A.M.; Salsitz, E. Cannabidiol for the Reduction of Cue-Induced Craving and Anxiety in Drug-Abstinent Individuals with Heroin Use Disorder: A Double-Blind Randomized Placebo-Controlled Trial. Am. J. Psychiatry 2019, 176, 911–922. [Google Scholar] [CrossRef]
- Shannon, S.; Lewis, N.; Lee, H.; Hughes, S. Cannabidiol in Anxiety and Sleep: A Large Case Series. Perm. J. 2019, 23, 18–41. [Google Scholar] [CrossRef]
- Jones, É.; Vlachou, S. A Critical Review of the Role of the Cannabinoid Compounds Δ9-Tetrahydrocannabinol (Δ9-THC) and Cannabidiol (CBD) and Their Combination in Multiple Sclerosis Treatment. Molecules 2020, 25, 4930. [Google Scholar] [CrossRef] [PubMed]
- Keating, G.M. Delta-9-Tetrahydrocannabinol/Cannabidiol Oromucosal Spray (Sativex®): A Review in Multiple Sclerosis-Related Spasticity. Drugs 2017, 77, 563–574. [Google Scholar] [CrossRef]
- Sukpiriyagul, A.; Chartchaiyarerk, R.; Tabtipwon, P.; Smanchat, B.; Prommas, S.; Bhamarapravatana, K.; Suwannarurk, K. Oral Tetrahydrocannabinol (THC):Cannabinoid (CBD) Cannabis Extract Adjuvant for Reducing Chemotherapy-Induced Nausea and Vomiting (CINV): A Randomized, Double-Blinded, Placebo-Controlled, Crossover Trial. Int. J. Women’s Health 2023, 15, 1345–1352. [Google Scholar] [CrossRef]
- Hanuš, L.O.; Meyer, S.M.; Muñoz, E.; Taglialatela-Scafati, O.; Appendino, G. Phytocannabinoids: A Unified Critical Inventory. Nat. Prod. Rep. 2016, 33, 1357–1392. [Google Scholar] [CrossRef] [PubMed]
- Rosenthaler, S.; Pöhn, B.; Kolmanz, C.; Nguyen Huu, C.; Krewenka, C.; Huber, A.; Kranner, B.; Rausch, W.-D.; Moldzio, R. Differences in Receptor Binding Affinity of Several Phytocannabinoids Do Not Explain Their Effects on Neural Cell Cultures. Neurotoxicol. Teratol. 2014, 46, 49–56. [Google Scholar] [CrossRef]
- Bonn-Miller, M.O.; Feldner, M.T.; Bynion, T.M.; Eglit, G.M.L.; Brunstetter, M.; Kalaba, M.; Zvorsky, I.; Peters, E.N.; Hennesy, M. A Double-Blind, Randomized, Placebo-Controlled Study of the Safety and Effects of CBN with and without CBD on Sleep Quality. Exp. Clin. Psychopharmacol. 2024, 32, 277–284. [Google Scholar] [CrossRef] [PubMed]
- Mancini, A.; Stratigos, A.; Guez, S.; Bourrat, E.; Kiritsi, D.; Samuelov, L.; Mazereeuw-Hautier, J.; Didona, B.; Bodemer, C.; Laimer, M.; et al. INM-755 Cannabinol Cream Demonstrates Anti-Itch Activity in Patients with Epidermolysis Bullosa. In Proceedings of the 12th World Congress on Itch (WCI), Miami, FL, USA, 5–7 November 2023. [Google Scholar]
- Zagzoog, A.; Mohamed, K.A.; Kim, H.J.J.; Kim, E.D.; Frank, C.S.; Black, T.; Jadhav, P.D.; Holbrook, L.A.; Laprairie, R.B. In Vitro and in Vivo Pharmacological Activity of Minor Cannabinoids Isolated from Cannabis sativa. Sci. Rep. 2020, 10, 20405. [Google Scholar] [CrossRef]
- Formukong, E.A.; Evans, A.T.; Evans, F.J. Analgesic and Antiinflammatory Activity of Constituents of Cannabis sativa L. Inflammation 1988, 12, 361–371. [Google Scholar] [CrossRef]
- Appendino, G.; Gibbons, S.; Giana, A.; Pagani, A.; Grassi, G.; Stavri, M.; Smith, E.; Rahman, M.M. Antibacterial Cannabinoids from Cannabis sativa: A Structure-Activity Study. J. Nat. Prod. 2008, 71, 1427–1430. [Google Scholar] [CrossRef]
- Borrelli, F.; Fasolino, I.; Romano, B.; Capasso, R.; Maiello, F.; Coppola, D.; Orlando, P.; Battista, G.; Pagano, E.; Di Marzo, V.; et al. Beneficial Effect of the Non-Psychotropic Plant Cannabinoid Cannabigerol on Experimental Inflammatory Bowel Disease. Biochem. Pharmacol. 2013, 85, 1306–1316. [Google Scholar] [CrossRef]
- Russo, E.B.; Cuttler, C.; Cooper, Z.D.; Stueber, A.; Whiteley, V.L.; Sexton, M. Survey of Patients Employing Cannabigerol-Predominant Cannabis Preparations: Perceived Medical Effects, Adverse Events, and Withdrawal Symptoms. Cannabis Cannabinoid Res. 2022, 7, 706–716. [Google Scholar] [CrossRef] [PubMed]
- Cuttler, C.; Stueber, A.; Cooper, Z.D.; Russo, E. Acute Effects of Cannabigerol on Anxiety, Stress, and Mood: A Double-Blind, Placebo-Controlled, Crossover, Field Trial. Sci. Rep. 2024, 14, 16163. [Google Scholar] [CrossRef] [PubMed]
- Abioye, A.; Ayodele, O.; Marinkovic, A.; Patidar, R.; Akinwekomi, A.; Sanyaolu, A. Δ9-Tetrahydrocannabivarin (THCV): A Commentary on Potential Therapeutic Benefit for the Management of Obesity and Diabetes. J. Cannabis Res. 2020, 2, 6. [Google Scholar] [CrossRef] [PubMed]
- Dennis, I.; Whalley, B.J.; Stephens, G.J. Effects of Δ9-Tetrahydrocannabivarin on [35S]GTPγS Binding in Mouse Brain Cerebellum and Piriform Cortex Membranes. Br. J. Pharmacol. 2008, 154, 1349–1358. [Google Scholar] [CrossRef]
- Bolognini, D.; Costa, B.; Maione, S.; Comelli, F.; Marini, P.; Di Marzo, V.; Parolaro, D.; Ross, R.A.; Gauson, L.A.; Cascio, M.G.; et al. The Plant Cannabinoid Δ9-Tetrahydrocannabivarin Can Decrease Signs of Inflammation and Inflammatory Pain in Mice. Br. J. Pharmacol. 2010, 160, 677–687. [Google Scholar] [CrossRef]
- Hill, A.J.; Weston, S.E.; Jones, N.A.; Smith, I.; Bevan, S.A.; Williamson, E.M.; Stephens, G.J.; Williams, C.M.; Whalley, B.J. Δ9-Tetrahydrocannabivarin Suppresses In Vitro Epileptiform and In Vivo Seizure Activity in Adult Rats. Epilepsia 2010, 51, 1522–1532. [Google Scholar] [CrossRef]
- Riedel, G.; Fadda, P.; McKillop-Smith, S.; Pertwee, R.G.; Platt, B.; Robinson, L. Synthetic and Plant-Derived Cannabinoid Receptor Antagonists Show Hypophagic Properties in Fasted and Non-Fasted Mice. Br. J. Pharmacol. 2009, 156, 1154–1166. [Google Scholar] [CrossRef]
- Smith, G. Weight Loss and Therapeutic Metabolic Effects of Tetrahydrocannabivarin (THCV)-Infused Mucoadhesive Strips. Cannabis 2024, 8, 1. [Google Scholar] [CrossRef]
- Englund, A.; Atakan, Z.; Kralj, A.; Tunstall, N.; Murray, R.; Morrison, P. The Effect of Five Day Dosing with THCV on THC-Induced Cognitive, Psychological and Physiological Effects in Healthy Male Human Volunteers: A Placebo-Controlled, Double-Blind, Crossover Pilot Trial. J. Psychopharmacol. 2016, 30, 140–151. [Google Scholar] [CrossRef]
- Alves, P.; Amaral, C.; Teixeira, N.; Correia-da-Silva, G. Cannabis sativa: Much More beyond Δ9-Tetrahydrocannabinol. Pharmacol. Res. 2020, 157, 104822. [Google Scholar] [CrossRef]
- Pagano, E.; Romano, B.; Iannotti, F.A.; Parisi, O.A.; D’Armiento, M.; Pignatiello, S.; Coretti, L.; Lucafò, M.; Venneri, T.; Stocco, G.; et al. The Non-Euphoric Phytocannabinoid Cannabidivarin Counteracts Intestinal Inflammation in Mice and Cytokine Expression in Biopsies from UC Pediatric Patients. Pharmacol. Res. 2019, 149, 104464. [Google Scholar] [CrossRef] [PubMed]
- Hill, A.; Mercier, M.; Hill, T.; Glyn, S.; Jones, N.; Yamasaki, Y.; Futamura, T.; Duncan, M.; Stott, C.; Stephens, G.; et al. Cannabidivarin Is Anticonvulsant in Mouse and Rat. Br. J. Pharmacol. 2012, 167, 1629–1642. [Google Scholar] [CrossRef]
- Brodie, M.J.; Czapinski, P.; Pazdera, L.; Sander, J.W.; Toledo, M.; Napoles, M.; Sahebkar, F.; Schreiber, A.; Nezadal, T.; Slonkova, J.; et al. A Phase 2 Randomized Controlled Trial of the Efficacy and Safety of Cannabidivarin as Add-on Therapy in Participants with Inadequately Controlled Focal Seizures. Cannabis Cannabinoid Res. 2021, 6, 528–536. [Google Scholar] [CrossRef]
- Hurley, E.N.; Ellaway, C.J.; Johnson, A.M.; Truong, L.; Gordon, R.; Galettis, P.; Martin, J.H.; Lawson, J.A. Efficacy and Safety of Cannabidivarin Treatment of Epilepsy in Girls with Rett Syndrome: A Phase 1 Clinical Trial. Epilepsia 2022, 63, 1736–1747. [Google Scholar] [CrossRef]
- Santos Álvarez, I.; Pérez Lloret, P.; González Soriano, J.M.; Pérez Moreno, M. An Approach to the Evaluation of the Potency of Cannabis Resin in Madrid: A Health Hazard? Adicciones 2023, 35, 279–288. [Google Scholar] [CrossRef] [PubMed]
- Zeger, V.R.; Bell, D.S.; Herrington, J.S.; Anderson, J.L. Selective Isolation of Pesticides and Cannabinoids Using Polymeric Ionic Liquid-Based Sorbent Coatings in Solid-Phase Microextraction Coupled to High-Performance Liquid Chromatography. J. Chromatogr. A 2022, 1680, 463416. [Google Scholar] [CrossRef]
- Carona, A.; Bicker, J.; Fonseca, C.; da Graça Campos, M.; Falcão, A.; Fortuna, A. Development and Validation of an HPLC-DAD Method for the Quantification of Cannabigerol, Cannabidiol, Cannabinol and Cannabichromene in Human Plasma and Mouse Matrices. Analyst 2024, 149, 3815–3827. [Google Scholar] [CrossRef]
- Szalata, M.; Dreger, M.; Zielińska, A.; Banach, J. Simple Extraction of Cannabinoids from Female Inflorescences of Hemp (Cannabis sativa L.). Molecules 2022, 27, 5868. [Google Scholar] [CrossRef]
- Bartkowiak-Wieczorek, J.; Mądry, E.; Książkiewicz, M.; Winkler-Galicki, J.; Szalata, M.; Szalata, M.; Jiménez, U.E.; Wielgus, K.; Grześkowiak, E.; Słomski, R.; et al. THC-Reduced Cannabis sativa L.—How Does the Solvent Determine the Bioavailability of Cannabinoids Given Orally? Nutrients 2023, 15, 2646. [Google Scholar] [CrossRef]
- Schadich, E.; Kaczorová, D.; Béres, T.; Džubák, P.; Hajdúch, M.; Tarkowski, P.; Ćavar Zeljković, S. Secondary Metabolite Profiles and anti-SARS-CoV-2 Activity of Ethanolic Extracts from Nine Genotypes of Cannabis sativa L. Arch. Pharm. 2024, 358, e2400607. [Google Scholar] [CrossRef]
- Skala, T.; Kahánková, Z.; Tauchen, J.; Janatová, A.; Kloucek, P.; Hubka, V.; Franková, A. Medical Cannabis Dimethyl Ether, Ethanol and Butane Extracts Inhibit the In Vitro Growth of Bacteria and Dermatophytes Causing Common Skin Diseases. Front. Microbiol. 2022, 13, 953092. [Google Scholar] [CrossRef]
- Acquavia, M.A.; Tesoro, C.; Pascale, R.; Ostuni, A.; Matera, I.; Bianco, G.; Scrano, L.; Bufo, S.A.; Ciriello, R.; Di Capua, A. Legal Cannabis sativa L. Dried Inflorescences: Cannabinoids Content and Cytotoxic Activity against Human HepG2 Cell Line. Appl. Sci. 2023, 13, 4960. [Google Scholar] [CrossRef]
- Boonyayothin, W.; Kobtrakul, K.; Khositanon, P.; Vimolmangkang, S.; Phoolcharoen, W. Development of a Plant-Produced Recombinant Monoclonal Antibody against Δ-9-Tetrahydrocannabinol (Δ9-THC) for Immunoassay Application. Biotechnol. Rep. 2022, 34, e00725. [Google Scholar] [CrossRef]
- Muhammad Zen, N.A.; Kobtrakul, K.; Khositanon, P.; Sanookpan, K.; Buranasudja, V.; Vimolmangkang, S. Vegetable Oil-Based Cannabis: Its Cannabinoid Profiling and Photoprotective Effect on UVA-Irradiated Human Skin Keratinocytes. Thai J. Pharm. Sci. 2023, 46, 720–733. [Google Scholar] [CrossRef]
- Benkirane, C.; Ben Moumen, A.; Fauconnier, M.-L.; Belhaj, K.; Abid, M.; Caid, H.S.; Elamrani, A.; Mansouri, F. Bioactive Compounds from Hemp (Cannabis sativa L.) Seeds: Optimization of Phenolic Antioxidant Extraction Using Simplex Lattice Mixture Design and HPLC-DAD/ESI-MS2 Analysis. RSC Adv. 2022, 12, 25764–25777. [Google Scholar] [CrossRef]
- Benkirane, C.; Mansouri, F.; Ben Moumen, A.; Taaifi, Y.; Melhaoui, R.; Caid, H.S.; Fauconnier, M.; Elamrani, A.; Abid, M. Phenolic Profiles of Non-industrial Hemp (Cannabis sativa L.) Seed Varieties Collected from Four Different Moroccan Regions. Int. J. Food Sci. Technol. 2023, 58, 1367–1381. [Google Scholar] [CrossRef]
- Mastellone, G.; Marengo, A.; Sgorbini, B.; Scaglia, F.; Capetti, F.; Gai, F.; Peiretti, P.G.; Rubiolo, P.; Cagliero, C. Characterization and Biological Activity of Fiber-Type Cannabis sativa L. Aerial Parts at Different Growth Stages. Plants 2022, 11, 419. [Google Scholar] [CrossRef]
- Mastellone, G.; Marengo, A.; Sgorbini, B.; Rubiolo, P.; Cagliero, C. Development of a Dispersive Solid-Liquid Microextraction Method Using Natural Eutectic Solvents for a Greener Extraction of Phytochemicals from Fiber-Type Cannabis sp. Ind. Crops Prod. 2022, 187, 115476. [Google Scholar] [CrossRef]
- Ohtsuki, T.; Friesen, J.B.; Chen, S.-N.; McAlpine, J.B.; Pauli, G.F. Selective Preparation and High Dynamic-Range Analysis of Cannabinoids in “CBD Oil” and Other Cannabis sativa Preparations. J. Nat. Prod. 2022, 85, 634–646. [Google Scholar] [CrossRef]
- Kim, A.L.; Yun, Y.J.; Choi, H.W.; Hong, C.-H.; Shim, H.J.; Lee, J.H.; Kim, Y.-C. Profiling Cannabinoid Contents and Expression Levels of Corresponding Biosynthetic Genes in Commercial Cannabis (Cannabis sativa L.) Cultivars. Plants 2022, 11, 3088. [Google Scholar] [CrossRef]
- Judžentienė, A.; Garjonytė, R.; Būdienė, J. Phytochemical Composition and Antioxidant Activity of Various Extracts of Fibre Hemp (Cannabis sativa L.) Cultivated in Lithuania. Molecules 2023, 28, 4928. [Google Scholar] [CrossRef] [PubMed]
- Monari, A.; Cantalù, S.; Zanfrognini, B.; Brighenti, V.; Verri, P.; Zanardi, C.; Pellati, F.; Pigani, L. An Electrochemical Approach for the Prediction of Δ9-Tetrahydrocannabinolic Acid and Total Cannabinoid Content in Cannabis sativa L. Analyst 2023, 148, 4688–4697. [Google Scholar] [CrossRef]
- Anceschi, L.; Codeluppi, A.; Brighenti, V.; Tassinari, R.; Taglioli, V.; Marchetti, L.; Roncati, L.; Alessandrini, A.; Corsi, L.; Pellati, F. Chemical Characterization of Non-Psychoactive Cannabis sativa L. Extracts, In Vitro Antiproliferative Activity and Induction of Apoptosis in Chronic Myelogenous Leukaemia Cancer Cells. Phytother. Res. 2022, 36, 914–927. [Google Scholar] [CrossRef]
- Tzimas, P.S.; Petrakis, E.A.; Halabalaki, M.; Skaltsounis, L.A. Extraction Solvent Selection for Cannabis sativa L. by Efficient Exploration of Cannabinoid Selectivity and Phytochemical Diversity. Phytochem. Anal. 2024, 35, 163–183. [Google Scholar] [CrossRef]
- Tzimas, P.S.; Beteinakis, S.; Petrakis, E.A.; Papastylianou, P.T.; Kakabouki, I.; Small-Howard, A.L.; Skaltsounis, L.A.; Halabalaki, M. Uncovering the Metabolite Complexity and Variability of Cultivated Hemp (Cannabis sativa L.): A First Phytochemical Diversity Mapping in Greece. Phytochemistry 2024, 222, 114076. [Google Scholar] [CrossRef] [PubMed]
- Salazar-Bermeo, J.; Moreno-Chamba, B.; Martínez-Madrid, M.C.; Valero, M.; Rodrigo-García, J.; Hosseinian, F.; Martín-Bermudo, F.; Aguado, M.; De La Torre, R.; Martí, N.; et al. Preventing Mislabeling: A Comparative Chromatographic Analysis for Classifying Medical and Industrial Cannabis. Molecules 2023, 28, 3552. [Google Scholar] [CrossRef]
- Moreno-Chamba, B.; Salazar-Bermeo, J.; Hosseinian, F.; Martin-Bermudo, F.; Aguado, M.; De La Torre, R.; Martínez-Madrid, M.C.; Valero, M.; Martí, N.; Saura, D. Aromatic and Cannabinoid Profiles of Cannabis Inflorescences and Seed Oils: A Comprehensive Approach for Variety Characterization. Ind. Crops Prod. 2024, 210, 118143. [Google Scholar] [CrossRef]
- Mouton, M.; Gerber, M.; Van der Kooy, F. Validation of a Fast LC-PDA Method for the Quantification of Cannabinoids in Commercial Tea Samples. Rev. Bras. Farmacogn. 2024, 34, 197–201. [Google Scholar] [CrossRef]
- Mouton, M.; Gerber, M.; Van Der Kooy, F. Cure-All Cannabidiol? The Cannabidiol Content of Commercial Products. Phytomed. Plus 2024, 4, 100520. [Google Scholar] [CrossRef]
- Roussel, J.-M.; Schelling, C.; Righezza, M.; Veuthey, J.-L. Application of Prediction Intervals to the Interpretation of the Robustness Study of a UHPLC Method for the Separation of Cannabinoids. J. Pharm. Biomed. Anal. 2022, 220, 114977. [Google Scholar] [CrossRef]
- Coppey, F.; Schelling, C.; Veuthey, J.; Esseiva, P. Cloud-Enabled Handheld NIR Spectroscopy: A Transformative Approach for Real-Time Forensic Analysis of Cannabis Specimens. Helv. Chim. Acta 2023, 106, e202300052. [Google Scholar] [CrossRef]
- Majumdar, C.G.; ElSohly, M.A.; Ibrahim, E.A.; Elhendawy, M.A.; Stanford, D.; Chandra, S.; Wanas, A.S.; Radwan, M.M. Effect of Gamma Irradiation on Cannabinoid, Terpene, and Moisture Content of Cannabis Biomass. Molecules 2023, 28, 7710. [Google Scholar] [CrossRef]
- Piani, B.; Ferfuia, C.; Bortolomeazzi, R.; Verardo, G.; Baldini, M. Development and Optimization of an HPLC-PDA Method for the Determination of Major Cannabinoids in Hemp (Cannabis sativa L.) Essential Oil Obtained by Hydrodistillation. Food Anal. Methods 2022, 15, 1677–1686. [Google Scholar] [CrossRef]
- Yu, C.; Long, R.; Cao, F.; Zhao, X.; Lan, T.; Xu, D. Development of Pure Certified Reference Material of Cannabidiol. Molecules 2024, 29, 921. [Google Scholar] [CrossRef]
- Aviram, J.; Atzmony, D.; Frenklakh, A.; Kroll, A.; Zaks, I.; Hazekamp, A. THC Degradation Does Not Impair the Accuracy of THC Doses Aerosolized by the Metered-Dose SyqeAir Inhaler: A 24-Month Stability Trial. J. Cannabis Res. 2022, 4, 55. [Google Scholar] [CrossRef]
- Tran, J.; Elkins, A.C.; Spangenberg, G.C.; Rochfort, S.J. High-Throughput Quantitation of Cannabinoids by Liquid Chromatography Triple-Quadrupole Mass Spectrometry. Molecules 2022, 27, 742. [Google Scholar] [CrossRef]
- Treyer, A.; Reinhardt, J.K.; Eigenmann, D.E.; Oufir, M.; Hamburger, M. Phytochemical Comparison of Medicinal Cannabis Extracts and Study of Their CYP-Mediated Interactions with Coumarinic Oral Anticoagulants. Med. Cannabis Cannabinoids 2023, 6, 21–31. [Google Scholar] [CrossRef] [PubMed]
- Luca, S.V.; Wojtanowski, K.; Korona-Głowniak, I.; Skalicka-Woźniak, K.; Minceva, M.; Trifan, A. Spent Material Extractives from Hemp Hydrodistillation as an Underexplored Source of Antimicrobial Cannabinoids. Antibiotics 2024, 13, 485. [Google Scholar] [CrossRef]
- Huang, S.; Qiu, R.; Fang, Z.; Min, K.; Van Beek, T.A.; Ma, M.; Chen, B.; Zuilhof, H.; Salentijn, G.I. Semiquantitative Screening of THC Analogues by Silica Gel TLC with an Ag(I) Retention Zone and Chromogenic Smartphone Detection. Anal. Chem. 2022, 94, 13710–13718. [Google Scholar] [CrossRef]
- Fernández, S.; Carreras, T.; Castro, R.; Perelmuter, K.; Giorgi, V.; Vila, A.; Rosales, A.; Pazos, M.; Moyna, G.; Carrera, I.; et al. A Comparative Study of Supercritical Fluid and Ethanol Extracts of Cannabis Inflorescences: Chemical Profile and Biological Activity. J. Supercrit. Fluids 2022, 179, 105385. [Google Scholar] [CrossRef]
- Fernández, S.; Castro, R.; López-Radcenco, A.; Rodriguez, P.; Carrera, I.; García-Carnelli, C.; Moyna, G. Beyond Cannabinoids: Application of NMR-Based Metabolomics for the Assessment of Cannabis sativa L. Crop Health. Front. Plant Sci. 2023, 14, 1025932. [Google Scholar] [CrossRef] [PubMed]
- Durante, C.; Anceschi, L.; Brighenti, V.; Caroli, C.; Afezolli, C.; Marchetti, A.; Cocchi, M.; Salamone, S.; Pollastro, F.; Pellati, F. Application of Experimental Design in HPLC Method Optimisation for the Simultaneous Determination of Multiple Bioactive Cannabinoids. J. Pharm. Biomed. Anal. 2022, 221, 115037. [Google Scholar] [CrossRef] [PubMed]
- Brighenti, V.; Marani, M.; Caroli, C.; Bertarini, L.; Gaggiotti, A.; Pollastro, F.; Durante, C.; Cannazza, G.; Pellati, F. A New HPLC Method with Multiple Detection Systems for Impurity Analysis and Discrimination of Natural versus Synthetic Cannabidiol. Anal. Bioanal. Chem. 2024, 416, 4555–4569. [Google Scholar] [CrossRef]
- Trovato, E.; Arena, K.; La Tella, R.; Rigano, F.; Laganà Vinci, R.; Dugo, P.; Mondello, L.; Guarnaccia, P. Hemp Seed-Based Food Products as Functional Foods: A Comprehensive Characterization of Secondary Metabolites Using Liquid and Gas Chromatography Methods. J. Food Compos. Anal. 2023, 117, 105151. [Google Scholar] [CrossRef]
- MacLaughlin, L.L.; MacDonald, M.T. Is Nitrogen-Modified Atmosphere Packaging a Tool for Retention of Volatile Terpenes and Cannabinoids in Stored Cannabis sativa Inflorescence? J. Cannabis. Res. 2024, 6, 42. [Google Scholar] [CrossRef]
- Melchert, D.; Schaare, F.; Winterhalter, P.; Beuerle, T. CBD Products: Labeling Accuracy of an Obscure Niche Market. Food Control 2024, 160, 110375. [Google Scholar] [CrossRef]
- Gardener, H.; Wallin, C.; Bowen, J. Heavy Metal and Phthalate Contamination and Labeling Integrity in a Large Sample of US Commercially Available Cannabidiol (CBD) Products. Sci. Total Environ. 2022, 851, 158110. [Google Scholar] [CrossRef]
- Osiripun, V.; Labua, S. Effects of Thermal Processing on Cannabidiol Degradation in Cannabidiol-Infused Pomegranate Juice and Evaluation of Its Antioxidant Property. J. Curr. Sci. Technol. 2023, 13, 107–117. [Google Scholar]
- Vaclavik, L.; Benes, F.; Fenclova, M.; Hricko, J.; Krmela, A.; Svobodova, V.; Hajslova, J.; Mastovska, K. Quantitation of Cannabinoids in Cannabis Dried Plant Materials, Concentrates, and Oils Using Liquid Chromatography–Diode Array Detection Technique with Optional Mass Spectrometric Detection: Single-Laboratory Validation Study, First Action 2018.11. J. AOAC Int. 2019, 102, 1822–1833. [Google Scholar] [CrossRef]
- Wongumpornpinit, V.; Temkitthawon, P.; Paenkaew, S.; Saesong, T.; Waranuch, N.; Ingkaninan, K. Preparation of Cannabis Biomass and Crude Extracts with High Neutral Cannabinoid Content. Sci. Technol. Asia 2023, 28, 216227. [Google Scholar] [CrossRef]
- Putthong, C.; Temkitthawon, P.; Phimnuan, P.; Viyoch, J.; Tongpoolsomjit, K. Formulation of Chewable Nutraceuticals Prepared from Banana Fruit Pulp and Hemp Seed Oil. ScienceAsia 2024, 50, 2024056. [Google Scholar] [CrossRef]
- Musetti, B.; Kun, A.; Menchaca, D.; Rodríguez-Haralambides, A.; Varela, J.; Thomson, L.; Bahnson, E.M. Cannabis sativa Extracts Inhibit LDL Oxidation and the Formation of Foam Cells In Vitro, Acting as Potential Multi-Step Inhibitors of Atherosclerosis Development. PLoS ONE 2024, 19, e0310777. [Google Scholar] [CrossRef] [PubMed]
- Kursa, W.; Jamiołkowska, A.; Wyrostek, J.; Kowalski, R. Attempts to Use Hemp (Cannabis sativa L. var. Sativa) Inflorescence Extract to Limit the Growth of Fungi Occurring in Agricultural Crops. Appl. Sci. 2024, 14, 1680. [Google Scholar] [CrossRef]
- Wilson, W.B.; Abdur-Rahman, M. Determination of 11 Cannabinoids in Hemp Plant and Oils by Liquid Chromatography and Photodiode Array Detection. Chromatographia 2022, 85, 115–125. [Google Scholar] [CrossRef]
- Wilson, W.B.; Urbas, A.A.; Abdur-Rahman, M.; Romares, A.; Mistek-Morabito, E. Determination of Δ9-THC, THCA, Δ8-THC, and Total Δ9-THC in 53 Smokable Hemp Plant Products by Liquid Chromatography and Photodiode Array Detection. Forensic Chem. 2024, 37, 100550. [Google Scholar] [CrossRef]
- Wilson, W.B.; Urbas, A.A.; Jensen, H.; Sander, L.C. High-Throughput LC-PDA Method for Determination of Δ9-THC and Related Cannabinoids in Cannabis sativa. Forensic Sci. 2024, 41, 100610. [Google Scholar] [CrossRef]
- Casiraghi, A.; Gentile, A.; Selmin, F.; Gennari, C.G.M.; Casagni, E.; Roda, G.; Pallotti, G.; Rovellini, P.; Minghetti, P. Ultrasound-Assisted Extraction of Cannabinoids from Cannabis sativa for Medicinal Purpose. Pharmaceutics 2022, 14, 2718. [Google Scholar] [CrossRef]
- Silva Sofrás, F.M.; Alonso, R.; Retta, D.S.; Di Leo Lira, P.; Desimone, M.F.; van Baren, C.M. Development and Validation of a Simple, Fast, and Accessible HPLC-UV Method for Cannabinoids Determination in Cannabis sativa L. Extracts and Medicinal Oils. Curr. Pharm. Des. 2023, 29, 1918–1928. [Google Scholar] [CrossRef] [PubMed]
- Pittiglio, M.K.; Ramirez, G.A.; Tesfatsion, T.T.; Ray, K.P.; Cruces, W. HPLC Method for Better Separation of THC Isomers to Ensure Safety and Compliance in the Hemp Market. ACS Omega 2024, 9, 25390–25394. [Google Scholar] [CrossRef]
- Cuchiaro, J.; Baumgartner, J.; Reynolds, M.M. Modeling a Pesticide Remediation Strategy for Preparative Liquid Chromatography Using High-Performance Liquid Chromatography. J. Cannabis Res. 2023, 5, 13. [Google Scholar] [CrossRef]
- Gigopulu, O.; Geskovski, N.; Stefkov, G.; Stoilkovska Gjorgievska, V.; Slaveska Spirevska, I.; Huck, C.W.; Makreski, P. A Unique Approach for In-Situ Monitoring of the THCA Decarboxylation Reaction in Solid State. Spectrochim. Acta Part A Mol. Biomol. Spectrosc. 2022, 267, 120471. [Google Scholar] [CrossRef]
- Gjorgievska, V.S.; Karanfilova, I.C.; Trajkovska, A.; Karapandzova, M.; Petrovska, B.B.; Kulevanova, S.; Stefkov, G. Monitoring of Cannabis Cultivar Technological Maturity by Trichome Morphology Analysis and HPLC Phytocannabinoid Content. Pharmacogn. Res. 2023, 15, 94–100. [Google Scholar] [CrossRef]
- Oliveira, G.D.A.R.; Estrada-Semprun, O.E.; Arantes, L.C.; Rodrigues, P.M.; Ribeiro, R.A.; Fagg, C.W.; Magalhães, P.O.; Fonseca-Bazzo, Y.M.; Silveira, D. Does Trema micranthum (L.) Blume Produce Cannabinoids? Plants 2024, 13, 1951. [Google Scholar] [CrossRef]
- Loxterkamp, L.; Monks, K. Analyzing Cannabis Flowers According to the German Pharmacopeia—Monograph 2018. Available online: https://www.knauer.net/document/download/354/3dffc74b-b035-4c99-9983-078b9c3ffaba/11569?preview=True (accessed on 28 February 2025).
- Spadafora, N.D.; Felletti, S.; Chenet, T.; Sirangelo, T.M.; Cescon, M.; Catani, M.; De Luca, C.; Stevanin, C.; Cavazzini, A.; Pasti, L. The Influence of Drying and Storage Conditions on the Volatilome and Cannabinoid Content of Cannabis sativa L. Inflorescences. Anal. Bioanal. Chem. 2024, 416, 3797–3809. [Google Scholar] [CrossRef]
- de Souza, M.R.; Koetz, M.; Limberger, R.P.; Henriques, A.T. DoE-Assisted Development and Validation of a Stability-Indicating HPLC-DAD Method for Simultaneous Determination of Five Cannabinoids in Cannabis sativa L. Based on Analytical Quality by Design (AQbD) Concept. Phytochem. Anal. 2022, 33, 999–1017. [Google Scholar] [CrossRef] [PubMed]
- Lajoie, C.; Doyen, A.; Feutry, P.; Gagnon, D.; Brisson, G. Impact of Emulsifiers for the Nanoencapsulation with Maltodextrin of Cannabis Oil by Spray Drying on the Physicochemical Properties and Bioaccessibility of Cannabinoids. Food Funct. 2022, 13, 10320–10332. [Google Scholar] [CrossRef] [PubMed]
- Mano-Sousa, B.J.; Alves, B.C.; Pedrosa, A.M.; Lima, P.L.; de Andrade, F.P.; Duarte-Almeida, J.M. Validation of Analytical Method of Cannabinoids: Novel Approach Using Turbo-Extraction. Talanta 2023, 254, 124108. [Google Scholar] [CrossRef] [PubMed]
- Dreger, M.; Szalata, M.; Górska-Paukszta, M.; Mańkowska, G.; Oleszak, G.; Kwiatkowska, E.; Ożarowski, M. Content of Cannabinoids in Clonally Propagated Industrial Hemp. J. Nat. Fibers 2023, 20, 2245968. [Google Scholar] [CrossRef]
- Jokić, S.; Jerković, I.; Pavić, V.; Aladić, K.; Molnar, M.; Kovač, M.J.; Vladimir-Knežević, S. Terpenes and Cannabinoids in Supercritical CO2 Extracts of Industrial Hemp Inflorescences: Optimization of Extraction, Antiradical and Antibacterial Activity. Pharmaceuticals 2022, 15, 1117. [Google Scholar] [CrossRef]
- Bongiorno, P.; Lopalco, A.; Casiraghi, A.; Spennacchio, A.; Pitruzzella, A.; Lopedota, A.A.; Minghetti, P.; Denora, N. Digital Technologies Applied to Control the One-Step Process of Cannabis Olive Oil Preparations. Pharmaceutics 2023, 15, 870. [Google Scholar] [CrossRef]
- Cuchiaro, J.; DeRoo, J.; Thai, J.; Reynolds, M.M. Evaluation of the Adsorption-Accessible Surface Area of MIL-53(Al) Using Cannabinoids in a Closed System. ACS Appl. Mater. Interfaces 2022, 14, 12836–12844. [Google Scholar] [CrossRef] [PubMed]
- Rylands, M.; Kusza, D.A.; Hlabisa, N.; Gwampa, T.; Ravenscroft, N. Development of Physicochemical Methods for the Quantification of CBD in South African Cannabis-Based Consumer Goods. S. Afr. J. Chem. 2024, 78, 36–42. [Google Scholar]
- Kim, E.-S.; Park, S.-H.; Kinney, C.A.; Olejar, K.J.; Corredor-Perilla, I.C. Comparison of Decarboxylation Rates of Acidic Cannabinoids between Secretory Cavity Contents and Air-Dried Inflorescence Extracts in Cannabis sativa cv. ‘Cherry Wine’. Sci. Rep. 2024, 14, 16411. [Google Scholar] [CrossRef] [PubMed]
- Park, S.-H.; Pauli, C.S.; Gostin, E.L.; Staples, S.K.; Seifried, D.; Kinney, C.; Vanden Heuvel, B.D. Effects of Short-Term Environmental Stresses on the Onset of Cannabinoid Production in Young Immature Flowers of Industrial Hemp (Cannabis sativa L.). J. Cannabis Res. 2022, 4, 1–13. [Google Scholar] [CrossRef]
- Carvalho, V.M.; de Almeida, F.G.; de Aguiar, A.F.L.; Pereira, F.C.S.; Rocha, E.D. Facing the Forensic Challenge of Cannabis Regulation: A Methodology for the Differentiation between Hemp and Marijuana Samples. Braz. J. Anal. Chem. 2022, 9, 162–176. [Google Scholar] [CrossRef]
- Qamar, S.; Torres, Y.J.M.; Parekh, H.S.; Falconer, J.R. Fractional Factorial Design Study for the Extraction of Cannabinoids from CBD-Dominant Cannabis Flowers by Supercritical Carbon Dioxide. Processes 2022, 10, 93. [Google Scholar] [CrossRef]
- Qamar, S.; Manrique, Y.J.; Parekh, H.S.; Falconer, J.R. Development and Optimization of Supercritical Fluid Extraction Setup Leading to Quantification of 11 Cannabinoids Derived from Medicinal Cannabis. Biology 2021, 10, 481. [Google Scholar] [CrossRef]
- Büttenbender, S.; Carlos, G.; Steppe, M.; Ortiz, R.S.; Limberger, R.P.; Mendez, A.S.L. Fast and Reliable Profiling of Cannabinoids in Seized Samples Using the Method of HPLC–DAD Followed by Chemometrics. Forensic Toxicol. 2022, 40, 407–413. [Google Scholar] [CrossRef]
- Sedan, D.; Vaccarini, C.; Demetrio, P.; Morante, M.; Montiel, R.; Saurí, A.; Andrinolo, D. Cannabinoid Content in Cannabis Flowers and Homemade Cannabis-Based Products Used for Therapeutic Purposes in Argentina. Cannabis Cannabinoid Res. 2023, 8, 197–206. [Google Scholar] [CrossRef]
- Liebling, J.P.; Clarkson, N.J.; Gibbs, B.W.; Yates, A.S.; O’Sullivan, S.E. An Analysis of Over-the-Counter Cannabidiol Products in the United Kingdom. Cannabis Cannabinoid Res. 2022, 7, 207–213. [Google Scholar] [CrossRef]
- Song, L.; Provis, J.; Al-Bataineh, A.M.; Fabien, K.J.; Kotler, M. Development of a Liquid Chromatographic Method with a Different Selectivity for the Quantification of Eighteen Phytocannabinoids in Hemp. Talanta Open 2024, 10, 100336. [Google Scholar] [CrossRef]
- Czauderna, M.; Taubner, T.; Wojtak, W. Comparative Study of Gas and Liquid Chromatography Methods for the Determination of Underivatised Neutral and Acidic Cannabinoids and Cholesterol. Molecules 2024, 29, 2165. [Google Scholar] [CrossRef] [PubMed]
- Mazzara, E.; Torresi, J.; Fico, G.; Papini, A.; Kulbaka, N.; Dall’Acqua, S.; Sut, S.; Garzoli, S.; Mustafa, A.M.; Cappellacci, L.; et al. A Comprehensive Phytochemical Analysis of Terpenes, Polyphenols and Cannabinoids, and Micromorphological Characterization of 9 Commercial Varieties of Cannabis sativa L. Plants 2022, 11, 891. [Google Scholar] [CrossRef] [PubMed]
- Boumrah, Y.; Baroudi, S.; Kecir, M.; Bouanani, S. Characterization of Algerian-seized Hashish over Eight Years (2011–2018). Part II: Chemical Categorization. J. Forensic Sci. 2020, 65, 1845–1851. [Google Scholar] [CrossRef]
- Boumrah, Y.; Kermouche, W.; Zarita, B.; Drardja, E.D.; Bouanani, S. Hashish Seizures in Algeria over the 2019–2020 Period: The Rise of Potent Hashish Hybrids. J. Forensic Sci. 2022, 67, 889–898. [Google Scholar] [CrossRef] [PubMed]
- Hall, D.R.; Sinclair, J.S.; Bhuyan, D.J.; Khoo, C.; Li, C.G.; Sarris, J.; Low, M. Quality Control of Cannabis Inflorescence and Oil Products: Response Factors for the Cost-Efficient Determination of Ten Cannabinoids by HPLC. Talanta Open 2022, 5, 100112. [Google Scholar] [CrossRef]
- Nalli, Y.; Bashir Mir, K.; Amin, T.; Gannedi, V.; Jameel, E.; Goswami, A.; Ali, A. Divergent Synthesis of Fractionated Cannabis sativa Extract Led to Multiple Cannabinoids C-&O-Glycosides with Anti-Proliferative/Anti-Metastatic Properties. Bioorg. Chem. 2024, 143, 107030. [Google Scholar] [CrossRef]
- Chan, K.-W. Kick Starting Method Development for Hemp Analysis Using Cannabis as Equivalent Material. Prob. Forensic Sci. 2023, 132, 271–283. [Google Scholar] [CrossRef]
- Tapia-Tapia, E.; Aránguiz, P.; Diaz, R.; Espinoza, L.; Weinstein-Oppenheimer, C.R.; Cuellar, M. Effect of Cannabis sativa L. Extracts, Phytocannabinoids and Their Acetylated Derivates on the SHSY-5Y Neuroblastoma Cells’ Viability and Caspases 3/7 Activation. Biol. Res. 2024, 57, 33. [Google Scholar] [CrossRef]
- Darigh, F.; Iranbakhsh, A.; Oraghi Ardebili, Z.; Ebadi, M.; Hassanpour, H. Simulated Microgravity Contributed to Modification of Callogenesis Performance and Secondary Metabolite Production in Cannabis indica. Plant Physiol. Biochem. 2022, 186, 157–168. [Google Scholar] [CrossRef]
- Darigh, F.; Iranbakhsh, A.; Oraghi Ardebili, Z.; Ebadi, M. Non-Thermal Plasma Improved Callogenesis Performance and Elicited the Production of Cannabinoids by Modifying DNA Methylome, Expression of WRKY1 and ERF1B Transcription Factors, and Expression of Genes That Contributed to the Biosynthesis of Cannabinoids. Protoplasma 2023, 260, 159–170. [Google Scholar] [CrossRef]
- Song, L.; Carlson, S.; Valenzuela, G.; Chao, M.; Pathipaka, S.B. Development of a Validated Method for Rapid Quantification of up to Sixteen Cannabinoids Using Ultra-High-Performance Liquid Chromatography Diode-Array Detector with Optional Electrospray Ionization Time-of-Flight Mass Spectrometry Detection. J. Chromatogr. A 2022, 1670, 462953. [Google Scholar] [CrossRef] [PubMed]
- Lazarjani, M.; Seyfoddin, A.; Le, T.T.; Chen, T. Development and Validation of HPLC and GC Methods for Quantification of Cannabinoids and Terpenes Extracted by Ultrasound Assisted Extraction Technique. Drug Anal. Res. 2024, 8, 33–45. [Google Scholar] [CrossRef]
- Mastinu, A.; Ascrizzi, R.; Ribaudo, G.; Bonini, S.A.; Premoli, M.; Aria, F.; Maccarinelli, G.; Gianoncelli, A.; Flamini, G.; Pistelli, L.; et al. Prosocial Effects of Nonpsychotropic Cannabis sativa in Mice. Cannabis Cannabinoid Res. 2022, 7, 170–178. [Google Scholar] [CrossRef] [PubMed]
- Tsujikawa, K.; Okada, Y.; Segawa, H.; Yamamuro, T.; Kuwayama, K.; Kanamori, T.; Iwata, Y.T. Evaluation of Decarboxylation Efficiency of Δ9-Tetrahydrocannabinolic Acid and Cannabidiolic Acid by UNODC Method. Forensic Toxicol. 2023, 41, 105–113. [Google Scholar] [CrossRef] [PubMed]
- Correia, B.; Ahmad, S.M.; Quintas, A. Determination of Phytocannabinoids in Cannabis Samples by Ultrasound-Assisted Solid-Liquid Extraction and High-Performance Liquid Chromatography with Diode Array Detector Analysis. J. Chromatogr. A 2023, 1705, 464191. [Google Scholar] [CrossRef]
- Barhdadi, S.; Courselle, P.; Deconinck, E.; Vanhee, C. The Analysis of Cannabinoids in E-Cigarette Liquids Using LC-HRAM-MS and LC-UV. J. Pharm. Biomed. Anal. 2023, 230, 115394. [Google Scholar] [CrossRef]
- De Leersnijder, C.; Duchateau, C.; De Braekeleer, K.; Deconinck, E. Relative Response Factors and Multiple Regression Models in Liquid Chromatography to Quantify Low-Dosed Components Using Alternative Standards—Proof of Concept: Total Δ9-THC Content in Cannabis Flowers Using CBD as Reference. Anal. Bioanal. Chem. 2022, 414, 6507–6520. [Google Scholar] [CrossRef]
- Duchateau, C.; De Leersnijder, C.; Barhdadi, S.; Canfyn, M.; De Braekeleer, K.; Deconinck, E. Discrepancies between Validated GC-FID and UHPLC-DAD Methods for the Analysis of Δ9-THC and CBD in Dried Hemp Flowers. Drug Test. Anal. 2022, 14, 1732–1743. [Google Scholar] [CrossRef]
- Toloza, H.; Buitrago, O.Y.; Orjuela, A.; Santaella, M.A.; Hurtado, A.M.; Arturo, D.E. Solvent Extraction of Cannabis sativa under Cryogenic Conditions. Sep. Purif. Technol. 2024, 329, 124906. [Google Scholar] [CrossRef]
- Kollipara, R.; Langille, E.; Tobin, C.; French, C.R. Phytocannabinoids Reduce Seizures in Larval Zebrafish and Affect Endocannabinoid Gene Expression. Biomolecules 2023, 13, 1398. [Google Scholar] [CrossRef] [PubMed]
- Gilmore, A.M.; Elhendawy, M.A.; Radwan, M.M.; Kidder, L.H.; Wanas, A.S.; Godfrey, M.; Hildreth, J.B.; Robinson, A.E.; ElSohly, M.A. Absorbance-Transmittance Excitation Emission Matrix Method for Quantification of Major Cannabinoids and Corresponding Acids: A Rapid Alternative to Chromatography for Rapid Chemotype Discrimination of Cannabis sativa Varieties. Cannabis Cannabinoid Res. 2023, 8, 911–922. [Google Scholar] [CrossRef]
- Hajrulai-Musliu, Z.; Dimitreska Stojkovikj, E.; Gusheski, D.; Musliu, D.; Velkovski, D. High-Performance Liquid Chromatography with DAD Detection for the Determination of Cannabinoids in Commercial Veterinary CBD Oil. Pharmacy 2024, 12, 181. [Google Scholar] [CrossRef]
- Elhendawy, M.A.; Radwan, M.M.; Ibrahim, E.A.; Wanas, A.S.; Chandra, S.; Godfrey, M.; ElSohly, M.A. Validation and Quantitation of Fifteen Cannabinoids in Cannabis and Marketed Products Using High-Performance Liquid Chromatography-Ultraviolet/Photodiode Array Method. Cannabis Cannabinoid Res. 2024, 9, e1091–e1107. [Google Scholar] [CrossRef]
- Fries, A.; Moldes, C.A.; Mazzaferro, L.S. Cost-Efficient Analysis of Cannabinoids in Therapeutic Oils Using HPLC with UV and Mass Spectrometry Detection. Nat. Prod. Res. 2024, 13, 1–9. [Google Scholar] [CrossRef]
- Song, L.; Valenzuela, G.; Carlson, S.; Dodson, Z.; Adisa, M. Potency Testing of up to Twenty Cannabinoids by Liquid Chromatography Diode Array Detector with Optional Electrospray Ionization Time-of-Flight Mass Spectrometry. Anal. Chim. Acta 2022, 1207, 339827. [Google Scholar] [CrossRef] [PubMed]
- Todd, J.; Song, H.; Van Acker, R. Does Pollination Alter the Cannabinoid Composition and Yield of Extracts from Hemp (Cannabis sativa L. cv. Finola) Flowers? Ind. Crops Prod. 2022, 183, 114989. [Google Scholar] [CrossRef]
- Song, L.; Meyer, G.; Adejumo, E.; Jovanovich, E.; LeBlanc, L.; Provis, J. Potency Testing of up to Sixteen Cannabinoids in Hemp-Infused Edibles Using Liquid Chromatography Diode Array Detector with Optional Confirmation of Identity by Electrospray Ionization Time-of-Flight Mass Spectrometry. Food Chem. 2023, 417, 135819. [Google Scholar] [CrossRef] [PubMed]
- Quiñones, R.; Casiano-Negroni, A.; Pijor, H.; Moreno, S.; Suarez, K.; Westfall, T.D.; Sullins, C.; Ivey, S.; Buxó, J.A. Analysis of Cannabinoids in Lotions Using High-Performance Liquid Chromatography. J. Chem. Educ. 2022, 99, 3558–3565. [Google Scholar] [CrossRef]
- Quiñones, R.; Moreno, S.; Smythers, A.L.; Sullins, C.; Pijor, H.; Brown, G.; Trouten, A.; Richards-Waugh, L.L.; Siddig, A. Quantification of Cannabis in Infused Consumer Products and Their Residues on Skin. ACS Pharmacol. Transl. Sci. 2022, 5, 642–651. [Google Scholar] [CrossRef]
- Glinn, M.A.; Michaud, G.P. Potency Levels of Regulated Cannabis Products in Michigan 2021–2022. J. Forensic Sci. 2023, 68, 1894–1905. [Google Scholar] [CrossRef]
- Namera, A.; Ota, S.; Tomioka, Y.; Saito, T.; Nagao, M. Facile Determination of Natural Cannabinoids in Cannabis Products Using a Conventional Fully Porous Particle Column and Isocratic High-Performance Liquid Chromatography with Diode-Array Detector. Forensic Toxicol 2022, 40, 417–421. [Google Scholar] [CrossRef]
- Jaidee, W.; Siridechakorn, I.; Nessopa, S.; Wisuitiprot, V.; Chaiwangrach, N.; Ingkaninan, K.; Waranuch, N. Kinetics of CBD, Δ9-THC Degradation and Cannabinol Formation in Cannabis Resin at Various Temperature and pH Conditions. Cannabis Cannabinoid Res. 2022, 7, 537–547. [Google Scholar] [CrossRef]
- Klinsang, T.; Charoensit, P.; Phimnuan, P.; Luangpraditkun, K.; Ross, G.M.; Viennet, C.; Ross, S.; Viyoch, J. In Vitro Wound Healing Potential of a Fibroin Film Incorporating a Cannabidiol/2-Hydroxypropyl-β-Cyclodextrin Complex. Pharmaceutics 2023, 15, 2682. [Google Scholar] [CrossRef] [PubMed]
- Luangpraditkun, K.; Pimjuk, P.; Phimnuan, P.; Wisanwattana, W.; Wisespongpand, C.; Waranuch, N.; Viyoch, J. Anti-Aging Properties of Cannabis sativa Leaf Extract against UVA Irradiation. Cosmetics 2024, 11, 45. [Google Scholar] [CrossRef]
- Chaiwangrach, N.; Waranuch, N.; Temkitthawon, P.; Wongwad, E.; Nuengchamnong, N.; Usuwanthim, K.; Saesong, T.; Rakkhetkorn, Y.; Pisutthanan, S.; Ingkaninan, K. Quality Assessment, Stability and In-Vitro Anti-Inflammatory Activities of a Topical Ointment Containing Cannabis and Turmeric Extracts for Haemorrhoids and Skin Diseases. Phytomed. Plus 2024, 4, 100635. [Google Scholar] [CrossRef]
- Birenboim, M.; Chalupowicz, D.; Maurer, D.; Barel, S.; Chen, Y.; Fallik, E.; Paz-Kagan, T.; Rapaport, T.; Sadeh, A.; Kengisbuch, D.; et al. Multivariate Classification of Cannabis Chemovars Based on Their Terpene and Cannabinoid Profiles. Phytochemistry 2022, 200, 113215. [Google Scholar] [CrossRef]
- Birenboim, M.; Fallik, E.; Kengisbuch, D.; Shimshoni, J.A. Quantitative and Qualitative Spectroscopic Parameters Determination of Major Cannabinoids. J. Lumin. 2022, 252, 119387. [Google Scholar] [CrossRef]
- Birenboim, M.; Kenigsbuch, D.; Shimshoni, J.A. Novel Fluorescence Spectroscopy Method Coupled with N-PLS-R and PLS-DA Models for the Quantification of Cannabinoids and the Classification of Cannabis Cultivars. Phytochem. Anal. 2023, 34, 280–288. [Google Scholar] [CrossRef]
- Birenboim, M.; Rinnan, Å.; Kengisbuch, D.; Shimshoni, J.A. Novel Fluorescence Spectroscopy Coupled with PARAFAC Modeling for Major Cannabinoids Quantification and Identification in Cannabis Extracts. Chemom. Intell. Lab. Syst. 2023, 232, 104717. [Google Scholar] [CrossRef]
- Birenboim, M.; Brikenstein, N.; Duanis-Assaf, D.; Maurer, D.; Chalupowicz, D.; Kenigsbuch, D.; Shimshoni, J.A. In Pursuit of Optimal Quality: Cultivar-Specific Drying Approaches for Medicinal Cannabis. Plants 2024, 13, 1049. [Google Scholar] [CrossRef]
- Birenboim, M.; Chalupowicz, D.; Kenigsbuch, D.; Shimshoni, J.A. Improved Long-Term Preservation of Cannabis Inflorescence by Utilizing Integrated Pre-Harvest Hexanoic Acid Treatment and Optimal Post-Harvest Storage Conditions. Plants 2024, 13, 992. [Google Scholar] [CrossRef] [PubMed]
- Brikenstein, N.; Birenboim, M.; Kenigsbuch, D.; Shimshoni, J.A. Optimization of Trimming Techniques for Enhancing Cannabinoid and Terpene Content in Medical Cannabis Inflorescences. Med. Cannabis Cannabinoids 2024, 7, 111–118. [Google Scholar] [CrossRef] [PubMed]
- Malík, M.; Praus, L.; Tlustoš, P. Comparison of Recirculation and Drain-to-Waste Hydroponic Systems in Relation to Medical Cannabis (Cannabis sativa L.) Plants. Ind. Crops Prod. 2023, 202, 117059. [Google Scholar] [CrossRef]
- Velechovský, J.; Malík, M.; Šenkyřík, J.B.; Tlustoš, P. Effect of Augmented Nutrient Composition and Fertigation System on Biomass Yield and Cannabinoid Content of Medicinal Cannabis (Cannabis sativa L.) Cultivation. Front. Plant Sci. 2024, 15, 1322824. [Google Scholar] [CrossRef]
- Malikova, L.; Malik, M.; Pavlik, J.; Ulman, M.; Pechouckova, E.; Skrivan, M.; Kokoska, L.; Tlustos, P. Anti-Staphylococcal Activity of Soilless Cultivated Cannabis across the Whole Vegetation Cycle under Various Nutritional Treatments in Relation to Cannabinoid Content. Sci. Rep. 2024, 14, 4343. [Google Scholar] [CrossRef]
- Kim, J.; Kim, D.-G.; Kim, J.-B.; Ryu, J.; Lee, Y.-J.; Woo, N.M.; Sik, J.J.; Kim, S.H. Simple Method for Detecting Tetrahydrocannabinolic Acid and Tetrahydrocannabinol in Cannabis Tissues Using Urine-Based Drug Diagnostic Device. Ind. Crops Prod. 2024, 219, 119007. [Google Scholar] [CrossRef]
- Lumu, S.; Hatterman-Valenti, H.; Hammed, A.; Monono, E. Effect of Short-Term Storage on Cannabinoid Content of Dried Floral Hemp (Cannabis sativa L.) Inflorescence. J. Appl. Res. Med. Aromat. Plants 2024, 42, 100567. [Google Scholar] [CrossRef]
- Stasiłowicz-Krzemień, A.; Sip, S.; Szulc, P.; Cielecka-Piontek, J. Determining Antioxidant Activity of Cannabis Leaves Extracts from Different Varieties—Unveiling Nature’s Treasure Trove. Antioxidants 2023, 12, 1390. [Google Scholar] [CrossRef]
- Stasiłowicz-Krzemień, A.; Sip, S.; Szulc, P.; Walkowiak, J.; Cielecka-Piontek, J. The Antioxidant and Neuroprotective Potential of Leaves and Inflorescences Extracts of Selected Hemp Varieties Obtained with scCO2. Antioxidants 2023, 12, 1827. [Google Scholar] [CrossRef]
- Sip, S.; Stasiłowicz-Krzemień, A.; Sip, A.; Szulc, P.; Neumann, M.; Kryszak, A.; Cielecka-Piontek, J. Development of Delivery Systems with Prebiotic and Neuroprotective Potential of Industrial-Grade Cannabis sativa L. Molecules 2024, 29, 3574. [Google Scholar] [CrossRef] [PubMed]
- Pires, B.; Oliveira, P.; Simão, A.Y.; Reis, J.; Ramos, S.; Duarte, A.P.; Margalho, C.; Rosado, T.; Barroso, M.; Gallardo, E. Characterisation of Cannabis-Based Products Marketed for Medical and Non-Medical Use Purchased in Portugal. Molecules 2024, 29, 2737. [Google Scholar] [CrossRef] [PubMed]
- Chauhan, J.; Bastia, B.K.; Kohli, K.; Chaudhary, B.; Chikara, G.; Gupta, A.; Kumar, A. Phytocannabinoid Profile and Potency of Cannabis Resin (Hashish) of Northwest Himalayas of India. J. Forensic Sci. 2024, 69, 1918–1925. [Google Scholar] [CrossRef]
- Li, H.; Zhao, Q.; Chang, S.; Wang, L.; Zhao, B. Phytochemical Analysis and Bioactivity of Different Ethanolic Extracts from Cannabidiol Full-Spectrum Oil. J. Mol. Liq. 2023, 372, 121173. [Google Scholar] [CrossRef]
- Monton, C.; Chankana, N.; Leelawat, S.; Suksaeree, J.; Songsak, T. Optimization of Supercritical Carbon Dioxide Fluid Extraction of Seized Cannabis and Self-Emulsifying Drug Delivery System for Enhancing the Dissolution of Cannabis Extract. J. Supercrit. Fluids 2022, 179, 105423. [Google Scholar] [CrossRef]
- Monton, C.; Tanpao, T.; Navakul, C.; Pengkum, T.; Santasanasuwan, S.; Suksaeree, J.; Charoenchai, L.; Songsak, T. Cannabidiol, ∆9-Tetrahydrocannabinol, and Cannabinol Contents of Cannabis sativa L. Inflorescences Claimed to Be Hang Kra Rog Phu Phan Cultivar Cultivated Outdoors in Various Locations of Thailand. Phytochem. Lett. 2023, 57, 126–132. [Google Scholar] [CrossRef]
- Song, L.; LeBlanc, L.; Jovanovich, E.; Mohammad Al-Bataineh, A.; Jervelle Fabien, K. A Rapid and Accurate Liquid Chromatographic Method for Hemp Compliance Testing. Forensic Chem. 2024, 40, 100592. [Google Scholar] [CrossRef]
- Mehdi, J.; Husain, D.; Srivastava, A.; Gupta, N.; Shanker, K.; Talha, M.; Lal, R.K.; Kumar, B.; Gupta, A.K. The Genetic Diversity and Chemical Profiling of Natural Populations of Indian Cannabis. Ind. Crops Prod. 2023, 203, 117187. [Google Scholar] [CrossRef]
- Ghosh, D.; Chaudhary, N.; Shanker, K.; Kumar, B.; Kumar, N. Monoecious Cannabis sativa L. Discloses the Organ-Specific Variation in Glandular Trichomes, Cannabinoids Content and Antioxidant Potential. J. Appl. Res. Med. Aromat. Plants 2023, 35, 100476. [Google Scholar] [CrossRef]
- Huang, S.; Van Beek, T.A.; Claassen, F.W.; Janssen, H.-G.; Ma, M.; Chen, B.; Zuilhof, H.; Salentijn, G.I. Comprehensive Cannabinoid Profiling of Acid-Treated CBD Samples and Δ8-THC-Infused Edibles. Food Chem. 2024, 440, 138187. [Google Scholar] [CrossRef]
- Pathompak, P.; Chankana, N.; Vipunngeun, N.; Phonkrathok, S. HPLC Method Development and Validation for Quantitation of CBD and THC in Suk-SaiYas Pills. J. Curr. Sci. 2022, 12, 538546. [Google Scholar] [CrossRef]
- Patirathnan, N.; Tummarintra, P.; Phakdeenukoolkitja, S. Analysis of THC and CBD in Cannabis Commercial Oil: Preliminary Study. KKU Res. J. (Grad. Stud.) 2024, 24, 143–154. [Google Scholar]
- Erukainure, O.L.; Oyenihi, O.R.; Amaku, J.F.; Chukwuma, C.I.; Nde, A.L.; Salau, V.F.; Matsabisa, M.G. Cannabis sativa L. Modulates Altered Metabolic Pathways Involved in Key Metabolisms in Human Breast Cancer (MCF-7) Cells: A Metabolomics Study. Heliyon 2023, 9, e16156. [Google Scholar] [CrossRef] [PubMed]
- Mastellone, G.; Marengo, A.; Sgorbini, B.; Rubiolo, P.; Anderson, J.L.; Cagliero, C. Ultrasound-Assisted Dispersive Solid-Liquid Microextraction with Eutectic Solvents for the Determination of Cannabinoids in Different Hemp Products. J. Chromatogr. B 2024, 1232, 123967. [Google Scholar] [CrossRef]
- Mileti, O.; Baldino, N.; Paleologo, M.F.O.; Lupi, F.R.; Marra, M.; Iacopetta, D.; Gabriele, D. Oil Extraction from Hemp Plant as a Potential Source of Cannabidiol for Healthy Protein Foods. Antioxidants 2023, 12, 1950. [Google Scholar] [CrossRef]
- Genovese, S.; Epifano, F.; Palumbo, L.; Collevecchio, C.; Fiorito, S. An Easy Way for the Removal of Residual Hydrocarbon Fractions from Crystallized Cannabigerol and Cannabidiol. Food Bioprod. Process 2023, 142, 50–58. [Google Scholar] [CrossRef]
- Fu, Y.; Zhu, S.; Duan, S.; Liu, L. Bioassay-Guided Isolation and Identification of Antibacterial Components against Escherichia coli from Industrial Hemp Leaves. Separations 2023, 10, 35. [Google Scholar] [CrossRef]
- Kalinowska, M.; Płońska, A.; Trusiak, M.; Gołębiewska, E.; Gorlewska-Pietluszenko, A. Comparing the Extraction Methods, Chemical Composition, Phenolic Contents and Antioxidant Activity of Edible Oils from Cannabis sativa and Silybum marianu Seeds. Sci. Rep. 2022, 12, 20609. [Google Scholar] [CrossRef]
- Kalinowska, M.; Gryko, K.; Wróblewska, A.M.; Jabłońska-Trypuć, A.; Karpowicz, D. Phenolic Content, Chemical Composition and Anti-/Pro-Oxidant Activity of Gold Milenium and Papierowka Apple Peel Extracts. Sci. Rep. 2020, 10, 14951. [Google Scholar] [CrossRef]
- Fućak, T.; Kreft, S.; Svedružić, Ž.M.; Tavčar, E. Mechanism and Kinetics of CBDA Decarboxylation into CBD in Hemp. J. Plant Biochem. Biotechnol. 2023, 32, 608–621. [Google Scholar] [CrossRef]
- Vida, R.G.; Strauss, L.V.; Bajtel, Á.; Kiss, T.; Csupor, D.; Fittler, A. Safety and Risks of CBD Oils Purchased Online: Unveiling Uncertain Quality and Vague Health Claims. Front. Pharmacol. 2023, 14, 1273540. [Google Scholar] [CrossRef]
- Picco, A.; Segale, L.; Miletto, I.; Pollastro, F.; Aprile, S.; Locatelli, M.; Bari, E.; Torre, M.L.; Giovannelli, L. Spray-Dried Powder Containing Cannabigerol: A New Extemporaneous Emulgel for Topical Administration. Pharmaceutics 2023, 15, 2747. [Google Scholar] [CrossRef]
- Jarén, C.; Zambrana, P.C.; Pérez-Roncal, C.; López-Maestresalas, A.; Ábrego, A.; Arazuri, S. Potential of NIRS Technology for the Determination of Cannabinoid Content in Industrial Hemp (Cannabis sativa L.). Agronomy 2022, 12, 938. [Google Scholar] [CrossRef]
- Recommended Methods for the Identification and Analysis of Cannabis and Cannabis Products: Manual for Use by National Drug Analysis Laboratories; United Nations Office on Drugs and Crime, Ed.; Rev. and updated; United Nations: New York, NY, USA, 2009; ISBN 978-92-1-148242-3. [Google Scholar]
- Ediz, E.F.; Demirel Kars, M.; Çetin, K. Development and Characterization of New Cannabidiol-Loaded Polycaprolactone Nanoparticles for Increased Bioavailability. ChemistrySelect 2024, 9, e202403609. [Google Scholar] [CrossRef]
- Analakkattillam, S.; Langsi, V.K.; Hanrahan, J.P.; Moore, E. Analytical Method Validation for Assay Determination of Cannabidiol and Tetrahydrocannabinol in Hemp Oil Infused Products by RP-HPLC. Sci. Rep. 2022, 12, 12453. [Google Scholar] [CrossRef] [PubMed]
- Sumontri, S.; Eiamart, W.; Tadtong, S.; Samee, W. Ultra-High-Performance Liquid Chromatography–Tandem Mass Spectrometry Analysis of Δ9-Tetrahydrocannabinol and Cannabidiol in Commercial Suk-Saiyasna Herbal Remedy: Applying Hansen Solubility Parameters for Sample Extraction to Ensure Regulatory Compliance. Pharmaceuticals 2024, 17, 1502. [Google Scholar] [CrossRef]
- Cheng, A.; Zhang, S.; Meng, F.; Xing, M.; Liu, H.; Yang, G.; Gao, Y. Nanosuspension-Loaded Dissolving Microneedle Patches for Enhanced Transdermal Delivery of a Highly Lipophilic Cannabidiol. Int. J. Nanomed. 2024, 19, 4061–4079. [Google Scholar] [CrossRef]
- Muresan, P.; McCrorie, P.; Smith, F.; Vasey, C.; Taresco, V.; Scurr, D.J.; Kern, S.; Smith, S.; Gershkovich, P.; Rahman, R. Development of Nanoparticle Loaded Microneedles for Drug Delivery to a Brain Tumour Resection Site. Eur. J. Pharm. Biopharm. 2023, 182, 53–61. [Google Scholar] [CrossRef] [PubMed]
- Hameed al-maraseemi, B.; Usmani, Z.; Rizwanullah, M.; Amin, S.; Mir, S.R. Box-Behnken Design Assisted Development and Optimization of RP-HPLC-PDA Technique for Determination of Cannabidiol in the Bulk and Nanoformulation. Egypt. J. Chem. 2022, 65, 1–2. [Google Scholar] [CrossRef]
- Raslan-Jaramillo, J.J.; Ríos-Gajardo, G.A.; Avello, M.A.; de Diego, M.G. Determination of Cannabinoids in Cannabis sativa Oil and Infused Ice Cream by LC-DAD Method. J. AOAC Int. 2024, 107, 140–145. [Google Scholar] [CrossRef]
- Abeysekera, S.K.; Robinson, A.; Ooi, M.P.-L.; Kuang, Y.C.; Manley-Harris, M.; Holmes, W.; Hirst, E.; Nowak, J.; Caddie, M.; Steinhorn, G.; et al. Sparse Reproducible Machine Learning for near Infrared Hyperspectral Imaging: Estimating the Tetrahydrocannabinolic Acid Concentration in Cannabis sativa L. Ind. Crops Prod. 2023, 192, 116137. [Google Scholar] [CrossRef]
- Johnson, D.A.; Hogan, M.; Marriot, R.; Heaney, L.M.; Bailey, S.J.; Clifford, T.; James, L.J. A Comparison of Advertised versus Actual Cannabidiol (CBD) Content of Oils, Aqueous Tinctures, e-Liquids and Drinks Purchased in the UK. J. Cannabis Res. 2023, 5, 28. [Google Scholar] [CrossRef] [PubMed]
- Khabir, Z.; Partalis, C.; Panchal, J.V.; Deva, A.; Khatri, A.; Garcia-Bennett, A. Enhanced Skin Penetration of Cannabidiol Using Organosilane Particles as Transdermal Delivery Vehicles. Pharmaceutics 2023, 15, 798. [Google Scholar] [CrossRef] [PubMed]
- Shreiber-Livne, I.; Sulimani, L.; Shapira, A.; Procaccia, S.; Meiri, D.; Sosnik, A. Poly(ethylene glycol)-b-Poly(epsilon-caprolactone) Nanoparticles as a Platform for the Improved Oral Delivery of Cannabidiol. Drug Deliv. Transl. Res. 2023, 13, 3192–3203. [Google Scholar] [CrossRef]
- Zheng, H.; Chen, B.; Rao, J. Nutraceutical Potential of Industrial Hemp (Cannabis sativa L.) Extracts: Physicochemical Stability and Bioaccessibility of Cannabidiol (CBD) Nanoemulsions. Food Funct. 2022, 13, 4502–4512. [Google Scholar] [CrossRef] [PubMed]
- Vella Szijj, J.; Gallo, L.L.; Buhagiar, P.I.; Szyrner, K.; Sammut Bartolo, N.; Ronsisvalle, S.; Serracino Inglott, A.; Azzopardi, L.M. Analysis of Cannabinoids in Oil. Integr. Med. Rep. 2024, 3, 122–131. [Google Scholar] [CrossRef]
- Tejada Rodriguez, E.; Vella Szijj, J.; Cachia, M.; Falzon, P.; Axisa, K.; Serracino-Inglott, A.; Azzopardi, L.M. An Efficient HPLC-UV Method for Determination of Tetrahydrocannabinol in Oil. Asian J. Pharm. Clin. Res. 2023, 16, 110–115. [Google Scholar] [CrossRef]
- Morakul, B.; Junyaprasert, V.B.; Sakchaisri, K.; Teeranachaideekul, V. Cannabidiol-Loaded Nanostructured Lipid Carriers (NLCs) for Dermal Delivery: Enhancement of Photostability, Cell Viability, and Anti-Inflammatory Activity. Pharmaceutics 2023, 15, 537. [Google Scholar] [CrossRef]
- Sucontphunt, A.; Sueree, L.; Jongrungruangchok, S.; Maha, A.; Madaka, F.; Chankana, N.; Chaiyabutr, K.; Leelawat, S.; Songsak, T.; Pradubyat, N. Validation and Comparison of Method Using Different Wavelength Detection at 210 and 228 Nm for Quantitative Analysis of CBD in Sublingual Cannabis Oil Products. Interprof. J. Health Sci. 2022, 20, 28–35. [Google Scholar]
- Mostafaei Dehnavi, M.; Ebadi, A.; Peirovi, A.; Taylor, G.; Salami, S.A. THC and CBD Fingerprinting of an Elite Cannabis Collection from Iran: Quantifying Diversity to Underpin Future Cannabis Breeding. Plants 2022, 11, 129. [Google Scholar] [CrossRef]
- Tajik, T.; Baghaei, K.; Moghadam, V.E.; Farrokhi, N.; Salami, S.A. Extracellular Vesicles of Cannabis with High CBD Content Induce Anticancer Signaling in Human Hepatocellular Carcinoma. Biomed. Pharmacother. 2022, 152, 113209. [Google Scholar] [CrossRef] [PubMed]
- Babayeva, M.; Srdanovic, I. Non-Linear Plasma Protein Binding of Cannabidiol. J. Cannabis Res. 2024, 6, 27. [Google Scholar] [CrossRef] [PubMed]
- Tai, W.; Yau, G.T.Y.; Arnold, J.C.; Chan, H.-K.; Kwok, P.C.L. High-Loading Cannabidiol Powders for Inhalation. Int. J. Pharm. 2024, 660, 124370. [Google Scholar] [CrossRef] [PubMed]
- Tai, W.; Arnold, J.C.; Chan, H.-K.; Kwok, P.C.L. Spray Freeze Dried Cannabidiol with Dipalmitoylphosphatidylcholine (DPPC) for Inhalation and Solubility Enhancement. Int. J. Pharm. 2024, 659, 124235. [Google Scholar] [CrossRef]
- Sainz Martinez, A.; Lanaridi, O.; Stagel, K.; Halbwirth, H.; Schnürch, M.; Bica-Schröder, K. Extraction Techniques for Bioactive Compounds of Cannabis. Nat. Prod. Rep. 2023, 40, 676–717. [Google Scholar] [CrossRef]
- Al Ubeed, H.M.S.; Bhuyan, D.J.; Alsherbiny, M.A.; Basu, A.; Vuong, Q.V. A Comprehensive Review on the Techniques for Extraction of Bioactive Compounds from Medicinal Cannabis. Molecules 2022, 27, 604. [Google Scholar] [CrossRef]
- Liu, Y.; Liu, H.-Y.; Li, S.-H.; Ma, W.; Wu, D.-T.; Li, H.-B.; Xiao, A.-P.; Liu, L.-L.; Zhu, F.; Gan, R.-Y. Cannabis sativa Bioactive Compounds and Their Extraction, Separation, Purification, and Identification Technologies: An Updated Review. TrAC Trends Anal. Chem. 2022, 149, 116554. [Google Scholar] [CrossRef]
- Nahar, L.; Uddin, S.J.; Alam, M.A.; Sarker, S.D. Extraction of Naturally Occurring Cannabinoids: An Update. Phytochem. Anal. 2021, 32, 228–241. [Google Scholar] [CrossRef]
- Vella Szijj, J. Challenges of Extracting and Determining Cannabinoids in Different Matrices. Cannabis Cannabinoid Res. 2024, 9, 1470–1477. [Google Scholar] [CrossRef]
- Tanney, C.A.S.; Backer, R.; Geitmann, A.; Smith, D.L. Cannabis Glandular Trichomes: A Cellular Metabolite Factory. Front. Plant Sci. 2021, 12, 721986. [Google Scholar] [CrossRef]
- Tahir, M.N.; Shahbazi, F.; Rondeau-Gagné, S.; Trant, J.F. The Biosynthesis of the Cannabinoids. J. Cannabis Res. 2021, 3, 7. [Google Scholar] [CrossRef] [PubMed]
- Reverchon, E.; De Marco, I. Supercritical Fluid Extraction and Fractionation of Natural Matter. J. Supercrit. Fluids 2006, 38, 146–166. [Google Scholar] [CrossRef]
- Pilařová, V.; Hadysová, Z.; Švec, F.; Nováková, L. Supercritical Fluids in Analysis of Cannabinoids in Various Cannabis Products. Anal. Chim. Acta 2022, 1232, 340452. [Google Scholar] [CrossRef]
- Rovetto, L.J.; Aieta, N.V. Supercritical Carbon Dioxide Extraction of Cannabinoids from Cannabis sativa L. J. Supercrit. Fluids 2017, 129, 16–27. [Google Scholar] [CrossRef]
- Ciolino, L.A.; Ranieri, T.L.; Taylor, A.M. Commercial Cannabis Consumer Products Part 2: HPLC-DAD Quantitative Analysis of Cannabis Cannabinoids. Forensic Sci. Int. 2018, 289, 438–447. [Google Scholar] [CrossRef]
- Mudge, E.M.; Murch, S.J.; Brown, P.N. Leaner and Greener Analysis of Cannabinoids. Anal. Bioanal. Chem. 2017, 409, 3153–3163. [Google Scholar] [CrossRef]
- Cannabis Flower Monography 3028 (07/2024). In European Pharmacopoeia 11.5; Council of Europe: Strasbourg, France, 2024.
- Hazekamp, A.; Peltenburg, A.; Verpoorte, R.; Giroud, C. Chromatographic and Spectroscopic Data of Cannabinoids from Cannabis sativa L. J. Liq. Chromatogr. Relat. Technol. 2005, 28, 2361–2382. [Google Scholar] [CrossRef]
- Raharjo, T.J.; Verpoorte, R. Methods for the Analysis of Cannabinoids in Biological Materials: A Review. Phytochem. Anal. 2004, 15, 79–94. [Google Scholar] [CrossRef]
- Fekete, S.; Schappler, J.; Veuthey, J.-L.; Guillarme, D. Current and Future Trends in UHPLC. TrAC Trends Anal. Chem. 2014, 63, 2–13. [Google Scholar] [CrossRef]
- D’Atri, V.; Fekete, S.; Clarke, A.; Veuthey, J.-L.; Guillarme, D. Recent Advances in Chromatography for Pharmaceutical Analysis. Anal. Chem. 2019, 91, 210–239. [Google Scholar] [CrossRef]
- Owolabi, A.; Ogunsola, O.; Joens, E.; Kotler, M.; Song, L. A Systematic Study of Liquid Chromatography in Search of the Best Separation of Cannabinoids for Potency Testing of Hemp-Based Products. Molecules 2025, 30, 758. [Google Scholar] [CrossRef]
- De Luca, C.; Buratti, A.; Krauke, Y.; Stephan, S.; Monks, K.; Brighenti, V.; Pellati, F.; Cavazzini, A.; Catani, M.; Felletti, S. Investigating the Effect of Polarity of Stationary and Mobile Phases on Retention of Cannabinoids in Normal Phase Liquid Chromatography. Anal. Bioanal. Chem. 2022, 414, 5385–5395. [Google Scholar] [CrossRef] [PubMed]
- De Luca, C.; Buratti, A.; Umstead, W.; Franco, P.; Cavazzini, A.; Felletti, S.; Catani, M. Investigation of Retention Behavior of Natural Cannabinoids on Differently Substituted Polysaccharide-Based Chiral Stationary Phases under Reversed-Phase Liquid Chromatographic Conditions. J. Chromatogr. A 2022, 1672, 463076. [Google Scholar] [CrossRef] [PubMed]
- Russo, F.; Tolomeo, F.; Angela Vandelli, M.; Biagini, G.; Laganà, A.; Laura Capriotti, A.; Cerrato, A.; Carbone, L.; Perrone, E.; Cavazzini, A.; et al. Enantioseparation of Chiral Phytocannabinoids in Medicinal Cannabis. J. Chromatogr. B 2023, 1221, 123682. [Google Scholar] [CrossRef] [PubMed]
- Umstead, W.J. The Chiral Separation of the (+) and (−)Enantiomers of Cannabidiol. Cannabis Sci. Technol. 2022, 5, 30–34. [Google Scholar]
- Welch, C.J.; Brkovic, T.; Schafer, W.; Gong, X. Performance to Burn? Re-Evaluating the Choice of Acetonitrile as the Platform Solvent for Analytical HPLC. Green Chem. 2009, 11, 1232–1238. [Google Scholar] [CrossRef]
- Dolan, J.W. Selectivity in Reversed-Phase LC Separations (Part 1): Solvent-Type Selectivity. LCGC Eur. 2010, 23, 581–584. [Google Scholar]
- Franklin, E.; Wilcox, M. Gradient HPLC-UV Method for Cannabinoid Profiling. In Chromatography Today; 2019; pp. 34–37. Available online: https://www.chromatographytoday.com/article/hplc-uhplc/31/regis-technologies-inc/gradient-hplc-uv-method-for-cannabinoid-profiling/2599 (accessed on 28 February 2025).
- Tzimas, P.S.; Petrakis, E.A.; Halabalaki, M.; Skaltsounis, L.A. Effective Determination of the Principal Non-Psychoactive Cannabinoids in Fiber-Type Cannabis sativa L. by UPLC-PDA Following a Comprehensive Design and Optimization of Extraction Methodology. Anal. Chim. Acta 2021, 1150, 338200. [Google Scholar] [CrossRef]
- Ryu, B.R.; Islam, M.J.; Azad, M.O.K.; Go, E.-J.; Rahman, M.H.; Rana, M.S.; Lim, Y.-S.; Lim, J.-D. Conversion Characteristics of Some Major Cannabinoids from Hemp (Cannabis sativa L.) Raw Materials by New Rapid Simultaneous Analysis Method. Molecules 2021, 26, 4113. [Google Scholar] [CrossRef]
- Clifford, B.; Young, C.; Owens, A.; Mott, J.; Lieberman, R. How to Choose the Right Instrumentation for Cannabinoid and Terpene Analysis. Cannabis Sci. Technol. 2020, 3, 34–42. [Google Scholar]
- De Backer, B.; Debrus, B.; Lebrun, P.; Theunis, L.; Dubois, N.; Decock, L.; Verstraete, A.; Hubert, P.; Charlier, C. Innovative Development and Validation of an HPLC/DAD Method for the Qualitative and Quantitative Determination of Major Cannabinoids in Cannabis Plant Material. J. Chromatogr. B 2009, 877, 4115–4124. [Google Scholar] [CrossRef]
- Križman, M. A Simplified Approach for Isocratic HPLC Analysis of Cannabinoids by Fine Tuning Chromatographic Selectivity. Eur. Food Res. Technol. 2020, 246, 315–322. [Google Scholar] [CrossRef]
- Berman, P.; Futoran, K.; Lewitus, G.M.; Mukha, D.; Benami, M.; Shlomi, T.; Meiri, D. A New ESI-LC/MS Approach for Comprehensive Metabolic Profiling of Phytocannabinoids in Cannabis. Sci. Rep. 2018, 8, 14280. [Google Scholar] [CrossRef] [PubMed]
- Thomas, B.F.; Compton, D.R.; Martin, B.R. Characterization of the Lipophilicity of Natural and Synthetic Analogs of Delta 9-Tetrahydrocannabinol and Its Relationship to Pharmacological Potency. J. Pharmacol. Exp. Ther. 1990, 255, 624–630. [Google Scholar] [CrossRef]
- Chandran, S.; Singh, R.S.P. Comparison of Various International Guidelines for Analytical Method Validation. Pharmazie 2007, 62, 4–14. [Google Scholar] [CrossRef]
- AOAC Official Methods of Analysis. Appendix F: Guidelines for Standard Method Performance Requirements; AOAC International: Rockville, MD, USA, 2016; Available online: https://www.aoac.org/resources/guidelines-for-standard-method-performance-requirements/ (accessed on 7 March 2025).
- Ojha, A.; Bhargava, S. Chapter 3—International Council for Harmonisation (ICH) Guidelines. In Regulatory affairs in the Pharmaceutical Industry; Elsevier: Amsterdam, The Netherlands, 2022; pp. 47–74. [Google Scholar]
- International Conference for Harmonisation. ICH Q2(R1) Validation of Analytical Procedures: Text and Methodology; European Medicines Agency: Amsterdam, The Netherlands, 1995.
- International Conference for Harmonisation. ICH Q2(R2) Guideline on Validation of Analytical Procedures; European Medicines Agency: Amsterdam, The Netherlands, 2024. Available online: https://www.ema.europa.eu/en/ich-q2r2-validation-analytical-procedures-scientific-guideline (accessed on 7 March 2025).
- International Conference for Harmonisation. ICH Guideline M10 on Bioanalytical Method Validation and Study Sample Analysis; European Medicines Agency: Amsterdam, The Netherlands, 2023. Available online: https://www.ema.europa.eu/en/ich-m10-bioanalytical-method-validation-scientific-guideline (accessed on 7 March 2025).
- AOAC Official Methods of Analysis. Appendix K: Guidelines for Dietary Supplements and Botanicals; AOAC International: Rockville, MD, USA, 2013. [Google Scholar]
- AOAC SMPR® 2019.003; Standard Method Performance Requirements (SMPRs®) for Quantitation of Cannabinoids in Plant Materials of Hemp (Low THC Varieties Cannabis sp.). AOAC International: Rockville, MD, USA, 2019. Available online: https://www.aoac.org/resources/smpr-2019003/ (accessed on 7 March 2025).
- ISO/IEC 17025:2017; General Requirements for the Competence of Testing and Calibration Laboratories. International Organization for Standardization: Geneva, Switzerland, 2017.
- Analytical Procedures and Methods Validation for Drugs and Biologics—Guidance for Industry; Food and Drug Administration: Silver Spring, MD, USA, 2015. Available online: https://www.fda.gov/media/87801/download (accessed on 7 March 2025).
- ORA Lab Manual Vol. II—Methods, Method Verification and Validation (ORALAB.5.4.5); Food and Drug Administration: Silver Spring, MD, USA, 2023. Available online: https://www.fda.gov/media/73920/download (accessed on 7 March 2025).
- Agência Nacional de Vigilância Sanitária. RDC No 166, de 24 de Julho de 2017. Dispõe Sobre a Validação de Métodos Analíticos e Dá Outras Providências. 2017. Available online: https://bvsms.saude.gov.br/bvs/saudelegis/anvisa/2017/rdc0166_24_07_2017.pdf (accessed on 7 March 2025).
- Magnusson, B.; Örnemark, U. (Eds.) Eurachem Guide: The Fitness for Purpose of Analytical Methods—A Laboratory Guide to Method Validation and Related Topics, 2nd ed.; Eurochem: Zug, Switzerland, 2014; ISBN 978-91-87461-59-0. [Google Scholar]
- Weitzel, M.L.J. The Estimation and Use of Measurement Uncertainty for a Drug Substance Test Procedure Validated According to USP. Accred. Qual. Assur. 2012, 17, 139–146. [Google Scholar] [CrossRef]
- Standard Practices for Method Validation in Forensic Toxicology. ANSI/ASB Standard 036, 1st ed.; American Academy of Forensic Science: Colorado Springs, CO, USA, 2019; Available online: https://www.aafs.org/asb-standard/standard-practices-method-validation-forensic-toxicology (accessed on 7 March 2025).
- Analytical Quality Control and Method Validation Procedures for Pesticide Residues Analysis in Food and Feed. SANTE 11312/2021; European Reference Laboratories for Residues in Pesticides, 2021; Available online: https://www.eurl-pesticides.eu/docs/public/tmplt_article.asp?CntID=727 (accessed on 7 March 2025).
- Guidance for the Implementation of a Quality Management System in Drug Testing Laboratories; United Nations Office on Drugs and Crime: Vienna, Austria, 2009; Available online: https://www.unodc.org/unodc/en/scientists/guidance-for-the-implementation-of-a-quality-management-system-in-drug-testing-laboratories_new.html (accessed on 7 March 2025).
- Scientific Working Group for Forensic Toxicology. Scientific Working Group for Forensic Toxicology (SWGTOX) Standard Practices for Method Validation in Forensic Toxicology. J. Anal. Toxicol. 2013, 37, 452–474. [Google Scholar] [CrossRef]
- Peters, F.T.; Drummer, O.H.; Musshoff, F. Validation of New Methods. Forensic Sci. Int. 2007, 165, 216–224. [Google Scholar] [CrossRef] [PubMed]
- Trufelli, H.; Palma, P.; Famiglini, G.; Cappiello, A. An Overview of Matrix Effects in Liquid Chromatography–Mass Spectrometry. Mass Spectrom. Rev. 2011, 30, 491–509. [Google Scholar] [CrossRef]
- Choi, S.-I.; Han, X.; Lee, S.-J.; Men, X.; Oh, G.; Lee, D.-S.; Lee, O.-H. Validation of an Analytical Method for the Determination of Thiabendazole in Various Food Matrices. Separations 2022, 9, 135. [Google Scholar] [CrossRef]
- Dawson, D.D.; Martin, R.W. Investigation of Chocolate Matrix Interference on Cannabinoid Analytes. J. Agric. Food Chem. 2020, 68, 5699–5706. [Google Scholar] [CrossRef] [PubMed]
- Ramella, A.; Roda, G.; Pavlovic, R.; Dei Cas, M.; Casagni, E.; Mosconi, G.; Cecati, F.; Minghetti, P.; Grizzetti, C. Impact of Lipid Sources on Quality Traits of Medical Cannabis-Based Oil Preparations. Molecules 2020, 25, 2986. [Google Scholar] [CrossRef]
- Williams, M.L.; Olomukoro, A.A.; Emmons, R.V.; Godage, N.H.; Gionfriddo, E. Matrix Effects Demystified: Strategies for Resolving Challenges in Analytical Separations of Complex Samples. J. Sep. Sci. 2023, 46, 2300571. [Google Scholar] [CrossRef]
- Matuszewski, B.K.; Constanzer, M.L.; Chavez-Eng, C.M. Strategies for the Assessment of Matrix Effect in Quantitative Bioanalytical Methods Based on HPLC−MS/MS. Anal. Chem. 2003, 75, 3019–3030. [Google Scholar] [CrossRef]
- Cortese, M.; Gigliobianco, M.R.; Magnoni, F.; Censi, R.; Di Martino, P. Compensate for or Minimize Matrix Effects? Strategies for Overcoming Matrix Effects in Liquid Chromatography-Mass Spectrometry Technique: A Tutorial Review. Molecules 2020, 25, 3047. [Google Scholar] [CrossRef] [PubMed]
- Nasiri, A.; Jahani, R.; Mokhtari, S.; Yazdanpanah, H.; Daraei, B.; Faizi, M.; Kobarfard, F. Overview, Consequences, and Strategies for Overcoming Matrix Effects in LC-MS Analysis: A Critical Review. Analyst 2021, 146, 6049–6063. [Google Scholar] [CrossRef] [PubMed]
- Gałuszka, A.; Migaszewski, Z.; Namieśnik, J. The 12 Principles of Green Analytical Chemistry and the SIGNIFICANCE Mnemonic of Green Analytical Practices. TrAC Trends Anal. Chem. 2013, 50, 78–84. [Google Scholar] [CrossRef]
- Safaei, Z.; Bocian, S.; Buszewski, B. Green Chromatography-Carbon Footprint of Columns Packed with Core–Shell Materials. RSC Adv. 2014, 4, 53915–53920. [Google Scholar] [CrossRef]
- Kalisz, O.; Tobiszewski, M.; Nowaczyk, A.; Bocian, S. Exploring the Potential of Green Chemistry in Reversed-Phase Liquid Chromatography: A Review of Sustainable Solvents. TrAC Trends Anal. Chem. 2024, 181, 118007. [Google Scholar] [CrossRef]
- Nowak, P.M.; Wietecha-Posłuszny, R.; Pawliszyn, J. White Analytical Chemistry: An Approach to Reconcile the Principles of Green Analytical Chemistry and Functionality. TrAC Trends Anal. Chem. 2021, 138, 116223. [Google Scholar] [CrossRef]
- Prat, D.; Wells, A.; Hayler, J.; Sneddon, H.; McElroy, C.R.; Abou-Shehada, S.; Dunn, P.J. CHEM21 Selection Guide of Classical- and Less Classical-Solvents. Green Chem. 2016, 18, 288–296. [Google Scholar] [CrossRef]
- Keith, L.H.; Gron, L.U.; Young, J.L. Green Analytical Methodologies. Chem. Rev. 2007, 107, 2695–2708. [Google Scholar] [CrossRef] [PubMed]
- Gałuszka, A.; Migaszewski, Z.M.; Konieczka, P.; Namieśnik, J. Analytical Eco-Scale for Assessing the Greenness of Analytical Procedures. TrAC Trends Anal. Chem. 2012, 37, 61–72. [Google Scholar] [CrossRef]
- Pena-Pereira, F.; Wojnowski, W.; Tobiszewski, M. AGREE—Analytical GREEnness Metric Approach and Software. Anal. Chem. 2020, 92, 10076–10082. [Google Scholar] [CrossRef]
- Płotka-Wasylka, J. A New Tool for the Evaluation of the Analytical Procedure: Green Analytical Procedure Index. Talanta 2018, 181, 204–209. [Google Scholar] [CrossRef]
- Sammut Bartolo, N.; Gallo, L.L.; Szyrner, K.; Buhagiar, P.I.; Vella Szijj, J. Greenness Assessment of Analytical Methods for Determination of Cannabinoids in Oils Using NEMI, Analytical Eco-Scale, AGREE and GAPI. Anal. Methods 2024, 16, 5931–5942. [Google Scholar] [CrossRef]
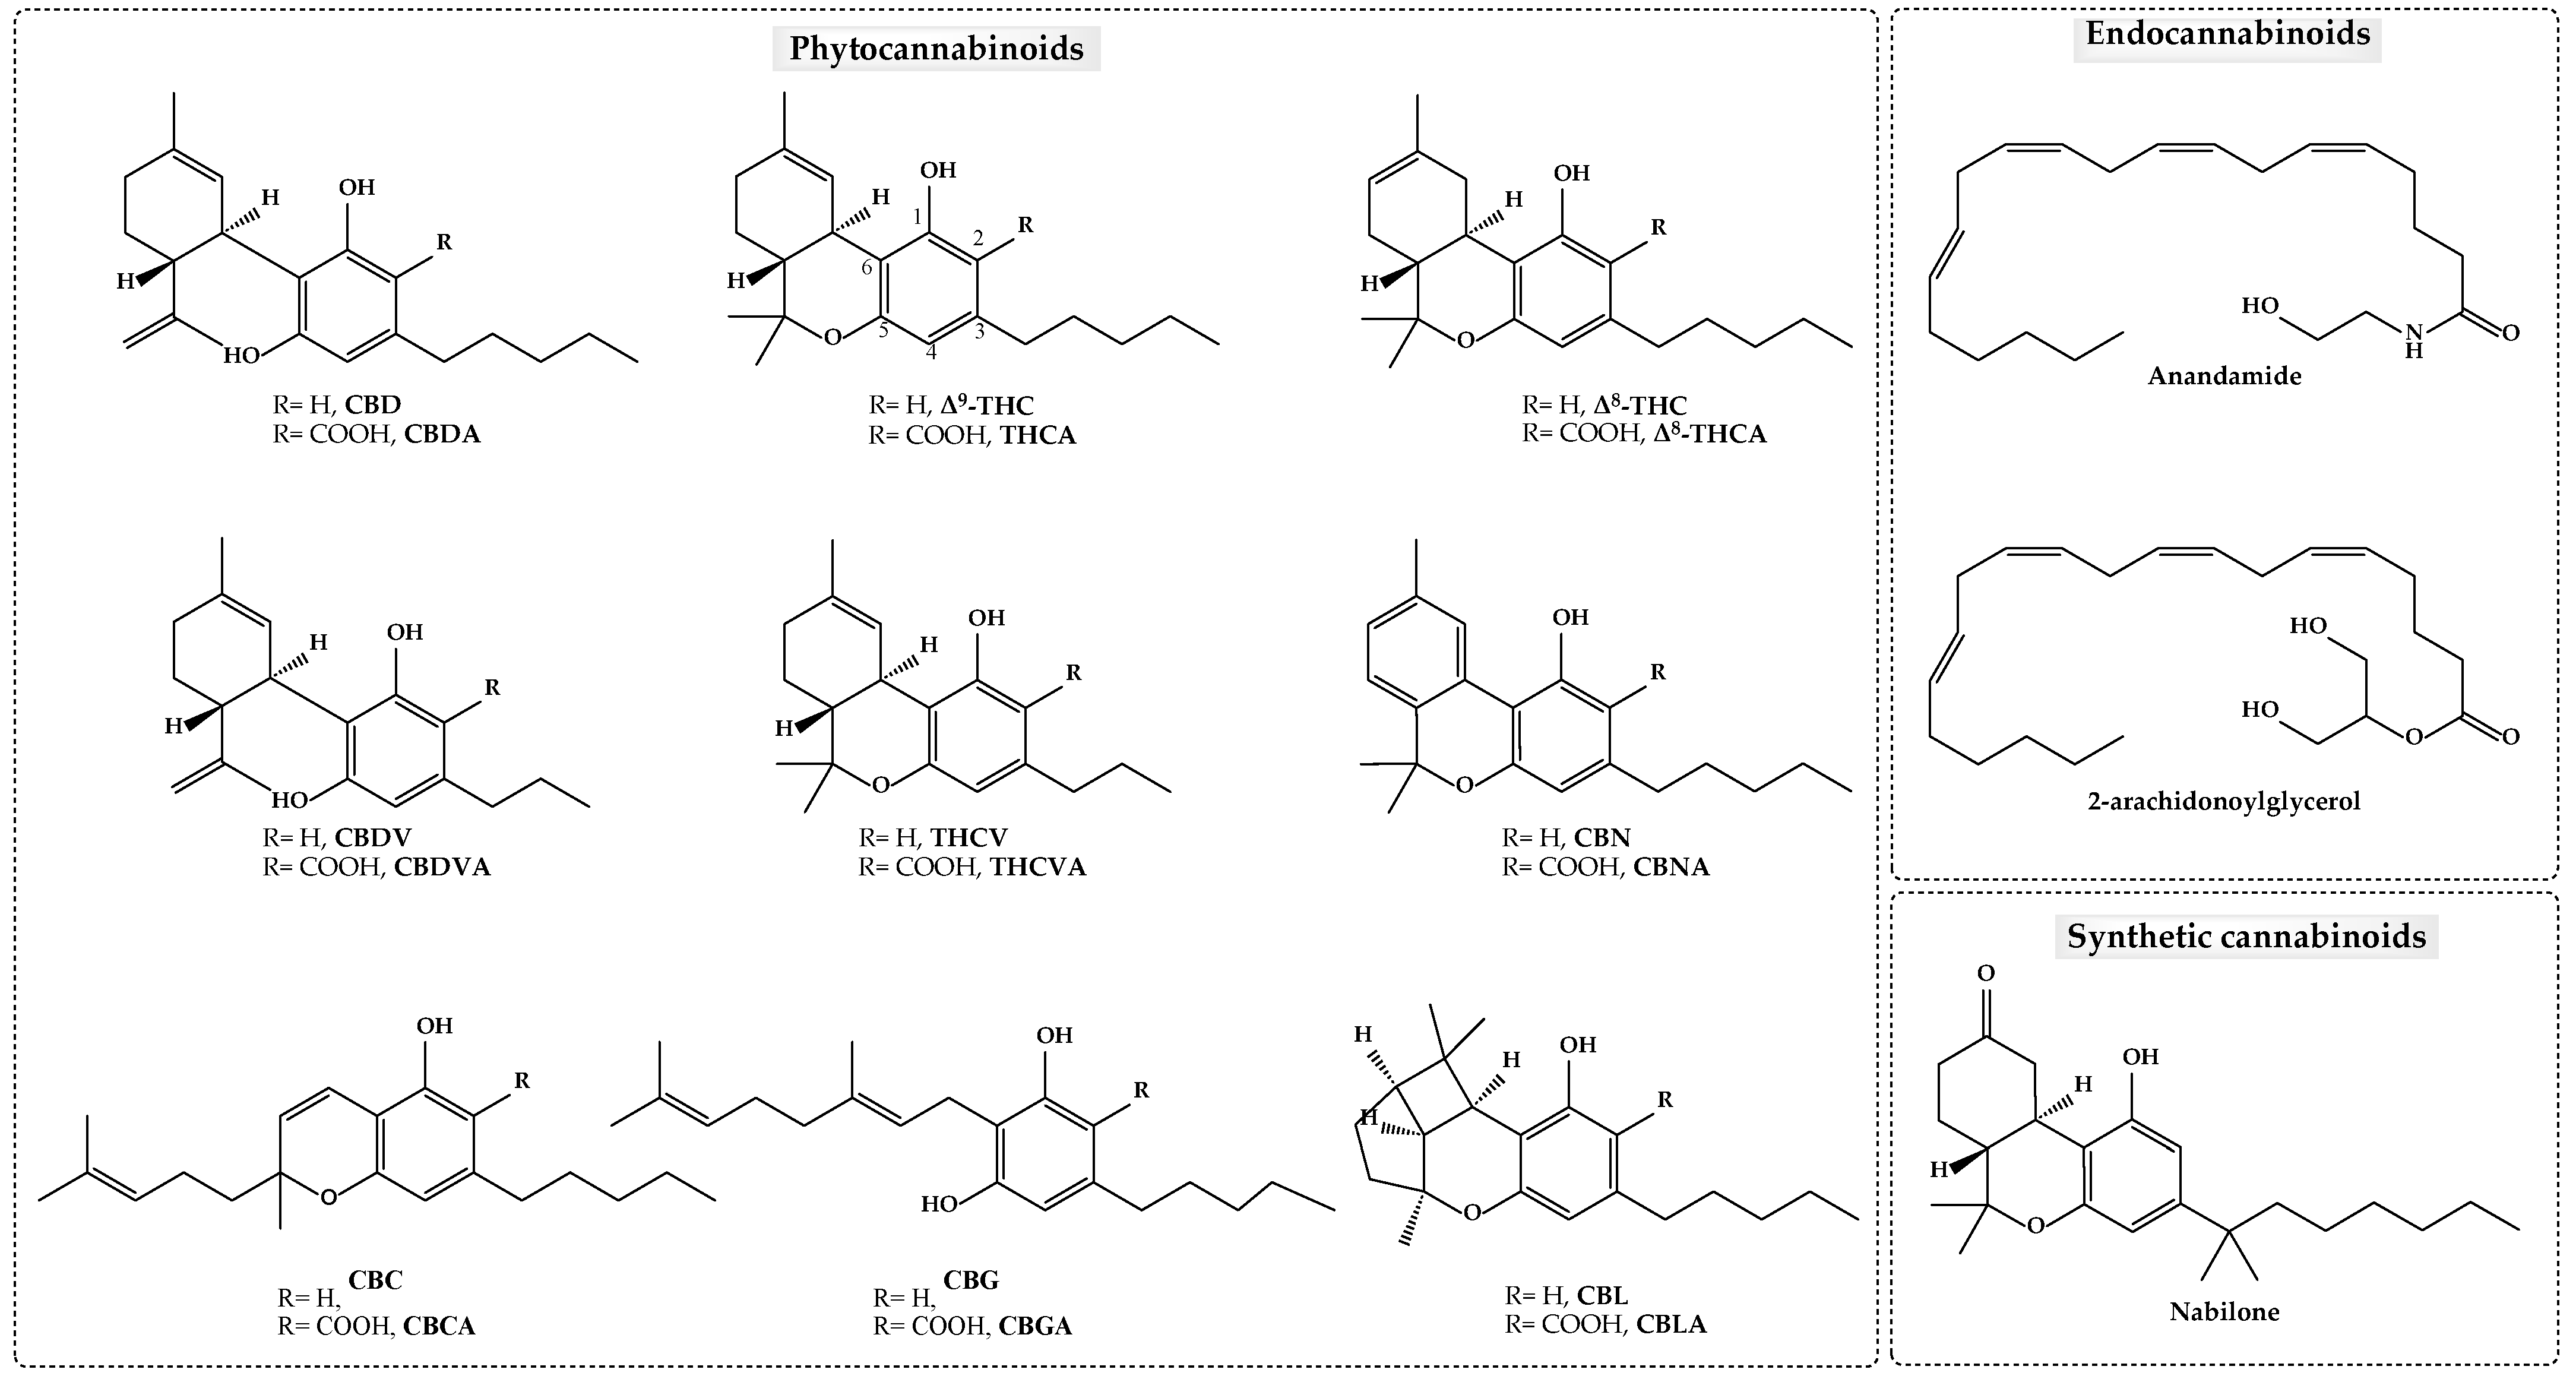
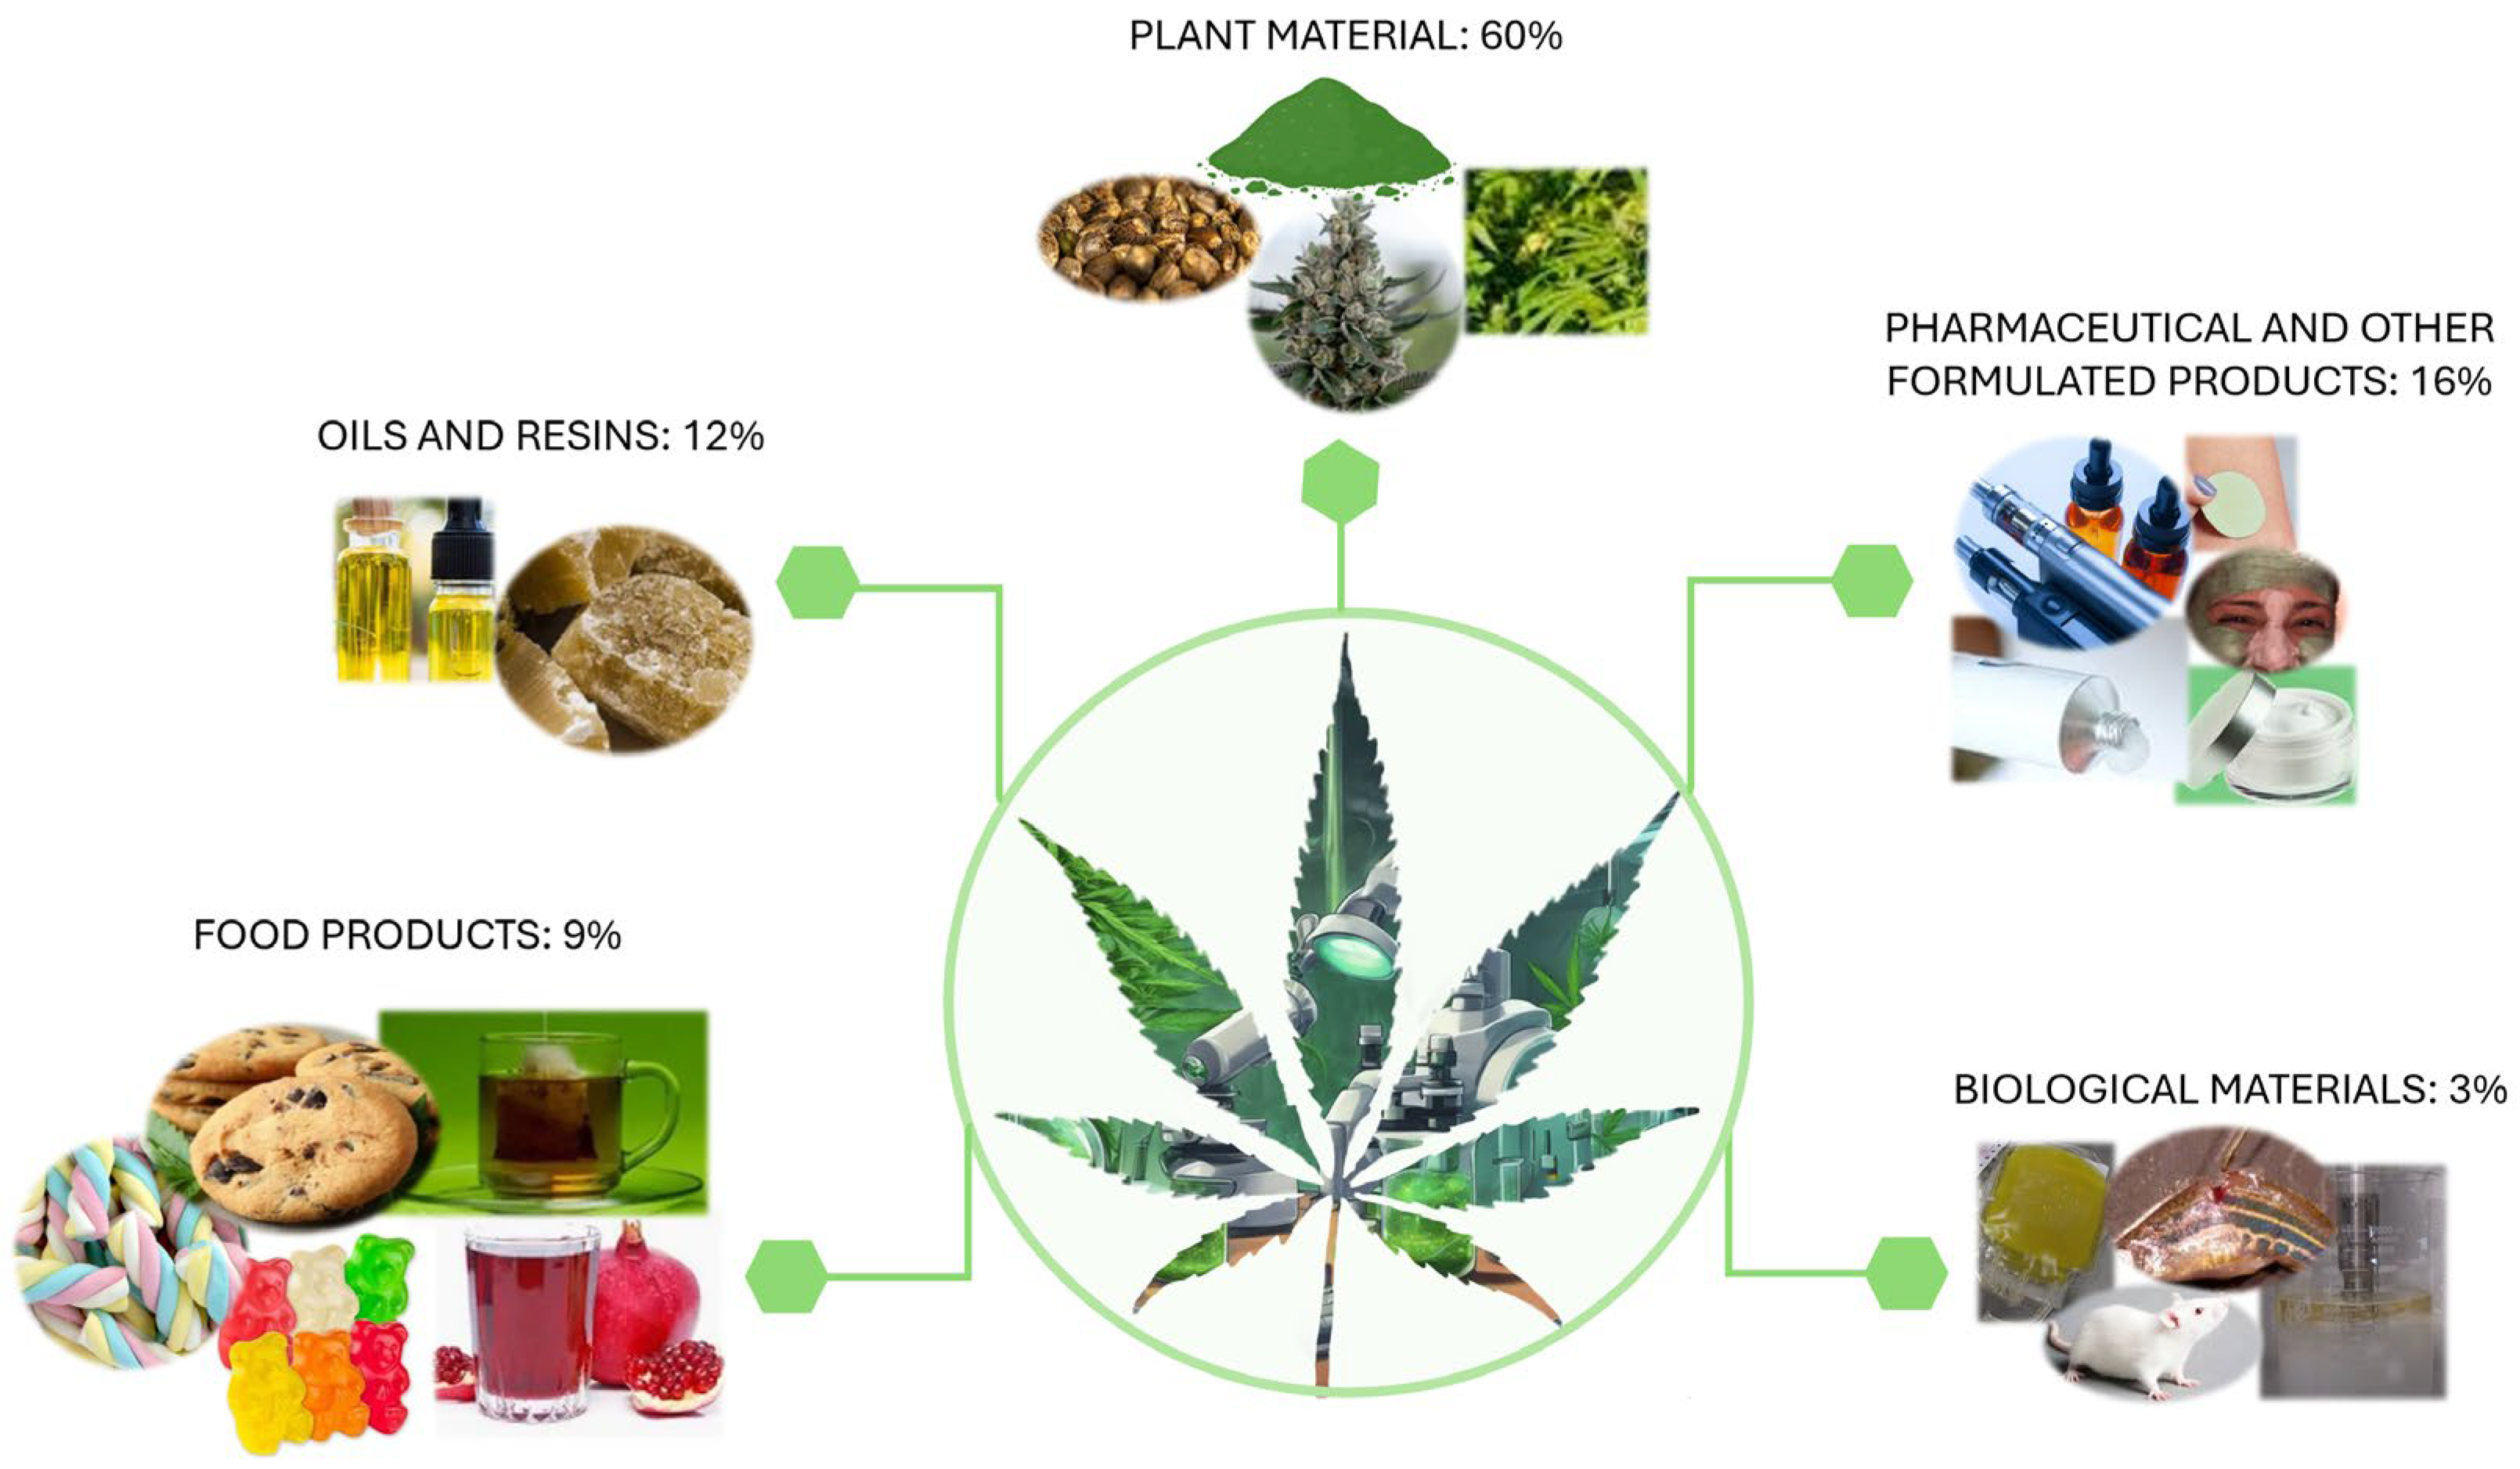
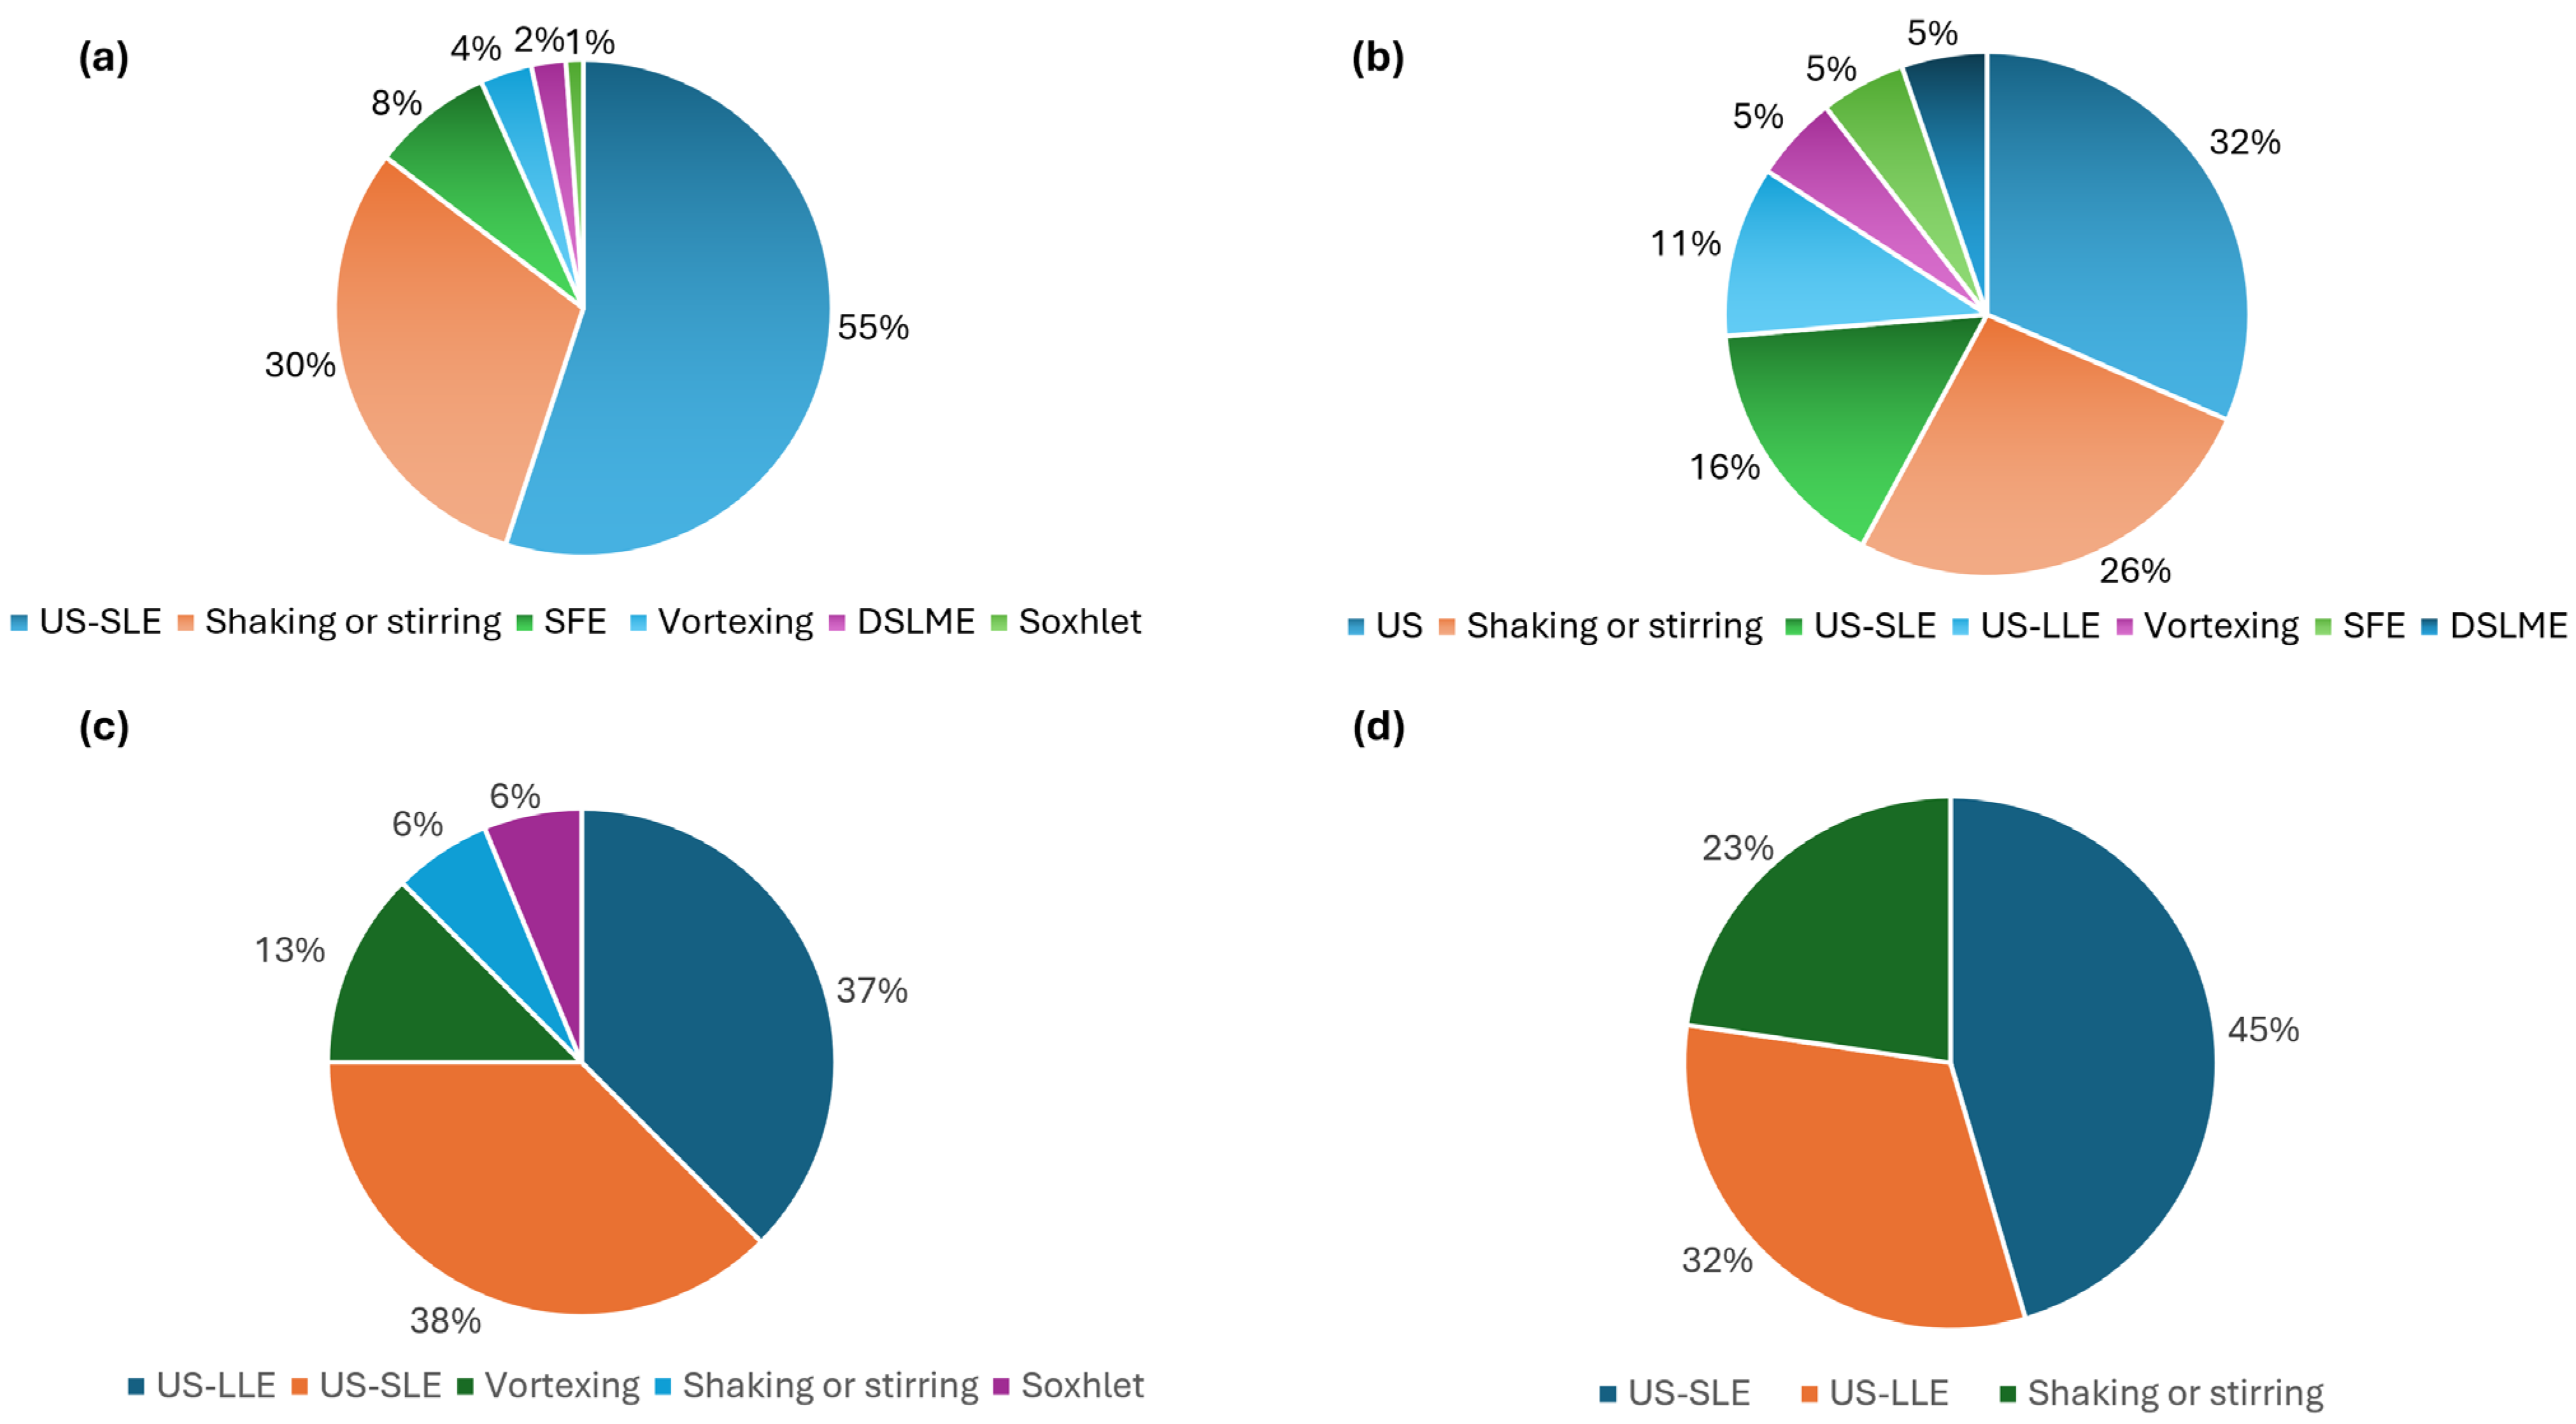
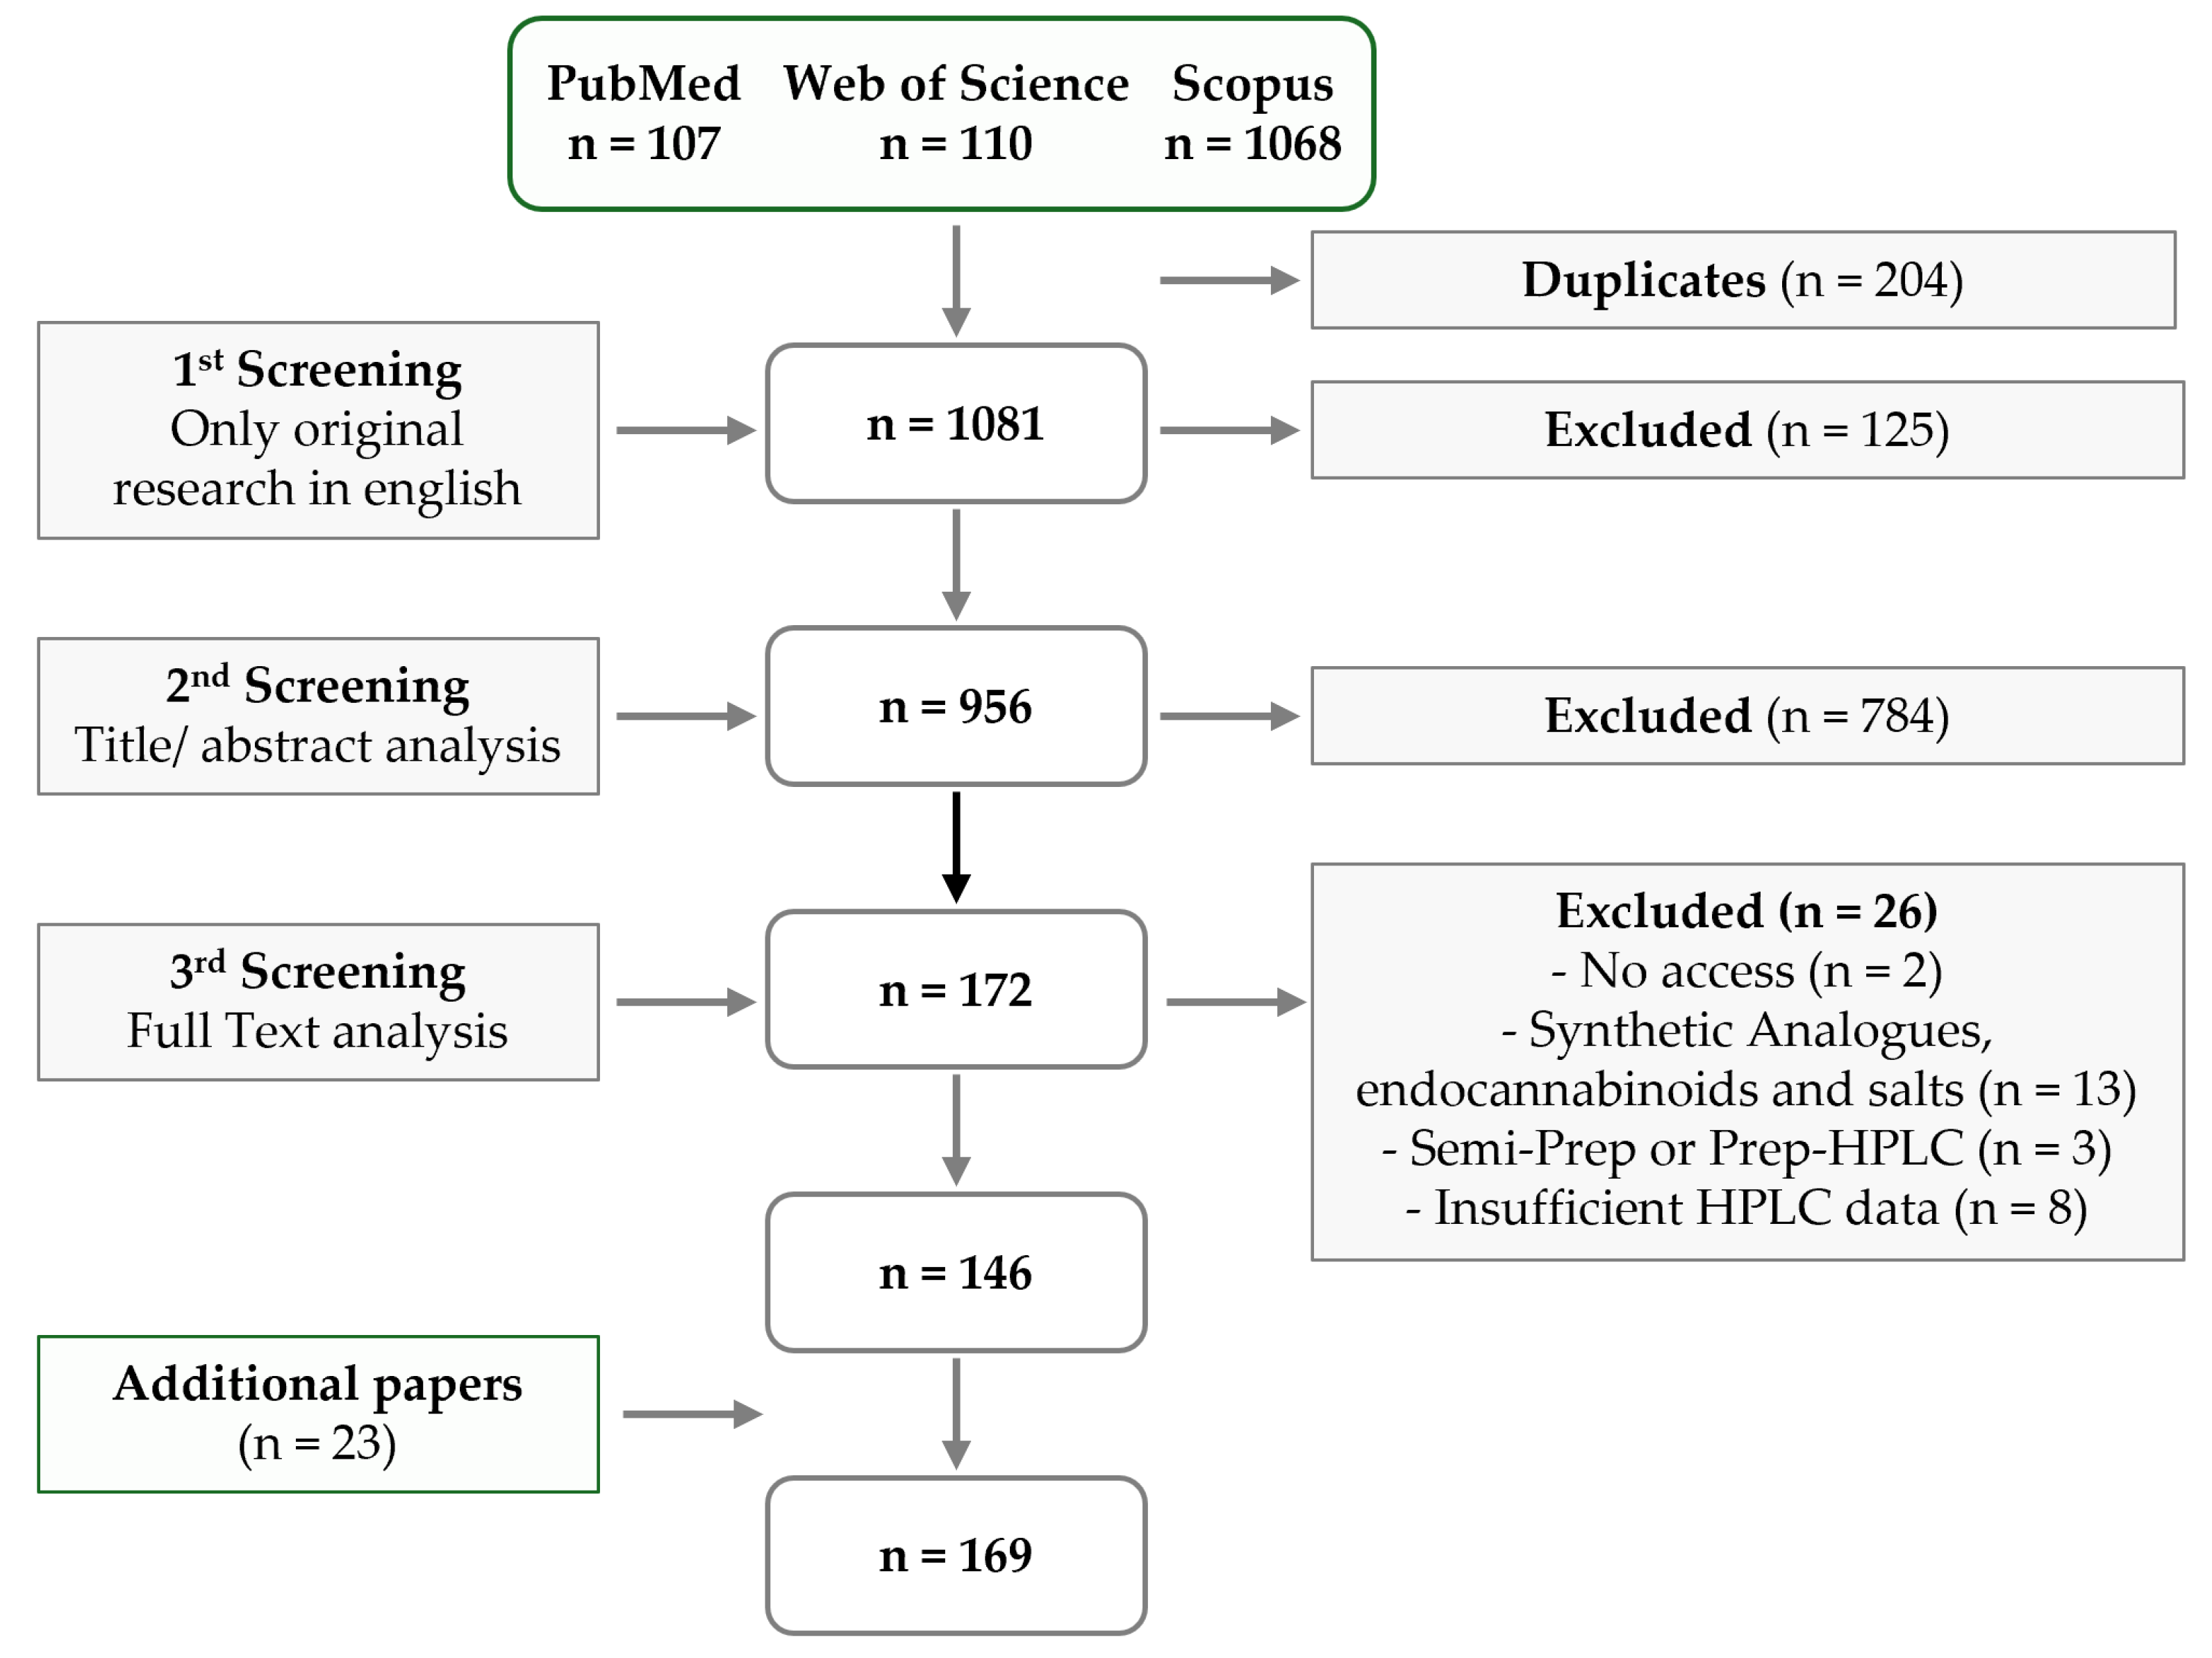

| Entry | Method a | Mobile Phase b | Column | Flow Rate (mL/min) c | Run Time (min) d | Injection Vol. (µL) | Temp. (°C) | UV Detection (nm) e | Cannabinoids Analyzed f | Ref. | ||
|---|---|---|---|---|---|---|---|---|---|---|---|---|
| Aqueous Phase (A) | Organic Phase (B) | Gradient % B | ||||||||||
| 1 | HPLC-UV/Vis | ACN | 10–90 | Agilent C18 (150 × 46 mm, 5 μm) | NR | 20 | 10 | 35 | NR | 5: CBD, CBDA, CBN, Δ9-THC, THCA | [80] | |
| 2 | HPLC-VWD | ACN | 65–75 | Restek Raptor ARC-18 (150 × 4.6 mm, 5 μm) with a guard col | 1 | 15 d | NR | NR | 228 | 6: CBC, CBD, CBG, CBN, Δ8-THC, Δ9-THC | [81] | |
| 3 | HPLC-DAD | ACN | 70–80 | InfinityLab Poroshell 120 C18 (100 × 4.6 mm, 2.7 μm) with a guard col | 1 | 16 | 20 | 40 | 220: CBD, Δ9-THC 283: CBC, CBN | 4: CBC, CBD, CBG, CBN | [82] | |
| 4 | HPLC-DAD | 0.01% FA | ACN-0.01% FA | 65–100 | Accucore C18 (100 × 2.1 mm, 2.6 μm) | 0.3 | 12 d | 1 | 50 | 230 | 4: CBD, CBDA, Δ9-THC, THCA | [83,84] |
| 5 | UHPLC-UV | 0.05% FA | ACN-0.05% FA | 70–100 | Waters Cortecs UPLC C18 (100 × 2.1 mm, 1.6 μm) | 0.3 | 12.5 | 10 | 35 | 228 | 17: CBC, CBCA, CBD, CBDA, CBDV, CBDVA, CBG, CBGA, CBN, CBNA, CBL, CBLA, Δ8-THC, Δ9-THC, THCA, THCV, THCVA | [85] |
| 6 | HPLC-DAD | 0.075% FA | ACN-0.5% FA | 70–100 | Excel Super C18 (250 × 4.6 mm, 3 μm) | 1 | 14 d | 10 | 40 | 210 | 12: CBC, CBD, CBDA, CBDV, CBDVA, CBG, CBGA, CBN, CBNA, Δ9-THC, THCA, THCV | [86] |
| 7 | HPLC-DAD | 0.1% FA | ACN | 65–95 | Luna C18 (150 × 4.6 mm, 5 μm) with a guard col | 1 | 28 | 20 | 25 | 210: CBD, Δ9-THC 220: CBDA, THCA, CBN | 5: CBD, CBDA, CBN, Δ9-THC, THCA | [87] |
| 8 | HPLC-DAD | 0.1% FA | ACN | 70–95 | InfinityLab Poroshell EC-C18 (150 × 3.0 mm, 2.7 μm) with a guard column | 0.5 | 25 | 5 | 35 | 228 | 7: CBD, CBDA, CBG, CBGA, CBN, Δ9-THC, THCA | [88,89] |
| 9 | HPLC-DAD | 0.1% FA | ACN-0.1% FA | 2–100 | Eclipse XDB-C18 (150 × 4.6 mm, 3.5 μm) | 0.6 | 51 | 10 | NR | 280 | 4: CBD, CBDA, CBEA, DHC | [90,91] |
| 10 | UHPLC-DAD | 0.1% FA | ACN-0.1% FA | 5–100 | Ascentis Express RP Amide (100 × 2.1 mm, 2.7 μm) | 0.4 | 65 | NR | NR | 220/269/306: CBDA 220/268/305: CBGA 220/271/304: THCA | 3: CBDA, CBGA, THCA f | [92,93] |
| 11 | UHPLC-DAD | 0.1% FA | ACN-0.1% FA | 5–100 | Phenomenex XB-C18 (50 × 2.1 mm, 1.7 μm) | NR | 18 d | NR | NR | 210, 273 | 7: CBC, CBD, CBDV, CBG, CBN, cis-Δ9-THC, Δ9-THC f | [94] |
| 12 | HPLC-UV/Vis | 0.1% FA | ACN-0.1% FA | 25–100 | µ-Bondapak C18 (300 × 3.9 mm) | 2 | 45 | 10 | NR | 225 | 14: CBC, CBCA, CBD, CBDA, CBDV, CBDVA, CBG, CBGA, CBN, Δ8-THC, ∆9-THC, THCA, THCV, THCVA | [95] |
| 13 | HPLC-DAD | 0.1% FA | ACN-0.1% FA | 40–90 | Zorbax Eclipse XDB C18 (150 × 4.6 mm, 5 μm) | 0.7 | 35 | 10–15 | 35 | NR | 4: CBD, CBDA, CBN, ∆9-THC | [96] |
| 14 | HPLC-UV f | 0.1% FA | ACN-0.1% FA | 60–90 | Ascentis Express C18 (150 × 3.0 mm, 2.7 μm) | 0.4 | 40 or 45 d | 3 | NR | 210: NC 220: AC | 7: CBD, CBDA, CBG, CBGA, CBN, Δ9-THC, THCA | [97,98] |
| 15 | UHPLC-DAD | 0.1% FA | ACN-0.1% FA | 60–90 | Fortis SpeedCore C18-PFP (100 mm × 2.1 mm, 2.6 μm) | 0.4 | 11 | 3 | 30 | 210: 6 NC 225: AC, CBC, CBN | 12: CBC, CBD, CBDA, CBCT, CBDV, CBDVA, CBE, CBGA, CBN, Δ9-cis-THC, Δ9-THC, THCA | [99,100] |
| 16 | HPLC-DAD | 0.1% FA | ACN-0.1% FA | 65–95 | Poroshell 120 SB-C18, (150 × 4.6 mm, 2.7 μm) | 0.5 | 18 | 2 | NR | 214 | 9: CBC, CBD, CBDA, CBG, CBGA, CBN, Δ9-THC, THCA, THCV | [101,102] |
| 17 | HPLC-DAD | 0.1% FA | ACN-0.1% FA | 65–100 | Zorbax Eclipse Plus C18 (50 × 2.1 mm, 1.8 μm) | 0.4 | 7.5 | 2 | 40 | 210: CBD, Δ9-THC 221: CBDA, THCA | 4: CBD, CBDA, Δ9-THC, THCA | [103,104] |
| 18 | UHPLC-DAD | 0.1% FA | ACN-0.1% FA | 68–95 | InfinityLab Poroshell 120 EC-C18 (150 × 2.1 mm, 2.7 μm) with a guard col | 0.5 | 18 | 1 | 30 | 214 | 11: CBC, CBD, CBDA, CBDV, CBG, CBGA, CBN, Δ8-THC, Δ9-THC, THCA, THCV | [105,106] |
| 19 | HPLC-DAD | 0.1% FA | ACN-0.1% FA | 70–77 | Phenomenex Luna C18(2) (150 × 4.6 mm, 3 μm) with a guard col | 1.2 | 22.2 | 10 | NR | 220 | 11: CBC, CBCA, CBD, CBDA, CBG, CBGA, CBN, Δ8-THC, Δ9-THC, THCA, THCV | [107] |
| 20 | HPLC-DAD | 0.1% FA | ACN-0.1% FA | 70–90 | Poroshell 120 EC-C18 (150 × 4.6 mm, 2.7 μm) | 0.4 | 60 | 10 | 25 | 220 | 5: CBD, CBDA, CBN, Δ9-THC, THCA | [108] |
| 21 | HPLC-DAD | 0.1% FA | ACN-0.1% FA | 70–90 | Supersil ODS2 (250 × 4.6 mm, 5 μm) | 1 | 30 | 10 | 35 | 220 | 5: CBD, CBDA, CBN, Δ9-THC, THCA | [109] |
| 22 | UHPLC-UV | 0.1% FA | ACN-0.1% FA | 70–100 | Waters Acquity UPLC C18 (150 × 2.1 mm, 1.7 μm) | 0.4 | 14 | NR | 30 | NR | 6: CBD, CBDA, CBGA, CBN, Δ9-THC, THCA | [110] |
| 23 | HPLC-DAD | 0.1% FA | ACN-0.1% FA | 70–100 | Phenomenex Luna Omega C18 (150 × 2.1 mm × 1.6 μm) | 0.4 | 8 | 5 | 40 | 214, 280 e | 16: CBC, CBCA, CBD, CBDA, CBDV CBDVA, CBG, CBGA, CBL, CBN, CBNA, Δ8-THC, Δ9-THC, THCA, THCV, THCVA | [111] |
| 24 | HPLC-DAD | 0.1% FA | ACN-0.1% FA | 70–100 | Waters SunFire C18 (150 × 3.0 mm, 3.5 μm) with a guard col | NR | 29 d | 2 | NR | 225 | 3: CBD, CBG, Δ9-THC f | [112] |
| 25 | HPLC-UV/Vis | 0.1% FA | ACN-0.1% FA | 72–90 | Zorbax XDB-C18 (150 mm × 4.6 mm, 3.5 μm) | 1.5 | 12 d | 10 | 30 | 228 | 13: CBC, CBD, CBDA, CBDV, CBDVA, CBG, CBGA, CBL, CBN, Δ8-THC, Δ9-THC, THCA, THCV f | [113] |
| 26 | HPLC-DAD | 0.1% FA | ACN-0.1% FA | 80–100 | Ultimate LP-C18 (150 × 4.6 mm, 2.5 μm) | 1 | 28 | 10 | NR | 228 | 6: CBD, CBDA, CBG, CBN, Δ9-THC, THCA f | [114] |
| 27 | HPLC-DAD | 1 mM FA (pH 3.53) | ACN | 70–99 | Hypersil C18 (150 × 4.6 mm, 3 μm) with a guard col | 1 | 18 | 10 | 25 | NR | 14: CBC, CBCA, CBD, CBDA, CBDV, CBDVA, CBG, CBGA, CBN, Δ8-THC, Δ9-THC, THCA, THCV, THCVA | [115,116] |
| 28 | HPLC-DAD | AF 2 mM–0.1% FA | ACN-0.1% FA | 70–90 | Ascentis Express C18 (150 × 3.0 mm, 2.7 μm) | 0.3 | 20 | 6 | 25 | 210: NC 220: AC | 12: CBC, CBCA, CBCV, CBD, CBDA, CBDV, CBGA, CBGV, CBN, Δ8-THC, Δ9-THC, THCA f | [117] |
| 29 | HPLC-VWD | AF 2 mM–0.1% FA | ACN-0.1% FA | 70–90 | Ascentis Express C18 (150 × 3.0 mm, 2.7 μm) | 0.2 | 35 | 3 | NR | 210 | 9: CBC, CBCV, CBD, CBDB, CBDV, CBG, CBGV, Δ8-THC, Δ9-THC | [118] |
| 30 | UHPLC-DAD | AF 5 mM–0.1% FA | ACN-0.1% FA | 67–95 | Ascentis Express C18 (150 × 3.0 mm, 2.7 μm) | 1 | 8 d | 5 | 40 | 228 | 16: CBC, CBCA, CBD, CBDA, CBDV, CBDVA, CBG, CBGA, CBL, CBN, CBNA, Δ8-THC, Δ9-THC, THCA, THCV, THCVA | [119] |
| 31 | UHPLC-UV | AF 5 mM–0.1% FA | ACN-0.1% FA | 70–98 | Ascenti Express C18 (150 × 2.1 mm, 2 μm) | 0.4 | 8 | 25 | 30 | 228 | 17: CBC, CBCA, CBD, CBDA, CBDV, CBDVA, CBG, CBGA, CBL, CBLA, CBN, CBNA, Δ8-THC, Δ9-THC, THCA, THCV, THCVA | [120] |
| 32 | HPLC-DAD | AF 5 mM–0.1% FA | ACN-0.1% FA | 75–95 | Luna C18(2) (150 × 2 mm, 3 μm) with a guard col | 0.25 | 35 | 5 | RT | 220 | 10: CBC, CBD, CBDA, CBDV, CBG, CBGA, CBN, Δ9-THC, THCA, THCVA | [121] |
| 33 | HPLC-DAD | AF 10 mM (pH 3.6) | ACN-0.1% FA | 70–100 | InfinityLab Poroshell 120 EC-C18, (100 × 2.1 mm, 1.9 μm) | 0.8 | 11 | 1 | 40 | NR | 16: CBC, CBCA, CBD, CBDA, CBDV, CBDVA, CBG, CBGA, CBL, CBLA, CBN, CBNA, Δ9-THC, THCA, THCV, THCVA | [122] |
| 34 | HPLC-DAD | AF 20 mM (pH 3.2) | ACN | 60–95 | XBridge C18 (150 × 4.6 mm, 3.5 μm) | 1 | NR | 25 | 25 | 240 | 3: CBD, CBN, Δ9-THC | [123,124] |
| 35 | HPLC-DAD | AF 20 mM (pH 3.6) | ACN-0.1% FA | NR | InfinityLab Poroshell 120 EC-C18 (150 × 4.6 mm, 2.7 μm) with a guard col | 1 | 15 d | 5 | 40 | 220 | 6: CBD, CBDA, CBN, Δ8-THC, Δ9-THC, THCA | [125,126] |
| 36 | UHPLC-DAD | AF 50 mM, 10% ACN (pH 3.75) | ACN-0.1% FA | 55–90 | Cortecs UPLC Waters C18 (100 × 2.1 mm, 1.6 μm) with a guard col | 0.3 | 10 | 3 | 30 | 270 | 10: CBC, CBD, CBDA, CBDV, CBG, CBGA, CBN, Δ8-THC, Δ9-THC, THCA | [127] |
| 37 | HPLC-UV | 0.085% PA | ACN-0.085% PA | 70–95 | NexLeaf CBX Potency RP C18 (150 × 4.6 mm, 2.7 μm) with a guard col | 1 | 10 | 5 | 35 | 220 | 9: CBC, CBD, CBDA, CBDV, CBG CBGA, CBN, Δ9-THC, THCA | [128] |
| 38 | HPLC-DAD | 0.085% PA | ACN-0.085% PA | 70–95 | NexLeaf CBX for Potency C18 (150 × 4.6 mm, 2.7 μm) with a guard col | 1.6 | 10 | 5 | 40 | 220 | 11: CBC, CBD, CBDA, CBDV, CBG, CBGA, CBN, Δ8-THC, Δ9-THC, THCA, THCV f | [129,130,131] |
| 39 | HPLC-UV | 0.085% PA | ACN-0.085% PA | 70–95 | NexLeaf CBX for Potency C18 (150 × 4.6 mm, 2.7 μm) with a guard col | 1.6 | 10 | NR | 35 | 220 | 5: CBD, CBDA, CBN, Δ9-THC, THCA | [132] |
| 40 | HPLC-MWD | 0.085% PA | ACN-0.085% PA | 75–95 | Phenomenex Kinetex XB-C18 (250 × 4.6 mm × 5 μm) with a guard col | 1.6 | 25 | NR | 35 | 220 | 11: CBC, CBD, CBDA, CBDV, CBG, CBGA, CBN, Δ8-THC, Δ9-THC, THCA, THCV | [133] |
| 41 | HPLC-DAD | 0.1% PA | ACN-0.1% PA | 55–60 | Restek Raptor C18 (150 × 4.6 mm, 2.7 μm) | 1.5 | 27 | 5 | 45 | 220 | 8: CBD, CBDV, CBG, CBN, Δ8-THC, Δ9-THC, THCA | [134] |
| 42 | HPLC-DAD | 0.1% PA | ACN-0.1% PA | 60–100 | InfinityLab Poroshell 120 EC-C18 (50 × 3.0 mm, 2.7 μm) | NR | 19 | 1 | NR | 208, 220, 230, and 240 | 26: CBC, CBCO, CBCV, CBCVA, CBD, CBDA, CBDA-ME, CBDP, CBDV, CBE, CBG, CBGA, CBGQA, CBGV, CBGVA, CBL, CBN, CBT, Δ8-THC, Δ9-THC, THCA, THCB, THCH, THCP, THCV, THCVA | [135] |
| 43 | HPLC-DAD | PA 8.64 g/L | ACN | 64–82 | InfinityLab Poroshell 120 EC-C18 (150 × 3 mm, 2.7 μm) | 0.7 | 30 | 10 | 40 | 225: NC 306: AC | 5: CBD, CBDA, CBN, Δ9-THC, THCA | [136,137] |
| 44 | HPLC-DAD | PA 8.6 g/L | ACN | 64–82 | Purospher RP-18 (250 × 4.6 mm, 5 μm) with a guard col | 1 | 25 | 10 | 40 | 225, 306 | 3: CBD, CBN, Δ9-THC f | [138,139] |
| 45 | UHPLC-DAD | PA 85% (pH 2.2) | ACN | 68–90 | Raptor ARC-18 (150 × 2.1 mm, 2.7 μm) | 0.4 | 13 | 1 | 25 | 228: NC 306: AC | 8: CBC, CBD, CBDA, CBDV, CBG, CBGA, Δ9-THC, THCA | [140] |
| 46 | HPLC-DAD | 0.05% AcOH (pH 4.40) | ACN | 56–75 | Phenomenex Kinetex C18 (150 × 4.6 mm, 2.6 μm) with a guard col | 0.8 | 35 | 5 | 25 | 220 | 12: CBC, CBD, CBDA, CBDV, CBDVA, CBG, CBGA, CBN, Δ8-THC, Δ9-THC, THCA, THCV | [141] |
| 47 | UHPLC-TUV | 0.1% AcOH | ACN | 53–95 | Cortecs RP C18 (150 × 2.1 mm, 1.6 μm) | 0.4 | 35 | 2 | 40 | 230 | 3: CBD, CBN, Δ9-THC | [142] |
| 48 | HPLC-DAD | 0.1% FA | MeOH | 60–90 | Phenomenex Kinetex C18 (100 mm × 2.1 mm, 5.0 μm) | 0.5 | 7 | 5 | 14 | 220 | 6: CBD, CBDA, CBN, Δ8-THC, Δ9-THC, THCA | [143] |
| 49 | HPLC-DAD | 0.1% FA | MeOH-0.05% FA | 60–95 | Dr Maisch ReproSil XR 120 (50 × 3.5 mm, 3 μm) | 1 | 10 | 1 | 40 | 228 | 7: CBC, CBD, CBDA, CBG, CBN, Δ9-THC, THCA | [144] |
| 50 | HPLC-DAD | 0.1% FA | MeOH-0.05% FA | 60–95 | InfinityLab Poroshell 120 EC-C18 (150 × 4.6 mm, 4 μm) | 1 | 77 | 35 | 50 | 210, 230 | 11: CBC, CBCA, CBD, CBDA, CBDVA, CBG, CBGA, CBN, Δ9-THC, THCA, THCVA | [145] |
| 51 | HPLC-VWD | 0.1% FA | MeOH-0.05% FA | 60–95 | InfinityLab Poroshell 120 EC-C18, (50 × 3 mm, 2.7 μm) | 1 | 11 | 5 | 50 | 230 | 5: CBD, CBDA, CBN, Δ9-THC, THCA | [146] |
| 52 | HPLC-DAD | 0.1% FA | MeOH-0.05% FA | 60–100 | InfinityLab Poroshell 120 EC-C18 (50 × 3.0 mm, 2.7 μm) | NR | 12.5 | 5 | NR | 220 | 3: CBD, CBN, Δ9-THC | [147] |
| 53 | HPLC-VWD | 0.1% FA | MeOH-0.05% FA | 75–95 | InfinityLab Poroshell 120 EC-C18, (150 × 4.6 mm) | 1 | 12.5 | 5 | 50 | 230 | 3: CBD, CBN, Δ9-THC | [148] |
| 54 | HPLC-DAD | 0.1% FA | MeOH-0.1% FA | 62–80 | Accucore aQ C18 Polar Endcapped (100 × 2.1 mm, 2.6 μm) | 0.45 | 27 | 2 | 50 | 228 | 13: CBC, CBCA, CBD, CBDA, CBDV, CBDVA, CBG, CBGA, CBN, Δ9-THC, THCA, THCV, THCVA | [149] |
| 55 | HPLC-UV | 0.1% FA | MeOH | 67–95 | Accucore aQ C18 Polar Endcapped (100 × 2.1 mm, 2.6 μm) | 0.45 | 23 | NR | NR | 210 | 7: CBD, CBDA, CBG, CBGA, CBN, Δ9-THC, THCA | [150] |
| 56 | HPLC-DAD | 50 mM AF (pH 5.19) | MeOH | 68–95 | C-18 (250 × 4.6 mm, 5.0 μm) | 1 | 30 | NR | 30 | 240 | 5: CBD, CBDA, CBN, Δ9-THC, THCA | [151] |
| 57 | UHPLC-DAD | 0.07% PA | MeOH-0.07% PA | 65–95 | Shim-pack XR-ODSII C18 (2.2 μm) | 1 | 45 | 10 | 50 | NR | 11: CBC, CBD, CBDA, CBDV, CBG, CBGA, CBN, Δ8-THC, Δ9-THC, THCA, THCV | [152,153] |
| 58 | HPLC-DAD | 10 mM AA (pH 5.2) | MeOH | 72–92 | Phenomenex Kinetex C18 (100 × 4.6 mm, 2.6 μm) | 0.7 | 28 | 10 | 30 | 220 | 8: CBD, CBDA, CBG, CBGA, CBN, Δ8-THC, Δ9-THC, THCA | [154] |
| 59 | HPLC-DAD | 25 mM AA | MeOH | 75–95 | Thermo Hypersil BDS C18 (150 × 4.6 mm, 5 μm) | 1 | 25 | NR | NR | 205 | 5: CBD, CBDA, CBN, Δ9-THC, THCA | [155] |
| 60 | HPLC-DAD | 0.1%TFA | MeOH-0.1% TFA | 79–100 | Waters Cortecs C18 (150 × 4.6 mm, 2.7 μm | 0.7 | 21 d | NR | 54 | 226 | 14: CBC, CBCA, CBD, CBDA, CBDV, CBDVA, CBG, CBGA, CBN, Δ8-THC, Δ9-THC, THCA, THCV, THCVA | [156] |
| 61 | HPLC-DAD | 0.015% FA | MeOH:ACN (75:25) | 74.5–80.5 b | Restek Raptor ARC-18 (150 × 2.1 mm, 2.7 μ) with a guard col | 0.3, 0.5 c | 32 | 3 | 30 | 230: 8 NC; 262: CBCA, CBNA; 271: 6 AC; 284: CBC, CBN | 18: CBC, CBCA, CBD, CBDA, CBDV, CBDVA, CBG, CBGA, CBL, CBLA, CBN, CBNA, CBT, Δ8-THC, Δ9-THC, THCA, THCV, THCVA f | [157] |
| 62 | HPLC-DAD | 0.1% FA | B: ACN-0.1% FA, C: MeOH a | 55%B,0%C–0%B,100%C | 3 columns: Shim-Pak C18 (75 × 3 mm, 2.2 μm), and 2 Phenomenex Synergy C18 (100 × 3 mm, 2.5 μm) with a guard col | 0.3–0.41 c | 88 | 5–30 | 40 | absorbance maxima of the analyzed CBs e | 17: CBC, CBCA, CBD, CBDA, CBDV, CBDVA, CBG, CBGA, CBL, CBLA, CBN, CBNA, Δ8-THC, Δ9-THC, THCA, THCV, THCVA | [158] |
| 63 | HPLC-DAD | 0.1% FA | B: ACN-0.1% FA, C: MeOH a | 70%B,0%C– 0%B,100%C | Agilent XDB (250 × 4.6 mm, 5.0 μm) | NR | 33 d | NR | NR | 200–400 | 8: CBC, CBD, CBDA, CBG, CBGA, CBN, Δ9-THC, THCA | [159] |
| 64 | HPLC-DAD | 0.1% PA | B: ACN C: MeOH a | 38%B,33%C–53%B,47%C | Phenomenex C18 (150 × 4.6 mm, 5 μm) | 1.2 | 26.5 | 10 | 30 | 220 | 6: CBD, CBDA, CBN, CBNA, Δ9-THC, THCA | [160,161] |
| 65 | HPLC-DAD | AF 20 mM 0.1% FA | B: ACN, C: MeOH 10 mM AF, 0.05% FA a | 50%B,0%C–45%B,45%C | Phenomenex Luna C18(2) (150 × 4.6 mm, 5 μm) with a guard col | 2.5 | 34 | 10 | 40 | 232 | 10: CBC, CBD, CBDA, CBDV, CBG, CBGA, CBN, Δ8-THC, Δ9-THC, THCA | [162] |
| Entry | Method a | Mobile Phase b | Column | Flow Rate (mL/min) c | Run Time (min) d | Injection Vol. (µL) | Temp. (°C) e | UV Detection (nm) f | Cannabinoids Analyzed g | Ref. | ||
|---|---|---|---|---|---|---|---|---|---|---|---|---|
| Aqueous Phase (A) | Organic Phase (B) | Ratio A:B | ||||||||||
| 66 | HPLC-DAD | ACN | 20:80 | Chromolith RP18 (150 × 4.6 mm, 5 μm) | 1 | 45 | NR | RT | 254 | 5: CBD, CBDV, CBN, Δ9-THC, THCV | [163] | |
| 67 | HPLC-DAD | ACN | 20:80 | Kinetex C18 (150 × 4.6 mm, 5 μm) | 1 | 9 | 25 | 35 | 210 | 4: CBD, CBN, Δ9-THC, THCA | [164] | |
| 68 | HPLC-UV | ACN | 20:80 | Kromasil C8 (150 × 4.6 mm, 5 μm) | 1 | 15 | 20 | NR | 272 | 3: CBN, Δ9-THC, THCA | [165] | |
| 69 | HPLC-DAD | ACN | 50:50 | C18 (250 × 4.6 mm, 5 μm) | 1 | 40 | 20 | NR | 228 | 5: CBC, CBD, CBG, CBN, Δ9-THC | [166,167] | |
| 70 | UHPLC-DAD | 0.028% FA (pH 3.6) | ACN | 27:73 | Luna Omega Polar C18 (150 × 2.1 mm, 1.6 μm) with a guard col | 0.3 | 15 | 3 | 30 | 223, 230, 251, 269, 285 f | 15: CBC, CBCA, CBD, CBDA, CBDV, CBDVA, CBG, CBGA, CBLA, CBN, Δ8-THC, Δ9-THC, THCA, THCV, THCVA | [168] |
| 71 | HPLC-UV | 0.1% FA | ACN | 16:84 | Zobax Eclipse Plus C18 | NR | 26 | 5 | NR | 280 | 12: CBC, CBD, CBDA, CBDV, CBG, CBGA, CBL, CBN, Δ8-THC, Δ9-THC, THCA, THCV | [169] |
| 72 | HPLC-VWD | 0.1% FA | ACN | 20:80 | Zorbax Eclipse XDB C18 (250 × 3 mm, 5 μm) | 0.5 | 25 | NR | 30 | 220 | 4: CBD, CBDA, Δ9-THC, THCA | [170] |
| 73 | HPLC-DAD | 0.1% FA | ACN | 25:75 | Mightysil RP-8GP (150 × 2 mm, 5 μm) | 0.2 | 16 | 5 | 40 | 210: CBD, Δ9-THC 284: CBDA, CBN, THCA | 5: CBD, CBDA, CBN, Δ9-THC, THCA | [171] |
| 74 | HPLC-DAD | 0.1% FA | ACN | 25:75 | Phenomenex Kinetex C18 (150 × 2.1 mm, 2.6 μm) with guard col | 0.5 | 30 | 10 | 20 | 230 | 6: CBD, CBDA, CBN, Δ8-THC, Δ9-THC, THCA | [172] |
| 75 | UHPLC-DAD | 0.1% FA | ACN | 41:59 | Cortecs UPLC Shield RP18 (100 × 2.1 mm, 1.6 μm) | 0.5 | 13 | 2 | 35 | 269 | 4: CBD, CBDA, Δ9-THC, THCA | [173] |
| 76 | UHPLC-DAD | 0.1% FA | ACN | 48:52 | Cortecs UPLC Shield RP18 (100 × 2.1 mm, 1.6 μm) | 0.7 | 18 | 5 | 35 | 228 | 4: CBD, CBDA, Δ9-THC, THCA | [174,175] |
| 77 | UHPLC-DAD | 0.1% FA | ACN | 49–51 | Hypersyl Gold RP (150 × 2.1 mm, 1.9 μm) | 0.45 | 25 | 5 | 35 | 280 | 5: CBD, CBDA, CBN, Δ9-THC, THCA | [176] |
| 78 | HPLC-DAD | 0.1% FA | ACN-0.1% FA | 17.5:82.5 | two HALO C18 (100 × 4.6 mm, 2.7 μm) (200 mm total length) | 1 | 12 | 20 | NR | 222: CBN 230: CBC 210: other 4 NC | 6: CBC, CBD, CBG, CBN, Δ8-THC, Δ9-THC | [177] |
| 79 | HPLC-DAD | 0.1% FA | ACN-0.1% FA | 23:77 | Phenomenex Luna C18(2) (150 × 4.6 mm, 3 μm) | 1.2 | 20 | 10 | NR | 220 | 4: CBD, CBDA, Δ9-THC, THCA | [178] |
| 80 | HPLC-DAD | 0.1% FA | ACN-0.1% FA | 25:75 | InfinityLab Poroshell 120 EC-18 (150 × 3.0 mm, 2.7 μm) | 0.6 | 12 | 10 | 30 | 228 | 12: CBC, CBD, CBDA, CBDV, CBG, CBGA, CBL, CBN, Δ8-THC, Δ9-THC, THCA, THCV | [179] |
| 81 | HPLC-DAD | 0.1% FA | ACN-0.1% FA | 25:75 | Phenomenex Luna C18(2) (250 × 4.6 mm, 3 μm) with a guard col | 1, 1.2 c | 30 | 10 | 40 | 220 | 15: CBC, CBCA, CBD, CBDA, CBDV, CBDVA, CBG, CBGA, CBL, CBN, Δ8-THC, Δ9-THC, THCA, THCV, THCVA | [180] |
| 82 | HPLC-UV | 0.1% FA | ACN-0.1% FA | 30:70 | Phenomenex Aeris peptide XB-C18 (250 × 2.1 mm, 2.6 μm) | 0.35 | 20 | 10 | 35 | 235 | 5: CBD, CBDA, CBN, Δ9-THC, THCA | [181] |
| 83 | UHPLC-DAD | 5 mM FA | ACN | 42:58 | Zorbax Eclipse Plus C18 (100 × 2.1 mm, 1.8 μm) | 0.5 | 25 | 8 | NR | 215 | 5: CBD, Δ(4)8-iso-THC Δ8-iso-THC, Δ8-THC, Δ9-THC | [216] |
| 84 | HPLC-DAD | AF 0.5 mM 0.02% FA (pH 3.0) | ACN | 25:75 | Raptor ARC-18 (150 × 2.1 mm, 2.7 μm) with a guard col | 0.4 | 20 | 4 | 30 | 223, 230, 251, 261, 269, 285 f | 20: CBC, CBCA, CBCV, CBD, CBDA, CBDV, CBDVA, CBG, CBGA, CBL, CBLA, CBN, CBNA, CBT, Δ8-THC, Δ9-THC, Δ8-THCA, THCA, THCV, THCVA | [182] |
| 85 | HPLC-VWD | AF 0.5 mM– 0.1% FA | ACN- AF 0.5 mM 0.1% FA | 25:75 | Restek Raptor ARC18 (150 × 4.6 mm, 2.7 μm) | 1.5 | 9 | NR | NR | 220 | 16: CBC, CBCA, CBD, CBDA, CBDV CBDVA, CBG, CBGA, CBL CBN, CBNA, Δ8-THC, Δ9-THC THCA, THCV, THCVA | [183] |
| 86 | HPLC-DAD | AF 2 mM– 0.011% FA (pH 3.6) | ACN | 27:73 | Luna Omega Polar C18 (150 × 2.1 mm, 1.6 μm) with guard col | 0.3 | 18 | 3 | 30 | 223, 230, 251, 269, 285 f | 15: CBC, CBCA, CBD, CBDA, CBDV, CBDVA, CBG, CBGA, CBLA, CBN, Δ8-THC, Δ9-THC, THCA, THCV, THCVA | [184] |
| 87 | HPLC-UV | AF 5 mM–0.1% FA | ACN-0.1% FA | 20:80 | ES Industries Harmony Secure RP18 (150 × 4.6 mm, 3.5 μm) with a guard col | 1 | 10 | 20 | 40 | 210, 228 | 3: CBD, CBN, Δ9-THC | [185] |
| 88 | HPLC-UV | AF 5 mM–0.1% FA | ACN-0.1% FA | 20:80 | Harmony Secure RP18 (150 × 4.6 mm, 3.5 μm) | 1 | 15 | 50 | 40 | 210: CBD, Δ9-THC, CBN 228: THCA, CBDA | 5: CBD, CBDA, CBN, Δ9-THC, THCA | [186] |
| 89 | HPLC-UV | AF 5 mM–0.1% FA | ACN-0.1% FA | 20:80 | Shimadzu Nexcol C18 (50 × 3.0 mm, 5 μm) | 0.3 | 8 | 5 | 40 | 228 | 3: CBD, CBN, Δ9-THC | [185] |
| 90 | UHPLC-DAD | AF 5 mM–0.1% FA | ACN-0.1% FA | 25:75 | Raptor ARC-18 (100 × 3.0 mm, 1.8 μm) with a guard col | 1 | 6 | 2 | 40 | 228 | 15: CBC, CBCA, CBD, CBDA, CBDV, CBDVA, CBG, CBGA, CBL, CBN, Δ8-THC, Δ9-THC, THCA, THCV, THCVA | [187] |
| 91 | HPLC-DAD | AF 10 mM–0.1% FA | ACN-0.1% FA | 30:70 | Inertsil ODS-HL (150 × 2.1 mm, 3 μm) | 0.3 | 35 | NR | 40 | 220 | 13: CBC, CBD, CBDA, CBDV CBG, CBGA, CBL, CBN, Δ8-THC, Δ9-THC, THCA, THCV, THCVA | [188] |
| 92 | HPLC-DAD | AF 20 mM (pH 3.6) | ACN | 25:75 | Phenomenex Kinetex C18 (150 × 4.6 mm, 2.6 μm) with a guard col | 0.8 | 15 | 5 | 40 | 220 | 10: CBC, CBD, CBDA, CBG, CBGA, CBN, Δ8-THC, Δ9-THC, THCA, THCV | [189,190,191,192] |
| 93 | HPLC-DAD | AF 20 mM–FA (pH 2.9) | ACN-0.1% FA | 30:70 | Phenomenex Kinetex XB-C18 (150 × 2.1 mm, 1.7 μm) | 0.3 | 16 | 2 | NR | 228 | 16: CBC, CBCA, CBD, CBDA, CBDVA, CBG, CBGA, CBL, CBN, CBNA, Δ8-THC, Δ9-THC, THCA, THCA-C4, THCV, THCVA | [193,194,195,196,197,198,199] |
| 94 | HPLC-DAD | AF 0.1 M– 0.1% FA | ACN-AF 0.1 M, 0.1% FA | 22.5:77.5 | Phenomenex Luna C18 (2) (250 × 3 mm, 3 μm) | 0.55 | 21 | 8 | 37 | 275 | 17: CBC, CBCA, CBD, CBDA, CBDV, CBDVA, CBG, CBGA, CBL, CBLA, CBN, CBNA, Δ8-THC, Δ9-THC, THCA, THCV, THCVA | [200,201,202] |
| 95 | HPLC-UV | formate buffer | ACN | 20:80 | CTInstruments C18, (150 × 4.6 mm, 5 μm) | 1.2 | 13.2 | 70 | 30 | 220 | 4: CBDA, CBD, Δ9-THC, THCA | [203] |
| 96 | HPLC-DAD | 0.1% TFA | ACN | 25:75 | Cortecs C18 (150 × 4.6 mm, 2.7 μm) | 1 | 15 | NR | NR | 228 | 8: CBC, CBD, CBDA, CBDV, CBDVA, CBL, Δ9-THC, THCA | [204] |
| 97 | UHPLC-DAD | 0.1% TFA | ACN | 41:59 | Cortecs Shield RP18 (150 × 4.6 mm, 2.7 μm) | 2 | 50 | 10 | 35 | 228 | 8: CBC, CBD, CBDA, CBG, CBGA, CBN, Δ9-THC, THCA | [205,206,207] |
| 98 | HPLC-DAD | 0.1% TFA | ACN | 41:59 | Cortecs Shield RP18 (150 × 4.6 mm, 2.7 μm) | 1 | 50 | 20 | 35 | 228 | 9: CBCA, CBD, CBDA, CBG, CBGA, CBN, Δ8-THC, Δ9-THC THCA | [208] |
| 99 | HPLC-DAD | 0.1% TFA | ACN | 41:59 | Reliant C18 (250 × 4.6 mm, 5 μm) | 1 | 20 | 20 | 35 | 235 | 10: CBC, CBD, CBDA, CBDV, CBG, CBN, Δ8-THC, Δ9-THC, THCA THCV | [209] |
| 100 | HPLC-VWD | MeOH | 13:87 | MultoHigh 100 RP18 (125 × 4.6 mm, 3 μm) | 0.2 | 40 | 10 | 35 | 212 | 3: CBD, CBDV, CBN | [210] | |
| 101 | HPLC-UV | MeOH | 17:83 | ACE 3 C18-PFP (150 × 3.0 mm, 3 μm) with guard col | 0.4 | 20 | 5 | 25 | 222 | 3: CBD, CBN, Δ9-THC g | [211,212] | |
| 102 | HPLC-DAD | 0.1% TFA | MeOH | 15:85 | Raptor ARC-18 (150 × 2.1 mm, 2.7 μm) with guard col | 0.3 | 10 | 3 | 30 | 230, 269 f | 18: CBC, CBCA, CBD, CBDA, CBDV, CBDVA, CBG, CBGA, CBL, CBLA, CBN, CBNA, CBT, Δ8-THC, Δ9-THC, THCA, THCV, THCVA | [213] |
| 103 | HPLC-DAD | AcOH 0.25% | ACN:MeOH (15:1) | 20:80 | Phenomenex Luna C18(2) (150 × 4.6 mm, 5.0 μm) | 1 | 30 | 10 | 30 or 35 e | 228 | 7: CBD, CBDA, CBN, Δ8-THC, Δ9-THC, THCA, THCV | [214,215] |
| 104 | HPLC-DAD | 1% ACN in hexane | NA | Nucleosil Ag(I) phase (100 × 4.6 mm, 3 μm) | 1 | 40 | 5 | NR | 215 | 5: CBD, Δ(4)8-iso-THC Δ8-iso-THC, Δ8-THC, Δ9-THC | [216] | |
Disclaimer/Publisher’s Note: The statements, opinions and data contained in all publications are solely those of the individual author(s) and contributor(s) and not of MDPI and/or the editor(s). MDPI and/or the editor(s) disclaim responsibility for any injury to people or property resulting from any ideas, methods, instructions or products referred to in the content. |
© 2025 by the authors. Licensee MDPI, Basel, Switzerland. This article is an open access article distributed under the terms and conditions of the Creative Commons Attribution (CC BY) license (https://creativecommons.org/licenses/by/4.0/).
Share and Cite
Silva, E.M.P.; Vitiello, A.; Miro, A.; Ribeiro, C.J.A. Recent HPLC-UV Approaches for Cannabinoid Analysis: From Extraction to Method Validation and Quantification Compliance. Pharmaceuticals 2025, 18, 786. https://doi.org/10.3390/ph18060786
Silva EMP, Vitiello A, Miro A, Ribeiro CJA. Recent HPLC-UV Approaches for Cannabinoid Analysis: From Extraction to Method Validation and Quantification Compliance. Pharmaceuticals. 2025; 18(6):786. https://doi.org/10.3390/ph18060786
Chicago/Turabian StyleSilva, Eduarda M. P., Antonella Vitiello, Agnese Miro, and Carlos J. A. Ribeiro. 2025. "Recent HPLC-UV Approaches for Cannabinoid Analysis: From Extraction to Method Validation and Quantification Compliance" Pharmaceuticals 18, no. 6: 786. https://doi.org/10.3390/ph18060786
APA StyleSilva, E. M. P., Vitiello, A., Miro, A., & Ribeiro, C. J. A. (2025). Recent HPLC-UV Approaches for Cannabinoid Analysis: From Extraction to Method Validation and Quantification Compliance. Pharmaceuticals, 18(6), 786. https://doi.org/10.3390/ph18060786