
Citicoline and Coenzyme Q10: Therapeutic Agents for Glial Activation Reduction in Ocular Hypertension

 , , ,
, , ,  ,
,  ,
,  ,
,  ,
,  ,
,  ,
,  ,
,  , and
, and 
Abstract
:
1. Introduction
2. Results
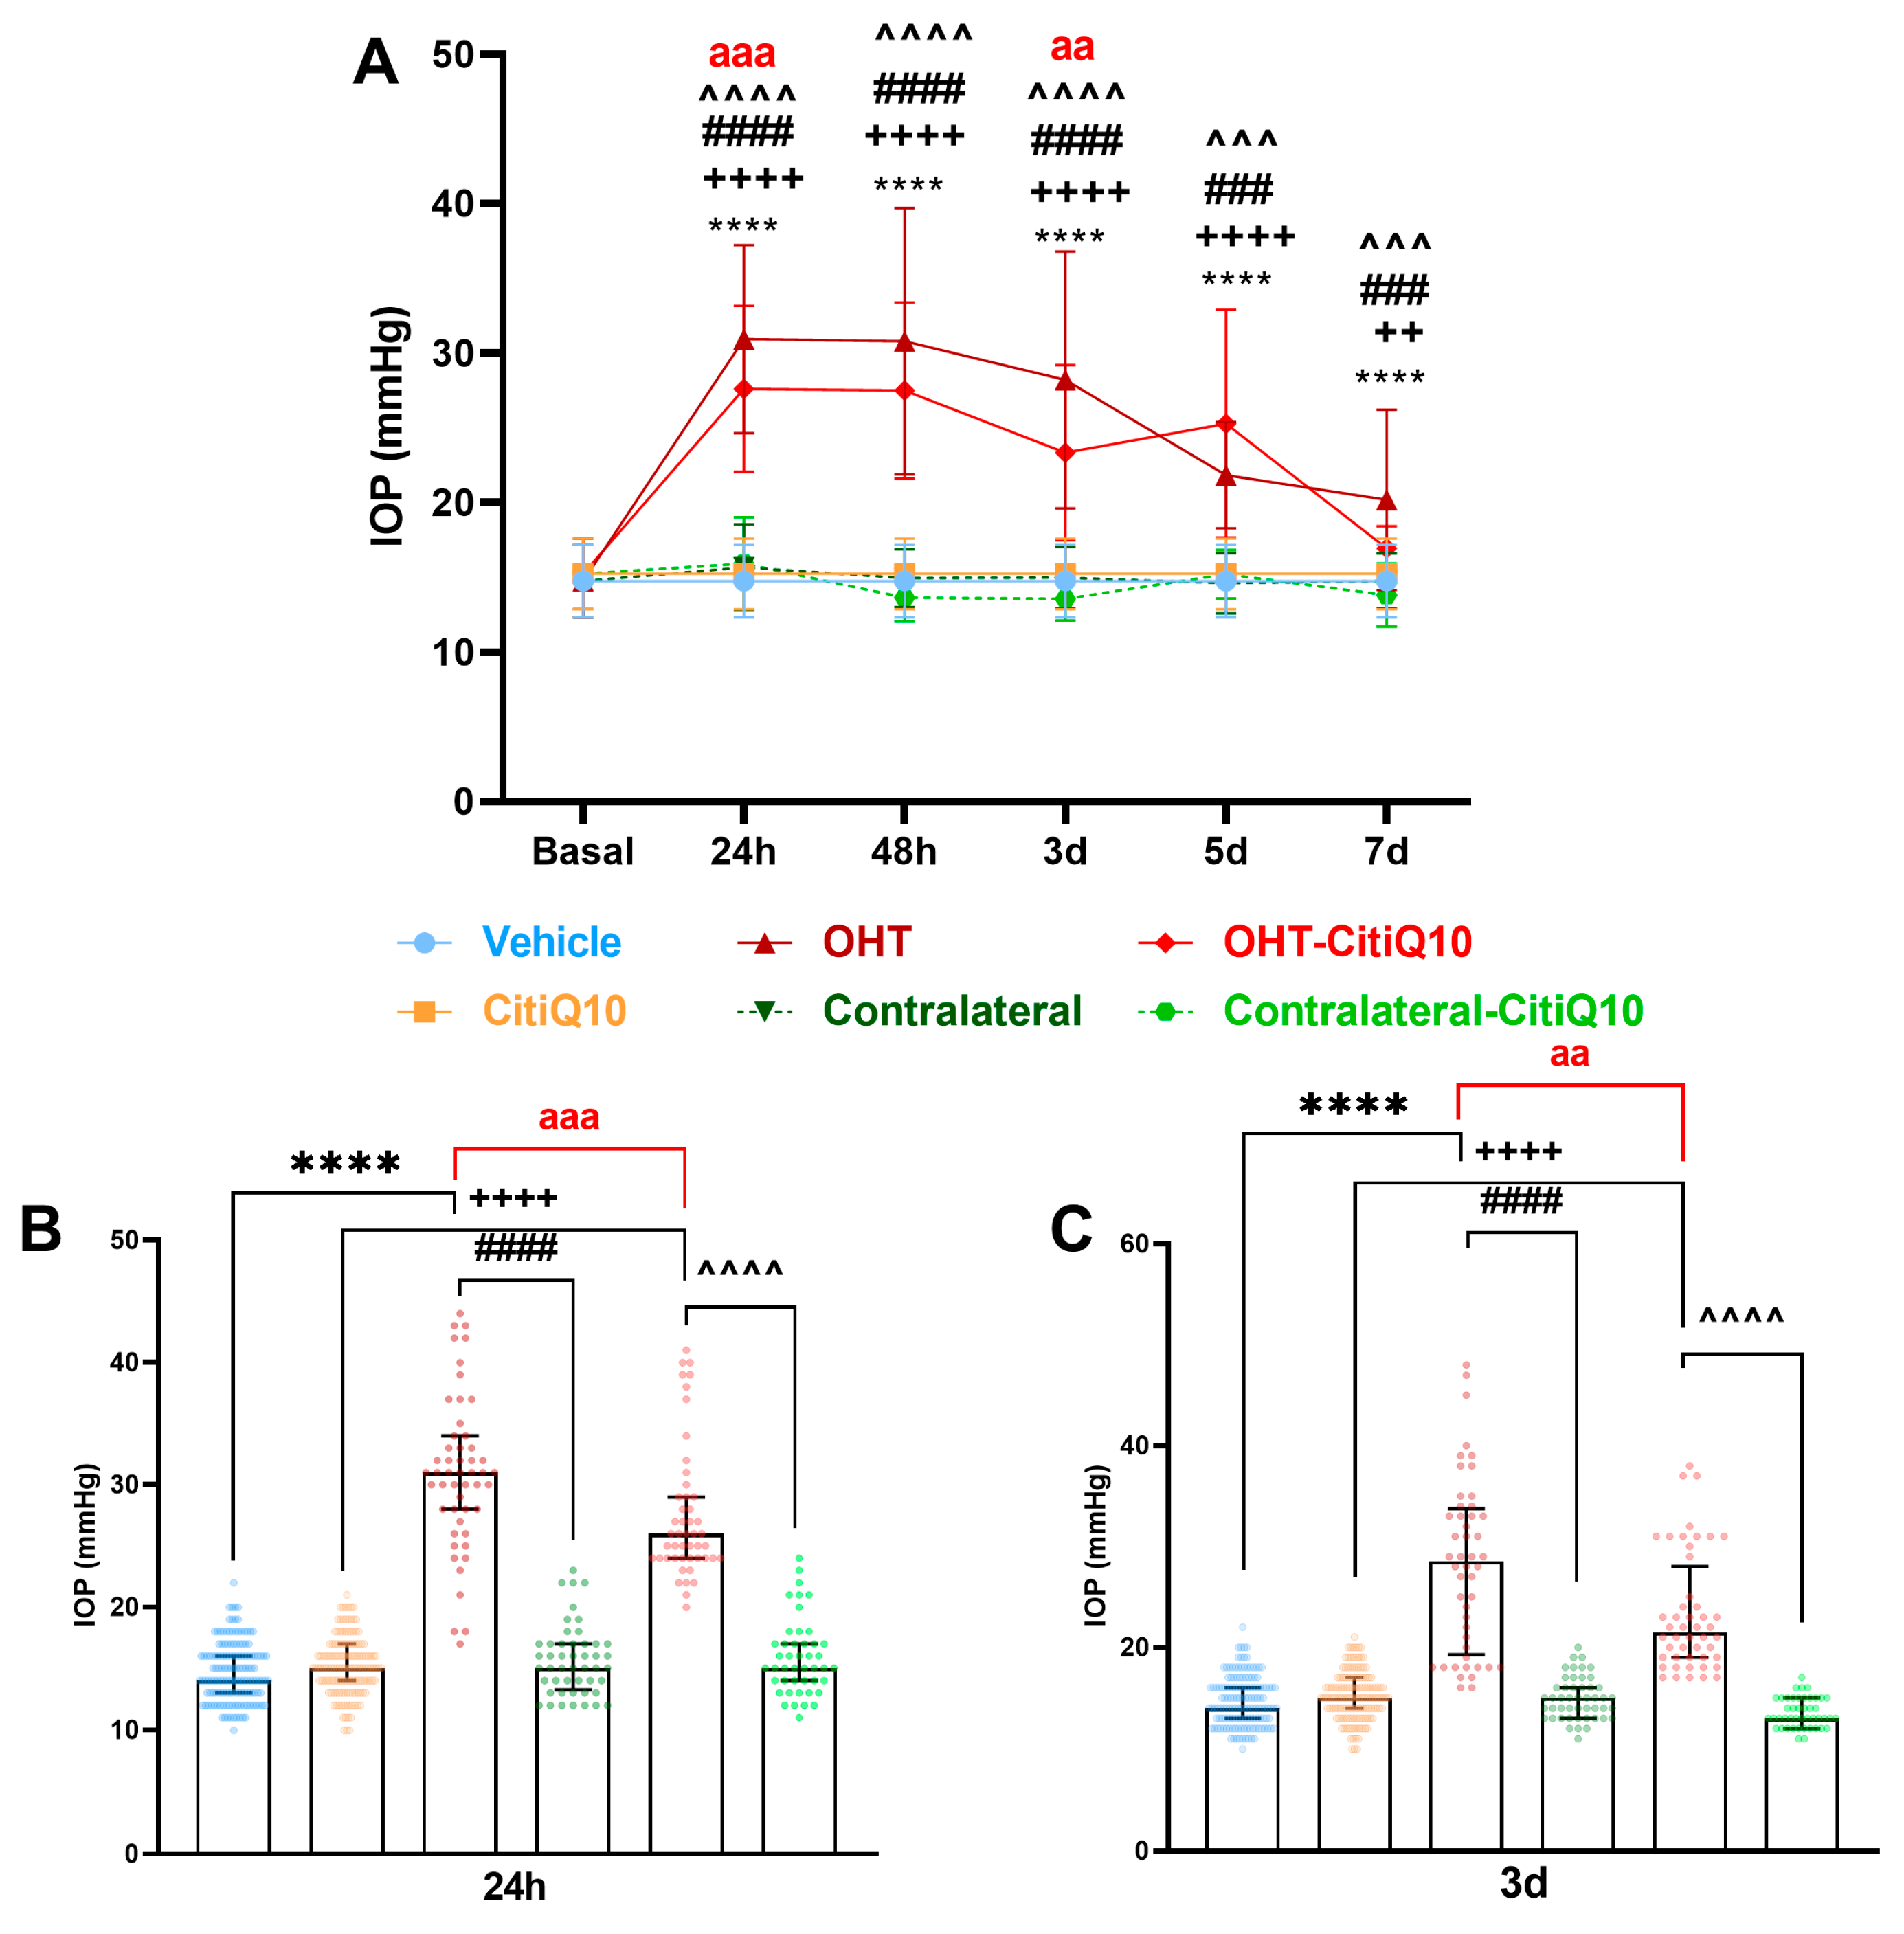
2.1. Intraocular Pressure: Citicoline + CoQ10 Exerts a Mild Hypotensive Effect in Early Stages Following Ocular Hypertension Induction
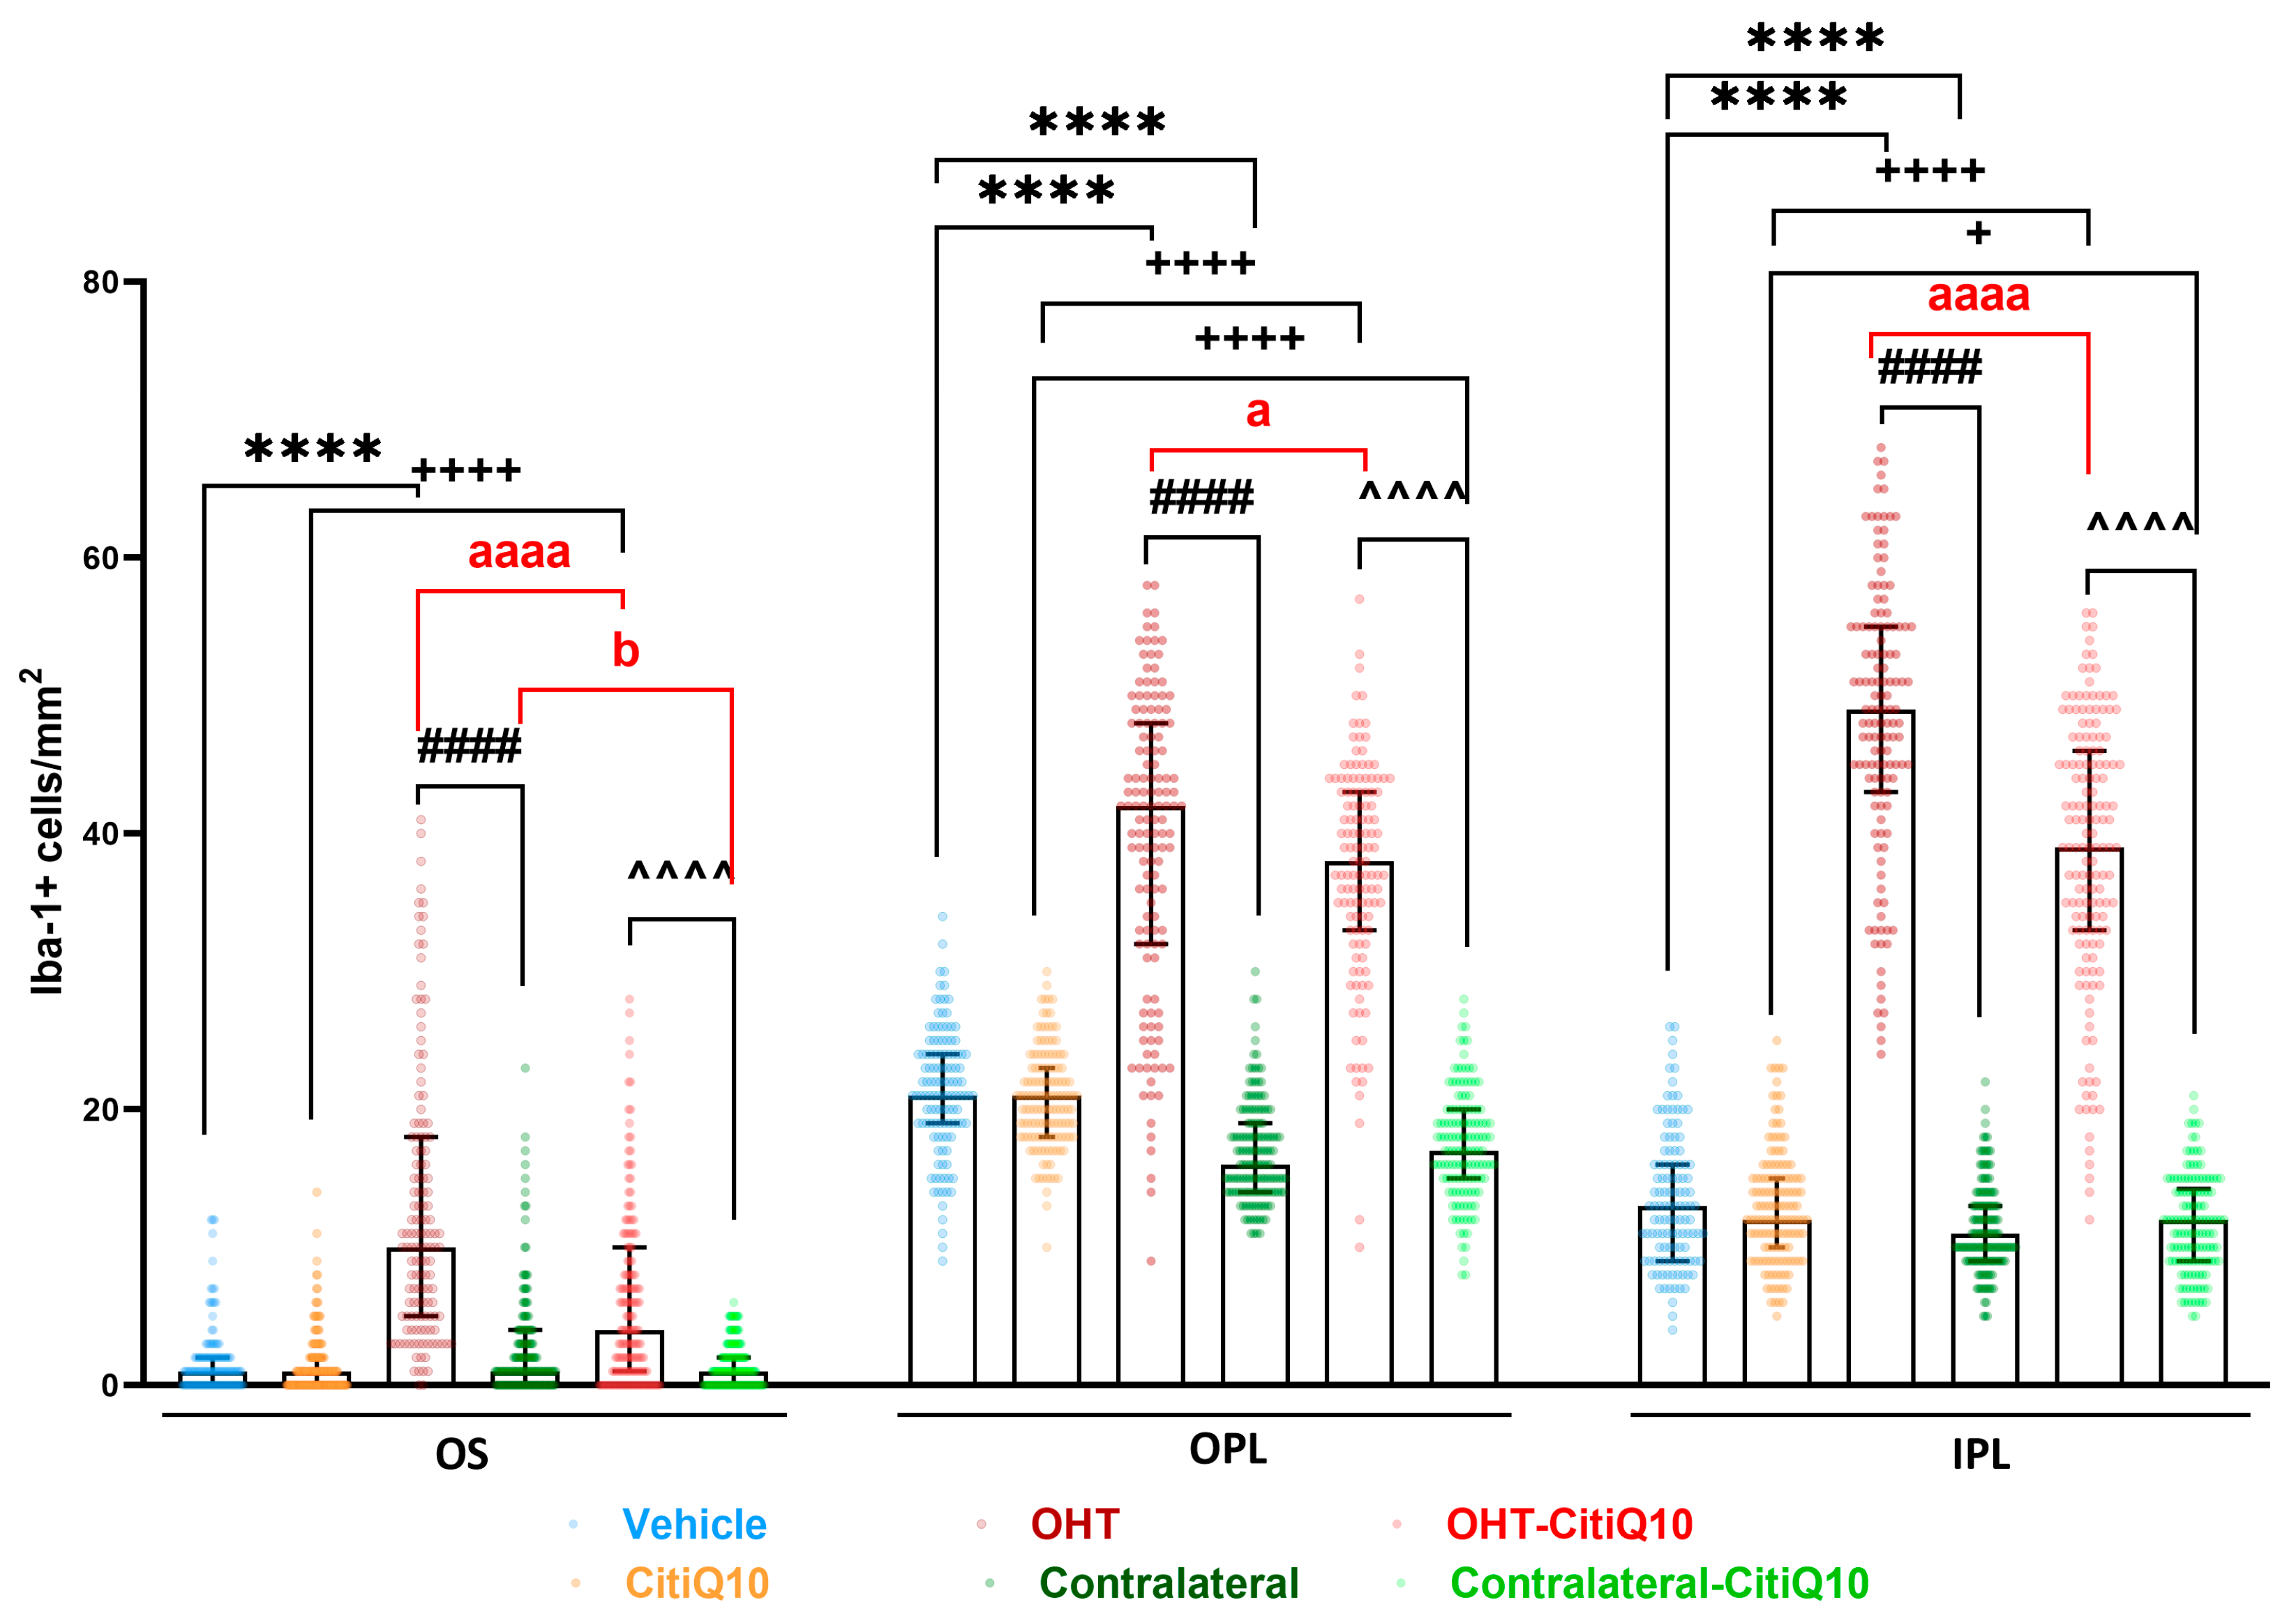
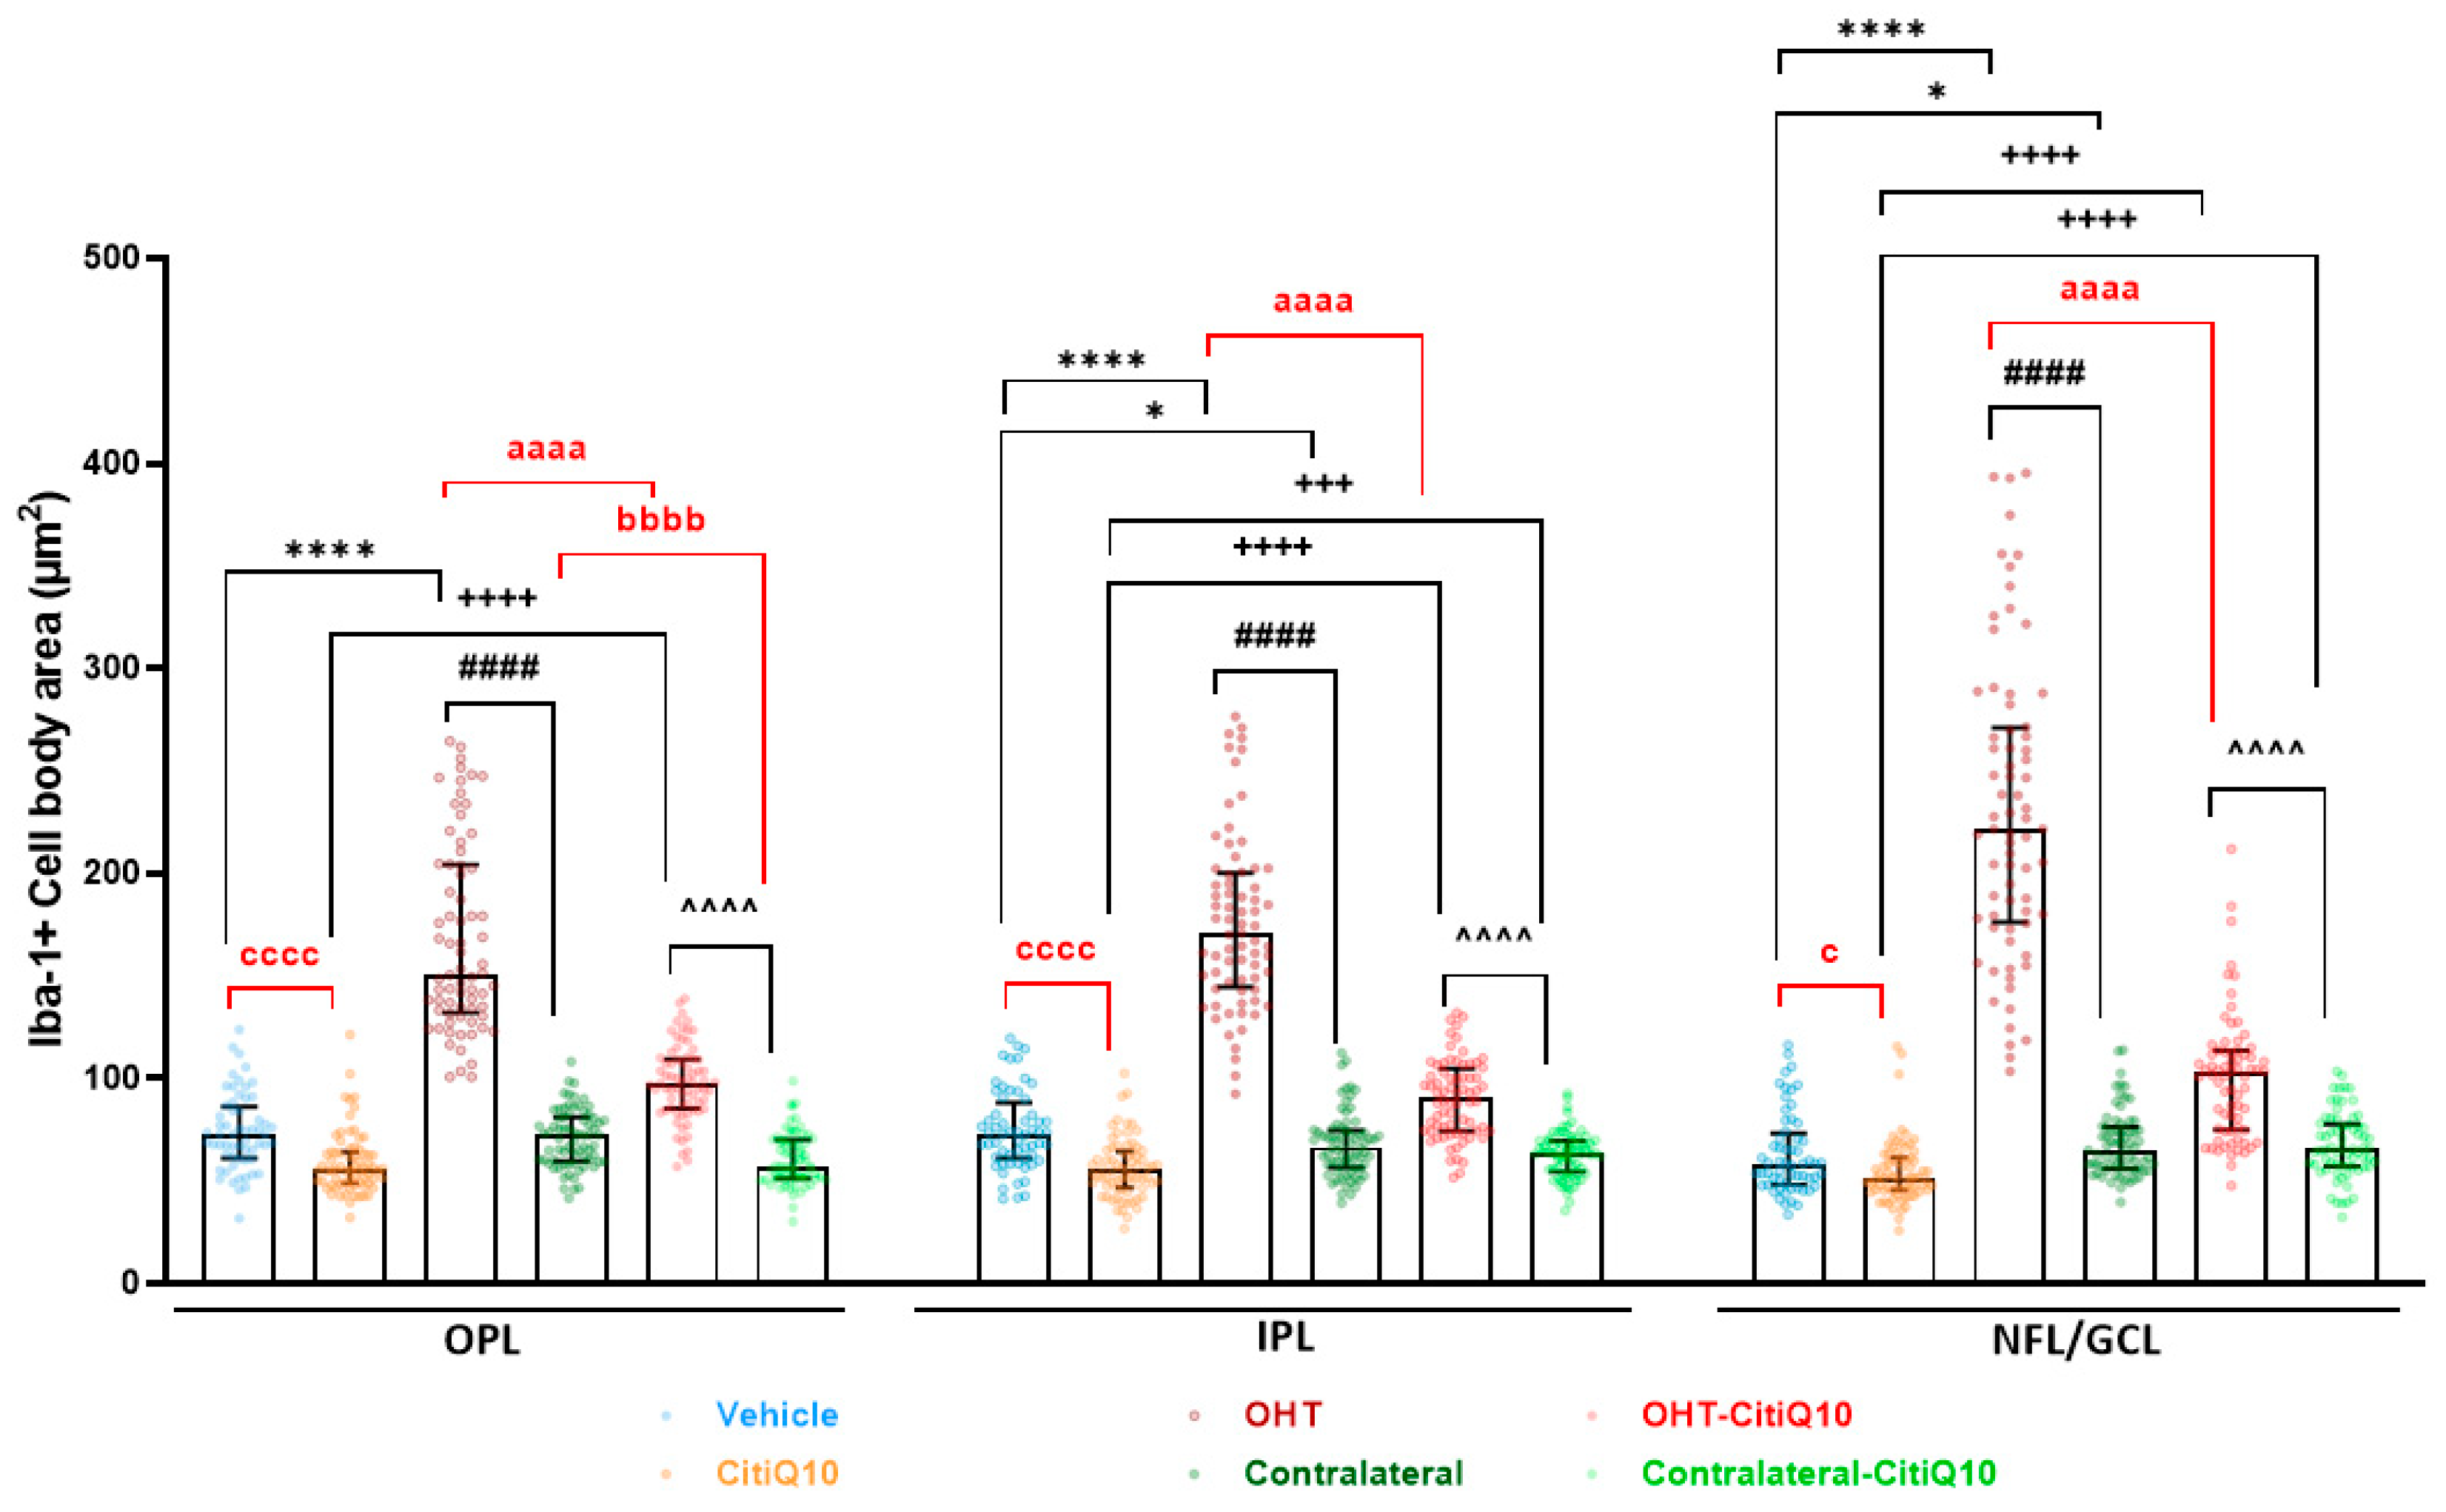
2.2. Retinal Glial Cells: The Combination of Citicoline and CoQ10 Reduces the Signs of Glial Activation Produced by Laser-Induced OHT
2.2.1. Morphological Signs of Microglial Activation
Microglial Cell Number
Area of the Retina Occupied by Iba-1 + Cells (Iba1-RA) in the NFL-GCL
Arbor Area
Cell Body Area
Number of Vertical Processes Connecting the OPL and OS
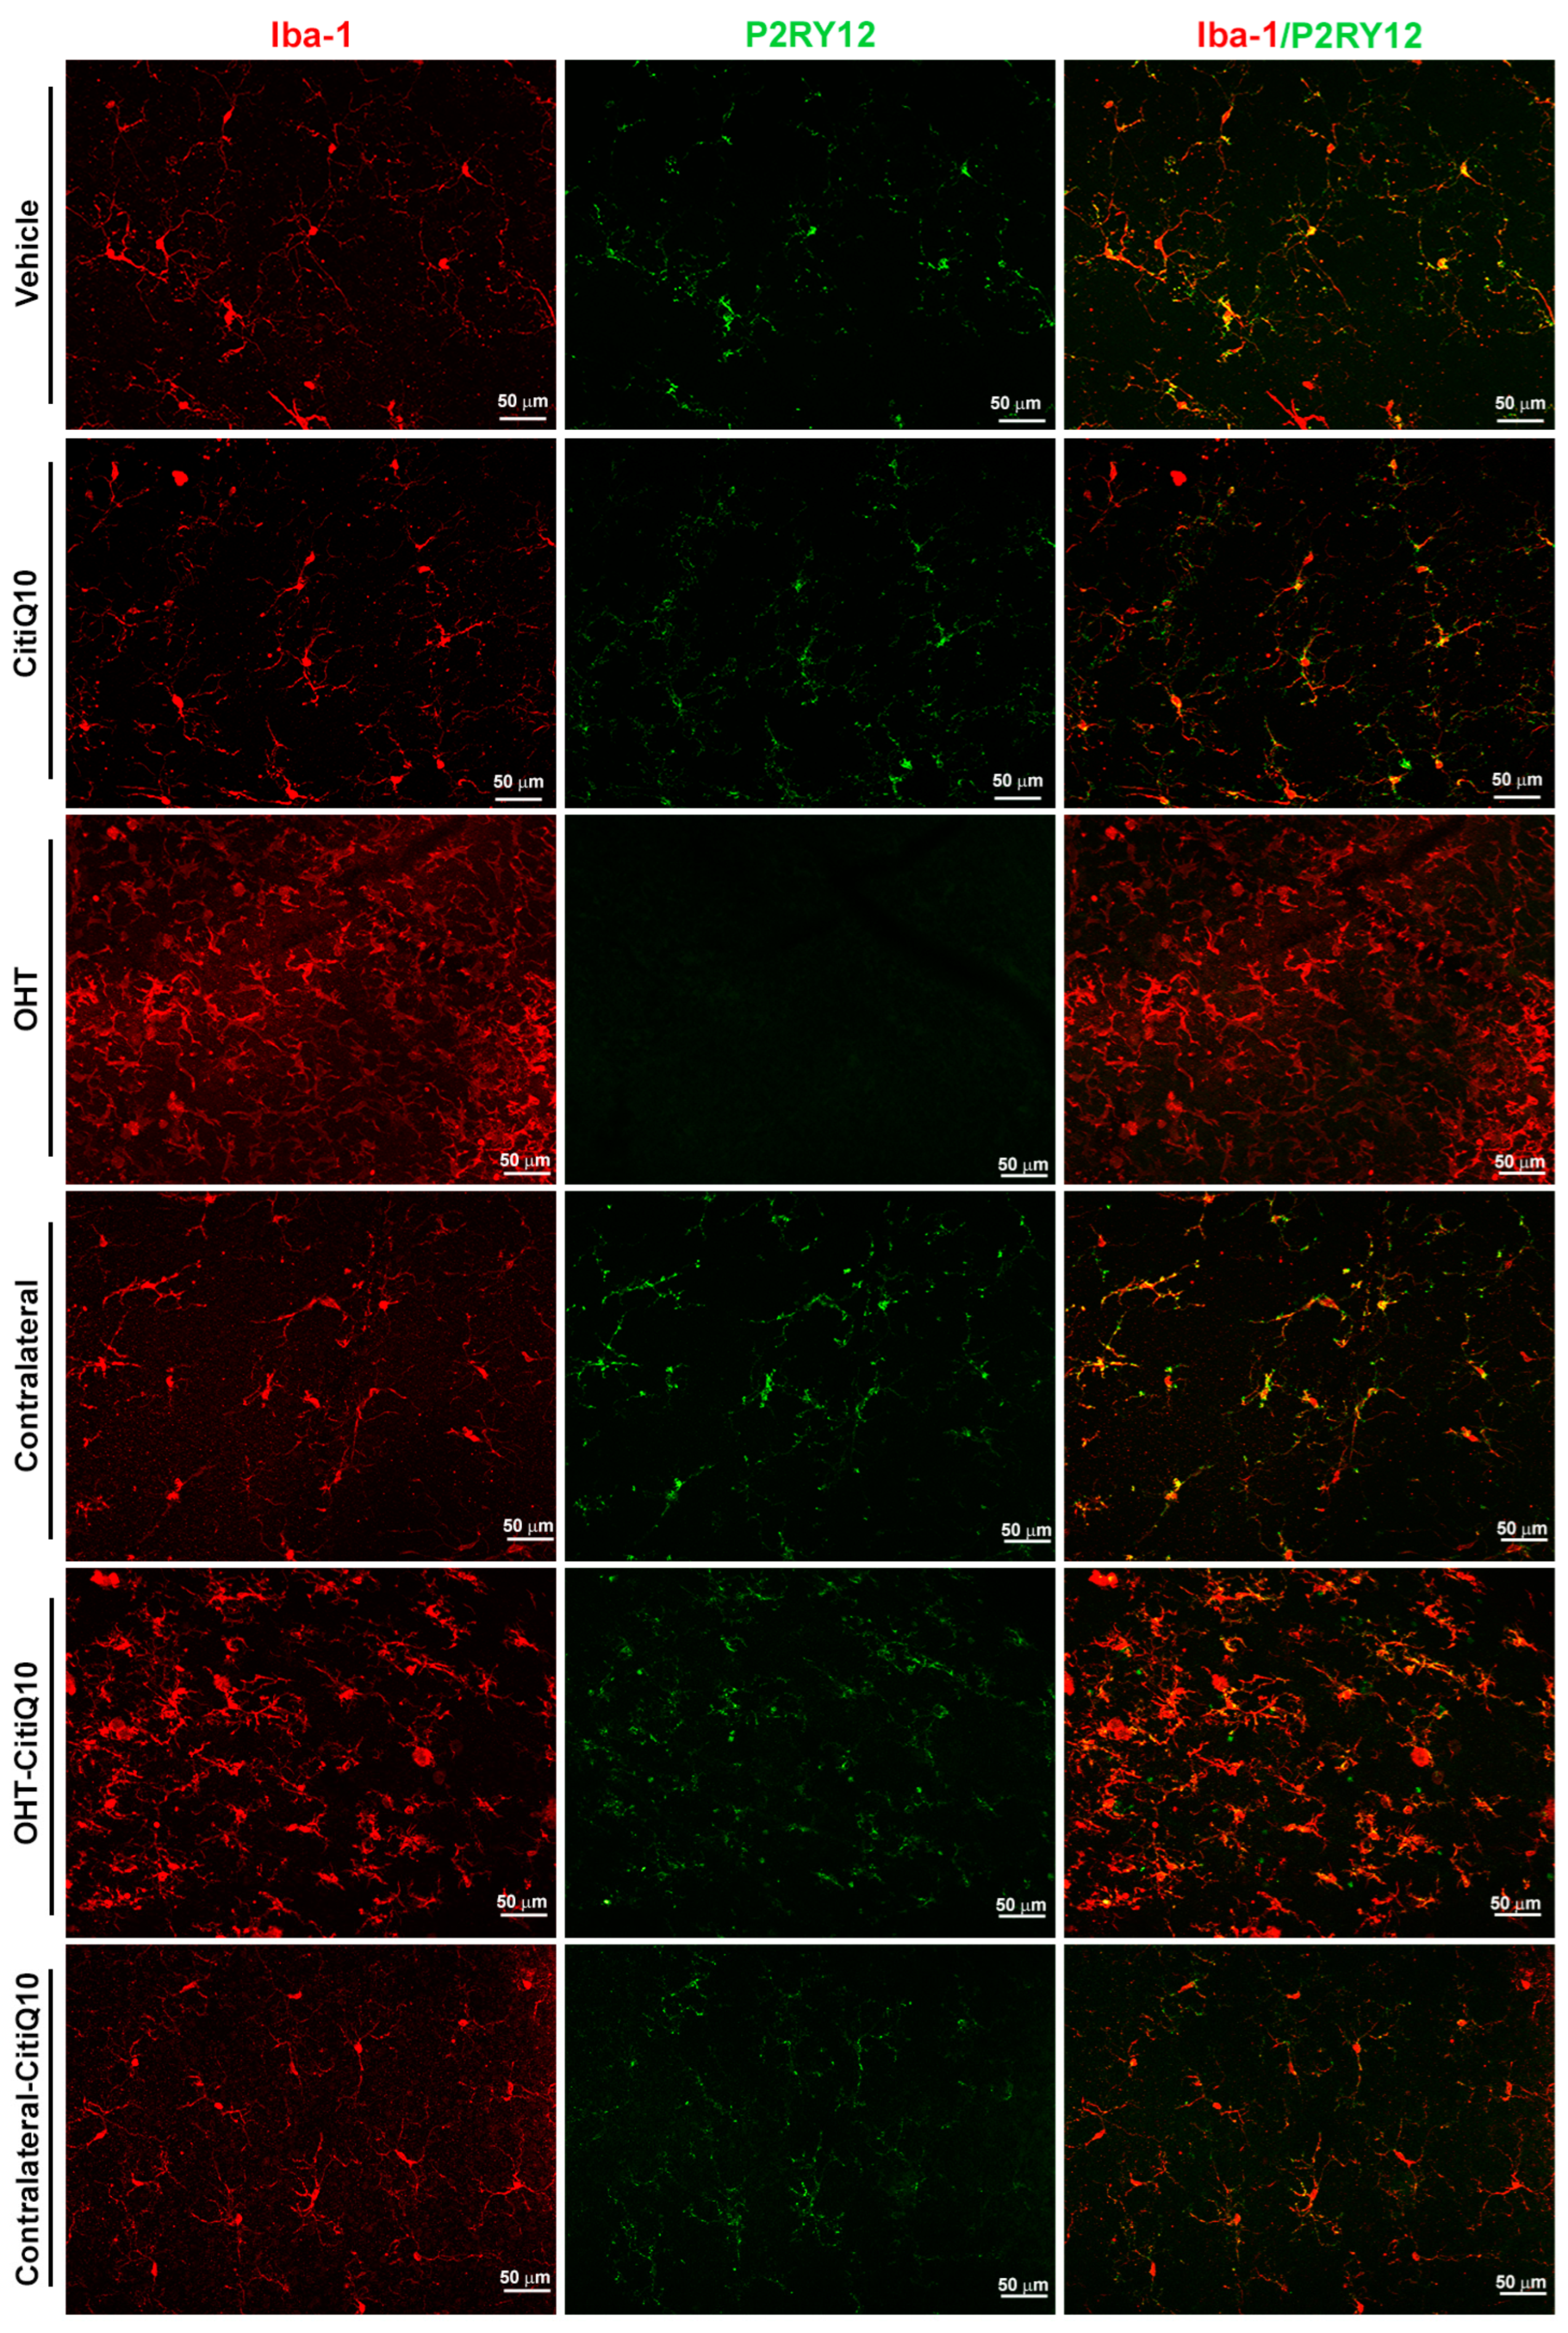
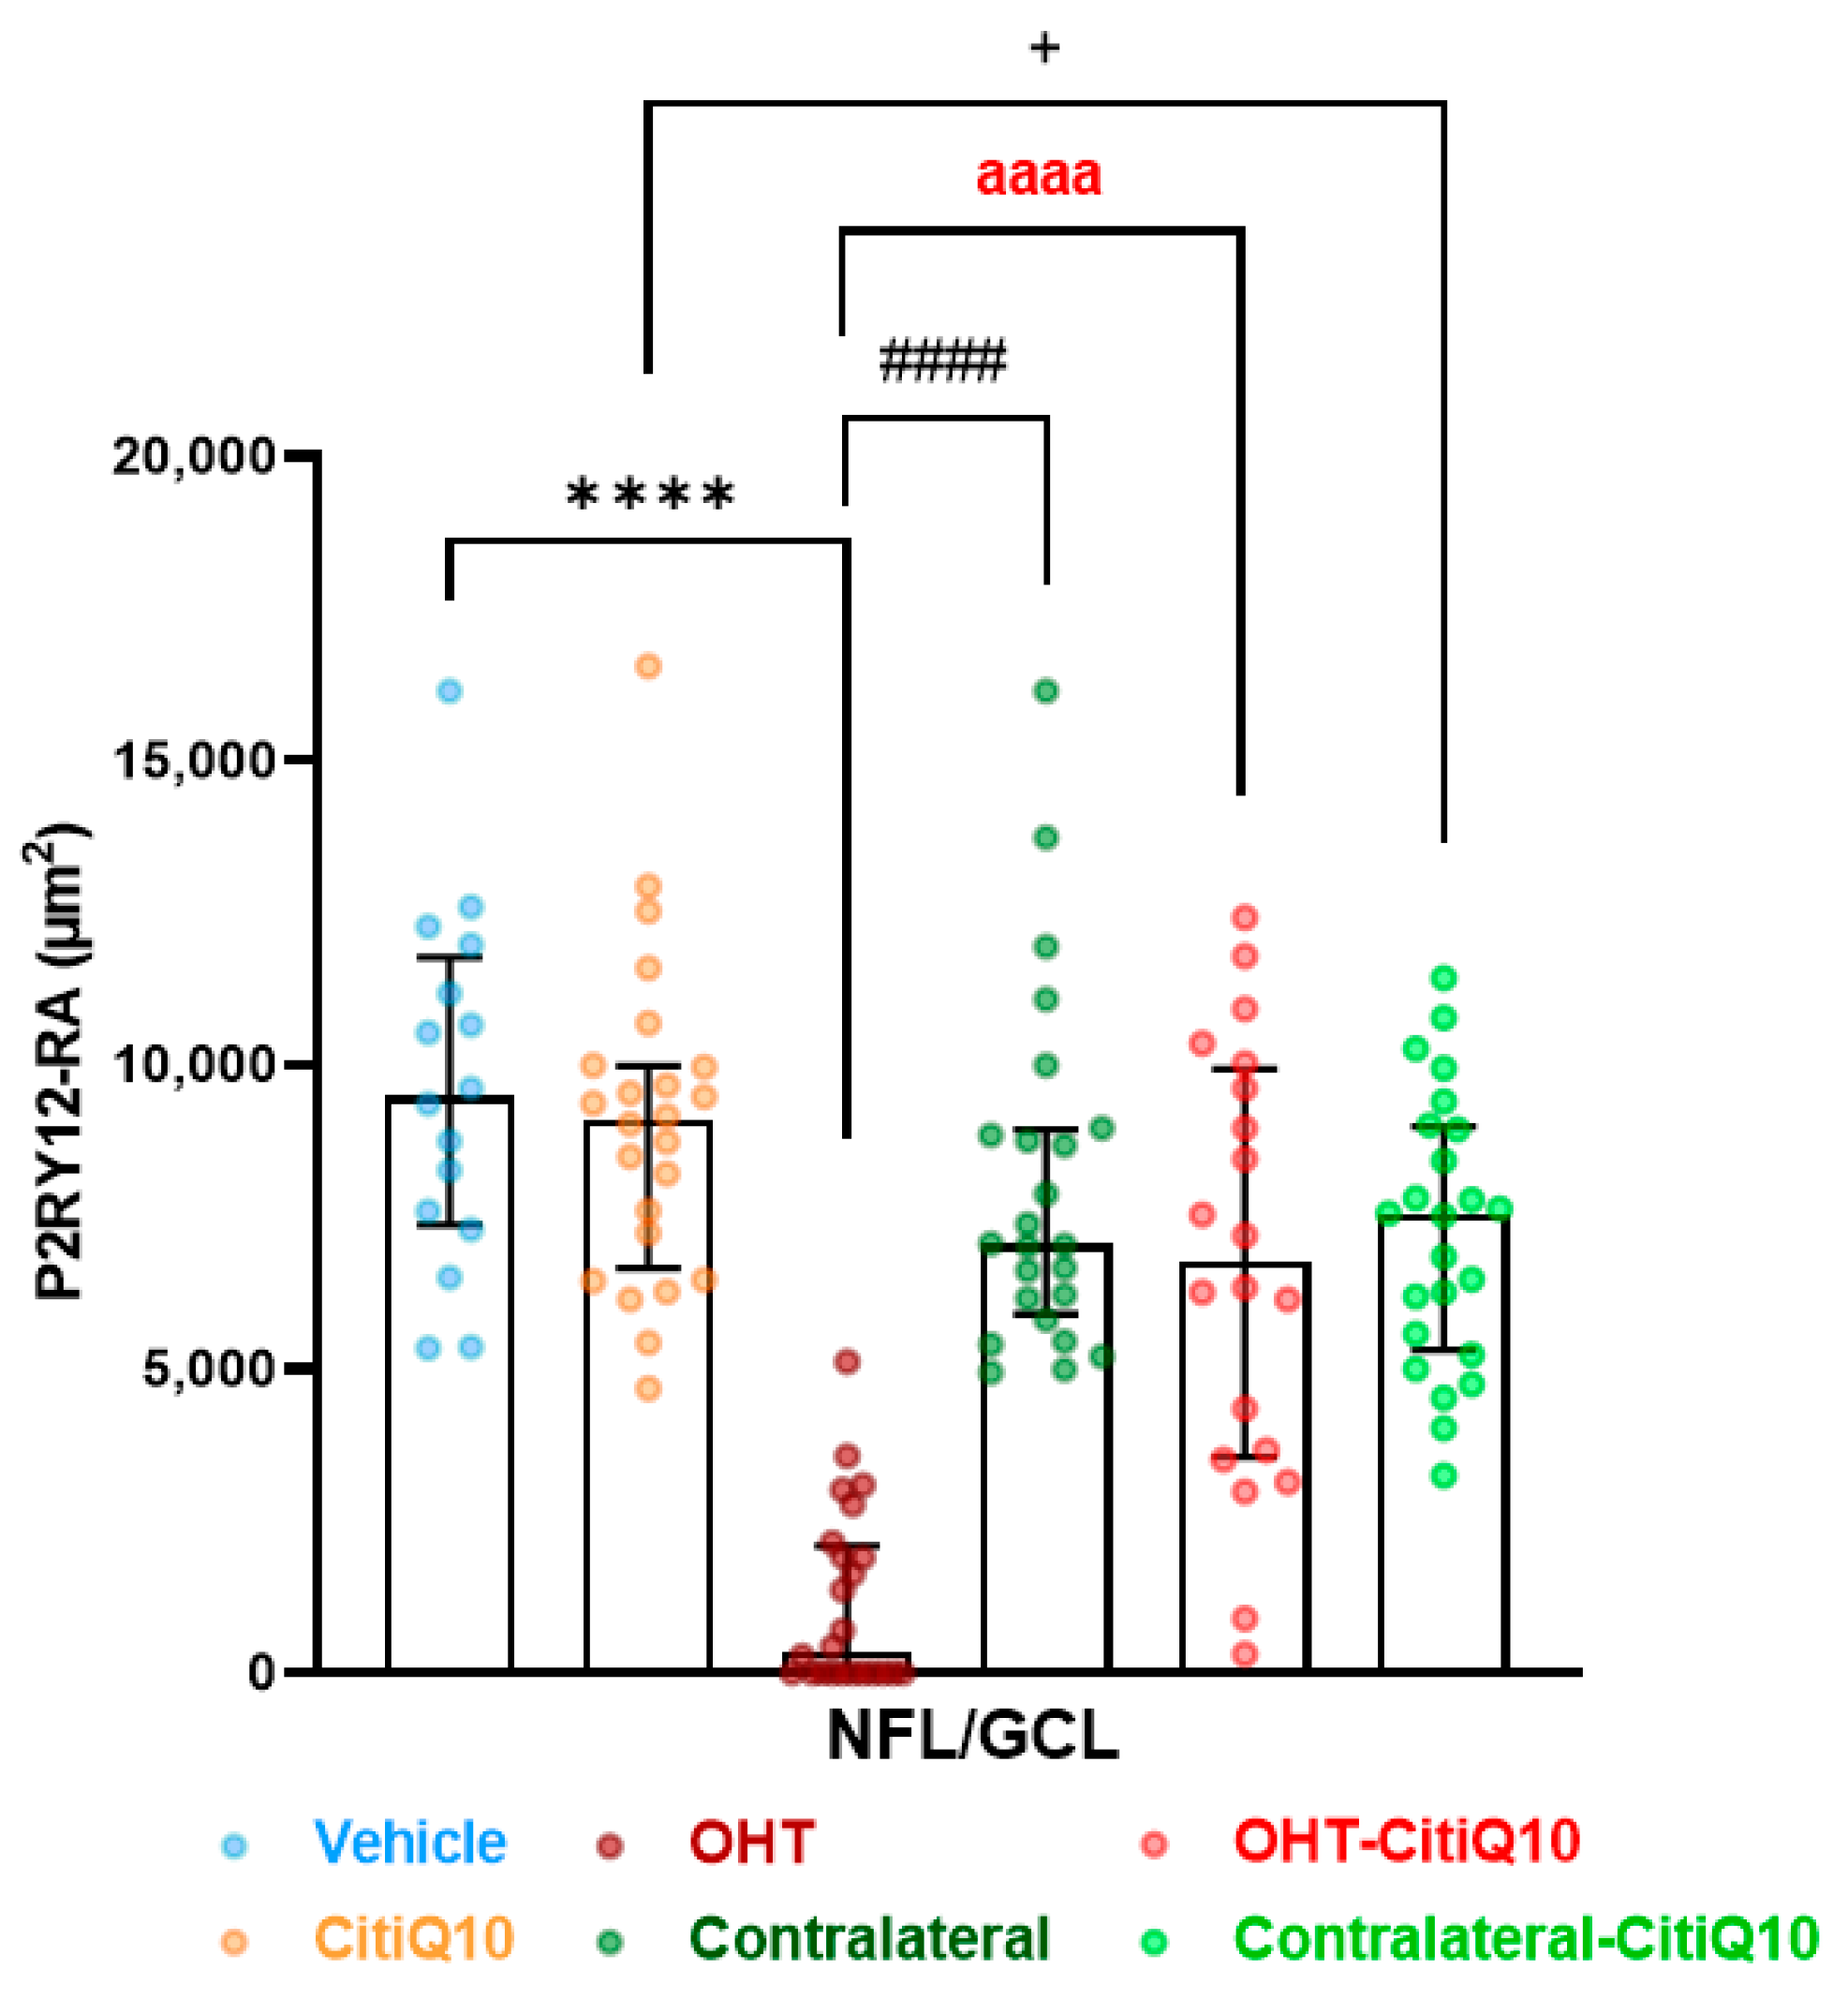
2.2.2. The Combination of Citicoline and CoQ10 Reduces the Down-Regulation of Microglial P2RY12 Expression in OHT Eyes
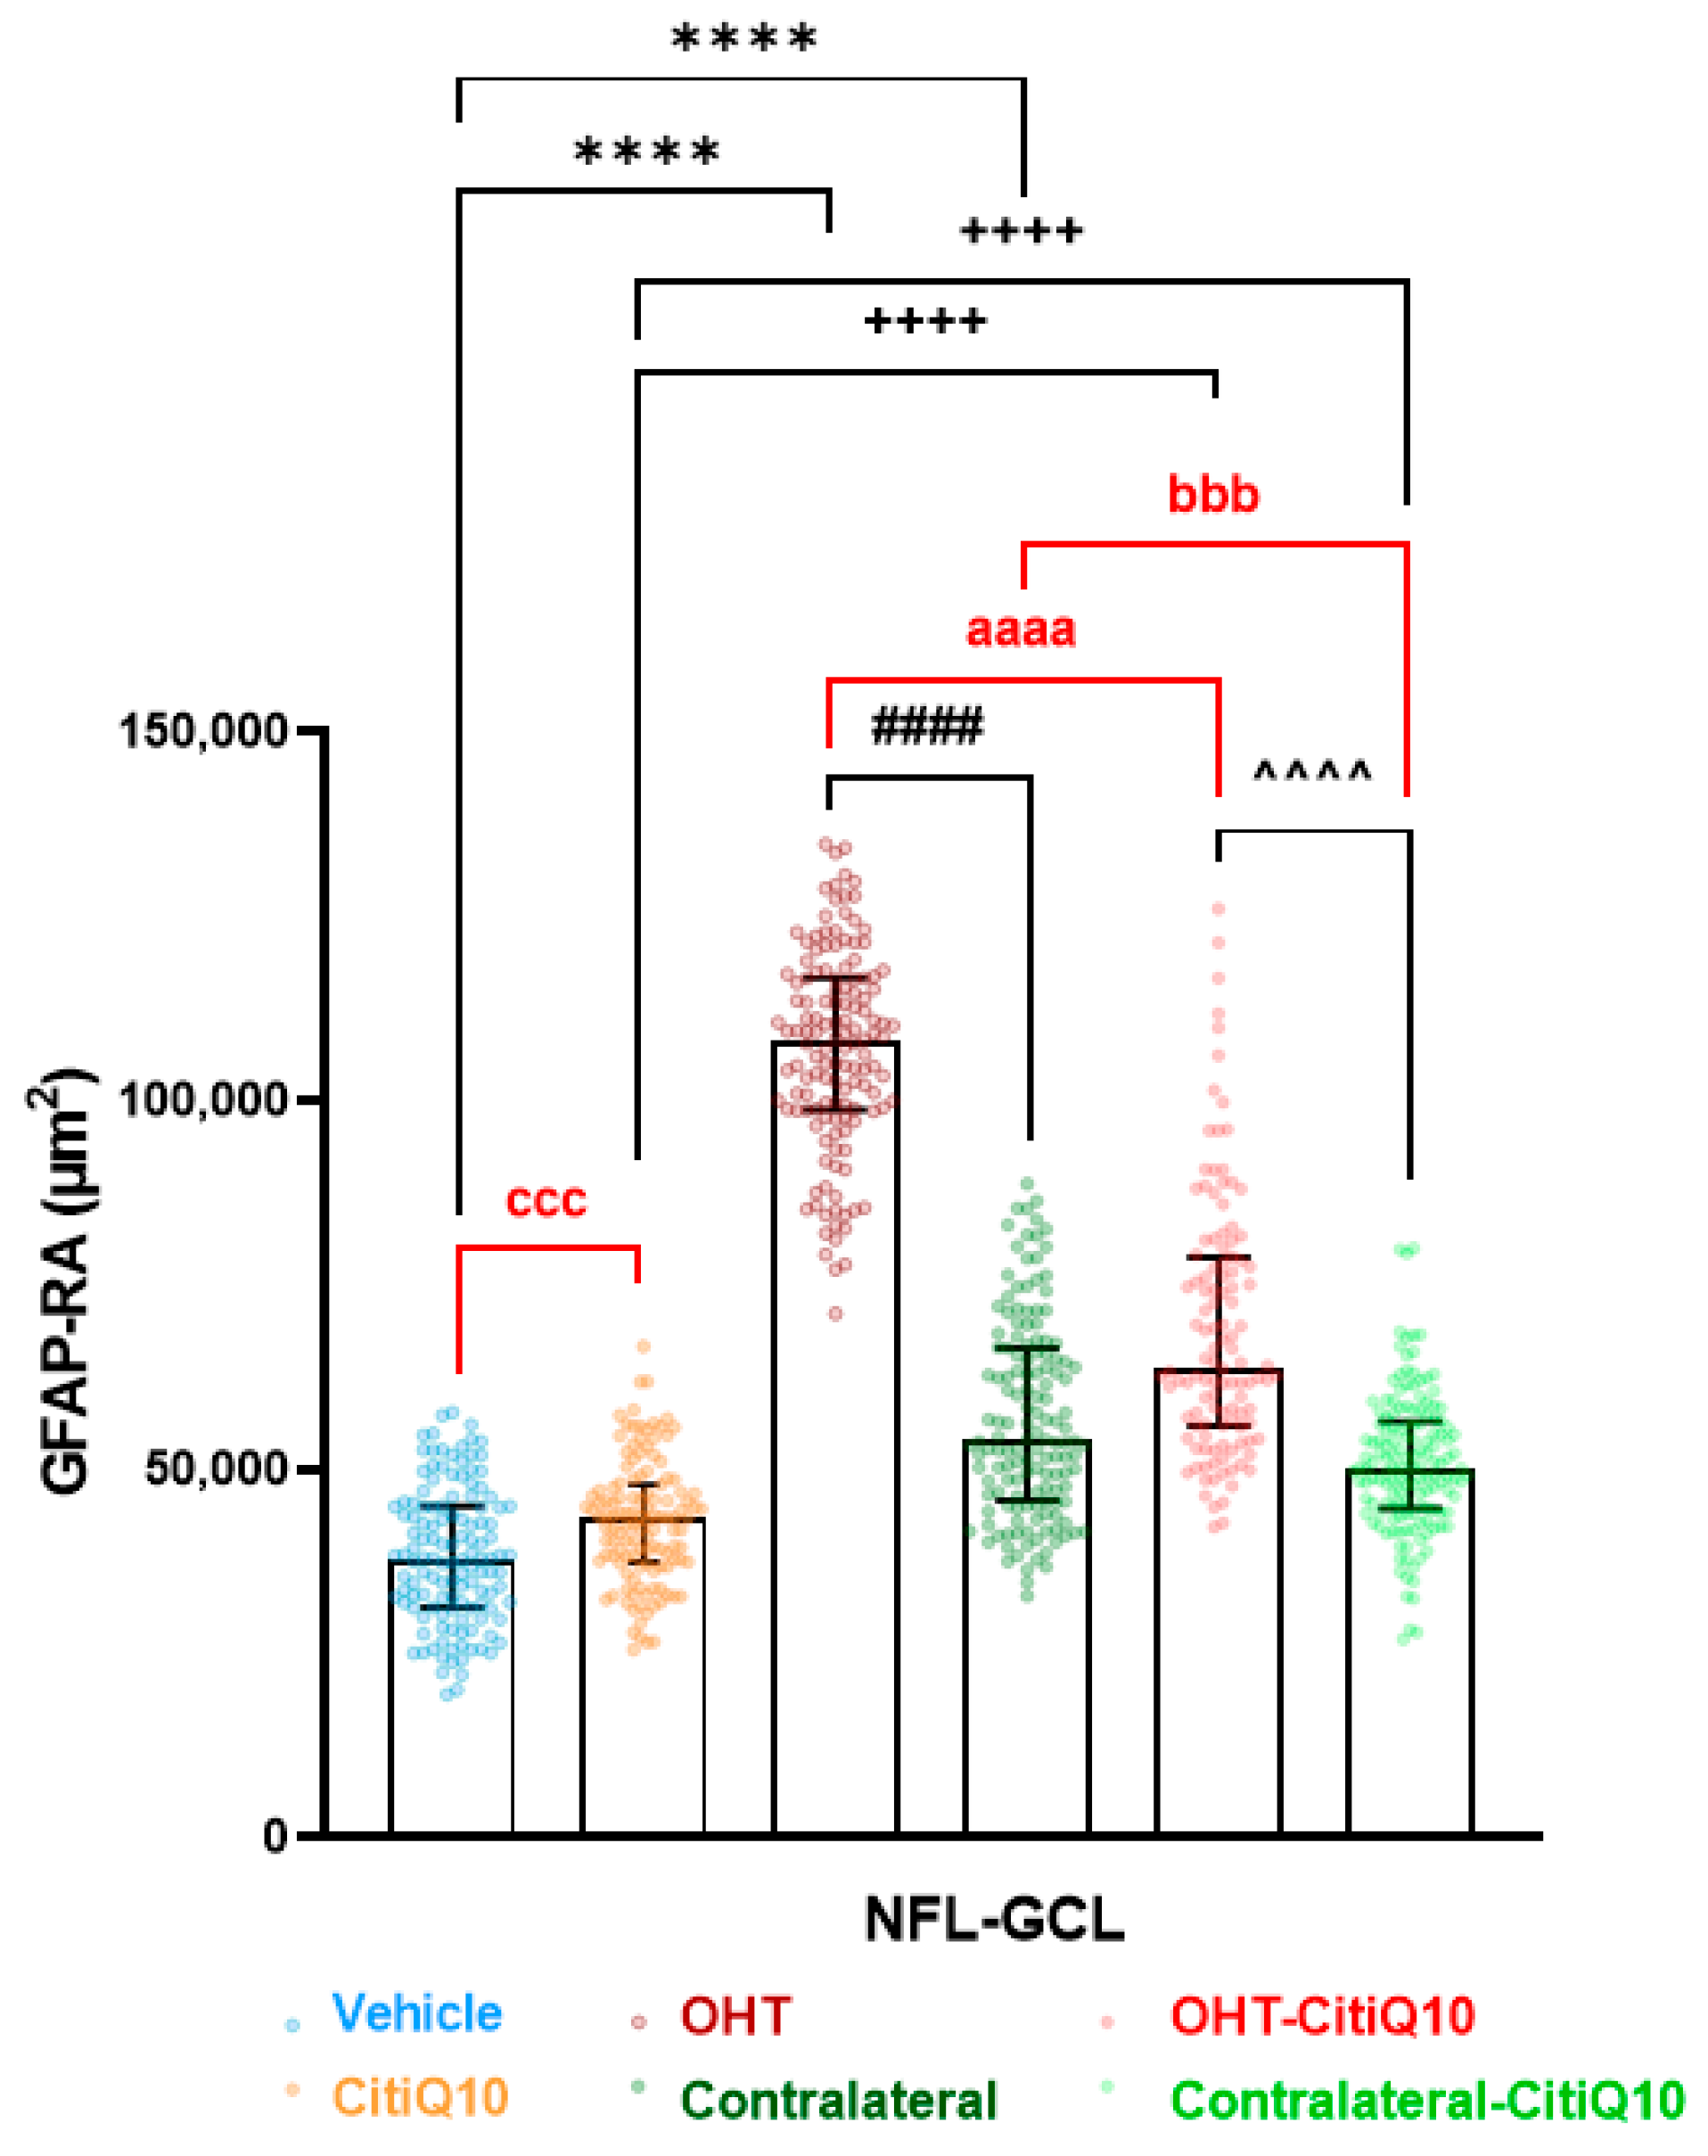
2.2.3. Macroglial Cells
2.3. Nuclei of the Visual Pathway: The Combination of Citicoline and CoQ10 Reduces Glial Activation Produced by Laser-Induced OHT
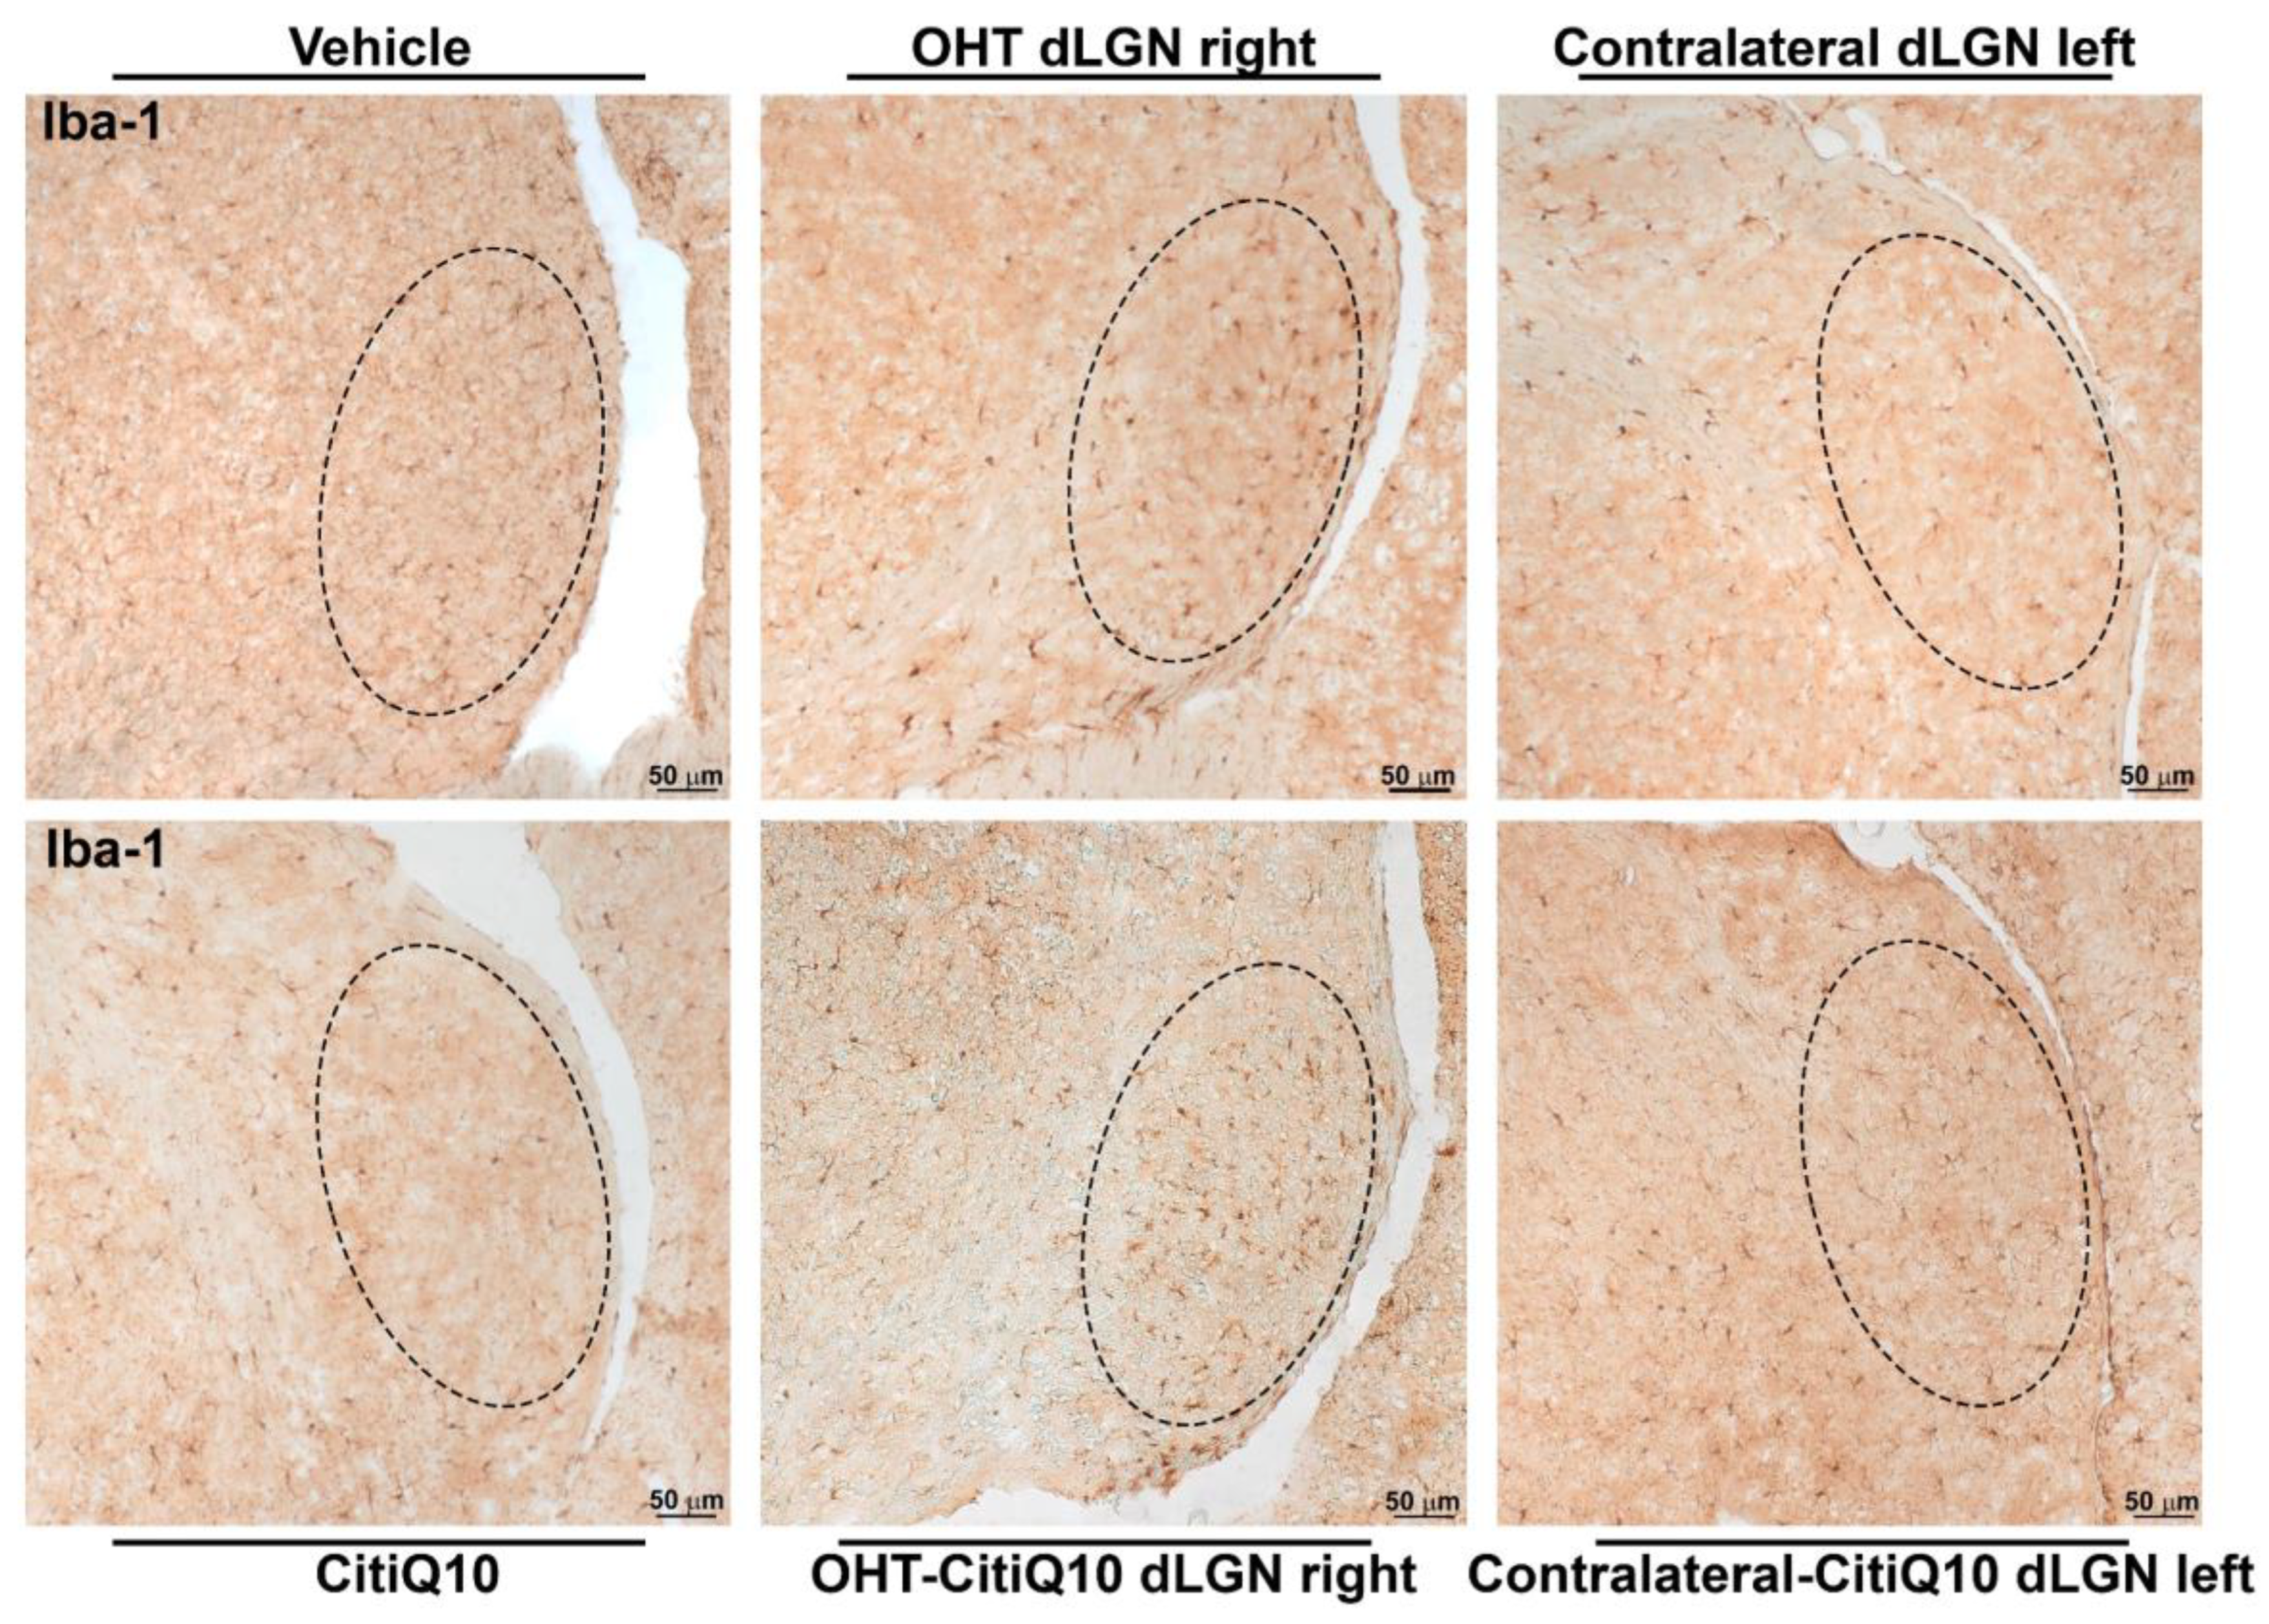
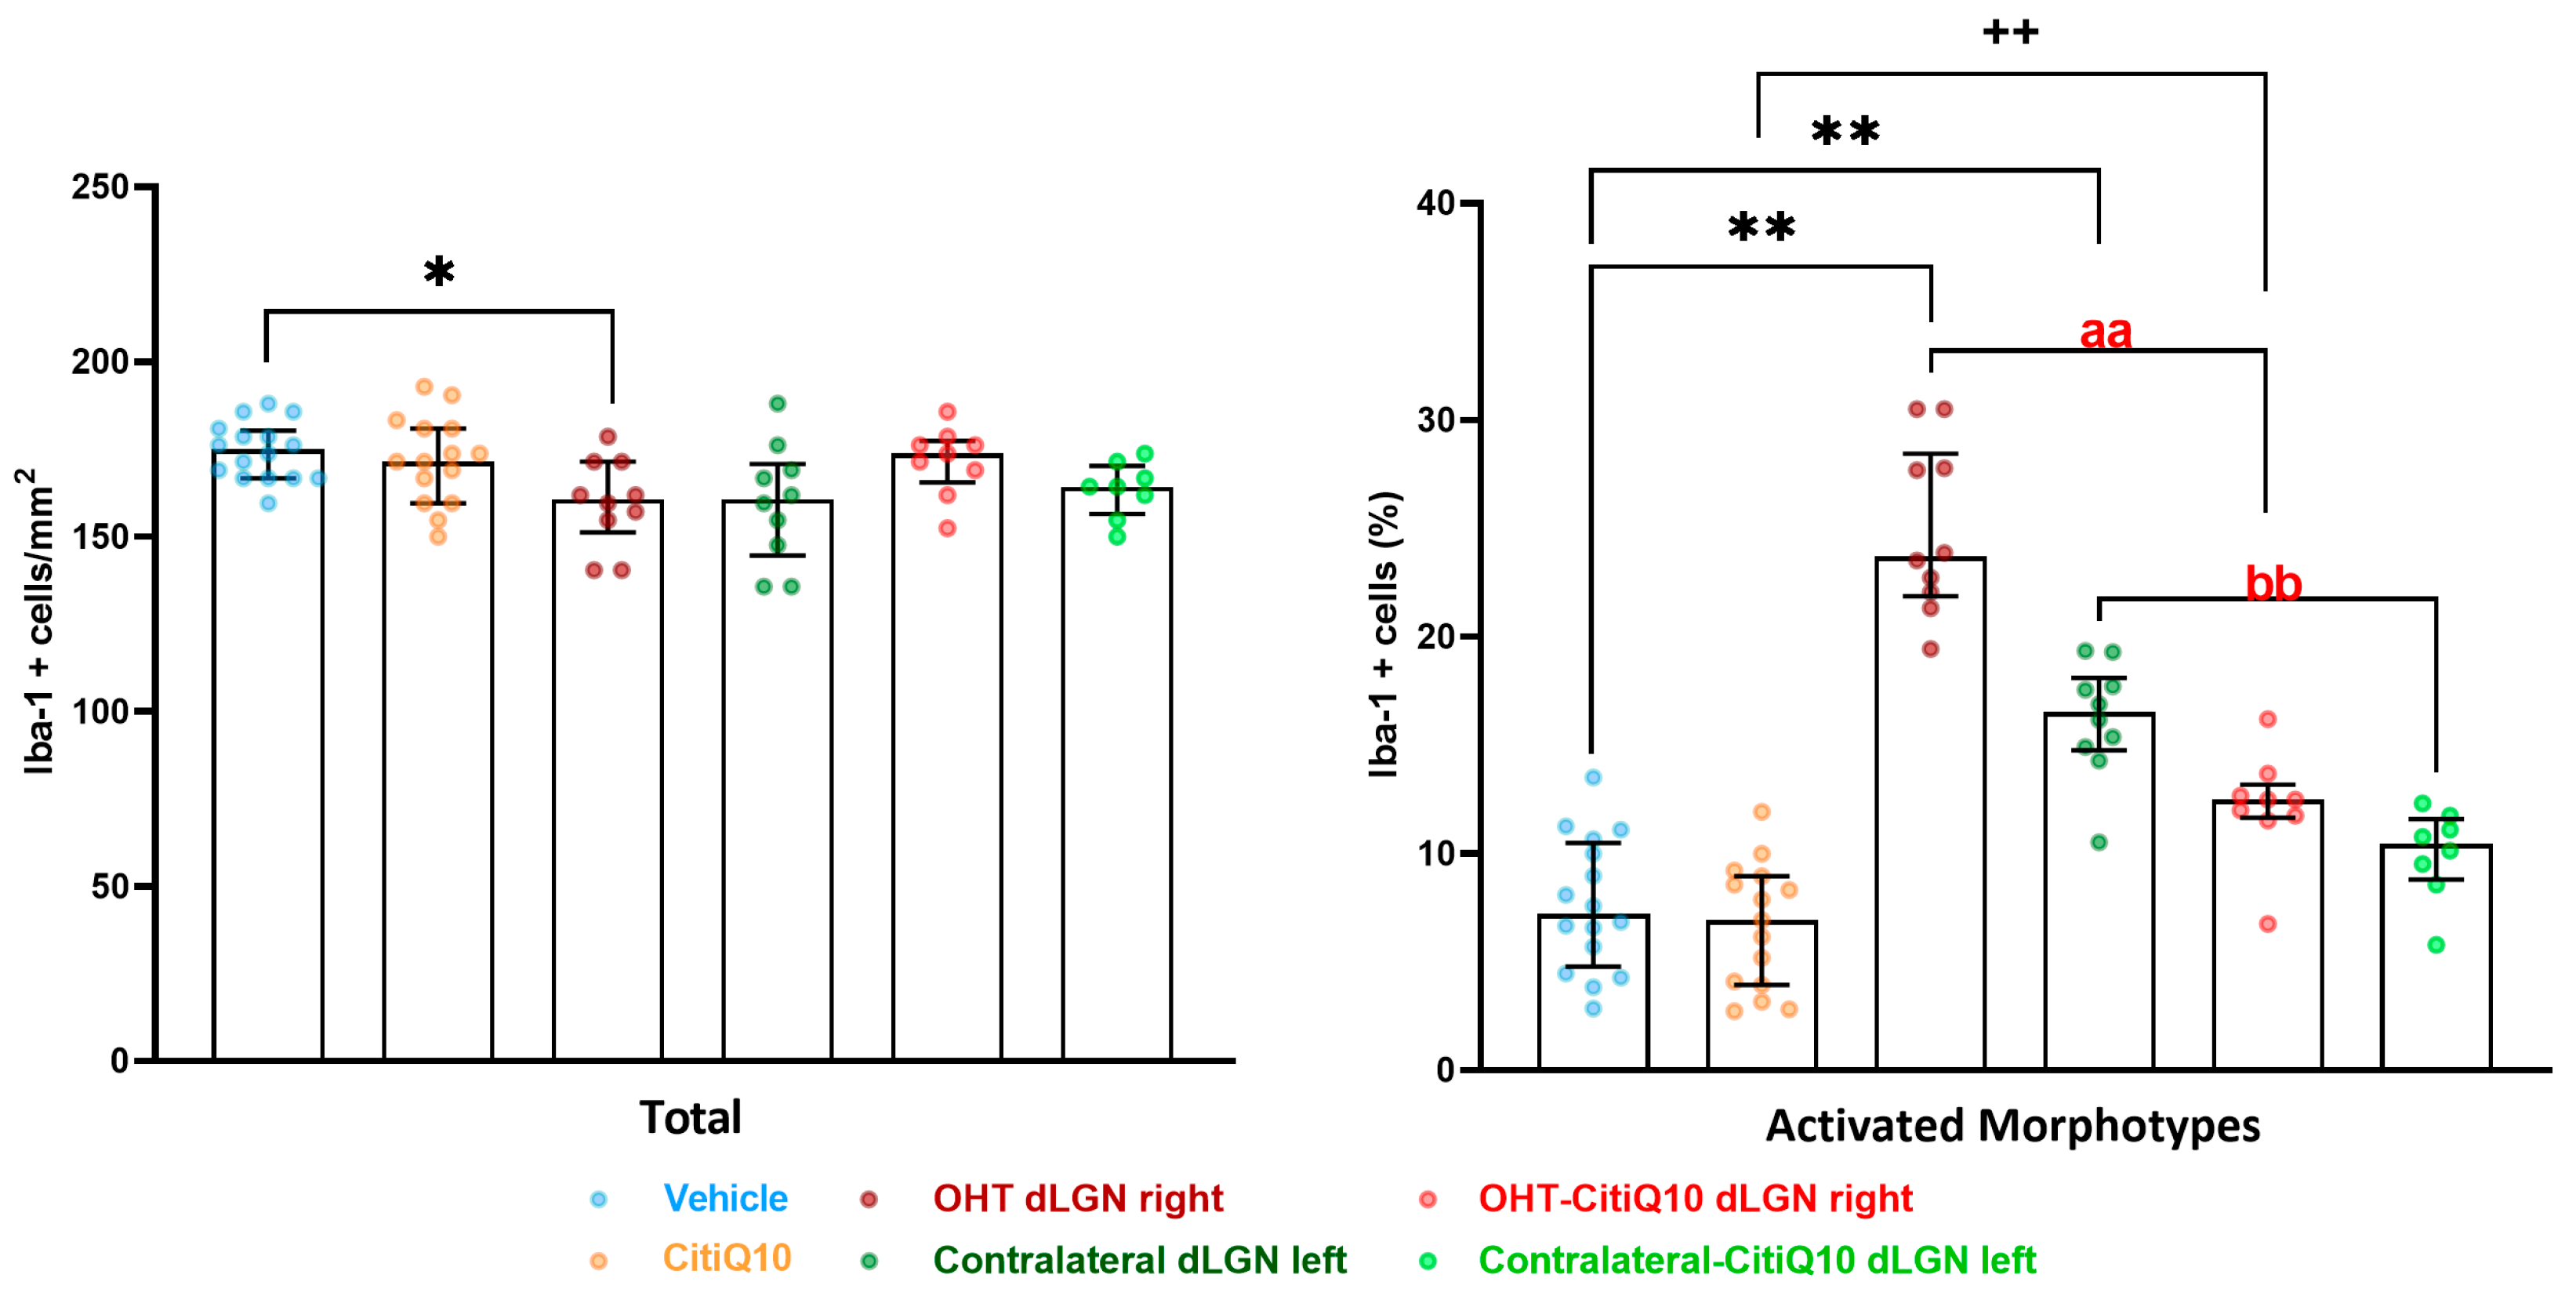
2.3.1. Dorsolateral Geniculate Nucleus (dLGN)
Iba-1+ Cells
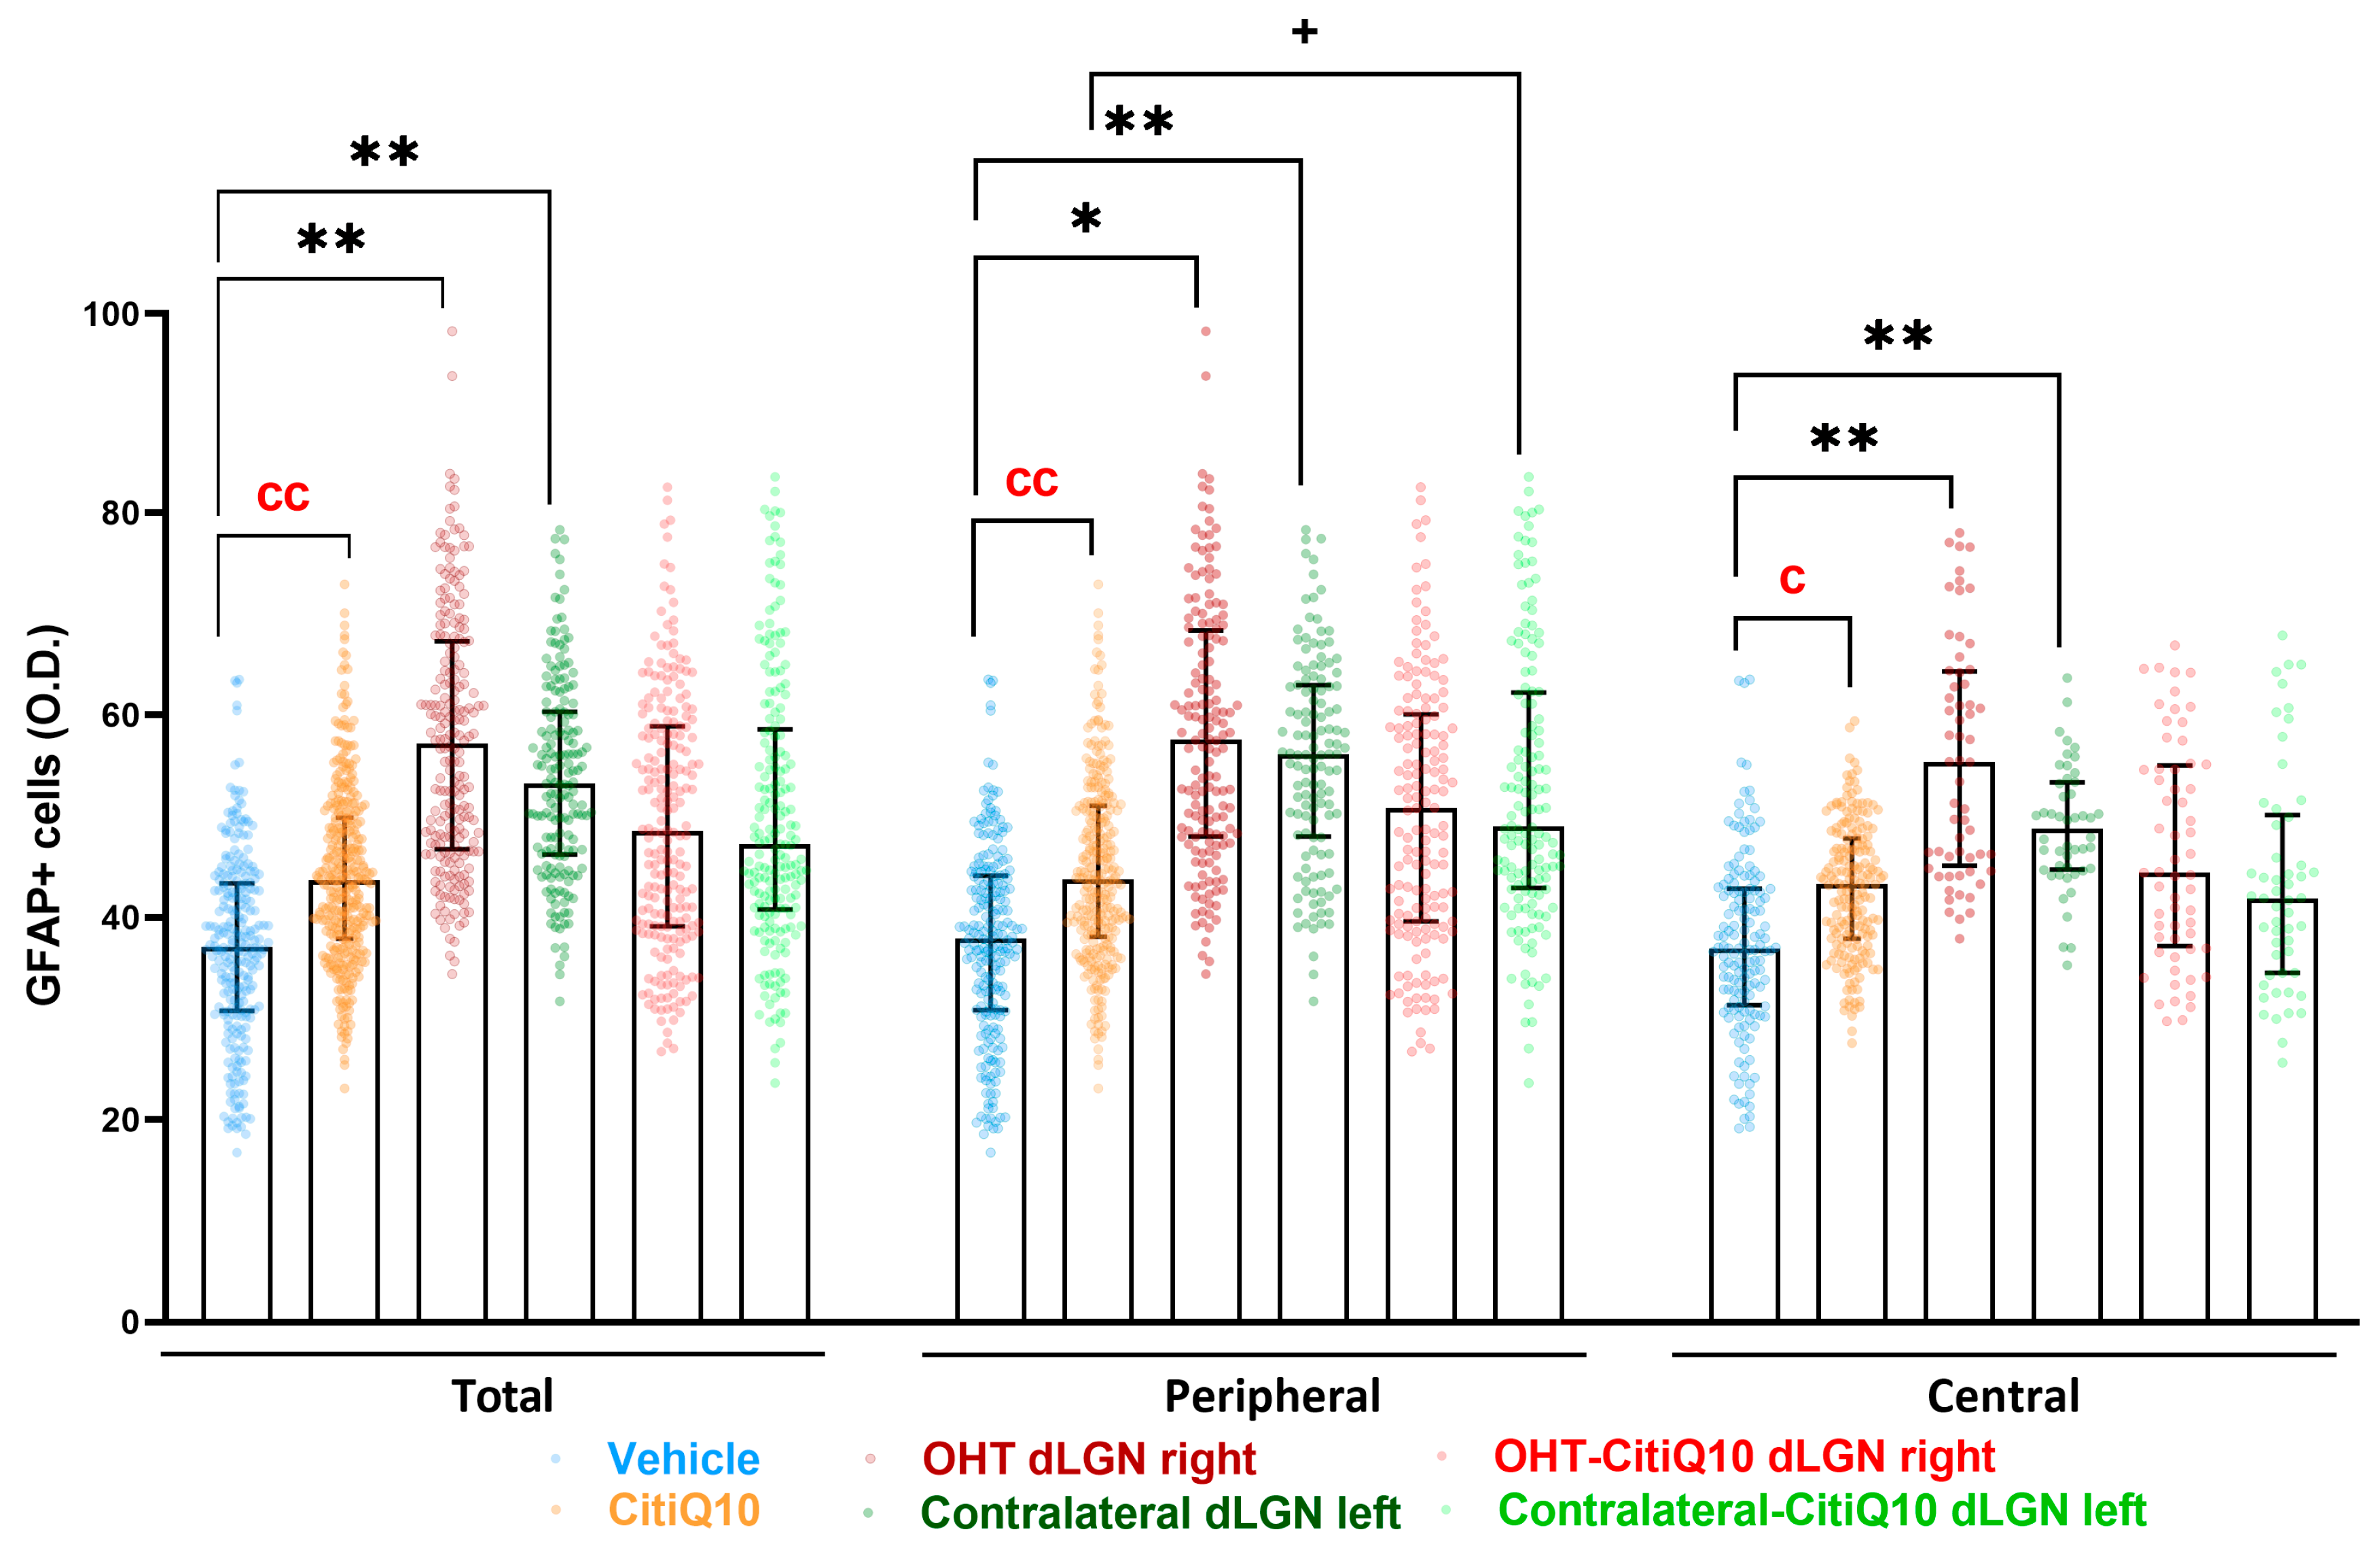
GFAP+ Cells
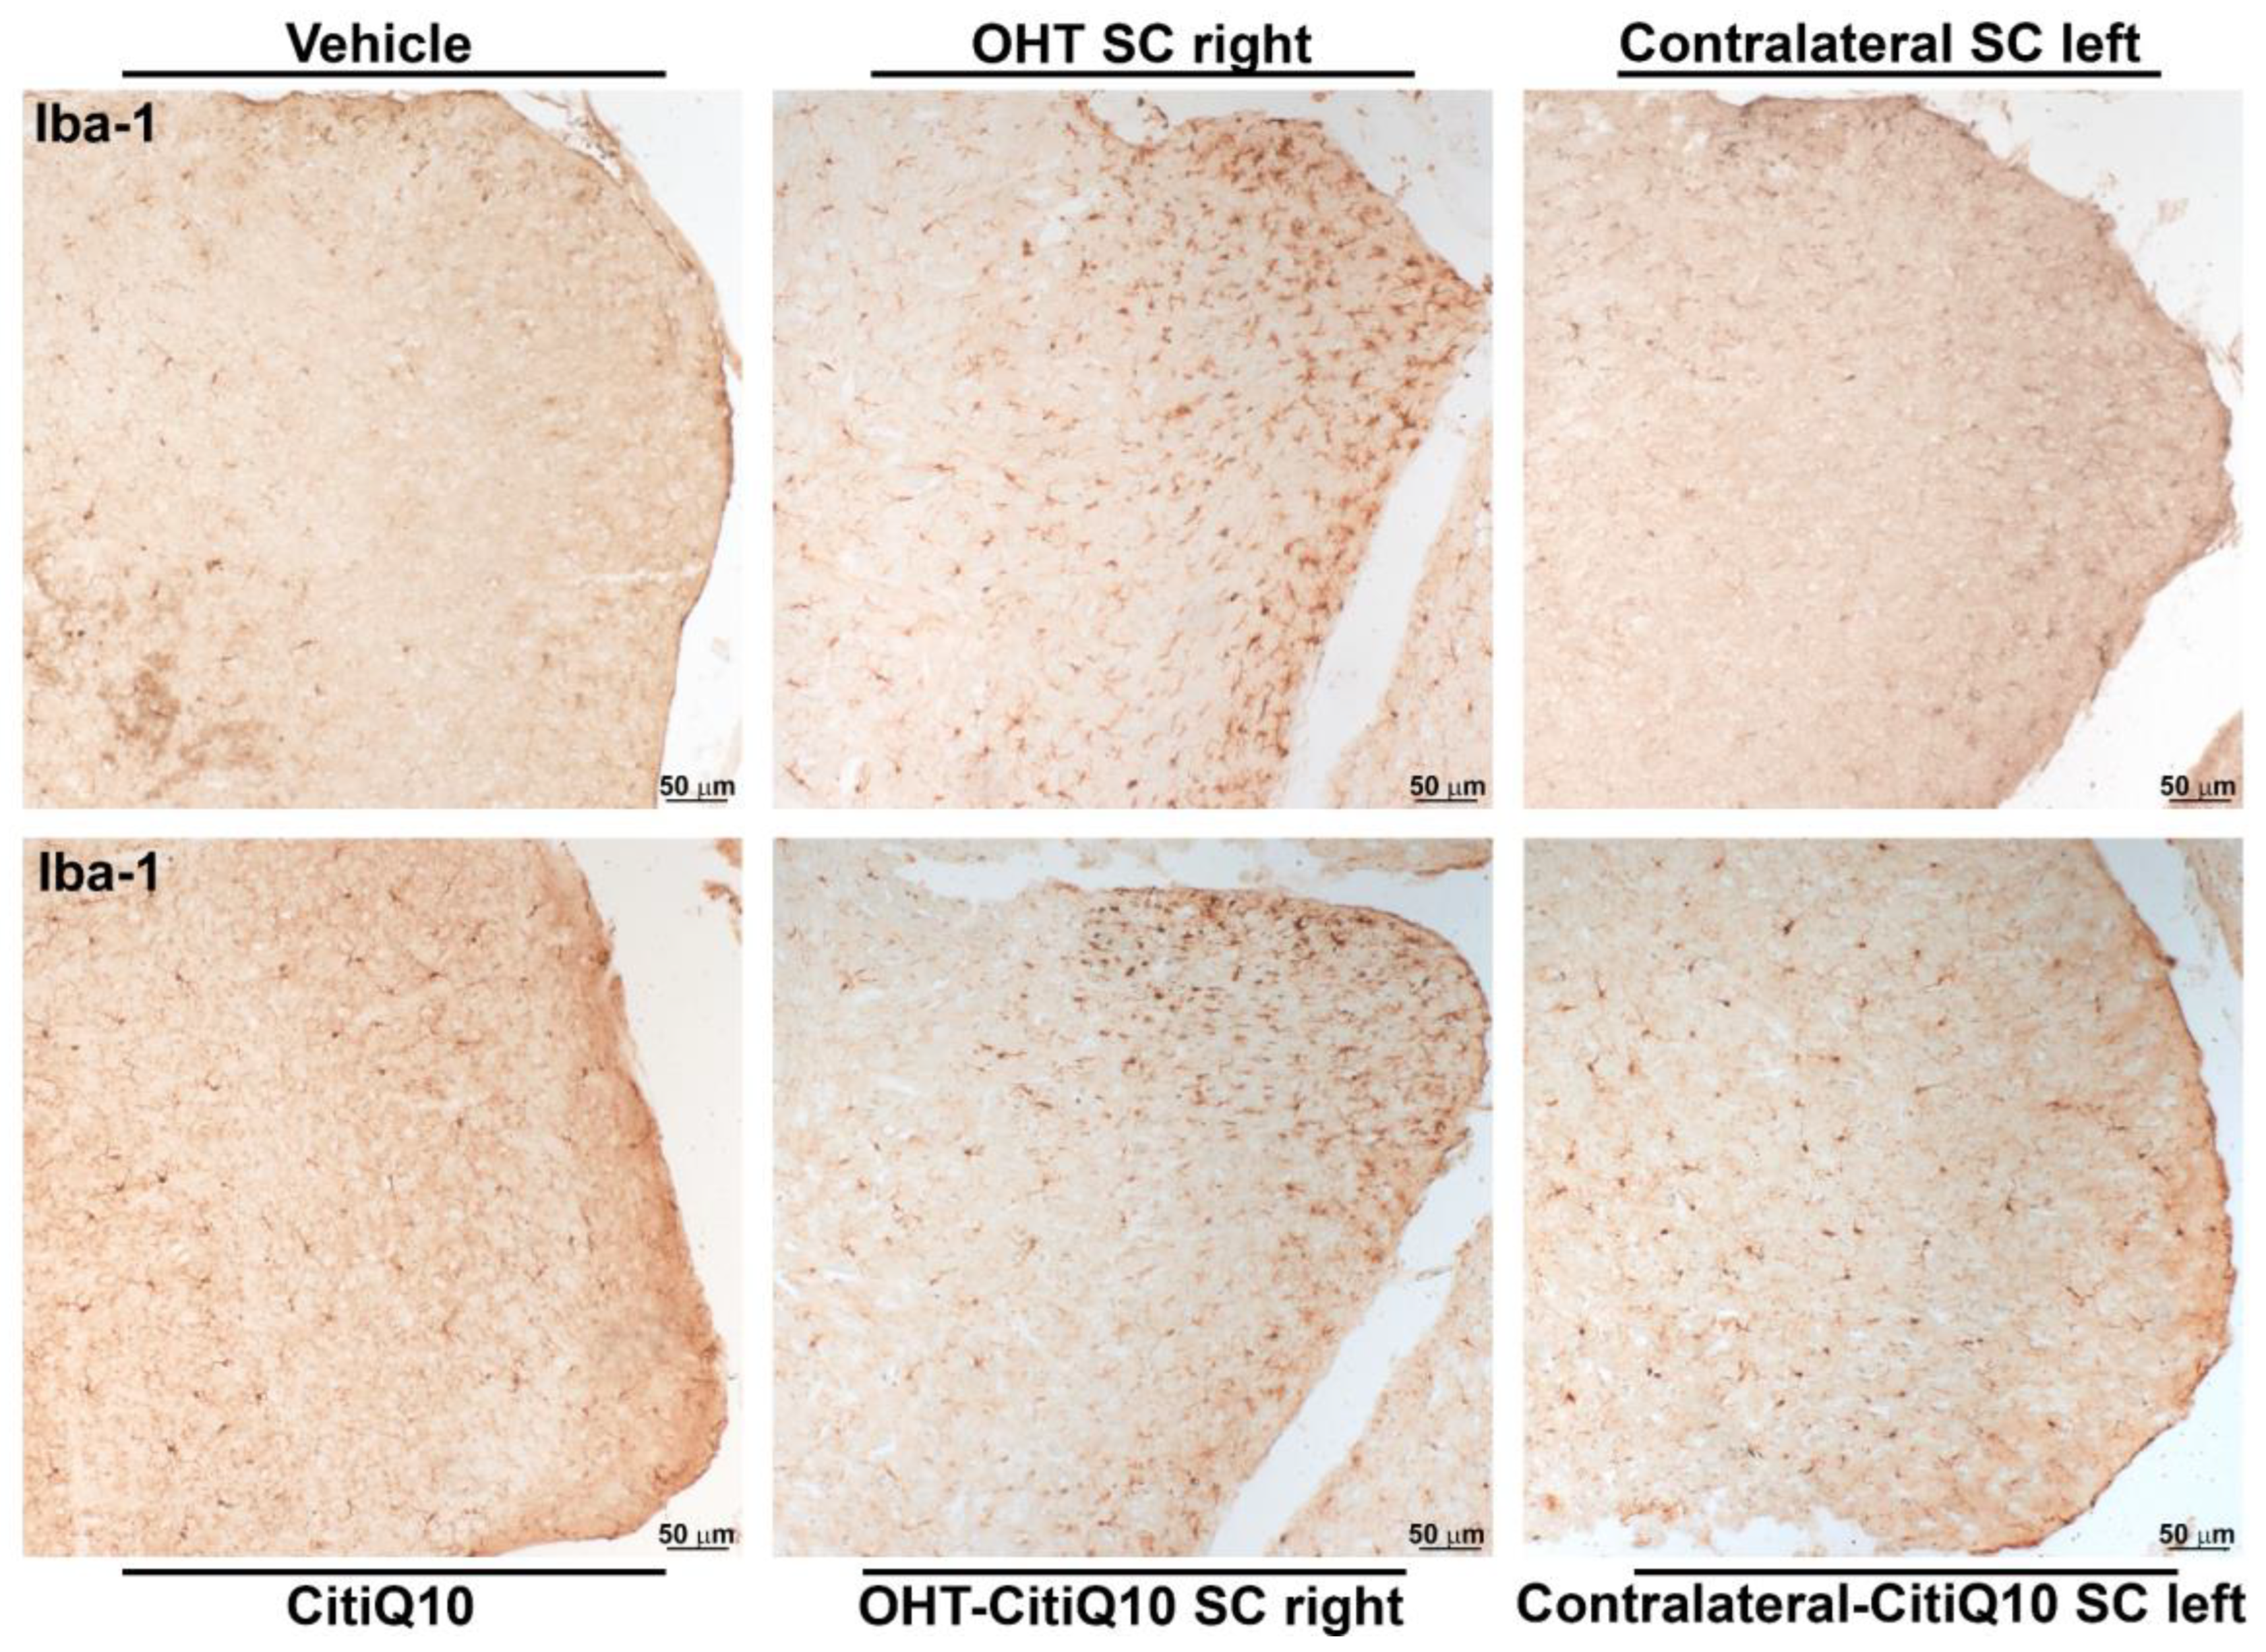
2.3.2. Superior Colliculus (SC)
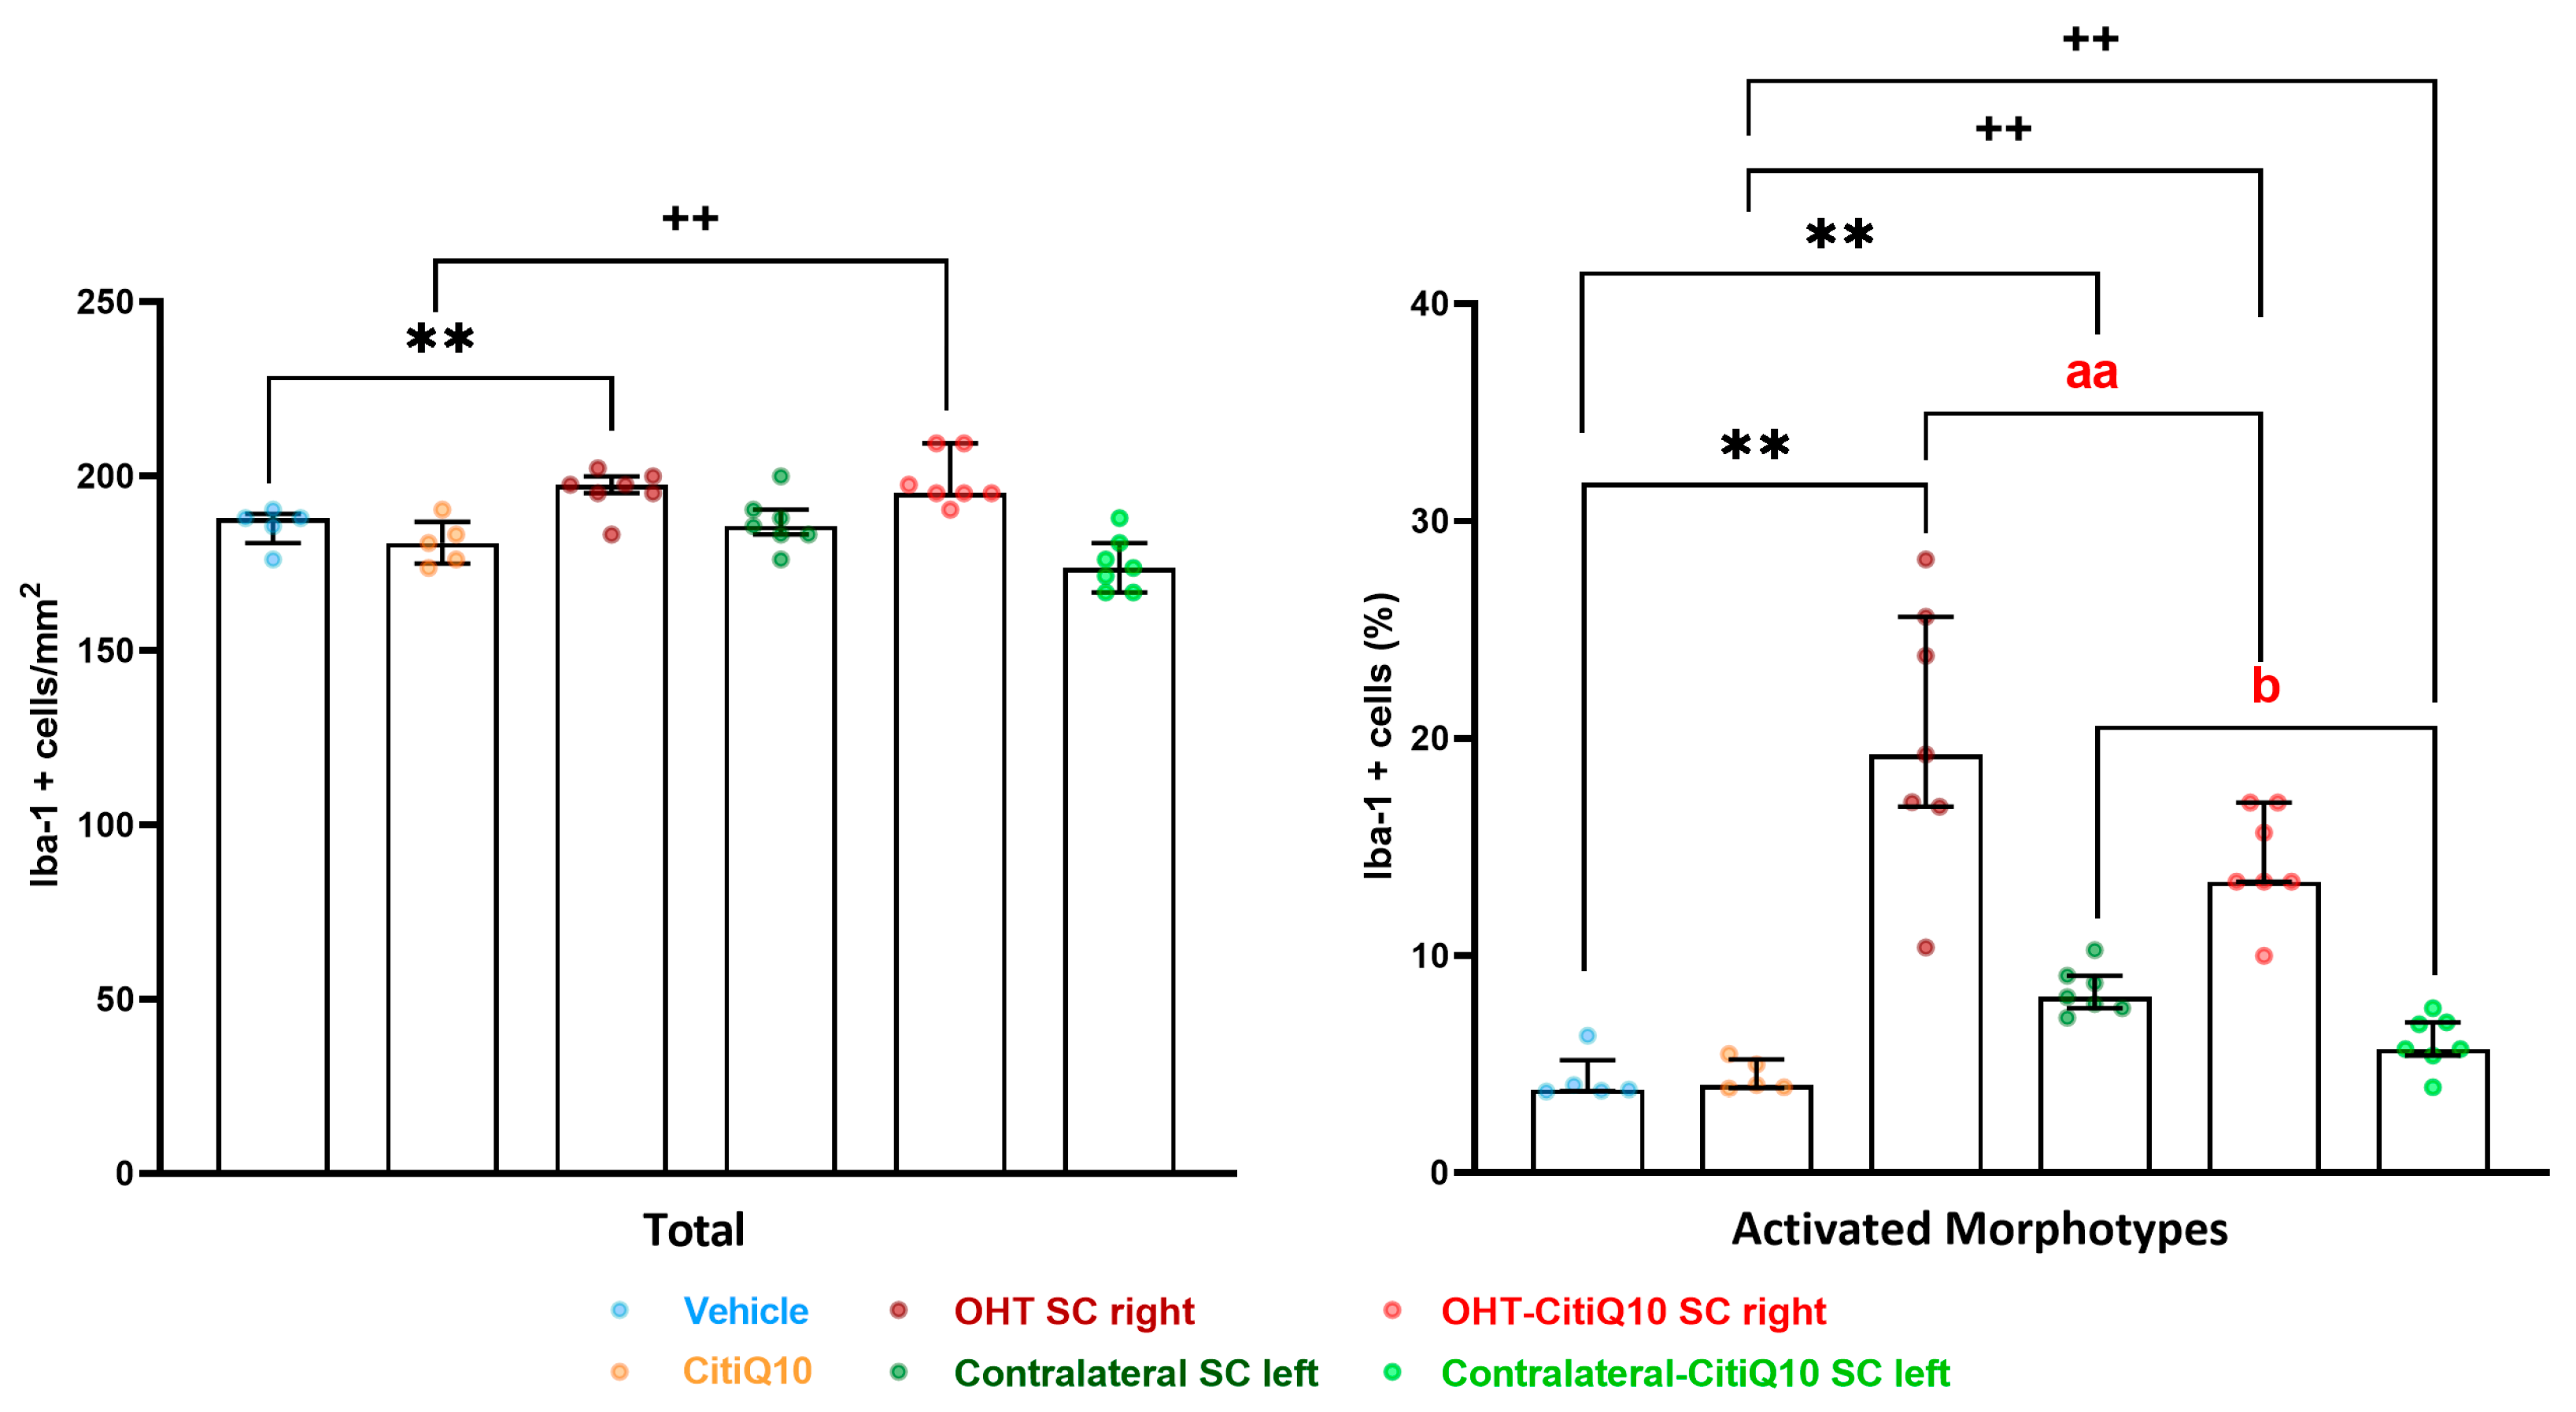
Iba-1+ Cells
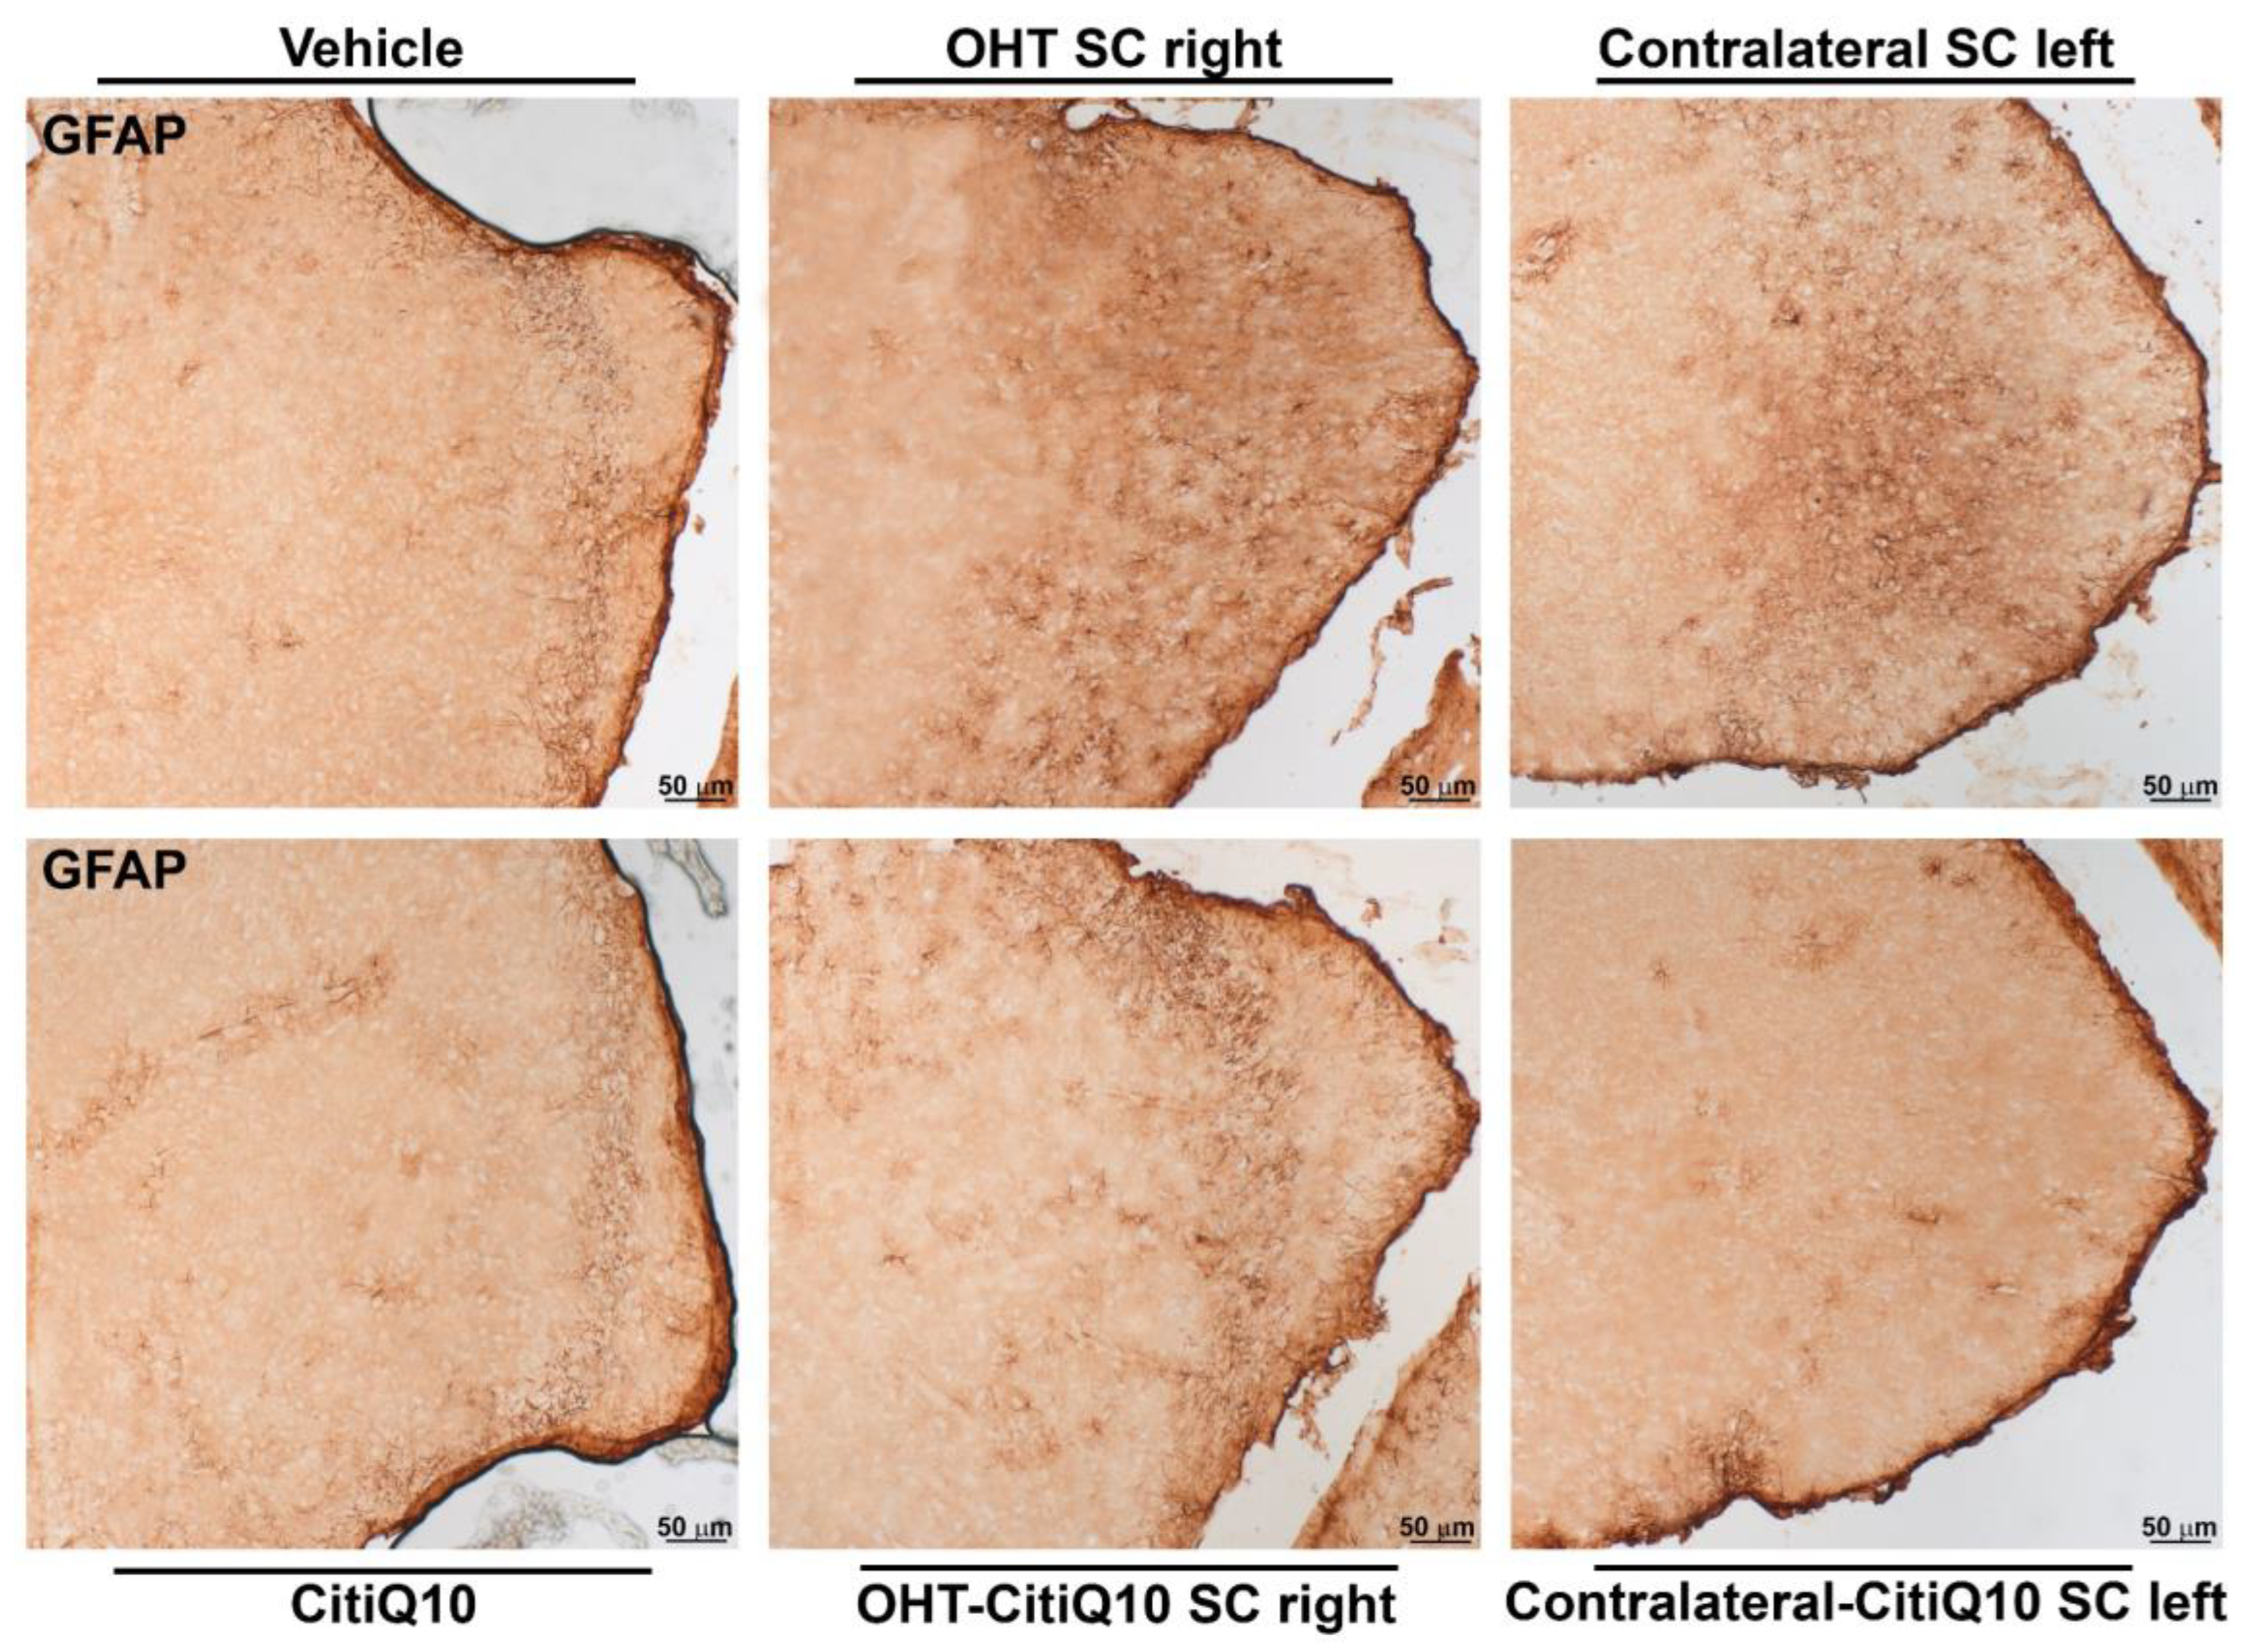
GFAP+ Cells
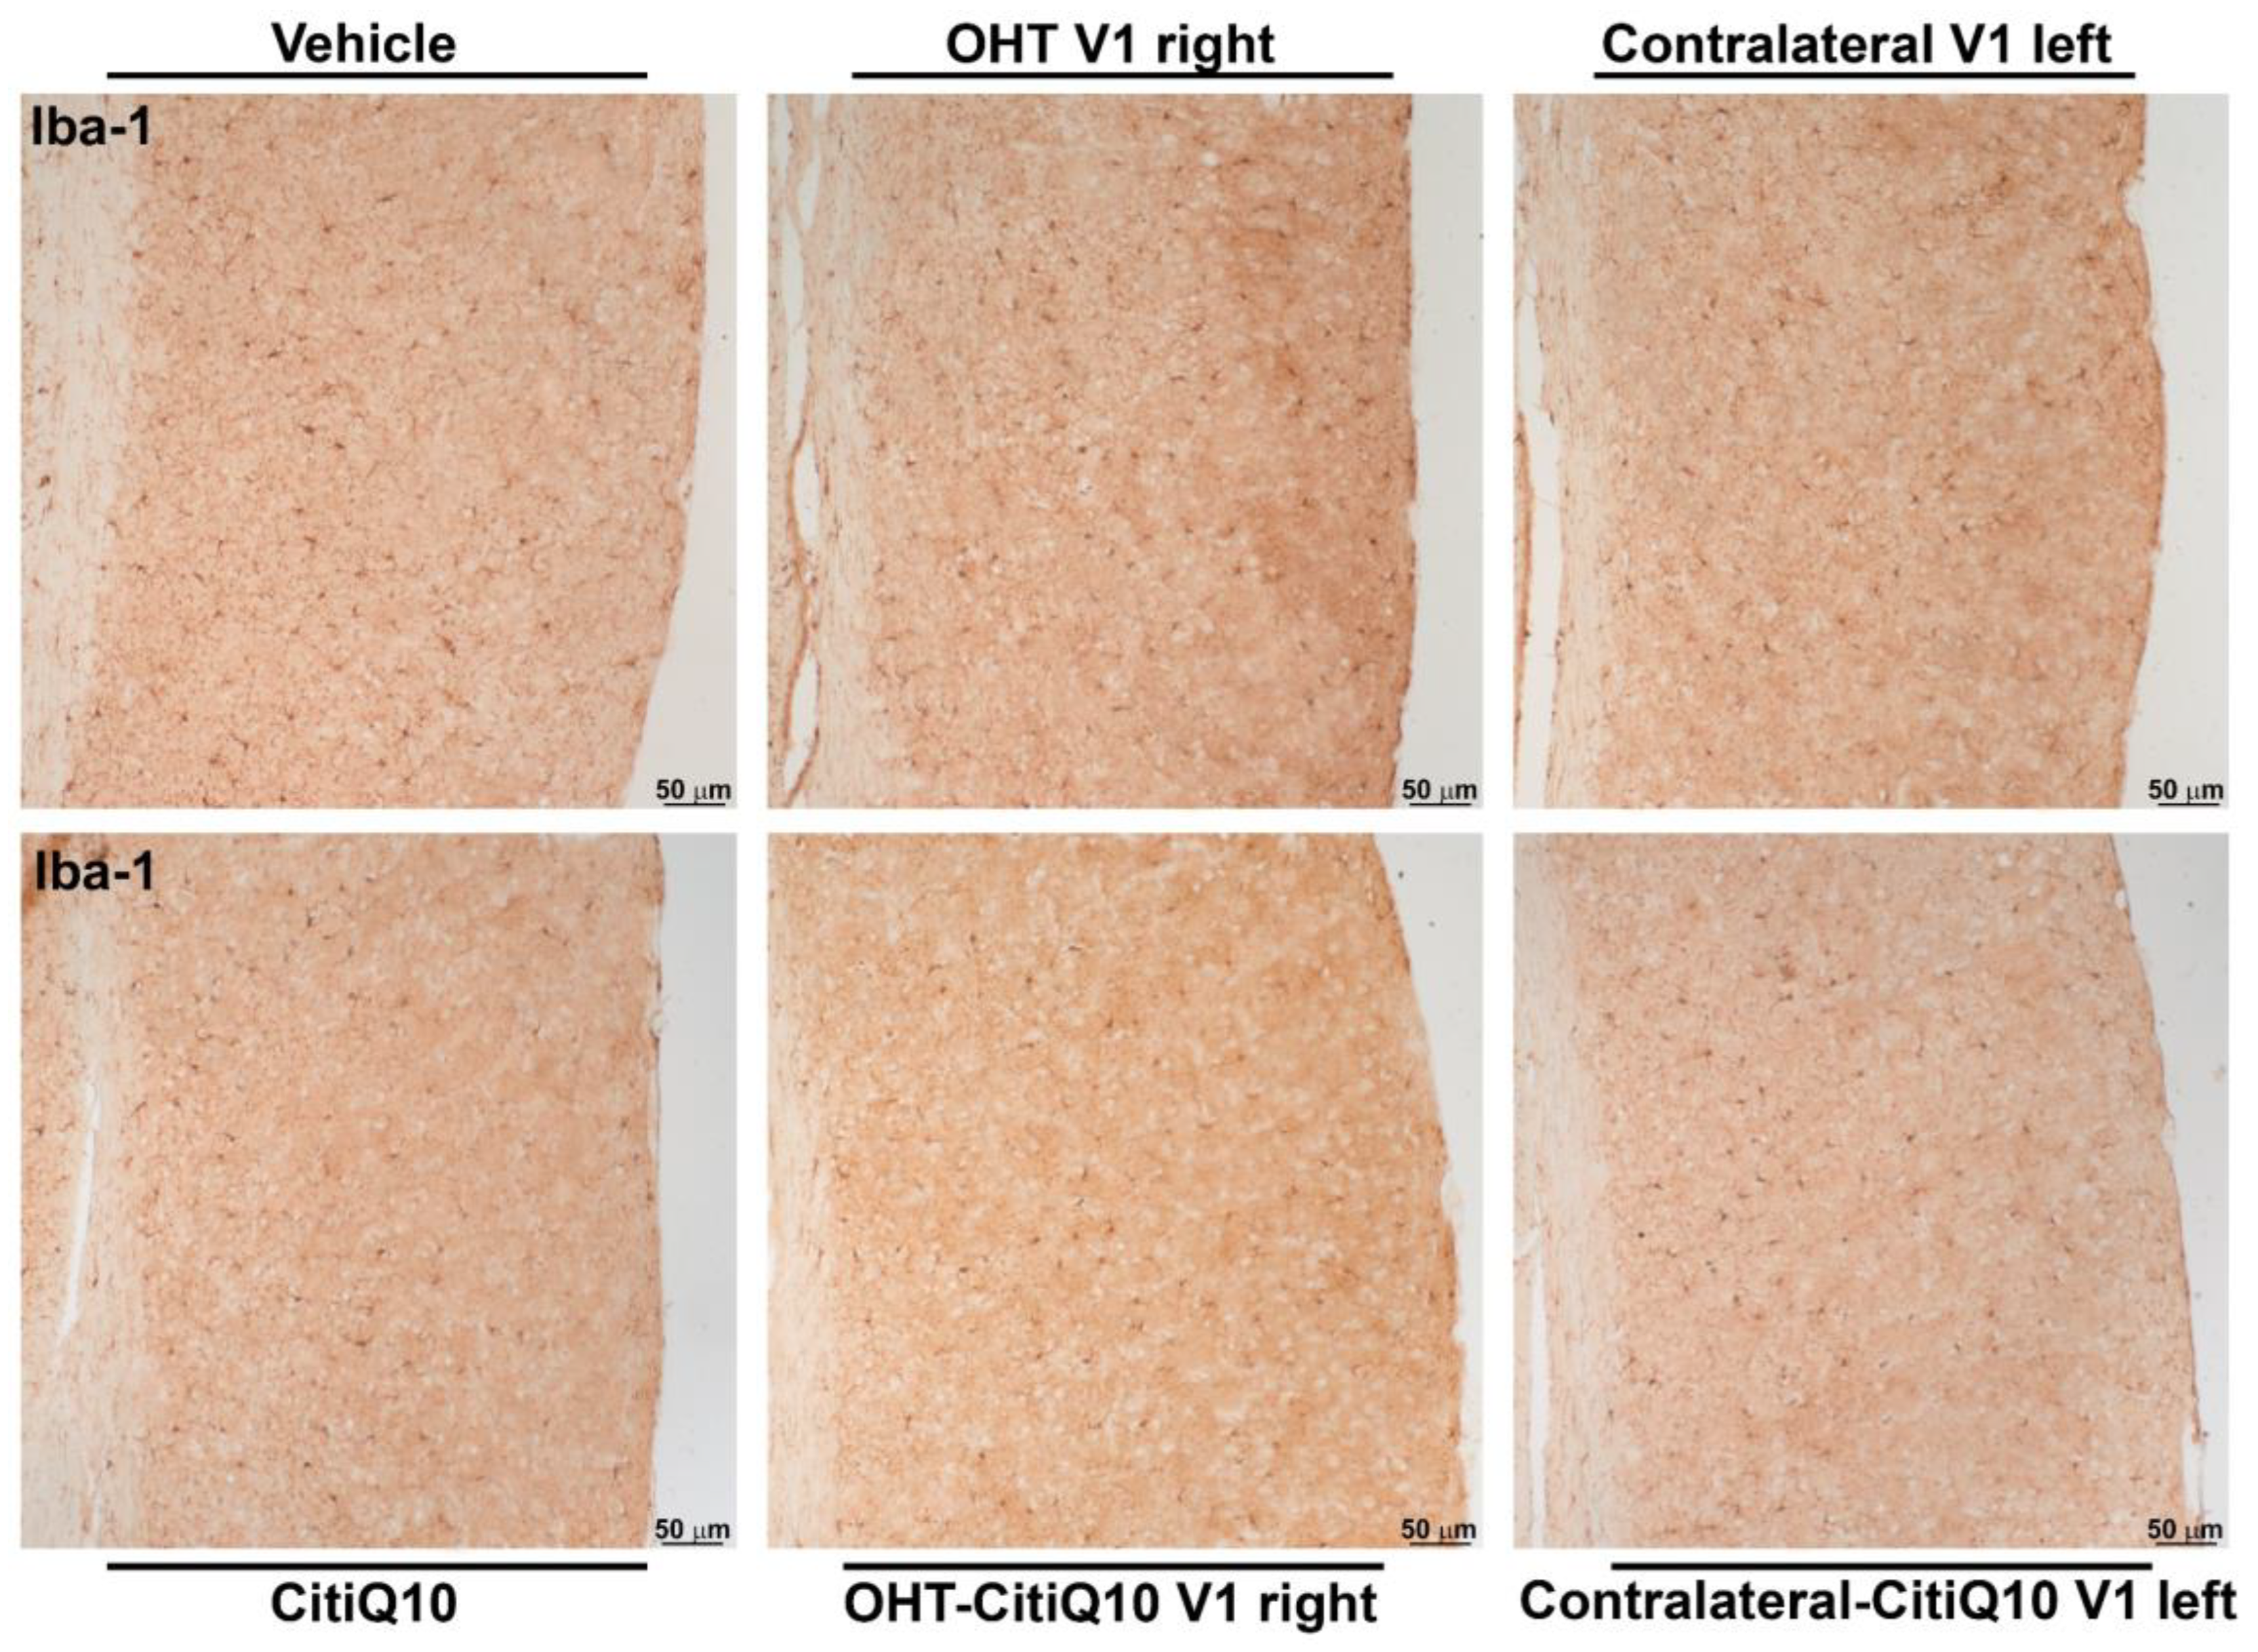
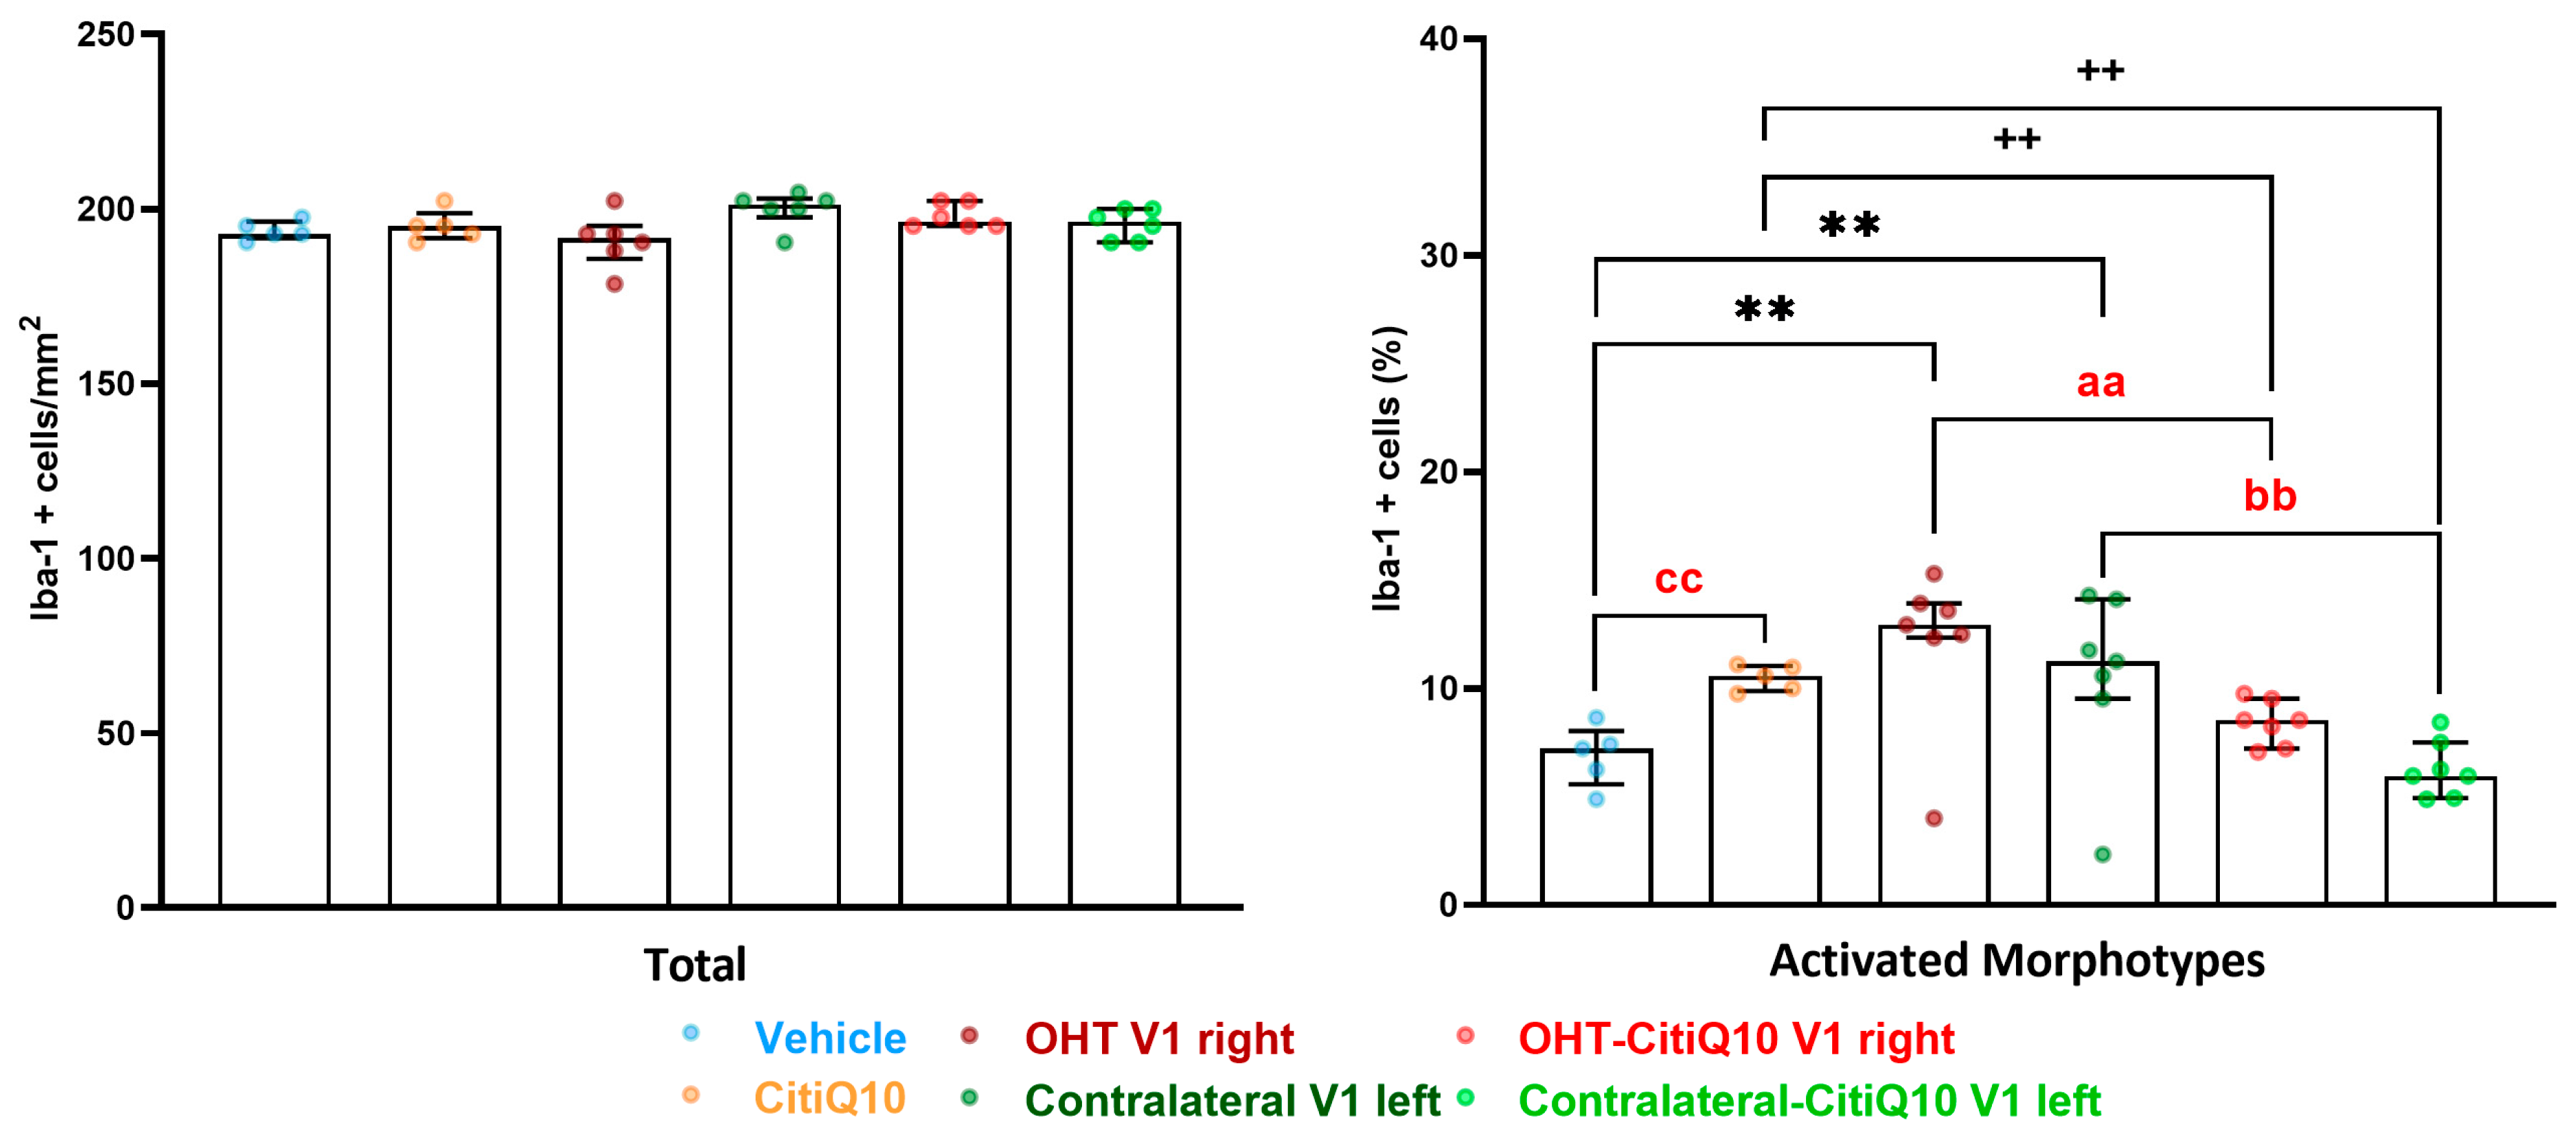
2.3.3. Visual Cortex (V1)
Iba-1+ Cells
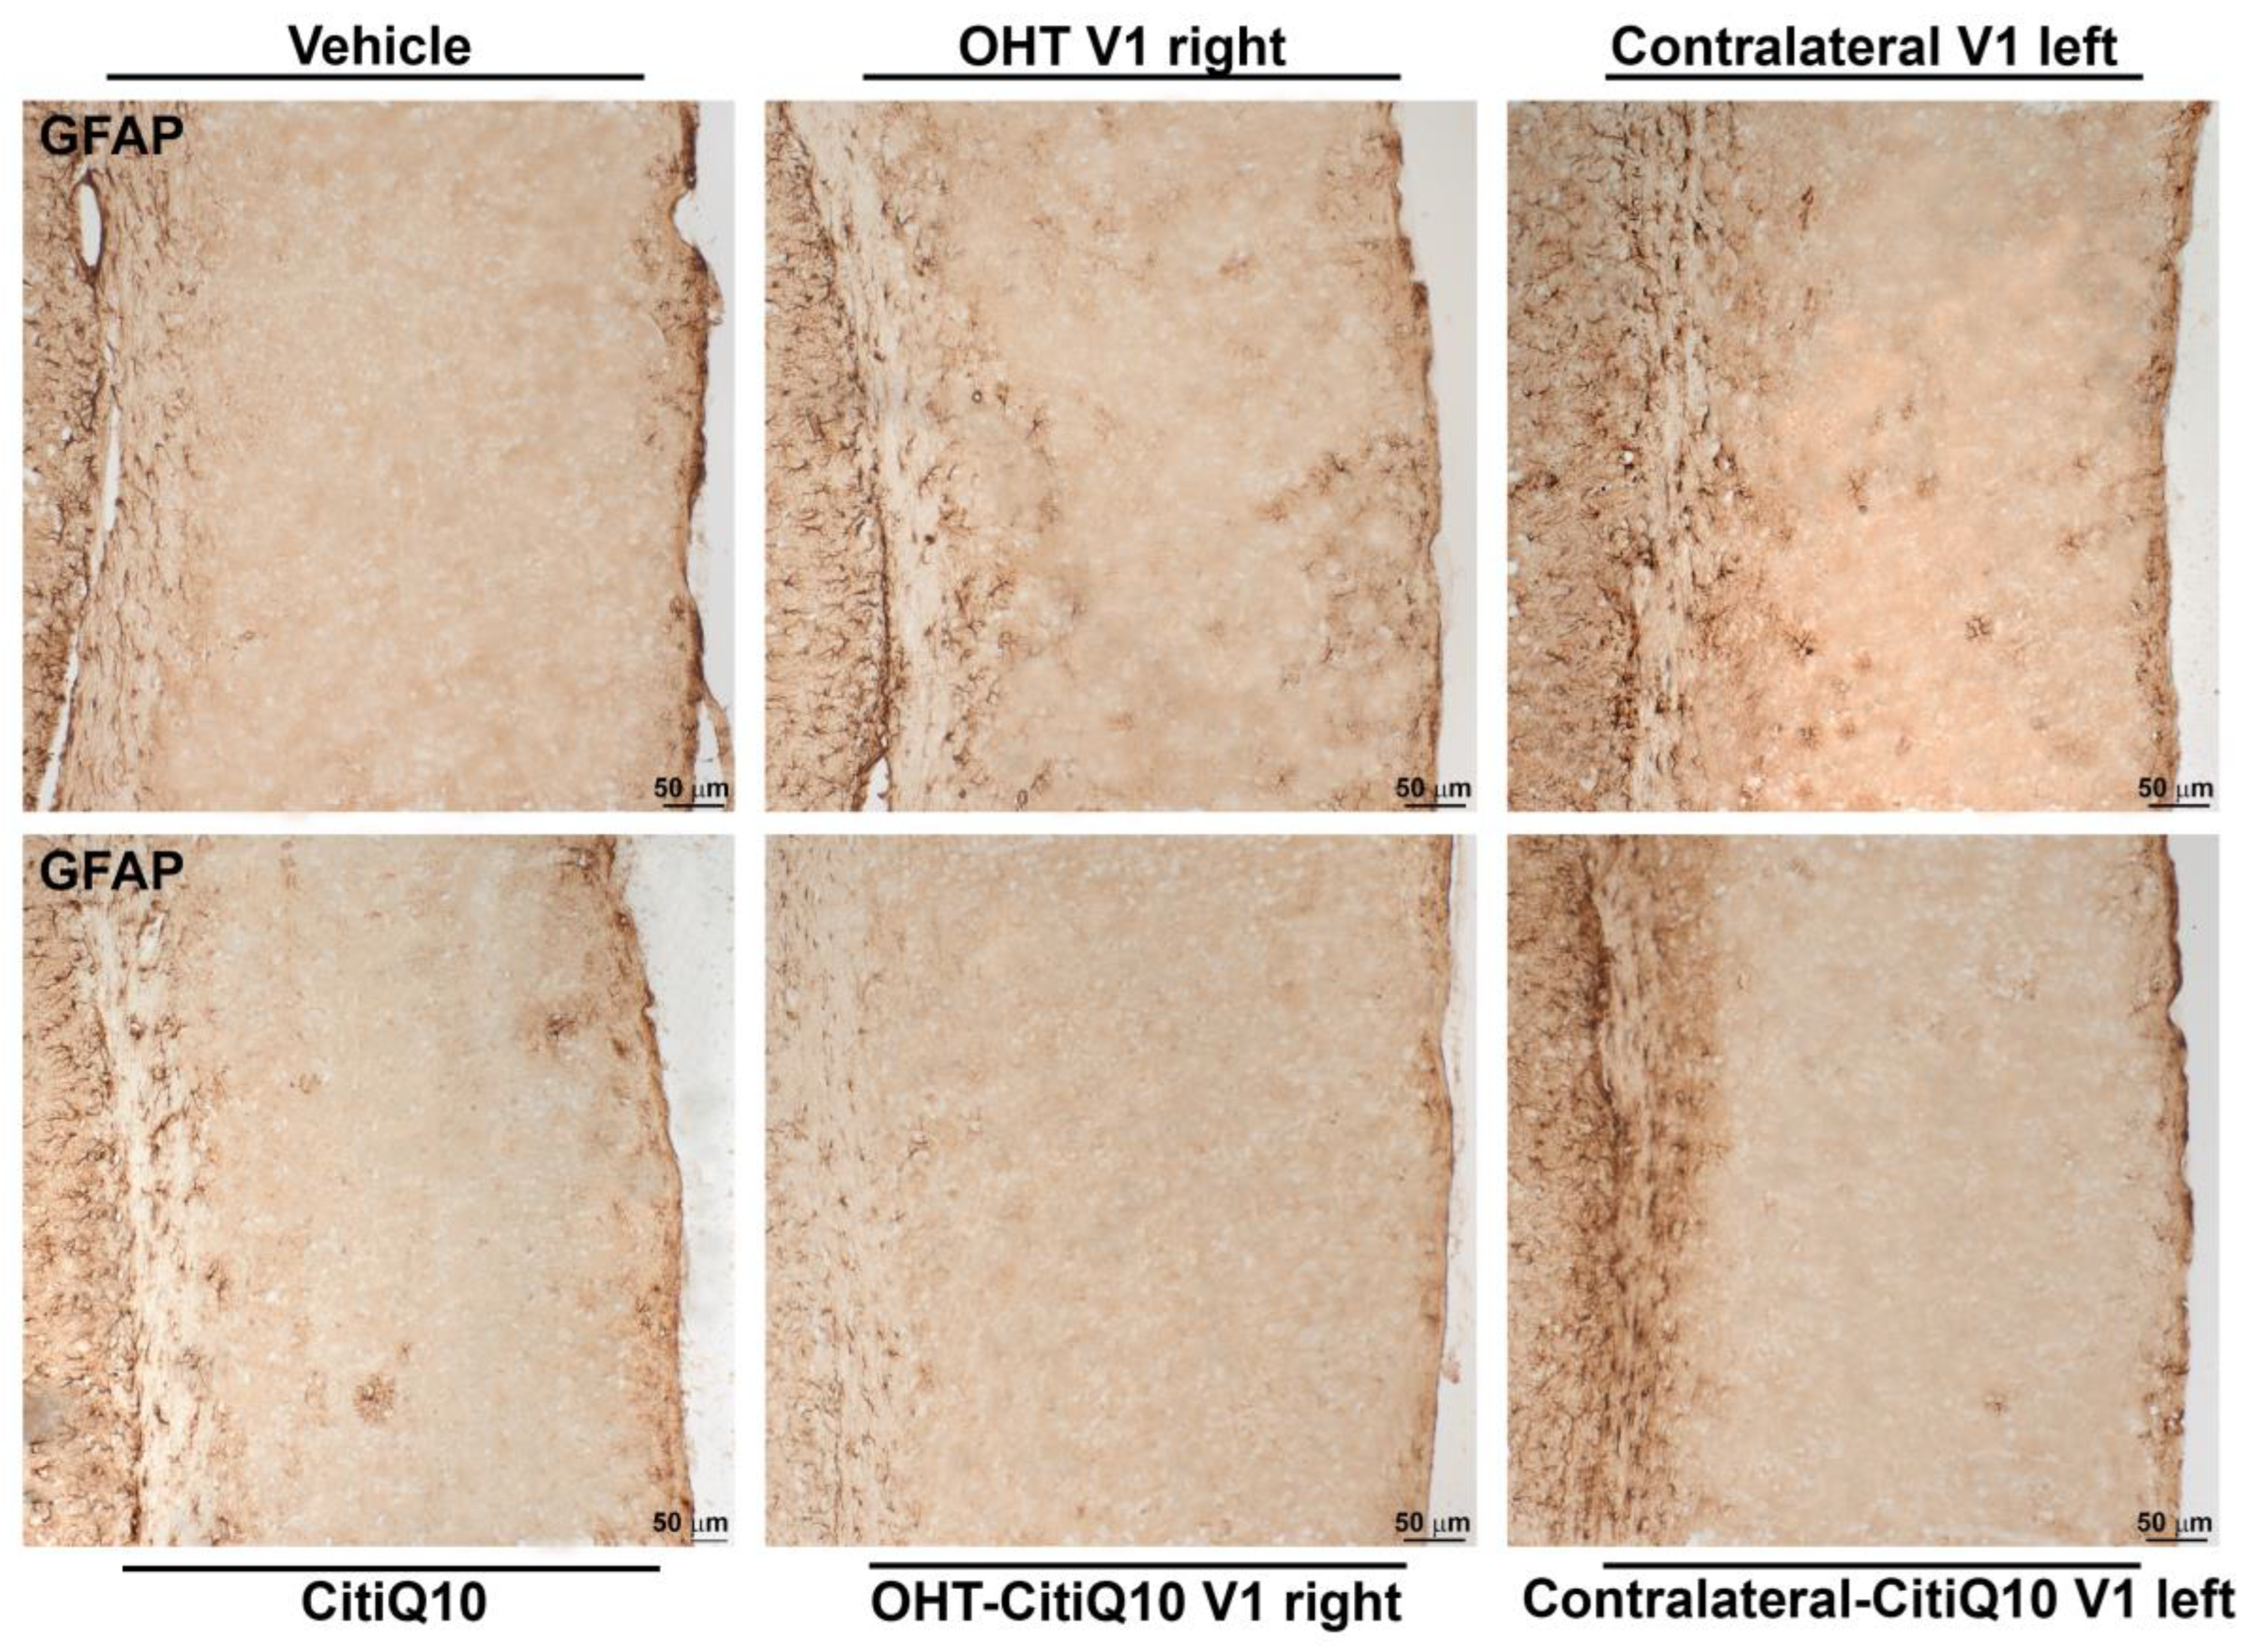
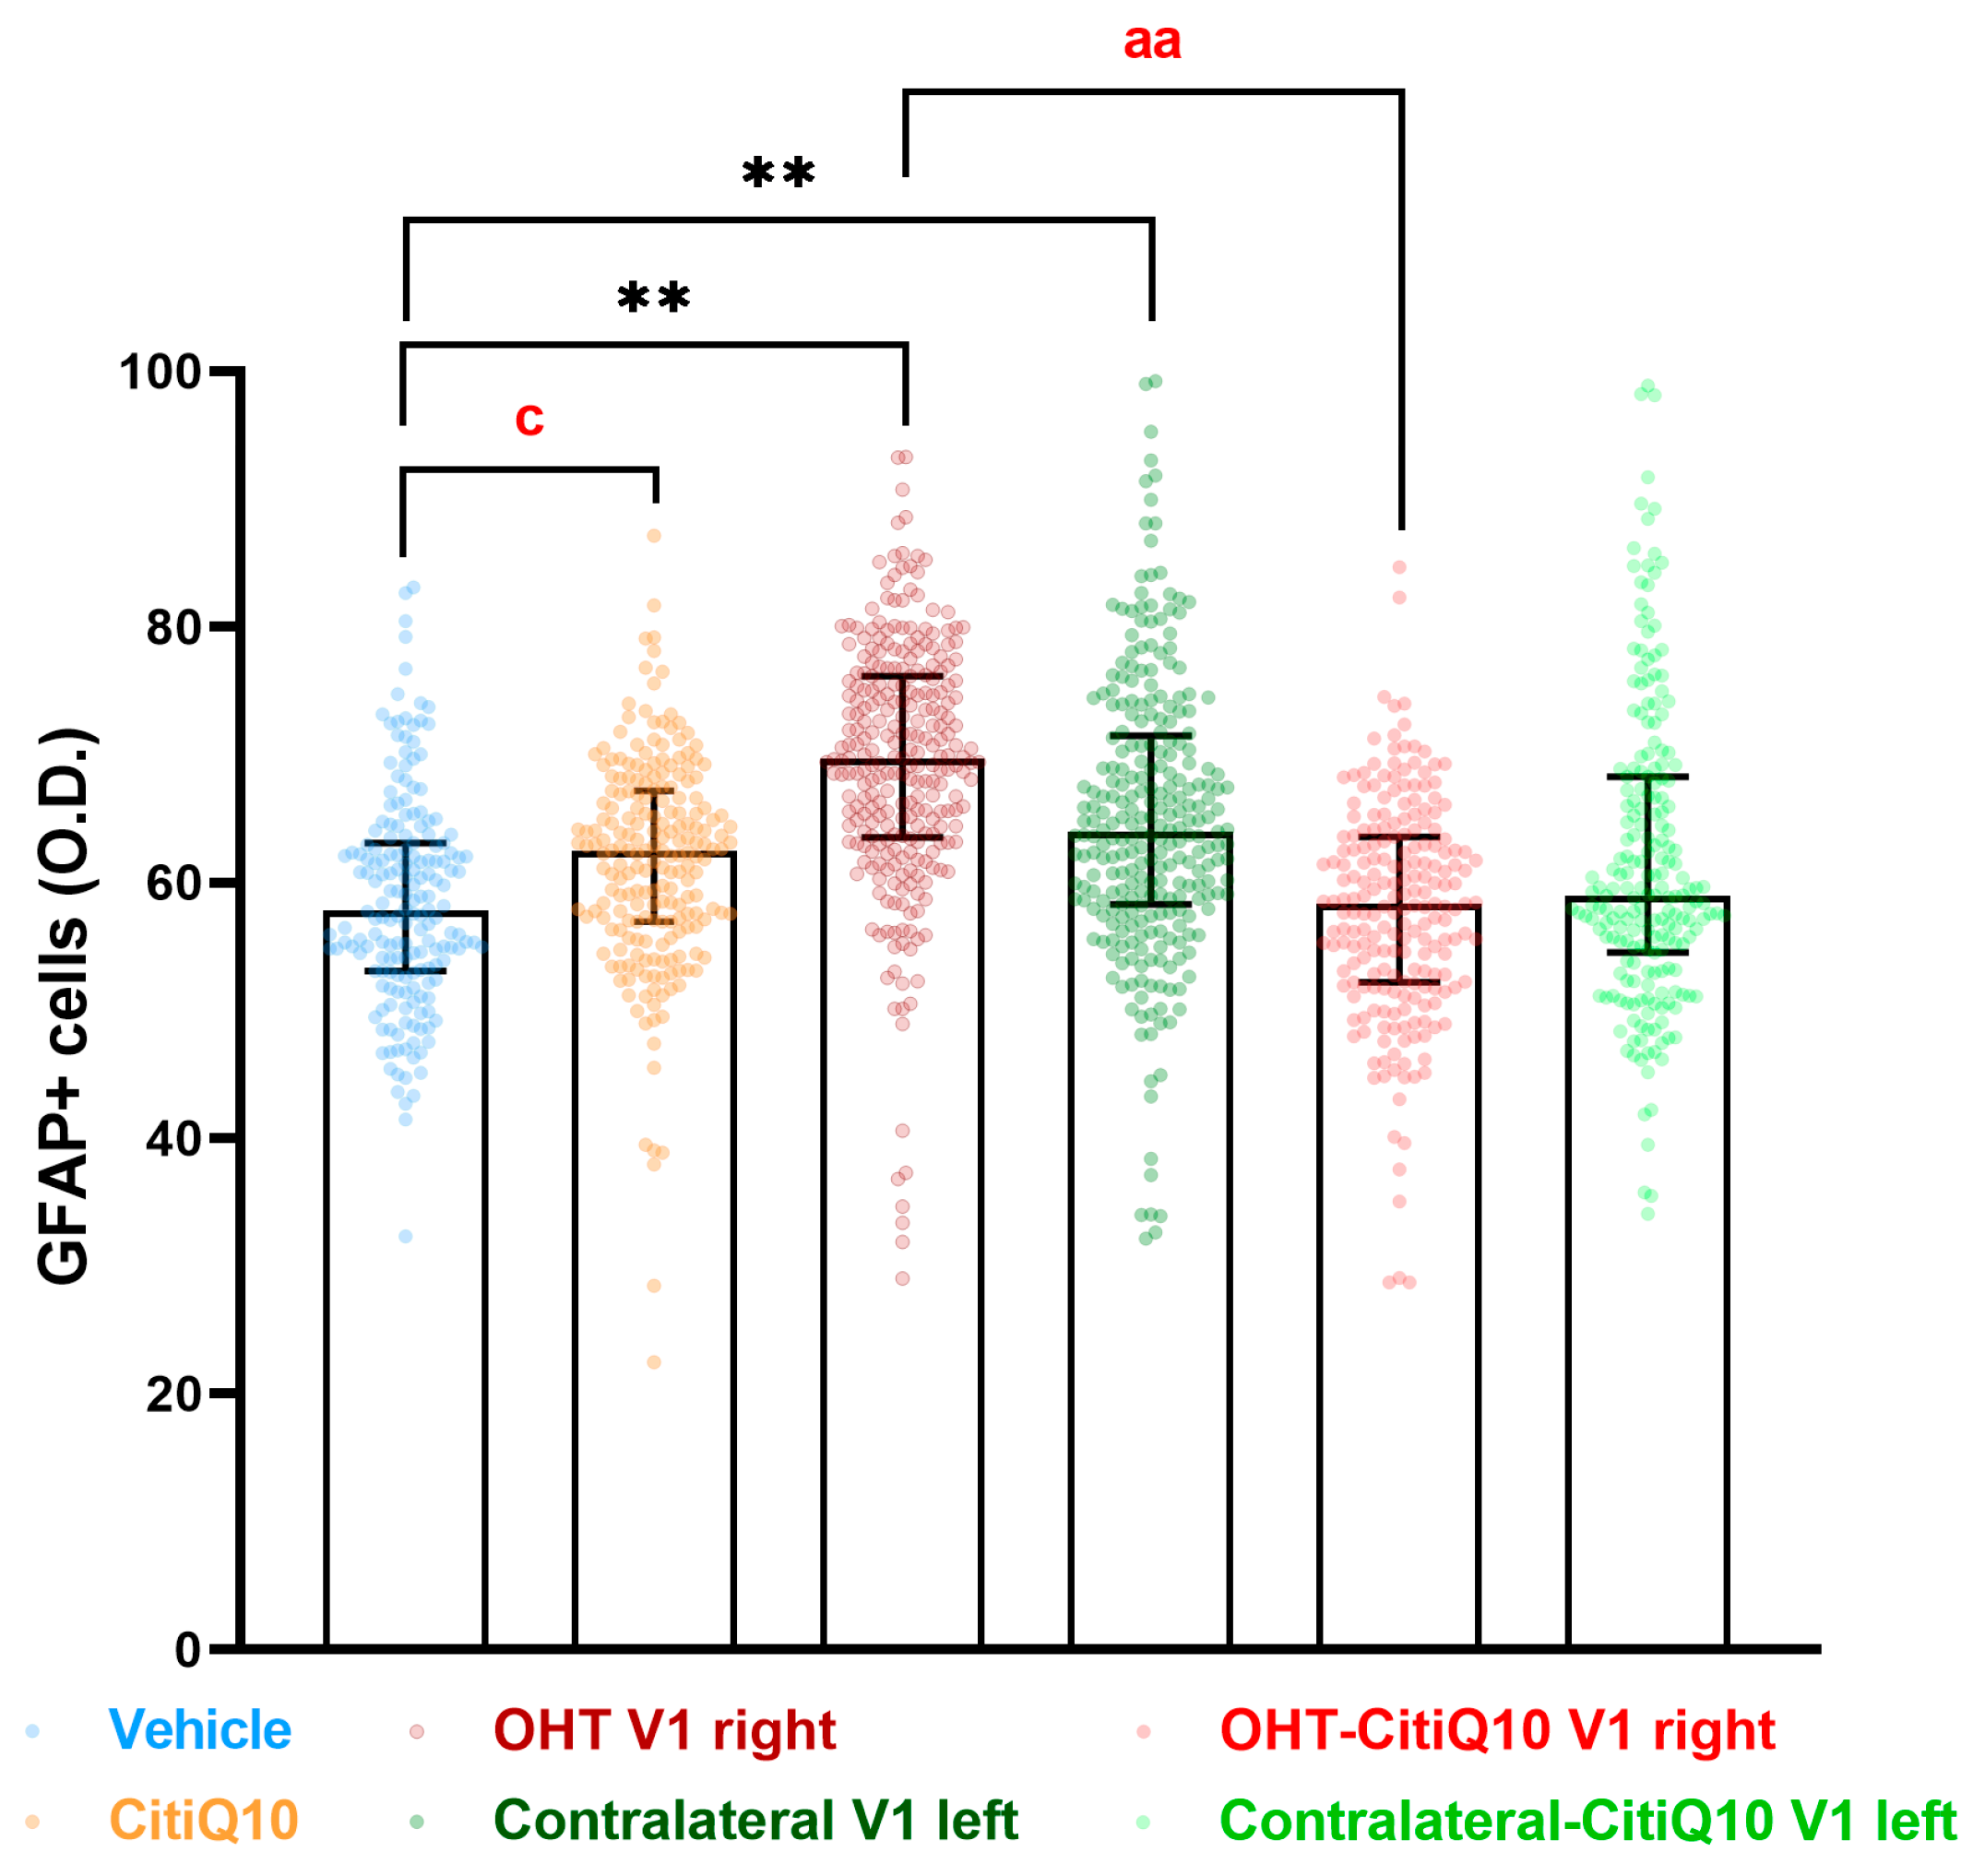
GFAP+ Cells
3. Discussion
4. Materials and Methods
4.1. Animals
4.2. Experimental Groups
4.3. Citicoline and CoQ10 Treatment
4.4. Anesthesia
4.5. Induction of Ocular Hypertension and IOP Measurement
4.6. Immunohistochemistry
4.6.1. Immunohistochemistry in Retinal Tissue
4.6.2. Immunohistochemistry in Visual Pathway Nuclei
4.7. Quantitative Analysis
4.7.1. Retina
Iba-1+ Cells
- Number of Iba-1+ cells in the OS
- Number of Iba-1+ cells in the OPL, IPL, and NFL-GCL
- Arbor area of Iba-1+ cells in the OPL and IPL
- Number of vertical processes of Iba-1+ cells connecting the OPL and OS
- Cell body area of Iba-1+ cells in the OPL, IPL, and NFL-GCL
Microglial P2RY12 Expression
GFAP+ Cells
4.7.2. Rest of the Visual Pathway
Iba-1+ Cells
GFAP+ Cells
4.8. Statistical Analysis
5. Conclusions
Author Contributions
Funding
Institutional Review Board Statement
Informed Consent Statement
Data Availability Statement
Acknowledgments
Conflicts of Interest
Abbreviations
| BAX | BCL-2-associated X protein |
| BCL-2 | B-cell lymphoma 2 |
| BDNF | Brain-derived neurotrophic factor |
| BRB | Blood retinal barrier |
| CD200R | CD200 receptor |
| dLGN | Dorsolateral geniculate nucleus |
| CNS | Central nervous system |
| CoQ10 | Coenzyme Q10 |
| CRLS1 | Cardiolipin synthase 1 |
| CXCR1 | CX3C chemokine receptor 1 |
| ERK | Extracellular signal regulated kinase |
| GFAP | Glial fibrillary acidic protein |
| GFAP-RA | Retinal area occupied by GFAP+ expression |
| GCL | Ganglion cell layer |
| H2O2 | Hydrogen peroxide |
| Iba 1-RA | Retinal area occupied by Iba-1+ expression |
| IL-1β | Interleukin 1 beta |
| IL-6 | Interleukin 6 |
| IL-8 | Interleukin 8 |
| IFN- γ | Interferon gamma |
| iNOS | Inducible nitric oxide synthase |
| IOP | Intraocular pressure |
| IPL | Inner plexiform layer |
| JAK2 | Janus kinase 2 |
| JNK | c-Jun N-terminal kinase |
| LGN | Lateral geniculate nucleus |
| MAPK | Mitogen-activated protein kinase |
| NF-κB | Nuclear factor kappa B |
| NFL | Never fiber layer |
| NLRP3 | NOD-like receptor family pyrin domain containing 3 |
| OHT | Ocular hypertension |
| OPL | Outer plexiform layer |
| OS | Outer segment |
| pERK | Phosphorylated ERK |
| PPAR- γ | Peroxisome proliferator-activated receptor gamma |
| P2RY12 | Purinergic receptor P2RY12 |
| P2RY12-RA | Retinal area occupied by P2RY12+ expression |
| RGCs | Retinal ganglion cells |
| ROS | Reactive oxygen species |
| SC | Superior colliculus |
| SD | Standard deviation |
| STAT3 | Signal transducer and activator of transcription 3 |
| SOD2 | Superoxide dismutase 2 |
| TNF-α | Tumor necrosis factor alpha |
| VEGF | Vascular endothelial growth factor |
| VP | Vertical processes |
| V1 | Primary visual cortex |
Appendix A. Estimation of the Size Effect in Statistically Significant Comparisons

| IOP | ||||||
|---|---|---|---|---|---|---|
| Vehicle vs. OHT | OHT vs. Contralateral | CitiQ10 vs. OHT-CitiQ10 | OHT-CitiQ10 vs. Contralateral-CitiQ10 | OHT vs. OHT-CitiQ10 | ||
| 24 h | Effect size |r| | 0.74 | 0.57 | 0.23 | 0.56 | 0.34 |
| CI (95%) | (15.00, 17.00) | (−17.00, −13.00) | (10.00, 12.00) | (−13.00, −9.00) | (−6.00, −2.00) | |
| p-value | <0.0001 | <0.0001 | <0.0001 | <0.0001 | 0.0006 | |
| 48 h | Effect size |r| | 0.74 | 0.56 | 0.74 | 0.58 | |
| CI (95%) | (12.00, 18.00) | (−19.00, −10.00) | (10.00, 13.00) | (−16.00, −10.00) | ||
| p-value | <0.0001 | <0.0001 | <0.0001 | <0.0001 | ||
| 3d | Effect size |r| | 0.92 | 0.56 | 0.9 | 0.56 | 0.31 |
| CI (95%) | (11.00, 16.00) | (−18.00, −8.00) | (5.00, 8.00) | (−11.00, −6.00) | (−8.00, −1.00) | |
| p-value | <0.0001 | <0.0001 | <0.0001 | <0.0001 | 0.0089 | |
| 5d | Effect size |r| | 0.95 | 0.95 | 0.73 | 0.96 | |
| CI (95%) | (5.00, 8.00) | (−11.00, −5.00) | (4.00, 16.00) | (−15.00, −3.00) | ||
| p-value | <0.0001 | 0.0005 | <0.0001 | 0.0001 | ||
| 7d | Effect size |r| | 0.3 | 0.95 | 0.23 | 0.96 | |
| CI (95%) | (2.00, 5.00) | (−15.00, −4.00) | (1.00, 3.00) | (−5.00, −2.00) | ||
| p-value | <0.0001 | 0.0005 | 0.0024 | 0.0002 | ||
| Iba-1+ Cells | |||||||||
|---|---|---|---|---|---|---|---|---|---|
| Vehicle vs. OHT | Vehicle vs. Contralateral | OHT vs. Contralateral | CitiQ10 vs. OHT-CitiQ10 | CitiQ10 vs. Contralateral-CitiQ10 | OHT-CitiQ10 vs. Contralateral-CitiQ10 | OHT vs. OHT-CitiQ10 | Contralateral vs. Contralateral-CitiQ10 | ||
| OS | Effect size |r| | 0.73 | 0.33 | 0.4 | 0.33 | 0.39 | 0.14 | ||
| CI (95%) | (7.00, 10.00) | (−11.00, −6.00) | (2.00, 4.00) | (−4.00, −1.00) | (−7.00, −4.00) | (−1.00, 0.00) | |||
| p-value | <0.0001 | <0.0001 | <0.0001 | <0.0001 | <0.0001 | 0.0177 | |||
| OPL | Effect size |r| | 0.72 | 0.34 | 0.79 | 0.35 | 0.35 | 0.14 | ||
| CI (95%) | (17.00, 21.00) | (−26.00, −22.00) | (16.00, 19.00) | (−4.00, −2.00) | (−23.00, −19.00) | (−5.00, 0.00) | |||
| p-value | <0.0001 | <0.0001 | <0.0001 | <0.0001 | <0.0001 | 0.0279 | |||
| IPL | Effect size |r| | 0.86 | 0.22 | 0.34 | 0.84 | 0.14 | 0.33 | 0.34 | |
| CI (95%) | (34.00, 37.00) | (−3.00, −1.00) | (−40.00, −35.00) | (25.00, 29.00) | (−2.00, 0.00) | (−30.00, −26.00) | (−12.00, −7.00) | ||
| p-value | <0.0001 | 0.0008 | <0.0001 | <0.0001 | 0.0201 | <0.0001 | <0.0001 | ||
| Iba-1+ RA- NFL-GCL | |||||||||
|---|---|---|---|---|---|---|---|---|---|
| Vehicle vs. CitiQ10 | Vehicle vs. OHT | Vehicle vs. Contralateral | OHT vs. Contralateral | CitiQ10 vs. OHT-CitiQ10 | CitiQ10 vs. Contralateral-CitiQ10 | OHT-CitiQ10 vs. Contralateral-CitiQ10 | OHT vs. OHT-CitiQ10 | Contralateral vs. Contralateral-CitiQ10 | |
| Effect size |r| | 0.18 | 0.86 | 0.18 | 0.34 | 0.86 | 0.19 | 0.36 | 0.75 | 0.22 |
| CI (95%) | (−1324, −230.3) | (30,482, 34,480) | (310.4, 1618) | (−34,390, −29,284) | (16,279, 18,092) | (255.8, 1309) | (−18,272, −15,566) | (−18,798, −14,635) | (−1549, −441.0) |
| p-value | 0.0048 | <0.0001 | 0.0034 | <0.0001 | <0.0001 | 0.0034 | <0.0001 | <0.0001 | 0.0006 |
| Iba-1+ Arbor Area | |||||||
|---|---|---|---|---|---|---|---|
| Vehicle vs. OHT | OHT vs. Contralateral | CitiQ10 vs. OHT-CitiQ10 | CitiQ10 vs. Contralateral-CitiQ10 | OHT-CitiQ10 vs. Contralateral-CitiQ10 | OHT vs. OHT-CitiQ10 | ||
| OPL | Effect size |r| | 0.81 | 0.26 | 0.76 | 0.1 | 0.26 | 0.47 |
| CI (95%) | (−3350, −2989) | (−2922, 3703) | (−2770, −2441) | (−523.6, −12.93) | (2039, 2544) | (587,4, 771,1) | |
| p-value | <0.0001 | <0.0001 | <0.0001 | 0.0395 | <0.0001 | <0.0001 | |
| IPL | Effect size |r| | 0.7 | 0.33 | 0.71 | 0.31 | 0.51 | |
| CI (95%) | (−4853, −4216) | (4005, 4628) | (−3808, −3295) | (−3066, 3782) | (514.0, 664.4) | ||
| p-value | <0.0001 | <0.0001 | <0.0001 | <0.0001 | <0.0001 | ||
| Iba-1+ Cell Body Area | ||||||||||
|---|---|---|---|---|---|---|---|---|---|---|
| Vehicle vs. CitiQ10 | Vehicle vs. OHT | Vehicle vs. Contralateral | OHT vs. Contralateral | CitiQ10 vs. OHT-CitiQ10 | CitiQ10 vs. Contralateral-CitiQ10 | OHT-CitiQ10 vs. Contralateral-CitiQ10 | OHT vs. OHT-CitiQ10 | Contralateral vs. Contralateral-CitiQ10 | ||
| OPL | Effect size |r| | 0.44 | 0.85 | 0.46 | 0.77 | 0.46 | 0.79 | 0.37 | ||
| CI (95%) | (−20.35, −9.997) | (72.45, 98.21) | (−99.40, −74.46) | (35.14, 45.45) | (−44.06, −33.44) | (−73.27, −48.23) | (−15.15, −6.235) | |||
| p-value | <0.0001 | <0.0001 | <0.0001 | <0.0001 | <0.0001 | <0.0001 | <0.0001 | |||
| IPL | Effect size |r| | 0.5 | 0.85 | 0.3 | 0.46 | 0.73 | 0.29 | 0.46 | 0.83 | |
| CI (95%) | (−22.83, −11.80) | (86.10, 108.40) | (−1.085, −0.5668) | (−116.9, −94.04) | (27.98, 38.88) | (3.659, 11.85) | (−34.27, −21.33) | (−92.19, −71.06) | ||
| p-value | <0.0001 | <0.0001 | 0.0313 | <0.0001 | <0.0001 | 0.0004 | <0.0001 | <0.0001 | ||
| GCL-NFL | Effect size |r| | 0.22 | 0.86 | 0.2 | 0.46 | 0.75 | 0.43 | 0.47 | 0.8 | |
| CI (95%) | (−11.59, −1.340) | (140.9, 179.3) | (1.082, 11.59) | (−180.0, −130.7) | (37.15, 52.71) | (9.224, 18.50) | (−41.12, −23.45) | (−143.5, −105.8) | ||
| p-value | 0.0114 | <0.0001 | 0.0208 | <0.0001 | <0.0001 | <0.0001 | <0.0001 | <0.0001 | ||
| VP | |||||||
|---|---|---|---|---|---|---|---|
| Vehicle vs. OHT | Vehicle vs. Contralateral | OHT vs. Contralateral | CitiQ10 vs. OHT-CitiQ10 | CitiQ10 vs. Contralateral-CitiQ10 | OHT vs. OHT-CitiQ10 | Contralateral vs. Contralateral-CitiQ10 | |
| Effect size |r| | 0.35 | 0.84 | 0.79 | 0.71 | 0.32 | 0.42 | 0.71 |
| CI (95%) | (0.00, 4.00) | (14.00, 32.00) | (9.00, 33.00) | (4.00, 7.00) | (0.00, 6.00) | (1.00, 5.00) | (−28.00, −13.00) |
| p-value | 0.0186 | <0.0001 | <0.0001 | <0.0001 | 0.0271 | 0.0027 | <0.0001 |
| P2RY12-RA | ||||
|---|---|---|---|---|
| Vehicle vs. OHT | OHT vs. Contralateral | CitiQ10 vs. Contralateral-CitiQ10 | OHT vs. OHT-CitiQ10 | |
| Effect size |r| | 0.84 | 0.84 | 0.32 | 0.07 |
| CI (95%) | (−99.47, −68.19) | (−4949, 8372) | (−3054, −133.7) | (−3514, 7536) |
| p-value | <0.0001 | <0.0001 | 0.0287 | <0.0001 |
| GFAP-RA | |||||||||
|---|---|---|---|---|---|---|---|---|---|
| Vehicle vs. CitiQ10 | Vehicle vs. OHT | Vehicle vs. Contralateral | OHT vs. Contralateral | CitiQ10 vs. OHT-CitiQ10 | CitiQ10 vs. Contralateral-CitiQ10 | OHT-CitiQ10 vs. Contralateral-CitiQ10 | OHT vs. OHT-CitiQ10 | Contralateral vs. Contralateral-CitiQ10 | |
| Effect size |r| | 0.25 | 0.86 | 0.64 | 0.33 | 0.76 | 0.41 | 0.36 | 0.76 | 0.8 |
| CI (95%) | (2302, 6988) | (66.101, 72.030) | (14.569, 20.288) | (−52.951,−45.181) | (19.824, 26,605) | (5701, 9918) | (−20.014, −8946) | (−44.106, −36.074) | (−7687,−2113) |
| p-value | 0.0001 | <0.0001 | <0.0001 | <0.0001 | <0.0001 | <0.0001 | <0.0001 | <0.0001 | 0.0005 |
| Iba-1 dLGN | ||||||
|---|---|---|---|---|---|---|
| Vehicle vs. OHT dLGN Right | Vehicle vs. Contralateral dLGN Left | CitiQ10 vs. OHT-CitiQ10 dLGN Right | OHT dLGN Right vs. OHT-CitiQ10 dLGN Right | Contralateral dLGN Left vs. Contralateral-CitiQ10 dLGN Left | ||
| Total | Effect size |r| | 0.03 | ||||
| CI (95%) | (−6.12, −3.88) | |||||
| p-value | 0.0319 | |||||
| Actived morphotypes | Effect size |r| | 0.81 | 0.81 | 0.77 | 0.83 | 0.83 |
| CI (95%) | (16.38, 18.62) | (7.44, 9.68) | (4.47, 6.71) | (−12.79, −10.31) | (−7.65, −5.17) | |
| p-value | 0.002 | 0.002 | 0.003 | 0.008 | 0.008 | |
| GFAP dLGN | |||||
|---|---|---|---|---|---|
| Vehicle vs. CitiQ10 | Vehicle vs. OHT dLGN Right | Vehicle vs. Contralateral dLGN Left | CitiQ10 vs. Contralateral-CitiQ10 dLGN Left | ||
| Total | Effect size |r| | 0.66 | 0.81 | 0.77 | |
| CI (95%) | (2.261, 11.34) | (10.11, 33.04) | (8.138, 22.21) | ||
| p-value | 0.007 | 0.0016 | 0.0031 | ||
| Peripheral | Effect size |r| | 0.86 | 0.78 | 0.86 | 0.72 |
| CI (95%) | (1.053, 11.27) | (2.712, 31.09) | (8.245, 5.35) | (1.829, 26.67) | |
| p-value | 0.007 | 0.0295 | 0.0031 | 0.0295 | |
| Central | Effect size |r| | 0.86 | 0.85 | 0.83 | |
| CI (95%) | (1.285, 12.23) | (8.981, 33.67) | (7.240, 21.85) | ||
| p-value | 0.0148 | 0.0016 | 0.0031 | ||
| Iba-1 SC | |||||||
|---|---|---|---|---|---|---|---|
| Vehicle vs. OHT SC Right | Vehicle vs. Contralateral SC Left | Citiq10 Vs. OHT-Citiq10 SC Right | CitiQ10 vs. Contralateral-CitiQ10 SC Left | OHT SC Right vs. OHT-CitiQ10 SC Right | Contralateral SC Left vs. Contralateral-CitiQ10 SC Left | ||
| Total | Effect size |r| | 0.83 | 0.83 | ||||
| CI (95%) | (3.76, 6.24) | (6.76, 9.24) | |||||
| p-value | 0.008 | 0.008 | |||||
| Active morphotypes | Effect size |r| | 0.83 | 0.83 | 0.83 | 0.76 | 0.83 | 0.79 |
| CI (95%) | (15.91, 18.39) | (2.84, 5.32) | (10.00, 12.48) | (0.42, 2.90) | (−6.95,−4.47) | (−3.46, −0.982) | |
| p-value | 0.008 | 0.008 | 0.008 | 0.016 | 0.008 | 0.16 | |
| GFAP SC | ||||||
|---|---|---|---|---|---|---|
| Vehicle vs. CitiQ10 | Vehicle vs. OHT SC Right | Vehicle vs. Contralateral SC Left | CitiQ10 vs. OHT-CitiQ10 SC Right | CitiQ10 vs. Contralateral-CitiQ10 SC Left | OHT SC Right vs. OHT-CitiQ10 SC Right | |
| Effect size |r| | 0.86 | 0.86 | 0.86 | 0.86 | 0.86 | 0.86 |
| CI (95%) | (2.268, 8.687) | (25.22, 31.70) | (7.253, 15.11) | (6.838, 16.01) | (2.291, 5.732) | (−16.99, −5.265) |
| p-value | 0.0007 | 0.001 | 0.001 | 0.0025 | 0.0303 | 0.0079 |
| Iba-1 V1 | ||||||||
|---|---|---|---|---|---|---|---|---|
| Vehicle vs. CitiQ10 | Vehicle vs. OHT V1 Right | Vehicle vs. Contralateral V1 Left | CitiQ10 vs. OHT-CitiQ10 V1 Right | CitiQ10 vs. Contralateral-CitiQ10 V1 Left | OHT V1 Right vs. OHT-CitiQ10 V1 Right | Contralateral V1 Left vs. Contralateral-CitiQ10 V1 Left | ||
| Active morphotypes | Effect size |r| | 0.83 | 0.83 | 0.83 | 0.83 | 0.83 | 0.83 | 0.83 |
| CI (95%) | (2.33, 4.81) | (5.35, 7.83) | (3.53, 6.01) | (−3.29, −0.81) | (−5.58, −3.10) | (−6.45, −3.97) | (−7.05, −4.57) | |
| p-value | 0.008 | 0.008 | 0.008 | 0.008 | 0.008 | 0.008 | 0.008 | |
| GFAP V1 | ||||
|---|---|---|---|---|
| Vehicle vs. CitiQ10 | Vehicle vs. OHT V1 Right | Vehicle vs. Contralateral V1 Left | OHT V1 Right vs. OHT-CitiQ10 V1 Right | |
| Effect size |r| | 0.86 | 0.85 | 0.85 | 0.83 |
| CI (95%) | (0.2333, 6.494) | (6.274, 15.54) | (1.799, 11.04) | (−19.06, −5.650) |
| p-value | 0.0221 | 0.0043 | 0.0043 | 0.0079 |
References
- Tham, Y.C.; Li, X.; Wong, T.Y.; Quigley, H.A.; Aung, T.; Cheng, C.Y. Global Prevalence of Glaucoma and Projections of Glaucoma Burden through 2040: A Systematic Review and Meta-Analysis. Ophthalmology 2014, 121, 2081–2090. [Google Scholar] [CrossRef] [PubMed]
- Quigley, H.; Broman, A.T. The Number of People with Glaucoma Worldwide in 2010 and 2020. Br. J. Ophthalmol. 2006, 90, 262–267. [Google Scholar] [CrossRef]
- Chen, H.; Zhao, Y.; Liu, M.; Feng, L.; Zhen, P.; Yi, J.; Liang, P.; Zhang, H.F.; Cang, J.; Troy, J.B.; et al. Progressive Degeneration of Retinal and Superior Collicular Functions in Mice with Sustained Ocular Hypertension. Investig. Ophthalmol. Vis. Sci. 2015, 56, 1971–1984. [Google Scholar] [CrossRef]
- Parisi, V.; Parisi, V. Neural Conduction in the Visual Pathways in Ocular Hypertension and Glaucoma. Graefes Arch. Clin. Exp. Ophthalmol. 1997, 235, 136–142. [Google Scholar] [CrossRef] [PubMed]
- Sapienza, A.; Raveu, A.-L.; Reboussin, E.; Roubeix, C.; Boucher, C.; Dégardin, J.; Godefroy, D.; Rostène, W.; Goazigo, A.R.-L.; Baudouin, C.; et al. Bilateral Neuroinflammatory Processes in Visual Pathways Induced by Unilateral Ocular Hypertension in the Rat. J. Neuroinflamm. 2016, 13, 44. [Google Scholar] [CrossRef]
- Jassim, A.H.; Nsiah, N.Y.; Inman, D.M. Ocular Hypertension Results in Hypoxia within Glia and Neurons throughout the Visual Projection. Antioxidants 2022, 11, 888. [Google Scholar] [CrossRef]
- Matamoros, J.A.; Rubio-Casado, S.; Fernández-Albarral, J.A.; Martínez-López, M.A.; Salobrar-García, E.; Marco, E.M.; Paleo-García, V.; de Hoz, R.; López-Cuenca, I.; Elvira-Hurtado, L.; et al. Neuroprotective Effect of the Combination of Citicoline and CoQ10 in a Mouse Model of Ocular Hypertension. Antioxidants 2025, 14, 4. [Google Scholar] [CrossRef] [PubMed]
- Gupta, N.; Ang, L.C.; De Tilly, L.N.; Bidaisee, L.; Yücel, Y.H. Human Glaucoma and Neural Degeneration in Intracranial Optic Nerve, Lateral Geniculate Nucleus, and Visual Cortex. Br. J. Ophthalmol. 2006, 90, 674–678. [Google Scholar] [CrossRef]
- Qu, J.; Wang, D.; Grosskreutz, C.L. Mechanisms of Retinal Ganglion Cell Injury and Defense in Glaucoma. Exp. Eye Res. 2010, 91, 48–53. [Google Scholar] [CrossRef]
- Baltmr, A.; Duggan, J.; Nizari, S.; Salt, T.E.; Cordeiro, M.F. Neuroprotection in Glaucoma—Is There a Future Role? Exp. Eye Res. 2010, 91, 554–566. [Google Scholar] [CrossRef]
- Tezel, G.; Ben-Hur, T.; Gibson, G.E.; Stevens, B.; Streit, W.J.; Wekerle, H.; Bhattacharya, S.K.; Borras, T.; Burgoyne, C.F.; Caspi, R.R.; et al. The Role of Glia, Mitochondria, and the Immune System in Glaucoma. Investig. Ophthalmol. Vis. Sci. 2009, 50, 1001–1012. [Google Scholar] [CrossRef]
- Ramírez, A.I.; Rojas, B.; de Hoz, R.; Salazar, J.J.; Gallego, B.I.; Triviño, A.; Ramírez, J.M. Microglia, Inflammation, and Glaucoma. In Glaucoma; SM Group Open Access eBooks: Dover, UK, 2015; pp. 1–16. [Google Scholar]
- de Hoz, R.; Rojas, B.; Ramírez, A.I.; Salazar, J.J.; Gallego, B.I.; Triviño, A.; Ramírez, J.M. Retinal Macroglial Responses in Health and Disease. BioMed Res. Int. 2016, 2016, 2954721. [Google Scholar] [CrossRef] [PubMed]
- Fernández-Albarral, J.A.; Ramírez, A.I.; de Hoz, R.; Matamoros, J.A.; Salobrar-García, E.; Elvira-Hurtado, L.; López-Cuenca, I.; Sánchez-Puebla, L.; Salazar, J.J.; Ramírez, J.M. Glaucoma: From Pathogenic Mechanisms to Retinal Glial Cell Response to Damage. Front. Cell. Neurosci. 2024, 18, 1354569. [Google Scholar] [CrossRef]
- Gallego, B.I.; Salazar, J.J.; de Hoz, R.; Rojas, B.; Ramírez, A.I.; Salinas-Navarro, M.; Ortín-Martínez, A.; Valiente-Soriano, F.J.; Avilés-Trigueros, M.; Villegas-Perez, M.P.; et al. IOP Induces Upregulation of GFAP and MHC-II and Microglia Reactivity in Mice Retina Contralateral to Experimental Glaucoma. J. Neuroinflamm. 2012, 9, 92. [Google Scholar] [CrossRef]
- Martínez-López, M.A.; Rubio-Casado, S.; Felipe, D.S.; Martín-Sánchez, B.; Fernández-Albarral, J.A.; Salobrar-García, E.; Matamoros, J.A.; Ramírez, J.M.; Hoz, R.; de Salazar, J.J.; et al. Cilastatin as a Potential Anti-Inflammatory and Neuroprotective Treatment in the Management of Glaucoma. Int. J. Mol. Sci. 2024, 25, 3115. [Google Scholar] [CrossRef]
- Ebneter, A.; Casson, R.J.; Wood, J.P.M.; Chidlow, G. Microglial Activation in the Visual Pathway in Experimental Glaucoma: Spatiotemporal Characterization and Correlation with Axonal Injury. Investig. Ophthalmol. Vis. Sci. 2010, 51, 6448–6460. [Google Scholar] [CrossRef] [PubMed]
- de Hoz, R.; Ramírez, A.I.; González-Martín, R.; Ajoy, D.; Rojas, B.; Salobrar-García, E.; Valiente-Soriano, F.J.; Avilés-Trigueros, M.; Villegas-Pérez, M.P.; Vidal-Sanz, M.; et al. Bilateral Early Activation of Retinal Microglial Cells in a Mouse Model of Unilateral Laser-Induced Experimental Ocular Hypertension. Exp. Eye Res. 2018, 171, 12–29. [Google Scholar] [CrossRef]
- Yuan, A.N.L. Activated Microglia in the Human Glaucomatous Optic Nerve Head. J. Neurosci. Res. 2001, 64, 523–532. [Google Scholar] [CrossRef]
- Naskar, R.; Wissing, M.; Thanos, S. Detection of Early Neuron Degeneration and Accompanying Microglial Responses in the Retina of a Rat Model of Glaucoma. Investig. Ophthalmol. Vis. Sci. 2002, 43, 2962–2968. [Google Scholar]
- Lewis, G.P.; Fisher, S.K. Up-Regulation of Glial Fibrillary Acidic Protein in Response to Retinal Injury: Its Potential Role in Glial Remodeling and a Comparison to Vimentin Expression. Int. Rev. Cytol. 2003, 230, 263–290. [Google Scholar] [CrossRef]
- Fernández-Albarral, J.A.; de Hoz, R.; Matamoros, J.A.; Chen, L.; López-Cuenca, I.; Salobrar-García, E.; Sánchez-Puebla, L.; Ramírez, J.M.; Triviño, A.; Salazar, J.J.; et al. Retinal Changes in Astrocytes and Müller Glia in a Mouse Model of Laser-Induced Glaucoma: A Time-Course Study. Biomedicines 2022, 10, 939. [Google Scholar] [CrossRef] [PubMed]
- Ramírez, A.I.; de Hoz, R.; Fernández-Albarral, J.A.; Salobrar-García, E.; Rojas, B.; Valiente-Soriano, F.J.; Avilés-Trigueros, M.; Villegas-Pérez, M.P.; Vidal-Sanz, M.; Triviño, A.; et al. Time Course of Bilateral Microglial Activation in a Mouse Model of Laser-Induced Glaucoma. Sci. Rep. 2020, 10, 4890. [Google Scholar] [CrossRef] [PubMed]
- Kettenmann, H.; Hanisch, U.K.; Noda, M.; Verkhratsky, A. Physiology of Microglia. Physiol. Rev. 2011, 91, 461–553. [Google Scholar] [CrossRef]
- Karlstetter, M.; Scholz, R.; Rutar, M.; Wong, W.T.; Provis, J.M.; Langmann, T. Retinal Microglia: Just Bystander or Target for Therapy? Prog. Retin. Eye Res. 2015, 45, 30–57. [Google Scholar] [CrossRef]
- Borkenstein, A.; Faschinger, C.; Maier, R.; Weger, M.; Theisl, A.; Demel, U.; Graninger, W.; Irene, H.; Mossböck, G. Measurement of Tumor Necrosis Factor-Alpha, Interleukin-6, Fas Ligand, Interleukin-1α, and Interleukin-1β in the Aqueous Humor of Patients with Open Angle Glaucoma Using Multiplex Bead Analysis. Mol. Vis. 2013, 19, 2306–2311. [Google Scholar]
- Almasieh, M.; Wilson, A.M.; Morquette, B.; Cueva Vargas, J.L.; Di Polo, A. The Molecular Basis of Retinal Ganglion Cell Death in Glaucoma. Prog. Retin. Eye Res. 2012, 31, 152–181. [Google Scholar] [CrossRef]
- Lee, D.; Shim, M.S.; Kim, K.Y.; Noh, Y.H.; Kim, H.; Kim, S.Y.; Weinreb, R.N.; Ju, W.K. Coenzyme Q10 Inhibits Glutamate Excitotoxicity and Oxidative Stress–Mediated Mitochondrial Alteration in a Mouse Model of Glaucoma. Investig. Ophthalmol. Vis. Sci. 2014, 55, 993. [Google Scholar] [CrossRef]
- Lee, D.; Kim, K.-Y.; Sup Shim, M.; Yeop Kim, S.; Ellisman, M.H.; Weinreb, R.N.; Ju, W.-K. Coenzyme Q10 Ameliorates Oxidative Stress and Prevents Mitochondrial Alteration in Ischemic Retinal Injury. Apoptosis 2014, 19, 603–614. [Google Scholar] [CrossRef]
- Tang, D.; Liu, X.; Chen, J. Mitoquinone Intravitreal Injection Ameliorates Retinal Ischemia–Reperfusion Injury in Rats Involving SIRT1/Notch1/NADPH Axis. Drug Dev. Res. 2022, 83, 800–810. [Google Scholar] [CrossRef]
- Ekicier Acar, S.; Sarıcaoğlu, M.S.; Çolak, A.; Aktaş, Z.; Sepici Dinçel, A. Neuroprotective Effects of Topical Coenzyme Q10 + Vitamin E in Mechanic Optic Nerve Injury Model. Eur. J. Ophthalmol. 2020, 30, 714–722. [Google Scholar] [CrossRef]
- Di Simone, S.C.; Libero, M.L.; Rapino, M.; di Giacomo, V.; Cataldi, A.; Guarnieri, S.; Recinella, L.; Leone, S.; Brunetti, L.; Menghini, L.; et al. Neuroprotective Effects Induced by Citicoline/Coenzyme Q10 Fixed Combination in Rat CTX-TNA2 Astrocytes Exposed to Oxidative Stress. Food Biosci. 2024, 61, 104758. [Google Scholar] [CrossRef]
- Ramírez, J.M.; Salobrar-García, E.; de Hoz, R.; Salazar, J.J.; Matamoros, J.A.; Sánchez-Puebla, L.; López-Cuenca, I.; Fernández-Albarral, J.A.; Ramírez, A.I. Laser-Induced Ocular Hypertension in a Mouse Model of Glaucoma. Methods Mol. Biol. 2023, 2708, 49–56. [Google Scholar] [CrossRef] [PubMed]
- Salinas-Navarro, M.; Alarcón-Martínez, L.; Valiente-Soriano, F.J.; Ortín-Martínez, A.; Jiménez-López, M.; Avilés-Trigueros, M.; Villegas-Pérez, M.P.; de la Villa, P.; Vidal-Sanz, M. Functional and Morphological Effects of Laser-Induced Ocular Hypertension in Retinas of Adult Albino Swiss Mice. Mol. Vis. 2009, 15, 2578–2598. [Google Scholar]
- Sánchez-Migallón, M.d.C.; Pierdomenico, J.D.; Gallego-Ortega, A.; García-Ayuso, D.; Vidal-Sanz, M.; Agudo-Barriuso, M.; Valiente-Soriano, F.J. Minocycline Administration Does Not Have an Effect on Retinal Ganglion Cell Survival in a Murine Model of Ocular Hypertension. Aging Dis. 2024, 15, 2241. [Google Scholar] [CrossRef] [PubMed]
- Fernández-Albarral, J.A.; Martínez-López, M.A.; Marco, E.M.; de Hoz, R.; Martín-Sánchez, B.; Felipe, D.S.; Salobrar-García, E.; López-Cuenca, I.; Pinazo-Durán, M.D.; Salazar, J.J.; et al. Is Saffron Able to Prevent the Dysregulation of Retinal Cytokines Induced by Ocular Hypertension in Mice? J. Clin. Med. 2021, 10, 4801. [Google Scholar] [CrossRef]
- Chidlow, G.; Wood, J.P.M.; Ebneter, A.; Casson, R.J. Interleukin-6 Is an Efficacious Marker of Axonal Transport Disruption during Experimental Glaucoma and Stimulates Neuritogenesis in Cultured Retinal Ganglion Cells. Neurobiol. Dis. 2012, 48, 568–581. [Google Scholar] [CrossRef]
- Johnson, E.C.; Doser, T.A.; Cepurna, W.O.; Dyck, J.A.; Jia, L.; Guo, Y.; Lambert, W.S.; Morrison, J.C. Cell Proliferation and Interleukin-6-Type Cytokine Signaling Are Implicated by Gene Expression Responses in Early Optic Nerve Head Injury in Rat Glaucoma. Investig. Ophthalmol. Vis. Sci. 2011, 52, 504–518. [Google Scholar] [CrossRef]
- Fernández-Albarral, J.A.; Salazar, J.J.; de Hoz, R.; Marco, E.M.; Martín-Sánchez, B.; Flores-Salguero, E.; Salobrar-García, E.; López-Cuenca, I.; Barrios-Sabador, V.; Avilés-Trigueros, M.; et al. Retinal Molecular Changes Are Associated with Neuroinflammation and Loss of RGCs in an Experimental Model of Glaucoma. Int. J. Mol. Sci. 2021, 22, 2066. [Google Scholar] [CrossRef]
- Wang, X.; Tay, S.S.W.; Ng, Y.K. An Immunohistochemical Study of Neuronal and Glial Cell Reactions in Retinae of Rats with Experimental Glaucoma. Exp. Brain Res. 2000, 132, 476–484. [Google Scholar] [CrossRef]
- Inman, D.M.; Horner, P.J. Reactive Nonproliferative Gliosis Predominates in a Chronic Mouse Model of Glaucoma. Glia 2007, 55, 942–953. [Google Scholar] [CrossRef]
- Johnson, E.C.; Jia, L.; Cepurna, W.O.; Doser, T.A.; Morrison, J.C. Global Changes in Optic Nerve Head Gene Expression after Exposure to Elevated Intraocular Pressure in a Rat Glaucoma Model. Investig. Ophthalmol. Vis. Sci. 2007, 48, 3161–3177. [Google Scholar] [CrossRef] [PubMed]
- Ackert-Bicknell, C.L.; Anderson, L.C.; Sheehan, S.; Hill, W.G.; Chang, B.; Churchill, G.A.; Chesler, E.J.; Korstanje, R.; Peters, L.L. Aging Research Using Mouse Models. Curr. Protoc. Mouse Biol. 2015, 5, 95–133. [Google Scholar] [CrossRef]
- Dutta, S.; Sengupta, P. Men and Mice: Relating Their Ages. Life Sci 2016, 152, 244–248. [Google Scholar] [CrossRef] [PubMed]
- Thameem Dheen, S.; Kaur, C.; Ling, E.-A. Microglial Activation and Its Implications in the Brain Diseases. Curr. Med. Chem. 2007, 14, 1189–1197. [Google Scholar] [CrossRef]
- Walker, F.; Nilsson, M.; Jones, K. Acute and Chronic Stress-Induced Disturbances of Microglial Plasticity, Phenotype and Function. Curr. Drug Targets 2013, 14, 1262–1276. [Google Scholar] [CrossRef]
- Khairova, R.A.; MacHado-Vieira, R.; Du, J.; Manji, H.K. A Potential Role for Pro-Inflammatory Cytokines in Regulating Synaptic Plasticity in Major Depressive Disorder. Int. J. Neuropsychopharmacol. 2009, 12, 561–578. [Google Scholar] [CrossRef] [PubMed]
- Cavalu, S.; Saber, S.; Ramadan, A.; Elmorsy, E.A.; Hamad, R.S.; Abdel-Reheim, M.A.; Youssef, M.E. Unveiling Citicoline’s Mechanisms and Clinical Relevance in the Treatment of Neuroinflammatory Disorders. FASEB J. 2024, 38, e70030. [Google Scholar] [CrossRef]
- González, H.; Elgueta, D.; Montoya, A.; Pacheco, R. Neuroimmune Regulation of Microglial Activity Involved in Neuroinflammation and Neurodegenerative Diseases. J. Neuroimmunol. 2014, 274, 1–13. [Google Scholar] [CrossRef]
- Varela, H.J.; Hernandez, M.R. Astrocyte Responses in Human Optic Nerve Head with Primary Open-Angle Glaucoma. J. Glaucoma 1997, 6, 303–313. [Google Scholar] [CrossRef]
- Hernandez, M.R. The Optic Nerve Head in Glaucoma: Role of Astrocytes in Tissue Remodeling. Prog. Retin. Eye Res. 2000, 19, 297–321. [Google Scholar] [CrossRef]
- Bringmann, A.; Pannicke, T.; Grosche, J.; Francke, M.; Wiedemann, P.; Skatchkov, S.N.; Osborne, N.N.; Reichenbach, A. Müller Cells in the Healthy and Diseased Retina. Prog. Retin. Eye Res. 2006, 25, 397–424. [Google Scholar] [CrossRef]
- Bringmann, A.; Wiedemann, P. Müller Glial Cells in Retinal Disease. Ophthalmologica 2012, 227, 1–19. [Google Scholar] [CrossRef] [PubMed]
- Lv, B.; Huo, F.; Zhu, Z.; Xu, Z.; Dang, X.; Chen, T.; Zhang, T.; Yang, X. Crocin Upregulates CX3CR1 Expression by Suppressing NF-ΚB/YY1 Signaling and Inhibiting Lipopolysaccharide-Induced Microglial Activation. Neurochem. Res. 2016, 41, 1949–1957. [Google Scholar] [CrossRef] [PubMed]
- Trost, A.; Motloch, K.; Bruckner, D.; Schroedl, F.; Bogner, B.; Kaser-Eichberger, A.; Runge, C.; Strohmaier, C.; Klein, B.; Aigner, L.; et al. Time-Dependent Retinal Ganglion Cell Loss, Microglial Activation and Blood-Retina-Barrier Tightness in an Acute Model of Ocular Hypertension. Exp. Eye Res. 2015, 136, 59–71. [Google Scholar] [CrossRef]
- Santiago, A.R.; Baptista, F.I.; Santos, P.F.; Cristóvão, G.; Ambrósio, A.F.; Cunha, R.A.; Gomes, C.A. Role of Microglia Adenosine A(2A) Receptors in Retinal and Brain Neurodegenerative Diseases. Mediat. Inflamm. 2014, 2014, 465694. [Google Scholar] [CrossRef]
- Ramírez, A.I.; Salazar, J.J.; de Hoz, R.; Rojas, B.; Gallego, B.I.; Salobrar-García, E.; Valiente-Soriano, F.J.; Triviño, A.; Ramirez, J.M. Macro- and Microglial Responses in the Fellow Eyes Contralateral to Glaucomatous Eyes. Prog. Brain Res. 2015, 220, 155–172. [Google Scholar] [CrossRef]
- Lucas-Ruiz, F.; Galindo-Romero, C.; Albaladejo-García, V.; Vidal-Sanz, M.; Agudo-Barriuso, M. Mechanisms Implicated in the Contralateral Effect in the Central Nervous System after Unilateral Injury: Focus on the Visual System. Neural Regen. Res. 2021, 16, 2125. [Google Scholar] [CrossRef]
- Takuma, K.; Baba, A.; Matsuda, T. Astrocyte Apoptosis: Implications for Neuroprotection. Prog. Neurobiol. 2004, 72, 111–127. [Google Scholar] [CrossRef]
- Wu, H.M.; Tzeng, N.S.; Qian, L.; Wei, S.J.; Hu, X.; Chen, S.H.; Rawls, S.M.; Flood, P.; Hong, J.S.; Lu, R.B. Novel Neuroprotective Mechanisms of Memantine: Increase in Neurotrophic Factor Release from Astroglia and Anti-Inflammation by Preventing Microglial Activation. Neuropsychopharmacology 2009, 34, 2344–2357. [Google Scholar] [CrossRef]
- Escartin, C.; Bonvento, G. Targeted Activation of Astrocytes: A Potential Neuroprotective Strategy. Mol. Neurobiol. 2008, 38, 231–241. [Google Scholar] [CrossRef]
- Martersteck, E.M.; Hirokawa, K.E.; Evarts, M.; Bernard, A.; Duan, X.; Li, Y.; Ng, L.; Oh, S.W.; Ouellette, B.; Royall, J.J.; et al. Diverse Central Projection Patterns of Retinal Ganglion Cells. Cell Rep. 2017, 18, 2058–2072. [Google Scholar] [CrossRef]
- Erskine, L.; Herreral, E. Connecting the Retina to the Brain. ASN Neuro 2015, 6, 1759091414562107. [Google Scholar] [CrossRef] [PubMed]
- Monavarfeshani, A.; Sabbagh, U.; Fox, M.A. Not a One-Trick Pony: Diverse Connectivity and Functions of the Rodent Lateral Geniculate Complex. Vis. Neurosci. 2017, 34, E012. [Google Scholar] [CrossRef]
- Liddelow, S.; Guttenplan, K.; Clarke, L.E.; Bennett, F.; Bohlen, C.; Schirmer, L.; Bennett, M.L.; Alexandra, E.M.; Chung, W.-S.; Peterson, T.; et al. Neurotoxic Reactive Astrocytes Are Induced by Activated Microglia. Nature 2017, 541, 481–487. [Google Scholar] [CrossRef] [PubMed]
- Salter, M.W.; Stevens, B. Microglia Emerge as Central Players in Brain Disease. Nat. Med. 2017, 23, 1018–1027. [Google Scholar] [CrossRef]
- Cooper, M.L.; Calkins, D.J. Beyond Hypertrophy: Changing Views of Astrocytes in Glaucoma. Vis. Res. 2024, 223, 108461. [Google Scholar] [CrossRef]
- Kanamori, A.; Nakamura, M.; Nakanishi, Y.; Yamada, Y.; Negi, A. Long-Term Glial Reactivity in Rat Retinas Ipsilateral and Contralateral to Experimental Glaucoma. Exp. Eye Res. 2005, 81, 48–56. [Google Scholar] [CrossRef]
- Shah, S.H.; Goldberg, J.L. The Role of Axon Transport in Neuroprotection and Regeneration. Dev. Neurobiol. 2018, 78, 998–1010. [Google Scholar] [CrossRef]
- Crish, S.D.; Sappington, R.M.; Inman, D.M.; Horner, P.J.; Calkins, D.J. Distal Axonopathy with Structural Persistence in Glaucomatous Neurodegeneration. Proc. Natl. Acad. Sci. USA 2010, 107, 5196–5201. [Google Scholar] [CrossRef]
- Cooper, M.L.; Collyer, J.W.; Calkins, D.J. Astrocyte Remodeling without Gliosis Precedes Optic Nerve Axonopathy. Acta Neuropathol. Commun. 2018, 6, 38. [Google Scholar] [CrossRef]
- Cooper, M.L.; Gildea, H.K.; Selles, M.C.; Katafygiotou, E.; Liddelow, S.A.; Chao, M.V. Astrocytes in the Mouse Brain Respond Bilaterally to Unilateral Retinal Neurodegeneration. Proc. Natl. Acad. Sci. USA 2025, 122, e2418249122. [Google Scholar] [CrossRef]
- Ito, S.; Feldheim, D.A. The Mouse Superior Colliculus: An Emerging Model for Studying Circuit Formation and Function. Front. Neural Circuits 2018, 12, 327065. [Google Scholar] [CrossRef] [PubMed]
- Liu, X.; Huang, H.; Snutch, T.P.; Cao, P.; Wang, L.; Wang, F. The Superior Colliculus: Cell Types, Connectivity, and Behavior. Neurosci. Bull. 2022, 38, 1519–1540. [Google Scholar] [CrossRef]
- Liang, F.; Xiong, X.R.; Zingg, B.; Ji, X.Y.; Zhang, L.I.; Tao, H.W. Sensory Cortical Control of a Visually Induced Arrest Behavior via Corticotectal Projections. Neuron 2015, 86, 755–767. [Google Scholar] [CrossRef] [PubMed]
- Shang, C.; Liu, Z.; Chen, Z.; Shi, Y.; Wang, Q.; Liu, S.; Li, D.; Cao, P. A Parvalbumin-Positive Excitatory Visual Pathway to Trigger Fear Responses in Mice. Science 2015, 348, 1472–1477. [Google Scholar] [CrossRef] [PubMed]
- Hübener, M. Mouse Visual Cortex. Curr. Opin. Neurobiol. 2003, 13, 413–420. [Google Scholar] [CrossRef]
- García-López, C.; García-López, V.; Matamoros, J.A.; Fernández-Albarral, J.A.; Salobrar-García, E.; de Hoz, R.; López-Cuenca, I.; Sánchez-Puebla, L.; Ramírez, J.M.; Ramírez, A.I.; et al. The Role of Citicoline and Coenzyme Q10 in Retinal Pathology. Int. J. Mol. Sci. 2023, 24, 5072. [Google Scholar] [CrossRef]
- Attia, H.; Albuhayri, S.; Alaraidh, S.; Alotaibi, A.; Yacoub, H.; Mohamad, R.; Al-Amin, M. Biotin, Coenzyme Q10, and Their Combination Ameliorate Aluminium Chloride-Induced Alzheimer’s Disease via Attenuating Neuroinflammation and Improving Brain Insulin Signaling. J. Biochem. Mol. Toxicol. 2020, 34, e22519. [Google Scholar] [CrossRef]
- Bhardwaj, M.; Kumar, A. Neuroprotective Mechanism of Coenzyme Q10 (CoQ10) against PTZ Induced Kindling and Associated Cognitive Dysfunction: Possible Role of Microglia Inhibition. Pharmacol. Rep. 2016, 68, 1301–1311. [Google Scholar] [CrossRef]
- Deppe, L.; Mueller-Buehl, A.M.; Tsai, T.; Erb, C.; Dick, H.B.; Joachim, S.C. Protection against Oxidative Stress by Coenzyme Q10 in a Porcine Retinal Degeneration Model. J. Pers. Med. 2024, 14, 437. [Google Scholar] [CrossRef]
- Kernt, M.; Arend, N.; Buerger, A.; Mann, T.; Haritoglou, C.; Ulbig, M.W.; Kampik, A.; Hirneiss, C. Idebenone Prevents Human Optic Nerve Head Astrocytes from Oxidative Stress, Apoptosis, and Senescence by Stabilizing BAX/Bcl-2 Ratio. J. Glaucoma 2013, 22, 404–412. [Google Scholar] [CrossRef]
- Park, C.H.; Kim, Y.S.; Cheon, E.W.; Noh, H.S.; Cho, C.H.; Chung, I.Y.; Yoo, J.M.; Kang, S.S.; Choi, W.S.; Cho, G.J. Action of Citicoline on Rat Retinal Expression of Extracellular-Signal-Regulated Kinase (ERK1/2). Brain Res. 2006, 1081, 203–210. [Google Scholar] [CrossRef]
- Sun, J.; Nan, G. The Extracellular Signal-Regulated Kinase 1/2 Pathway in Neurological Diseases: A Potential Therapeutic Target (Review). Int. J. Mol. Med. 2017, 39, 1338–1346. [Google Scholar] [CrossRef] [PubMed]
- Mastropasqua, L.; Agnifili, L.; Ferrante, C.; Sacchi, M.; Figus, M.; Rossi, G.C.M.; Brescia, L.; Aloia, R.; Orlando, G. Citicoline/Coenzyme Q10/Vitamin B3 Fixed Combination Exerts Synergistic Protective Effects on Neuronal Cells Exposed to Oxidative Stress. Nutrients 2022, 14, 2963. [Google Scholar] [CrossRef] [PubMed]
- Mominur Rahman, M.; Afsana Mim, S.; Afroza Alam Tumpa, M.; Taslim Sarker, M.; Ahmed, M.; Alghamdi, B.S.; Hafeez, A.; Alexiou, A.; Perveen, A.; Md Ashraf, G. Exploring the Management Approaches of Cytokines Including Viral Infection and Neuroinflammation for Neurological Disorders. Cytokine 2022, 157, 155962. [Google Scholar] [CrossRef]
- Eyster, K.M. The Membrane and Lipids as Integral Participants in Signal Transduction: Lipid Signal Transduction for the Non-Lipid Biochemist. Adv. Physiol. Educ. 2007, 31, 5–16. [Google Scholar] [CrossRef] [PubMed]
- Krupinski, J.; Slevin, M.; Badimon, L. Citicoline Inhibits MAP Kinase Signalling Pathways after Focal Cerebral Ischaemia. Neurochem. Res. 2005, 30, 1067–1073. [Google Scholar] [CrossRef]
- Li, X.; Xie, Z.; Zhou, Q.; Tan, X.; Meng, W.; Pang, Y.; Huang, L.; Ding, Z.; Hu, Y.; Li, R.; et al. TGN-020 Alleviate Inflammation and Apoptosis After Cerebral Ischemia-Reperfusion Injury in Mice Through Glymphatic and ERK1/2 Signaling Pathway. Mol. Neurobiol. 2024, 61, 1175–1186. [Google Scholar] [CrossRef]
- Chavda, V.; Chaurasia, B.; Garg, K.; Deora, H.; Umana, G.E.; Palmisciano, P.; Scalia, G.; Lu, B. Molecular Mechanisms of Oxidative Stress in Stroke and Cancer. Neurol. Disord. 2022, 5, 100029. [Google Scholar] [CrossRef]
- Zang, J.; Liu, A.X.; Qi, L. The Cytological Mechanism and Effects of Hypertensive Cerebral Hemorrhage Treatment by Citicoline on Serum GFAP and Copeptin Level. Eur. J. Inflamm. 2019, 17, 2058739219867244. [Google Scholar] [CrossRef]
- Lee, H.J.; Park, J.H.; Hoe, H.S. Idebenone Regulates Aβ and LPS-Induced Neurogliosis and Cognitive Function Through Inhibition of NLRP3 Inflammasome/IL-1β Axis Activation. Front. Immunol. 2022, 13, 749336. [Google Scholar] [CrossRef] [PubMed]
- Yan, A.; Liu, Z.; Song, L.; Wang, X.; Zhang, Y.; Wu, N.; Lin, J.; Liu, Y.; Liu, Z. Idebenone Alleviates Neuroinflammation and Modulates Microglial Polarization in LPS-Stimulated BV2 Cells and MPTP-Induced Parkinson’s Disease Mice. Front. Cell. Neurosci. 2019, 12, 420291. [Google Scholar] [CrossRef] [PubMed]
- Li, L.; Xu, D.; Lin, J.; Zhang, D.; Wang, G.; Sui, L.; Ding, H.; Du, J. Coenzyme Q10 Attenuated β-Amyloid25-35-Induced Inflammatory Responses in PC12 Cells through Regulation of the NF-ΚB Signaling Pathway. Brain Res. Bull. 2017, 131, 192–198. [Google Scholar] [CrossRef]
- Kilkenny, C.; Browne, W.J.; Cuthill, I.C.; Emerson, M.; Altman, D.G. Improving Bioscience Research Reporting: The ARRIVE Guidelines for Reporting Animal Research. J. Pharmacol. Pharmacother. 2010, 1, 94–99. [Google Scholar] [CrossRef]
- Shapiro, L.A.; Perez, Z.D.; Foresti, M.L.; Arisi, G.M.; Ribak, C.E. Morphological and Ultrastructural Features of Iba1-Immunolabeled Microglial Cells in the Hippocampal Dentate Gyrus. Brain Res. 2009, 1266, 29–36. [Google Scholar] [CrossRef]
- Haynes, S.E.; Hollopeter, G.; Yang, G.; Kurpius, D.; Dailey, M.E.; Gan, W.-B.; Julius, D. The P2Y12 Receptor Regulates Microglial Activation by Extracellular Nucleotides. Nat. Neurosci. 2006, 9, 1512–1519. [Google Scholar] [CrossRef]
- Gallego, B.I.; de Gracia, P. Automatic Counting of Microglial Cell Activation and Its Applications. Neural Regen. Res. 2016, 11, 1212–1215. [Google Scholar] [CrossRef] [PubMed]
- de Gracia, P.; Gallego, B.I.; Rojas, B.; Ramírez, A.I.; de Hoz, R.; Salazar, J.J.; Triviño, A.; Ramírez, J.M. Automatic Counting of Microglial Cells in Healthy and Glaucomatous Mouse Retinas. PLoS ONE 2015, 10, e0143278. [Google Scholar] [CrossRef]
- Gomes, F.V.; Llorente, R.; Del Bel, E.A.; Viveros, M.P.; López-Gallardo, M.; Guimarães, F.S. Decreased Glial Reactivity Could Be Involved in the Antipsychotic-like Effect of Cannabidiol. Schizophr. Res. 2015, 164, 155–163. [Google Scholar] [CrossRef]


Disclaimer/Publisher’s Note: The statements, opinions and data contained in all publications are solely those of the individual author(s) and contributor(s) and not of MDPI and/or the editor(s). MDPI and/or the editor(s) disclaim responsibility for any injury to people or property resulting from any ideas, methods, instructions or products referred to in the content. |
© 2025 by the authors. Licensee MDPI, Basel, Switzerland. This article is an open access article distributed under the terms and conditions of the Creative Commons Attribution (CC BY) license (https://creativecommons.org/licenses/by/4.0/).
Share and Cite
Matamoros, J.A.; Rubio-Casado, S.; Fernández-Albarral, J.A.; Martínez-López, M.A.; Ramírez, A.I.; Salobrar-García, E.; Marco, E.M.; Paleo-García, V.; de Hoz, R.; López-Cuenca, I.; et al. Citicoline and Coenzyme Q10: Therapeutic Agents for Glial Activation Reduction in Ocular Hypertension. Pharmaceuticals 2025, 18, 694. https://doi.org/10.3390/ph18050694
Matamoros JA, Rubio-Casado S, Fernández-Albarral JA, Martínez-López MA, Ramírez AI, Salobrar-García E, Marco EM, Paleo-García V, de Hoz R, López-Cuenca I, et al. Citicoline and Coenzyme Q10: Therapeutic Agents for Glial Activation Reduction in Ocular Hypertension. Pharmaceuticals. 2025; 18(5):694. https://doi.org/10.3390/ph18050694
Chicago/Turabian StyleMatamoros, José A., Sara Rubio-Casado, José A. Fernández-Albarral, Miguel A. Martínez-López, Ana I. Ramírez, Elena Salobrar-García, Eva M. Marco, Victor Paleo-García, Rosa de Hoz, Inés López-Cuenca, and et al. 2025. "Citicoline and Coenzyme Q10: Therapeutic Agents for Glial Activation Reduction in Ocular Hypertension" Pharmaceuticals 18, no. 5: 694. https://doi.org/10.3390/ph18050694
APA StyleMatamoros, J. A., Rubio-Casado, S., Fernández-Albarral, J. A., Martínez-López, M. A., Ramírez, A. I., Salobrar-García, E., Marco, E. M., Paleo-García, V., de Hoz, R., López-Cuenca, I., Elvira-Hurtado, L., Sánchez-Puebla, L., Ramírez, J. M., López-Gallardo, M., & Salazar, J. J. (2025). Citicoline and Coenzyme Q10: Therapeutic Agents for Glial Activation Reduction in Ocular Hypertension. Pharmaceuticals, 18(5), 694. https://doi.org/10.3390/ph18050694