

Developing a Chromatographic Method for Quantifying Latanoprost and Related Substances in Glaucoma Treatments


Abstract

1. Introduction
2. Results
2.1. Method Development
2.2. Method Validation
2.2.1. System Suitability
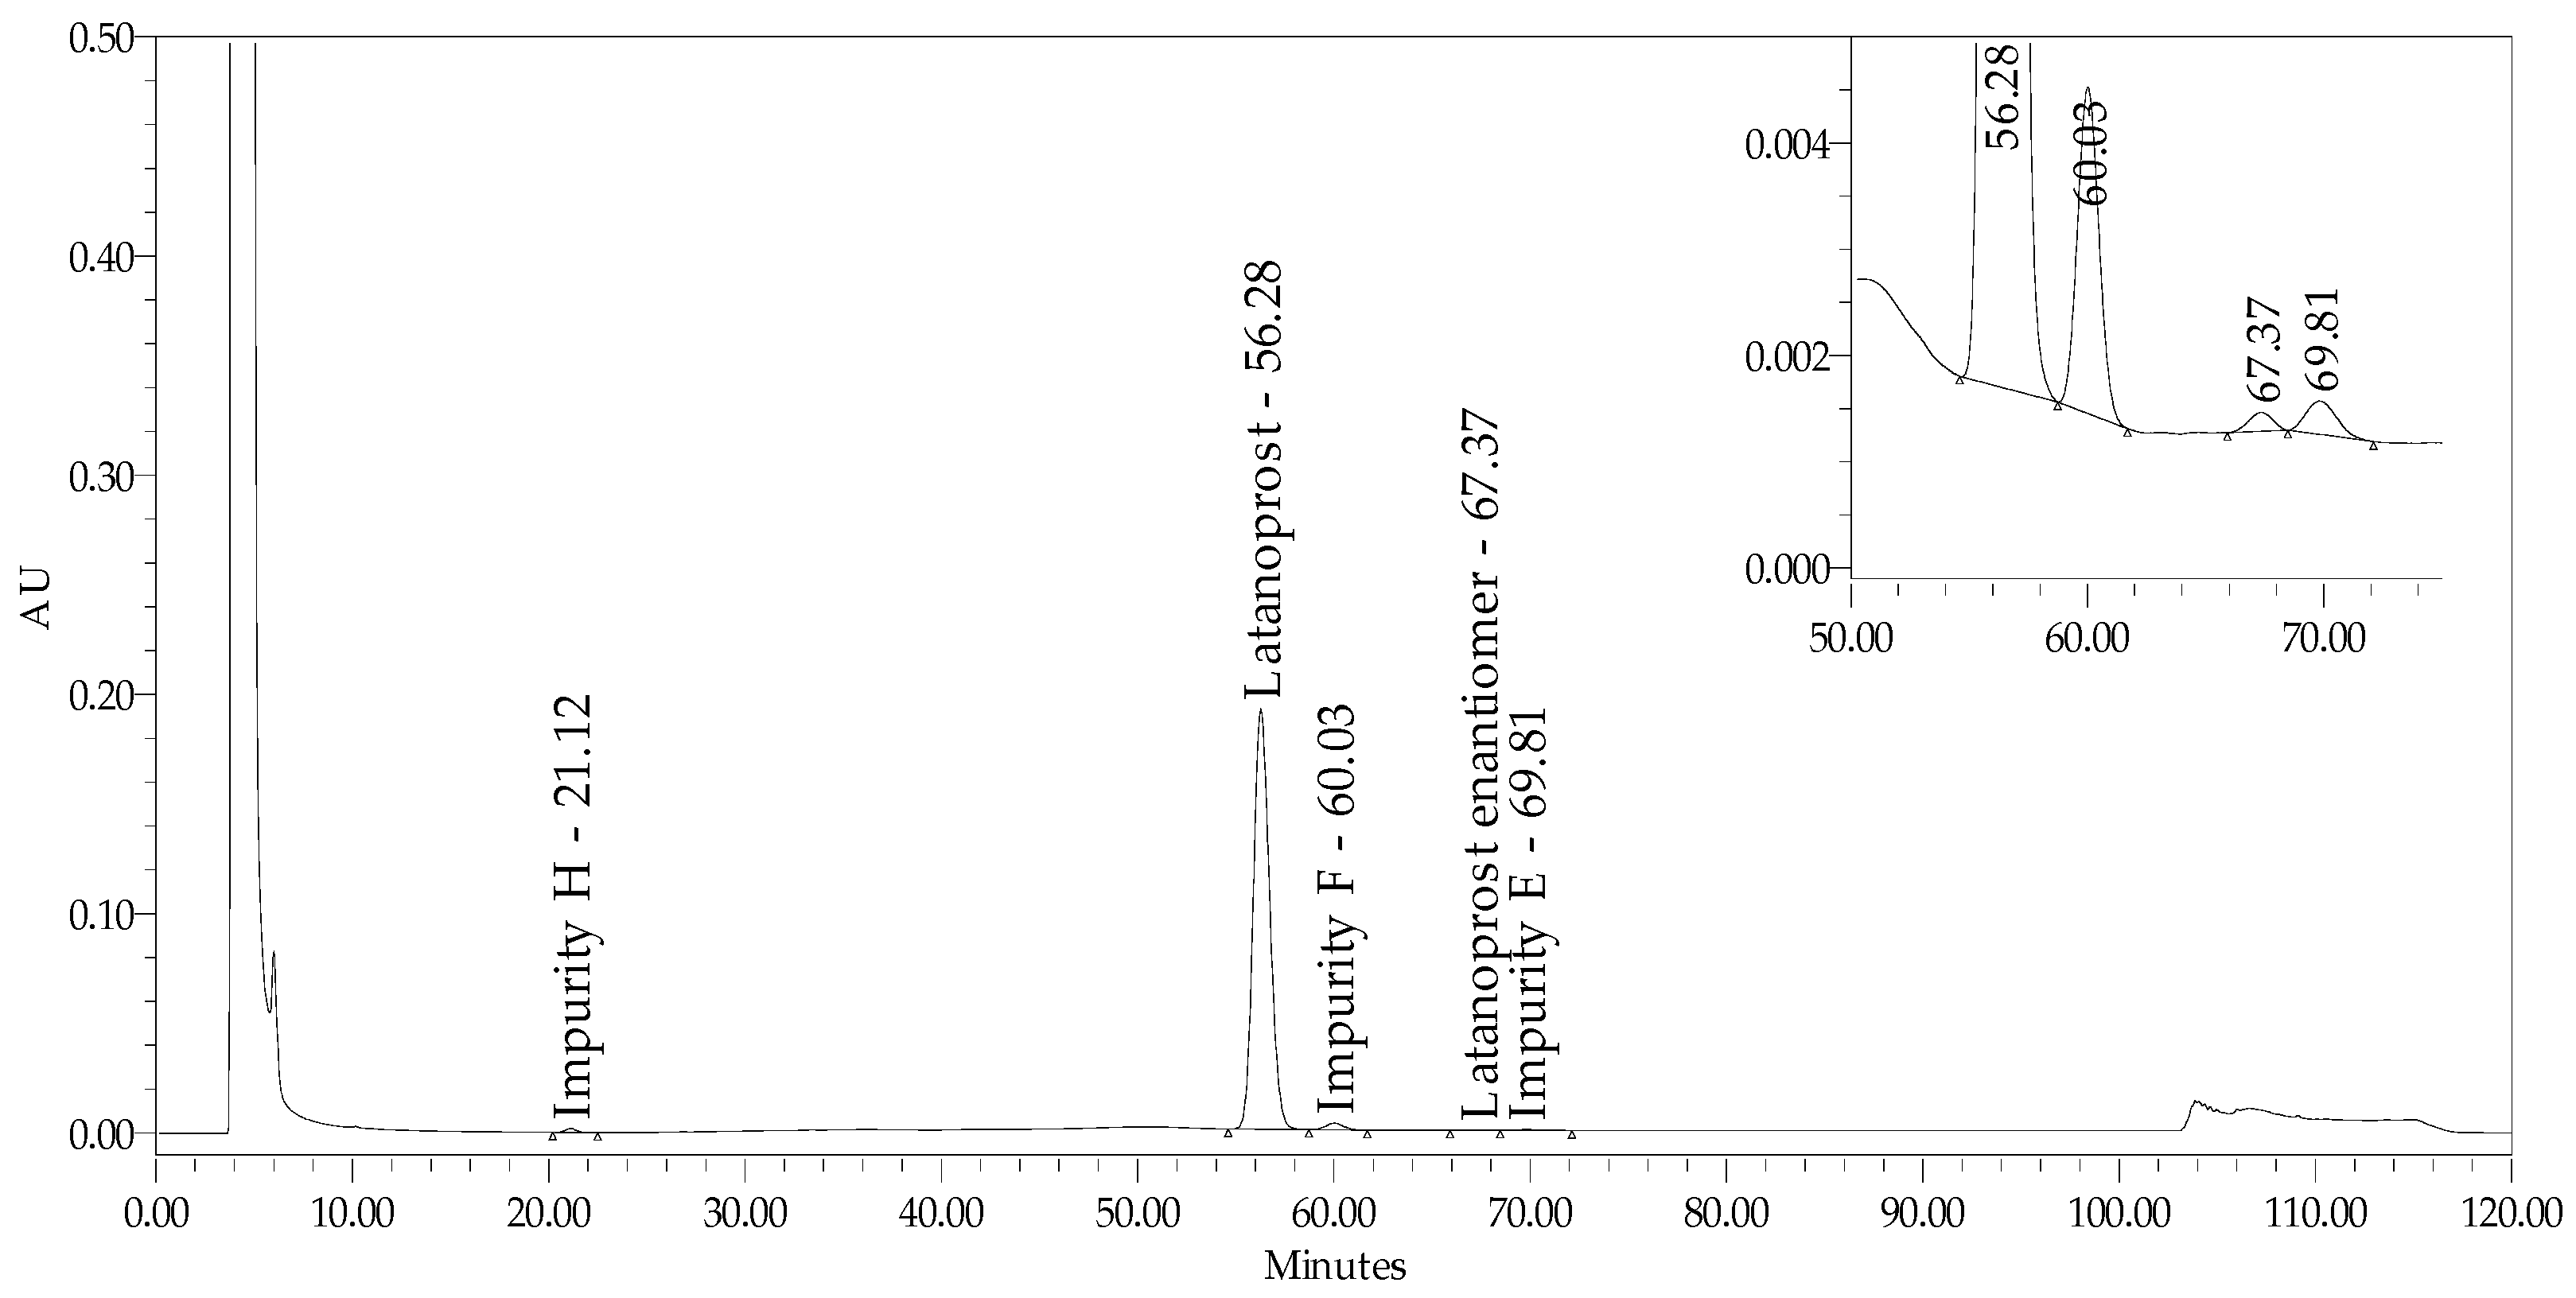
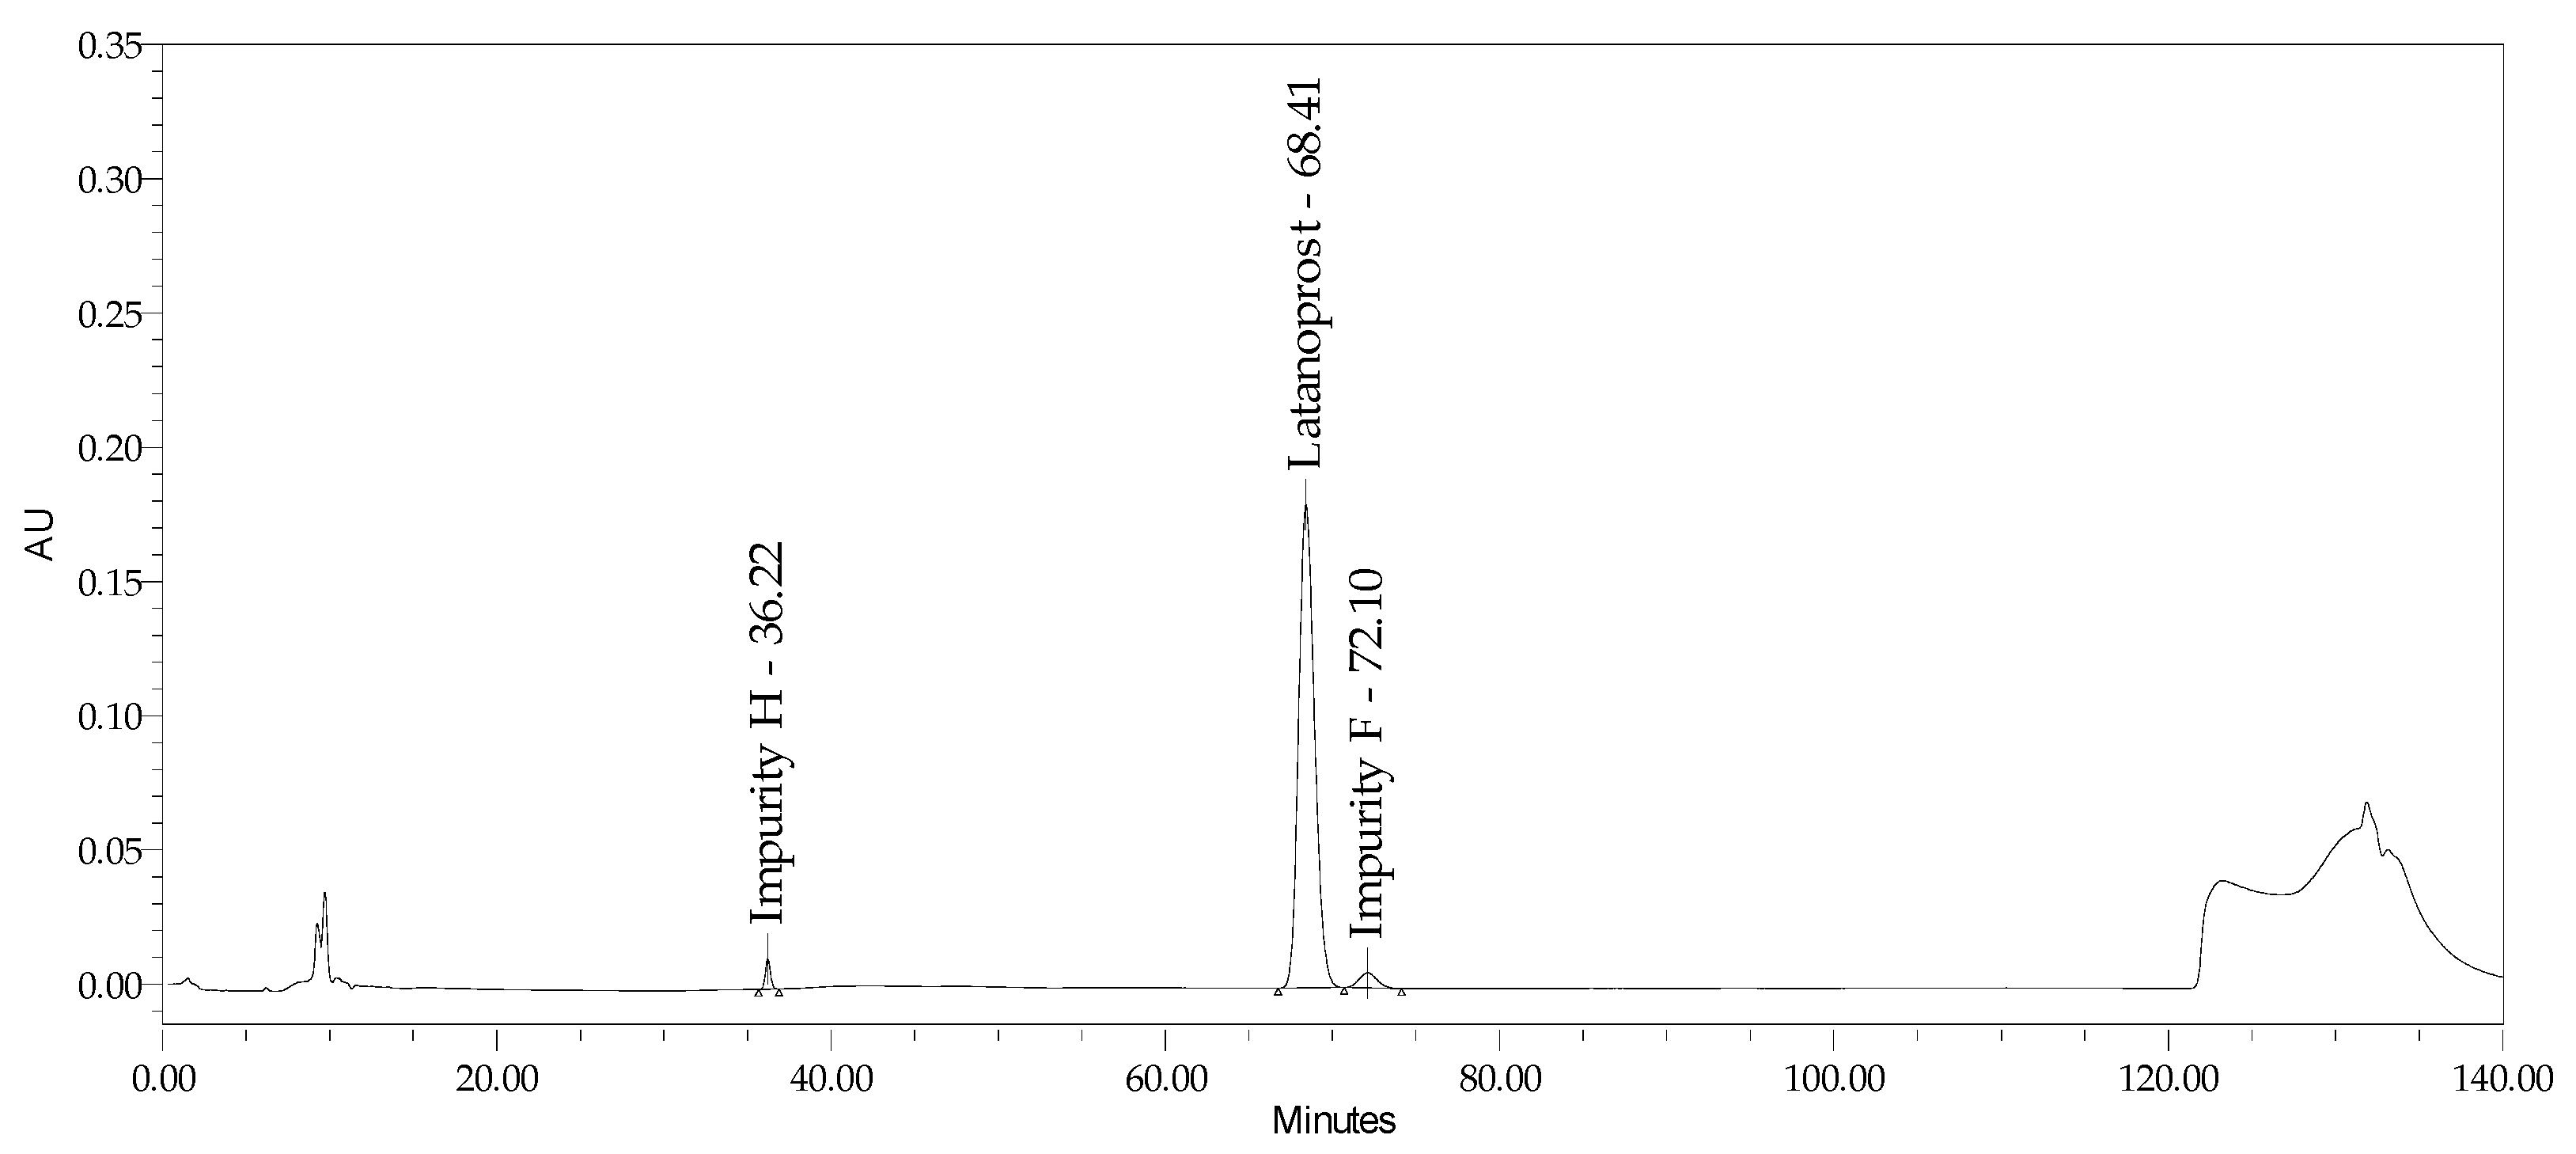
2.2.2. Specificity and Stability-Indicating Power
2.2.3. System Precision
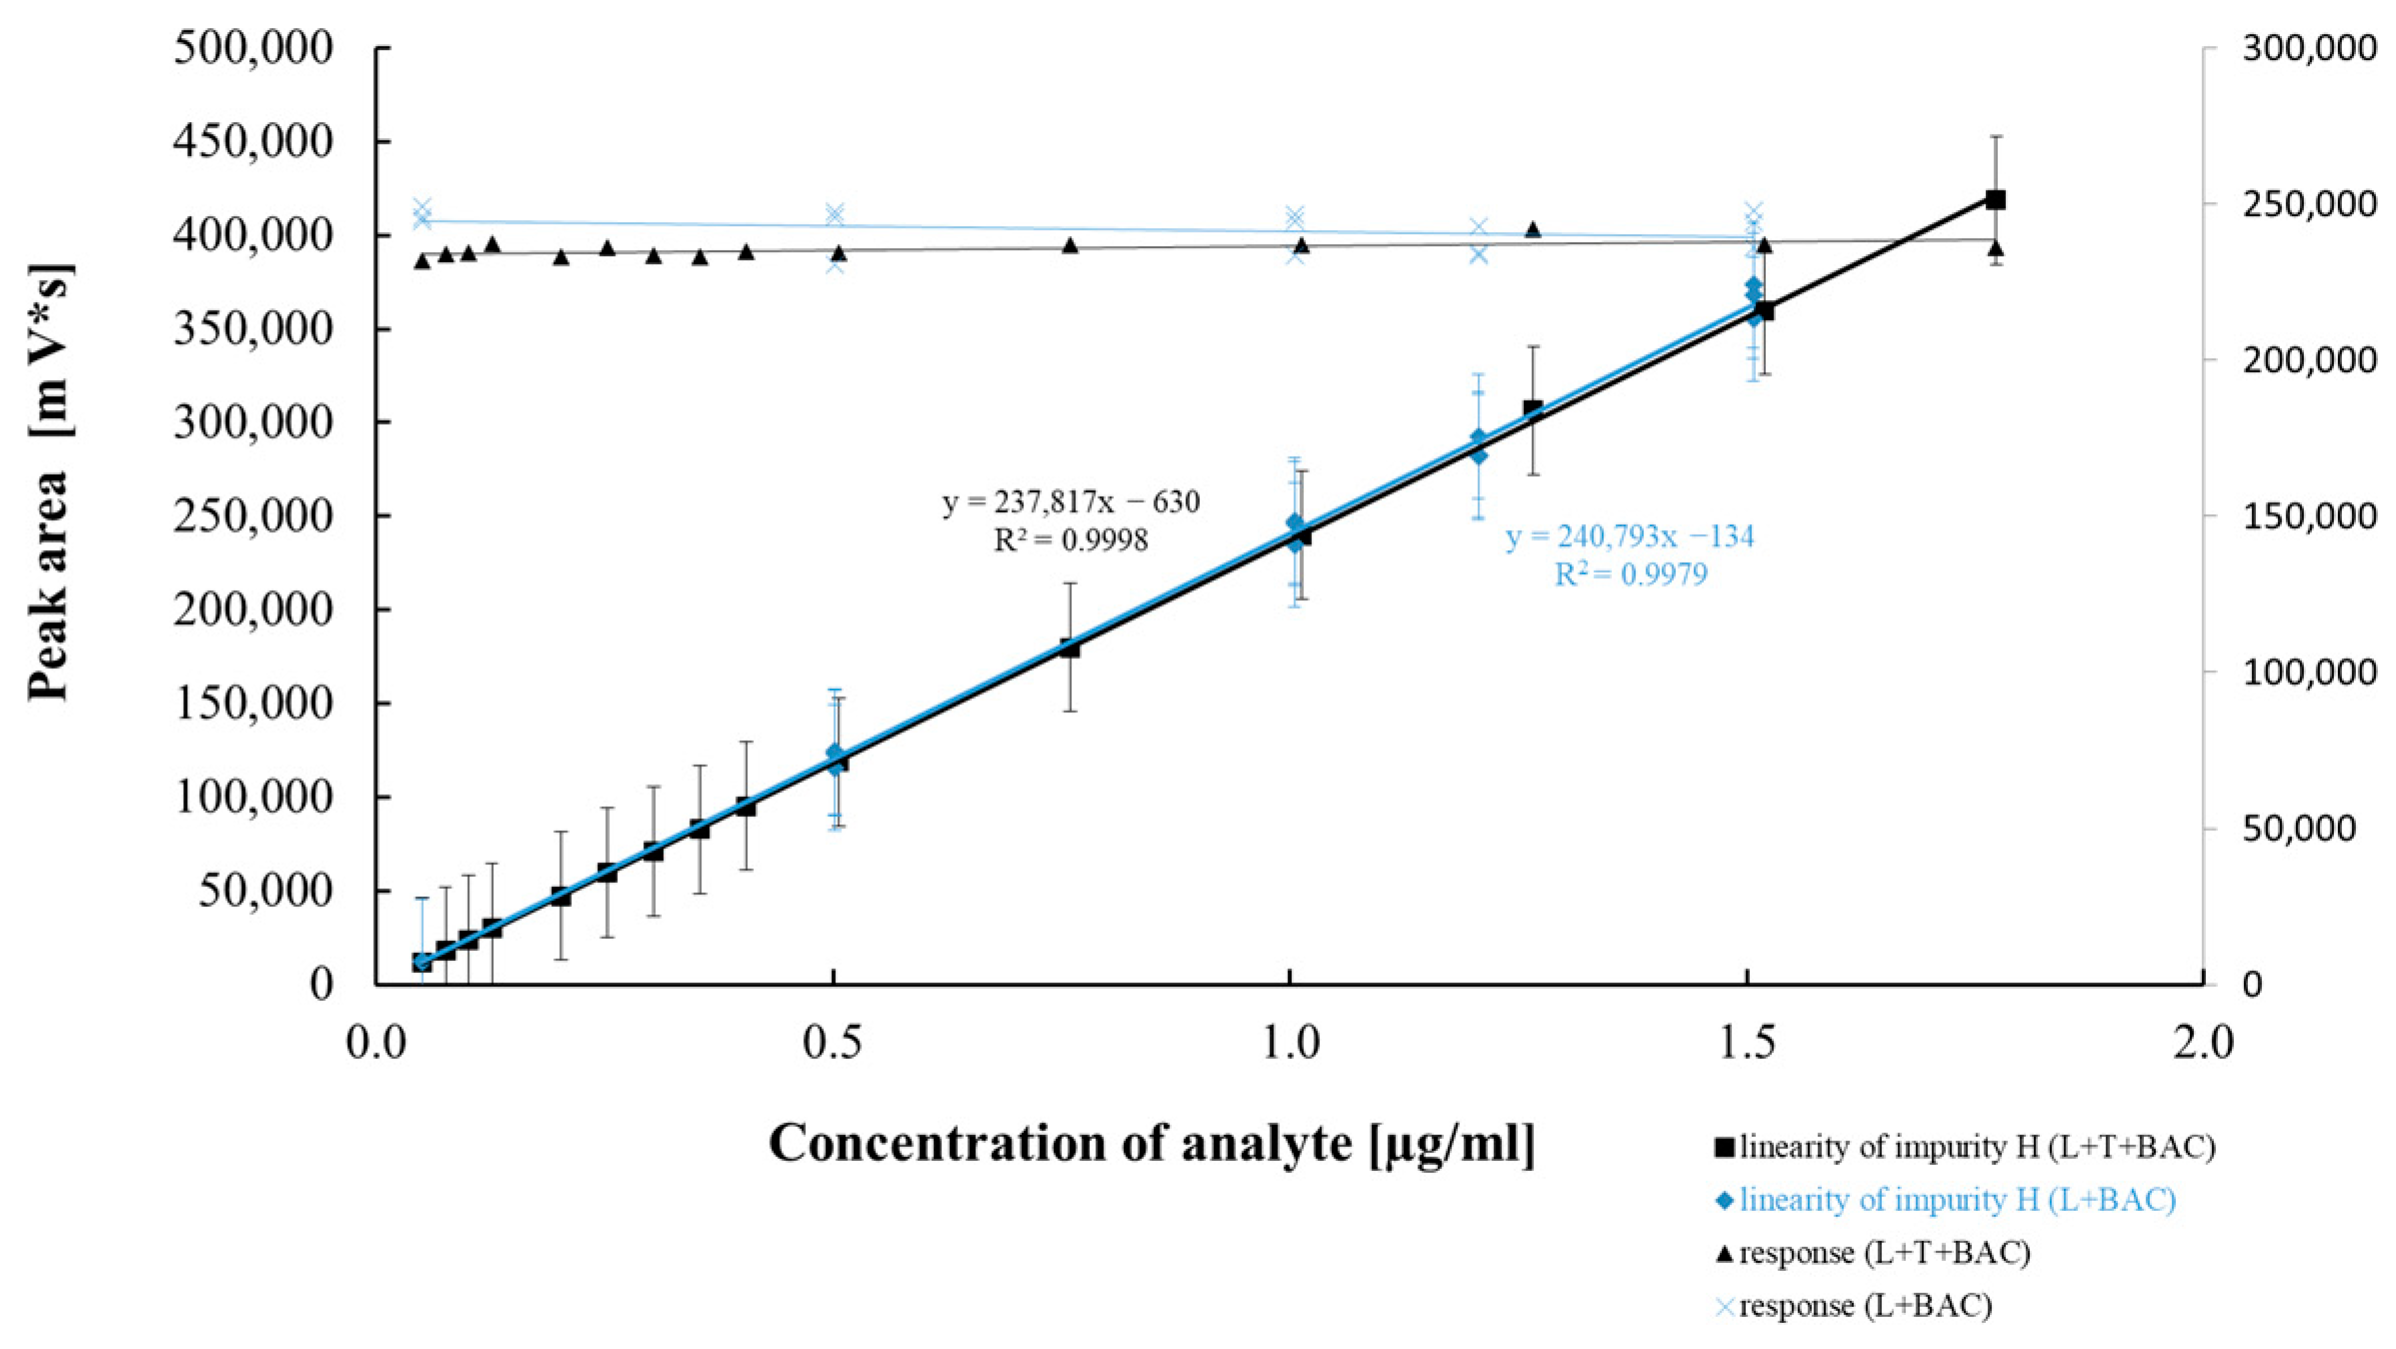
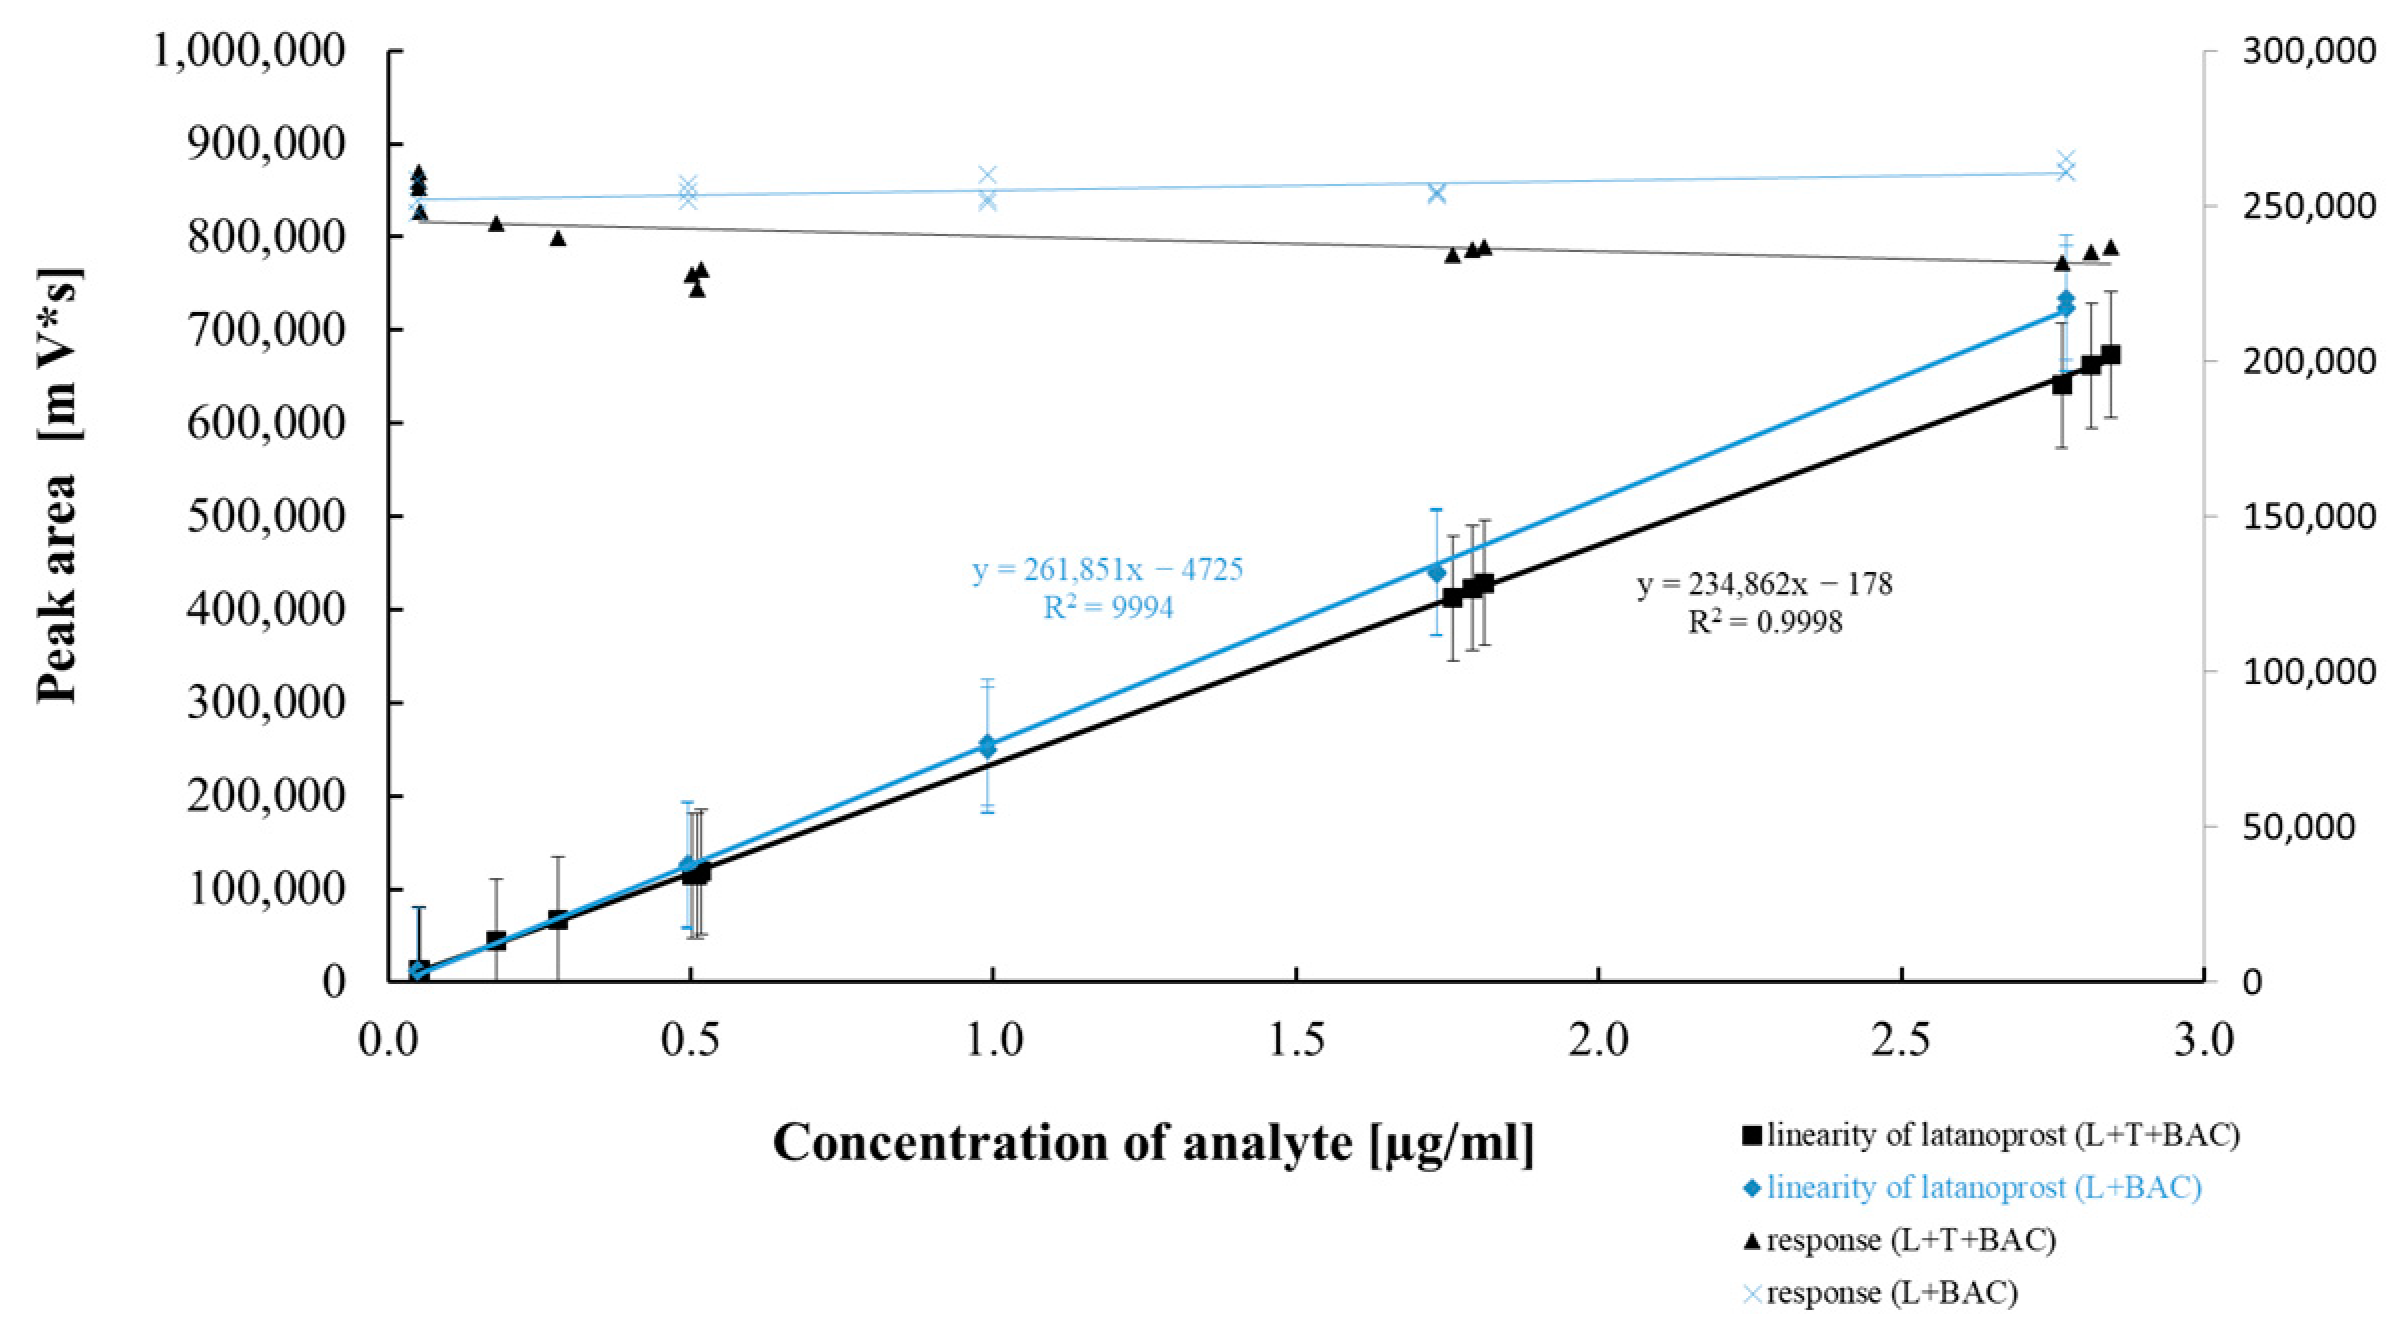
2.2.4. Method Precision, Linearity, and Accuracy
- P—peak area of the analyte in the model sample [µV × s];
- C—concentration of the analyte in the measured model sample [µg/mL].

| Latanoprost Assay | Unknown Impurity | Impurity H | Impurity E | Impurity F | |
|---|---|---|---|---|---|
| RSD (u) n = 15 L + T + BAC | 0.74% | 4.7% | 1.1% | 4.8% | 5.0% |
| RSD (u) n = 15 L + BAC | 0.44% | 2.0% | 2.5% | 4.7% | 2.6% |
2.2.5. Limit of Detection and Quantification
2.2.6. Robustness
2.3. Drug Product Analyses
3. Discussion
4. Materials and Methods
4.1. Materials
4.2. HPLC Analysis
4.3. Method Validation
- Mb—mass balance [%];
- A—assay of the analyte before degradation;
- Ad—assay of the analyte after degradation;
- I—sum of impurities before degradation;
- Id—sum of impurities after degradation.
5. Conclusions
Supplementary Materials
Author Contributions
Funding
Institutional Review Board Statement
Informed Consent Statement
Data Availability Statement
Acknowledgments
Conflicts of Interest
References
- Gedde, S.J.; Vinod, K.; Wright, M.M.; Muir, K.W.; Lind, J.T.; Chen, P.P.; Li, T.; Mansberger, S.L.; American Academy of Ophthalmology Preferred Practice Pattern Glaucoma Panel. Primary Open-Angle Glaucoma Preferred Practice Pattern®. Ophthalmology 2021, 128, P71–P150. [Google Scholar] [CrossRef] [PubMed]
- World Health Organization, World Report on Vision, ISBN 978-92-4-151657-0. Available online: https://www.who.int/publications/i/item/world-report-on-vision (accessed on 8 October 2019).
- Tham, Y.C.; Li, X.; Wong, T.Y.; Quigley, H.A.; Aung, T.; Cheng, C.Y. Global prevalence of glaucoma and projections of glaucoma burden through 2040: A systematic review and meta-analysis. Ophthalmology 2014, 121, 2081–2090. [Google Scholar] [CrossRef] [PubMed]
- Asendrych-Wicik, K.; Zarczuk, J.; Walaszek, K.; Ciach, T.; Markowicz-Piasecka, M. Trends in development and quality assessment of pharmaceutical formulations—F2α analogues in the glaucoma treatment. Eur. J. Pharm. Sci. 2023, 180, 106315. [Google Scholar] [CrossRef] [PubMed]
- EDQM. European Pharmacopoeia, Supplement 11.3, Latanoprost Monograph 01/2024:223; EDQM (European Directorate for the Quality of Medicines and HealthCare): Strasbourg, France, 2023. [Google Scholar]
- USP-NF 2021; Latanoprost Monograph. United States Pharmacopeia: Rockville, MD, USA, 2020. Available online: https://doi.usp.org/USPNF/USPNF_M44357_02_01.html (accessed on 8 October 2019).
- Le Basle, Y.; Chennell, P.; Sautou, V. A Sorption Study between Ophthalmic Drugs and Multi Dose Eyedroppers in Simulated Use Conditions. Pharm. Technol. Hosp. Pharm. 2017, 2, 181–191. [Google Scholar] [CrossRef]
- Walash, M.; El-Shaheny, R. Fast separation and quantification of three anti-glaucoma drugs by high-performance liquid chromatography UV detection. J. Food Drug Anal. 2016, 24, 441–449. [Google Scholar] [CrossRef] [PubMed]
- Srinivas, K.; Narendra, D.; Varaprasad, P.V.V.; Jaya Durga Madhuri, G.; Eswari, K.; Shanti Priya, N. Method Development and Validation of Latanoprost by using RP-HPLC in Pharmaceutical Formulations. Int. J. Res. AYUSH Pharm. Sci. 2023, 7, 14–16. [Google Scholar] [CrossRef]
- Paolera, M.D.; Kasahara, N.; Umbelino, C.C.; Walt, J.G. Comparative study of the stability of bimatoprost 0.03% and latanoprost 0.005%: A patient-use study. BMC Ophthalmol. 2008, 8, 11. [Google Scholar] [CrossRef] [PubMed]
- Ashfaq, M.; Khan, I.; Asghar, M. High-performance liquid chromatography determination of latanoprost in pharmaceutical formulations using UV detection. Anal. Lett. 2006, 39, 2235–2242. [Google Scholar] [CrossRef]
- Mansoor, S.; Tas, C. Simple, fast, and sensitive isocratic high-performance liquid chromatography method for the quantification of latanoprost. Acta Chromatogr. 2014, 26, 191–202. [Google Scholar] [CrossRef]
- Ramana, L.V.; Narendra, D.; Lakshmi, G.V. Method Development and Validation for Simultaneous Estimation of Netarsudil & Latanoprost by RP-HPLC method. Eur. J. Pharm. Med. Res. 2020, 7, 888–894. [Google Scholar]
- Sharanya, P.S.; Rani, S.S. Development and Validation of Stability Indicating Analytical Method for the Simultaneous Estimation of Netarsudil and Latanoprost by RP-HPLC. World J. Pharm. Sci. 2022, 10, 104–112. [Google Scholar] [CrossRef]
- Kunala, A.; Gummadi, S. Simultaneous Estimation of Netarsudil and Latanoprost by Stability Indicating RP-HPLC-Pda in Pure Binary Blend and their Ophthalmic Solution. Int. J. Pharm. Qual. Assur. 2022, 13, 308–314. [Google Scholar] [CrossRef]
- Dharmamoorthy, G.; Nataraj, K.S.; Krishna Manjari Pawar, A. Development and validation of a stability-indicating reverse-phase ultra-performance liquid chromatography method for the simultaneous determination of netarsudil and latanoprost in bulk and pharmaceutical formulation. Int. J. Green. Pharm. 2020, 14, 179–185. [Google Scholar] [CrossRef]
- Ankit, A.; Sunil, T.; Kashyap, N. Method Development and its Validation for Quantitative Simultaneous Determination of Latanoprost, Timolol and Benzalkonium Chloride in Ophtalmic Solution by RP-HPLC. J. Drug Deliv. Ther. 2011, 2013, 26–30. [Google Scholar]
- Ibrahim, A.E.; Saleh, H.; Elhenawee, M. Assessment and validation of green stability indicating RP-HPLC method for simultaneous determination of timolol and latanoprost in pharmaceutical dosage forms using eco-friendly chiral mobile phase. Microchem. J. 2019, 148, 21–26. [Google Scholar] [CrossRef]
- Widomski, P.; Baran, P.; Gołȩbiewski, P.; Surowiec, I.; Bielejewska, A. Validated liquid chromatographic method for analysis of the isomers of latanoprost. Acta Chromatogr. 2008, 20, 157–164. [Google Scholar] [CrossRef]
- Mehta, J.; Patel, V.; Kshatri, N.; Vyas, N. A versatile LC method for the simultaneous quantification of latanoprost, timolol and benzalkonium chloride and related substances in the presence of their degradation products in ophthalmic solution. Anal. Methods 2010, 2, 1737–1744. [Google Scholar] [CrossRef]
- Velpandian, T.; Kotnala, A.; Halder, N.; Ravi, A.K.; Archunan, V.; Sihota, R. Stability of latanoprost in generic formulations using controlled degradation and patient usage simulation studies. Curr. Eye Res. 2015, 40, 561–571. [Google Scholar] [CrossRef] [PubMed]
- Latanoprost Ophthalmic Solution, USP Pending Monograph, Draft 1. Published online 2012. Available online: https://sandoz-ca.cms.sandoz.com/sites/default/files/Media%20Documents/Sandoz%C2%AE%20Latanoprost%20Monograph.pdf (accessed on 16 March 2025).
- ICH Q2(R2) Guideline on Validation of Analytical Procedures. Available online: https://www.ema.europa.eu/en/documents/scientific-guideline/ich-q2r2-guideline-validation-analytical-procedures-step-5-revision-1_en.pdf (accessed on 22 December 2023).
- ICH Topic Q 3 B (R2) Impurities in New Drug Products, ICH Q3B (R2) Impurities in new drug products—Scientific guideline | European Medicines Agency (EMA). Available online: https://www.ema.europa.eu/en/documents/scientific-guideline/ich-q-3-b-r2-impurities-new-drug-products-step-5_en.pdf (accessed on 1 June 2006).
- Manoranjani, M. Issue 6 www.jetir.org (ISSN-2349-5162). Vol. 6, JETIR1906262 Journal of Emerging Technologies and Innovative Research. 2019. Available online: https://www.jetir.org/papers/JETIR1906262.pdf (accessed on 14 June 2019).
- Sjöquist, B.; Tajallaei, S.; Stjernschantz, J. Pharmacokinetics of Latanoprost in the Cynomolgus Monkey 1st Communication: Single intravenous, oral or topical administration on the eye. Arzneim.-Forsch. Drug Res. 1999, 49, 225. [Google Scholar] [CrossRef]
- AOAC (Association of Official Analytical Chemists). Official Methods of Analysis. Appendix F: Guideline for Standard Method Performance Requirements AOAC International, 20th ed.; AOAC International: Arlington, VA, USA, 2016; ISBN 9780935584875. [Google Scholar]
- Wang, R.; Gagliuso, D.; Mittag, T.; Podos, S. Effect of 15-Keto Latanoprost on Intraocular Pressure and Aqueous Humor Dynamics in Monkey Eyes. Investig. Ophthalmol. Vis. Sci. 2007, 48, 4143–4147. [Google Scholar] [CrossRef] [PubMed]
- ICH Q14 Analytical procedure development—Scientific guideline, ICH Q14 Analytical procedure development—Scientific guideline | European Medicines Agency (EMA). Available online: https://www.ema.europa.eu/en/documents/scientific-guideline/ich-q14-guideline-analytical-procedure-development-step-5_en.pdf (accessed on 26 January 2024).


| Stationary Phase | Column Characteristic | Mobile Phase | Latanoprost RT [min] | Impurity F RT [min] | Resolution | Reference | |
|---|---|---|---|---|---|---|---|
| Dimension [mm] | Particle Size [µm] | ||||||
| Symmetry C18 | 150 × 4.6 | 5 | Phase A: 1.36 g/L KH2PO4 pH 6.8: ACN (700:300) Phase B: ACN: MeOH 1:1 (v/v) | 40.2 | 40.4 | Not separated | [13] |
| Intersil ODS | 250 × 4.6 | 5 | Phase A: 0.1 M KH2PO4; Phase B: ACN A:B (50:50 v/v) | 469.4 | 501.7 | Separated * | [15] |
| Spherisorb Phenyl | 150 × 4.6 | 5 | Octanosulphonic acid sodium salt 2.5 g/L of pH 2.5: ACN (70:30 v/v) | 13.2 | 13.0 | Not separated | [25] |
| Hypersil BDS CN | 250 × 4.6 | 5 | Phase A: 0.05 M sodium phosphate Na3PO4; pH 3.2; Phase B: ACN: MeOH (1:1 v/v), A:B (70:30 v/v) | 18.4 | 17.9 | Not separated | [20] |
| Results Agilent 1210 System UV/VIS Detector | Results Waters System/PDA Detector | Acceptance Criteria |
|---|---|---|
| Rslatanoprost/impF = 2.0 | Rslatanoprost/impF = 2.0 | Rslatanoprost/impF ≥ 1.8 |
| Std1% RSD (%)n=5 = 1.0 | Std1% RSD (%)n=5 = 3.6 | Std1% RSD (%) ≤ 5.0 |
| Std100% RSD (%)n=5 = 0.3 | Std100% RSD (%)n=5 = 0.4 | Std100% RSD (%) ≤ 2.0 |
| Std1% As = 1.0 | Std1% As = 1.0 | 0.8 ≤ As ≤ 1.5 |
| Std100% As = 1.0 | Std100% As = 1.0 | 0.8 ≤ As ≤ 1.5 |
| Type of Degradation/ Product | Identified Latanoprost Impurities Content 1 | Other single Impurities Content % 1 | Sum of Impurities | Latanoprost % Content 1 | PA/PT 3 Latanoprost | Mass Balance |
|---|---|---|---|---|---|---|
| Oxidation 3% H2O2 by 5 h | ||||||
| L+T+BAC | Imp. H—0.21% | RRT 0.65—0.87% RRT 0.66—0.72% | 1.8% | 92.7% | 0.394 | 95.0% |
| L+BAC | Imp. H < RT 2 | RRT 0.65—0.17% | 0.2% | 94.0% | 0.558 | 94.7% |
| Photolysis UV light 1 h | ||||||
| L+T+BAC | Imp. F—22.9% Imp. H—0.75% | RRT 0.29—0.11% RRT 0.55—0.14% RRT 0.57—0.21% | 24.1% | 70.8% | 0.414 | 95.4% |
| L+BAC | Imp. F < RT 2 Imp. H < RT 2 | <R T2 | NA | 98.7% | 0.471 | 99.2% |
| Alkaline hydrolysis 0.1 M NaOH by 4 h | ||||||
| L+T+BAC | Imp. H < RT 2 | <RT 2 | NA | 96.9% | 0.295 | 97.4% |
| L+BAC | Imp. H—3.30% | <RT 2 | 3.3% | 93.0% | 0.299 | 96.8% |
| Alkaline hydrolysis 0.2 M NaOH by 4 h | ||||||
| L+T+BAC | Imp. H—99.7% | <RT 2 | 99.7% | 0.3% | 0.275 | 100.5% |
| L+BAC | Imp. H—99.7% | <RT 2 | 99.7% | 0.2% | 0.562 | 100.4% |
| Acid hydrolysis 0.2 M HCl by 2 */4 ** h | ||||||
| ** L+T+BAC | Imp. H—0.41% | <RT 2 | 0.41% | 93.2% | 0.570 | 97.3% |
| * L+BAC | Imp. H < RT2 | <RT 2 | NA | 98.3% | 0.483 | 98.2% |
| Thermal degradation 40 C/24 h | ||||||
| L+T+BAC | Imp. H < RT 2 | RRT 0.43—0.14%; RRT 0.47—0.15% | 0.29% | 97.8% | 0.274 | 98.6% |
| L+BAC | Imp. H < RT 2 | <RT 2 | NA | 97.3% | 0.231 | 97.8% |
| Thermal degradation 80 C/24 h | ||||||
| L+T+BAC | Imp. H—0.83% | <RT 2 | 0.83% | 98.9% | 0.259 | 100.2% |
| L+BAC | Imp. H—1.39% | <RT 2 | 1.39% | 97.4% | 0.275 | 99.3% |
| Inj. No. | Latanoprost ~50 µg/mL | Latanoprost ~0.5 µg/mL | Imp. H ~0.50 µg/mL | Imp. F ~0.88 µg/mL | Imp. E ~0.14 µg/mL | |||||
|---|---|---|---|---|---|---|---|---|---|---|
| Peak Area [µS × s] | RT [min] | Peak Area [µS × s] | RT [min] | Peak Area [µS × s] | RT [min] | Peak Area [µS × s] | RT [min] | Peak Area [µS × s] | RT [min] | |
| 1 | 11,615,872 | 68.06 | 125,574 | 68.38 | 119,610 | 36.17 | 224,886 | 71.41 | 31,819 | 82.27 |
| 2 | 11,625,870 | 67.96 | 124,860 | 68.01 | 120,420 | 36.19 | 223,772 | 71.51 | 34,026 | 82.33 |
| 3 | 11,586,447 | 67.88 | 124,486 | 68.26 | 120,851 | 36.35 | 224,028 | 71.60 | 32,604 | 82.57 |
| 4 | 11,586,125 | 67.88 | 124,219 | 68.01 | 119,817 | 36.21 | 224,399 | 71.32 | 35,571 | 82.13 |
| 5 | 11,559,556 | 67.83 | 122,304 | 67.87 | 119,608 | 36.21 | 227,636 | 71.32 | 33,540 | 82.17 |
| 6 | 11,549,791 | 67.81 | 123,126 | 67.99 | 119,723 | 36.21 | 227,489 | 71.42 | 35,167 | 82.30 |
| mean | 11,587,277 | 67.90 | 124,095 | 68.09 | 120,005 | 36.22 | 225,368 | 71.43 | 33,788 | 82.30 |
| SD | 29,942 | 0.09 | 1191 | 0.19 | 513 | 0.06 | 1741 | 0.11 | 1448 | 0.16 |
| RSD% | 0.26 | 0.14 | 0.96 | 0.28 | 0.43 | 0.18 | 0.77 | 0.15 | 4.28 | 0.19 |
| Performance Characteristic | Latanoprost Assay | Latanoprost Unknown Impurities | Imp. E | Imp. F | Imp. H |
|---|---|---|---|---|---|
| Range [µg/mL] | 40–60 µg/mL | 0.05–2.77 µg/mL | 0.05–0.41 µg/mL | 0.05–2.79 µg/mL | 0.05–1.78 µg/mL |
| Accuracy | |||||
| Recovery 1 | conc. ~40 µg/mL 99.0% (RSDn=3—1.0%) | conc. ~0.05 µg/mL 101.6% (RSDn=3—2.4%) | conc. ~0.08 µg/mL 102,0% (RSDn=3—2.9%) | conc. ~0.1 µg/mL 95.0 (RSDn=3—3.0%) | conc. ~0.08 µg/mL 91.7% (RSDn=3—0.6%) |
| Recovery 2 | conc. ~50 µg/mL 99.8% (RSDn=3—0.5%) | conc. ~0.5 µg/mL 92.4% (RSDn=3—1.4%) | conc. ~0.3 µg/mL 97.3% (RSDn=3—5.8%) | conc. ~0.4 µg/mL 99.4% (RSDn=3—2.1%) | conc. ~0.8 µg/mL 92.8% (RSDn=3—0.6%) |
| Recovery 3 | conc. ~60 µg/mL 99.3% (RSDn=3—0.1%) | conc. ~2.8 µg/mL 95.6% (RSDn=3—1.1%) | conc. ~0.4 µg/mL 96.9% (RSDn=3—1.4%) | conc. ~2 µg/mL 103.5% (RSDn=3—1.6%) | conc. ~1.5 µg/mL 93.6% (RSDn=3—1.4%) |
| Mean (R ± ΔR) | 99.4% ± 0.5% * | 96.5% ± 3.1% * | 98.8% ± 3.1% * | 99.3 ± 3.2% * | 92.71 ± 0.9% * |
| SD | 0.6% (n = 9) | 4.1 (n = 9) | 4.1 (n = 9) | 4.2 (n = 9) | 1.1 (n = 9) |
| RSD% | 0.6% (n = 9) | 4.2 (n = 9) | 4.1 (n = 9) | 4.2 (n = 9) | 1.2 (n = 9) |
| Linearity | |||||
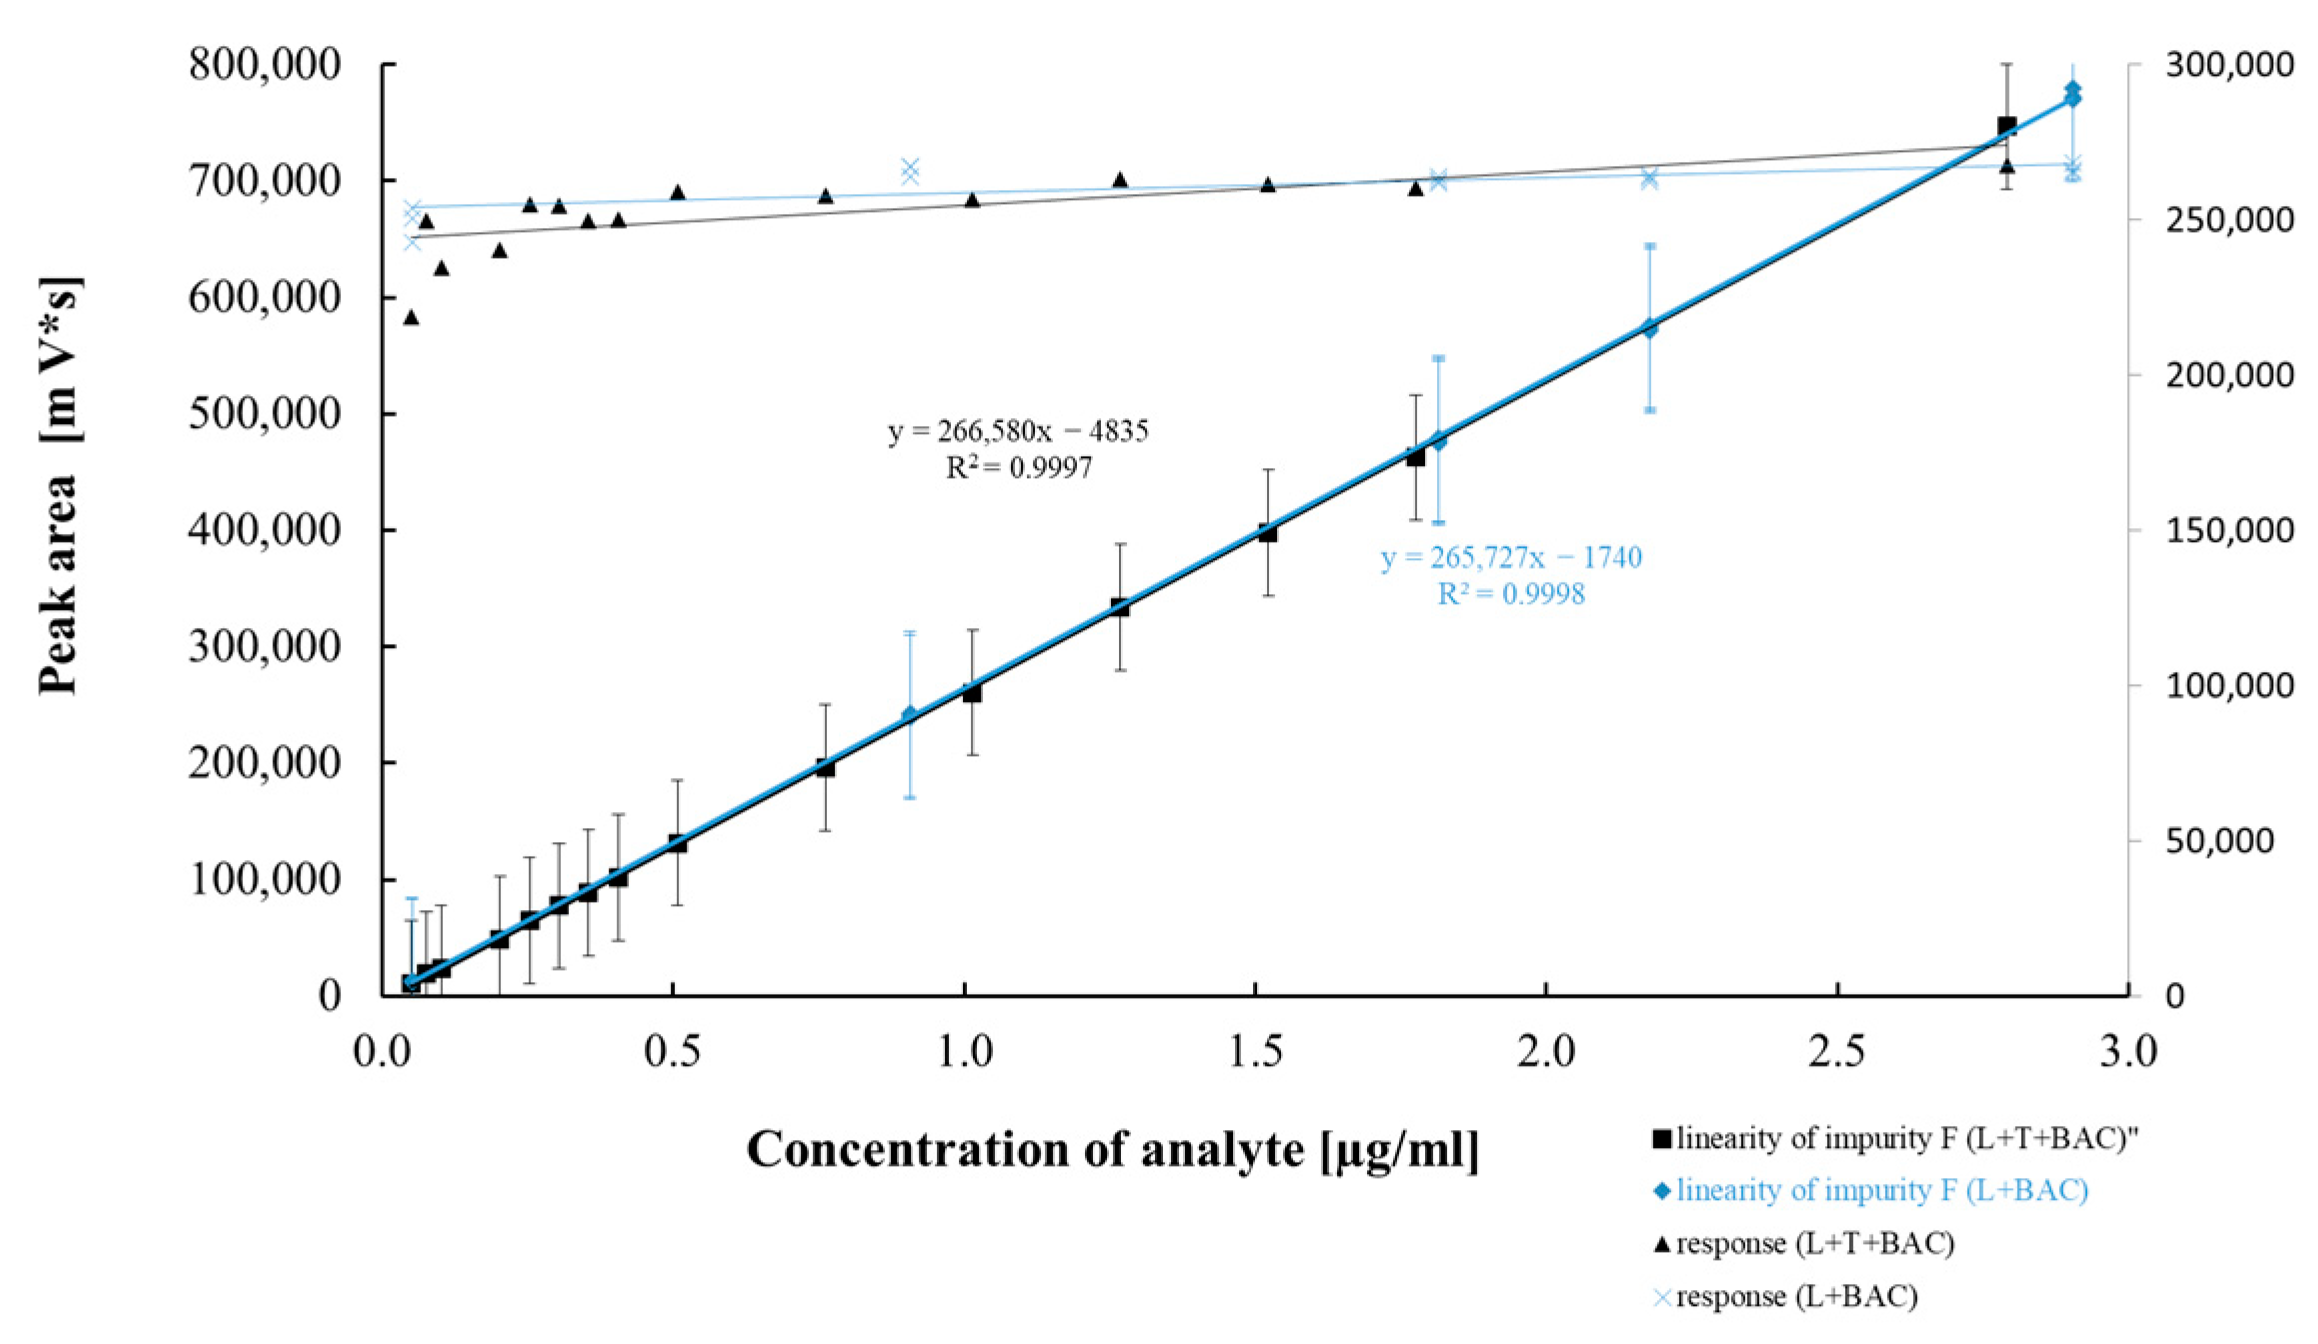
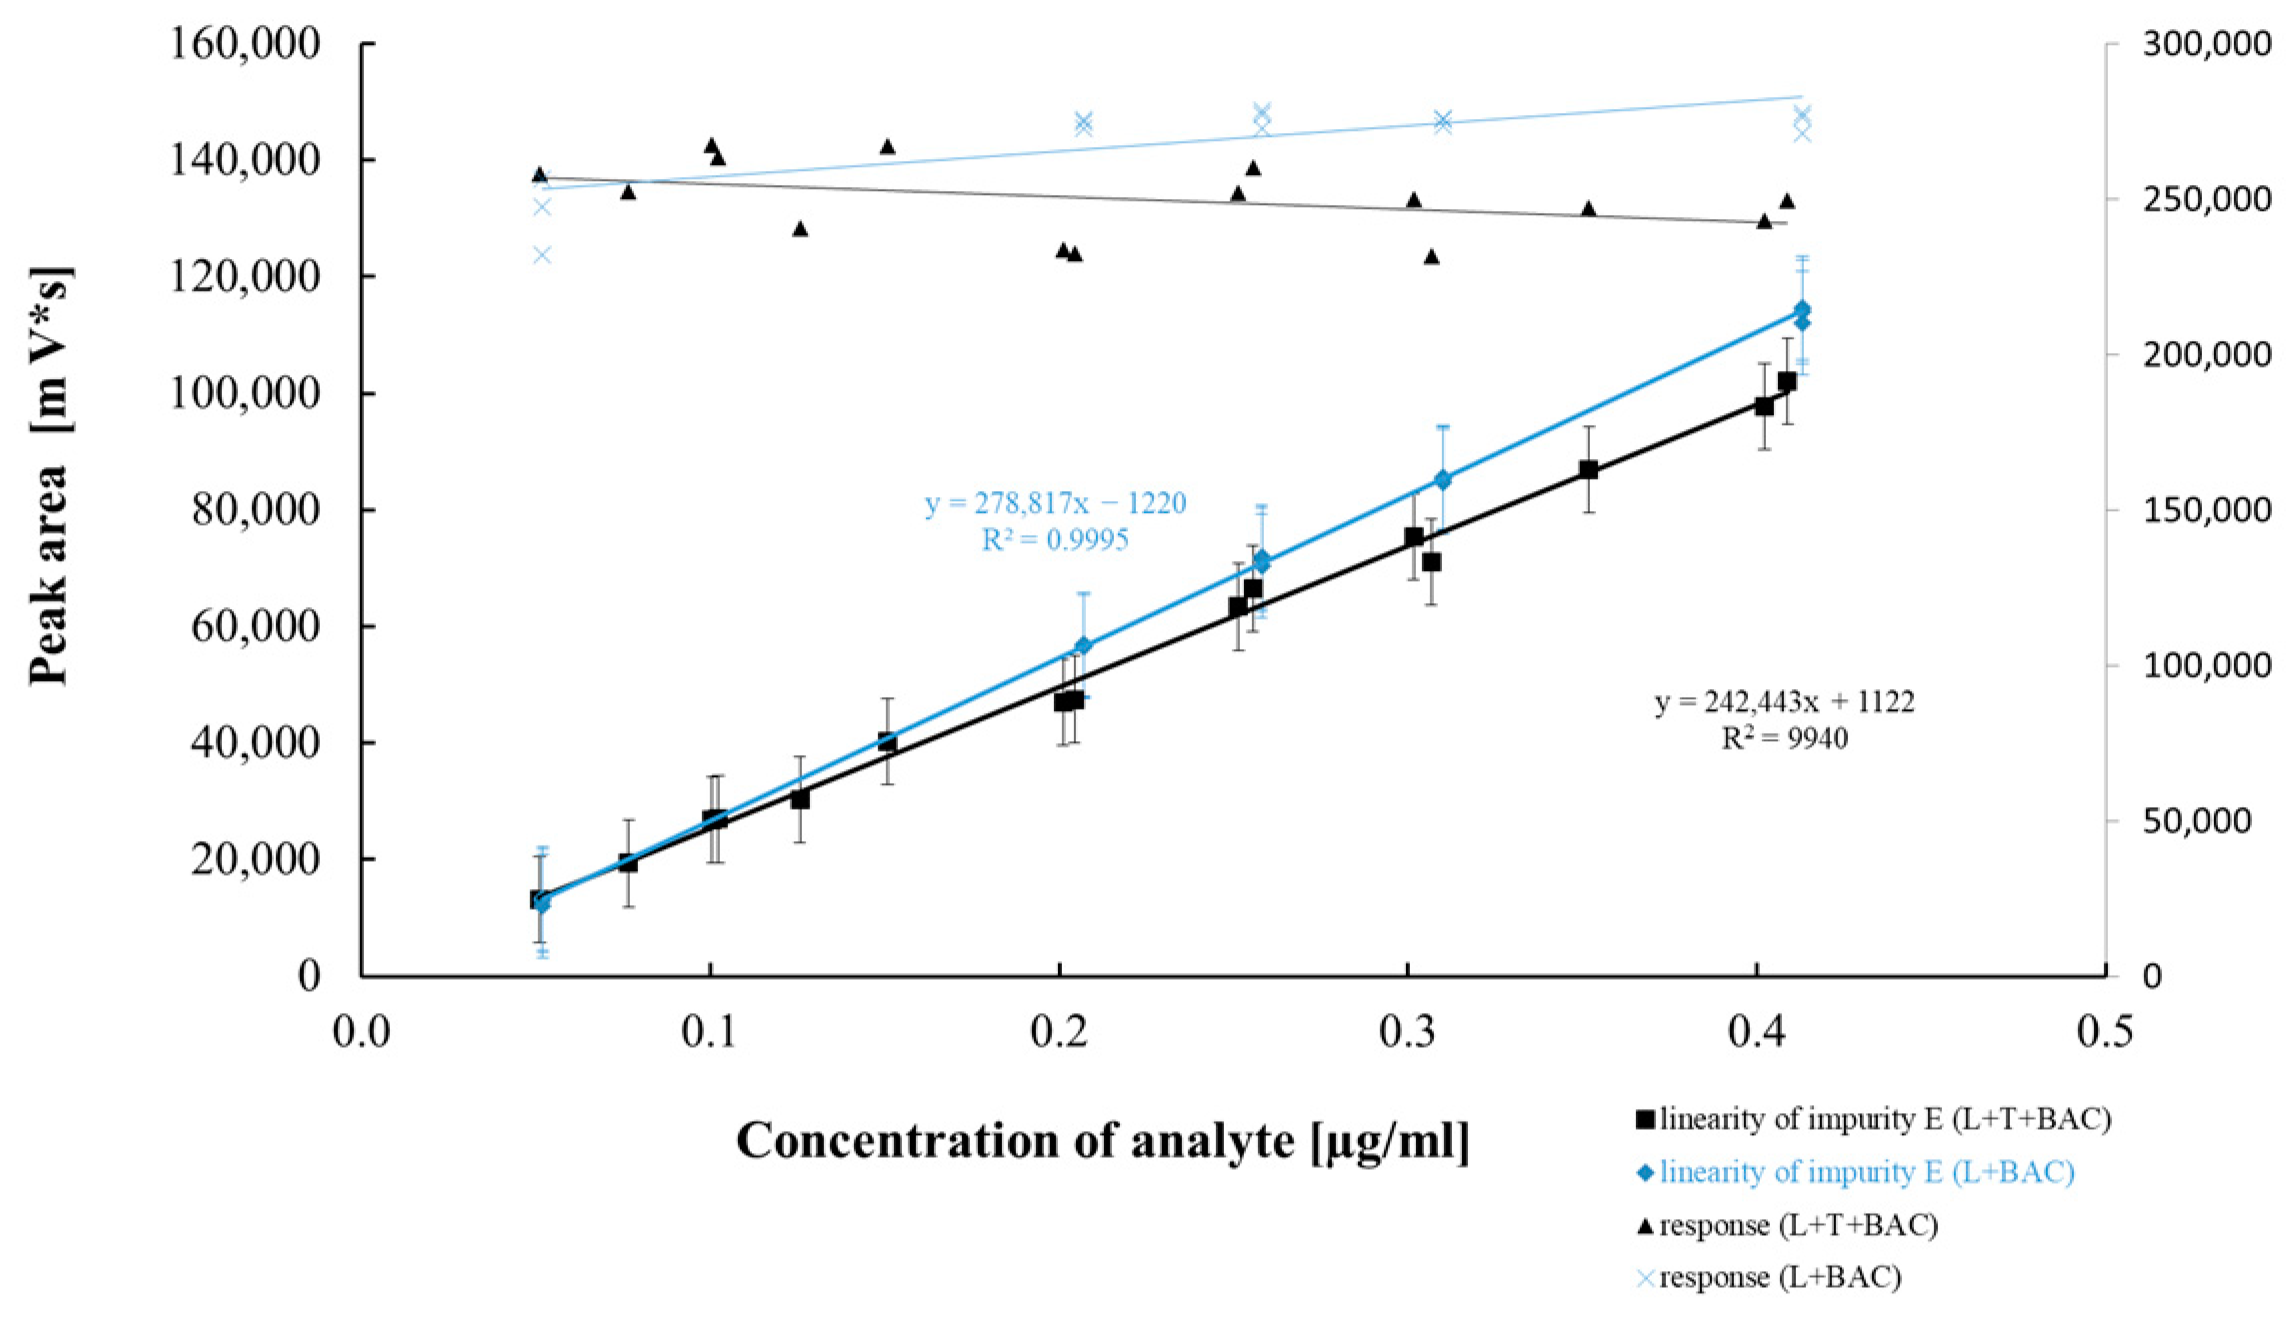
| Regression equation | Y = 239,779x − 75,565 | Y = 234,862x − 178 | Y = 242,443x + 1122 | Y = 266,580x − 4835 | Y = 237,817x − 630 |
| Slope (b ± Δb) | 239,779 ± 7437 | 234,862 ± 1926 | 242,443 ± 11246 | 266,580 ± 2623 | 237,817 ± 1552 |
| Sb | 3443 | 891 | 5206 | 1214 | 906 |
| Intercept (a ± Δa) | −75,565 ± 385,507 | −178 ± 2906 | 1122 ± 2779 | −4835 ± 2812 | −630 ± 1552 |
| Sa | 178,475 | 1345 | 1287 | 1302 | 719 |
| Sxy | 90,601 | 3689 | 2294 | 3560 | 1896 |
| Correlation coefficient | 0.999 | 0.999 | 0.997 | 0.999 | 0.999 |
| p value ** | 4.10 × 10⁻¹⁸ | 1.27 × 10⁻²⁵ | 7.53 × 10⁻¹⁶ | 1.37 × 10⁻²⁴ | 1.34 × 10⁻²⁵ |
| Precision | |||||
| Repeatability | X1(mean n=6) 95.65% | X1(n=6) 0.20% (0.10 µg/mL) | X1(n=6) 0.26% (0.13 µg/mL) | X1(n=6) 1.89% (0.94 µg/mL) | X1(n=6) 1.00% (0.50 µg/mL) |
| SD n = 6 | 0.47% | 0.01% (0.00 µg/mL) | 0.01% (0.01 µg/mL) | 0.01% (0.01 µg/mL) | 0.01% (0.00 µg/mL) |
| RSD | 0.49% | 2.81% | 5.19% | 0.64% | 0.51% |
| Intermediate precision | X2(mean n=6) 95.80% | X2(n=6) 0.20% (0.10 µg/mL) | X2(n=6) 0.29% (0.15 µg/mL) | X2(n=6) 1.79% (0.89 µg/mL) | X2(n=6) 0.97% (0.49 µg/mL) |
| SD n = 6 | 0.83% | 0.01% (0.00 µg/mL) | 0.01% (0.01 µg/mL) | 0.01% (0.01 µg/mL) | 0.00% |
| RSD n = 6 | 0.87% | 3.16% | 2.58% | 0.74% | 0.42% |
| Meann=12 ± ΔX | X(n=12) 95.73 ± 0.41% | X(n=12) 0.20% (0.10 µg/mL) | X(n=12) 0.28% (0.14 µg/mL) | X(n=12) 1.84% (0.92 µg/mL) | X(n=12) 0.99% (0.50 µg/mL) |
| 0.15% | 0.00% (0.00 µg/mL) | 0.03% (0.02 µg/mL) | 0.10% (0.05 µg/mL) | 0.03% (0.01 µg/mL) | |
| SD n = 12 | 0.65% | 0.01% (0.00 µg/mL) | 0.02% (0.01 µg/mL) | 0.05% (0.03 µg/mL) | 0.02% (0.01 µg/mL) |
| RSD n = 12 | 0.68% | 3.15% | 6.54% | 2.87% | 1.73% |
| Performance Characteristic | Latanoprost Assay | Latanoprost Unknown Impurities | Imp. E | Imp. F | Imp. H |
|---|---|---|---|---|---|
| Range | 40–60 µg/mL | 0.05–2.77 µg/mL | 0.05–0.41 µg/mL | 0.05–2.79 µg/mL | 0.05–1.78 µg/mL |
| Accuracy | |||||
| Recovery 1 | conc. ~40 µg/mL 98.8% (RSDn=3—0.7%) | conc. ~0.05 µg/mL 93.2% (RSDn=3—2.5%) | conc. ~0.05 µg/mL 97.4% (RSDn=3—5.0%) | conc. ~0.05 µg/mL 98.1% (RSDn=3—1.9%) | conc. ~0.05 µg/mL 96.7% (RSDn=3—1.2%) |
| Recovery 2 | conc. ~50 µg/mL 99.0% (RSDn=3—0.3%) | conc. ~1 µg/mL 93.7% (RSDn=3—1.7%) | conc. ~0.3 µg/mL 107.9% (RSDn=3—2.6%) | conc. ~2 µg/mL 103.6% (RSDn=3—0.4%) | conc. ~0.8 µg/mL 95.2% (RSDn=3—2.9%) |
| Recovery 3 | conc. ~60 µg/mL 98.3% (RSDn=3—0.1%) | conc. ~2.8 µg/mL 96.8% (RSDn=3—0.9%) | conc. ~0.4 µg/mL 105.9% (RSDn=3—3.6%) | conc. ~2.9 µg/mL 105.1% (RSDn=3—0.7%) | conc. ~1.5 µg/mL 95.6% (RSDn=3—2.5%) |
| Mean (R ± ΔR) | 98.7% ± 0.4% * | 94.6% ± 1.7% * | 103.7% ± 4.5% * | 102.3% ± 2.6% * | 95.8% ± 1.6% * |
| SD | 0.5% (n = 9) | 2.3 (n = 9) | 5.9 (n = 9) | 3.4 (n = 9) | 2.0 (n = 9) |
| RSD% | 0.5% (n = 9) | 2.4 (n = 9) | 5.7 (n = 9) | 3.3 (n = 9) | 2.1 (n = 9) |
| Linearity | |||||
| Regression equation | y = 231,609x + 48,800 | y = 261,851x − 4725 | y = 278,817x − 1220 | y = 265,770x − 1769 | y = 240,793x − 134 |
| Slope (b ± Δb) | 231,609 ± 1515 | 261,851 ± 1926 | 278,817 ± 3794 | 265,770 ± 2270 | 240,793 ± 6485 |
| Sb | 701 | 1796 | 1757 | 1051 | 3002 |
| Intercept (a ± Δa) | 48,800 ± 80,231 | −4725 ± 5988 | −1220 ± 1045 | −1769 ± 4222 | −134 ± 6479 |
| Sa | 37,144 | 2772 | 484 | 1955 | 2999 |
| Sxy | 45,855 | 6686 | 814 | 4051 | 6026 |
| Correlation coefficient (r) | 0.999 | 0.999 | 0.999 | 0.999 | 0.999 |
| p value ** | 6.78 × 10⁻²⁷ | 2.69 × 10⁻²² | 9.71 × 10⁻²³ | 2.27 × 10⁻²⁵ | 6.80 × 10⁻¹⁹ |
| Precision | |||||
| Repeatability | X1(mean n=6) 95.65% | <LOD (0.05%) | X1(n=6) 0.23% (0.11 µg/mL) | X1(n=6) 2.52% (1.26 µg/mL) | X1(n=6) 0.55% (0.28 µg/mL) |
| SD n = 6 | 0.47% | NA | 0.01% (0.00 µg/mL) | 0.01% (0.00 µg/mL) | 0.00% (0.00 µg/mL) |
| RSD | 0.49% | NA | 3.30% | 0.21% | 0.00% |
| Intermediate precision | X2(mean n=6) 95.80% | <LOD (0.05%) | X2(n=6) 0.32% (0.16 µg/mL) | X2 (n=6) 2.57% (1.28 µg/mL) | X2(n=6) 0.65% (0.33 µg/mL) |
| SD n = 6 | 0.83% | NA | 0.02% (0.01 µg/mL) | 0.05% (0.02 µg/mL) | 0.01% (0.00 µg/mL) |
| RSD n = 6 | 0.87% | NA | 5.59% | 1.84% | 0.92% |
| Mean n = 12 | X(n=12) 95.73 ± 0.41% | NA | X(n=12) 0.27% (0.14 µg/mL) | X(n=12) 2.54% (1.27 µg/mL) | X(n=12) 0.60% (0.30 µg/mL) |
| 0.15% | NA | 0.09% (0.05 µg/mL) | 0.05% (0.03 µg/mL) | 0.10% (0.05 µg/mL) | |
| SD n = 12 | 0.65% | NA | 0.05% (0.02 µg/mL) | 0.04% (0.02 µg/mL) | 0.05% (0.03 µg/mL) |
| RSD n = 12 | 0.68% | NA | 18.10% | 1.63% | 8.73% |
| Tested Product Parameter | Latanoprost | Imp. F | Imp. H | Imp. E |
|---|---|---|---|---|
| L+BAC | ||||
| Slope (b) | 261,851 | 265,770 | 240,793 | 278,817 |
| Sy | 2772 | 1955 | 2999 | 484 |
| LOQ [µg/mL] | 0.11 | 0.07 | 0.12 | 0.02 |
| LOD [µg/mL] | 0.03 | 0.02 | 0.04 | 0.01 |
| L+T+BAC | ||||
| Slope (b) | 234,862 | 266,580 | 237,817 | 242,443 |
| Sy | 1345 | 1302 | 719 | 1287 |
| LOQ [µg/mL] | 0.06 | 0.05 | 0.03 | 0.05 |
| LOD [µg/mL] | 0.02 | 0.01 | 0.01 | 0.02 |
| Limit | Latanoprost Concentration µg/mL (%) 1 | S/N 2 | RSD (n = 6) |
|---|---|---|---|
| LOD | 0.025 (0.05%) | 19 | 6.0% |
| LOQ | 0.035 (0.07%) | 27 | 2.4% |
| Analysis Conditions | SST Parameters | ||
|---|---|---|---|
| Reference Solution of Latanoprost 1.0% | SST Solution | ||
| RSD(%) Latanoprost Peak Area (n = 5) | As *** | Rs **** | |
| Acc. TM * | 1.25 | 1.1 | 2.1 |
| column temperature: −2 °C ** | 1.97 | 1.1 | 2.1 |
| column temperature: +2 °C ** | 2.01 | 1.1 | 2.1 |
| Acc. TM *, chromatographic system set 1 | 1.73 | 1.1 | 2.0 |
| Acc. TM *, chromatographic system set 2 | 1.58 | 1.1 | 1.9 |
| Acc. TM * | 1.46 | 1.1 | 2.2 |
| −2% of acetonitrile in mobile phase ** | 0.36 | 1.1 | 2.0 |
| +2% of acetonitrile in mobile phase ** | 1.52 | 1.1 | 2.1 |
| SST Acceptance criteria: | RSD(%) ≤ 5.0 | 0.8 ≤ As ≤ 1.5 | ≥ 1.8 |
| Analysis Conditions | Results | |||
|---|---|---|---|---|
| Related Substances | Assay | |||
| Impurity H | Impurity F | Impurity E | latanoprost | |
| Acc. TM * | 0.55% *** | 2.47% *** | 0.22% *** | 92.7% *** |
| column temperature: −2 °C ** | 0.52% *** | 2.28% *** | 0.19% *** | 91.8% *** |
| column temperature: +2 °C ** | 0.54% *** | 2.45% *** | 0.18% *** | 92.8% *** |
| RSD% 2.85 | RSD% 4.35 | RSD% 10.58 | RSD% 0.60 | |
| Acc. TM *, chromatographic set 1 | 0.55% *** | 2.52% *** | 0.23% *** | 92.7% *** |
| Acc. TM *, chromatographic set 2 | 0.65% *** | 2.60% *** | 0.28% *** | 93.8% *** |
| RSD% 11.79 | RSD% 2.21 | RSD% 13.86 | RSD% 0.83 | |
| Acc. TM * | 0.59% *** | 2.68% *** | 0.24% *** | 93.8% *** |
| −2% of acetonitrile in mobile phase ** | 0.66% *** | 2.43% *** | 0.19% *** | 93.9% *** |
| +2% of acetonitrile in mobile phase ** | 0.64% *** | 2.50% *** | 0.30% *** | 93.7% *** |
| RSD% 5.72 | RSD% 5.08 | RSD% 22.63 | RSD% 0.11 | |
| Xalatan Batch 1 | Xalatan Batch 2 | Latanoprost Formulation BAC Free Batch 1 | Latanoprost, Formulation BAC Free Batch 2 | |
|---|---|---|---|---|
| Latanoprost assay | 92.4% | 92.8% | 93.6% | 95.3% |
| Impurity F | 2.27% | 2.93% | <RT * | <RT * |
| Impurity E | 0.14% | 0.14% | <RT * | <RT * |
| Impurity H | 1.48% | 0.89% | 1.02% | 1.05% |
| Impurity D | <RT * | <RT * | <RT * | <RT * |
| TPPO | <RT * | <RT * | <RT * | <RT * |
| Latanoprost enantiomer | <RT * | <RT * | <RT * | <RT * |
| 15-ketolatanoprost | <RT * | <RT * | <RT * | <RT * |
| Total | 3.9% | 4.0% | 1.8% | 2.1% |
| Xalacom Batch 1 | Xalacom Batch 2 | Latanoprost, Timolol Formulation BAC Free Batch 1 | Latanoprost, Timolol Formulation BAC Free Batch 2 | |
|---|---|---|---|---|
| Latanoprost assay | 96.4% | 101.8% | 97.6% | 99.2% |
| Impurity F | 2.0% | 2.7% | 0.10% | 0.10% |
| Impurity E | 0.10% | <0.10% | <RT * | <RT * |
| Impurity H | <0.10% | 0.35% | 1.2% | 1.2% |
| Impurity D | <RT * | <RT * | <RT * | <RT * |
| TPPO | <RT * | <RT * | <RT * | <RT * |
| Latanoprost enantiomer | <RT * | <RT * | <RT * | <RT * |
| 15-ketolatanoprost | <RT * | <RT * | <RT * | <RT * |
| Total | 2.1% | 3.4% | 1.5% | 1.9% |
| Time Point (min) | Flow (mL/min) | Phase A (% v/v) | Phase B (% v/v) |
|---|---|---|---|
| 0 | 0.5 | 100 | 0 |
| 18.0 | 0.5 | 100 | 0 |
| 30.0 | 0.5 | 85 | 15 |
| 60.0 | 0.5 | 85 | 15 |
| 75.0 | 0.4 | 88 | 12 |
| 100.0 | 0.5 | 88 | 12 |
| 115.0 | 0.5 | 88 | 12 |
| 116.0 | 1.0 | 50 | 50 |
| 127.0 | 0.5 | 50 | 50 |
| 128.0 | 1.0 | 50 | 50 |
| 140.0 | 0.5 | 100 | 0 |
Disclaimer/Publisher’s Note: The statements, opinions and data contained in all publications are solely those of the individual author(s) and contributor(s) and not of MDPI and/or the editor(s). MDPI and/or the editor(s) disclaim responsibility for any injury to people or property resulting from any ideas, methods, instructions or products referred to in the content. |
© 2025 by the authors. Licensee MDPI, Basel, Switzerland. This article is an open access article distributed under the terms and conditions of the Creative Commons Attribution (CC BY) license (https://creativecommons.org/licenses/by/4.0/).
Share and Cite
Asendrych-Wicik, K.; Malik, K.; Markowicz-Piasecka, M. Developing a Chromatographic Method for Quantifying Latanoprost and Related Substances in Glaucoma Treatments. Pharmaceuticals 2025, 18, 619. https://doi.org/10.3390/ph18050619
Asendrych-Wicik K, Malik K, Markowicz-Piasecka M. Developing a Chromatographic Method for Quantifying Latanoprost and Related Substances in Glaucoma Treatments. Pharmaceuticals. 2025; 18(5):619. https://doi.org/10.3390/ph18050619
Chicago/Turabian StyleAsendrych-Wicik, Katarzyna, Katarzyna Malik, and Magdalena Markowicz-Piasecka. 2025. "Developing a Chromatographic Method for Quantifying Latanoprost and Related Substances in Glaucoma Treatments" Pharmaceuticals 18, no. 5: 619. https://doi.org/10.3390/ph18050619
APA StyleAsendrych-Wicik, K., Malik, K., & Markowicz-Piasecka, M. (2025). Developing a Chromatographic Method for Quantifying Latanoprost and Related Substances in Glaucoma Treatments. Pharmaceuticals, 18(5), 619. https://doi.org/10.3390/ph18050619