Article

Absorption Distribution Metabolism Excretion and Toxicity Property Prediction Utilizing a Pre-Trained Natural Language Processing Model and Its Applications in Early-Stage Drug Development

1
College of Pharmacy, Chungnam National University, Daejeon 34134, Republic of Korea
2
Department of Bio-AI convergence, Chungnam National University, Daejeon 34134, Republic of Korea
3
Computer Science and Engineering, Chungnam National University, Daejeon 34134, Republic of Korea
*
Authors to whom correspondence should be addressed.
These authors contributed equally to this work.
Pharmaceuticals 2024, 17(3), 382; https://doi.org/10.3390/ph17030382
Submission received: 20 February 2024 / Revised: 14 March 2024 / Accepted: 15 March 2024 / Published: 17 March 2024
(This article belongs to the Special Issue Machine Learning Methods for Medicinal Chemistry)

Abstract

:
Machine learning techniques are extensively employed in drug discovery, with a significant focus on developing QSAR models that interpret the structural information of potential drugs. In this study, the pre-trained natural language processing (NLP) model, ChemBERTa, was utilized in the drug discovery process. We proposed and evaluated four core model architectures as follows: deep neural network (DNN), encoder, concatenation (concat), and pipe. The DNN model processes physicochemical properties as input, while the encoder model leverages the simplified molecular input line entry system (SMILES) along with NLP techniques. The latter two models, concat and pipe, incorporate both SMILES and physicochemical properties, operating in parallel and with sequential manners, respectively. We collected 5238 entries from DrugBank, including their physicochemical properties and absorption, distribution, metabolism, excretion, and toxicity (ADMET) features. The models’ performance was assessed by the area under the receiver operating characteristic curve (AUROC), with the DNN, encoder, concat, and pipe models achieved 62.4%, 76.0%, 74.9%, and 68.2%, respectively. In a separate test with 84 experimental microsomal stability datasets, the AUROC scores for external data were 78% for DNN, 44% for the encoder, and 50% for concat, indicating that the DNN model had superior predictive capabilities for new data. This suggests that models based on structural information may require further optimization or alternative tokenization strategies. The application of natural language processing techniques to pharmaceutical challenges has demonstrated promising results, highlighting the need for more extensive data to enhance model generalization.

1. Introduction

Over the past few decades, the landscape of drug discovery has been significantly transformed by the integration of in silico methodologies, witnessing a substantial surge in efficiency and effectiveness. This revolution in computational approaches has been instrumental in streamlining the drug screening process, thereby offering the pharmaceutical industry considerable savings in terms of both costs and time. Among the various strategies employed, Quantitative Structure–Activity Relationship (QSAR) models have emerged as a cornerstone for predicting the chemical properties of compounds. The foundational premise of QSAR models is the assumption that compounds with analogous structures are likely to exhibit similar activities, thereby enabling the prediction of chemical activity through structural analysis.
Traditionally, QSAR models have relied on machine learning (ML) techniques, including but not limited to support vector machines, decision trees, naive Bayes, and k-nearest neighbors [1,2]. These methods typically dissect the structure of molecules into predefined molecular fragments or employ theoretical molecular descriptors, often determined through human judgment on a training dataset. Such an approach, while functional, has its limitations, particularly in terms of predictability on novel datasets.
However, the advent of deep learning is reshaping this landscape by addressing the shortcomings of conventional QSAR methodologies. Deep learning algorithms have the capacity to algorithmically define the criteria for analysis, thus bypassing the constraints imposed by human-set parameters. This advancement not only enhances the predictive accuracy of these models but also broadens their application. Furthermore, a significant limitation of traditional QSAR models has been their reliance solely on compounds with available ADMET experimental results for model construction. Considering the vast number of synthesized compounds, the subset with ADMET data is relatively small, posing a considerable challenge to the generalization of ADMET prediction models.
An online competition held in 2012 revealed the potential of deep learning algorithms to address problems with pharmaceuticals, such that there has been a shift toward the deep-learning techniques. Although deep learning has shown promising results that can replace traditional methods, some problems in deep learning remain [3]. Deep learning models tend to improve their performance by memorizing the inputs, which can increase their dependency on the tested data [4,5,6]. This tendency is even more pronounced in pharmaceutical fields, for example, the relationship between a molecular structure and its properties. Because molecular data come in various forms depending on their specific domain, many efforts to generate compatible data and to make a link between various domains are under process. Due to the mutual understanding of computer-aided drug design (CADD) in pharmaceutical fields, various trials to predict pharmacologic features and endpoints in drug development are being made with machine learning [7,8,9]. In terms of pharmacology, the features concerning absorption, distribution, metabolism, excretion, and toxicity (ADMET) are of significant interest in typical drug development and can be used for weighing the systemic exposure and potential side effects of a candidate drug. Since this systemic exposure is affected by numerous factors and features, reliable ADMET prediction has the utmost priority before candidate drugs are further evaluated in real clinical situations [10].
In techniques for deep learning, graph convolutional neural networks (GCNNs) enable the dynamic learning of chemical structures by considering a space for atoms and adjacent bonds [11]. After the advantages of GCNNs were demonstrated, new featurization approaches based on multitasking or sequential learning were implemented using GCNNs, leading to further performance improvements [12]. However, despite these improvements, GCNNs have difficulties with unlabeled structures because they require many feature parameters. In a recent study, however, contrastive learning in GCNN was introduced to resolve this problem [13], showing remarkable performance improvements along the tasks. Just as there was a certain level of progression in the performance utilizing graph neural networks, this was also demonstrated in natural language processing. Transformer-based learning is vigorously performed in this field; recent natural language technique applications during drug development tasks were successful in improving benchmark results. Within natural language processing (NLP), bidirectional encoder representations from transformers (BERT) have significantly improved NLP over the past 4 years via transformer pre-training and task-specific model fine-tuning [14]. Because BERT is generally used in conjunction with masked language modeling (MLM), it is also expected to be able to deal with the atom, masking the problems seen in GCNNs.
In addition, BERT is capable of handling large amounts of data because it was originally designed to deal with large volumes of text. In 2020, Chithrananda et al. introduced ChemBERTa, which contains 77 million simplified molecular input-line entry systems (SMILES) from PubChem and was designed to perform large-scale self-supervised pre-training for molecular property predictions. ChemBERTa is expected to provide promising performance for representation learning and molecular property prediction as a pre-trained model [15].
In addition to BERT, models that employ transformers and that have shown effectiveness in masked modeling, such as BART (Bidirectional Auto-Regressive Transformers) [16] and ELECTRA (Efficiently Learning an Encoder that Classifies Token Replacements Accurately) [17], could serve as promising pre-trained models in drug discovery. Performance metrics in these studies have exceeded those of traditional approaches in many tasks, as has been previously demonstrated in language tasks [18].
Both GCNN and NLP models are continuously evolving, complementing each other’s weaknesses, yet an examination in terms of the weaknesses and strengths of the NLP technique is not sufficiently considered across the aspects of pharmacy. In this study, (1) the performance of natural language models of ChemBERTa and ELECTRA were assessed on benchmark datasets with other prediction models, and (2) large-scale transfer learning with fine tunings to natural language models in ADMET problems was carried out to test its ability to perform multi-task prediction. (3) The models were then assessed on the external dataset to investigate the NLP model’s generalization towards ADMET problems.

2. Results

2.1. MoleculeNet Dataset

In Table 1 and Table 2, the results from the MoleculeNet dataset are shown. The mean and standard deviation of AUROC or RMSE and MAP on each dataset are reported. In reference to the benchmark result from Wang et al., the performance metrics of supervised learning models or graph models were compared with those of ChemBERTa and ELECTRA. In classification tasks, ChemBERTa recorded around mid-ranks on average and showed superior performance on toxicity problems like Tox21 and ClinTox (ranked 1st and 3rd, respectively). ELECTRA ranked slightly below ChemBERTa scores in general. Both ChemBERTa and ELECTRA scored almost the lowest in regression tasks. The performance of ELECTRA was lower than that of ChemBERTa in most tasks except ESOL and QM7.

2.2. DrugBank Dataset

Based on the AUROC values, the encoder model had the best performance (76.0%), followed by the concat model (74.9%), the pipe model (68.2%), the DNN_A model (63.6%), the DNN model (62.4%), and the pipe_A model (61.2%). The encoder and concat models, which included pre-trained models, generally showed higher predictive power than the others. The pipe model showed comparatively low performance, even though it utilized a pre-trained model. The incorporation of attention slightly increased the performance of the DNN model but decreased the pipe model’s performance.
Although DNN is the simplest model, it uses parameters that are considered important in drug development, and it can be identified that the performance is not significantly inferior compared to other models. It was shown that the performance of the DNN’s simple model slightly improved due to the addition of attention. Considering that encoder and concat are similar in structure and differ only in the input information, it has been shown that important structural information can be sufficiently reflected by SMILES in the QSAR work process.
The pipe model, comprising two steps that predict physicochemical information and ADMET properties, may have exhibited decreased performance due to uncertainties introduced during the learning processes. This issue was likely more pronounced in the pipe model, which utilized the attention algorithm, adding complexity. A summary of the performance of the output label is described in Figure 1 and Figure 2.

2.3. External Dataset

The DNN, encoder, and concat models had AUROC values of 0.78, 0.44, and 0.50, respectively. When tested only with CYP 3A4 substrate prediction, the matched label proportions for the test data were 0.631, 0.583, and 0.571. For weighted soft voting, which analyzes the abundance of CYP450 subtype enzymes, the matched label proportions for the test data were 0.619, 0.571, and 0.583, respectively. In all three assessment methods, DNN scored the best.

2.4. Applicability Domain

The models were developed using datasets from PubChem and DrugBank. Initially, the PubChem dataset was employed for the pre-training of the language model through MLM techniques. This step enabled the model to understand the structures of a wide variety of substances. The models were then fine-tuned with the DrugBank dataset, with a focus on the ADMET features of substances classified as drugs. The scope of chemical structures targeted by these models was those cataloged in PubChem. To assess the model’s applicability and its limitations within this domain, the external dataset—comprising rates of CYP450 enzyme reactions for toxic substances not listed in DrugBank—was employed for validation purposes. The validation showed that the DNN model, which is close to traditional QSAR models, had superior performance, but within the DrugBank dataset, other models performed better. This suggests that these models are more adept at predicting the ADMET features of therapeutic drugs rather than toxic substances.

3. Discussion

In the MoleculeNet benchmark dataset, the pre-trained NLP models generally exhibited good performance in classification tasks. However, in most regression tasks, the NLP models demonstrated poor performance, with other models surpassing the NLP model metrics, especially in tasks predicting physicochemical properties. It is believed that the regression tasks require more detailed information on atomic spacing, which the NLP models used in this study cannot fully consider. On the other hand, the classification tasks resulted in better outcomes with simpler model implementations. In the Tox21 dataset, the NLP models achieved a better AUROC (82.3% and 80%, respectively) compared to the latest GNN techniques. The lower performance of ELECTRA in this study, compared to BERT in previous studies, could be attributed to its pre-training on a smaller set of molecules. It is anticipated that ELECTRA’s performance will improve with further pre-training using SMILES information. Moreover, as GNN techniques have enhanced their performance by addressing atom-masking tasks, these NLP models could also see improved performance by developing an approach that considers the precise functional space or by introducing another tokenization method to generate the minimal unit of functional atom groups.
The DNN model resembles the traditional QSAR model. Similar to its predecessor, it trains exclusively on datasets containing results from ADMET experiments without employing a pre-training approach. In contrast, other models, such as encoder, concat, and pipe, utilize a fine-tuning strategy with pre-trained NLP models. Except for pipe_A, these models demonstrated superior performance compared to the DNN. This outcome validates the efficacy of the NLP’s MLM training technique in capturing the structural nuances of chemical compounds.
In an effort to enhance model accuracy, we explored the concat model and pipe model, which integrate SMILES notation alongside the physicochemical properties of compounds. However, the encoder model, relying solely on SMILES notation, emerged as the most effective. This can be attributed to the fact that pharmaceutical development typically focuses on compounds adhering to specific physicochemical criteria, such as Lipinski’s rule of five and the Ghose filter. The limited variance in physicochemical properties within the training dataset presumably had minimal impact on the model performance.
When assessed using the external dataset, the DNN model’s performance surpassed its counterparts (the concat and encoder models). The external dataset comprised toxic compounds, which often deviate from conventional guidelines like Lipinski’s rule of five. This deviation suggests that the range of physicochemical properties in the training dataset is considerably narrower than that in the external dataset. This finding underscores the significance of employing diverse and unbiased datasets to bolster the model’s generalization capability.

4. Materials and Methods

4.1. Data Collection and Preprocessing

Three datasets were collected to evaluate the learning under different conditions. To derive quantitative benchmark results in comparison to other machine learning techniques, the dataset from MoleculeNet was used [18]. The data from DrugBank [38] was used to assess the model’s schematic position during drug development steps. Among the labels used in learning in the DrugBank dataset, we created an external dataset (unseen in the learning process) to evaluate the model trained on the DrugBank data.

4.1.1. MoleculeNet Dataset

To assess the performance of the model on classification and regression problems, datasets from MoleculeNet were used [39]. A total of 13 datasets were selected for benchmarking, consisting of 44 binary classification tasks and 24 regression tasks. The datasets of BBBP (Blood–Brain Barrier Penetration) [19], Tox21 (Toxicology in the 21st Century) [20], ClinTox (clinical trial toxicity) [21], HIV (AIDS Antiviral Screen Data) [22], BACE (beta-site APP cleaving enzyme 1) [23], SIDER (Side Effect Resource) [24], and MUV (Maximum Unbiased Validation) [25] were chosen for classification tests. For regression tests, the datasets of FreeSolv (Database of Experimental and Calculated Hydration Free Energies) [33], ESOL (Estimating Aqueous Solubility) [34], Lipo (Experimental in vitro DMPK and physicochemical data on a set of publicly disclosed compounds) [35], QM7 (quantum-machine 7) [36], QM8 [37], and QM9 [37] were chosen. The chosen datasets cover various domains, including physiology, biophysics, physical chemistry, and quantum mechanics, coupled with molecular SMILES information. The benchmarks were compared with known prediction models and GNN-based techniques. As a reference for GNN models, the results of Wang et al. were used [13].

4.1.2. DrugBank Dataset

Datasets for training, testing, and validation were collected from DrugBank. We obtained 13,856 raw JSON files. Each file contained drug information such as the name, description, attribute values, related molecules, and applications. In total, 5238 raw files contained SMILES and ADMET data, and 18 features extracted from the ”Experimental Properties” and ”Predicted Properties” tabs were used for model training as follows: SMILES, LogP, LogS, pKa, water solubility, physiological charge, hydrogen acceptor count, hydrogen donor count, polar surface area, rotatable bond count, molar refractivity, polarizability, the number of rings, bioavailability, and drug-likeness filters including Lipinski’s rule of five [40], the Ghose filter [41], Veber’s rule [42], and the MDDR-like rule [43] (Table A3). The filter properties of bioavailability, Lipinski’s rule of five, the Ghose filter, Vebers’ rule, and MDDR-like rule are Boolean-type data that determine whether the information is ‘true or false’, and, for all other properties except the SMILES, it meant that molecular formulas were numeric data types. Among the extracted data, the four filter values of Veber’s rule, the MDDR-like rule, Lipinski’s rule of five, and the Ghose filter were excluded since those values could not be determined from the experiment, and possible overfitting was observed in the pre-test. The models were used to predict 21 ADMET features extracted from the “Predicted ADMET Features” Table, and these features are described in Table A3. To avoid semantic redundancy in the outputs, the labels of human intestinal absorption and Caco-2 permeability were combined into human intestinal absorption. Two p-glycoprotein inhibitor (I and II) descriptors were combined into one p-glycoprotein inhibitor, and the same was performed for the two hERG inhibition descriptors. If one of the 18 features was missing from a raw file, the corresponding chemical was excluded from the analysis.

4.1.3. External Dataset

Additional model testing was performed using 84 compounds externally collected by the CYP assay to evaluate the ability to perform CYP substrate prediction. The external dataset included the chemical structure, formula, and metabolism of CYP in human liver microsomes. These chemical structures were encoded in the SMILES format, and the classification of a compound as a CYP substrate was determined by the percentage of the chemical that remained following a specified reaction duration.

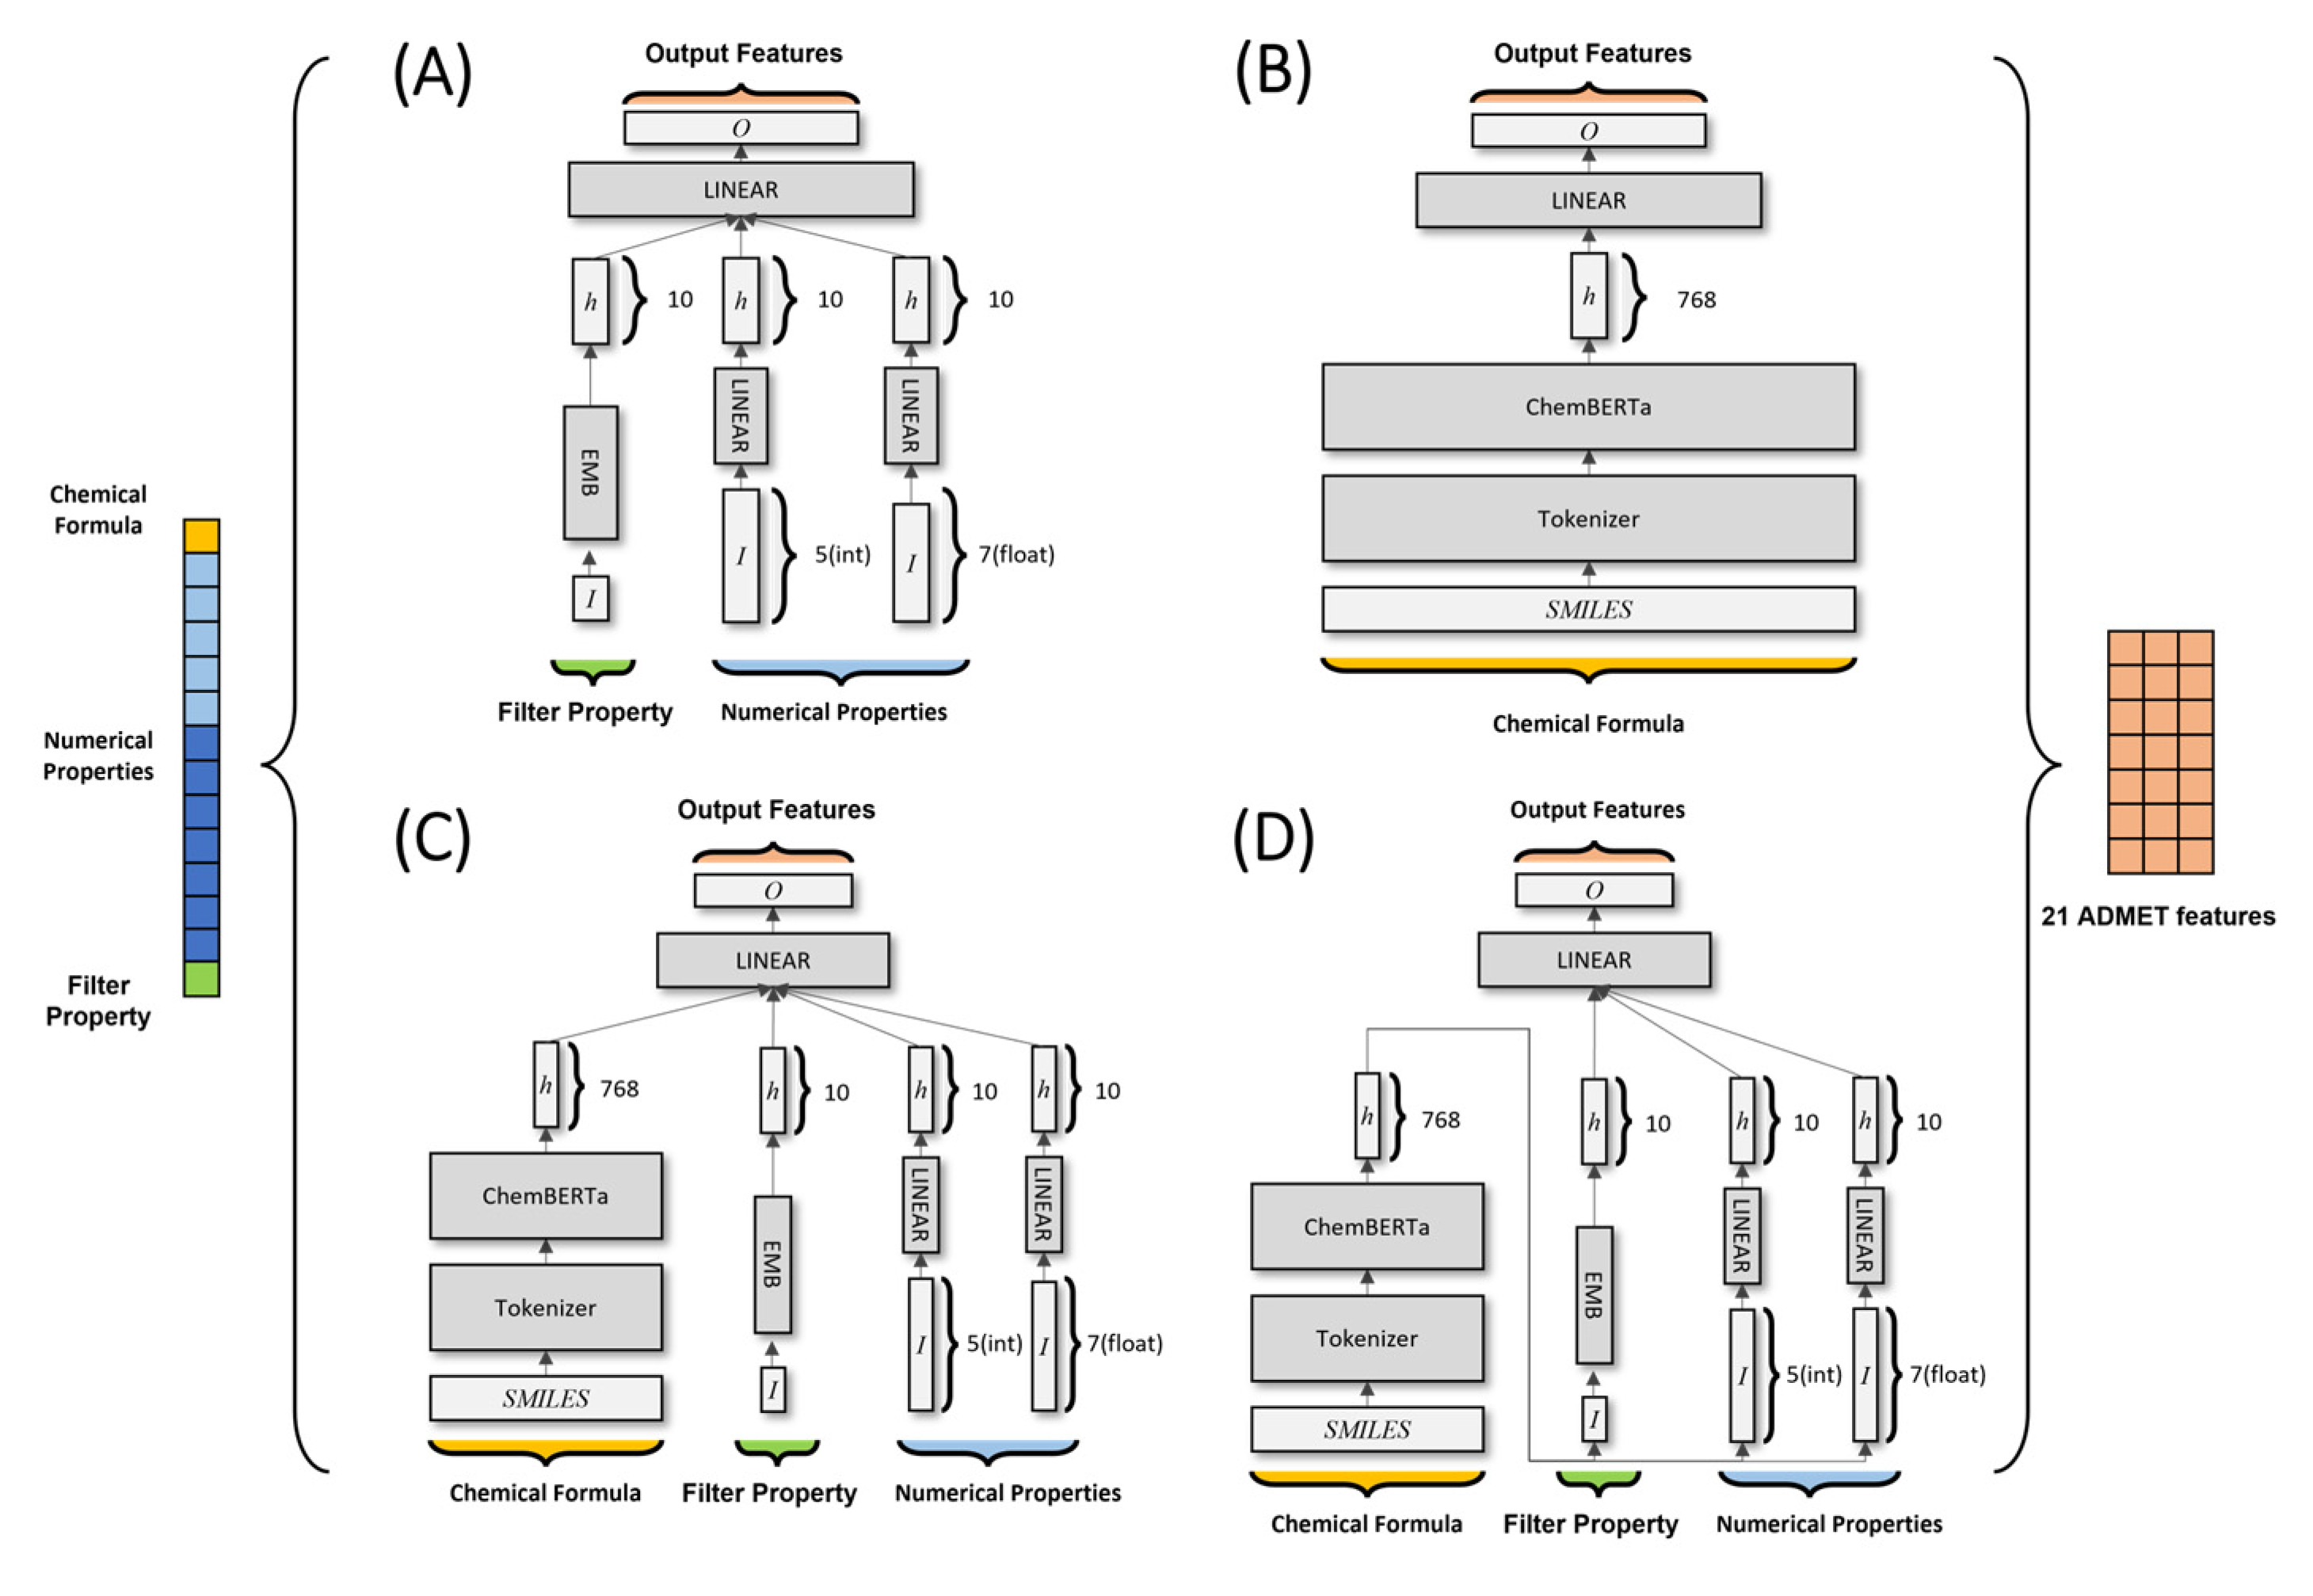
4.2. Deep Learning Models

For the MoleculeNet dataset, both ChemBERTa and ELECTRA were utilized in the benchmarks. For tokenization, a byte pair encoder (BPE) [44]-based SMILES tokenizer and WordPiece were used, respectively [15,45]. BPE is a sub-word level tokenization technique that processes the maximum number of words in a text corpus. Given the unlimited number of letter combinations, even unknown words can be processed by decomposing them into multiple-letter combinations. Thus, even SMILES can be expressed as a set of sub-SMILES. WordPiece Tokenizer is a variant algorithm of BPE. The algorithm merges the pairs with the highest ’likelihood’ of the corpus when merged, as opposed to merging the pairs in which the BPE appears most frequently based on their ’frequency’. The ELECTRA model pays more attention to the efficiency of learning as well as the accuracy of the model. ELECTRA includes new pre-training tasks called Replaced Token Detection (RTD) to improve learning efficiency, through which ELECTRA learns faster and more effectively. For this study, we used ELECTRA-small and randomly extracted 10 M molecules that were pre-trained from the PubChem 109 M dataset with 10 epochs. For the DrugBank dataset, an NLP model with better performance in the benchmark was selected and used in learning. Six models with different structures were tested in this study (Figure 3); they were all trained using a cross-entropy loss function.
  • A deep neural network (DNN) model consists of fully connected and embedded layers. The model uses 18 input physicochemical values as input properties. One Boolean feature was transformed into a 10-dimensional vector via embedding layers. Five integer-based and seven float features were transformed into a 10-dimensional vector via fully connected layers. Vectors were concatenated into a 30-dimensional vector, which passed through fully connected layers to return a vector with 21 dimensions (the predicted ADMET features).
  • An encoder model includes a pre-trained ChemBERTa model. This model treats SMILES data as “natural sentences” and learns via MLM, which is RoBERTa. The SMILES data used for the pre-trained model are in the form of a 768-dimensional hidden vector, which is transformed into an 18-dimensional vector via fully connected layers.
  • A concat model combines the DNN and encoder models described above. The 30-dimensional vector from the DNN model and the 768-dimensional hidden vector from the encoder model are concatenated and passed to the hidden layer of the concat model. This 798-dimensional hidden vector is then transformed into 21 dimensions.
  • A pipe model, which subsumed a pre-trained ChemBERTa model, used a 768-dimensional hidden vector based on SMILES data to predict 21 physicochemical properties. Those physicochemical properties were then used as input for a DNN model to predict ADMET features.
  • A modified version of the DNN model is DNN A (where A stands for attention). We incorporated dot-product self-attention into the model, which uses hidden vectors from the DNN as the query, key, and value. By implementing dot-product self-attention, it was possible to identify which input most affected ADMET feature predictions.
  • A modified version of the pipe model is pipe A, into which dot-product self-attention can be incorporated.

4.3. Settings

The data were divided into training, validation, and test sets (ratio of 7:1.5:1.5). All numeric data were normalized. The batch size was fixed at 32, with the learning rate at 5 × 10⁻⁵. Early stopping was used during training; this automatically terminated training if the validation loss value did not drop for five epochs. A maximum of 30 epochs were allowed before early stopping. For more accurate performance measurements, each model was constructed five times, with identical parameters using different random seeds for generating random numbers during model initialization. As an optimizer, AdamW was used. For each classification and regression problem, binary cross entropy and mean squared errors (MSEs) were used for the loss function. No activation function was used except in the case of attention models, which used the tanh activation model. Model training was performed using a computer with an Nvidia A100 GPU, AMD EPYC ROME 7742 CPU, and 1 TB of RAM.

4.4. Evaluation

In benchmark datasets, model evaluation was performed in the area under the receiver operating characteristic curve (AUROC) for classification tasks. For regression tasks, FreeSolv, ESOL, and Lipo used the root mean square error (RMSE), while QM7, QM8, and QM9 were measured with the mean absolute error (MAE) in accordance with MoleculeNet’s recommendation. Performance evaluation in the DrugBank dataset was based on accuracy, the area under the receiver operating characteristic curve (AUROC), F1, precision, and recall. Accuracy refers to the proportion of data correctly predicted by the model. Accuracy is an intuitive metric, but these data should be balanced to evaluate accuracy appropriately. For example, if a test dataset consists of 100 values, of which 99 are true values and 1 is a false value, the accuracy would be 99% if the model predicted 100 true values without any conditions, which implies that the metric is biased. When these data are unbalanced, it is difficult to obtain reliable results. Precision, recall, and F1 should be included as performance metrics to overcome potential bias in the accuracy evaluation. Precision refers to the proportion of actual true values relative to all predicted true values. Precision evaluation does not take predicted false values into account; only true values are considered, which gives rise to bias. Therefore, precision alone is not a reliable metric. Recall refers to the proportion of true values correctly predicted by the model. This metric does not take predicted false values into account. The problem with recall is that if all values are predicted to be true, performance is considered perfect. Recall and precision are related; if precision increases, recall tends to decrease.
Precision and recall are good metrics when several conditions are satisfied, but due to their bias, F1 (the harmonic average of precision and recall) is the most used metric. Precision and recall are complementary, but both values must be high for F1 to be high; thus, F1 represents a compromise that solves the problems of precision and recall. The receiver operating characteristic (ROC) curve can show the predictive performance of a model at different thresholds. ROC curves plot recall against specificity, which is also complimentary. Specificity is defined as the proportion of false values predicted correctly by the model. The AUROC is a commonly used metric that increases when a model predicts both true and false values accurately; therefore, it has good evaluation performance. The prediction results of the six models used in this experiment were voted on: when the result was a tie (3:3), the highest average prediction probability of each model was considered the final value.
When evaluating the external data, the CYP450 substrate prediction performance was assessed with the DNN, encoder, and concat models. Since the label did not match with what was predicted from the models, performance evaluation was conducted on the following three methods of transformation. (1) The CYP450 subtypes’ substrate-predicted value for each model was concatenated into one vector and then synthesized into one feature of the CYP substrate (logical, true, or false) with deep neural networks. (2) The CYP 3A4 (the major enzyme in CYP metabolism) substrate value was taken directly for the CYP substrate. (3) The prediction was compared to the results of weighted soft voting regarding CYP450 abundance. Abundance was set to 12% for the CYP450 subtype 2C9, 4% for subtype 2D6, and 30% for subtype 3A4. In the case of (1), the performance was measured by the AUROC, and for the rest of the method, performance was measured in matched proportion with the test data.

5. Conclusions

In traditional ADMET prediction models, the scope was narrowly confined to compounds with pre-existing experimental ADMET data. This limitation significantly curtailed the models’ generalizability, as the dataset of compounds with known ADMET outcomes was substantially smaller than the entire pool of synthesized compounds. Additionally, these conventional models often introduced bias by incorporating human-defined molecular fragments or theoretical molecular descriptors. In contrast, NLP (Natural Language Processing) models have adopted the strategy of unsupervised pre-training on extensive datasets, which is a technique proven to bolster model performance while also reducing the potential for human-induced biases. However, when evaluated against the external dataset, simpler models, such as the DNN model, outperformed more complex ones. This discrepancy unveiled a decline in performance when dealing with heterogeneous datasets, suggesting that generalization capabilities might be compromised due to dataset bias. Enhancing our dataset with a more diverse array of data points could, therefore, further refine the accuracy of deep learning models. To improve model robustness and lessen reliance on large datasets, we advocate for methodological advancements, including data augmentation, few-shot learning, and the adoption of sophisticated pre-trained models proficient in interpreting the SMILES notation.

Author Contributions

Conceptualization, W.J., S.G. and J.-w.C.; methodology, S.G. and W.J.; software, T.H.; validation, H.L.; formal analysis, T.H.; investigation, W.J. and H.L.; resources, Y.-K.K.; data curation, S.G. and H.L.; writing—original draft preparation, W.J., S.G., T.H. and H.L.; writing—review and editing, Y.-K.K., J.-w.C., H.-y.Y. and S.J.; visualization, T.H.; supervision, Y.-K.K., J.-w.C., H.-y.Y. and S.J.; project administration, H.-y.Y. and S.J.; funding acquisition, Y.-K.K. All authors have read and agreed to the published version of the manuscript.

Funding

This study was supported by Chungnam National University, Institute of Information & communications Technology Planning Evaluation (IITP) grant funded by the Korea government(MSIT) (No.RS-2022-00155857, Artificial Intelligence Convergence Innovation Human Resources Development (Chungnam National University)) and National Research Foundation of Korea (NRF) grant funded by the Korea government (MSIT; No. RS-2023-00278597, NRF-2022R1A2C1010929, NRF2022R1A5A7085156), and the Korea Environmental Industry Technology Institute (KEITI) through Core Technology Development Project for Environmental Diseases Prevention and Management (RS-2021-KE001333), funded by the Korea Ministry of Environment (MOE).

Institutional Review Board Statement

Not applicable.

Informed Consent Statement

Not applicable.

Data Availability Statement

Data is contained within the article.

Acknowledgments

The authors thank Sang Kyum Kim on College of Pharmacy, Chungnam National University for contribution on external dataset.

Conflicts of Interest

The authors declare no conflicts of interest. The funders had no role in the design of the study; in the collection, analyses, or interpretation of data; in the writing of the manuscript; or in the decision to publish the results.

Appendix A. Supplementary Results

Table A1. Total performance metrics.
FeatureModelAUROCF1AccuracyPrecisionRecall
Ames testConcat0.679 0.730 0.901 0.790 0.679
DNN0.504 0.583 0.878 0.689 0.504
DNN_A0.500 0.467 0.878 0.439 0.500
Encoder0.655 0.700 0.891 0.751 0.655
Pipe0.510 0.614 0.879 0.773 0.510
Pipe_A0.500 0.467 0.878 0.439 0.500
BiodegradationConcat0.840 0.853 0.917 0.867 0.840
DNN0.749 0.771 0.875 0.795 0.749
DNN_A0.757 0.779 0.879 0.802 0.757
Encoder0.854 0.857 0.917 0.860 0.854
Pipe0.806 0.821 0.899 0.835 0.806
Pipe_A0.500 0.452 0.823 0.412 0.500
Blood–Brain BarrierConcat0.845 0.832 0.868 0.820 0.845
DNN0.624 0.697 0.798 0.791 0.624
DNN_A0.677 0.715 0.805 0.757 0.677
Encoder0.835 0.844 0.885 0.854 0.835
Pipe0.757 0.804 0.861 0.857 0.757
Pipe_A0.669 0.733 0.818 0.811 0.669
Caco-2 permeableConcat0.792 0.828 0.868 0.867 0.792
DNN0.772 0.783 0.831 0.794 0.772
DNN_A0.776 0.790 0.837 0.804 0.776
Encoder0.859 0.865 0.893 0.872 0.859
Pipe0.768 0.796 0.845 0.827 0.768
Pipe_A0.624 0.644 0.739 0.665 0.624
CarcinogenicityConcat0.607 0.690 0.973 0.801 0.607
DNN0.500 0.493 0.971 0.485 0.500
DNN_A0.500 0.493 0.971 0.485 0.500
Encoder0.627 0.688 0.972 0.762 0.627
Pipe0.520 0.579 0.969 0.653 0.520
Pipe_A0.500 0.493 0.971 0.485 0.500
CYP450 1A2 substrateConcat0.810 0.823 0.872 0.836 0.810
DNN0.722 0.747 0.823 0.773 0.722
DNN_A0.758 0.777 0.841 0.796 0.758
Encoder0.782 0.811 0.866 0.843 0.782
Pipe0.791 0.821 0.873 0.853 0.791
Pipe_A0.782 0.804 0.860 0.826 0.782
CYP450 2C19 inhibitorConcat0.762 0.788 0.884 0.816 0.762
DNN0.575 0.637 0.831 0.713 0.575
DNN_A0.577 0.632 0.828 0.699 0.577
Encoder0.780 0.802 0.891 0.825 0.780
Pipe0.722 0.770 0.879 0.824 0.722
Pipe_A0.664 0.716 0.856 0.777 0.664
CYP450 2C9 inhibitorConcat0.759 0.764 0.903 0.769 0.759
DNN0.528 0.570 0.874 0.619 0.528
DNN_A0.515 0.608 0.883 0.742 0.515
Encoder0.751 0.754 0.898 0.756 0.751
Pipe0.673 0.737 0.907 0.814 0.673
Pipe_A0.514 0.547 0.874 0.585 0.514
CYP450 2C9 substrateConcat0.500 0.800 0.997 0.999 0.667
DNN0.500 0.499 0.996 0.498 0.500
DNN_A0.500 0.499 0.996 0.498 0.500
Encoder0.666 0.705 0.996 0.749 0.666
Pipe0.500 0.499 0.996 0.498 0.500
Pipe_A0.500 0.499 0.996 0.498 0.500
CYP450 2D6 inhibitorConcat0.616 0.673 0.949 0.743 0.616
DNN0.584 0.698 0.954 0.867 0.584
DNN_A0.610 0.752 0.959 0.979 0.610
Encoder0.669 0.765 0.962 0.894 0.669
Pipe0.608 0.722 0.957 0.888 0.608
Pipe_A0.500 0.487 0.948 0.474 0.500
CYP450 2D6 substrateConcat0.698 0.782 0.973 0.888 0.698
DNN0.500 0.490 0.962 0.481 0.500
DNN_A0.533 0.644 0.963 0.815 0.533
Encoder0.664 0.743 0.969 0.844 0.664
Pipe0.500 0.490 0.962 0.481 0.500
Pipe_A0.500 0.490 0.962 0.481 0.500
CYP450 3A4 inhibitorConcat0.738 0.750 0.874 0.761 0.738
DNN0.535 0.590 0.842 0.656 0.535
DNN_A0.520 0.588 0.845 0.675 0.520
Encoder0.758 0.764 0.879 0.771 0.758
Pipe0.654 0.704 0.868 0.763 0.654
Pipe_A0.558 0.620 0.847 0.696 0.558
CYP450 3A4 substrateConcat0.870 0.864 0.879 0.858 0.870
DNN0.755 0.766 0.803 0.778 0.755
DNN_A0.766 0.769 0.802 0.772 0.766
Encoder0.838 0.850 0.873 0.863 0.838
Pipe0.826 0.827 0.850 0.828 0.826
Pipe_A0.786 0.786 0.814 0.786 0.786
CYP450 inhibitory promiscuityConcat0.843 0.832 0.874 0.822 0.843
DNN0.723 0.736 0.818 0.750 0.723
DNN_A0.727 0.729 0.807 0.732 0.727
Encoder0.854 0.848 0.888 0.842 0.854
Pipe0.821 0.826 0.877 0.832 0.821
Pipe_A0.786 0.799 0.860 0.813 0.786
hERG inhibition (precisiondictor I)Concat0.557 0.610 0.966 0.673 0.557
DNN0.500 0.492 0.968 0.484 0.500
DNN_A0.500 0.492 0.968 0.484 0.500
Encoder0.538 0.603 0.967 0.685 0.538
Pipe0.500 0.492 0.968 0.484 0.500
Pipe_A0.500 0.492 0.968 0.484 0.500
hERG inhibition (precisiondictor II)Concat0.835 0.830 0.905 0.825 0.835
DNN0.641 0.688 0.854 0.743 0.641
DNN_A0.690 0.724 0.864 0.762 0.690
Encoder0.821 0.828 0.907 0.836 0.821
Pipe0.746 0.775 0.885 0.806 0.746
Pipe_A0.743 0.767 0.880 0.793 0.743
Human intestinal absorptionConcat0.884 0.854 0.896 0.827 0.884
DNN0.727 0.771 0.868 0.820 0.727
DNN_A0.767 0.795 0.878 0.824 0.767
Encoder0.883 0.878 0.921 0.873 0.883
Pipe0.848 0.867 0.919 0.887 0.848
Pipe_A0.615 0.693 0.835 0.795 0.615
P-glycoprotein inhibitor IConcat0.780 0.816 0.916 0.856 0.780
DNN0.634 0.703 0.878 0.789 0.634
DNN_A0.711 0.744 0.885 0.780 0.711
Encoder0.800 0.828 0.920 0.857 0.800
Pipe0.736 0.782 0.903 0.835 0.736
Pipe_A0.672 0.748 0.893 0.845 0.672
P-glycoprotein inhibitor IIConcat0.683 0.716 0.894 0.753 0.683
DNN0.577 0.629 0.879 0.692 0.577
DNN_A0.552 0.601 0.875 0.660 0.552
Encoder0.657 0.683 0.882 0.712 0.657
Pipe0.608 0.659 0.884 0.720 0.608
Pipe_A0.556 0.602 0.874 0.656 0.556
P-glycoprotein substrateConcat0.851 0.850 0.849 0.850 0.851
DNN0.798 0.799 0.800 0.800 0.798
DNN_A0.804 0.804 0.805 0.805 0.804
Encoder0.866 0.867 0.868 0.868 0.866
Pipe0.840 0.840 0.841 0.841 0.840
Pipe_A0.824 0.824 0.824 0.824 0.824
Renal organic cation transporterConcat0.774 0.828 0.967 0.890 0.774
DNN0.649 0.710 0.949 0.784 0.649
DNN_A0.626 0.678 0.944 0.739 0.626
Encoder0.808 0.863 0.973 0.926 0.808
Pipe0.597 0.683 0.948 0.798 0.597
Pipe_A0.556 0.708 0.949 0.974 0.556
TotalConcat0.749 0.786 0.911 0.824 0.757
DNN0.624 0.660 0.879 0.705 0.624
DNN_A0.636 0.670 0.882 0.717 0.636
Encoder0.760 0.788 0.915 0.821 0.760
Pipe0.682 0.719 0.903 0.767 0.682
Pipe_A0.612 0.637 0.880 0.672 0.612
Table A2. List of input properties in DrugBank dataset.
InputProperty Type
SMILESString
Physiological chargeInt
Number of ringsInt
Rotatable bond countInt
H bond acceptor countInt
H bond donor countInt
polarizabilityFloat
Molar RefractivityFloat
Monoisotopic weightFloat
Molecular weightFloat
Polar surface areaFloat
LogPFloat
LogSFloat
Water SolubilityFloat
BioavailabilityBoolean
Rule of fiveBoolean
Veber’s ruleBoolean
MDDR-like ruleBoolean
Ghose filterBoolean
Table A3. List of predicted properties in DrugBank dataset.
ADMET PropertyTRUEFALSE
Human intestinal absorptionTRUEFALSE
Blood–Brain BarrierTRUEFALSE
Caco-2 permeableTRUEFALSE
P-glycoprotein substrateSubstrateNon-substrate
P-glycoprotein inhibitor IInhibitorNon-inhibitor
P-glycoprotein inhibitor IIInhibitorNon-inhibitor
Renal organic cation transporterInhibitorNon-inhibitor
CYP450 2C9 substrateSubstrateNon-substrate
CYP450 2D6 substrateSubstrateNon-substrate
CYP450 3A4 substrateSubstrateNon-substrate
CYP450 1A2 inhibitorInhibitorNon-inhibitor
CYP450 2C9 inhibitorInhibitorNon-inhibitor
CYP450 2D6 inhibitorInhibitorNon-inhibitor
CYP450 2C19 inhibitorInhibitorNon-inhibitor
CYP450 3A4 inhibitorInhibitorNon-inhibitor
CYP450 inhibitory promiscuityHigh CYP Inhibitory PromiscuityLow CYP Inhibitory Promiscuity
Ames testAMES toxicNon-AMES toxic
CarcinogenicityCarcinogensNon-carcinogens
BiodegradationReadily biodegradableNot readily biodegradable
hERG inhibition (predictor I)Week inhibitorStrong inhibitor
hERG inhibition (predictor II)InhibitorNon-inhibitor

References

  1. Lavecchia, A. Machine-Learning Approaches in Drug Discovery: Methods and Applications. Drug Discov. Today 2015, 20, 318–331. [Google Scholar] [CrossRef]
  2. Winkler, D.A. Neural Networks as Robust Tools in Drug Lead Discovery and Development. Mol. Biotechnol. 2004, 27, 139–167. [Google Scholar] [CrossRef]
  3. Vamathevan, J.; Clark, D.; Czodrowski, P.; Dunham, I.; Ferran, E.; Lee, G.; Li, B.; Madabhushi, A.; Shah, P.; Spitzer, M.; et al. Applications of Machine Learning in Drug Discovery and Development. Nat. Rev. Drug Discov. 2019, 18, 463–477. [Google Scholar] [CrossRef]
  4. Chuang, K.V.; Gunsalus, L.M.; Keiser, M.J. Learning Molecular Representations for Medicinal Chemistry: Miniperspective. J. Med. Chem. 2020, 63, 8705–8722. [Google Scholar] [CrossRef] [PubMed]
  5. Kearnes, S.; Goldman, B.; Pande, V. Modeling Industrial ADMET Data with Multitask Networks. arXiv 2016, arXiv:1606.08793. [Google Scholar]
  6. Xu, Y.; Ma, J.; Liaw, A.; Sheridan, R.P.; Svetnik, V. Demystifying Multitask Deep Neural Networks for Quantitative Structure–Activity Relationships. J. Chem. Inf. Model. 2017, 57, 2490–2504. [Google Scholar] [CrossRef] [PubMed]
  7. Wu, Z.; Zhu, M.; Kang, Y.; Leung, E.L.-H.; Lei, T.; Shen, C.; Jiang, D.; Wang, Z.; Cao, D.; Hou, T. Do We Need Different Machine Learning Algorithms for QSAR Modeling? A Comprehensive Assessment of 16 Machine Learning Algorithms on 14 QSAR Data Sets. Brief. Bioinform. 2021, 22, bbaa321. [Google Scholar] [CrossRef] [PubMed]
  8. Göller, A.H.; Kuhnke, L.; Montanari, F.; Bonin, A.; Schneckener, S.; Ter Laak, A.; Wichard, J.; Lobell, M.; Hillisch, A. Bayer’s in Silico ADMET Platform: A Journey of Machine Learning over the Past Two Decades. Drug Discov. Today 2020, 25, 1702–1709. [Google Scholar] [CrossRef] [PubMed]
  9. Ekins, S. The next Era: Deep Learning in Pharmaceutical Research. Pharm. Res. 2016, 33, 2594–2603. [Google Scholar] [CrossRef] [PubMed]
  10. Montanari, F.; Kuhnke, L.; Ter Laak, A.; Clevert, D.-A. Modeling Physico-Chemical ADMET Endpoints with Multitask Graph Convolutional Networks. Molecules 2019, 25, 44. [Google Scholar] [CrossRef]
  11. Cáceres, E.L.; Tudor, M.; Cheng, A.C. Deep Learning Approaches in Predicting ADMET Properties. Future Med. Chem. 2020, 12, 1995–1999. [Google Scholar] [CrossRef]
  12. Feinberg, E.N.; Joshi, E.; Pande, V.S.; Cheng, A.C. Improvement in ADMET Prediction with Multitask Deep Featurization. J. Med. Chem. 2020, 63, 8835–8848. [Google Scholar] [CrossRef]
  13. Wang, Y.; Wang, J.; Cao, Z.; Barati Farimani, A. Molecular Contrastive Learning of Representations via Graph Neural Networks. Nat. Mach. Intell. 2022, 4, 279–287. [Google Scholar] [CrossRef]
  14. Devlin, J.; Chang, M.-W.; Lee, K.; Toutanova, K. Bert: Pre-Training of Deep Bidirectional Transformers for Language Understanding. arXiv 2018, arXiv:1810.04805. [Google Scholar]
  15. Chithrananda, S.; Grand, G.; Ramsundar, B. ChemBERTa: Large-Scale Self-Supervised Pretraining for Molecular Property Prediction. arXiv 2020, arXiv:2010.09885. [Google Scholar]
  16. Lewis, M.; Liu, Y.; Goyal, N.; Ghazvininejad, M.; Mohamed, A.; Levy, O.; Stoyanov, V.; Zettlemoyer, L. Bart: Denoising Sequence-to-Sequence Pre-Training for Natural Language Generation, Translation, and Comprehension. arXiv 2019, arXiv:1910.13461. [Google Scholar]
  17. Clark, K.; Luong, M.-T.; Le, Q.V.; Manning, C.D. Electra: Pre-Training Text Encoders as Discriminators Rather than Generators. arXiv 2020, arXiv:2003.10555. [Google Scholar]
  18. Irwin, R.; Dimitriadis, S.; He, J.; Bjerrum, E.J. Chemformer: A Pre-Trained Transformer for Computational Chemistry. Mach. Learn. Sci. Technol. 2022, 3, 015022. [Google Scholar] [CrossRef]
  19. Martins, I.F.; Teixeira, A.L.; Pinheiro, L.; Falcao, A.O. A Bayesian Approach to in Silico Blood-Brain Barrier Penetration Modeling. J. Chem. Inf. Model. 2012, 52, 1686–1697. [Google Scholar] [CrossRef] [PubMed]
  20. Huang, R.; Xia, M.; Nguyen, D.-T.; Zhao, T.; Sakamuru, S.; Zhao, J.; Shahane, S.A.; Rossoshek, A.; Simeonov, A. Tox21Challenge to Build Predictive Models of Nuclear Receptor and Stress Response Pathways as Mediated by Exposure to Environmental Chemicals and Drugs. Front. Environ. Sci. 2016, 3, 85. [Google Scholar] [CrossRef]
  21. Gayvert, K.M.; Madhukar, N.S.; Elemento, O. A Data-Driven Approach to Predicting Successes and Failures of Clinical Trials. Cell Chem. Biol. 2016, 23, 1294–1301. [Google Scholar] [CrossRef] [PubMed]
  22. AIDS Antiviral Screen Data—NCI DTP Data—NCI Wiki. Available online: https://wiki.nci.nih.gov/display/NCIDTPdata/AIDS+Antiviral+Screen+Data (accessed on 1 March 2024).
  23. Subramanian, G.; Ramsundar, B.; Pande, V.; Denny, R.A. Computational Modeling of β-Secretase 1 (BACE-1) Inhibitors Using Ligand Based Approaches. J. Chem. Inf. Model. 2016, 56, 1936–1949. [Google Scholar] [CrossRef] [PubMed]
  24. Kuhn, M.; Letunic, I.; Jensen, L.J.; Bork, P. The SIDER Database of Drugs and Side Effects. Nucleic Acids Res. 2016, 44, D1075–D1079. [Google Scholar] [CrossRef] [PubMed]
  25. Rohrer, S.G.; Baumann, K. Maximum Unbiased Validation (MUV) Data Sets for Virtual Screening Based on PubChem Bioactivity Data. J. Chem. Inf. Model. 2009, 49, 169–184. [Google Scholar] [CrossRef] [PubMed]
  26. Kipf, T.N.; Welling, M. Semi-Supervised Classification with Graph Convolutional Networks. arXiv 2016, arXiv:1609.02907. [Google Scholar]
  27. Xu, K.; Hu, W.; Leskovec, J.; Jegelka, S. How Powerful Are Graph Neural Networks? arXiv 2018, arXiv:1810.00826. [Google Scholar]
  28. Schütt, K.T.; Sauceda, H.E.; Kindermans, P.-J.; Tkatchenko, A.; Müller, K.-R. Schnet—A Deep Learning Architecture for Molecules and Materials. J. Chem. Phys. 2018, 148, 241722. [Google Scholar] [CrossRef] [PubMed]
  29. Lu, C.; Liu, Q.; Wang, C.; Huang, Z.; Lin, P.; He, L. Molecular Property Prediction: A Multilevel Quantum Interactions Modeling Perspective. In Proceedings of the AAAI Conference on Artificial Intelligence, Honolulu, HI, USA, 27 January–1 February 2019; Volume 33, pp. 1052–1060. [Google Scholar]
  30. Yang, K.; Swanson, K.; Jin, W.; Coley, C.; Eiden, P.; Gao, H.; Guzman-Perez, A.; Hopper, T.; Kelley, B.; Mathea, M.; et al. Analyzing Learned Molecular Representations for Property Prediction. J. Chem. Inf. Model. 2019, 59, 3370–3388. [Google Scholar] [CrossRef]
  31. Hu, W.; Liu, B.; Gomes, J.; Zitnik, M.; Liang, P.; Pande, V.; Leskovec, J. Strategies for Pre-Training Graph Neural Networks. arXiv 2019, arXiv:1905.12265. [Google Scholar]
  32. Liu, S.; Demirel, M.F.; Liang, Y. N-Gram Graph: Simple Unsupervised Representation for Graphs, with Applications to Molecules. In Proceedings of the 33rd Conference on Neural Information Processing Systems (NeurIPS 2019), Vancouver, BC, Canada, 8–14 December 2019. [Google Scholar]
  33. Mobley, D.L.; Guthrie, J.P. FreeSolv: A Database of Experimental and Calculated Hydration Free Energies, with Input Files. J. Comput.-Aided Mol. Des. 2014, 28, 711–720. Available online: https://link.springer.com/article/10.1007/s10822-014-9747-x (accessed on 1 March 2024). [CrossRef]
  34. Delaney, J.S. ESOL:  Estimating Aqueous Solubility Directly from Molecular Structure. J. Chem. Inf. Comput. Sci. 2004, 44, 1000–1005. [Google Scholar] [CrossRef]
  35. Hersey, A. ChEMBL Deposited Data Set—AZ Dataset 2015. Available online: https://www.ebi.ac.uk/chembl/document_report_card/CHEMBL3301361/ (accessed on 20 February 2024).
  36. Rupp, M.; Tkatchenko, A.; Müller, K.R.; Von Lilienfeld, O.A. Fast and Accurate Modeling of Molecular Atomization Energies with Machine Learning. Phys. Rev. Lett. 2012, 108, 058301. Available online: https://journals.aps.org/prl/abstract/10.1103/PhysRevLett.108.058301 (accessed on 1 March 2024). [CrossRef]
  37. Blum, L.C.; Reymond, J.-L. 970 Million Druglike Small Molecules for Virtual Screening in the Chemical Universe Database GDB-13. J. Am. Chem. Soc. 2009, 131, 8732–8733. [Google Scholar] [CrossRef]
  38. Wishart, D.S.; Knox, C.; Guo, A.C.; Shrivastava, S.; Hassanali, M.; Stothard, P.; Chang, Z.; Woolsey, J. DrugBank: A Comprehensive Resource for in Silico Drug Discovery and Exploration. Nucleic Acids Res. 2006, 34, D668–D672. [Google Scholar] [CrossRef]
  39. Wu, Z.; Ramsundar, B.; Feinberg, E.N.; Gomes, J.; Geniesse, C.; Pappu, A.S.; Leswing, K.; Pande, V. MoleculeNet: A Benchmark for Molecular Machine Learning. Chem. Sci. 2018, 9, 513–530. [Google Scholar] [CrossRef] [PubMed]
  40. Lipinski, C.A.; Lombardo, F.; Dominy, B.W.; Feeney, P.J. Experimental and Computational Approaches to Estimate Solubility and Permeability in Drug Discovery and Development Settings. Adv. Drug Deliv. Rev. 2012, 64, 4–17. [Google Scholar] [CrossRef]
  41. Ghose, A.K.; Viswanadhan, V.N.; Wendoloski, J.J. A Knowledge-Based Approach in Designing Combinatorial or Medicinal Chemistry Libraries for Drug Discovery. 1. A Qualitative and Quantitative Characterization of Known Drug Databases. J. Comb. Chem. 1999, 1, 55–68. [Google Scholar] [CrossRef] [PubMed]
  42. Veber, D.F.; Johnson, S.R.; Cheng, H.-Y.; Smith, B.R.; Ward, K.W.; Kopple, K.D. Molecular Properties That Influence the Oral Bioavailability of Drug Candidates. J. Med. Chem. 2002, 45, 2615–2623. [Google Scholar] [CrossRef] [PubMed]
  43. Oprea, T.I. Property Distribution of Drug-Related Chemical Databases. J. Comput.-Aided Mol. Des. 2000, 14, 251–264. [Google Scholar] [CrossRef] [PubMed]
  44. Sennrich, R.; Haddow, B.; Birch, A. Neural Machine Translation of Rare Words with Subword Units. arXiv 2015, arXiv:1508.07909. [Google Scholar]
  45. Wu, Y.; Schuster, M.; Chen, Z.; Le, Q.V.; Norouzi, M.; Macherey, W.; Krikun, M.; Cao, Y.; Gao, Q.; Macherey, K.; et al. Google’s Neural Machine Translation System: Bridging the Gap between Human and Machine Translation. arXiv 2016, arXiv:1609.08144. [Google Scholar]
Figure 1. Performance metrics of total features (Table A1) for suggested models.
Pharmaceuticals 17 00382 g001
Figure 2. Box plots of the distribution of performance metrics for each feature (Table A3) of suggested models.
Pharmaceuticals 17 00382 g002
Figure 3. Schematic flow of prepared core models, (A): DNN, (B): encoder, (C): concat, and (D): pipe. Single SMILES and Boolean features, five integers, and seven float values are concatenated and processed in the model before the values are transformed into 21 output values. I: input, h: hidden layer, EMB: embedding layer, LINEAR: full-connected layer.
Pharmaceuticals 17 00382 g003
Table 1. Mean and standard deviation (in parenthesis) of AUROC measures on 7 classification benchmarks. Supervised learning models: first seven rows. Self-supervised/pre-training methods: rows eight to thirteen. Tested models (ChemBERTa and ELECTRA): rows twelve and thirteenth. (RF: random forest. SVM: support vector machine. #: Number of).
DatasetBBBP [19]Tox21 [20]ClinTox [21]HIV [22]BACE [23]SIDER [24]MUV [25]
# Molecules203978311478411271513142793,087
# Tasks1122112717
RF71.4 (0.0)76.9 (1.5)71.3 (5.6)78.1 (0.6)86.7 (0.8)68.4 (0.9)63.2 (2.3)
SVM72.9 (0.0)81.8 (1.0)66.9 (9.2)79.2 (0.0)86.2 (0.0)68.2 (1.3)67.3 (1.3)
GCN [26]71.8 (0.0)70.9 (2.6)62.5 (2.8)74 (3.0)71.6 (2.0)53.6 (3.2)71.6 (4.0)
GIN [27]65.8 (4.5)74 (0.8)58 (4.4)75.3 (1.9)70.1 (5.4)57.3 (1.6)71.8 (2.5)
SchNet [28]84.8 (2.2)77.2 (2.3)71.5 (3.7)70.2 (3.4)76.6 (1.1)53.9 (3.7)71.3 (3.0)
MGCN [29]85 (6.4)70.7 (1.6)63.4 (4.2)73.8 (1.6)73.4 (3.0)55.2 (1.8)70.2 (3.4)
D-MPNN [30]71.2 (3.8)68.9 (1.3)90.5 (5.3)75 (2.1)85.3 (5.3)63.2 (2.3)76.2 (2.8)
Hu et al. [31]70.8 (1.5)78.7 (0.4)78.9 (2.4)80.2 (0.9)85.9 (0.8)65.2 (0.9)81.4 (2.0)
N-Gram [32]91.2 (3.0)76.9 (2.7)85.5 (3.7)83 (1.3)87.6 (3.5)63.2 (0.5)81.6 (1.9)
MolCLR-GCN [13]73.8 (0.2)74.7 (0.8)86.7 (1.0)77.8 (0.5)78.8 (0.5)66.9 (1.2)84 (1.8)
MolCLR-GIN [13]73.6 (0.5)79.8 (0.7)93.2 (1.7)80.6 (1.1)89 (0.3)68 (1.1)88.6 (2.2)
ChemBERTa73.4 (1.4)82.3 (0.9)88.9 (3.6)74.5 (3.1)79.2 (2.0)60.4 (2.0)73.9 (3.4)
ChemELECTRA72.5 (2.0)80 (1.0)84.6 (3.3)73.7 (2.9)76.9 (2.5)56.9 (1.8)73.7 (2.8)
Table 2. Mean and standard deviation (in parenthesis) of RMSE and MAE measures. RMSE for FreeSolv, ESOL, and Lipo dataset; MAE for QM7, QM8, and QM9. Supervised learning models: first seven rows. Self-supervised/pre-training methods: rows eight to thirteen. Tested models (ChemBERTa and ELECTRA): rows twelve and thirteen (RF: random forest. SVM: support vector machine. #: Number of).
DatasetFreeSolv [33]ESOL [34]Lipo [35]QM7 [36]QM8 [37]QM9 [37]
# Molecules64211284200683021,786130,829
# Tasks1111128
RF2.03 (0.22)1.07 (0.19)0.88 (0.04)122.7 (4.2)0.0423 (0.0021)16.061 (0.019)
SVM3.14 (0.0)1.5 (0.0)0.82 (0.0)156.9 (0.0)0.0543 (0.001)24.613 (0.144)
GCN2.87 (0.14)1.43 (0.05)0.85 (0.08)122.9 (2.2)0.0366 (0.0011)5.796 (1.969)
GIN2.76 (0.18)1.45 (0.02)0.85 (0.07)124.8 (0.7)0.0371 (0.0009)4.741 (0.912)
SchNet3.22 (0.76)1.05 (0.06)0.91 (0.1)74.2 (6)0.0204 (0.0021)0.081 (0.001)
MGCN3.35 (0.01)1.27 (0.15)1.11 (0.04)77.6 (4.7)0.0223 (0.0021)0.05 (0.002)
D-MPNN2.18 (0.91)0.98 (0.26)0.65 (0.05)105.8 (13.2)0.0143 (0.0022)3.241 (0.119)
Hu et al. [31]2.83 (0.12)1.22 (0.02)0.74 (0.0)110.2 (6.4)0.0191 (0.0003)4.349 (0.061)
N-Gram2.51 (0.19)1.1 (0.03)0.88 (0.12)125.6 (1.5)0.032 (0.0032)7.636 (0.027)
MolCLR-GCN2.39 (0.14)1.16 (0.0)0.78 (0.01)83.1 (4.0)0.0181 (0.0002)3.552 (0.041)
MolCLR-GIN2.2 (0.2)1.11 (0.01)0.65 (0.08)87.2 (2.0)0.0174 (0.0013)2.357 (0.118)
ChemBERTa5 (0.11)2.06 (0.02)1.2 (0.0)187.7 (2.7)0.0333 (0.0003)20.941 (0.199)
ChemELECTRA5.03 (0.13)2.05 (0.0)1.2 (0.0)179.1 (0.7)0.0359 (0.0002)24.228 (0.314)
Disclaimer/Publisher’s Note: The statements, opinions and data contained in all publications are solely those of the individual author(s) and contributor(s) and not of MDPI and/or the editor(s). MDPI and/or the editor(s) disclaim responsibility for any injury to people or property resulting from any ideas, methods, instructions or products referred to in the content.

