

Extraction Methods, Chemical Characterization, and In Vitro Biological Activities of Plinia cauliflora (Mart.) Kausel Peels

 ,
,  ,
,  , ,
, , 
 , and
, and
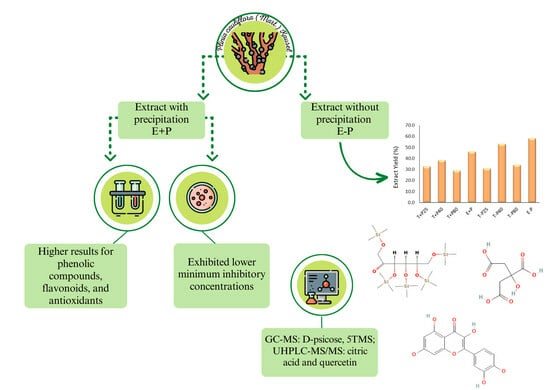
Abstract
:
1. Introduction
2. Results
2.1. Yield of the Extracts
2.2. Characterization by GC-MS and UHPLC-MS/MS
2.3. Quantification of Total Phenolic Compounds and Flavonoids
2.4. Evaluation of Antimicrobial Activity
3. Discussion
4. Material and Methods
4.1. Plant Material
4.2. Extraction Processes
4.3. Phytochemical Evaluation
4.3.1. GC-MS Analysis
4.3.2. UHPLC-MS/MS Analysis
4.4. Spectrophotometric Analysis
4.5. Antioxidant Analysis
4.6. In Vitro Antimicrobial Activity
4.7. Statistical Analysis
5. Conclusions
Author Contributions
Funding
Institutional Review Board Statement
Informed Consent Statement
Data Availability Statement
Acknowledgments
Conflicts of Interest
Appendix A

| Compound | [M+] | Main Fragments m/z | Reference |
|---|---|---|---|
| D-psicose, 5TMS | 541 | 73 (100), 306 (30.74), 147 (23.34), 204 (22.64) | This study |
| D-glucose, 5TMS | 540 | 204(100), 73(94), 191 (66), 147 (26) | This study |
| 73, 89, 103, 147 | [48] | ||
| 73, 147, 205, 319 | [49] | ||
| Citric acid, 3TMS | 408 | 73 (100), 147 (26), 75 (25), 201 (20) | This study |
| 73, 201, 147 | [50] | ||
| Glycerol, 3TMS | 308 | 73 (100), 147 (69), 205 (43), 117 (30), 103 (28) | This study |
| 147(100), 73(95), 205 (83), 117 (40), 103 (32) | [51] | ||
| 59, 73, 89, 103, 117 | [48] |
References
- Baseggio, A.M.; Nuñez, C.E.C.; Dragano, N.R.V.; Lamas, C.A.; de Campos-Braga, P.A.; Lenquiste, S.A.; Reyes, F.G.R.; Cagnon, V.H.A.; Maróstica-Júnior, M.R. Jaboticaba peel extract decrease autophagy in white adipose tissue and prevents metabolic disorders in mice fed with a high-fat diet. PharmaNutrition 2018, 6, 147–156. [Google Scholar] [CrossRef]
- Lima, A.D.J.B.; Corrêa, A.D.; Alves, A.P.C.; Abreu, C.M.P.; Dantas-Barros, A.M. Caracterização química do fruto jabuticaba (Myrciaria cauliflora Berg) e de suas frações. Arch. Latinoam. Nutr. 2008, 58, 416–421. [Google Scholar]
- Palozi, R.A.C.; Guarnier, L.P.; Romão, P.V.M.; Nocchi, S.R.; Santos, C.C.; Lourenço, E.L.B.; Silva, D.B.; Gasparotto, F.M.; Gasparotto-Junior, A. Pharmacological safety of Plinia cauliflora (Mart.) Kausel in rabbits. Toxicol. Rep. 2019, 6, 616–624. [Google Scholar] [CrossRef] [PubMed]
- Rosa, R.G.; Sganzerla, W.G.; Barroso, T.L.; Buller, L.S.; Berni, M.D.; Forster-Carneiro, T. Sustainable production of bioactive compounds from jabuticaba (Myrciaria cauliflora): A bibliometric analysis of scientific research over the last 21 years. Sustain. Chem. Pharm. 2022, 27, 100656. [Google Scholar] [CrossRef]
- Cefali, L.C.; Franco, J.G.; Nicolini, G.F.; Santos, É.M.; Fava, A.L.M.; Figueiredo, M.C.; Ataide, J.Á.; Foglio, M.A.; Mazzola, P.G. Jaboticaba, a Brazilian jewel, source of antioxidant and wound healing promoter. Sustain. Chem. Pharm. 2021, 20, 100401. [Google Scholar] [CrossRef]
- Romão, P.V.M.; Palozi, R.A.C.; Guarnier, L.P.; Silva, A.O.; Lorençone, B.R.; Nocchi, S.R.; Moura, C.C.F.S.; Lourenço, E.L.B.; Silva, D.B.; Gasparotto Junior, A. Cardioprotective effects of Plinia cauliflora (Mart.) Kausel in a rabbit model of doxorubicin-induced heart failure. J. Ethnopharmacol. 2019, 242, 112042. [Google Scholar] [CrossRef]
- Lamas, C.A.; Lenquiste, S.A.; Baseggio, A.M.; Cuquetto-Leite, L.; Kido, L.A.; Aguiar, A.C.; Erbelin, M.N.; Collares-Buzato, C.B.; Maróstica Junior, M.R.; Cagnon, V.H.A. Jaboticaba extract prevents prediabetes and liver steatosis in high-fat-fed aging mice. J. Funct. Foods 2018, 47, 434–446. [Google Scholar] [CrossRef]
- Brito, T.G.D.S.; Silva, A.P.S.D.; Cunha, R.X.D.; Fonseca, C.S.M.D.; Araújo, T.F.D.S.; Campos, J.K.L.; Nascimento, W.M.; Araújo, H.A.D.; Silva, J.P.R.E.; Tavares, J.F.; et al. Anti-inflammatory, hypoglycemic, hypolipidemic, and analgesic activities of Plinia cauliflora (Mart.) Kausel (Brazilian grape) epicarp. J. Ethnopharmacol. 2021, 268, 113611. [Google Scholar] [CrossRef]
- Gasparotto Junior, A.; Souza, P.; Lívero, F.A.R. Plinia cauliflora (Mart.) Kausel: A comprehensive ethnopharmacological review of a genuinely Brazilian species. J. Ethnopharmacol. 2019, 245, 112169. [Google Scholar] [CrossRef]
- Zhou, P.; Zheng, M.; Li, X.; Zhou, J.; Shang, Y.; Li, Z.; Qu, L. A consecutive extraction of pectin and hesperidin from Citrus aurantium L.: Process optimization, extract mechanism, characterization and bio-activity analysis. Ind. Crops and Prod. 2022, 182, 114849. [Google Scholar] [CrossRef]
- Hu, X.; Goff, H.D. Fractionation of polysaccharides by gradient non-solvent precipitation: A review. Trends Food Sci. Technol. 2018, 81, 108–115. [Google Scholar] [CrossRef]
- Rodrigues, S.; Fernandes, F.A.; Brito, E.S.; Sousa, A.D.; Narain, N. Ultrasound extraction of phenolics and anthocyanins from jabuticaba peel. Ind. Crops. Prod. 2015, 69, 400–407. [Google Scholar] [CrossRef]
- Quesada-Granados, J.J.; Rufián-Henares, J.Á.; Chakradhari, S.; Sahu, P.K.; Sahu, Y.K.; Patel, K.S. Comparative Analysis of Traditional Oriental Herbal Fruits as Potential Sources of Polyphenols and Minerals for Nutritional Supplements. Molecules 2023, 28, 2682. [Google Scholar] [CrossRef]
- Oliveira, F.C.D.; Marques, T.R.; Machado, G.H.A.; Carvalho, T.C.L.D.; Caetano, A.A.; Batista, L.R.; Corrêa, A.D. Jabuticaba skin extracts: Phenolic compounds and antibacterial activity. Braz. J. Food Technol. 2018, 21, 2017108. [Google Scholar] [CrossRef]
- Bonetti, C.I.; Dalmagro, M.; Friedrich, J.C.; Jesus, D.R.; Pinc, M.M.; Alberton, O.; Lourenço, E.L.B. Phytochemical profile and evaluation of the antimicrobial activity of Echinodorus grandiflorus crude extract of the leaves. J. Agric. Stud. 2020, 8, 176–192. [Google Scholar] [CrossRef]
- Islam, M.T.; Paz, M.F.C.J.; Baharul, I.; Alencar, M.V.O.B.; Melo-Cavalcante, A.A.C. Maceration-Vortex-Technique (MVT), a rapid and new extraction method in phyto-pharmacological screening. Int. J. Pharm. Pharm. Sci. 2016, 8, 1–3. [Google Scholar] [CrossRef]
- Pruteanu, L.L.; Bailey, D.S.; Grădinaru, A.C.; Jäntschi, L. The Biochemistry and Effectiveness of Antioxidants in Food, Fruits, and Marine Algae. Antioxidants 2023, 12, 860. [Google Scholar] [CrossRef] [PubMed]
- Xu, Y.; Burton, S.; Kim, C.; Sismour, E. Phenolic compounds, antioxidant, and antibacterial properties of pomace extracts from four Virginia-grown grape varieties. Food Sci. Nutr. 2015, 4, 125–133. [Google Scholar] [CrossRef] [PubMed]
- Baldin, J.C.; Michelin, E.C.; Polizer, Y.J.; Rodrigues, I.; Godoy, S.H.S.; Fregonesi, R.P.; Pires, M.A.; Carvalho, L.T.; Fávaro-Trindade, C.S.; Lima, C.G.; et al. Microencapsulated aboticaba (Myrciaria cauliflora) extract added to fresh sausage as natural dye with antioxidant and antimicrobial activity. Meat. Sci. 2016, 118, 15–21. [Google Scholar] [CrossRef]
- Lenquiste, S.A.; Marineli, R.S.; Moraes, É.A.; Dionísio, A.P.; Brito, E.S.; Maróstica-Junior, M.R. Jaboticaba peel and jaboticaba peel aqueous extract shows in vitro and in vivo antioxidant properties in obesity model. Food Res. Int. 2015, 77, 162–170. [Google Scholar] [CrossRef]
- Ponneganti, S.; Suryanarayana-Murty, U.; Bagul, C.; Borkar, R.M.; Radhakrishnanand, P. Phyto-metabolomics of Phlogacanthus thyrsiformis by using LC-ESI-QTOF-MS/MS and GC/QTOF-MS: Evaluation of antioxidant and enzyme inhibition potential of extracts. Food Res. Int. 2022, 161, 111874. [Google Scholar] [CrossRef]
- t’Kindt, R.; Morreel, K.; Deforce, D.; Boerjan, W.; Van-Bocxlaer, J. Joint GC-MS and LC-MS platforms for comprehensive plant metabolomics: Repeatability and sample pre-treatment. J. Chromatogr. B Analyt. Technol. Biomed. Life Sci. 2009, 877, 3572–3580. [Google Scholar] [CrossRef] [PubMed]
- Chung, M.Y.; Oh, D.K.; Lee, K.W. Hypoglycemic health benefits of D-psicose. J. Agric. Food Chem. 2012, 60, 863–869. [Google Scholar] [CrossRef] [PubMed]
- Hayashi, N.; Iida, T.; Yamada, T.; Okuma, K.; Takehara, I.; Yamamoto, T.; Yamada, K.; Tokuda, M. Study on the postprandial blood glucose suppression effect of D-psicose in borderline diabetes and the safety of long-term ingestion by normal human subjects. Biosci. Biotechnol. Biochem. 2010, 74, 510–519. [Google Scholar] [CrossRef]
- Wang, L.; Chen, K.; Zheng, P.; Huo, X.; Liao, F.; Zhu, L.; Hu, M.; Tao, Y. Enhanced production of D-psicose from D-fructose by a redox-driven multi-enzyme cascade system. Enzyme Microb. Technol. 2023, 163, 110172. [Google Scholar] [CrossRef]
- Stuper-Szablewska, K.; Szablewski, T.; Przybylska-Balcerek, A.; Szwajkowska-Michałek, L.; Krzyżaniak, M.; Świerk, D.; Cegielska-Radziejewska, R.; Krejpcio, Z. Antimicrobial activities evaluation and phytochemical screening of some selected plant materials used in traditional medicine. Molecules 2023, 28, 244. [Google Scholar] [CrossRef]
- Gomez-Delgado, M.; Camps-Font, O.; Luz, L.; Sanz, D.; Mercade, M. Update on citric acid use in endodontic treatment: A systematic review. Odontology 2023, 111, 1–19. [Google Scholar] [CrossRef]
- Burel, C.; Kala, A.; Purevdorj-Gage, L. Impact of pH on citric acid antimicrobial activity against Gram-negative bacteria. Lett. Appl. microbiol. 2021, 72, 332–340. [Google Scholar] [CrossRef]
- In, Y.W.; Kim, J.J.; Kim, H.J.; Oh, S.W. Antimicrobial activities of acetic acid, citric acid and lactic acid against Shigella species. J. Food Saf. 2013, 33, 79–85. [Google Scholar] [CrossRef]
- Batiha, G.E.S.; Beshbishy, A.M.; Ikram, M.; Mulla, Z.S.; El-Hack, M.E.A.; Taha, A.E.; Algammal, A.M.; Elewa, Y.H.A. The Pharmacological Activity, Biochemical Properties, and Pharmacokinetics of the Major Natural Polyphenolic Flavonoid: Quercetin. Foods 2020, 9, 374. [Google Scholar] [CrossRef] [PubMed]
- Lesjak, M.; Beara, I.; Simin, I.; Pintać, D.; Majkić, T.; Bekvalac, K.; Orčić, D.; Mimica-Dukić, N. Antioxidant and anti-inflammatory activities of quercetin and its derivatives. J. Funct. Foods. 2018, 40, 68–75. [Google Scholar] [CrossRef]
- Riva, A.; Vitale, J.A.; Belcaro, G.; Hu, S.; Feragalli, B.; Vinciguerra, G.; Cacchio, M.; Bonanni, E.; Giacomelli, L.; Eggenhöffner, R.; et al. Quercetin phytosome® in triathlon athletes: A pilot registry study. Minerva Med. 2018, 109, 285–289. [Google Scholar] [CrossRef]
- Homayoonfal, M.; Gilasi, H.; Asemi, Z.; Khaksary-Mahabady, M.; Asemi, R.; Yousefi, B. Quercetin modulates signal transductions and targets non-coding RNAs against cancer development. Cell. Signal. 2023, 107, 110667. [Google Scholar] [CrossRef] [PubMed]
- Su, Y.; Ma, L.; Wen, Y.; Wang, H.; Zhang, S. Studies of the in Vitro Antibacterial Activities of Several Polyphenols against Clinical Isolates of Methicillin-Resistant Staphylococcus aureus. Molecules 2014, 19, 12630–12639. [Google Scholar] [CrossRef]
- Fleck, N.; Sant’Anna, V.; Castro Oliveira, W.; Brandelli, A.; Veras, F.F. Jaboticaba peel extract as an antimicrobial agent: Screening and stability analysis. Br. Food J. 2021, 124, 2793–2804. [Google Scholar] [CrossRef]
- Lobiuc, A.; Pavăl, N.-E.; Mangalagiu, I.I.; Gheorghiță, R.; Teliban, G.-C.; Amăriucăi-Mantu, D.; Stoleru, V. Future Antimicrobials: Natural and Functionalized Phenolics. Molecules 2023, 28, 1114. [Google Scholar] [CrossRef] [PubMed]
- Cisowska, A.; Wojnicz, D.; Hendrich, A.B. Anthocyanins as antimicrobial agents of natural plant origin. Nat. Prod. Commun. 2011, 6, 149–156. [Google Scholar] [CrossRef]
- BRASIL. Ministério da Saúde. Agência Nacional de Vigilância Sanitária. RDC Nº 243, de 26 de julho de 2018. Diário Oficial da República Federativa do Brasil, 27 July 2018.
- Salazar-Gómez, A.; Alonso-Castro, A.J. Medicinal Plants from Latin America with Wound Healing Activity: Ethnomedicine, Phytochemistry, Preclinical and Clinical Studies—A Review. Pharmaceuticals 2022, 15, 1095. [Google Scholar] [CrossRef]
- Canini, A.; Alesiani, D.; D’Arcangelo, G.; Tagliatesta, P. Gas chromatography–mass spectrometry analysis of phenolic compounds from Carica papaya L. leaf. J. Food Compos. Anal. 2007, 20, 584–590. [Google Scholar] [CrossRef]
- Tolouei, S.E.L.; Tirloni, C.A.S.; Palozi, R.A.C.; Schaedler, M.I.; Guarnier, L.P.; Silva, A.O.; Almeida, V.P.; Budel, J.M.; Souza, R.I.C.; Santos, A.C.; et al. Celosia argentea L. (Amaranthaceae) a vasodilator species from the Brazilian Cerrado–An ethnopharmacological report. J. Ethnopharmacol. 2019, 229, 115–126. [Google Scholar] [CrossRef]
- Singleton, V.L.; Rossi, J.A. Colorimetry of total phenolics with phosphomolybdic-phosphotungstic acid reagents. Am. J. Enol. Vitic. 1965, 20, 144–158. [Google Scholar] [CrossRef]
- Woisky, R.G.; Salatino, A. Analysis of propolis: Some parameters and procedures for chemical quality control. J. Apic. Res. 1998, 37, 99–105. [Google Scholar] [CrossRef]
- Silveira, A.C.; Kassuia, Y.S.; Domahovski, R.C.; Lazzarotto, M. Método de DPPH adaptado: Uma ferramenta para analisar atividade antioxidante de polpa de frutos de erva-mate de forma rápida e reprodutível. In Embrapa Florestas-Comunicado Técnico (INFOTECA-E); Comunicado Técnico (CNPF): Colombo, Sri Lanka, 2018. [Google Scholar]
- Re, R.; Pellegrini, N.; Proteggente, A.; Pannala, A.; Yang, M.; Rice-Evans, C. Antioxidant activity applying an improved ABTS radical cation decoloration assay. Free Radic. Biol. Med. 1999, 26, 1231–1237. [Google Scholar] [CrossRef]
- Santos, K.A.; Klein, E.J.; Gazim, Z.C.; Gonçalves, J.E.; Cardozo-Filho, L.; Corazza, M.L.; da Silva, E.A. Wood and industrial residue of candeia (Eremanthus erythopappus): Supercritical CO2 oil extraction, composition, antioxidant activity and mathematical modeling. J. Supercrit. Fluids 2016, 114, 1–8. [Google Scholar] [CrossRef]
- CLSI—Clinical and Laboratory Standards Institute. Performance Standards for Antimicrobial Disk Susceptibility Tests. Approved Standard, 11th ed.; CLSI Document M02-A11; CLSI: Wayne, PA, USA, 2012. [Google Scholar]
- Falco, B.; Grauso, L.; Fiore, A.; Bonanomi, G.; Lanzotti, V. Metabolomics and chemometrics of seven aromatic plants: Carob, eucalyptus, laurel, mint, myrtle, rosemary and strawberry tree. Phytochem. Anal. 2022, 33, 696–709. [Google Scholar] [CrossRef] [PubMed]
- Falco, B.; Grauso, L.; Fiore, A.; Bochicchio, R.; Amato, M.; Lanzotti, V. Metabolomic analysis and antioxidant activity of wild type and mutant chia (Salvia hispanica L.) stem and flower grown under different irrigation regimes. J. Sci. Food Agric. 2021, 101, 6010–6019. [Google Scholar] [CrossRef] [PubMed]
- National Center for Biotechnology Information. PubChem Compound Summary for CID 91696760, Citric Acid, Tris(Trimethylsilyl) Ester. 2023. Available online: https://pubchem.ncbi.nlm.nih.gov/compound/Citric-Acid_-tris_trimethylsilyl_-ester (accessed on 2 August 2023).
- Lendzion, K.; Gornowicz, A.; Strawa, J.W.; Bielawska, K.; Czarnomysy, R.; Popławska, B.; Bielawski, K.; Tomczyk, M.; Miltyk, W.; Bielawska, A. LC-PDA-MS and GC-MS Analysis of Scorzonera hispanica Seeds and Their Effects on Human Breast Cancer Cell Lines. Int. J. Mol. Sci. 2022, 23, 11584. [Google Scholar] [CrossRef]


| Compound | Relative Composition (%) * | |||||||||
|---|---|---|---|---|---|---|---|---|---|---|
| m/z | RT | T + P25 | T + P40 | T + P80 | E + P | T − P25 | T − P40 | T − P80 | E − P | |
| Phenols and derivates | 0.47 | 0.39 | 0.49 | 0.66 | 0.46 | 0.15 | 0.82 | 0.88 | ||
| Gallic acid, 4TMS | 458 | 27.28 | 0.47 | 0.39 | 0.49 | 0.66 | 0.46 | n.d ** | 0.82 | 0.88 |
| 4-Hydroxybutanoic acid, 2TMS | 248 | 7.49 | n.d | n.d | n.d | n.d | n.d | 0.15 | n.d | n.d |
| Sugars and derivates | 70.86 | 69.70 | 55.84 | 77.50 | 60.39 | 57.92 | 67.09 | 68.27 | ||
| α-D-Glucopyranose, 5TMS | 540 | 26.01 | n.d | n.d | n.d | n.d | n.d | 9.77 | n.d | n.d |
| β-D-Galactofuranose, 1,2,3,5,6-pentakis-O-(TMS) | 540 | 24.84 | n.d | n.d | 2.30 | n.d | n.d | n.d | 1.74 | 5.78 |
| 3,8-dioxa-2,9-disiladecan-5-one, 2,2,6,6,9,9-hexamethyl | 276 | 22.46 | n.d | n.d | n.d | n.d | n.d | 0.13 | n.d | n.d |
| D-(−)-Fructofuranose, pentakis(TMS) ether (isomer 1) | 540 | 23.90 | n.d | 2.80 | 3.73 | 15.45 | n.d | n.d | 15.13 | 0.75 |
| D-(−)-Fructofuranose, pentakis(TMS) ether (isomer 2) | 540 | 23.92 | 5.55 | n.d | n.d | 0.36 | 12.65 | 10.52 | 0.09 | 3.74 |
| D-(−)-Tagatofuranose, pentakis(TMS) ether (isomer 1) | 540 | 18.56 | 1.74 | 0.11 | n.d | n.d | n.d | n.d | 0.12 | 3.91 |
| D-(+)-Ribono-1,4-lactone, 3TMS | 364 | 19.51 | 0.14 | 0.14 | n.d | n.d | 0.10 | 0.21 | n.d | n.d |
| D-Glucose, 5TMS | 540 | 28.31 | 21.62 | 19.49 | 8.76 | n.d | 11.65 | 11.07 | 8.70 | 16.98 |
| D-Psicofuranose, pentakis (TMS) ether (isomer 1) | 540 | 24.10 | n.d | n.d | 12.81 | 1.80 | 8.80 | n.d | 15.00 | n.d |
| D-Psicofuranose, pentakis (TMS) ether (isomer 2) | 540 | 23.19 | 0.10 | n.d | n.d | n.d | 2.09 | 0.25 | 0.12 | 2.62 |
| D-Xylopyranose, 4TMS | 438 | 26.30 | 7.91 | 5.80 | 0.43 | 8.60 | 0.66 | 2.60 | n.d | 7.01 |
| Glyceryl-glycoside, TMS | 686 | 35.11 | 0.08 | 0.07 | n.d | n.d | n.d | n.d | n.d | n.d |
| Ethyl α-D-glucopyranoside, 4TMS | 496 | 27.09 | n.d | n.d | n.d | 0.20 | 0.12 | n.d | n.d | n.d |
| Glucopyranose, 5TMS | 540 | 40.44 | n.d | n.d | n.d | 8.02 | n.d | n.d | n.d | n.d |
| Deoxyglucose, 4TMS | 452 | 44.94 | n.d | n.d | n.d | 0.39 | n.d | n.d | n.d | n.d |
| Glucuronolactone, TMS | 392 | 36.52 | 0.08 | n.d | 0.18 | n.d | n.d | n.d | n.d | n.d |
| Arabinofuranose, TMS | 438 | 22.94 | n.d | n.d | n.d | 2.62 | n.d | n.d | n.d | n.d |
| D-Arabinose, 4TMS | 438 | 19.57 | n.d | 0.09 | n.d | n.d | n.d | n.d | n.d | n.d |
| 2-Deoxyribose, 3TMS | 350 | 21.02 | n.d | n.d | n.d | n.d | n.d | 0.15 | n.d | 0.08 |
| 3-α-Mannobiose | 918 | 43.41 | 0.41 | 0.60 | 0.19 | 0.26 | 0.11 | 0.21 | 0.25 | n.d |
| Arabinitol, 5TMS | 512 | 37.70 | 0.07 | 0.18 | n.d | 1.82 | n.d | n.d | n.d | n.d |
| Arabinonic acid, TMS | 364 | 22.20 | n.d | n.d | 2.27 | n.d | n.d | 2.80 | n.d | n.d |
| D-(−)-Lyxofuranose, TMS | 438 | 42.79 | n.d | n.d | n.d | n.d | n.d | n.d | 0.19 | 1.14 |
| D-(−)-Ribofuranose, TMS | 438 | 40.54 | 0.20 | 0.14 | n.d | n.d | n.d | n.d | n.d | n.d |
| D-(−)-Tagatose, 5TMS | 540 | 25.77 | n.d | n.d | 10.44 | n.d | n.d | 2.34 | n.d | n.d |
| D-(+)-Galactose, TMS | 583 | 27.82 | 2.48 | 1.21 | n.d | n.d | n.d | n.d | n.d | n.d |
| D-(+)-Talofuranose, TMS | 540 | 24.84 | n.d | 5.93 | 0.24 | 14.91 | 2.55 | 4.76 | n.d | n.d |
| D-(+)-Trehalose, TMS | 918 | 43.60 | n.d | n.d | 1.01 | 0.66 | 1.28 | 1.16 | 1.84 | n.d |
| D-(+)-Turanose, TMS | 918 | 42.28 | 0.16 | 0.36 | n.d | 0.49 | n.d | n.d | n.d | n.d |
| D-Gluconic acid, 6TMS | 628 | 28.59 | n.d | 3.23 | n.d | 1.72 | 0.50 | n.d | 2.56 | n.d |
| D-Mannitol, 6TMS | 614 | 26.74 | n.d | n.d | 1.25 | 0.15 | n.d | n.d | n.d | n.d |
| D-Psicose, 5TMS | 540 | 26.01 | 22.49 | 22.59 | n.d | 17.17 | 10.02 | 0.17 | 10.67 | 16.10 |
| D-Trehalose, TMS | 918 | 41.91 | n.d | n.d | n.d | 0.23 | n.d | n.d | n.d | 0.14 |
| D-Xylose, 4TMS | 438 | 27.43 | n.d | n.d | 0.53 | n.d | 1.01 | 1.34 | n.d | n.d |
| Erythritol, 4TMS | 410 | 15.56 | n.d | n.d | 0.31 | n.d | 0.27 | 0.30 | 0.35 | 0.06 |
| Gluonic acid, 4TMS | 466 | 26.13 | 3.25 | 2.79 | 3.15 | n.d | 3.20 | 4.76 | 2.28 | n.d |
| L-(−)-Sorbofuranose, TMS | 540 | 42.79 | 0.14 | n.d | n.d | n.d | n.d | n.d | n.d | n.d |
| L-(−)-Sorbose, 5TMS | 540 | 27.70 | n.d | 0.19 | 0.03 | 2.11 | n.d | 0.17 | n.d | n.d |
| L-Sorbopyranose, 5TMS | 540 | 25.00 | 0.73 | n.d | n.d | n.d | n.d | n.d | n.d | n.d |
| Lactulose, TMS | 918 | 42.89 | 0.50 | 0.19 | n.d | 0.34 | n.d | n.d | 0.16 | 0.12 |
| Melibiose, TMS | 918 | 44.98 | 0.48 | 0.14 | n.d | n.d | n.d | n.d | n.d | n.d |
| Ribonic acid, TMS | 526 | 37.80 | 0.08 | n.d | n.d | n.d | n.d | n.d | n.d | n.d |
| D-Sorbitol, 6TMS | 614 | 27.00 | n.d | n.d | 1.41 | n.d | 0.16 | n.d | 1.58 | n.d |
| Sucrose, 8TMS | 918 | 41.69 | n.d | n.d | n.d | 0.21 | n.d | n.d | n.d | n.d |
| Xylitol, 5TMS | 512 | 21.56 | 2.68 | 3.66 | 6.81 | n.d | 2.99 | 4.38 | 6.33 | 2.73 |
| Xylose, 4TMS | 438 | 25.72 | n.d | n.d | n.d | n.d | 1.70 | n.d | n.d | 5.40 |
| β-D-talopyranose, 5TMS | 540 | 26.60 | n.d | n.d | n.d | n.d | 0.56 | 0.84 | n.d | 1.74 |
| Carboxylic acids and derivates | 16.29 | 8.89 | 24.23 | 3.51 | 19.45 | 14.41 | 9.50 | 9.81 | ||
| Cyclohexanone-3-carboxylic acid | 214 | 14.77 | n.d | n.d | n.d | n.d | n.d | 0.32 | n.d | n.d |
| 3-Butenoic acid, 3-(trimethylsiloxy)-,TMS ester | 246 | 17.30 | n.d | n.d | n.d | n.d | n.d | n.d | n.d | 0.67 |
| 3,4,5-Trihydroxypentanoic acid, tetrakis(TMS) | 286 | 19.89 | 0.34 | n.d | n.d | n.d | n.d | n.d | n.d | n.d |
| Valeric acid, TMS | 364 | 18.98 | 0.18 | n.d | n.d | 0.32 | 0.12 | n.d | n.d | 0.28 |
| Acrylic acid, TMS | 320 | 26.48 | 0.97 | 1.15 | 0.22 | 1.06 | 0.25 | n.d | n.d | 1.09 |
| Citric acid, 3TMS | 408 | 23.05 | 8.70 | 6.98 | 23.14 | 1.73 | 17.51 | 8.32 | 8.61 | 7.40 |
| Glutaric acid, TMS | 364 | 17.32 | n.d | n.d | n.d | n.d | 0.49 | 1.63 | n.d | n.d |
| Methylmalonic acid, 2TMS | 540 | 24.03 | 5.56 | n.d | n.d | n.d | n.d | n.d | n.d | n.d |
| succinic acid, 2TMS | 262 | 9.60 | 0.54 | 0.76 | 0.87 | 0.41 | 1.10 | 4.14 | 0.89 | 0.37 |
| Alkaloids | 2.80 | 2.91 | 0.97 | 4.36 | 0.87 | 0.91 | 2.99 | 0.64 | ||
| Quininic acid, 5TMS | 552 | 25.15 | 2.80 | 2.91 | 0.97 | 4.36 | 0.87 | 0.91 | 2.99 | 0.64 |
| Dioxanes | n.d | 1.95 | n.d | n.d | 2.27 | n.d | 0.11 | 11.36 | ||
| 1,3-Dihydroxyacetone dimer, 4TMS | 468 | 22.18 | n.d | 1.95 | n.d | n.d | 2.27 | n.d | 0.11 | 11.36 |
| Fatty acids | 0.09 | 0.34 | 0.55 | 0.08 | 0.65 | 1.24 | 0.67 | 0.14 | ||
| Acetin, bis-1,3- TMS ether | 278 | 6.16 | n.d | n.d | 0.21 | n.d | 0.32 | 1.07 | n.d | 0.12 |
| Linoleic acid, TMS | 352 | 32.51 | 0.09 | 0.13 | 0.13 | n.d | n.d | n.d | n.d | n.d |
| Linoelaidic acid, TMS | 352 | 32.50 | n.d | n.d | n.d | n.d | 0.15 | 0.17 | 0.31 | n.d |
| Palmitic Acid, TMS | 328 | 28.89 | n.d | 0.22 | 0.21 | 0.08 | 0.18 | n.d | 0.37 | 0.02 |
| Glycerolipids | 0.57 | 0.47 | 0.88 | 0.83 | 0.45 | 0.54 | 0.68 | 0.81 | ||
| 1-Monopalmitin, 2TMS | 474 | 40.17 | 0.57 | 0.47 | 0.43 | 0.83 | 0.45 | 0.33 | 0.68 | 0.40 |
| 2-Palmitoylglycerol, 2TMS | 474 | 43.15 | n.d | n.d | n.d | n.d | n.d | 0.21 | n.d | n.d |
| Glycerol monostearate, 2TMS | 502 | 43.60 | n.d | n.d | 0.45 | n.d | n.d | n.d | n.d | 0.41 |
| Hydroxy acids and derivates | 0.76 | 4.91 | 4.31 | 5.99 | 5.00 | 7.52 | 7.25 | 3.90 | ||
| Glycolic acid, 2TMS | 220 | 4.10 | 0.10 | 0.12 | 0.08 | 0.08 | 0.08 | n.d | 0.09 | 0.03 |
| Hydracrylic acid, 2TMS | 234 | 5.36 | n.d | n.d | n.d | n.d | n.d | 0.13 | n.d | n.d |
| 2-Isopropyl-3-ketobutyrate, bis(O-TMS) | 288 | 13.58 | n.d | n.d | 0.09 | n.d | n.d | 0.12 | n.d | 0.14 |
| Lactic Acid, 2TMS | 234 | 3.86 | 0.24 | 0.30 | 0.25 | 0.14 | 1.00 | 2.23 | 0.18 | 0.07 |
| Malic acid, 3TMS | 350 | 14.91 | 0.18 | 4.30 | 3.81 | 5.67 | 2.44 | 3.39 | 4.21 | 3.60 |
| Glyceric acid, 3TMS | 322 | 10.25 | 0.13 | 0.18 | 0.07 | 0.11 | 0.12 | 0.16 | 0.11 | 0.06 |
| Mannonic acid, 4TMS | 466 | 25.81 | 0.12 | n.d | n.d | n.d | 1.37 | 1.48 | 2.66 | n.d |
| Keto acids and derivates | n.d | n.d | n.d | n.d | n.d | 0.46 | n.d | n.d | ||
| 2-Ketobutyric acid, TMS | 174 | 10.94 | n.d | n.d | n.d | n.d | n.d | 0.13 | n.d | n.d |
| 2-Oxovaleric acid | 230 | 9.18 | n.d | n.d | n.d | n.d | n.d | 0.33 | n.d | n.d |
| Organooxygen compounds | 7.82 | 9.77 | 12.64 | 6.90 | 10.24 | 16.52 | 10.66 | 4.21 | ||
| 1,2,3-Butanetriol, 3TMS | 322 | 6.56 | n.d | n.d | 0.44 | n.d | 0.60 | 1.95 | n.d | 0.22 |
| 2,3-Butanediol, 2TMS | 234 | 3.58 | 0.38 | 0.52 | n.d | n.d | 0.46 | 0.81 | 0.28 | n.d |
| Glycerol, 3TMS | 308 | 8.70 | 7.38 | 9.25 | 10.51 | 6.90 | 8.99 | 13.44 | 8.61 | 3.08 |
| meso-Erythritol, 4TMS | 410 | 21.16 | n.d | n.d | n.d | n.d | n.d | 0.21 | n.d | 0.11 |
| Myo-Inositol, 6TMS | 612 | 30.45 | 0.06 | n.d | 0.11 | n.d | 0.19 | 0.12 | 0.17 | 0.08 |
| Ribitol, 5TMS | 512 | 21.68 | n.d | n.d | 1.58 | n.d | n.d | n.d | 1.59 | 0.72 |
| Quinones | 0.34 | 0.53 | 0.09 | 0.16 | 0.22 | 0.34 | 0.25 | n.d | ||
| Kojic acid, 2TMS | 286 | 19.89 | 0.34 | 0.53 | 0.09 | 0.16 | 0.22 | 0.34 | 0.25 | n.d |
| Compound | Relative Composition (%) * | |||||||||
|---|---|---|---|---|---|---|---|---|---|---|
| Mw | RT | T + P25 | T + P40 | T + P80 | E + P | T − P25 | T − P40 | T − P80 | E − P * | |
| Flavonoids | 35.58 | 67.73 | 54.37 | 18.47 | 69.04 | 14.54 | 11.04 | 45.15 | ||
| Quercetin | 303 | 37.18 | 12.47 | 21.01 | 19.84 | 3.82 | 31.98 | 7.33 | 3.24 | 16.75 |
| O-hexosyl quercetin | 464 | 30.90 | 5.36 | 2.54 | 2.50 | 2.23 | 2.91 | 1.03 | 1.42 | 3.15 |
| O-hexosyl delphinidin | 477 | 28.54 | 0.40 | 0.45 | 0.98 | 0.14 | n.d ** | n.d | n.d | n.d |
| O-hexosyl cyanidin | 449 | 11.57 | 11.97 | 30.67 | 12.43 | 2.11 | 27.87 | 1.16 | 1.50 | 11.55 |
| O-deoxyhexosyl quercetin | 448 | 30.38 | 5.36 | 8.71 | 13.15 | 7.67 | 6.28 | 2.30 | 2.07 | 9.46 |
| O-deoxyhexosyl myricetin | 464 | 34.24 | n.d | 4.35 | 5.47 | 2.51 | n.d | 2.73 | 2.79 | 4.23 |
| Phenolic acids | 0.85 | 0.56 | n.d | 0.15 | n.d | n.d | n.d | n.d | ||
| Syringic acid | 198 | 43.87 | 0.85 | 0.56 | n.d | 0.15 | n.d | n.d | n.d | n.d |
| Tannins and derivates | 7.82 | 15.36 | 21.78 | 19.21 | 5.12 | 5.36 | 81.10 | 4.85 | ||
| O-galloyl ellagic acid | 474 | 1.54 | 7.21 | 10.95 | 16.19 | 17.28 | n.d | 0.30 | n.d | n.d |
| O-hexosyl ellagic acid | 480 | 28.54 | 0.46 | 0.45 | 1.39 | 0.30 | n.d | n.d | n.d | n.d |
| O-pentosyl ellagic acid | 470 | 32.61 | 0.15 | 0.37 | 0.29 | 0.24 | 0.88 | 0.20 | 78.87 | 0.22 |
| Di-O-galloyl hexoside | 500 | 43.50 | n.d | n.d | n.d | n.d | n.d | 3.39 | 0.79 | 1.68 |
| Tri-O-galloyl hexoside | 648 | 32.27 | n.d | 3.59 | 3.91 | 1.39 | 4.24 | 1.48 | 1.44 | 2.96 |
| Sugars and derivates | 58.93 | 16.36 | 23.85 | 62.18 | 17.25 | 80.10 | 7.87 | 50.00 | ||
| di-hexoside | 342 | 1.05 | 57.72 | 16.01 | 3.86 | 17.75 | 16.03 | 63.87 | 7.29 | 14.56 |
| Hexose | 180 | 1.20 | 1.20 | 0.35 | 19.99 | 44.42 | 1.22 | 16.23 | 0.58 | 35.44 |
| Compound | Relative Composition (%) * | |||||||||
|---|---|---|---|---|---|---|---|---|---|---|
| Mw | RT | T + P25 | T + P40 | T + P80 | E + P | T − P25 | T − P40 | T − P80 | E − P * | |
| Flavonoids | 0.83 | 1.13 | 1.22 | 1.44 | 0.84 | 0.63 | 0.90 | 1.80 | ||
| Quercetin | 303 | 12.4 | 0.13 | 0.11 | 0.06 | 0.04 | 0.12 | 0.03 | 0.03 | 0.08 |
| O-hexosyl quercetin | 464 | 9.2 | 0.25 | 0.22 | 0.54 | 0.20 | 0.03 | 0.03 | 0.03 | 0.14 |
| O-hexosyl cyanidin | 449 | 5.0 | 0.01 | 0.32 | 0.10 | 0.69 | 0.06 | 0.04 | 0.13 | 0.89 |
| O-deoxyhexosyl quercetin | 448 | 10.2 | 0.43 | 0.49 | 0.53 | 0.51 | 0.63 | 0.54 | 0.72 | 0.69 |
| Phenolic acids | 0.25 | 0.23 | 0.29 | 0.49 | 0.68 | 0.17 | 0.23 | 2.81 | ||
| Gallic acid | 170 | 2.7 | 0.25 | 0.23 | 0.29 | 0.49 | 0.63 | 0.17 | 0.23 | 2.81 |
| Syringic acid | 198 | 9.1 | n.d ** | n.d | n.d | n.d | 0.04 | n.d | n.d | n.d |
| Tannins and derivates | 0.16 | 0.37 | 0.44 | 1.18 | 0.45 | 0.58 | 0.33 | 1.67 | ||
| Ellagic acid | 310 | 9.4 | n.d | n.d | 0.01 | 0.32 | 0.13 | 0.22 | 0.10 | 0.56 |
| O-cinnamoyl O-galloyl hexoside | 470 | 6.6 | 0.15 | 0.15 | 0.16 | 0.23 | 0.15 | 0.25 | 0.14 | 0.25 |
| O-pentosyl ellagic acid | 470 | 9.8 | n.d | 0.03 | 0.03 | 0.03 | n.d | n.d | 0.01 | 0.04 |
| O-galloyl ellagic acid | 474 | 12.8 | n.d | 0.02 | 0.01 | 0.11 | 0.04 | 0.06 | 0.02 | 0.06 |
| HHDP galloyl O-hexoside | 802 | 6.9 | n.d | n.d | n.d | 0.01 | n.d | n.d | n.d | 0.01 |
| HHDP di-galloyl O-hexoside | 794 | 7.9 | 0.00 | 0.01 | 0.05 | 0.34 | 0.01 | 0.01 | 0.01 | 0.26 |
| di-HHDP O-hexoside | 784 | 7.3 | n.d | n.d | n.d | 0.02 | n.d | n.d | 0.01 | 0.03 |
| Di-O-galloyl hexoside | 500 | 3.3 | n.d | n.d | n.d | n.d | 0.02 | n.d | n.d | 0.44 |
| di-HHDP-galloyl O-hexoside | 972 | 4.6 | n.d | n.d | n.d | n.d | n.d | 0.00 | 0.01 | n.d |
| HHDP tri-galloyl O-hexoside | 966 | 14.8 | n.d | 0.04 | 0.08 | 0.11 | 0.10 | n.d | n.d | n.d |
| di-HHDP-galloyl O-hexoside (castalagin/vescalagin isomer) | 978 | 4.6 | n.d | 0.11 | 0.10 | 0.02 | 0.01 | 0.03 | 0.04 | 0.02 |
| Tri-O-galloyl hexoside | 648 | 3.7 | n.d | n.d | n.d | n.d | n.d | n.d | 0.01 | n.d |
| Sugars and derivates | 18.86 | 15.28 | 15.91 | 21.25 | 17.57 | 11.19 | 1.40 | 2.08 | ||
| di-hexoside | 342 | 1.1 | 1.54 | n.d | n.d | n.d | n.d | n.d | n.d | 0.22 |
| Hexose | 180 | 1.0 | 17.32 | 15.28 | 15.91 | 21.25 | 17.57 | 11.19 | 1.40 | 1.86 |
| Carboxylic acids and derivates | 77.35 | 78.05 | 76.62 | 68.60 | 74.10 | 79.42 | 88.80 | 82.43 | ||
| Citric acid | 192 | 2.3 | 77.35 | 78.05 | 76.62 | 68.60 | 74.10 | 79.42 | 88.80 | 82.43 |
| Alkaloids | 2.56 | 4.92 | 5.52 | 7.05 | 6.36 | 8.02 | 8.34 | 9.22 | ||
| Quinic acid | 203 | 1.4 | 2.56 | 4.92 | 5.52 | 7.05 | 6.36 | 8.02 | 8.34 | 9.22 |
| Method | Phenolic Compounds (µg EAG gext−1) | Flavonoids (µg QUE gext−1) |
|---|---|---|
| T + P25 | 25.54 ± 0.42 f | 3.05 ± 0.02 e |
| T+ P40 | 45.86 ± 1.07 d | 5.39 ± 0.01 c |
| T + P80 | 51.72 ± 0.24 c | 6.36 ± 0.11 b |
| E + P | 115.59 ± 1.79 a | 6.95 ± 0.04 a |
| T − P25 | 63.94 ± 0.84 b | 4.82 ± 0.08 d |
| T − P40 | 38.10 ± 0.36 e | 6.34 ± 0.05 b |
| T − P80 | 26.92 ± 1.17 f | 4.97 ± 0.07 d |
| E − P | 49.08 ± 1.05 c | 3.09 ± 0.03 e |
| Sig. | <0.001 | <0.001 |
| Method | DPPH (μMTrolox) | FRAP (µmolTrolox gext−1) | ABTS (µmolFe2+ gext−1) |
|---|---|---|---|
| T + P25 | 315.88 ± 5.86 d | 829.83 ± 9.97 e | 1141.00 ± 31.10 cd |
| T + P40 | 360.93 ± 6.03 c | 1067.38 ± 12.14 b | 1092.31 ± 44.27 cd |
| T + P80 | 388.66 ± 4.51 b | 990.35 ± 4.27 c | 1242.42 ± 19.92 b |
| E + P | 489.16 ± 4.51 a | 1330.80 ± 5.92 a | 1483.12 ± 10.73 a |
| T − P25 | 247.72 ± 7.64 e | 800.20 ± 8.36 f | 1073.38 ± 16.88 d |
| T − P40 | 204.98 ± 2.08 f | 443.60 ± 8.96 g | 843.50 ± 50.08 e |
| T − P80 | 334.94 ± 6.80 d | 933.25 ± 14.0 d | 1173.45 ± 15.59 bc |
| E − P | 333.21 ± 8.96 d | 999.51 ± 10.31 c | 1484.47 ± 18.19 a |
| Sig. | <0.001 | <0.001 | <0.001 |
| Method | B. subitilis | E. coli | S. aureus | P. aeruginosa | C. albicans |
|---|---|---|---|---|---|
| T + P25 | 15.62 ± 0.00 | 5.20 ± 2.26 | 20.83 ± 9.02 | 15.62 ± 0.00 | >125 |
| T + P40 | 20.83 ± 9.02 | 6.51 ± 2.26 | 31.25 ± 0.00 | 15.62 ± 0.00 | >125 |
| T + P80 | 20.83 ± 9.02 | 7.81 ± 0.00 | 15.62 ± 0.00 | 15.62 ± 0.00 | >125 |
| E + P | 15.62 ± 0.00 | 7.81 ± 0.00 | 15.62 ± 0.00 | 13.02 ± 4.51 | >125 |
| T − P25 | 15.62 ± 0.00 | 10.41 ± 4.51 | 20.83 ± 9.02 | 20.83 ± 9.02 | >125 |
| T − P40 | 26.04 ± 9.02 | 7.81 ± 0.00 | 31.25 ± 0.00 | 10.41 ± 4.51 | >125 |
| T − P80 | 26.04 ± 18.04 | 52.08 ± 18.04 | 62.50 ± 0.00 | 62.50 ± 0.00 | >125 |
| E − P | 62.50 ± 0.00 | 62.50 ± 0.00 | 125.00 ± 0.00 | 20.83 ± 9.02 | >125 |
Disclaimer/Publisher’s Note: The statements, opinions and data contained in all publications are solely those of the individual author(s) and contributor(s) and not of MDPI and/or the editor(s). MDPI and/or the editor(s) disclaim responsibility for any injury to people or property resulting from any ideas, methods, instructions or products referred to in the content. |
© 2023 by the authors. Licensee MDPI, Basel, Switzerland. This article is an open access article distributed under the terms and conditions of the Creative Commons Attribution (CC BY) license (https://creativecommons.org/licenses/by/4.0/).
Share and Cite
Pinc, M.M.; Dalmagro, M.; da Cruz Alves Pereira, E.; Donadel, G.; Thomaz, R.T.; da Silva, C.; Macruz, P.D.; Jacomassi, E.; Gasparotto Junior, A.; Hoscheid, J.; et al. Extraction Methods, Chemical Characterization, and In Vitro Biological Activities of Plinia cauliflora (Mart.) Kausel Peels. Pharmaceuticals 2023, 16, 1173. https://doi.org/10.3390/ph16081173
Pinc MM, Dalmagro M, da Cruz Alves Pereira E, Donadel G, Thomaz RT, da Silva C, Macruz PD, Jacomassi E, Gasparotto Junior A, Hoscheid J, et al. Extraction Methods, Chemical Characterization, and In Vitro Biological Activities of Plinia cauliflora (Mart.) Kausel Peels. Pharmaceuticals. 2023; 16(8):1173. https://doi.org/10.3390/ph16081173
Chicago/Turabian StylePinc, Mariana Moraes, Mariana Dalmagro, Elton da Cruz Alves Pereira, Guilherme Donadel, Renan Tedeski Thomaz, Camila da Silva, Paula Derksen Macruz, Ezilda Jacomassi, Arquimedes Gasparotto Junior, Jaqueline Hoscheid, and et al. 2023. "Extraction Methods, Chemical Characterization, and In Vitro Biological Activities of Plinia cauliflora (Mart.) Kausel Peels" Pharmaceuticals 16, no. 8: 1173. https://doi.org/10.3390/ph16081173
APA StylePinc, M. M., Dalmagro, M., da Cruz Alves Pereira, E., Donadel, G., Thomaz, R. T., da Silva, C., Macruz, P. D., Jacomassi, E., Gasparotto Junior, A., Hoscheid, J., Lourenço, E. L. B., & Alberton, O. (2023). Extraction Methods, Chemical Characterization, and In Vitro Biological Activities of Plinia cauliflora (Mart.) Kausel Peels. Pharmaceuticals, 16(8), 1173. https://doi.org/10.3390/ph16081173