Detection and Quantification of Some Ethanol-Producing Bacterial Strains in the Gut of Mouse Model of Non-Alcoholic Fatty Liver Disease: Role of Metformin

 ,
,
Abstract
1. Introduction
2. Results
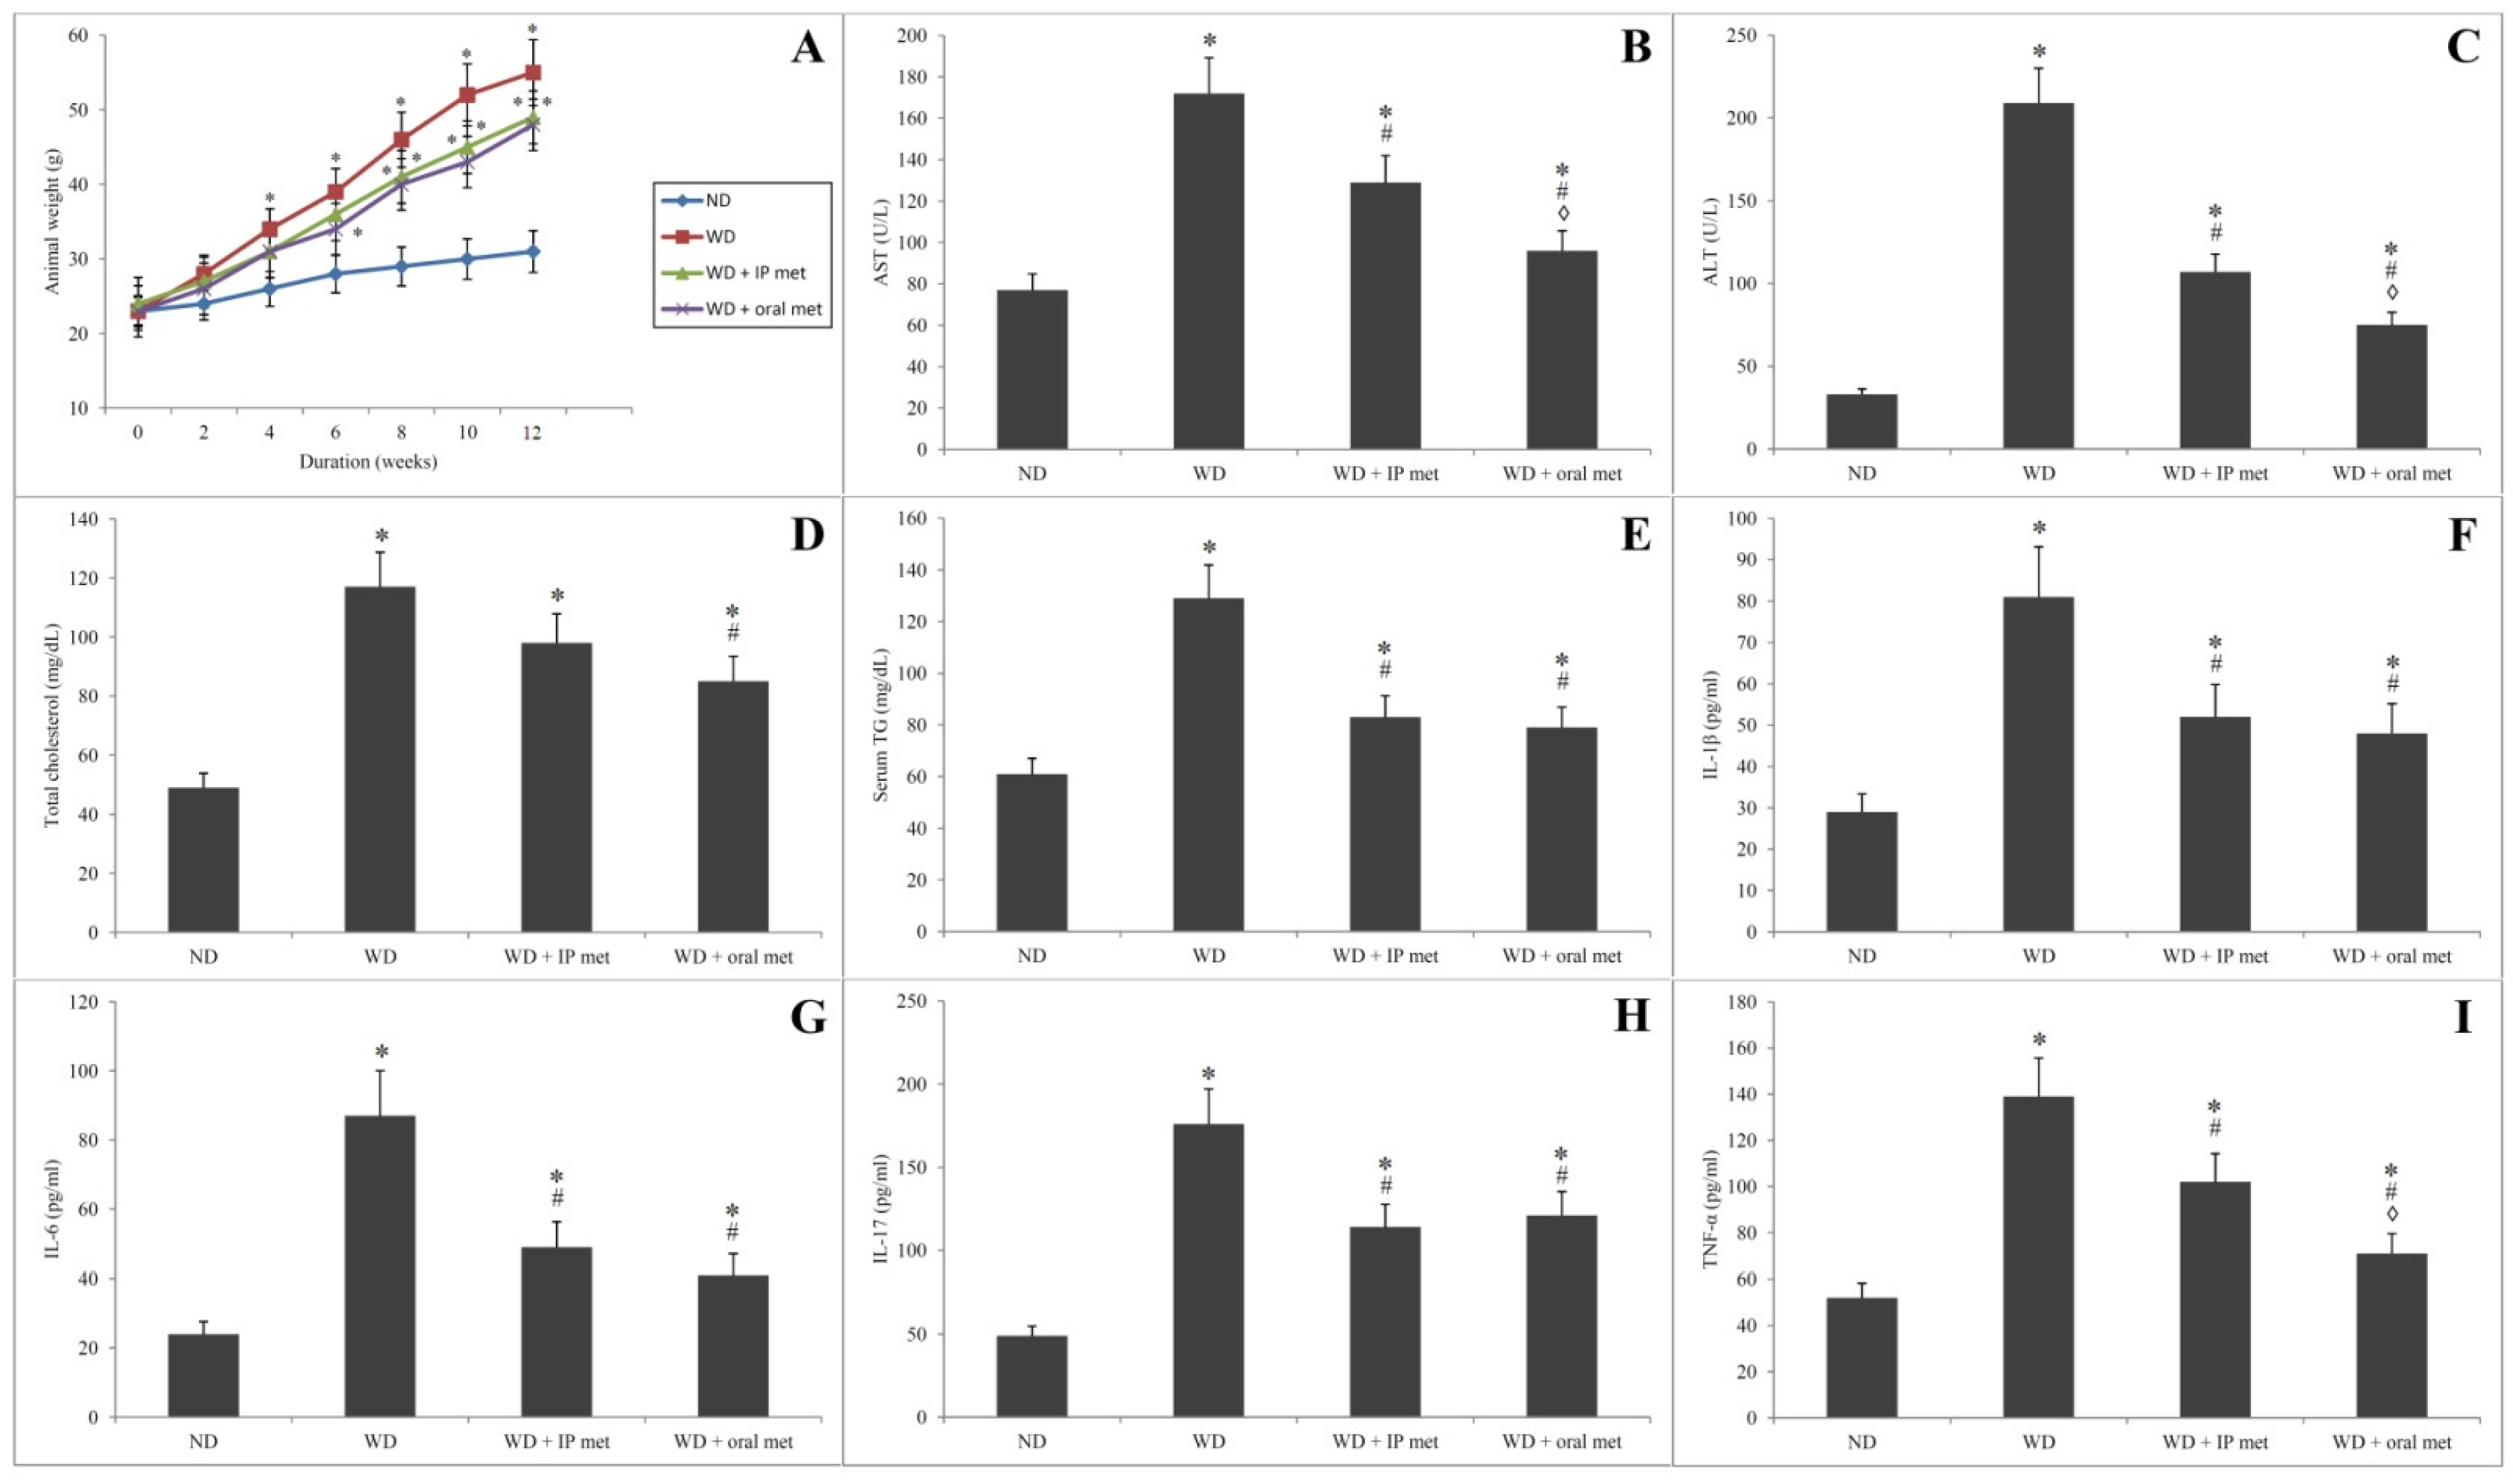
2.1. Animal Weight
2.2. Biochemical Parameters
2.3. Assay of Serum Cytokines’ Levels

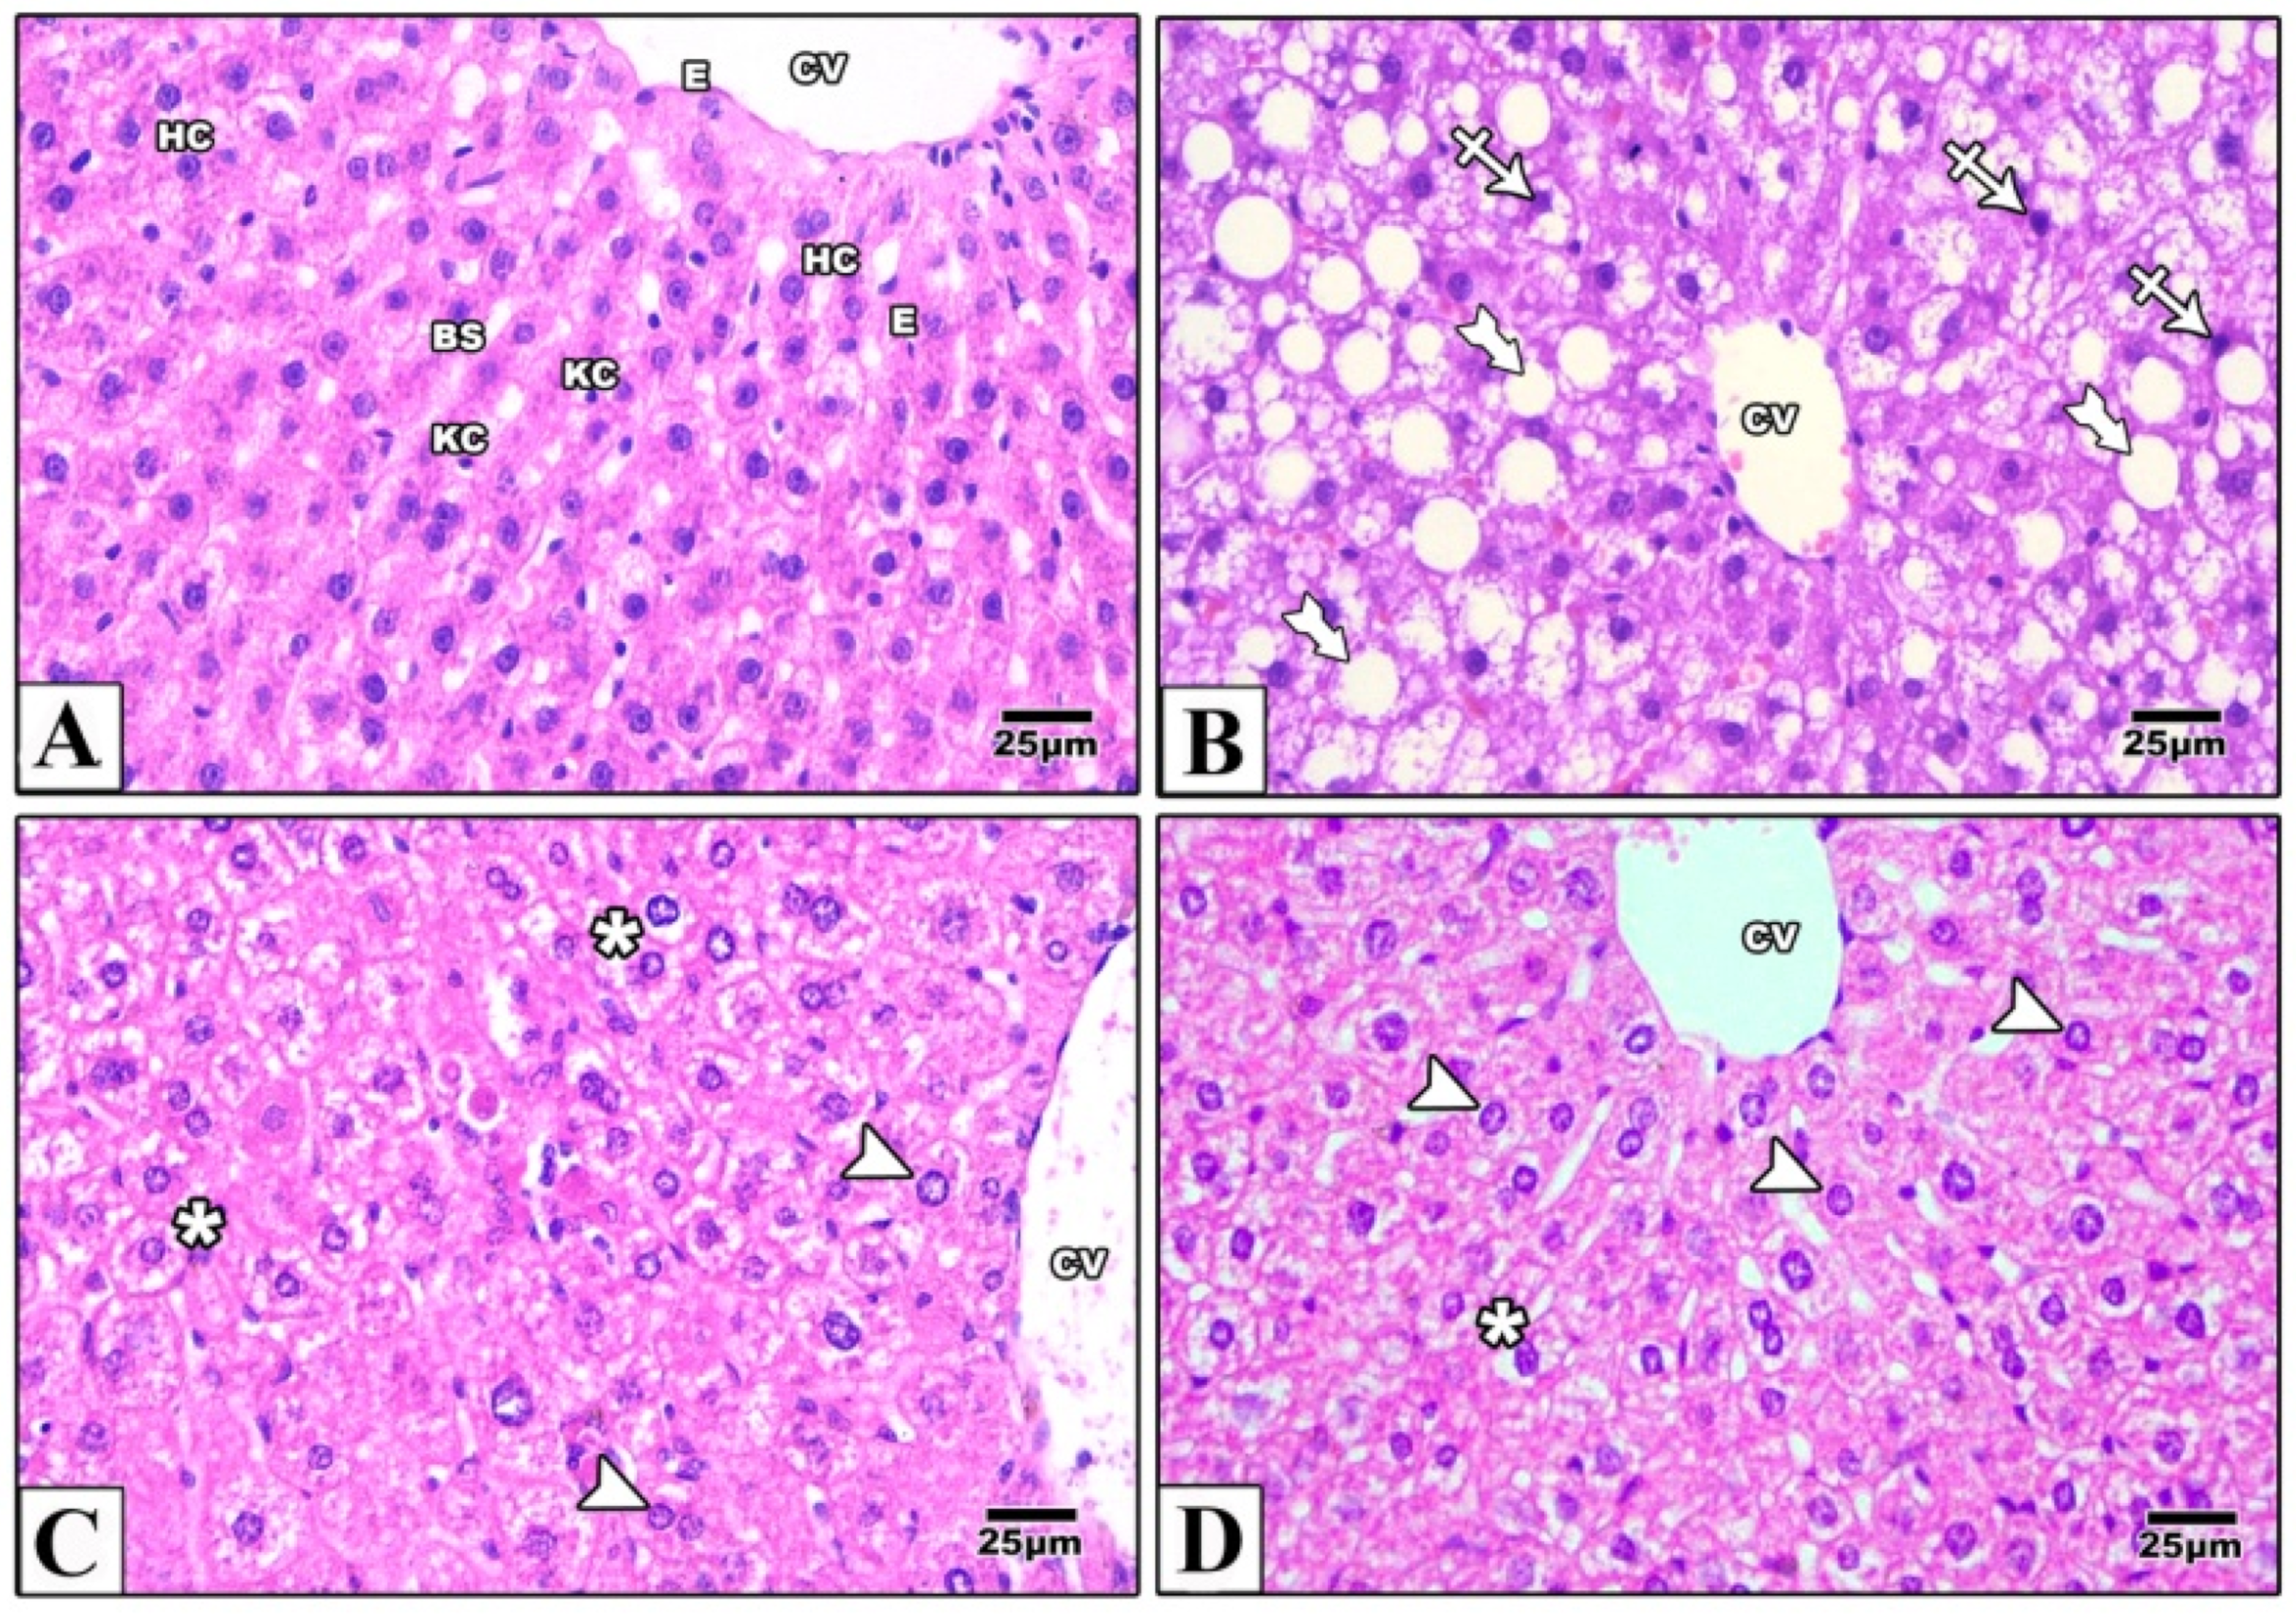
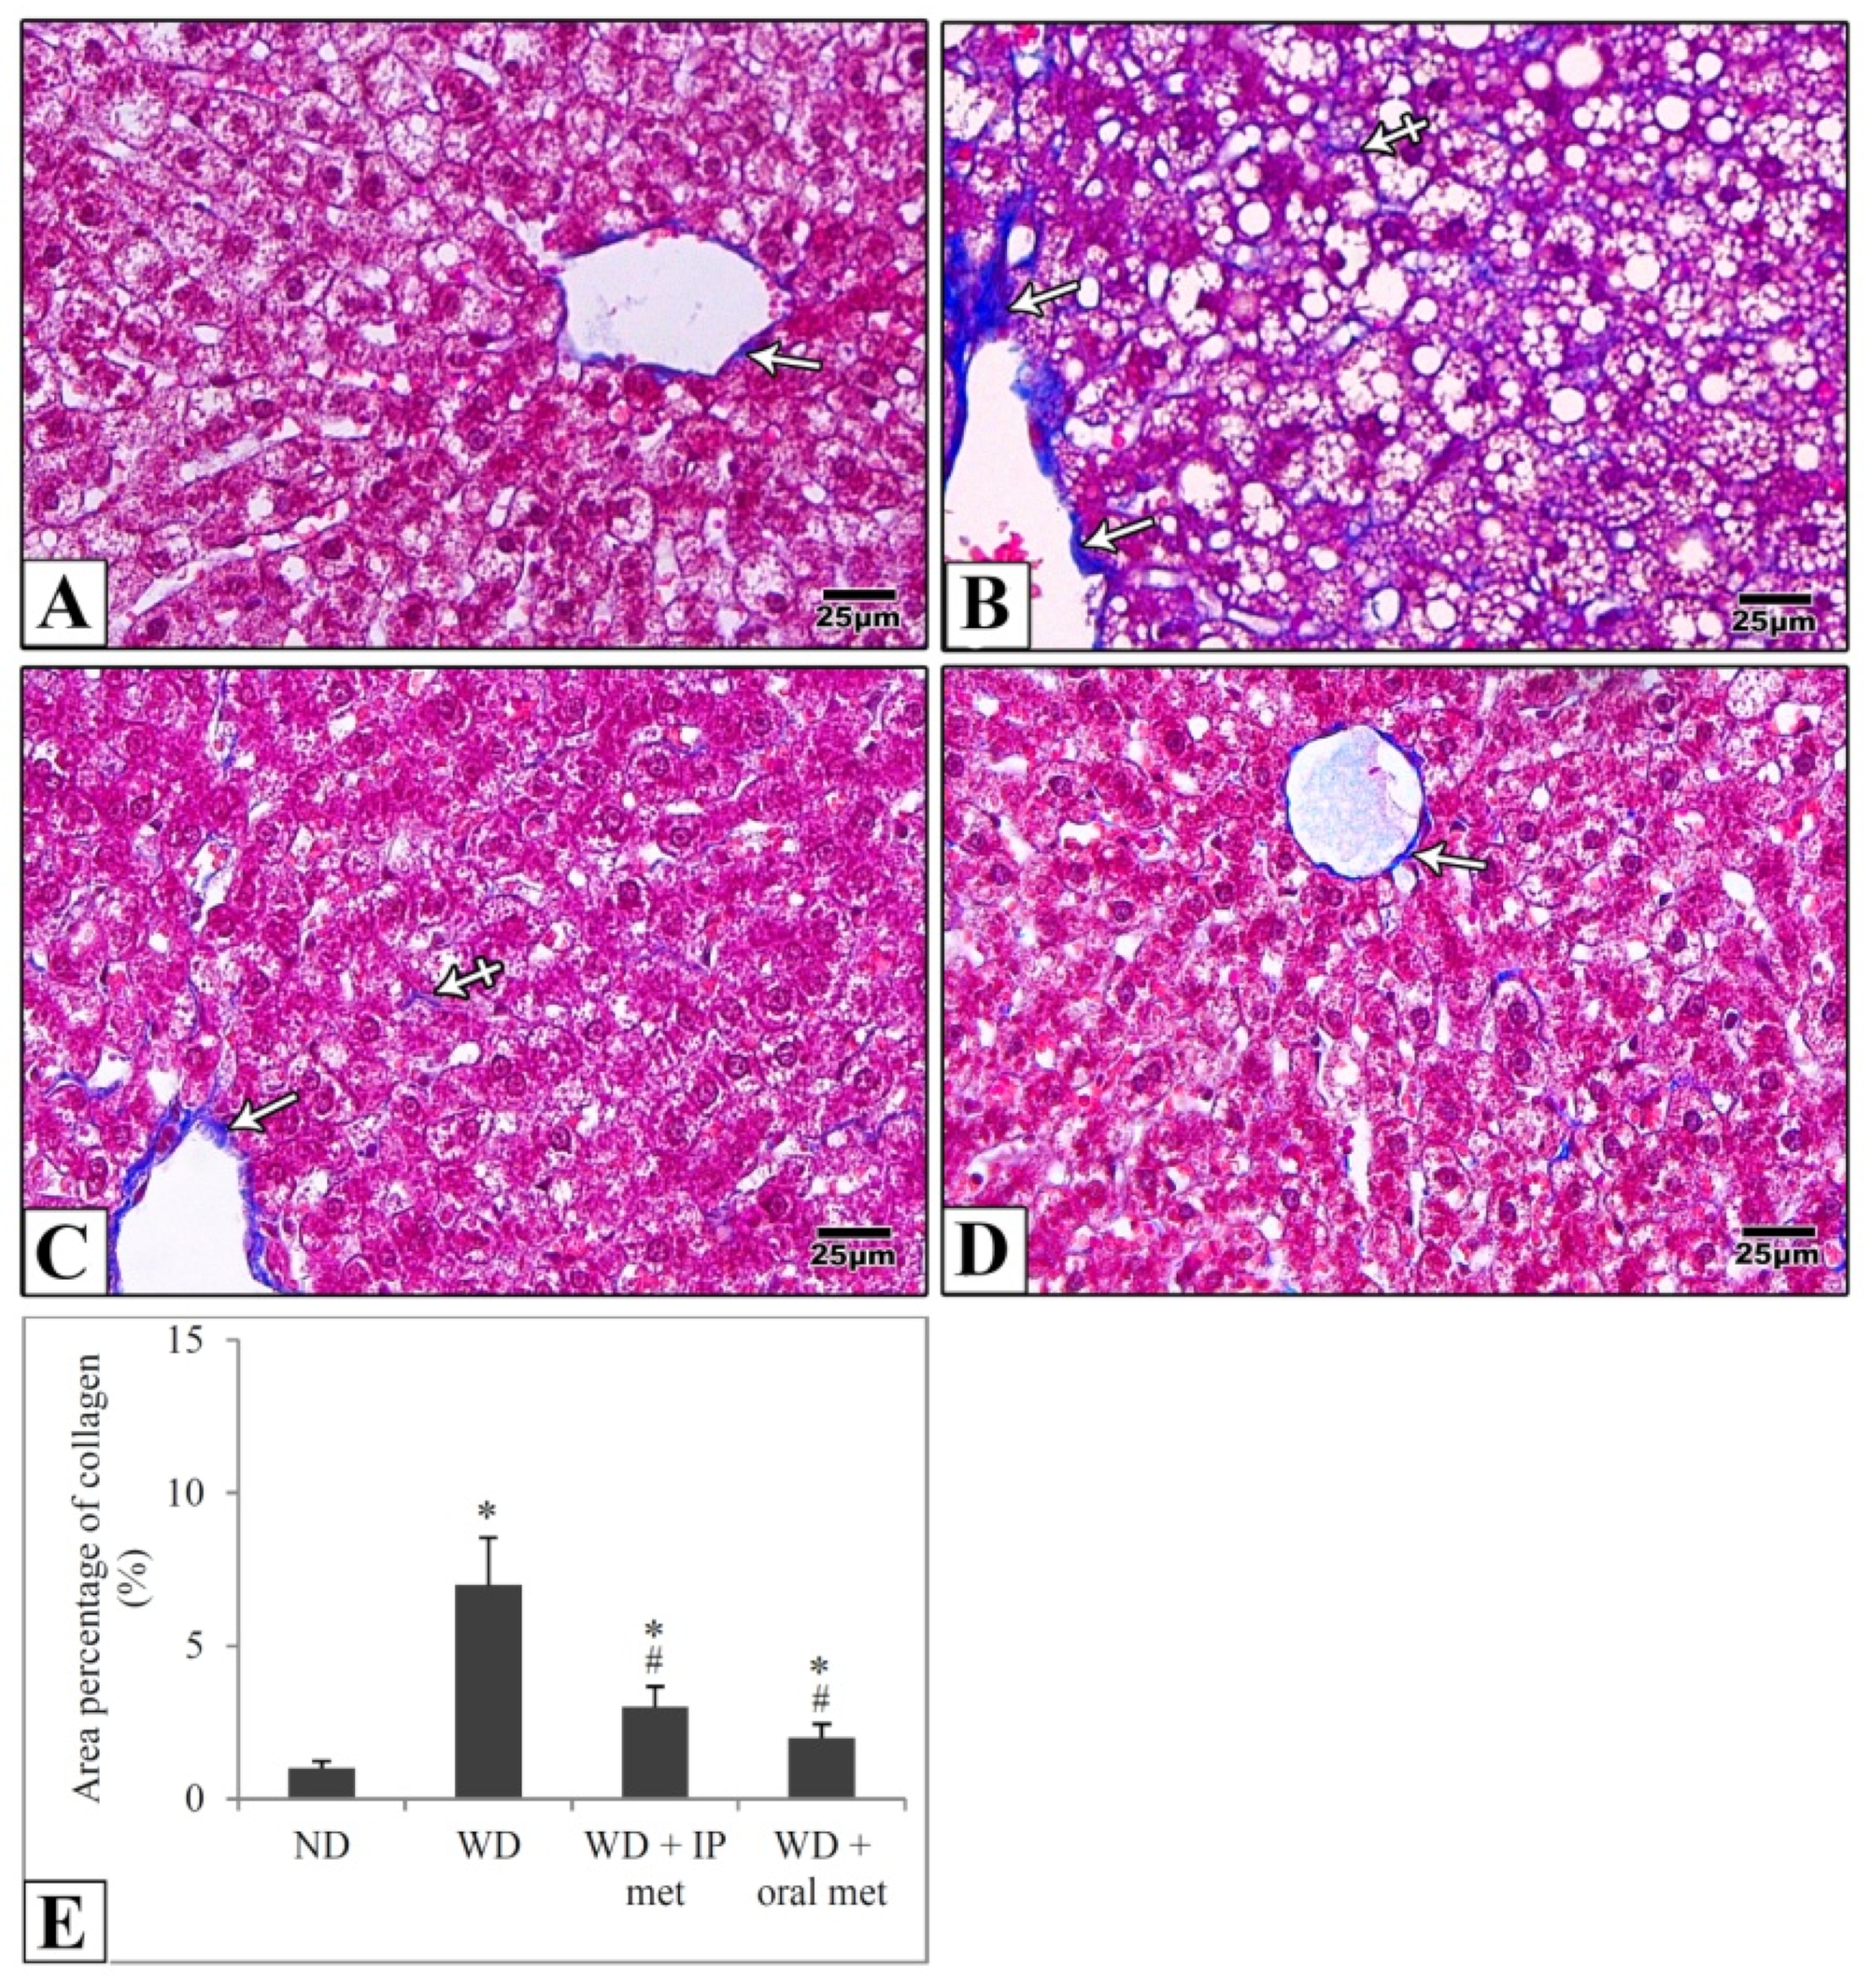
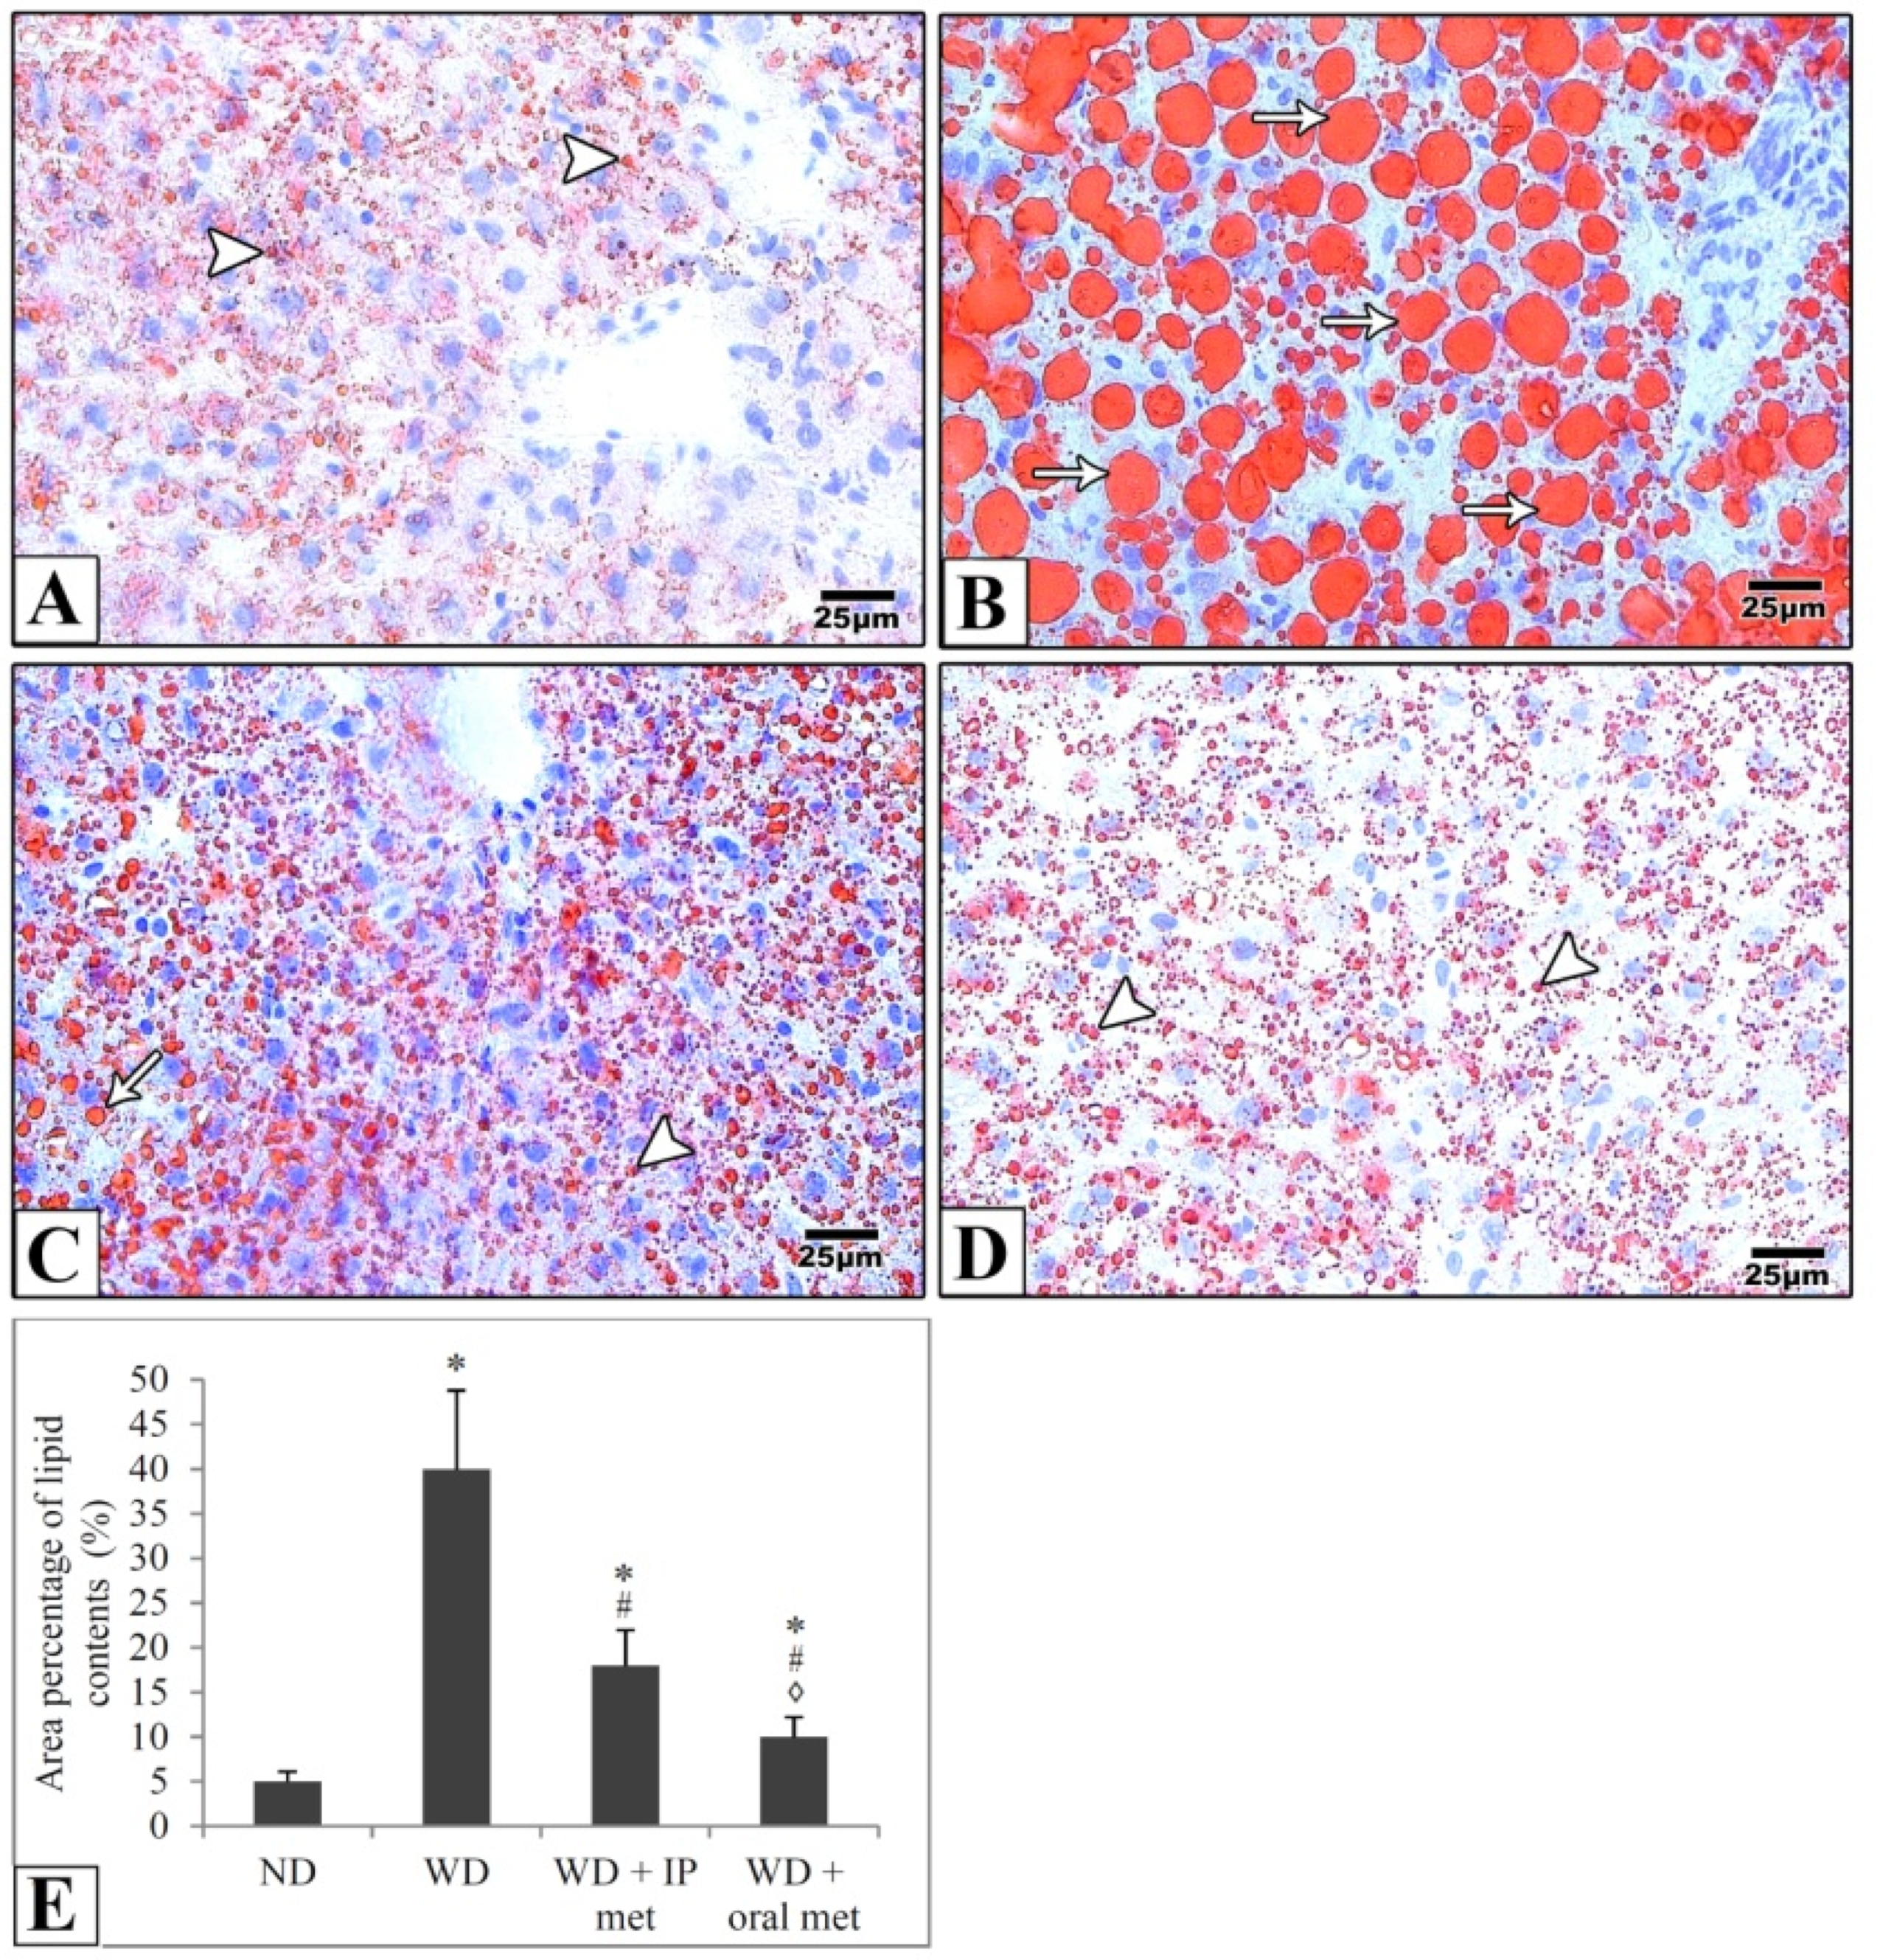
2.4. Histological Results
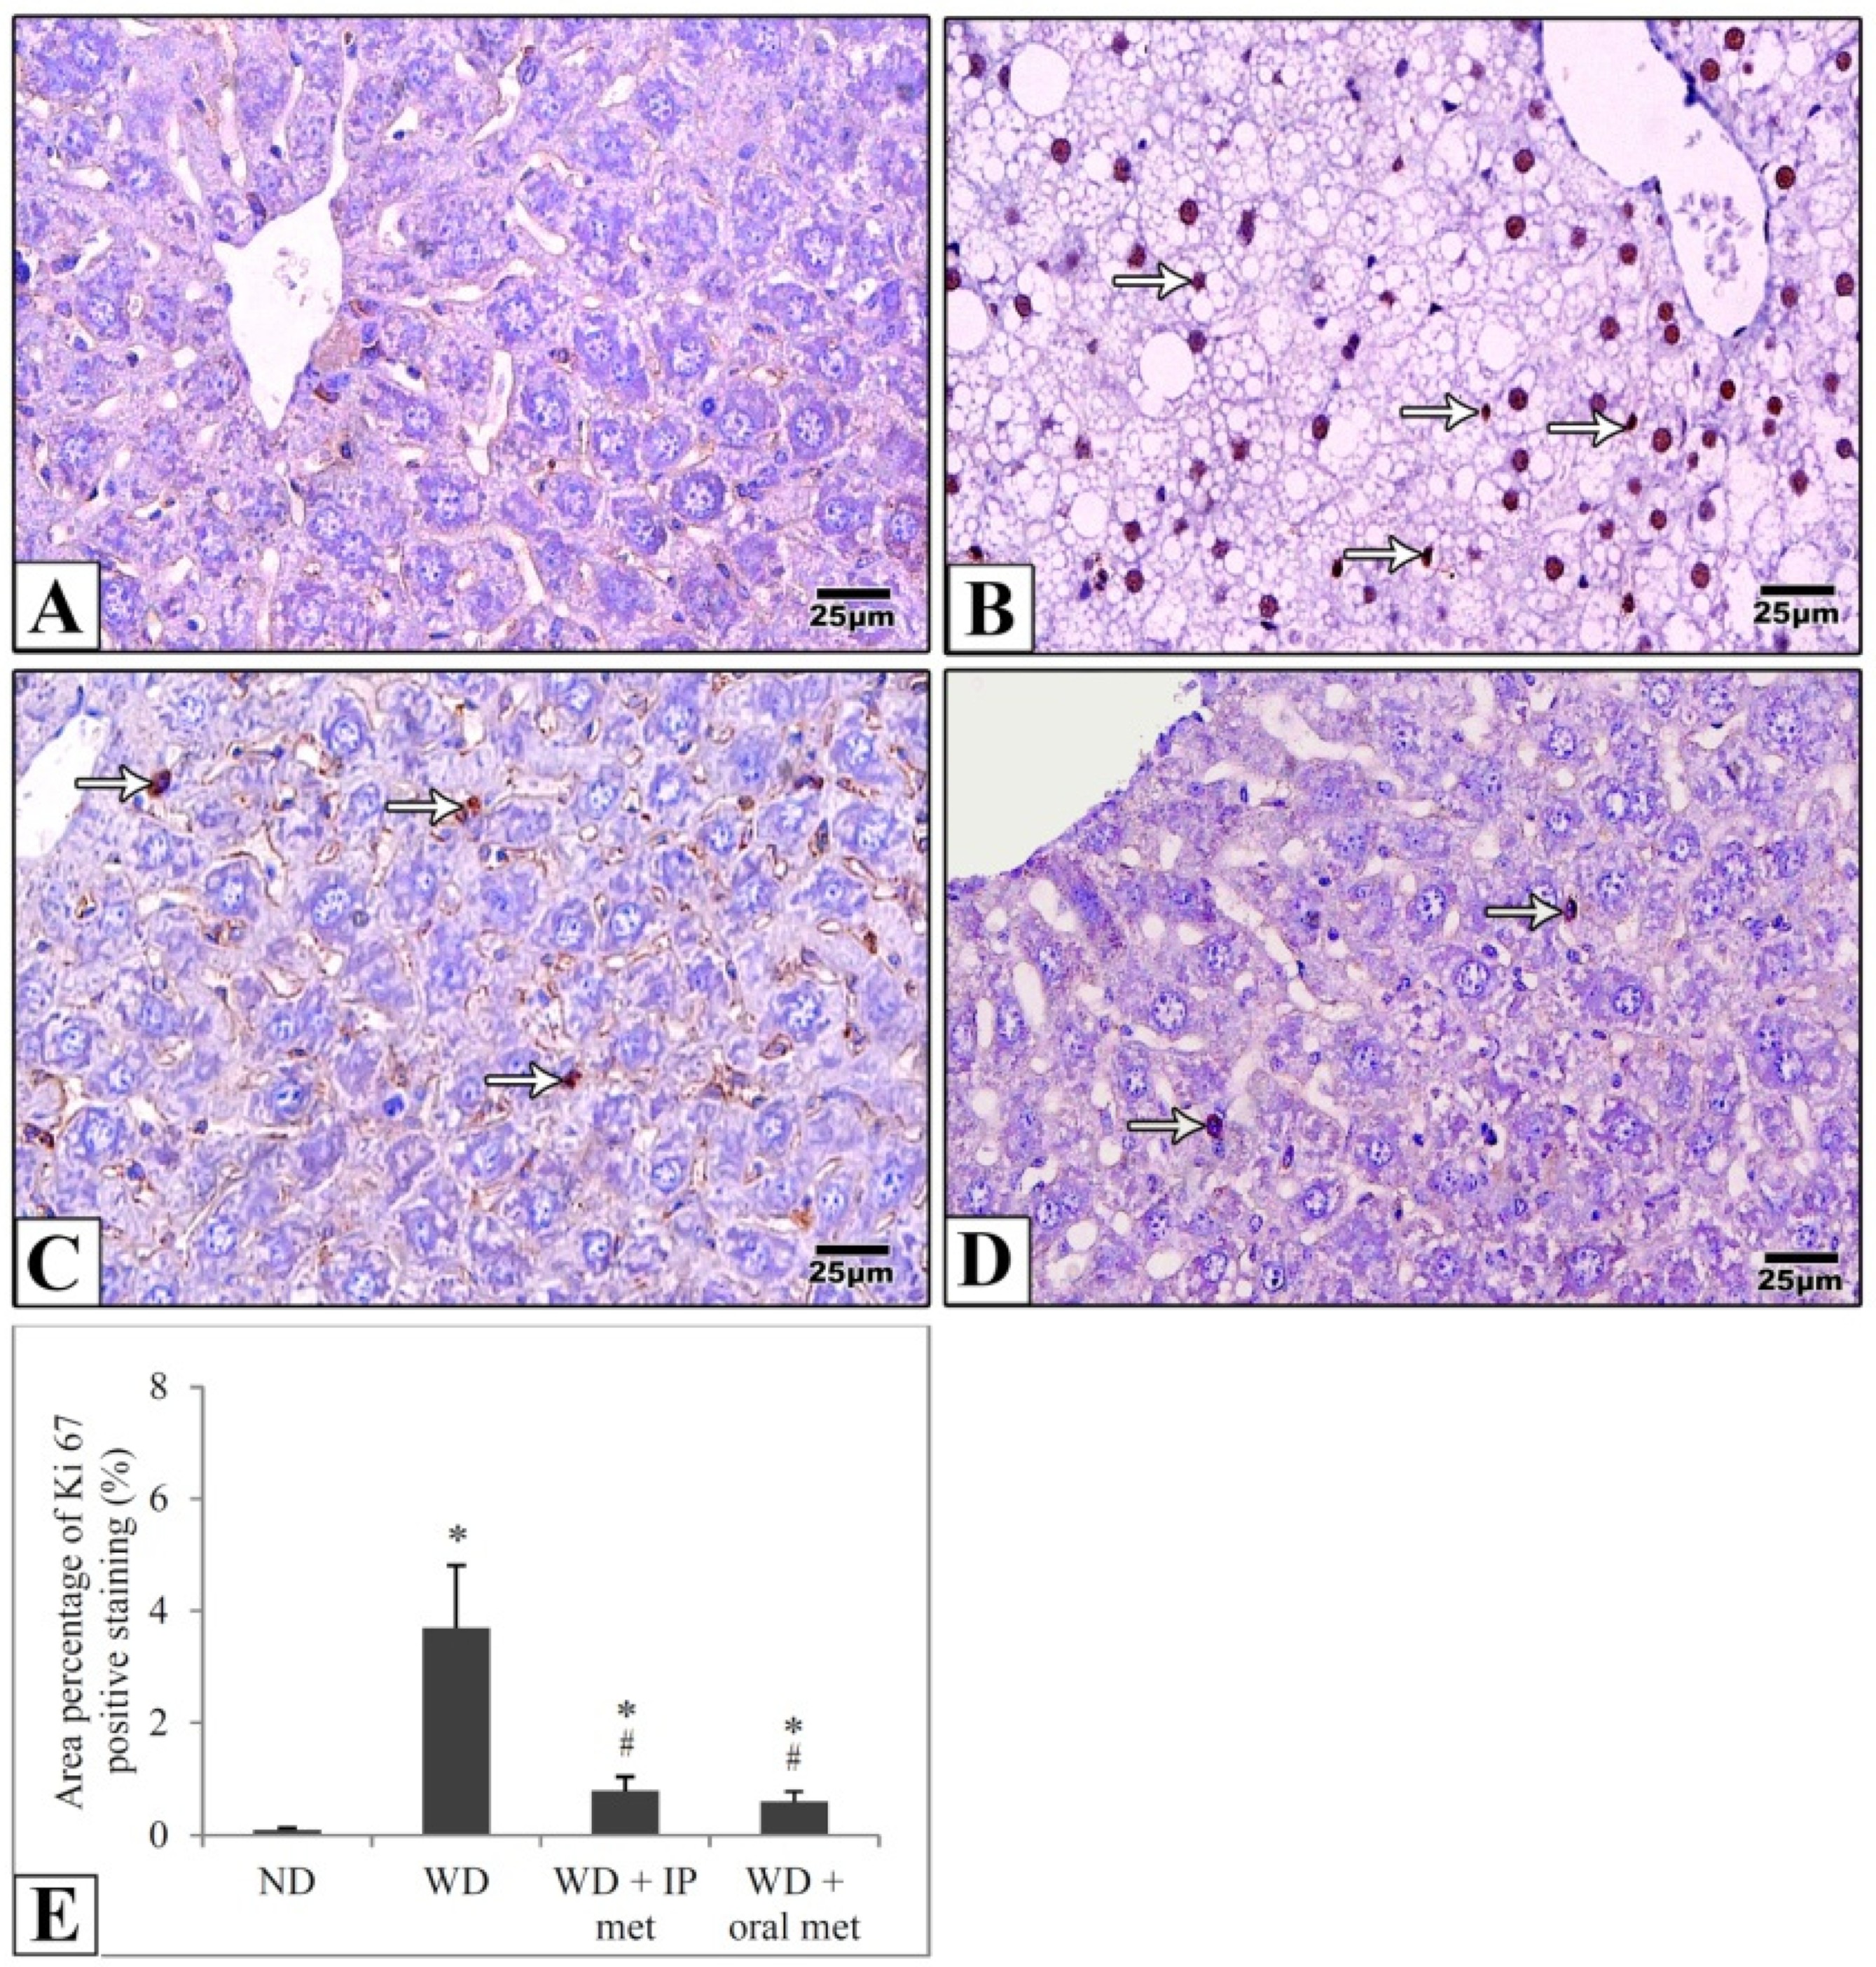
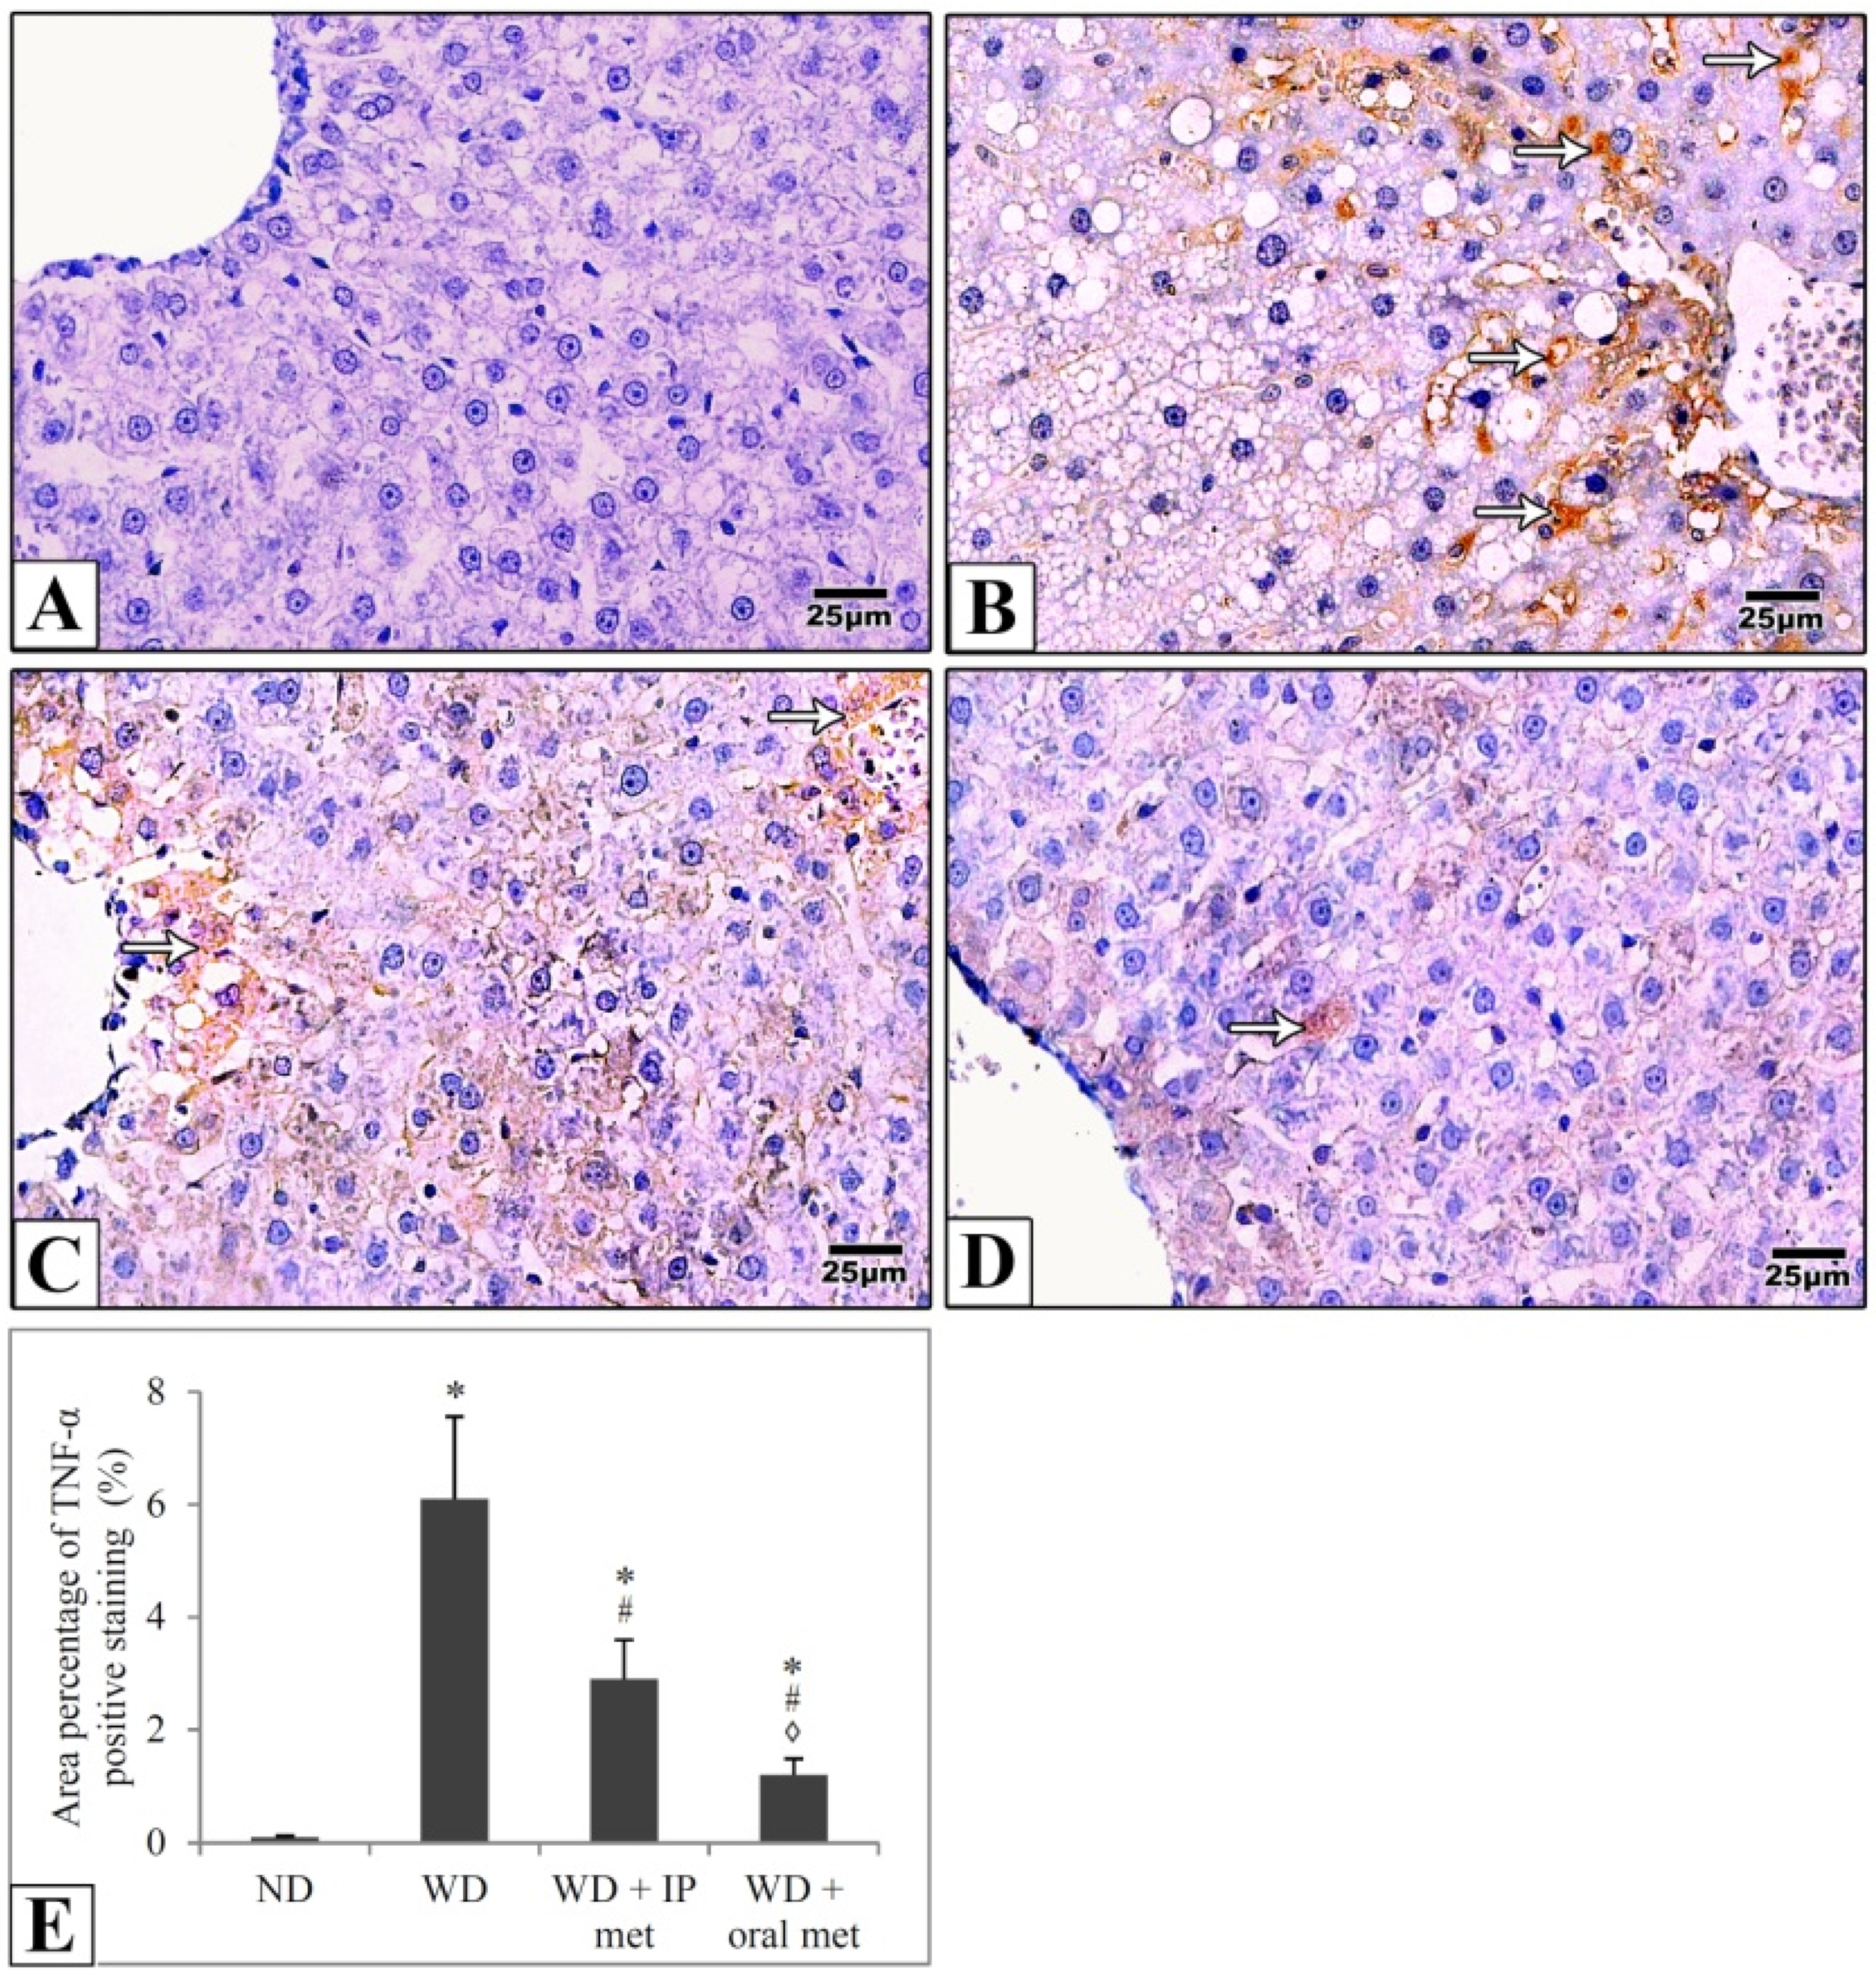
2.5. Immunohistochemical Staining
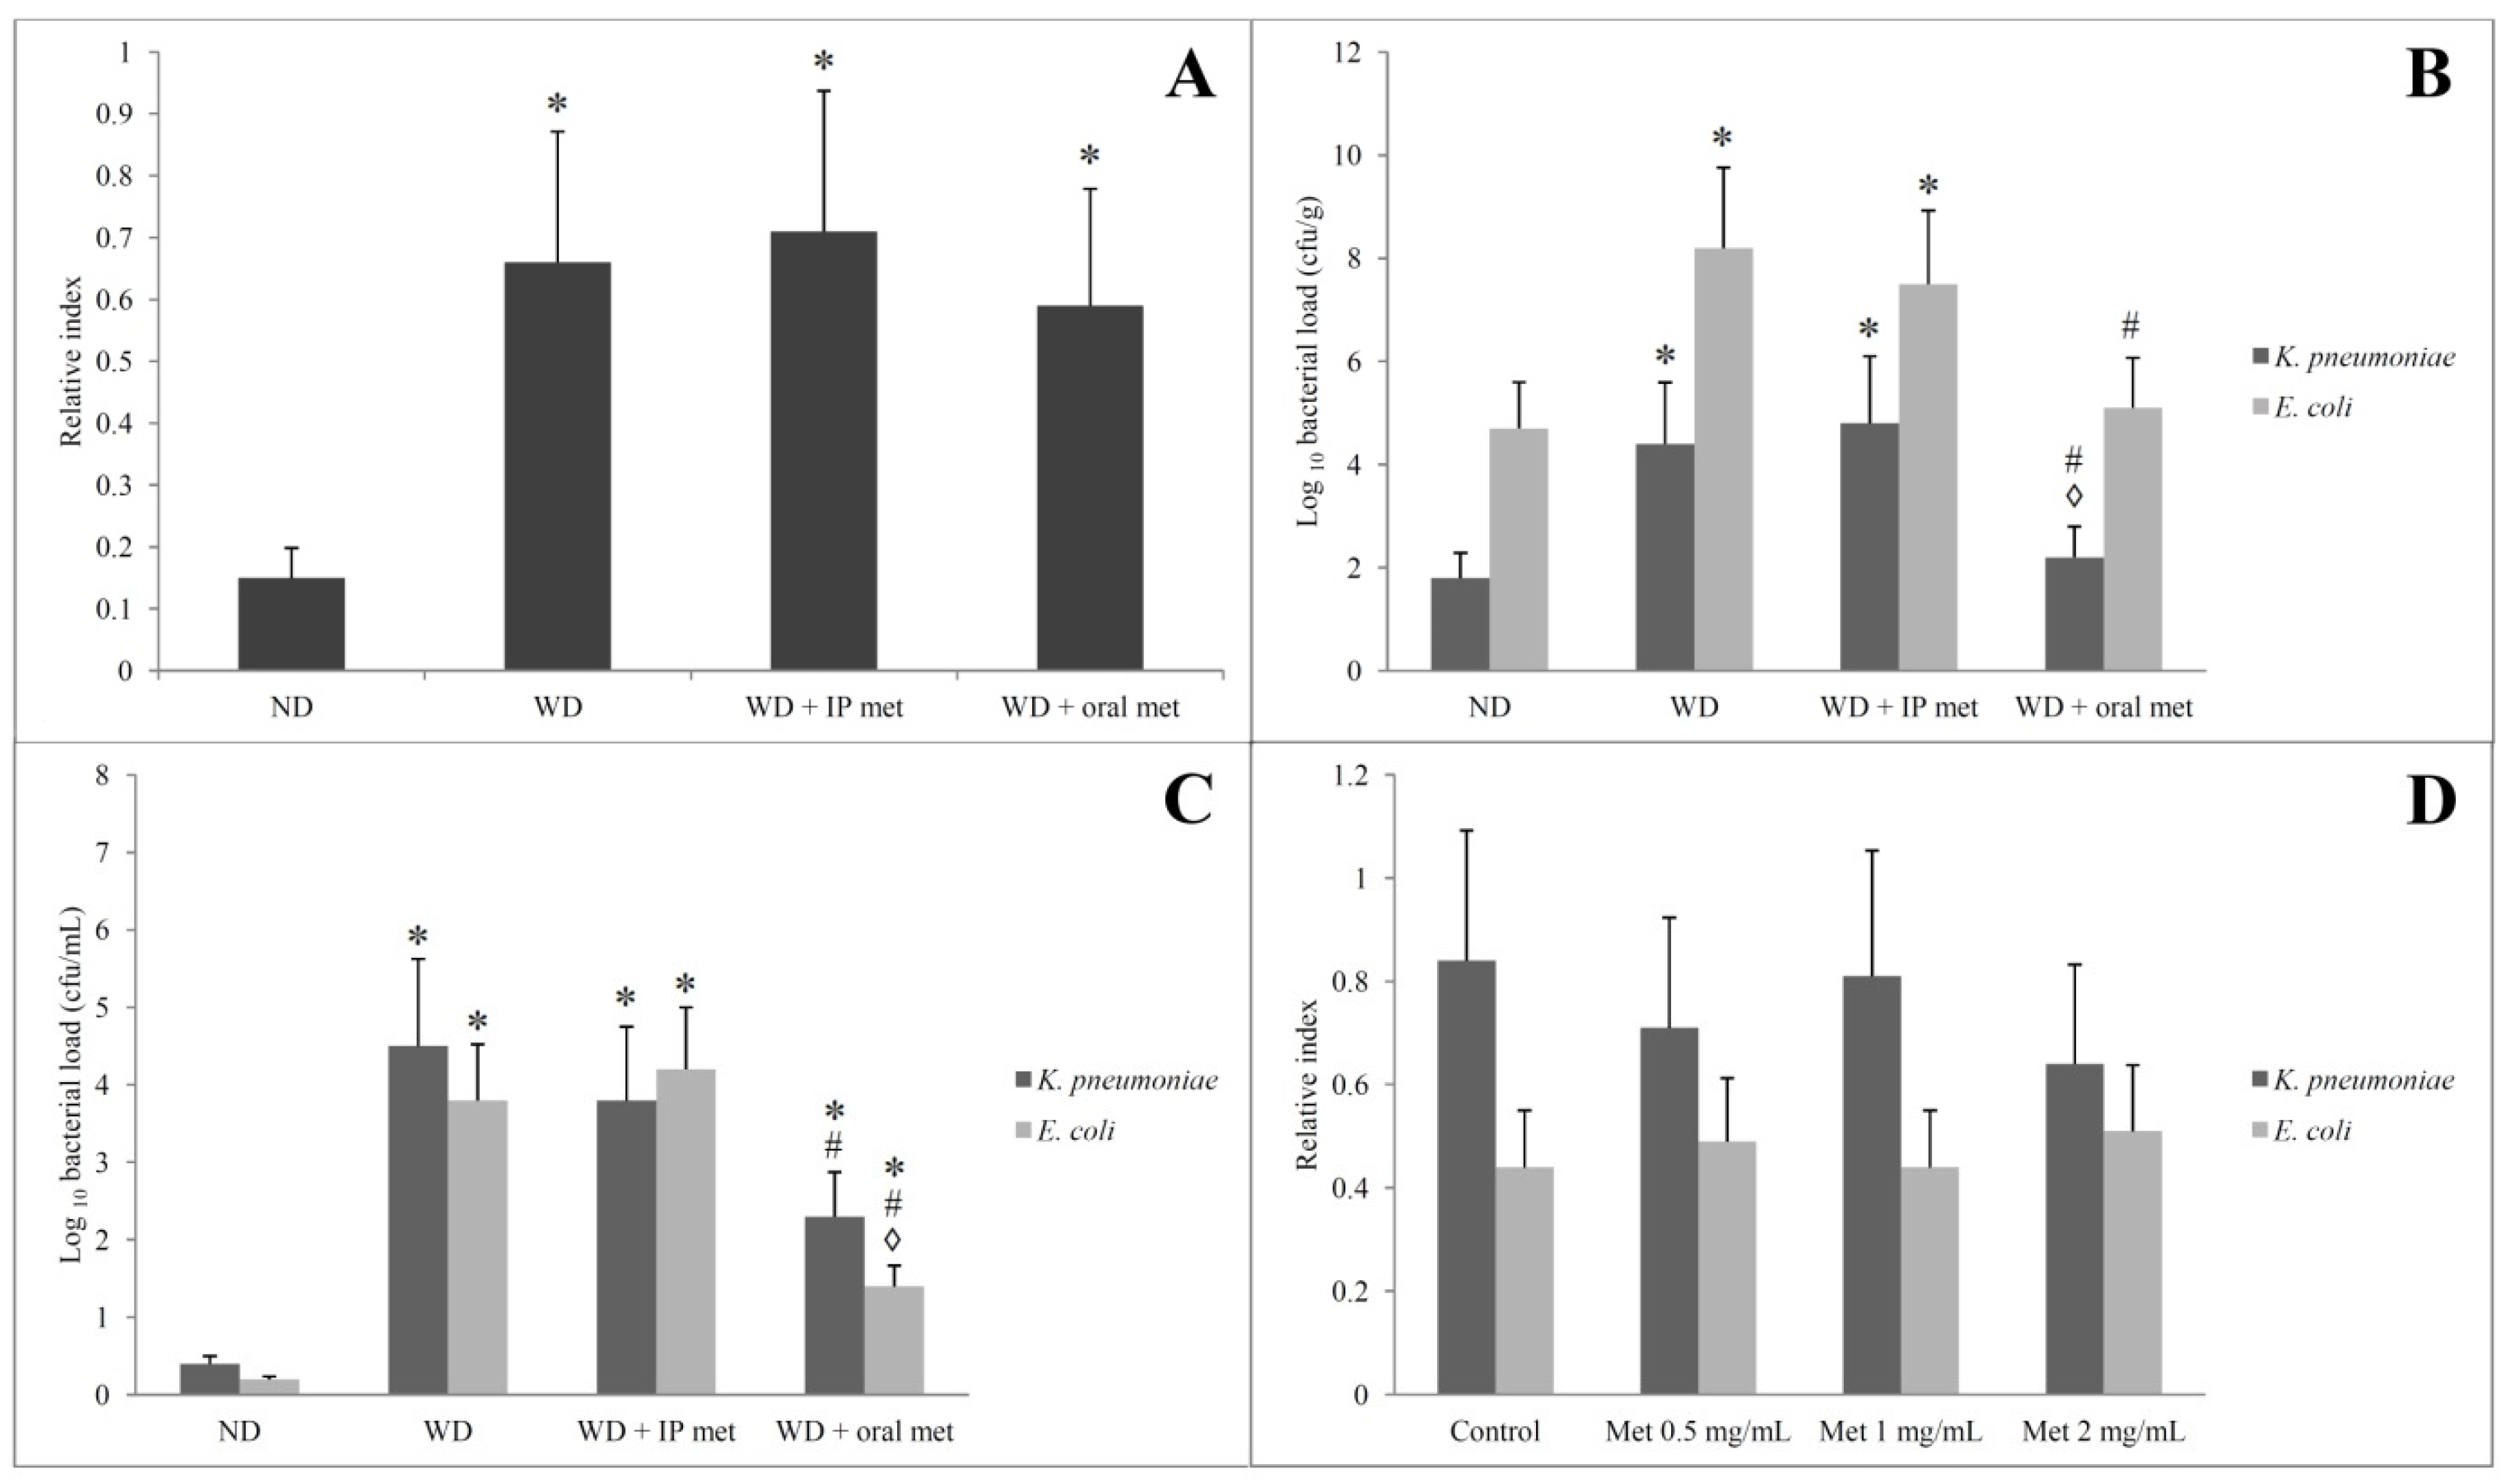
2.6. Stool Analysis for Ethanol Contents
2.7. Selective Isolation of Ethanol-Resistant K. pneumoniae and E. coli
2.8. Alcohol Dehydrogenase (ADH) Gene Amplification by PCR and Measurement of Bacterial Ethanol Production in the Presence of Metformin
3. Discussion
4. Materials and Methods
4.1. Animals
- Group I (n = 10), Control group; animals were kept on a standard pellet diet.
- Group II (n = 10), animals were fed a Western diet.
- Group III (n = 10), animals were fed a Western diet with IP metformin (Sigma-Aldrich) (100 mg/kg/day).
- Group IV (n = 16), animals were fed a Western diet with oral metformin (300 mg/kg/day in drinking water (1.5 mg/mL), assuming that the average water consumption is about 4 mL of water per day).
4.2. Biochemical Parameters
4.3. Assay of Serum Cytokines’ Levels
4.4. Histological Study
4.5. Immunohistochemical Study
4.6. Morphometric Studies
4.7. Stool Analysis for Ethanol Contents
4.8. Selective Isolation of Ethanol-Resistant K. pneumoniae and E. coli
4.9. Adh Gene of Ethanol-Resistant K. pneumoniae and E. coli; Amplification by PCR
- A volume of 12.5 μL of Taq PCR Master Mix after being briefly vortexed to avoid localised differences in salt concentration.
- The primer solutions were thawed on ice & mixed well before use. One μL of each primer was added to the PCR tube.
- A volume of 5 μL of template-extracted DNA was added to each tube.
- A volume of 5.5 μL of nuclease-free double distilled water was added.
4.10. Measurement of Ethanol Production by Ethanol-Resistant K. pneumoniae and E. coli
4.11. Data Analysis
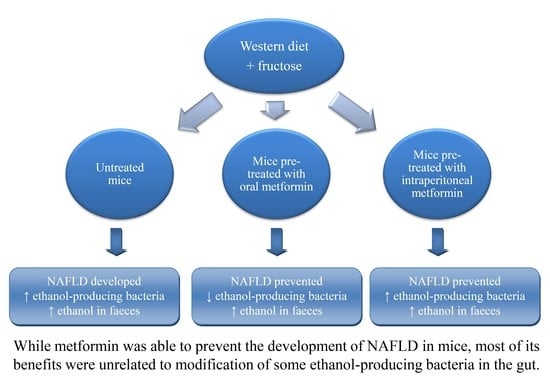
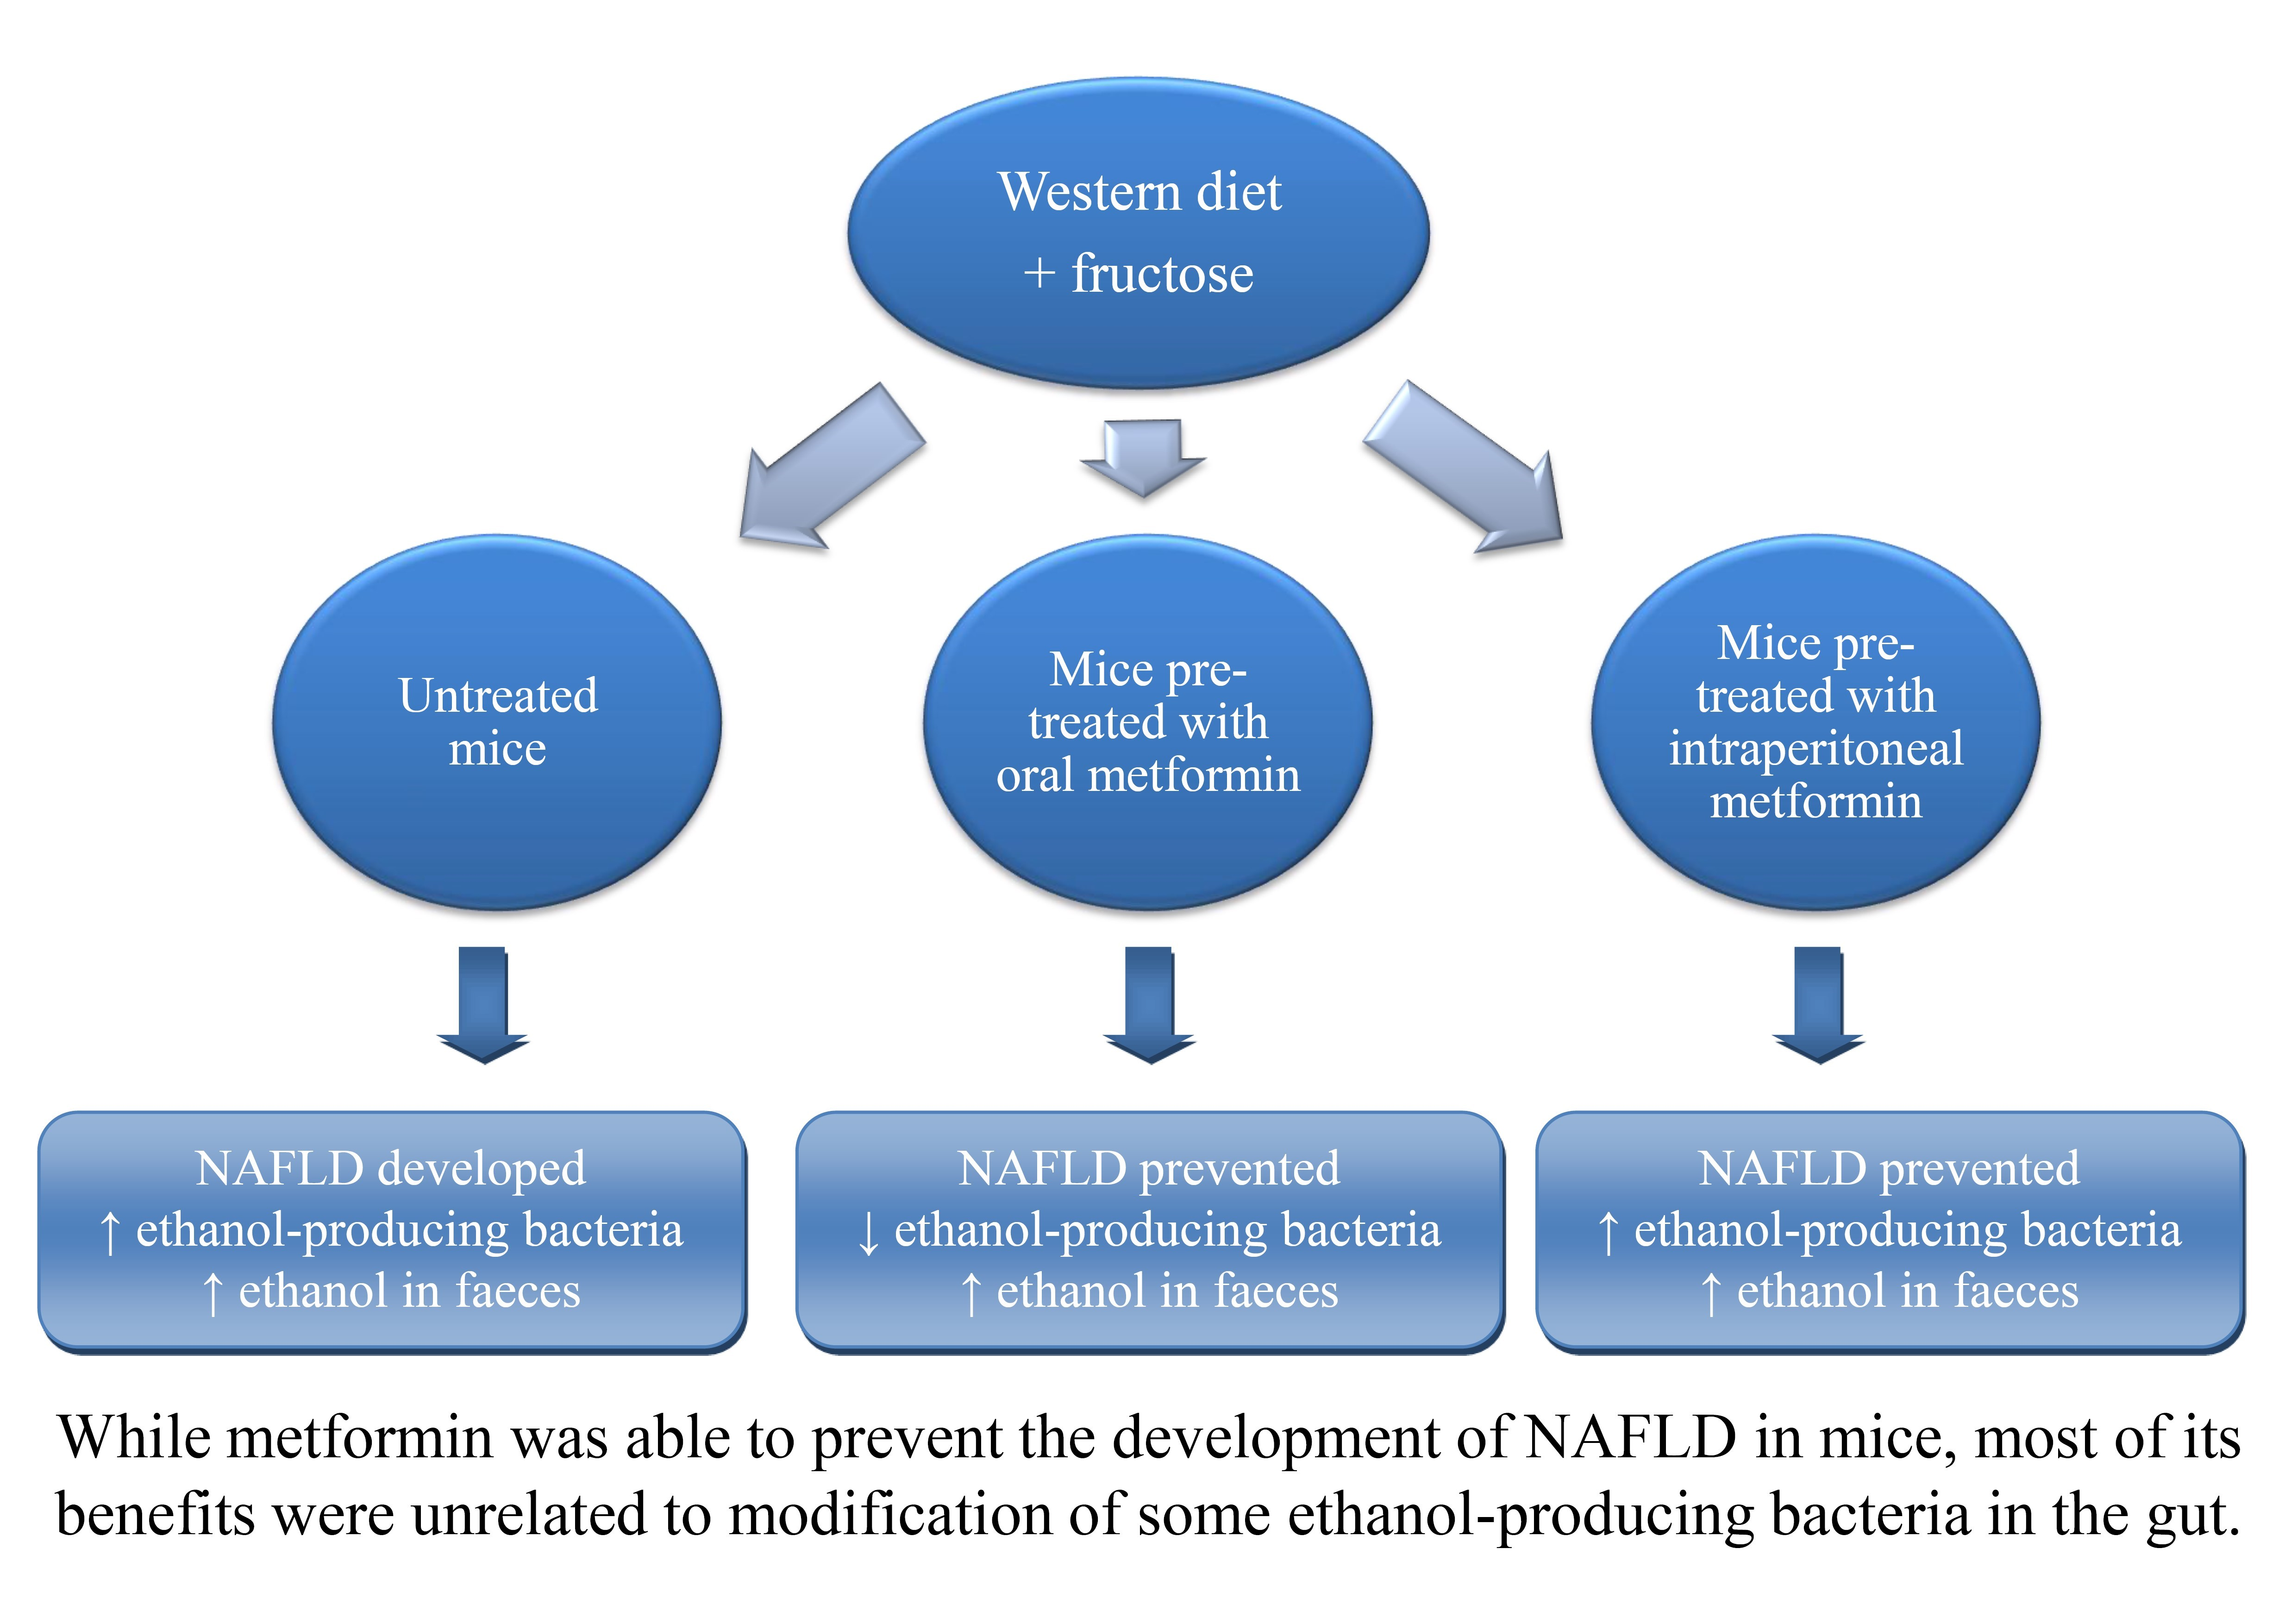
5. Conclusions
Author Contributions
Funding
Institutional Review Board Statement
Informed Consent Statement
Data Availability Statement
Acknowledgments
Conflicts of Interest
References
- Estes, C.; Razavi, H.; Loomba, R.; Younossi, Z.; Sanyal, A.J. Modeling the epidemic of nonalcoholic fatty liver disease demonstrates an exponential increase in burden of disease. Hepatology 2018, 67, 123–133. [Google Scholar] [CrossRef] [PubMed]
- Ludwig, J.; Viggiano, T.R.; McGill, D.B.; Oh, B.J. Non alcoholic steatohepatitis: Mayo Clinic experiences with a hitherto unnamed disease. Mayo Clin. Proc. 1980, 55, 434–438. [Google Scholar] [PubMed]
- Charlton, M.R.; Burns, J.M.; Pedersen, R.A.; Watt, K.D.; Heimbach, J.K.; Dierkhising, R.A. Frequency and outcomes of liver transplantation for non-alcoholic steatohepatitis in the United States. Gastroenterology 2011, 141, 1249–1253. [Google Scholar] [CrossRef] [PubMed]
- Caligiuri, A.; Gentilini, A.; Marra, F. Molecular pathogenesis of NASH. Int. J. Mol. Sci. 2016, 17, 1575. [Google Scholar] [CrossRef] [PubMed]
- Ghoshal, U.C.; Goel, A.; Quigley, E.M.M. Gut microbiota abnormalities, small intestinal bacterial overgrowth, and non-alcoholic fatty liver disease: An emerging paradigm. Indian J. Gastroenterol. 2020, 39, 9–21. [Google Scholar] [CrossRef] [PubMed]
- Quesada-Vázquez, S.; Aragonès, G.; Del Bas, J.M.; Escoté, X. Diet, gut microbiota and non-alcoholic fatty liver disease: Three parts of the same axis. Cells 2020, 9, 176. [Google Scholar] [CrossRef]
- Zhu, L.; Baker, S.S.; Gill, C.; Liu, W.; Alkhouri, R.; Baker, R.D.; Gill, S.R. Characterization of gut microbiomes in non-alcoholic steatohepatitis (NASH) patients: A connection between endogenous alcohol and NASH. Hepatology 2013, 57, 601–609. [Google Scholar] [CrossRef]
- Iruzubieta, P.; Medina, J.M.; Fernández-López, R.; Crespo, J.; de la Cruz, F. A role for gut microbiome fermentative pathways in fatty liver disease progression. J. Clin. Med. 2020, 9, 1369. [Google Scholar] [CrossRef]
- Yuan, J.; Chen, C.; Cui, J.; Lu, J.; Yan, C.; Wei, X.; Zhao, X.; Li, N.; Li, S.; Xue, G.; et al. Fatty liver disease caused by high-alcohol-producing Klebsiella pneumoniae. Cell Metab. 2019, 30, 675–688.e7. [Google Scholar] [CrossRef]
- Lin, H.Z.; Yang, S.Q.; Chuckaree, C.; Kuhajda, F.; Ronnetm, G.; Diehlm, A.M. Metformin reverses fatty liver disease in obese, leptin-deficient mice. Nat. Med. 2000, 6, 998–1003. [Google Scholar] [CrossRef]
- Spruss, A.; Kanuri, G.; Stahl, C.; Bischoff, S.C.; Bergheim, I. Metformin protects against the development of fructose-induced steatosis in mice: Role of the intestinal barrier function. Lab. Investig. 2012, 92, 1020–1032. [Google Scholar] [CrossRef] [PubMed]
- Feng, W.; Gao, C.; Bi, Y.; Wu, M.; Li, P.; Shen, S.; Chen, W.; Yin, T.; Zhu, D. Randomized trial comparing the effects of gliclazide, liraglutide, and metformin on diabetes with non-alcoholic fatty liver disease. J. Diabetes 2017, 9, 800–809. [Google Scholar] [CrossRef] [PubMed]
- Brandt, A.; Hernández-Arriaga, A.; Kehm, R.; Sánchez, V.; Jin, C.J.; Nier, A.; Baumann, A.; Camarinha-silva, A.; Bergheim, I. Metformin attenuates the onset of non-alcoholic fatty liver disease and affects intestinal microbiota and barrier in small intestine. Sci. Rep. 2019, 9, 6668. [Google Scholar] [CrossRef] [PubMed]
- Said, A.; Akhter, A. Meta-analysis of randomized controlled trials of pharmacologic agents in non-alcoholic steatohepatitis. Ann. Hepatol. 2017, 16, 538–547. [Google Scholar] [CrossRef]
- Pinyopornpanish, K.; Leerapun, A.; Pinyopornpanish, K.; Chattipakorn, N. Effects of metformin on hepatic steatosis in adults with nonalcoholic fatty liver disease and diabetes: Insights from the cellular to patient levels. Gut Liver 2021, 15, 827–840. [Google Scholar] [CrossRef] [PubMed]
- Zhang, Y.; Wang, H.; Xiao, H. Metformin actions on the liver: Protection mechanisms emerging in hepatocytes and immune cells against NASH-related HCC. Int. J. Mol. Sci. 2021, 22, 5016. [Google Scholar] [CrossRef] [PubMed]
- LaMoia, T.E.; Shulman, G.I. Cellular and molecular mechanisms of metformin action. Endocr. Rev. 2021, 42, 77–96. [Google Scholar] [CrossRef]
- Hawley, S.A.; Gadalla, A.E.; Olsen, G.S.; Hardie, D.G. The antidiabetic drug metformin activates the AMP-activated protein kinase cascade via an adenine nucleotide-independent mechanism. Diabetes 2002, 51, 2420–2425. [Google Scholar] [CrossRef] [PubMed]
- Zhu, Z.; Jiang, Z.; Zhou, J.; Zhou, D.; Wang, W.; Zhao, C.; Zhen, Z.; Nanji, A.A. Involvement of insulin resistance in the protective effect of metformin against alcoholic liver injury. Alcohol. Clin. Exp. Res. 2014, 38, 1510–1519. [Google Scholar] [CrossRef]
- Li, Y.L.; Li, X.Q.; Wang, Y.D.; Shen, C.; Zhao, C.Y. Metformin alleviates inflammatory response in non-alcoholic steatohepatitis by restraining signal transducer and activator of transcription 3-mediated autophagy inhibition in vitro and in vivo. Biochem. Biophys. Res. Commun. 2019, 513, 64–72. [Google Scholar] [CrossRef]
- Borole, K.D.; Padalkar, P.H.; Swami, R. Assessment of antioxidant activity of metformin in ethanol induced liver damage in Sprague Dawley rats. Int. J. Basic Clin. Pharmacol. 2016, 5, 324–328. [Google Scholar] [CrossRef]
- Adeshirlarijaney, A.; Zou, J.; Tran, H.Q.; Chassaing, B.; Gewirtz, A.T. Amelioration of metabolic syndrome by metformin associates with reduced indices of low-grade inflammation independently of the gut microbiota. Am. J. Physiol. Endocrinol. 2019, 317, E1121–E1130. [Google Scholar] [CrossRef] [PubMed]
- Lee, H.; Ko, G. Effect of metformin on metabolic improvement and gutmicrobiota. Appl. Environ. Microbiol. 2014, 80, 5935–5943. [Google Scholar] [CrossRef] [PubMed]
- Xiao, X.; Huan, Q.; Huang, Y.; Liu, Y.; Li, R.; Xu, X.; Wang, Z. Metformin reverses tmexCD1-toprJ1- and tet(A)-mediated high-level tigecycline resistance in K. pneumoniae. Antibiotics 2022, 11, 162. [Google Scholar] [CrossRef] [PubMed]
- Wu, H.; Esteve, E.; Tremaroli, V.; Khan, M.T.; Caesar, R.; Mannerås-Holm, L.; Ståhlman, M.; Olsson, L.M.; Serino, M.; Planas-Fèlix, M.; et al. Metformin alters the gut microbiome of individuals with treatment-naive type 2 diabetes, contributing to the therapeutic effects of the drug. Nat. Med. 2017, 23, 850–858. [Google Scholar] [CrossRef]
- Bauer, P.V.; Duca, F.A.; Waise, T.M.Z.; Rasmussen, B.A.; Abraham, M.A.; Dranse, H.J.; Puri, A.; O’Brien, C.A.; Lam, T.K.T. Metformin alters upper small intestinal microbiota that impact a glucose-SGLT1-sensing glucoregulatory pathway. Cell Metab. 2018, 27, 101–117.e5. [Google Scholar] [CrossRef] [PubMed]
- Zhang, X.; Zhao, Y.; Xu, J.; Xue, J.; Zhang, M.; Pang, X.; Zhang, X.; Zhao, L. Modulation of gut microbiota by berberine and metformin during the treatment of high-fat diet-induced obesity in rats. Sci. Rep. 2015, 5, 14405. [Google Scholar] [CrossRef]
- Wang, J.H.; Bose, S.; Lim, S.K.; Ansari, A.; Chin, Y.W.; Choi, H.S.; Kim, H. Houttuynia cordata facilitates metformin on ameliorating insulin resistance associated with gut microbiota alteration in oletf rats. Genes 2017, 8, 239. [Google Scholar] [CrossRef]
- Wang, J.H.; Bose, S.; Shin, N.R.; Chin, Y.W.; Choi, Y.H.; Kim, H. Pharmaceutical impact of Houttuynia cordata and metformin combination on high-fat-diet-induced metabolic disorders: Link to intestinal microbiota and metabolic endotoxemia. Front. Endocrinol. 2018, 9, 620. [Google Scholar] [CrossRef]
- Khat-Udomkiri, N.; Toejing, P.; Sirilun, S.; Chaiyasut, C.; Lailerd, N. Antihyperglycemic effect of rice husk derived xylooligosaccharides in high-fat diet and low-dose streptozotocin-induced type 2 diabetic rat model. Food. Sci. Nutr. 2020, 8, 428–444. [Google Scholar] [CrossRef]
- Liu, Y.; Wang, C.; Li, J.; Li, T.; Zhang, Y.; Liang, Y.; Mei, Y. Phellinus linteus polysaccharide extract improves insulin resistance by regulating gut microbiota composition. FASEB J. 2020, 34, 1065–1078. [Google Scholar] [CrossRef] [PubMed]
- Karlsson, F.H.; Tremaroli, V.; Nookaew, I.; Bergstrom, G.; Behre, C.J.; Fagerberg, B.; Nielsen, J.; Backhed, F. Gut metagenome in European women with normal, impaired and diabetic glucose control. Nature 2013, 498, 99–103. [Google Scholar] [CrossRef] [PubMed]
- He, D.; Han, H.; Fu, X.; Liu, A.; Zhan, Y.; Qiu, H.; Ma, L.; Zhang, X.; Wang, X. Metformin reduces blood glucose in treatment-naive type 2 diabetes by altering the gut microbiome. Can. J. Diabetes 2022, 46, 150–156. [Google Scholar] [CrossRef] [PubMed]
- Forslund, K.; Hildebrand, F.; Nielsen, T.; Falony, G.; Le Chatelier, E.; Sunagawa, S.; Prifti, E.; Vieira-Silva, S.; Gudmundsdottir, V.; Pedersen, H.K.; et al. Disentangling type 2 diabetes and metformin treatment signatures in the human gut microbiota. Nature 2015, 528, 262–266. [Google Scholar] [CrossRef] [PubMed]
- Bryrup, T.; Thomsen, C.W.; Kern, T.; Allin, K.H.; Brandslund, I.; Jorgensen, N.R.; Vestergaard, H.; Hansen, T.; Hansen, T.H.; Pedersen, O.; et al. Metformin-induced changes of the gut microbiota in healthy young men: Results of a non-blinded, one-armed intervention study. Diabetologia 2019, 62, 1024–1035. [Google Scholar] [CrossRef]
- Lee, C.B.; Chae, S.U.; Jo, S.J.; Jerng, U.M.; Bae, S.K. The relationship between the gut microbiome and metformin as a key for treating type 2 diabetes mellitus. Int. J. Mol. Sci. 2021, 22, 3566. [Google Scholar] [CrossRef]
- Theofilis, P.; Vordoni, A.; Kalaitzidis, R.G. Trimethylamine N-Oxide levels in non-alcoholic fatty liver disease: A systematic review and meta-analysis. Metabolites 2022, 12, 1243. [Google Scholar] [CrossRef]
- Kuka, J.; Videja, M.; Makrecka-Kuka, M.; Liepins, J.; Grinberga, S.; Sevostjanovs, E.; Vilks, K.; Liepinsh, E.; Dambrova, M. Metformin decreases bacterial trimethylamine production and trimethylamine N-oxide levels in db/db mice. Sci. Rep. 2020, 10, 14555. [Google Scholar] [CrossRef]
- Mbaye, B.; Borentain, P.; Magdy Wasfy, R.; Alou, M.T.; Armstrong, N.; Mottola, G.; Meddeb, L.; Ranque, S.; Gérolami, R.; Million, M.; et al. Endogenous ethanol and triglyceride production by gut Pichia kudriavzevii, Candida albicans and Candida glabrata yeasts in non-alcoholic steatohepatitis. Cells 2022, 11, 3390. [Google Scholar] [CrossRef]
- Meijnikman, A.S.; Davids, M.; Herrema, H.; Aydin, O.; Tremaroli, V.; Rios-Morales, M.; Levels, H.; Bruin, S.; de Brauw, M.; Verheij, J.; et al. Microbiome-derived ethanol in nonalcoholic fatty liver disease. Nat. Med. 2022, 28, 2100–2106. [Google Scholar] [CrossRef]
- Wang, Y.; Tong, J.; Chang, B.; Wang, B.; Zhang, D.; Wang, B. Effects of alcohol on intestinal epithelial barrier permeability and expression of tight junction-associated proteins. Mol. Med. Rep. 2014, 9, 2352–2356. [Google Scholar] [CrossRef] [PubMed]
- Carino, A.; Cipriani, S.; Marchianò, S.; Biagioli, M.; Santorelli, C.; Donini, A.; Zampella, A.; Monti, M.C.; Fiorucci, S. BAR502, a dual FXR and GPBAR1 agonist, promotes browning of white adipose tissue and reverses liver steatosis and fibrosis. Sci. Rep. 2017, 7, 42801. [Google Scholar] [CrossRef] [PubMed]
- Bancroft, J.D.; Layton, C. Connective and mesenchymal tissues with their stains. In Bancroft’s Theory and Practice of Histological Techniques; Suvarna, S.K., Layton, C., Bancroft, J.D., Eds.; Churchill Livingstone: Philadelphia, PA, USA, 2013; pp. 173–212. [Google Scholar]
- Horiguchi, N.; Ishac, E.J.; Gao, B. Liver regeneration is suppressed in alcoholic cirrhosis: Correlation with decreased STAT3 activation. Alcohol 2007, 41, 271–280. [Google Scholar] [CrossRef] [PubMed]
- Tian, S.; Jiang, X.; Tang, Y.; Han, T. Laminaria japonica fucoidan ameliorates cyclophosphamide-induced liver and kidney injury possibly by regulating Nrf2/HO-1 and TLR4/NF-κB signaling pathways. J. Sci. Food Agric. 2022, 102, 2604–2612. [Google Scholar] [CrossRef] [PubMed]
- Tian, S.; Zhao, Y.; Qian, L.; Jiang, S.; Tang, Y.; Han, T. DHA-enriched phosphatidylserine alleviates high fat diet-induced jejunum injury in mice by modulating gut microbiota. Food Funct. 2023, 14, 1415–1429. [Google Scholar] [CrossRef] [PubMed]
- Leclercq, S.; Matamoros, S.; Cani, P.D.; Neyrinck, A.M.; Jamar, F.; Starkel, P.; Windey, K.; Tremaroli, V.; Backhed, F.; Verbeke, K.; et al. Intestinal permeability, gut-bacterial dysbiosis, and behavioral markers of alcohol-dependence severity. Proc. Natl. Acad. Sci. USA 2014, 111, E4485–E4493. [Google Scholar] [CrossRef]
- Leclercq, S.; Le Roy, T.; Furgiuele, S.; Coste, V.; Bindels, L.B.; Leyrolle, Q.; Neyrinck, A.M.; Quoilin, C.; Amadieu, C.; Petit, G.; et al. Gut microbiota-induced changes in β-hydroxybutyrate metabolism are linked to altered sociability and depression in alcohol use disorder. Cell Rep. 2020, 33, 108238. [Google Scholar] [CrossRef]
- Vaahtovuo, J.; Korkeamäki, M.; Munukka, E.; Viljanen, M.K.; Toivanen, P. Quantification of bacteria in human feces using 16S rRNA-hybridization, DNA-staining and flow cytometry. J. Microbiol. Methods 2005, 63, 276–286. [Google Scholar] [CrossRef]
- Wilson, K. Preparation of genomic DNA from bacteria. Curr. Protoc. Mol. Biol. 2001, 56, 2–4. [Google Scholar] [CrossRef]
- Li, N.N.; Li, W.; Feng, J.X.; Zhang, W.W.; Zhang, R.; Du, S.H.; Liu, S.Y.; Xue, G.H.; Yan, C.; Cui, J.H.; et al. High alcohol-producing Klebsiella pneumoniae causes fatty liver disease through 2,3-butanediol fermentation pathway in vivo. Gut. Microbes 2021, 13, 1979883. [Google Scholar] [CrossRef]
- Itoh, N.; Kariya, S.; Kurokawa, J. Efficient PCR-based amplification of diverse alcohol dehydrogenase genes from metagenomes for improving biocatalysis: Screening of gene-specific amplicons from metagenomes. Appl. Environ. Microbiol. 2014, 80, 6280–6289. [Google Scholar] [CrossRef] [PubMed]
- Koontz, L. Agarose gel electrophoresis. Methods Enzymol. 2013, 529, 35–45. [Google Scholar] [PubMed]


| Step | Initial Denaturation | Three-Step Cycling × 30 Times: | Final Extension | ||
|---|---|---|---|---|---|
| Denaturation | Annealing | Extension | |||
| Duration | 2 min | 10 s | 30 s | 3 min | 5 min |
| Temperature | 94 °C | 98 °C | 60 °C | 68 °C | 68 °C |
Disclaimer/Publisher’s Note: The statements, opinions and data contained in all publications are solely those of the individual author(s) and contributor(s) and not of MDPI and/or the editor(s). MDPI and/or the editor(s) disclaim responsibility for any injury to people or property resulting from any ideas, methods, instructions or products referred to in the content. |
© 2023 by the authors. Licensee MDPI, Basel, Switzerland. This article is an open access article distributed under the terms and conditions of the Creative Commons Attribution (CC BY) license (https://creativecommons.org/licenses/by/4.0/).
Share and Cite
Abouelkheir, M.; Taher, I.; Eladl, A.S.R.; Shabaan, D.A.; Soliman, M.F.M.; Taha, A.E. Detection and Quantification of Some Ethanol-Producing Bacterial Strains in the Gut of Mouse Model of Non-Alcoholic Fatty Liver Disease: Role of Metformin. Pharmaceuticals 2023, 16, 658. https://doi.org/10.3390/ph16050658
Abouelkheir M, Taher I, Eladl ASR, Shabaan DA, Soliman MFM, Taha AE. Detection and Quantification of Some Ethanol-Producing Bacterial Strains in the Gut of Mouse Model of Non-Alcoholic Fatty Liver Disease: Role of Metformin. Pharmaceuticals. 2023; 16(5):658. https://doi.org/10.3390/ph16050658
Chicago/Turabian StyleAbouelkheir, Mohamed, Ibrahim Taher, Amira S. R. Eladl, Dalia A. Shabaan, Mona F. M. Soliman, and Ahmed E. Taha. 2023. "Detection and Quantification of Some Ethanol-Producing Bacterial Strains in the Gut of Mouse Model of Non-Alcoholic Fatty Liver Disease: Role of Metformin" Pharmaceuticals 16, no. 5: 658. https://doi.org/10.3390/ph16050658
APA StyleAbouelkheir, M., Taher, I., Eladl, A. S. R., Shabaan, D. A., Soliman, M. F. M., & Taha, A. E. (2023). Detection and Quantification of Some Ethanol-Producing Bacterial Strains in the Gut of Mouse Model of Non-Alcoholic Fatty Liver Disease: Role of Metformin. Pharmaceuticals, 16(5), 658. https://doi.org/10.3390/ph16050658