Article

Mucosal Genes Expression in Inflammatory Bowel Disease Patients: New Insights

by
Sumaiah J. Alarfaj
1,†,
Sally Abdallah Mostafa
2,†,
Walaa A. Negm
3,*,
Thanaa A. El-Masry
4,
Marwa Kamal
5,
Mohamed Elsaeed
6,† and
Ahmed Mohamed El Nakib
7,†
1
Department of Pharmacy Practice, College of Pharmacy, Princess Nourah Bint Abdulrahman University, P.O. Box 84428, Riyadh 11671, Saudi Arabia
2
Department of Medical Biochemistry and Molecular Biology, Faculty of Medicine, Mansoura University, Mansoura 35511, Egypt
3
Department of Pharmacognosy, Faculty of Pharmacy, Tanta University, Tanta 31527, Egypt
4
Department of Pharmacology and Toxicology, Faculty of Pharmacy, Tanta University, Tanta 31527, Egypt
5
Department of Clinical Pharmacy, Faculty of Pharmacy, Fayoum University, Fayoum 63514, Egypt
6
Department of General Surgery, Faculty of Medicine, Mansoura University, Mansoura 35511, Egypt
7
Department of Tropical Medicine, Faculty of Medicine, Mansoura University, Mansoura 35511, Egypt
*
Author to whom correspondence should be addressed.
These authors contributed equally to this work.
Pharmaceuticals 2023, 16(2), 324; https://doi.org/10.3390/ph16020324
Submission received: 12 January 2023 / Revised: 3 February 2023 / Accepted: 16 February 2023 / Published: 20 February 2023
(This article belongs to the Special Issue Drug Treatments for Inflammatory Bowel Diseases)

Abstract

:
Individual differences in IBD illness severity, behavior, progression, and therapy response are evident. Since a break in the intestinal epithelial barrier causes IBD to begin, mucosal gene expression in IBD is crucial. Due to its high sensitivity and dynamic nature, molecular analysis of biomarkers in intestinal biopsies is feasible and provides a reliable means of evaluating localized inflammation. The goal of this investigation was to discover alterations in gene expression in the inflamed mucosa of IBD patients undergoing treatment with 5-amino salicylic acid (5ASA) (N = 39) or anti-TNF drugs (N = 22). The mucosal expression of numerous IBD-related genes was evaluated using qPCR. We discovered that the levels of the proteins Lipocalin-2 (LCN2), Nitric Oxide Synthase 2 (NOS2), Mucin 2 (MUC2), Mucin 5AC (MUC5AC), and Trefoil factor 1 (TFF1), which are overexpressed in untreated IBD patients compared to non-IBD subjects, are decreased by both therapy regimens. On the other hand, anti-TNF medicine helped the levels of ABCB1 and E-cadherin return to normal in IBD patients who were not receiving treatment.

1. Introduction

Inflammatory bowel disease is a long-term inflammatory condition of the gut that can present clinically as Crohn’s disease (CD), ulcerative colitis (UC), or IBD undefined (IBD-U) [1,2,3].
The intensity, behavior, progression, and response to therapy for IBD disease show significant individual diversity [2,4,5,6]. Both clinical factors and molecular signatures have been linked to many elements of disease progression. Previous studies dealing with molecular investigations have been demonstrated and are used for clinical practice and therapeutic decision-making in IBD patients [7,8,9].
In the past 20 years, numerous innovative therapeutic agents targeting different immune pathways have also been developed, in addition to tumor necrosis factor (anti-TNF) inhibitors [10]. Taking these medications has improved the long-term results for both CD and UC, despite a significant increase in the expense burden on many health care systems [11].
The current therapy goals for IBD now include steroid-free remission, endoscopic remission, and lowering surgery rates [12]. Although the primary therapeutic purpose was to alleviate patient symptoms, in addition to the fact that over 30% of IBD patients do not respond to treatment, among those who do, the response vanishes in 23–46% of instances after a year of medication use [13]. In order to improve the overall IBD disease management, a treatment plan based on molecular perturbations and the detection of predictors of nonresponse can be chosen [14].
In IBD patients, mucosal gene expression is particularly significant because a breach in the intestinal epithelium barrier is thought to be the source of the disease’s development. Due to their high sensitivity and dynamic nature, various molecular biomarkers in intestinal biopsies are feasible and offer a reliable approach to evaluating localized inflammation.
Mucosal genes play an essential role in mucosal integrity and play an important role in the pathogenesis of IBD. Genes within several IBD-associated loci indicate a position for barrier integrity in disease predisposition [15].
Another difficulty in controlling IBD disease is monitoring the pathophysiological mechanisms behind the chronic inflammatory process and the effects of treatment. Studies on molecular mucosal profiling are scarce in this area [15].
This study aimed to find differences in the gene expression between the mucosa of IBD patients receiving 5-aminosalicylic acid (5ASA) or biological therapies in the form of anti-TNF treatment and IBD patients receiving no medication or control subjects without IBD.

2. Results

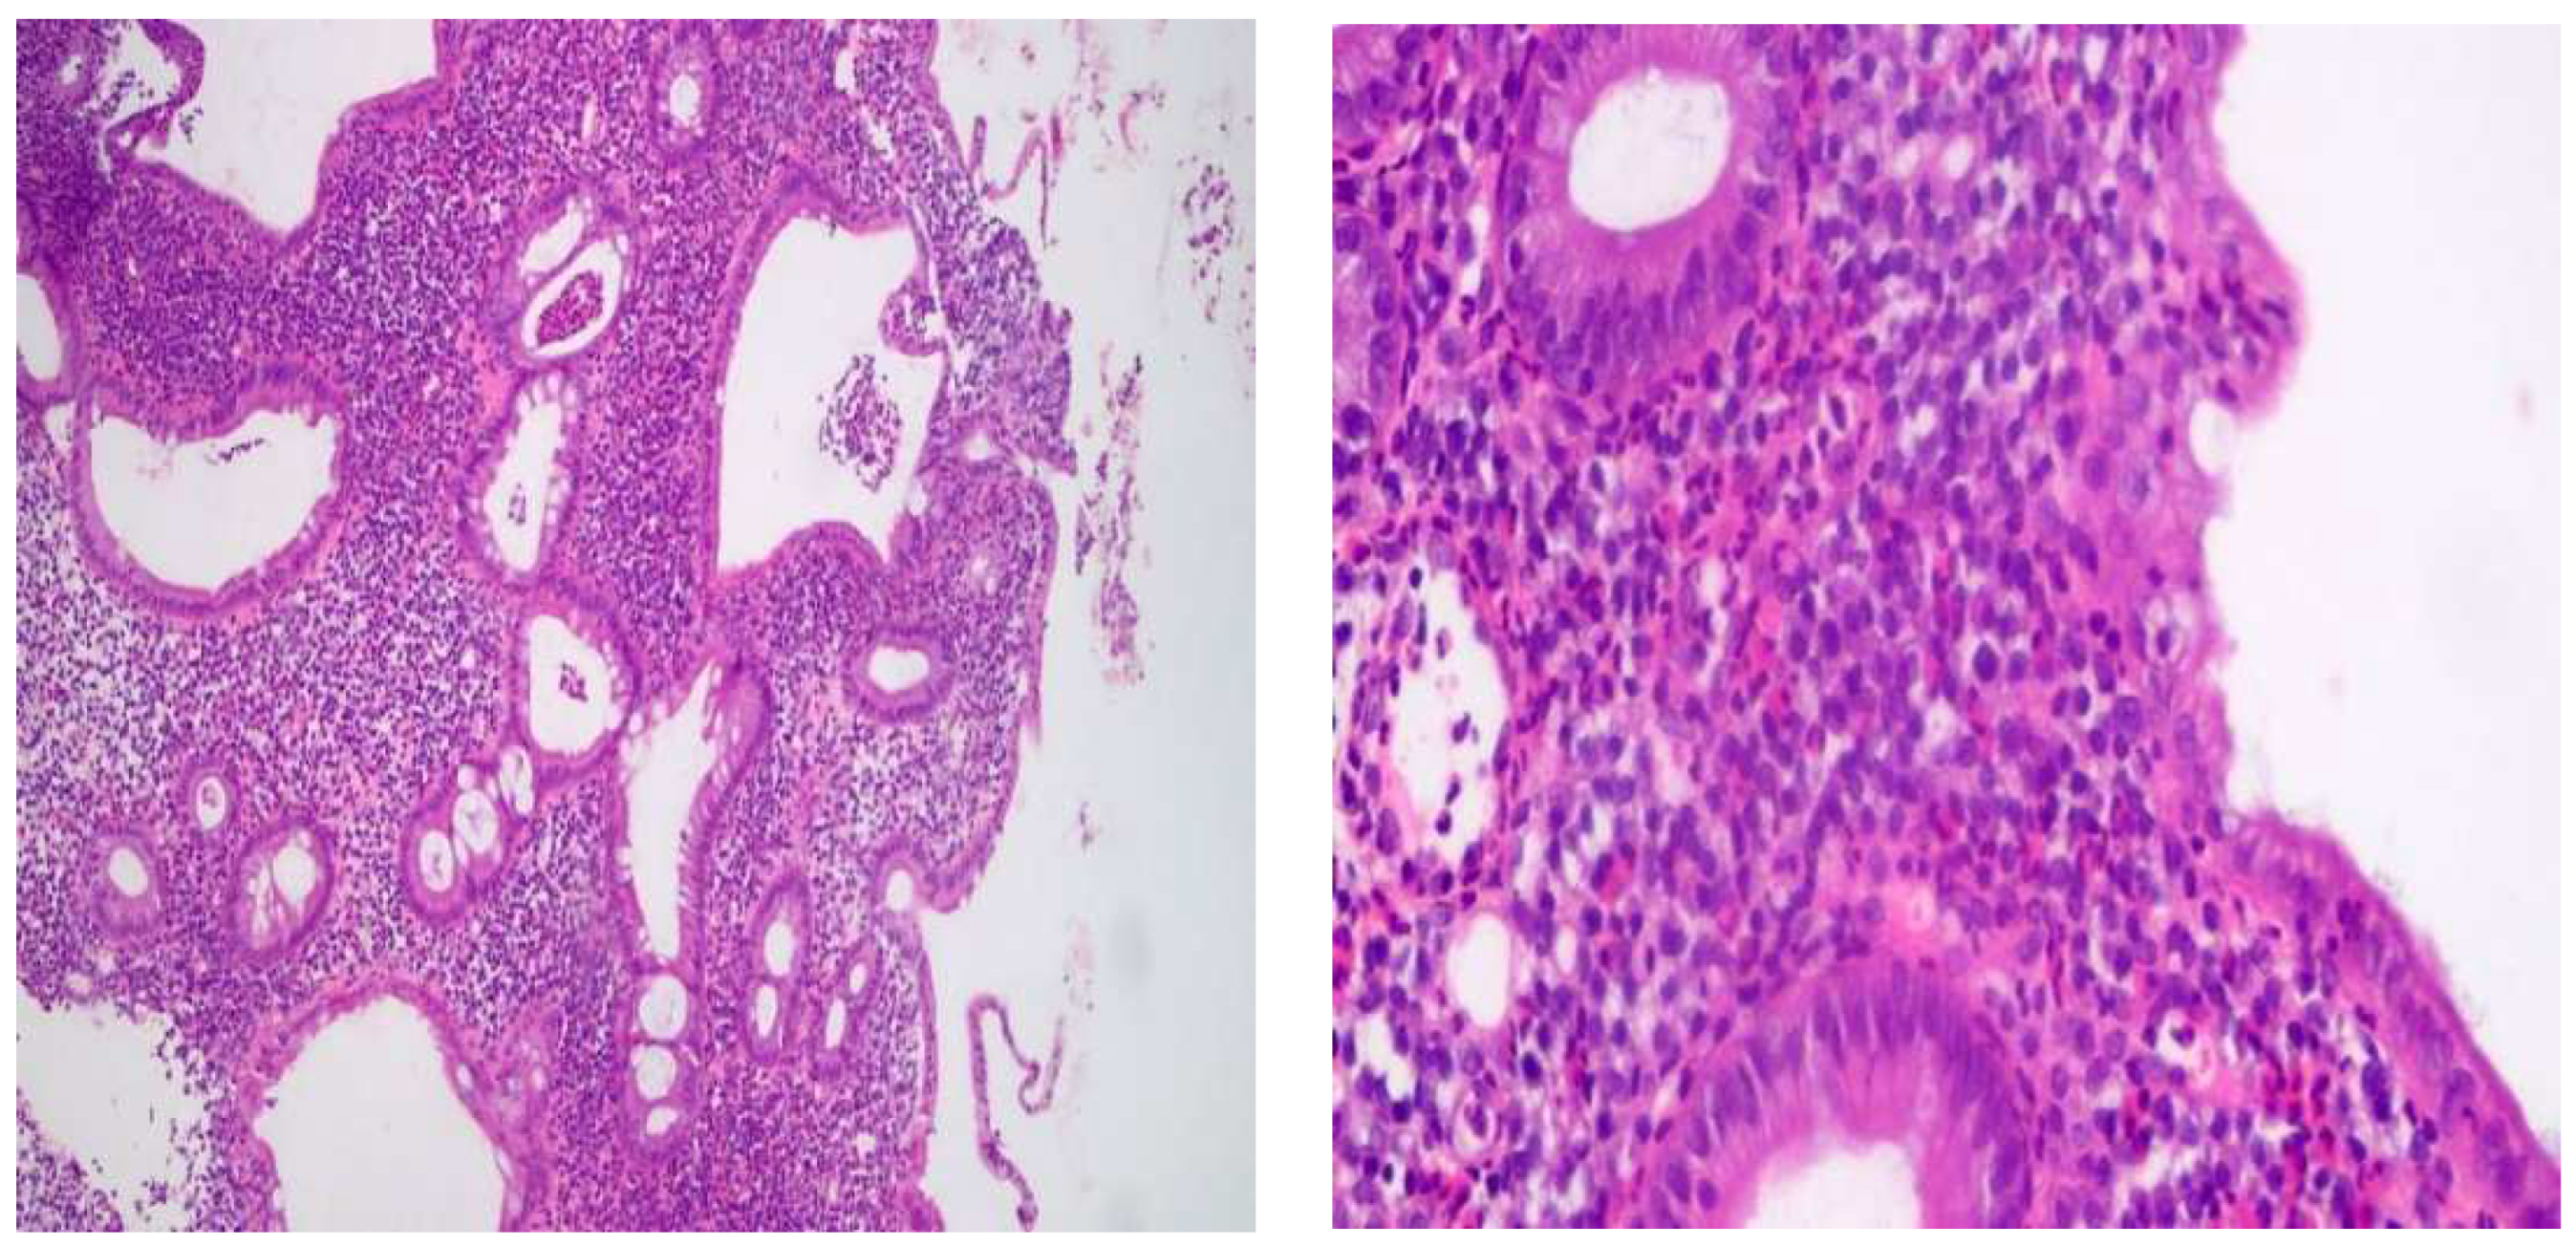
2.1. Histological Changes

At the time of enrolment, 22 patients (27.5%) were receiving anti-TNF (anti-TNF) therapy, 39 patients (48.75%) were receiving (5-ASA), and 19 patients (23.75%) were drug-free. Among the treated patients, 59 were still in the active phase, and 21 showed endoscopically as being in remission. Clinical response for all patients was performed using the A MAYO partial score and Crohn’s Disease Activity Index (CDAI) score (Figure 1, Figure 2, Figure 3 and Figure 4).
Multiple snips of colonic mucosa. Lamina was widened by dense mixed inflammatory cellular infiltrate involving muscularis mucosa. The infiltrate was mainly lymphoplasmacytic with mixed neutrophils and eosinophils. There was crypt irregularity with branching and a reduction in mucin production. There was detected cryptitis and crypt abscesses (Left: 200×/Right: 400×, H&E staining).
Figure 2. Severe diffuse active colitis consistent with IBD (ulcerative colitis).
Pharmaceuticals 16 00324 g002
Multiple snips of colonic mucosa with focal ulceration. Lamina was widened by dense mixed inflammatory cellular infiltrate involving muscularis mucosa. The infiltrate was mainly lymphoplasmacytic with mixed neutrophils and eosinophils. There was crypt irregularity with branching and a reduction in mucin production. Cryptitis and crypt abscesses were detected (Left: 200×/Right: 400×, H&E staining).
Figure 3. Mild focal colitis (quiescent stage of IBD)/(known case of ulcerative colitis).
Pharmaceuticals 16 00324 g003
Multiple snips of colonic mucosa with preserved mucin production and no significant crypt irregularity. Lamina propria was the seat of chronic inflammatory cellular infiltrate with some eosinophils about 15/HPF. No detected cryptitis or crypt abscesses (Left: 200×/Right: 400×).
Figure 4. Moderate diffuse colitis with non-caseating epithelioid granulomatous inflammatory lesion highly suggestive of Crohn’s disease.
Pharmaceuticals 16 00324 g004
Snips of colonic mucosa. Crypts were regular. The lamina propria was the seat of moderate inflammatory cellular infiltrate. The infiltrate was formed of lymphocytes and neutrophils with focal cryptitis. Multiple epithelioid granulomas were detected, which were non-caseating (Left: 200×/Right: 400×, H&E staining).

2.2. Patients’ and Non-IBD Control Participants’ Characteristics

The IBD patients’ age, gender distribution, and smoking habits did not differ from those of the non-IBD control subjects. When patients were taken into account, there was no discernible difference in the length of the treatments for the 5-ASA and anti-TNF groups (Table 1).

2.3. Gene Expression among Studied Groups

The results are displayed in Table S1 and Figure 5.

2.3.1. ABCB1 Gene Expression

Regarding ABCB1 gene expression, there was a statistically substantial difference between patients receiving anti-TNF-α and those receiving 5-ASA (p < 0.0001). There was also a significant difference between participants receiving anti-TNF-α and those who received no treatment (p < 0.0001). There was no statistical difference between patients obtaining anti-TNF-α and the control group (p = 0.4361).

2.3.2. LCN2 Gene Expression

Regarding LCN2 gene expression, there was a statistically marked difference between participants receiving anti-TNF-α and those receiving 5-ASA (p = 0.0012). There was a statistically substantial difference between patients receiving anti-TNF-α and those who received no treatment (p < 0.0001). There was a statistically marked difference between patients obtaining anti-TNF-α and the control group (p = 0.0139).

2.3.3. NOS2 Gene Expression

There was a statistically significant difference between participants receiving anti-TNF-α and those receiving 5-ASA in NOS2 gene expression (p = 0.0095). There was no statistically significant difference between patients receiving anti-TNF-α and those receiving no treatment (p > 0.9999). There was a statistically significant difference between the anti-TNF-α treated patients and the control group (p < 0.0001).

2.3.4. TFF1 Gene Expression

Regarding TFF1 gene expression, patients receiving anti-TNF-α and those receiving 5-ASA differed statistically significantly (p = 0.0016). There was a statistically significant difference between the patients taking anti-TNF-α and those who received no treatment (p < 0.0001). There was a statistically marked difference between patients taking anti-TNF-α and the control group (p = 0.0188) [16].

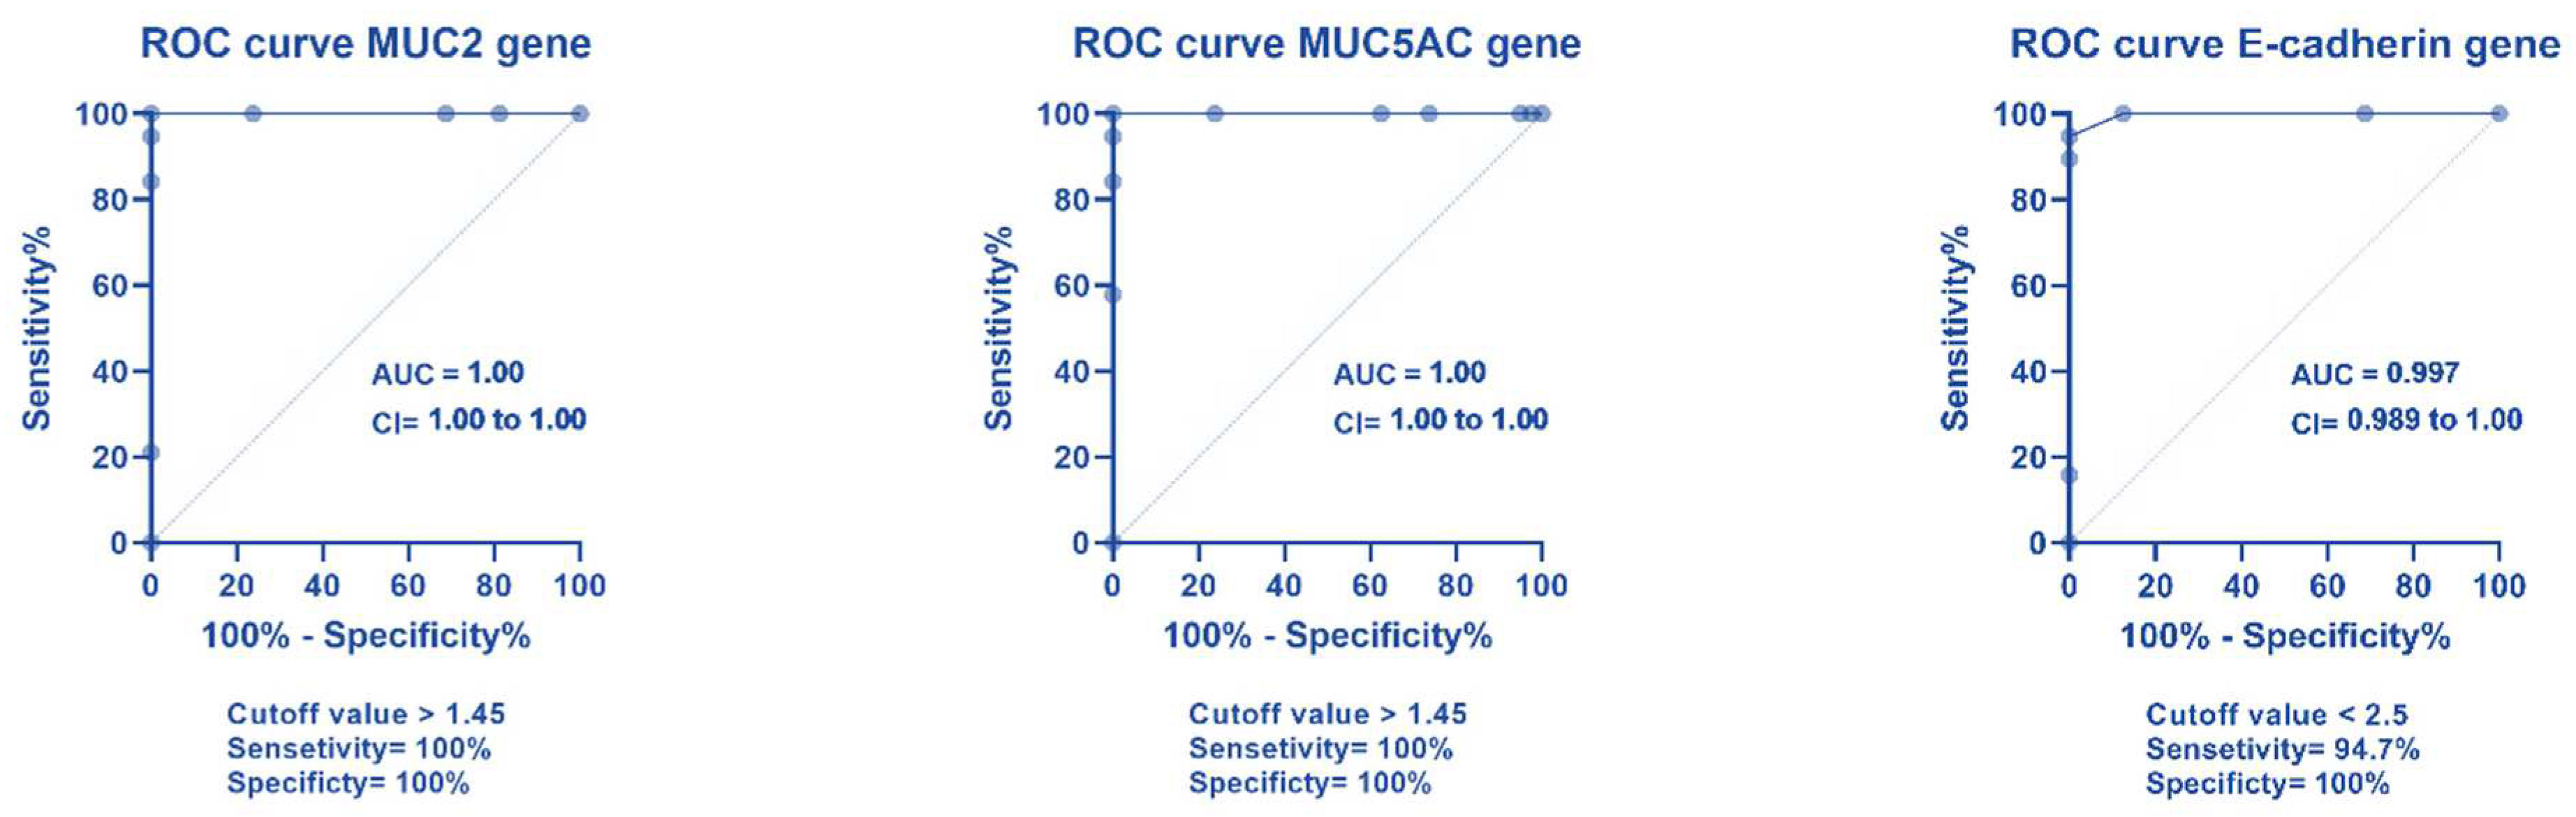
2.3.5. MUC2 Gene Expression

Regarding MUC2 gene expression, there was a statistically substantial difference between patients receiving anti-TNF-α and those receiving 5-ASA (p = 0.0003). There was a statistically significant difference between patients receiving anti-TNF-α and those who received no treatment (p < 0.0001). There was no statistically significant difference between patients receiving anti-TNF-α and the control group (p = 0.2564).

2.3.6. MUC5AC Gene Expression

There was a statistically marked variation in MUC5AC gene expression between patients receiving anti-TNF-α and those receiving 5-ASA (p < 0.0001). There was a statistically marked difference between the patients receiving anti-TNF-α and those who received no treatment (p < 0.0001). There was no statistically significant difference between patients receiving anti-TNF-α and the control group (p > 0.9999).

2.3.7. E-Cadherin Gene Expression

Regarding E-cadherin gene expression, there was a statistically substantial variation between those receiving anti-TNF-α and 5-ASA (p < 0.0001). There was a statistically marked difference between patients obtaining anti-TNF-α and those who received no treatment (p < 0.0001). There was no statistically substantial difference between patients taking anti-TNF-α and the control group (p > 0.9999) [17].

2.4. ROC Curve Analysis for Different Gene Expression

The results are displayed in Figure 6.
For discrimination between the IBD patients and controls, ROC curve analysis was performed for different genes. The ABCB1 gene’s cutoff value was <1.45, with a sensitivity of 100%, a specificity of 100%, and an AUC of 1. The AUC was 1, a sensitivity oof 100%, specificity was 100%, and >0.95 was the cutoff value for the LCN2 gene. The NOS2 gene’s cutoff value was >0.85, with a sensitivity of 100%, a specificity of 76.3%, and an AUC of 0.981. The TFF1 gene’s cutoff value was >1.45, with a sensitivity of 100%, a specificity of 100%, and an AUC of 1. The MUC2 gene’s cutoff value was >1.45, with a sensitivity of 100%, a specificity of 100%, and an AUC of 1. The MUC5AC gene’s cutoff value was >1.45, with a sensitivity of 100%, a specificity of 100%, and an AUC of 1. The E-cadherin gene’s cutoff value was <2.5, with a sensitivity of 94.7%, a specificity of 100%, and an AUC of 0.0997.

2.5. Correlation between Different Genes

The correlation between different genes is explained in Figure 7 and Table S2. There was a strong negative relationship between the ABCB1 gene and E-cadherin gene, LCN2 gene, MUC2 gene, MUC5AC gene, and TFF1 gene (r = −0.73, −0.77, −0.76, −0.77, and −078 respectively). There was a negligible relationship between the ABCB1 gene and the NOS2 gene (r = −0.14).
There was a strong positive relationship between the LCN2 gene and E-cadherin gene, MUC2 gene, MUC5AC, and TFF1 gene (r = 0.88, 0.88, 0.87, 0.91, respectively). On the other hand, there was a moderate positive relationship between the LCN2 gene and the NOS2 gene (r = 0.31). There was a strong positive relationship between the MUC2 gene and both the E-cadherin gene and the MUC5AC gene (r = 0.9 and 0.88, respectively).
There was a strong relationship between the MU5AC gene and E-cadherin (r = 0.88).
There was a weak positive relationship between the NOS2 gene, MUC2 gene, MUC5AC gene, and TFF1 gene (r = 0.28, 0.26, and 0.23, respectively). On the other hand, there was a moderate positive relationship between the NOS2 gene and E-cadherin (r = 0.3).
There was a strong positive relationship between the TFF1 gene and the E-cadherin gene, MUC2 gene, and MUC5AC gene (r = 0.88, 0.83 and 0.91, respectively).

3. Discussion

In order to assess changes in the colonic mucosa of IBD patients under various therapy modalities, we used a bull’s eye gene expression approach to look at genes implicated in inflammation, apoptosis, immunological response, cellular adhesion, and tissue remodeling. Previous studies comparing the molecular signature of patients undergoing various medications remain underrepresented, despite the extensive use of the transcriptional analysis of intestinal tissues comparing IBD patients and non-IBD controls to uncover new biomarkers.
Following anti-TNF medication, ABCB1 was increased after being downregulated in drug-free patients. P-Glycoprotein 1, an ATP-dependent transmembrane pump that transfers drugs from the intracellular to the extracellular area, is encoded by the ABCB1 gene, commonly known as the MDR1 gene. It has been proposed that reduced gut expression levels and ABCB1′s lack of function are factors in the genesis of IBD. The typical gastrointestinal system expresses ABCB1 extensively [18].
Additionally, inconsistent results have been found in several genetic studies examining the connection between IBD susceptibility and the three SNPs (G2677T/A, C3435T, and C1236T) regarded to be the most clinically significant [19]. Numerous research has evaluated ABCB1′s role in the responsiveness to anti-TNF medications. There was no significant correlation between the ABCB1 gene alternates and infliximab response in Italian and Hungarian patients with IBD [11,20,21]. In this study, we found that the low levels of ABCB1 in patients were markedly increased by anti-TNF medication, bringing them to levels that were equivalent to the non-IBD controls. One in vitro study using Caco-2 cell lines displayed that in vitro TNF reduced the MDR1 mRNA levels. However, the possible alteration of ABCB1 in the mucosa of IBD patients by anti-TNF therapy has not been studied [22].
Additionally, we found that ABCB1 expression was significantly increased by anti-TNF medication, reaching levels comparable to those seen in the control subjects free of IBD. These results were consistent with the earlier research by Milanesi et al. (2019) [14].
Our findings demonstrate that 5-ASA and anti-TNF medications can lower the mucosal expression levels of NOS2, TFF1, and LCN2, which were excessive in untreated cases relative to the controls. Interestingly, anti-TNF medicine had a more significant effect on TFF1 and LCN2; nonetheless, treatment returned their levels to normal for individuals who were not affected. The impacts of 5-ASA on NOS2 expression also seem more favorable, despite the differences from the non-IBD controls being noticeably different. These results were in line with those of an earlier investigation by Milanesi et al. (2019) [14]. The NOS2 and LCN2 genes encode two antimicrobial peptides (AMPs): nitric oxide synthase 2 and the neutrophil gelatinase-associated lipocalin (NGAL) system.
LCN2/NGAL prevents bacterial development by securing iron-containing siderophores, while NOS2 produces nitric oxide, a reactive free radical that is a biological moderator in antibacterial, neurotransmission, and anti-tumor effects.
Numerous studies have demonstrated that the mucosa of IBD patients has both highly elevated LCN2/NGAL and NOS2 levels [23,24]. Notably, the NGAL protein has been proposed as a potential biomarker in IBD patients since, if present in high concentrations, it is positively connected with the severity and activity of the disease. The LCN2/NGAL levels were shown to be higher in patients with active UC, and infliximab treatment resulted in a decrease in these levels [24].
A single high infliximab dosage effectively lowered the elevated LCN protein concentration in the urine of CD patients. This intriguing result was also shown in our research, where the treated group’s LCN2 expression was lower [25].
Nitric oxide (NO) is produced by the enzyme NOS2, activated through a concoction of lipopolysaccharide and specific inflammatory mediators. Nitric oxide controls bowel epithelial cells, preserves the barrier’s integrity, and supports tight junctions. Additionally, it starts the oxidation of proteins and lipids through a free radical process that causes a redox imbalance. It has been demonstrated that the colon mucosa of both UC and CD patients exhibit enhanced nitric oxide synthase activity [26,27].
Higher gene expression levels were found by Senhaji et al. in 2017 in the colonic mucosa of CD patients compared to the controls and in patients with active UC compared to patients with passive UC [28]. Numerous populations have demonstrated a relationship between NOS2 gene variations and IBD risk [28,29]. Luther and colleagues discovered that the colonic expression of NOS2 was higher in non-responders than responders in individuals who lost response to the TNF-antagonist [30].
TFF1 is another increased gene in untreated individuals, and 5-ASA and anti-TNF treatments impact it. It is related to the same family as the trefoils TFF1, TFF2, and TFF3 [31]. It has been demonstrated that these persistent secretory proteins contribute to the upkeep and restoration of epithelial surfaces because they are highly expressed in the gastrointestinal mucosa [32].
While chronic inflammation encourages TFF expression to limit the course of the disease, acute mucosal damage stimulates TFFs to expedite cell migration to seal the wounded zone from luminal contents. TFF1 was expressed in individuals with severe UC in immunohistochemical studies on colon biopsy specimens but not in normal tissue [33].
Shaoul et al. (2004) found that this trefoil protein was also expressed in the colons of patients with IBD [34]. The serum levels of the trefoil factors have also been investigated, and those with IBD had higher concentrations of TFF1 and TFF3 [35].
Additionally, in UC patients, the serum TFF3 concentration was associated with the clinical and biochemical indicators of disease activity [36].
In the inflamed IBD colon, E-cadherin gene expression was dramatically reduced. The loss and destruction of epithelial cells in the colon affected by IBD are likely to blame for the reduced expression.
Additionally, IBD responders to anti-TNF medication showed normalized expression of this gene, and these results were consistent with those of an earlier study conducted by Arijs et al. in 2011 [37].
Both the MUC2 and MUC5AC genes were found to be significantly expressed in the current study’s untreated IBD patients, and their expression returned to normal after receiving anti-TNF medication.
MUC2 is the prominent colonic mucin in IBD, although it is not just found in healthy goblet cells. Clamp et al. [38] discovered that granular MUC2 is expressed by not phenotypical goblet cells in IBD and other inflammatory conditions of the colon. Contrary to the goblet cells of healthy people and IBD patients, who keep mature granular mucin and do not express immature mucin outside the Golgi, these cells express weakly glycosylated mucin present in secretory granules. This mucin is likely secreted as a juvenile, sparsely glycosylated product. This abnormal pattern of mucin glycosylation in IBD patients has also been proposed by others [38,39].
To make up for the loss of barrier and repair function caused by MUC2 and perhaps ITF expression alterations during inflammation, MUC5AC and TFF1 expression may be upregulated. It has been hypothesized that TFF1 aids in healing and regeneration [40].
Goblet cells that express MUC5ACTFF1 are frequently found in inflammatory conditions, indicating that this is a generic response to inflammation and may not always signify dysplastic alterations [34]. The cross-sectional nature of this study could be a possible drawback. Furthermore, the small size of our study prevented us from conducting additional subgroup analysis (UC and CD separately).

4. Materials and Methods

4.1. Patients

Eighty IBD patients and 80 healthy control participants from the Tropical Medicine Department at the Mansoura Faculty of Medicine were recruited for this study out of 1974 patients who underwent colonoscopy over three years (Figure 8).
Multiple colonoscopic biopsies were taken from the inflamed mucosa in patients with active IBD, those IBD patients who were in remission, and from the healthy colonic mucosa from healthy control individuals. Before biopsy sampling, all individuals provided written informed consent. The Mansoura Faculty of Medicine’s Institutional Review Board (MFM-IRB) authorized the study (Code number R.22.08.1786).
Crohn’s disease (CD) and ulcerative colitis (UC) were identified in accordance with suggestions made by the European Crohn’s and Colitis Organization (ECCO), which preclude that the diagnosis of CD or UC is based on a combination of clinical, biochemical, stool, endoscopic, cross-sectional imaging, and histological investigations [3]. According to Dobre et al. (2018) [14], the following exclusion criteria were applied to the non-IBD control subjects: the presence of gastrointestinal symptoms, current or previous use of non-steroidal anti-inflammatory drugs (within the last three months), and current or prior use of anticoagulants/antiplatelet drugs (within the last three months).
Monoclonal antibodies directed against TNF-α are fast-acting and potent anti-inflammatory agents. Anti-TNF therapies approved for treating IBD include infliximab, adalimumab, and certolizumab [3].

4.2. Total RNA Isolation and qPCR

For qPCR, a 7500 Fast Real-Time PCR system was used. The total RNA was extracted from fresh-frozen tissues using the RNeasy Mini Kit (Qiagen, Venlo, Germany), and the RNA quantity and quality were assessed using a spectrophotometric approach (NanoDrop 2000, Thermo Scientific™ ND2000USCAN, Waltham, MA, USA). The total RNA was then converted to complementary DNA (cDNA) using the SensiFASTTM cDNA Kit (Bioline, London, UK). As an internal control gene, glyceraldehyde 3-phosphate dehydrogenase (GAPDH) was employed along with the SensiFASTTM SYBR Green PCR Master Mix from Bioline. We applied the 2CT approach to determine the fold change in gene expression. Table S3 shows the primer sequences of different genes, and the GAPDH gene was used as the control gene.

4.3. Statistical Analysis

Continuous variables were tested using the t-test, while categorical variables were tested using the Chi-square test. The gene expression data are displayed as the mean ± standard deviation (SD). To ascertain each gene’s appropriate cutoff value and diagnostic accuracy, receiver operating characteristic (ROC) curves were built.
The differences in gene expression were estimated using Kruskal–Wallis and Dunn’s multiple comparisons tests. The statistical analysis of each gene’s expression was verified for normality using the Shapiro–Wilk normality test. The Spearman correlation test was used to examine the relationship among genes. GraphPad Prism was used for statistical analysis (version 9.3.1). At p < 0.05, significance was accepted.

5. Conclusions

Considering the potential drawbacks of our investigation, we identified a configuration of genes whose ectopic expression in IBD mucosa appears to be better controlled by biological therapy (anti-TNF therapy) than by 5-ASA medications. Lipocalin-2 (LCN2), Nitric Oxide Synthase 2 (NOS2), Mucin 2 (MUC2), Mucin 5AC (MUC5AC), and Trefoil factor 1 (TFF1) were overexpressed in the untreated IBD patients compared to the non-IBD patients and that 5ASA and anti-TNF-a treatment reduced these expressions. Anti-TNF therapy helped the levels of ABCB1 and E-cadherin in the untreated IBD patients return to normal. To find the gene expression profiles useful for assisting therapeutic decision-making, more extensive studies of treatment naive IBD with standardized sampling and the prospective follow-up of clinical outcomes are pertinent.

Supplementary Materials

The following supporting information can be downloaded at: https://www.mdpi.com/article/10.3390/ph16020324/s1, Table S1. Gene expression analysis among different groups, Table S2. Explanation of correlation between different genes, Table S3. Primer sequences of different genes.

Author Contributions

Conceptualization, A.M.E.N. and W.A.N.; Data curation, M.E.; Formal analysis, S.J.A.; Funding acquisition, T.A.E.-M.; Investigation, S.A.M., M.E., and A.M.E.N.; Methodology, S.A.M., M.K., and A.M.E.N.; Project administration, S.J.A.; Resources, S.J.A., and M.K.; Software, W.A.N., and M.K.; Supervision, T.A.E.-M. and W.A.N.; Writing—original draft, S.A.M., M.E., and A.M.E.N.; Writing—review & editing, W.A.N., M.K., S.J.A., and A.M.E.N. All authors have read and agreed to the published version of the manuscript.

Funding

This project was funded by Princess Nourah bint Abdulrahman University Researchers Supporting Project Number (PNURSP2023R167), Princess Nourah bint Abdulrahman University, Riyadh, Saudi Arabia.

Institutional Review Board Statement

The present study was permitted and approved by Mansoura Faculty of Medicine’s Institutional Review Board (MFM-IRB) (Code number R.22.08.1786).

Informed Consent Statement

Written informed consent was obtained from all 160 participants in this study, and the study was approved by the ethical committee of the Mansoura Faculty of Medicine (Code number R.22.08.1786).

Data Availability Statement

The data presented in this study are available on request.

Acknowledgments

We greatly appreciate the support of Princess Nourah bint Abdulrahman University in funding this research through Princess Nourah bint Abdulrahman University Researchers Supporting Project Number (PNURSP2023R167), Princess Nourah bint Abdulrahman University, Riyadh, Saudi Arabia.

Conflicts of Interest

The authors declare no conflict of interest.

References

  1. Gomollón, F.; Dignass, A.; Annese, V.; Tilg, H.; Van Assche, G.; Lindsay, J.O.; Peyrin-Biroulet, L.; Cullen, G.J.; Daperno, M.; Kucharzik, T., 3rd. European evidence-based consensus on the diagnosis and management of Crohn’s disease 2016: Part 1: Diagnosis and medical management. J. Crohns Colitis 2017, 11, 3–25. [Google Scholar] [CrossRef] [PubMed] [Green Version]
  2. Thia, K.T.; Sandborn, W.J.; Harmsen, W.S.; Zinsmeister, A.R.; Loftus Jr, E.V. Risk factors associated with progression to intestinal complications of Crohn’s disease in a population-based cohort. Gastroenterology 2010, 139, 1147–1155. [Google Scholar] [CrossRef] [PubMed] [Green Version]
  3. Magro, F.; Gionchetti, P.; Eliakim, R.; Ardizzone, S.; Armuzzi, A.; Barreiro-de Acosta, M.; Burisch, J.; Gecse, K.B.; Hart, A.L.; Hindryckx, P. Third European evidence-based consensus on diagnosis and management of ulcerative colitis. Part 1: Definitions, diagnosis, extra-intestinal manifestations, pregnancy, cancer surveillance, surgery, and ileo-anal pouch disorders. J. Crohns Colitis 2017, 11, 649–670. [Google Scholar] [CrossRef] [PubMed] [Green Version]
  4. Beaugerie, L.; Seksik, P.; Nion–Larmurier, I.; Gendre, J.P.; Cosnes, J. Predictors of Crohn’s disease. Gastroenterology 2006, 130, 650–656. [Google Scholar] [CrossRef]
  5. Monstad, I.; Hovde, Ø.; Solberg, I.C.; Moum, B.A. Clinical course and prognosis in ulcerative colitis: Results from population-based and observational studies. Ann. Gastroenterol. Q. Publ. Hell. Soc. Gastroenterol. 2014, 27, 95. [Google Scholar]
  6. Alarfaj, S.J.; Mostafa, S.A.; Abdelsalam, R.A.; Negm, W.A.; El-Masry, T.A.; Hussein, I.A.; El Nakib, A.M. Helicobacter pylori Infection in Cirrhotic Patients with Portal Hypertensive Gastropathy: A New Enigma? Front. Med. 2022, 9, 902255. [Google Scholar] [CrossRef]
  7. Martin, J.C.; Chang, C.; Boschetti, G.; Ungaro, R.; Giri, M.; Grout, J.A.; Gettler, K.; Chuang, L.-s.; Nayar, S.; Greenstein, A.J. Single-cell analysis of Crohn’s disease lesions identifies a pathogenic cellular module associated with resistance to anti-TNF therapy. Cell 2019, 178, 1493–1508.e1420. [Google Scholar] [CrossRef]
  8. Marigorta, U.M.; Denson, L.A.; Hyams, J.S.; Mondal, K.; Prince, J.; Walters, T.D.; Griffiths, A.; Noe, J.D.; Crandall, W.V.; Rosh, J.R. Transcriptional risk scores link GWAS to eQTLs and predict complications in Crohn’s disease. Nat. Genet. 2017, 49, 1517–1521. [Google Scholar] [CrossRef]
  9. Lee, J.C.; Lyons, P.A.; McKinney, E.F.; Sowerby, J.M.; Carr, E.J.; Bredin, F.; Rickman, H.M.; Ratlamwala, H.; Hatton, A.; Rayner, T.F. Gene expression profiling of CD8+ T cells predicts prognosis in patients with Crohn disease and ulcerative colitis. J. Clin. Investig. 2011, 121, 4170–4179. [Google Scholar] [CrossRef] [Green Version]
  10. Reinisch, W.; Sandborn, W.J.; Rutgeerts, P.; Feagan, B.G.; Rachmilewitz, D.; Hanauer, S.B.; Lichtenstein, G.R.; De Villiers, W.J.; Blank, M.; Lang, Y. Long-term infliximab maintenance therapy for ulcerative colitis: The ACT-1 and-2 extension studies. Inflamm. Bowel Dis. 2012, 18, 201–211. [Google Scholar] [CrossRef]
  11. Reinglas, J.; Gonczi, L.; Kurt, Z.; Bessissow, T.; Lakatos, P.L. Positioning of old and new biologicals and small molecules in the treatment of inflammatory bowel diseases. World J. Gastroenterol. 2018, 24, 3567. [Google Scholar] [CrossRef]
  12. Atreya, R.; Neurath, M.F. Current and future targets for mucosal healing in inflammatory bowel disease. Visc. Med. 2017, 33, 82–88. [Google Scholar] [CrossRef]
  13. Ben-Horin, S.; Chowers, Y. loss of response to anti-TNF treatments in Crohn’s disease. Aliment. Pharmacol. Ther. 2011, 33, 987–995. [Google Scholar] [CrossRef]
  14. Milanesi, E.; Dobre, M.; Manuc, T.E.; Becheanu, G.; Tieranu, C.G.; Ionescu, E.M.; Manuc, M. Mucosal gene expression changes induced by anti-TNF treatment in inflammatory bowel disease patients. Drug Dev. Res. 2019, 80, 831–836. [Google Scholar] [CrossRef] [Green Version]
  15. D’Amico, F.; Netter, P.; Baumann, C.; Veltin, M.; Zallot, C.; Aimone-Gastin, I.; Danese, S.; Peyrin-Biroulet, L. Setting up a virtual calprotectin clinic in inflammatory bowel diseases: Literature review and nancy experience. J. Clin. Med. 2020, 9, 2697. [Google Scholar] [CrossRef]
  16. Mostafa, S.A.; Mohammad, M.H.; Negm, W.A.; Batiha, G.E.S.; Alotaibi, S.S.; Albogami, S.M.; De Waard, M.; Tawfik, N.Z.; Abdallah, H.Y. Circulating microRNA203 and its target genes’ role in psoriasis pathogenesis. Front. Med. 2022, 9, 988962. [Google Scholar] [CrossRef]
  17. Muise, A.M.; Walters, T.D.; Glowacka, W.K.; Griffiths, A.M.; Ngan, B.; Lan, H.; Xu, W.; Silverberg, M.; Rotin, D. Polymorphisms in E-cadherin (CDH1) result in a mis-localised cytoplasmic protein that is associated with Crohn’s disease. Gut 2009, 58, 1121–1127. [Google Scholar] [CrossRef]
  18. Borg-Bartolo, S.P.; Boyapati, R.K.; Satsangi, J.; Kalla, R. Precision medicine in inflammatory bowel disease: Concept, progress and challenges. F1000Research 2020, 9, 54. [Google Scholar] [CrossRef] [Green Version]
  19. Petryszyn, P.W.; Wiela-Hojeńska, A. The importance of the polymorphisms of the ABCB1 gene in disease susceptibility, behavior and response to treatment in inflammatory bowel disease: A literature review. Adv. Clin. Exp. Med. 2018, 27, 1459–1463. [Google Scholar] [CrossRef]
  20. Palmieri, O.; Latiano, A.; Valvano, R.; D’inca, R.; Vecchi, M.; Sturniolo, G.; Saibeni, S.; Bossa, F.; Latiano, T.; Devoto, M. Multidrug resistance 1 gene polymorphisms are not associated with inflammatory bowel disease and response to therapy in Italian patients. Aliment. Pharmacol. Ther. 2005, 22, 1129–1138. [Google Scholar] [CrossRef]
  21. Zintzaras, E. Is there evidence to claim or deny association between variants of the multidrug resistance gene (MDR1 or ABCB1) and inflammatory bowel disease? Inflamm. Bowel Dis. 2012, 18, 562–572. [Google Scholar] [CrossRef]
  22. Belliard, A.M.; Lacour, B.; Farinotti, R.; Leroy, C. Effect of tumor necrosis factor-α and interferon-γ on intestinal P-glycoprotein expression, activity, and localization in Caco-2 cells. J. Pharm. Sci. 2004, 93, 1524–1536. [Google Scholar] [CrossRef] [PubMed]
  23. Dobre, M.; Mănuc, T.E.; Milanesi, E.; Pleşea, I.E.; Ţieranu, E.N.; Popa, C.; Mănuc, M.; Preda, C.M.; Ţieranu, I.; Diculescu, M.M. Mucosal CCR1 gene expression as a marker of molecular activity in Crohn’s disease: Preliminary data. Rom. J. Morphol. Embryol 2017, 58, 1263–1268. [Google Scholar] [PubMed]
  24. Thorsvik, S.; Bakke, I.; van Beelen Granlund, A.; Røyset, E.S.; Damås, J.K.; Østvik, A.E.; Sandvik, A.K. Expression of neutrophil gelatinase-associated lipocalin (NGAL) in the gut in Crohn’s disease. Cell Tissue Res. 2018, 374, 339–348. [Google Scholar] [CrossRef] [PubMed] [Green Version]
  25. Bolignano, D.; Della Torre, A.; Lacquaniti, A.; Costantino, G.; Fries, W.; Buemi, M. Neutrophil gelatinase-associated lipocalin levels in patients with Crohn disease undergoing treatment with infliximab. J. Investig. Med. 2010, 58, 569–571. [Google Scholar] [CrossRef]
  26. Guihot, G.; Guimbaud, R.; Bertrand, V.; Narcy-Lambare, B.; Couturier, D.; Duée, P.-H.; Chaussade, S.; Blachier, F. Inducible nitric oxide synthase activity in colon biopsies from inflammatory areas: Correlation with inflammation intensity in patients with ulcerative colitis but not with Crohn’s disease. Amino Acids 2000, 18, 229–237. [Google Scholar] [CrossRef]
  27. Alotaibi, B.; Mokhtar, F.A.; El-Masry, T.A.; Elekhnawy, E.; Mostafa, S.A.; Abdelkader, D.H.; Elharty, M.E.; Saleh, A.; Negm, W.A. Antimicrobial activity of brassica rapa L. Flowers extract on gastrointestinal tract infections and antiulcer potential against Indomethacin-Induced gastric ulcer in rats supported by metabolomics profiling. J. Inflamm. Res. 2021, 14, 7411. [Google Scholar] [CrossRef]
  28. Senhaji, N.; Nadifi, S.; Zaid, Y.; Serrano, A.; Rodriguez, D.A.L.; Serbati, N.; Karkouri, M.; Badre, W.; Martín, J. Polymorphisms in oxidative pathway related genes and susceptibility to inflammatory bowel disease. World J. Gastroenterol. 2017, 23, 8300. [Google Scholar] [CrossRef]
  29. Martín, M.C.; Martinez, A.; Mendoza, J.L.; Taxonera, C.; Díaz-Rubio, M.; Fernández-Arquero, M.; de la Concha, E.G.; Urcelay, E. Influence of the inducible nitric oxide synthase gene (NOS2A) on inflammatory bowel disease susceptibility. Immunogenetics 2007, 59, 833–837. [Google Scholar] [CrossRef]
  30. Luther, J.; Gala, M.; Patel, S.J.; Dave, M.; Borren, N.; Xavier, R.J.; Ananthakrishnan, A.N. Loss of response to anti-tumor necrosis factor alpha therapy in Crohn’s disease is not associated with emergence of novel inflammatory pathways. Dig. Dis. Sci. 2018, 63, 738–745. [Google Scholar] [CrossRef]
  31. Kjellev, S. The trefoil factor family–small peptides with multiple functionalities. Cell. Mol. Life Sci. 2009, 66, 1350–1369. [Google Scholar] [CrossRef]
  32. Aihara, E.; Engevik, K.A.; Montrose, M.H. Trefoil factor peptides and gastrointestinal function. Annu. Rev. Physiol. 2017, 79, 357. [Google Scholar] [CrossRef] [Green Version]
  33. Longman, R.J.; Poulsom, R.; Corfield, A.P.; Warren, B.F.; Wright, N.A.; Thomas, M.G. Alterations in the composition of the supramucosal defense barrier in relation to disease severity of ulcerative colitis. J. Histochem. Cytochem. 2006, 54, 1335–1348. [Google Scholar] [CrossRef] [Green Version]
  34. Shaoul, R.; Okada, Y.; Cutz, E.; Marcon, M.A. Colonic expression of MUC2, MUC5AC, and TFF1 in inflammatory bowel disease in children. J. Pediatr. Gastroenterol. Nutr. 2004, 38, 488–493. [Google Scholar] [CrossRef]
  35. Vestergaard, E.; Brynskov, J.; Ejskjaer, K.; Clausen, J.; Thim, L.; Nexø, E.; Poulsen, S. Immunoassays of human trefoil factors 1 and 2: Measured on serum from patients with inflammatory bowel disease. Scand. J. Clin. Lab. Investig. 2004, 64, 146–156. [Google Scholar] [CrossRef]
  36. Grønbæk, H.; Vestergaard, E.M.; Hey, H.; Nielsen, J.N.; Nexø, E. Serum trefoil factors in patients with inflammatory bowel disease. Digestion 2006, 74, 33–39. [Google Scholar] [CrossRef]
  37. Arijs, I.; De Hertogh, G.; Machiels, K.; Van Steen, K.; Lemaire, K.; Schraenen, A.; Van Lommel, L.; Quintens, R.; Van Assche, G.; Vermeire, S. Mucosal gene expression of cell adhesion molecules, chemokines, and chemokine receptors in patients with inflammatory bowel disease before and after infliximab treatment. Off. J. Am. Coll. Gastroenterol. ACG 2011, 106, 748–761. [Google Scholar] [CrossRef]
  38. Clamp, J.; Fraser, G.; Read, A. Study of the carbohydrate content of mucus glycoproteins from normal and diseased colons. Clin. Sci. 1981, 61, 229–234. [Google Scholar] [CrossRef] [Green Version]
  39. Cui, M.; Zhang, M.; Liu, K. Colon-targeted drug delivery of polysaccharide-based nanocarriers for synergistic treatment of inflammatory bowel disease: A review. Carbohydr. Polym. 2021, 272, 118530. [Google Scholar] [CrossRef]
  40. Khulusi, S.; Hanby, A.; Marrero, J.; Patel, P.; Mendall, M.; Badve, S.; Poulsom, R.; Elia, G.; Wright, N.; Northfield, T. Expression of trefoil peptides pS2 and human spasmolytic polypeptide in gastric metaplasia at the margin of duodenal ulcers. Gut 1995, 37, 205–209. [Google Scholar] [CrossRef] [Green Version]
Figure 1. Moderate diffuse active colitis consistent with IBD (ulcerative colitis).
Pharmaceuticals 16 00324 g001
Figure 5. Gene expression in different groups. This shows the gene expression of various genes among the other studied groups (* significant at p < 0.05, ** at p < 0.01, *** at p < 0.001, **** at p < 0.0001).
Pharmaceuticals 16 00324 g005
Figure 6. The ROC curve analysis of the different genes.
Pharmaceuticals 16 00324 g006aPharmaceuticals 16 00324 g006b
Figure 7. Correlation between different genes.
Pharmaceuticals 16 00324 g007
Figure 8. Flowchart of the study.
Pharmaceuticals 16 00324 g008
Table 1. Characteristics of the IBD and control participants.
IBD PatientsN = 80
Age (mean ± SD)46.75 ± 6.648
Sex (%M)(N = 56) 70%
Sex (%F)(N = 24) 30%
Smoking Behavior
Non-smokers(N = 62) 77.5%
Mild(N = 12) 15%
Moderate(N = 3) 3.75%
Severe(N = 3) 3.75%
Type of Disease
(%UC)(N = 62) 77.5%
(%CD)(N = 18) 22.5%
Disease Activity
% Active(N = 59) 73.75%
% Remission(N = 21) 26.25%
Treatment Duration
Drug-free23.75% (19 patients)
5-ASA treatment48.75% (3–24 months) (31 UC patients & 8 CD patients)
Anti-TNF treatment27.5% (3–24 months) (12 UC patients & 10 CD patients)
Non-IBD subjectsN = 80
Age (mean ± SD)49.78 ± 4.352
Sex (%M)(N = 55) 68.75%
Sex (%F)(N = 25) 31.25%
Smoking Behavior
Non-smokers(N = 70) 87.5%
Mild(N = 5) 6.25%
Moderate(N = 2) 2.5%
Severe(N = 3) 3.75%
Disclaimer/Publisher’s Note: The statements, opinions and data contained in all publications are solely those of the individual author(s) and contributor(s) and not of MDPI and/or the editor(s). MDPI and/or the editor(s) disclaim responsibility for any injury to people or property resulting from any ideas, methods, instructions or products referred to in the content.

