Abstract
The date palm (Phoenix dactylifera L.) is a popular edible fruit consumed all over the world and thought to cure several chronic diseases and afflictions. The profiling of the secondary metabolites of optimized ripe Ajwa date pulp (RADP) extracts is scarce. The aim of this study was to optimize the heat extraction (HE) of ripe Ajwa date pulp using response surface methodology (RSM) and artificial neural network (ANN) modeling to increase its polyphenolic content and antioxidant activity. A central composite design was used to optimize HE to achieve the maximum polyphenolic compounds and antioxidant activity of target responses as a function of ethanol concentration, extraction time, and extraction temperature. From RSM estimates, 75.00% ethanol and 3.7 h (extraction time), and 67 °C (extraction temperature) were the optimum conditions for generating total phenolic content (4.49 ± 1.02 mgGAE/g), total flavonoid content (3.31 ± 0.65 mgCAE/g), 2,2-diphenyl-1-picrylhydrazyl (11.10 ± 0.78 % of inhibition), and cupric-reducing antioxidant capacity (1.43 µM ascorbic acid equivalent). The good performance of the ANN was validated using statistical metrics. Seventy-one secondary metabolites, including thirteen new bioactive chemicals (hebitol II, 1,2-di-(syringoyl)-hexoside, naringin dihydrochalcone, erythron-guaiacylglycerol-β-syringaresinol ether hexoside, erythron-1-(4′-O-hexoside-3,5-dimethoxyphenyl)-2-syrngaresinoxyl-propane-1,3-diol, 2-deoxy-2,3-dehydro-N-acetyl-neuraminic acid, linustatin and 1-deoxynojirimycin galactoside), were detected using high-resolution mass spectroscopy. The results revealed a significant concentration of phytoconstituents, making it an excellent contender for the pharmaceutical and food industries.
1. Introduction
Extraction is the first and most significant step in recovering and purifying bioactive chemicals from plant sources, and it is often accomplished using maceration, distillation, or Soxhlet reflux extraction, but long extraction times and low extraction effectiveness limit these approaches [1]. For large-scale extraction, the best approach should provide high efficiency with minimal processing time. In general, either empirical or statistical methods can be used to optimize a process [2,3]. The one-factor-at-a-time technique is an empirical system that involves changing one element at a time while maintaining all other variables constant [4]. The main limitation of this strategy is that it neglects the interplay between the factors, and hence, it cannot account for all the effects of a parameter on the response. One more burden is that it requires numerous trials to finish the study, thereby increasing the time, costs, and reagent and material consumption [5]. To solve this challenge, multivariate statistical approaches were adopted for optimizing analytical procedures. One of the most prominent multivariate strategies used in analytical optimization is the response surface methodology (RSM) [4]. RSM is a collection of statistical and mathematical methodologies for constructing, developing, and adjusting procedures in which many variables impact a desired response, with the purpose of optimizing that response. It can be used to develop, formulate, and create new products, as well as refining the design of current ones. It describes how the independent variables influence the processes, either singly or together. This experimental approach provides a mathematical model that illustrates the chemical or biological procedures in addition to assessing the impact of independent factors [5,6]. However, any nonlinear relationship between the variables may reduce the forecast accuracy of RSM [7]. Artificial neural networks (ANNs) are rapidly being utilized as prediction tools in a variety of disciplines, including engineering, owing to their capacity to use learning algorithms to identify input–output links for nonlinear complex systems [8].
The date palm (Phoenix dactylifera L., Arecaceae family) is a popular edible fruit consumed all over the world. The Ajwa date is only cultivated in Medina, Saudi Arabia. It is one of the most expensive and valued cultivars on the market owing to religious and ethnomedical beliefs regarding its health-promoting qualities [9]. The beneficial properties of Ajwa dates are mentioned in the Old Testament, “Hadith”, and Islamic literature, and eating these dates is thought to cure several chronic diseases and afflictions [9]. It is regarded to have cardioprotective [10], hepatoprotective [11], nephroprotective [12], and constipation-relieving [13] properties and antioxidant, anti-inflammatory [14], anticancer [15], antifungal, antibacterial, and antiviral activities [16]. The fruit is rich in dietary fiber, minerals, organic acids, and vitamins and has great nutritional and therapeutic value [13]. Carbohydrates constitute more than 70% of the fruit [17]. In addition, it contains abundant bioactive components such as polyphenols, including phenolic acids, flavonoids, and lignans [13].
The optimization of the extraction of various dates from Tunisia, Algeria, Egypt, and other locations and their polyphenolic content as well as antioxidant activities were described in the prior literature; however, no systematic statistical technique was applied [1,18,19]. Additionally, the majority of the optimization of the extraction process was performed solely using RSM methodology, but the illustrious scientists made no attempt to compare the efficacy of predictive modeling with alternative, more effective methods such as ANN. Furthermore, to the best of our knowledge, this is the first study to use heat extraction (HE) with RSM and ANN to enhance the polyphenolic components and antioxidant activity of ripe Ajwa date pulp (RADP) extracts. The aim was to use the RSM central composite design (CCD) tool to investigate and optimize extraction parameters such as extraction temperature, time, and ethanol concentration to acquire the maximum polyphenolic content and antioxidant potentiality from RADP. We argue that the projected values generated by the RSM-CCD approach correspond to the actual results and that this statistical tool is an effective model to optimize RADP polyphenolic compound extraction and antioxidant activity. The estimating capabilities and modeling effectiveness of the RSM and ANN models were also statistically examined. Additionally, we have also profiled the secondary metabolites of RADP using high-resolution mass spectrometry analysis.
2. Results and Discussion
2.1. Fitting of the RSM and ANN Models
Table 1 summarizes the experimental parameters and findings of 20 extraction situations. All response variables were transformed into second-order quadratic polynomial equations to account for the difference in the various replies as functions of the extraction factors. The statistical significance of the fitted second-order quadratic model equations were determined using ANOVA (Table 2). To improve the model fit and prediction, non-significant terms (p > 0.05) were removed from the models. The p-values were used to determine the importance of each coefficient. The model terms were considered significant, very significant, and strikingly significant when the p-values were less than 0.05, 0.01, and 0.001, respectively; the model terms were not significant when the p-values were greater than 0.05 [20].

Table 1.
Central composite design (CCD) for independent variables and corresponding response values (experimental).
Table 2.
ANOVA for quadratic model (transfer function: none).
The statistical test known as the F-value, which compares the source mean square to the residual square, is frequently employed in conjunction with the p-value. The better the F-value, the more significant the model [21]. Table 2 outlines the model F-value range, which runs from 34.85 to 154.89. Adjusted R2 adjusts for the number of terms in the model, whereas projected R2 measures the variation in new data explained by the model. The various R2 values represent the degree of interpretation concerning the mean that the model can explain. For a fair level of agreement, the maximum expected difference between adjusted R2 and predicted R2 is 0.2; otherwise, it may indicate a problem with the model or the experimental data used to create the model [22]. The model is more accurate if adjusted R2 and projected R2 values are near 1. The constructed regression models, therefore, have a high level of statistical significance, as shown by their R2 values (0.9691–0.9929), adjusted R2 value (0.9413–0.9865), and predicted R2 value (0.8432–0.9580). It is important to note that R2 is ineffective for establishing the effectiveness or validity of a nonlinear model [23]. Contrarily, the most widely used metrics among the numerous model selection techniques are the predicted residual sum of squares (PRESS), the Akaike information criterion (AIC), and the Bayesian information criterion (BIC) [24]. The PRESS measures a model’s propensity to predict; hence, the lower the PRESS score, the greater the model’s prediction [25]. The PRESS value range in the current study is between 0.0464 and 0.5369, which supports the claim. Furthermore, it is generally known that Schwarz’s Bayesian information criterion (BIC) and Akaike information criterion (AIC) are both penalized-likelihood information criteria. In contrast to BIC, which is an estimate of the posterior probability of a model being authentic in a specific Bayesian setup, AIC is an estimate of a constant plus the distance between the fitted likelihood function of the model and the unknown actual likelihood function of the data [26]. The lower AICc and BIC model is typically considered the “best” model. AICc and BIC values, in this case, vary from −55.62 to −4.85 and −70.11 to −19.33, respectively, and indicate that the intended responses can be predicted with great accuracy. Furthermore, the appropriate precision value is an indicator of the signal-to-noise ratio. It is preferable to have a ratio >4 [27]. Here, the ratio was between 18.9896 and 34.9882, suggesting a sufficient signal, indicating that the model is suitable for this procedure. The coefficient of variation (CV) is a measure of a model’s reproducibility; in general, if CV < 10%, the model is reproducible [28]. In this study the CV values range from 0.9981 to 3.44. The modified R2 (R2 ≥ 0.80) was well within acceptable limits in this study, showing that the experimental data fits second-order polynomial equations satisfactorily [29]. To demonstrate the interactions between the independent variables, 3D surfaces and contour plots were constructed using multiple linear regression equations. The main and cross-product effects of the independent variables on the response variables are more easily understood from these 3D charts (Figure 1A–D).
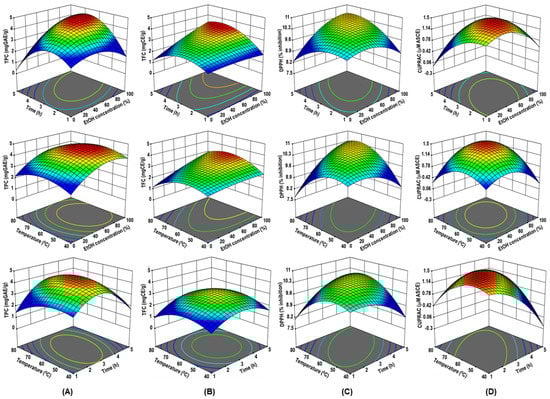
Figure 1.
The three-dimensional (3D) response surface plots of RADP extraction on ethanol concentration, time, and temperature for TPC (A), TFC (B), DPPH radical scavenging activity (C), and CUPRAC (D) as a function of significant interaction factors for RSM.
There is growing body of evidence that ANN modeling is superior and more sophisticated than RSM and that ANNs are an emerging viable alternative to the RSM system for complicated nonlinear multivariate modeling. In terms of fitting experimental responses, prediction, and modeling of biological processes, ANNs are more precise than RSM [30,31]. The experimental values were subjected to ANN modeling for further model verification. The predicted values obtained after training the ANN model are given in supplementary data Table S1.
The ANN model predicted values that were reasonably close to the observed values, indicating the appropriateness of our model. The nonlinear correlations between the extraction parameters (X1, X2, and X3) and response variables (Y1, Y2, Y3, and Y4) were predicted using the ANN model. By comparing the error between network training and testing, the number of neurons in the hidden layer was modified using the hit-and-trial strategy. During development, the input layer was not triggered using the transfer function, but the output and hidden layers were activated using pure line (purelin) and tangent sigmoid transfer (tansig) functions in MATLAB. In the experiment, the lowest feasible error between training and testing was evaluated, and the minimum number of epochs to prevent model overfitting was considered; the results were consistent with the findings of previous works [32]. Training the network with the Levenberg–Marquardt technique yielded the best validation performance for all dependent variables: TPC (Y1), TFC (Y2), DPPH (Y3), and CUPRAC (Y4) (supplementary data Figures S1–S4).
2.2. Comparison of the Prediction Abilities of the RSM and ANN Models
The predictive and estimate capabilities of RSM and ANN models were compared. Comparative similarity plots were used to examine the projected values of the four target responses (Y1, Y2, Y3, and Y4) obtained using the ANN model. The results indicate that compared to the RSM model, the ANN model was more correct, precise, and capable of assessment in terms of fitting the experimental data to all target responses (supplementary data Table S1). The RSM model had a greater degree of divergence between the projected and actual data than the ANN model, whereas the ANN model had stable residuals with low variation.
The values of the correlation coefficient (R2), root-mean-square error (RMSE), absolute average deviation (AAD), and standard error of prediction (SEP) were calculated to compare the RSM and ANN models (Table 3). Better modeling requires lower RMSE, AAD, and SEP, and greater R2. The calculated R2 values of the trained ANN model were higher than those of the RSM model, indicating the superiority of the ANN model in terms of predicting all four dependent variables. The AAD is a measure of the projected data’s divergence from the actual data, whereas the RMSE numbers demonstrate the model’s absolute fit. The ANN model performed better than the RSM model, as seen by the former’s lower AAD and RMSE values. In addition, the ANN model had low SEP values, in the range of 0.0449–0.2903. The ANN model has a substantially stronger predictive capacity than the RSM model because the former can approximate nonlinear systems, but the latter is only successful if the system is constrained to second-order polynomial regression. The ANN model is likewise unaffected by experimental design, and it is faster at calculating many responses in a single run than the RSM model, which requires multiple runs for multi-response optimization in a typical experimental design [33]. Unlike the RSM model, building an ANN model requires many iterative calculations and long computation time. Moreover, ANNs are also useful as they are flexible for the addition of new experimental data for model generation [33].
Table 3.
Comparison of the prediction abilities of the RSM and ANN models.
2.3. Effect of HE Parameters on the TPC and TFC
The TPC and TFC in the RADP extracts varied from 2.87 to 4.53 mgGAE/g and 2.03 to 3.44 mgCAE/g, respectively (Table 1). The linear effect of ethanol concentration (X1), temperature (X3), and the quadratic component of (X12), (X22), and (X32) as well as the interaction of (X1X3) and (X2X3) were significant for TPC. The linear effect of (X1), (X2), and (X3); the quadratic component of (X22) and (X32); and the interaction of (X1X2) and (X1X3) were significant for TFC (Table 2). The following second-order polynomial equations shown in Equations (1) and (2) demonstrate the relationships among TPC, TFC, and their variables.
The lack of fit values for TPC and TFC (F = 1.73 and 2.07, respectively) were non-significant, indicating that the model accurately predicted R2 = 0.9866 (TPC) and 0.9729 (TFC) and Adj.R2 = 0.9745 (TPC) and 0.9485 (TFC) (Table 2). The RSM model adequately predicted the effects of parameters on the TPC and TFC of the RADP extract. As shown in Figure 1A,B, when the temperature (X3) was fixed (60 °C), the maximum TPC and TFC were achieved when the ethanol concentration (X1) was 50%, and time was 3 h. This could be because a medium concentration of ethanol may make the solvent more polar and dissolve more polyphenols, both polar and moderately polar ones [1]. Experiments in a previous comparative study revealed that the extraction of polyphenols from green tea leaves using a high hydrostatic pressure procedure augmented as the percentage of ethanol in the solvent, which peaked at 50% ethanol and dropped after that [34]. Hence, extraction of polyphenols in hydroalcoholic solution is highly efficient as the polyphenols are highly soluble in these solutions [1]. Furthermore, when ethanol is present at a moderate quantity in water, it can disrupt and break the architecture and structure of phospholipids that make up the lipid bilayer of membranes, affecting the penetrability of plant cells, thereby allowing better extraction and diffusion of the polyphenolic compounds [34].
2.4. Effect of HE Parameters on the In Vitro Antioxidant Capacity (AC)
DPPH radical scavenging activity and CUPRAC analysis revealed a linear significant effect of ethanol concentration (X1) and the quadratic effect of temperature (X3) on antioxidant activity. The fitted second-order polynomial equations for DPPH (% inhibition) and CUPRAC (ascorbic acid equivalent μM) are shown in Equations (3) and (4):
The AC values ranged from 9.36% to 10.81% inhibition of DPPH and from 0.75 to 1.47 μM ascorbic acid equivalent (Table 1). The ANOVA results show that the data fitted the model results for DPPH (R2 = 0.9691 and Adj. R2 = 0.9413) and CUPRAC response (R2 = 0.9929 and Adj. R2 = 0.9865), and the lack of fit was non-significant (F = 1.03 for DPPH and 2.37 for CUPRAC) (Table 2). From the 3D response surface plots shown in Figure 1C,D, both DPPH radical scavenging activity and CUPRAC activity increase with increasing ethanol concentration to reach the maximum values at 100% and 75% ethanol, respectively. This means that the greater the quantity of the organic solvent, the better the electron and proton donation capacities are. This result is consistent with the prior finding for TFC that 100% ethanol is required for maximum extraction [34]. Increasing the ethanol concentration allows for the extraction of significant polyphenolics in RADP, both in terms of quality and quantity. There is increasing evidence that the quality and quantity of polyphenolic compounds and antioxidant activity differ with the ethanol concentrations [35,36].
2.5. Model Validation
The desirability function optimizes responses for polyphenolic content (TPC and TFC) and antioxidant activity (DPPH and CUPRAC) concurrently. The parameters were forecasted using Derringer’s desirability function, allowing a multivariate analysis to discover the ideal level for all responses in a single extraction [37]. In this study, the following conditions were used to achieve the maximal overall desirability D = 0.934 (on a scale of 0 to 1): X1, 75%; X2, 3.7 h; and X3, 67 °C. Figure 2 shows the contour plot as a function of ethanol concentration, extraction time, and temperature at optimum condition. To verify the sufficiency of the model equations, a duplicate experiment was conducted in the optimal conditions predicted by Derringer’s desire model. The following results were obtained: TPC = 4.49 ± 1.02 mgGAE/g, TFC = 3.31 ± 0.65 mgCAE/g, % inhibition of DPPH = 11.10% ± 0.78%, and µM ascorbic acid equivalent CUPRAC = 1.43 ± 0.43. As stated in Table 4, the relative standard deviations (RSDs) of TPC, TFC, DPPH, and CUPRAC showed that the predicted values for all groups were very similar to the experimental results. This result is also supported by prior research [29].
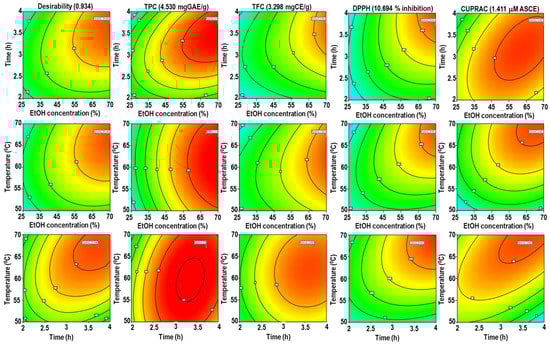
Figure 2.
Desirability surface plot as a function of ethanol concentration, extraction time, and temperature for TPC, TFC, DPPH, and CUPRAC.
Table 4.
Experiment data of the validation of predicted values at optimal extraction conditions of RADP.
2.6. Identification of Secondary Metabolites in RADP with High-Resolution Mass Spectrometry
Secondary metabolites in the RADP extracts were identified using ESI-MS/MS in the positive and negative ionization modes. As indicated in Table 5, 71 compounds were identified in the negative mode using MSn data from the mass of the precursor ion, fragments, recognized fragmentation patterns for the given classes of compounds, and neutral mass loss, and from comparison with the existing literature and searches in online databases. Furthermore, the significance of these results was determined by finding the confidence level. Level 3 denotes a tentative candidate, whereas level 2 indicates the probable structure of the identified compound [38].
Table 5.
List of possible identified compounds of the optimized extract of ripe Ajwa date pulp (RADP) by electrospray ionization mass spectrometry (ESI-MS)/MS.
2.6.1. Phenolic Acids
A phenolic acid may lose its methyl (15 Da), hydroxyl (18 Da), or carboxyl (44 Da) moiety to form a specific fragment ion. The fragmentation of a phenolic acid glycoside begins with the cleavage of the glycosidic link to yield the m/z of the phenolic acid and the corresponding loss of the sugar molecule (neutral mass loss of 162 Da). Thus, compounds 2–7 were tentatively identified as hydroxybenzoylhexose, coumaroyl hexose, caffeoylshikimic acid, caffeic acid hexoside, caffeic acid derivatives, and dicaffeoyl shikimic acid, respectively [17,39,40]. Among these, coumaroyl hexose (IC50 value: 37.7 μM), caffeoylshikimic acid (IC50 value: 2.9 μM), caffeic acid hexoside (IC50 value: 0.55 μM), and dicaffeoyl shikimic acid (IC50 value: 0.38 μM) were found to have DPPH-scavenging activity [41,42,43]. Additionally, coumaroyl glucoside severely inhibits glycogen phosphorylase, a crucial target for producing antihyperglycemic medicines [44]. The formation of advanced glycation end products (AGEs) and the activity of the angiotensin-converting and acetylcholinesterase enzymes are all inhibited by caffeine acid glucoside [45]. In addition, compound 1 yielded a precursor ion [M–H]− at m/z 139.0050, generated characteristic ions at m/z 111.01 and 95.01 by loss of neutral molecules of CO and COO, respectively, and was provisionally identified as coumalic acid; this is the first time that this compound was identified in Ajwa dates (supplementary data Figure S5A). Furthermore, compound 8 produced a monoisotopic ion [M–H]− at m/z 505.1603 and yielded fragment ions at m/z 325.09 [M-H-181 Da], m/z 341.08 [M-H-165 Da], and MS2 ion at m/z 341.08. Further loss of glucosyl moiety (162 Da) led to the generation of an ion at m/z 179.03, and the following loss of water molecules yielded an ion at m/z 161.02, thereby confirming the presence of caffeoyl hexoside. Based on the fragmentation behavior, compound 8 was tentatively confirmed as hebitol II, which has been identified in RADP for the first time (Figure 3A). According to Wang et al., hebitol II prevented the growth of Plasmodium falciparum 3D7, a malarial parasite line [46]. Moreover, compound 9 was tentatively identified as 1,2-di-(syringoyl)-hexoside with molecular formula C24H28O14, which yielded a deprotonated ion at m/z 539.1377 and generated the following fragment ions: m/z at 359.09 ([M-H-syringoyl moiety]), 341.08 ([M-H-syringoyl moiety-H2O]), 197.04 (syringic acid), and 153.05 because of the loss of water molecule from ion m/z 197.04 (Figure 3B). Compound 9 too has been identified for the first time in RADP.
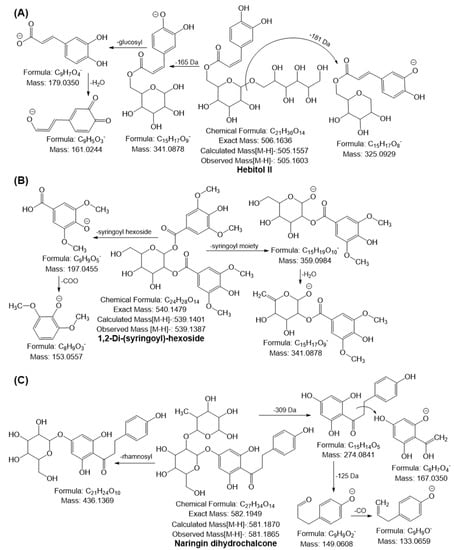
Figure 3.
Possible mass fragmentation behavior of identified compounds in RADP. (A) Hebitol II, (B) 1,2-di-(syringoyl)-hexoside, and (C) naringin dihydrochalcone.
2.6.2. Flavonoids
A previous review demonstrated that each subgroup of flavonoids exhibits a different fragmentation behavior in MS2 analysis. The cleavage of the C-ring bonds (retro-Diels-Alder, i.e., RDA mechanism) produces ions with the A- or B-ring and some part of the C-ring, which is the most common fragmentation of flavonoids [47]. Notable losses of small neutral molecules, such as CO (28 Da), C2H2O (42 Da), COO (44 Da), 2CO (56 Da), CO + COO (72 Da), and 3CO (84 Da), may also occur [48]. Based on a comparison of the fragmentation patterns with those previously published in the literature, compounds 10, 11, and 20 were identified as chrysoeriol, quercetin, and afzelin gallate, respectively [1,17,40]. Along with their antioxidant properties, quercetin, and chrysoeriol have shown potent anti-cancer, anti-inflammatory, antidiabetic, and antihyperlipidemic effects [49,50]. Flavonoids are frequently glycosylated. The typical fragmentation of O-glycosides produces neutral species corresponding to sugar units (hexoses, 162 Da; deoxyhexoses, 146 Da; pentoses, 132 Da) and an aglycone ion. Conversely, C-glucosides produce a sequence of fragments because of the cleavage of the C-C bonds with the sugar moiety; examples of such fragments are [M-H-60]−, [M-H-90]−, and [M-H-120]−, which serve as the hallmark diagnostic ions of glycone [51,52]. Compounds 12–18 and 21–29 were identified as dihydrokaempferol hexoside (aromadendrin hexoside), isoquercitrin, isorhamnetin hexoside, luteolin hexosyl sulfate, chrysoeriol hexosyl sulfate, isoquercitrin sulfate, apigenin-8-C-(pentosyl)-hexoside (vitexin rhamnoside), luteolin rhamnosyl hexoside, chrysoeriol rhamnosyl hexoside (chrysoeriol rutinoside), quercetin rhamnosyl glucoside (rutin), isorhamnetin rhamnosyl glucoside (isorhamnetin rutinoside), quercetin diglucoside, isorhamnetin diglucoside, luteolin dihexosyl sulfate, luteolin rhamnosyl dihexoside (luteolin rutinoside), and chrysoeriol rhamnosyl dihexoside (chrysoeriol rutinoside), respectively, based on the similarities observed in the comparison of their fragmentation behaviors and with the behaviors reported in the literature [1,13,17,40]. The flavonoid glycosides’ DPPH-scavenging action is as follows: isorhamnetin rutinoside > isoquercitrin > isorhamnetin hexoside > chrysoeriol rutinoside > rutin > vitexin rhamnoside ≅ luteolin rutinoside [53,54,55,56]. The deprotonated molecular ion [M–H]− at m/z 581.1863 exhibited MS2 fragment ions at m/z 436.13 and 274.08 by loss of rhamnosyl (145 Da) and rhamnosyl-glucosyl moieties (309 Da). The ion at m/z 274.08 further yielded MS3 ion at m/z 167.03 and 149.06 through cleavage of the α-β bond and loss of the phloroglucinol moiety (125 Da); hence, compound 19 was tentatively identified as naringin dihydrochalcone, which has been identified for the first time in RADP (Figure 3C). Naringin dihydrochalcone has more excellent antioxidant activity than naringin [57]. It was proposed as a potential therapeutic agent for Alzheimer’s disease treatment due to its ability to combat several effects that increase neurogenesis, suppress neuroinflammation, and decrease Aβ levels [58].
2.6.3. Lignans
The monoisotopic mass [M–H]− at m/z 775.2821 yielded a characteristic fragment ion at m/z 613 by loss of hexosyl moiety (162 Da) and m/z 417.155, confirming the presence of syringaresinol. The MS2 ion at m/z 417.15 underwent further cleavage of the furfuran ring followed by the loss of two molecules of CH3 generated ion at m/z 181.05 and 151.00, respectively; compound 30 was tentatively confirmed as a furfuran-type lignan compound, namely erythro-guaiacylglycerol-β-syringaresinol ether hexoside (Figure 4A). Furthermore, the deprotonated ion [M–H]− of compound 31 was obtained at m/z 805.2926, and it yielded a fragment ion at m/z 643.23 by the loss of the hexosyl moiety, which was 31 Da higher than that of compound 30. This suggests that the compound has one more methoxy group. The other fragmentation behavior observed was similar to that of the quasimolecular ion of compound 30, suggesting that compound 31 was erythro-1-(4′-O-hexoside-3,5-dimethoxyphenyl)-syringaresinoxyl-propane-1,3-diol (supplementary data Figure S5B). Both lignans were identified for the first time in RADP. The biological activities of these lignans remain unknown [59,60].
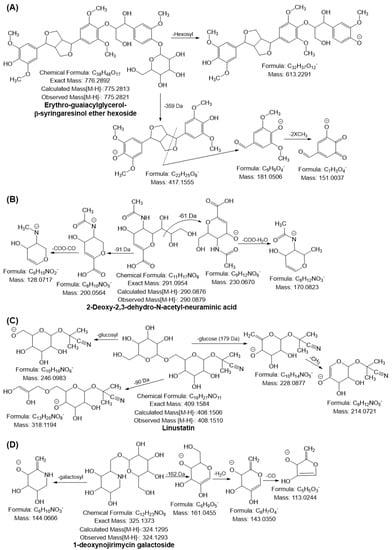
Figure 4.
Possible mass fragmentation behavior of identified compounds in RADP. (A) erythron-guaiacylglycerol-β-syringaresinol ether hexoside, (B) 2-deoxy-2,3-dehydro-N-acetyl-neuraminic acid, (C) linustatin, and (D) 1-deoxynojirimycin galactoside.
2.6.4. Sialic Acid and Derivatives
The deprotonated ion [M–H]− of No. 32 was observed at m/z 290.0879, and diagnostic ions were generated at m/z 230.06 and 200.05 by the loss of 61 and 91 Da, respectively. Both MS2 ions further generated fragment ions at m/z 146.08 ([M-H-230.06-COO-H2O]) and 128.07 ([M-H-200.05-COO-CO]), suggesting that the compound was 2-deoxy-2,3-dehydro-N-acetyl-neuraminic acid (DANA) (Figure 4B). The monoisotopic mass [M–H]− at m/z 308.0987 and 632.2039 with molecular formulas C11H19NO9 and C23H39NO19 suggested that compounds 33 and 34 were N-acetyl-neuraminic acid and 3′-sialyllactose (SL), respectively, as their mass fragmentation behaviors were quite similar to the behavior of the quasimolecular ion of compound 32 (supplementary data Figure S5C,D). This is the first time that sialic acid has been identified in RADP. DANA is a glucose-dependent potentiator of insulin secretion [61]. The positive effects of SL on inflammation and immunological homeostasis by altering the gut microbiota profile have been documented in numerous investigations. It also slows the progression of rheumatoid arthritis by reducing chemokines and cytokines, and it relieves osteoarthritis by promoting cartilage regeneration and preventing cartilage from being destroyed [62,63,64].
2.6.5. Amino Acids, Carboxylic Acids, and Fatty Acids
From comparisons of the mass and the fragmentation behaviors of the precursor ion based on mass spectroscopic analysis reported in the literature and various online databases, compounds 35–38, 48–55, and 56–67 were identified as amino acids, carboxylic acids, and fatty acids, respectively (Table 5) [17,40,47,48,65,66,67]. Pyroglutamic acid is utilized as a humectant in products for dry skin and hair and has potential anti-angiotensin-converting enzyme activity [68].
2.6.6. Sugar Molecules
From the monoisotopic ion [M–H]― at m/z 351.0569, the diagnostic ions yielded at m/z 291.07 ([M-H-COO-H2O]), 273.06 ([M-H-291.07-H2O]), 175.02 ([M-H-glucoronyl]), and 131.03 ([M-H-175.02-COO]). Compound 46 was tentatively identified as unsaturated digalacturonate; this is the first time that this compound was found in RADP (supplementary data Figure S6A). Furthermore, compound 47 was tentatively identified as xylosmaloside with the molecular formula C18H20O9, and this compound generated the deprotonated ion [M–H]− at m/z 379.1027 and the following mass fragmentation pattern: m/z 343.08 ([M-H-36 Da]), 217.05 ([M-H-162 Da]), 179.05 (xylose), and 161.04 ([M-H-179.05-18 Da]) (supplementary data Figure S6B). This compound too was identified for the first time in RADP. Compounds 39–45 were confirmed as sugar molecules from comparison of their deprotonated ion mass and fragmentation behaviors with those reported in the literature and online databases [47,48,65,66,67,69]. Maltitol, one of the sugar molecules, inhibits Streptococcus mutans DMST 18777, and xylosmaloside has greater antioxidant properties than ascorbic acid [70,71].
2.6.7. Others
Compound 68 yielded a monoisotopic mass [M–H]− at m/z 408.1510 and generated a diagnostic ion at m/z 246.09 by loss of the glucosyl moiety (162 Da). Furthermore, a prominent ion peak was observed at m/z 228.08 with the neutral loss of glucose moiety. In the MS3 spectra of m/z 228, ions at m/z 214.07 were observed owing to the loss of CH2, suggesting that the compound was linustatin, a cyanogenic glucoside, which has also been identified for the first time in RADP (Figure 4C). The deprotonated ion [M–H]− at m/z 324.1293 and the characteristic ions at m/z 144.06 ([M-H-galactosyl moiety]) and 161.04 ([M-H-162 Da]) were observed. The fragment ion at m/z 161.04 further yielded ions at m/z 143.03 and 113.02 through the consecutive loss of H2O and CO. Based on the mass fragmentation behavior, compound 69 was tentatively identified, for the first time in RADP, as 1-deoxynojirimycin galactoside (Figure 4D). Although 1-deoxynojirimycin galactoside’s pharmacological role is unknown, its aglycone component (1-deoxynojirimycin) has a powerful antihyperglycemic and anti-obesity activity [72]. Compound 70 was tentatively identified as oxycoumarin-4-acetic acid methyl ether hexoside, with the molecular formula C18H20O10, and it yielded a deprotonated ion [M–H]− at m/z 395.0968. It gave a prominent peak at m/z 233.04, owing to the loss of galacotosyl moiety (162 Da). In the MS3 spectra of 233.04, ions at m/z 205.05 and 161.02 were generated through the loss of CO and acetic acid methyl ether moiety (supplementary data Figure S6C).
3. Materials and Methods
3.1. Sample Collection and Preparation
Ripe Ajwa dates were collected from an Ajwa date farm located in Medina, Saudi Arabia, and were identified by a scientific officer at the National Herbarium and Genebank of Saudi Arabia. A voucher specimen (No. NHG005) has been stored in our laboratory for further investigation. Heat extraction (HE) was performed in a temperature-controlled heater using a round-bottom flask with a condenser to prevent solvent evaporation (Soxlet water bath C-WBS-D6, Changshin Science, Seoul, Republic of Korea). The dry powder samples (10.0 g) were extracted thrice with 100 mL solvent according to the investigational design shown in supplemental data Tables S1 and S2. After extraction, the samples were filtered using Whatman No. 1 filter paper (Schleicher & Schuell, Keene, NH, USA), concentrated to dryness in a rotary evaporator (Tokyo Rikakikai Co. Ltd., Tokyo, Japan) at 40 °C and 50 rpm, and then lyophilized using a freeze-dryer (Il-shin Biobase, Goyang, Republic of Korea). The RADP extract was kept at −20 °C before subsequent experiments.
3.2. Antioxidant Activities
The total phenolic content (TPC) and total flavonoid content (TFC) in ripe Ajwa date pulp (RADP) extracts were determined using the Folin–Ciocalteu test and the aluminum chloride colorimetric method, respectively [45]. The TPC (y = 0.0512x + 0.0018; r2 = 0.9835) and TFC (y = 0.014x + 0.0021; r2 = 0.9994) were determined using the corresponding regression equations for the calibration curves. The TPC was expressed in terms of the gallic acid equivalent (mg)/dry weight sample (g), and the TFC in terms of the catechin equivalent (mg)/dry weight sample (g). The DPPH radical scavenging assay and the cupric-reducing antioxidant capacity (CUPRAC) assay were applied to assess the antioxidant activity of RADP extracts [28].
3.3. Experimental Design of Response Surface Methodology (RSM) for the Extraction Process
The RSM model was developed for the extraction of phenolic compounds from RADP; the independent process factors were ethanol concentration (X1), time (X2), and temperature (X3), and the response variables were TPC (Y1), TFC (Y2), DPPH-scavenging activity (Y3), and CUPRAC (Y4). The extractions were carried out using a central composite design (CCD) with three components and five layers. The response variables were fitted to the second-order polynomial model equation shown in Equation (5), which specifies the relationship between the independent variables and responses.
where Y is the response variable, and Xi and Xj are the independent coded variables; β0 denotes the constant coefficient, and βi, βii, and βij denote the coefficients of linear, quadratic, and interaction effects, respectively. Design Expert 11 was used for the RSM analysis and multiple linear regression (Stat-Ease, Minneapolis, MN, USA). To select the best model, the function parameter was selected as “None” and various R2 (coefficient of determination) values, PRESS (the predicted residual sum of squares), BIC (the Bayesian information criterion), and AICc (the Akaike information criterion–second-order) were considered. The F-values with p < 0.05 indicated statistical significance. The interaction outcome of each factor on the response value was represented in the form of three-dimensional (3D) surface plots.
3.4. Artificial Neural Networks (ANN) Modeling
An ANN was used to predict a nonlinear relationship between RADP’s input parameters (X1, X2, and X3) and response variables (Y1, Y2, Y3, and Y4). The Neural Network ToolboxTM of MATLAB was used for the nonlinear analysis, and the multilayer perceptron (MLP) was utilized to map layers of independent and response variables using a back-propagation feed-forward ANN model [28]. The hit-and-trial method was used to calculate the required number of neurons in the hidden layer, which ranged from 1 to 15, to minimize discrepancies between the predicted and experimental results of RADP. Figure 5 depicts the three-layered fundamental architecture (MLP topology) of the ANN model. The model’s fundamental architecture consists of three layers: a three-neuron input layer representing the three independent factors (ethanol concentration, extraction time, and temperature); a six-neuron hidden layer; and an output layer representing the four response variables (TPC, TFC, DPPH-scavenging activity, and CUPRAC value) of RADP. The investigational dataset used to create the RSM model was also used to develop an ANN model: network training (70%: 20 points), validation (15%: 5 points), and network testing (15%: 5 points). In the ANN design, the output signal was made by sending the weighted sum of the input variables to each neuron through an activation function. This function was usually nonlinear and was represented by the hidden layer.
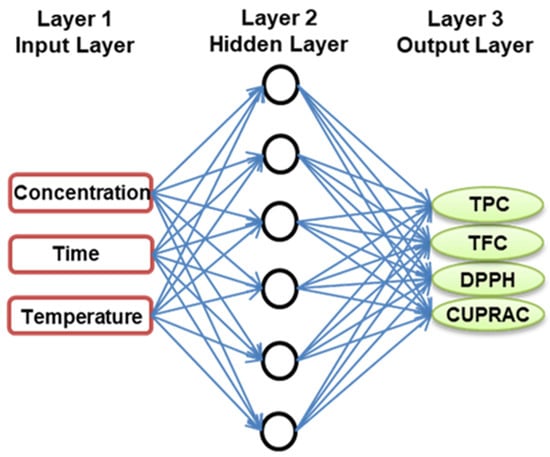
Figure 5.
Optimal topology of a developed ANN model.
3.5. Comparison of the Prediction Ability of the RSM and ANN Models
The following equations (Equations (6)–(9)) were used to calculate various statistical parameters, including the correlation coefficient (R2), root-mean-square error (RMSE), absolute average deviation (AAD), and standard error of prediction (SEP), to compare the estimation capabilities of RSM and ANN for improving the extraction procedure with better TPC, TFC, and antioxidant potential of RADP.
where Yp is the predicted response; Ye is the observed response; Ym is the average response variable; n is the number of experiments.
3.6. Validation of the Model
Derringer’s desire function was used to find the ideal conditions for maximizing all replies in a single experiment. Each response is turned into a unique desirability function ranging from 0 to 1 during this procedure (in the order of the lowest to the highest desirability). The component functions are then combined to create a total desirability function. The total desirability function is constructed using the following equation [1].
Response surface and desirability function analyses were used to determine the optimal RADP extraction parameters, which were 75% ethanol concentration, 3.7 h of extraction time, and 67 °C temperature with D = 0.934. A triple experiment was conducted under the best possible circumstances to validate the existing model. The average experimental results were then compared to the predicted results. The experimental data were also compared to the values that the model indicated. To compare the observed and anticipated outcomes of RADP, Equation (11) was utilized to calculate the relative standard deviation (RSD).
The resulting data were analyzed and optimized for all response circumstances when the RSD% was <10. Additionally, the electrospray ionization mass spectrometry (ESI-MS)/MS profiles of bioactive compounds were found under ideal circumstances of RADP.
3.7. Analysis of Chemical Compounds by ESI-MS/MS
The Q-Exactive Orbitrap mass spectrometer (Thermo Fisher Scientific INC., San Jose, CA, USA) was used to conduct the positive (+) and negative (−) mode ESI-MS investigations of RADP. A 500 μL graded syringe (Hamilton Company Inc., Reno, NV, USA) and a 15 μL/min syringe pump (Model 11, Harvard, Holliston, MA, USA) were used to immerse the RADP in the ESI source. The normal negative mode ESI-MS conditions were as follows: mass resolution of 140,000 (full width at half maximum, FWHM), sheath gas flow rate of 5, seep gas flow rate of 0, auxiliary gas flow rate of 0, spray voltage of 4.20 kV, capillary temperature of 320 °C, S-lens Rf level, and automatic gain control of 5 E 6. The MS/MS experiments were conducted on the same instrument utilizing three unique stepwise normalized collision energies (10, 30, and 40) to produce better fragmentations of each peak, hence facilitating the confirmation of RADP for each compound [48].
The Xcalibur 3.1 with Foundation 3.1 (Thermo Fisher Scientific Inc. Rockford, IL, USA) was used to process the collected mass spectral data. The m/z peaks were tentatively identified by comparing their calculated (exact) masses of protonated and/or deprotonated (M–H) adducts with the m/z values and ESI-MS/MS fragmentation patterns from the in-house MS/MS database and online databases such as METLIN [65], CFM-ID 4.0 [66] and FooDB [67]. The chemical structure was drawn using ChemDraw Professional 15.0 (PerkinElmer, Waltham, MA, USA).
3.8. Statistical Analysis
The experimental results were statistically analyzed using Design Expert 11 and MATLAB software. All data were reported as the mean ± standard deviation of at least three independent experiments (n = 3), each with three sample replicates. Differences were considered significant at p < 0.001, p < 0.01, and p < 0.05.
4. Conclusions
This work was the first to use two modeling methodologies (RSM and ANN) to optimize the heat extraction (HE) conditions for achieving the highest amount of TPC, TFC, and antioxidant potential of RADP. The ANN model is more accurate and reliable for optimizing the extraction conditions of RADP for improved attainment of TPC, TFC, and antioxidant characteristics, as evidenced by the greater R2 and lower RMSE, AAD, and SEP compared to the RSM model. The optimal conditions (75% ethanol, extraction time of 3.7 h, and extraction temperature of 67 °C) were determined to maximize the TPC, TFC, and antioxidant potential of RADP. Under optimum conditions, TPC, TFC, DPPH radical scavenging effect, and ascorbic acid equivalent CUPRAC value were obtained as 4.53 mg GAE/g, 3.30 mg CAE/g, 10.69% inhibition, and 1.41 μM, respectively. RADP contains phenolic acids, flavonoids, sialic acids, lignans, etc., as determined by high-resolution mass spectrometry analysis. Sialic acids and lignans were described for the first time in RADP as bioactive substances. Based on these data, we can infer that RADP, a viable candidate for an antioxidant functional food, could be used extensively in the nutraceutical and pharmaceutical industries.
Supplementary Materials
The following supporting information can be downloaded at: https://www.mdpi.com/article/10.3390/ph16020319/s1. Figure S1: The R2 value of training, validation, test, and overall for TPC during ANN. Figure S2: The R2 value of training, validation, test, and overall for TFC during ANN. Figure S3: The R2 value of training, validation, test, and overall for DPPH during ANN. Figure S4: The R2 value of training, validation, test, and overall for CUPRAC during ANN. Figure S5: Possible mass fragmentation behavior of identified compounds in RADP. (A) Coumalic acid, (B) Erythro-1-(4”-O-β-D-glucopyranoside-3,5-dimethyoxyphenyl)-2-syringaresinoxyl-propane-1,3-diol, (C) N-acetyl-α-neuraminic acid, and (D) 6′-sialyllactose. Figure S6: Possible mass fragmentation behavior of identified compounds in RADP. (A) Unsaturated digalacturonate, (B) Xylosmaloside, and (C) Oxycoumarin-4-acetic acid methyl ester hexoside. Table S1: Central composite design (CCD) for the independent variables and corresponding response value in RSM and ANN (predicted). Table S2: Independent process variables with experimental ranges and levels for heat reflux extraction of ripe Ajwa date pulp (RADP).
Author Contributions
Conceptualization, M.B.A., S.-H.L. and S.K.; methodology, F.A., M.N. and A.J.; software, F.A., M.N. and A.J.; formal analysis, M.B.A., F.A., M.N. and A.J.; investigation, F.A. and M.N.; resources, M.B.A. and S.-H.L.; data curation, F.A., A.J., M.B.A. and S.-H.L.; writing—original draft preparation, F.A.; writing—review and editing, M.B.A. and S.-H.L.; supervision, M.B.A., S.-H.L. and S.K.; project administration, M.B.A. and S.-H.L.; funding acquisition, M.B.A. and S.-H.L. All authors have read and agreed to the published version of the manuscript.
Funding
This study was supported by the National Research Foundation of Korea (NRF) funded by the Ministry of Science and ICT (2020R1A2C2011495 and 2021R1IA1A01058062).
Institutional Review Board Statement
Not applicable.
Informed Consent Statement
Not applicable.
Data Availability Statement
Not applicable.
Acknowledgments
Fanar Alshammaria received the financial support for his Ph.D. studying project from the Education Ministry of the Kingdom of Saudi Arabia (EMSA).
Conflicts of Interest
The authors declare no conflict of interest.
References
- Sedraoui, S.; Badr, A.; Barba, M.G.M.; Doyen, A.; Tabka, Z.; Desjardins, Y. Optimization of the Ultrahigh-Pressure–Assisted Extraction of Phenolic Compounds and Antioxidant Activity from Palm Dates (Phoenix dactylifera L.). Food Anal. Methods 2020, 13, 1556–1569. [Google Scholar] [CrossRef]
- Liyana-Pathirana, C.; Shahidi, F. Optimization of extraction of phenolic compounds from wheat using response surface methodology. Food Chem. 2005, 93, 47–56. [Google Scholar] [CrossRef]
- Tabaraki, R.; Nateghi, A. Optimization of ultrasonic-assisted extraction of natural antioxidants from rice bran using response surface methodology. Ultrason. Sonochemistry 2011, 18, 1279–1286. [Google Scholar] [CrossRef] [PubMed]
- Kusuma, H.S.; Amenaghawon, A.N.; Darmokoesoemo, H.; Neolaka, Y.A.B.; Widyaningrum, B.A.; Onowise, S.U.; Anyalewechi, C.L. A comparative evaluation of statistical empirical and neural intelligence modeling of Manihot esculenta-derived leaves extract for optimized bio-coagulation-flocculation of turbid water. Ind. Crops Prod. 2022, 186, 115194. [Google Scholar] [CrossRef]
- Bezerra, M.A.; Santelli, R.E.; Oliveira, E.P.; Villar, L.S.; Escaleira, L.A. Response surface methodology (RSM) as a tool for optimization in analytical chemistry. Talanta 2008, 76, 965–977. [Google Scholar] [CrossRef]
- Baş, D.; Boyacı, İ.H. Modeling and optimization I: Usability of response surface methodology. J. Food Eng. 2007, 78, 836–845. [Google Scholar] [CrossRef]
- Desai, K.M.; Survase, S.A.; Saudagar, P.S.; Lele, S.S.; Singhal, R.S. Comparison of artificial neural network (ANN) and response surface methodology (RSM) in fermentation media optimization: Case study of fermentative production of scleroglucan. Biochem. Eng. J. 2008, 41, 266–273. [Google Scholar] [CrossRef]
- Zobel, C.W.; Cook, D.F. Evaluation of neural network variable influence measures for process control. Eng. Appl. Artif. Intell. 2011, 24, 803–812. [Google Scholar] [CrossRef]
- Yasin, B.R.; El-Fawal, H.A.; Mousa, S.A. Date (Phoenix dactylifera) Polyphenolics and Other Bioactive Compounds: A Traditional Islamic Remedy’s Potential in Prevention of Cell Damage, Cancer Therapeutics and Beyond. Int. J. Mol. Sci. 2015, 16, 30075–30090. [Google Scholar] [CrossRef]
- Al-Yahya, M.; Raish, M.; AlSaid, M.S.; Ahmad, A.; Mothana, R.A.; Al-Sohaibani, M.; Al-Dosari, M.S.; Parvez, M.K.; Rafatullah, S. ’Ajwa’ dates (Phoenix dactylifera L.) extract ameliorates isoproterenol-induced cardiomyopathy through downregulation of oxidative, inflammatory and apoptotic molecules in rodent model. Phytomedicine Int. J. Phytother. Phytopharm. 2016, 23, 1240–1248. [Google Scholar] [CrossRef]
- Almatroodi, S.A.; Khan, A.A.; Aloliqi, A.A.; Ali Syed, M.; Rahmani, A.H. Therapeutic Potential of Ajwa Dates (Phoenix dactylifera) Extract in Prevention of Benzo(a)pyrene-Induced Lung Injury through the Modulation of Oxidative Stress, Inflammation, and Cell Signalling Molecules. Appl. Sci. 2022, 12, 6784. [Google Scholar] [CrossRef]
- Hassan, S.M.A.; Aboonq, M.S.; Albadawi, E.A.; Aljehani, Y.; Abdel-Latif, H.M.; Mariah, R.A.; Shafik, N.M.; Soliman, T.M.; Abdel-Gawad, A.R.; Omran, F.M.; et al. The Preventive and Therapeutic Effects of Ajwa Date Fruit Extract Against Acute Diclofenac Toxicity-Induced Colopathy: An Experimental Study. Drug Des. Devel. Ther. 2022, 16, 2601–2616. [Google Scholar] [CrossRef]
- Khalid, S.; Khalid, N.; Khan, R.S.; Ahmed, H.; Ahmad, A. A review on chemistry and pharmacology of Ajwa date fruit and pit. Trends Food Sci. Technol. 2017, 63, 60–69. [Google Scholar] [CrossRef]
- Rahmani, A.H.; Aly, S.M.; Ali, H.; Babiker, A.Y.; Srikar, S.; Khan, A.A. Therapeutic effects of date fruits (Phoenix dactylifera) in the prevention of diseases via modulation of anti-inflammatory, anti-oxidant and anti-tumour activity. Int. J. Clin. Exp. Med. 2014, 7, 483–491. [Google Scholar] [PubMed]
- Siddiqui, S.; Ahmad, R.; Khan, M.A.; Upadhyay, S.; Husain, I.; Srivastava, A.N. Cytostatic and Anti-tumor Potential of Ajwa Date Pulp against Human Hepatocellular Carcinoma HepG2 Cells. Sci. Rep. 2019, 9, 245. [Google Scholar] [CrossRef] [PubMed]
- Boulenouar, N.; Marouf, A.; Cheriti, A. Antifungal activity and phytochemical screening of extracts from Phoenix dactylifera L. cultivars. Nat. Prod. Res. 2011, 25, 1999–2002. [Google Scholar] [CrossRef] [PubMed]
- Nematallah, K.A.; Ayoub, N.A.; Abdelsattar, E.; Meselhy, M.R.; Elmazar, M.M.; El-Khatib, A.H.; Linscheid, M.W.; Hathout, R.M.; Godugu, K.; Adel, A.; et al. Polyphenols LC-MS2 profile of Ajwa date fruit (Phoenix dactylifera L.) and their microemulsion: Potential impact on hepatic fibrosis. J. Funct. Foods 2018, 49, 401–411. [Google Scholar] [CrossRef]
- Almusallam, I.A.; Mohamed Ahmed, I.A.; Babiker, E.E.; Al Juhaimi, F.Y.; Fadimu, G.J.; Osman, M.A.; Al Maiman, S.A.; Ghafoor, K.; Alqah, H.A.S. Optimization of ultrasound-assisted extraction of bioactive properties from date palm (Phoenix dactylifera L.) spikelets using response surface methodology. LWT 2021, 140, 110816. [Google Scholar] [CrossRef]
- Benkerrou, F.; Bachir bey, M.; Amrane, M.; Louaileche, H. Ultrasonic-assisted extraction of total phenolic contents from Phoenix dactylifera and evaluation of antioxidant activity: Statistical optimization of extraction process parameters. J. Food Meas. Charact. 2018, 12, 1910–1916. [Google Scholar] [CrossRef]
- Dahmoune, F.; Remini, H.; Dairi, S.; Aoun, O.; Moussi, K.; Bouaoudia-Madi, N.; Adjeroud, N.; Kadri, N.; Lefsih, K.; Boughani, L.; et al. Ultrasound assisted extraction of phenolic compounds from P. lentiscus L. leaves: Comparative study of artificial neural network (ANN) versus degree of experiment for prediction ability of phenolic compounds recovery. Ind. Crops Prod. 2015, 77, 251–261. [Google Scholar] [CrossRef]
- Aung, T.; Kim, S.J.; Eun, J.B. A hybrid RSM-ANN-GA approach on optimisation of extraction conditions for bioactive component-rich laver (Porphyra dentata) extract. Food Chem 2022, 366, 130689. [Google Scholar] [CrossRef] [PubMed]
- Qadir, R.; Anwar, F.; Naseem, K.; Tahir, M.H.; Alhumade, H. Enzyme-Assisted Extraction of Phenolics from Capparis spinosa Fruit: Modeling and Optimization of the Process by RSM and ANN. ACS Omega 2022, 7, 33031–33038. [Google Scholar] [CrossRef]
- Spiess, A.N.; Neumeyer, N. An evaluation of R2 as an inadequate measure for nonlinear models in pharmacological and biochemical research: A Monte Carlo approach. BMC Pharmacol. 2010, 10, 6. [Google Scholar] [CrossRef] [PubMed]
- Gu, Y.; Wei, H.-L.; Balikhin, M.M. Nonlinear predictive model selection and model averaging using information criteria. Syst. Sci. Control Eng. 2018, 6, 319–328. [Google Scholar] [CrossRef]
- Williams, A.O.F.; Akanbi, O.D. Statistical modeling and optimization of the bleachability of regenerated spent bleaching earth using response surface methodology and artificial neural networks with genetic algorithm. Chem. Prod. Process Model. 2022; in press. [Google Scholar] [CrossRef]
- Vrieze, S.I. Model selection and psychological theory: A discussion of the differences between the Akaike information criterion (AIC) and the Bayesian information criterion (BIC). Psychol. Methods 2012, 17, 228–243. [Google Scholar] [CrossRef]
- Rebollo-Hernanz, M.; Cañas, S.; Taladrid, D.; Segovia, Á.; Bartolomé, B.; Aguilera, Y.; Martín-Cabrejas, M.A. Extraction of phenolic compounds from cocoa shell: Modeling using response surface methodology and artificial neural networks. Sep. Purif. Technol. 2021, 270, 118779. [Google Scholar] [CrossRef]
- Choi, H.-J.; Naznin, M.; Alam, M.B.; Javed, A.; Alshammari, F.H.; Kim, S.; Lee, S.-H. Optimization of the extraction conditions of Nypa fruticans Wurmb. using response surface methodology and artificial neural network. Food Chem. 2022, 381, 132086. [Google Scholar] [CrossRef]
- Xu, S.; Li, X.; Liu, S.; Tian, P.; Li, D. Juniperus sabina L. as a Source of Podophyllotoxins: Extraction Optimization and Anticholinesterase Activities. Int. J. Mol. Sci. 2022, 23, 10205. [Google Scholar] [CrossRef]
- Huang, S.-M.; Kuo, C.-H.; Chen, C.-A.; Liu, Y.-C.; Shieh, C.-J. RSM and ANN modeling-based optimization approach for the development of ultrasound-assisted liposome encapsulation of piceid. Ultrason. Sonochemistry 2017, 36, 112–122. [Google Scholar] [CrossRef]
- Kuo, C.-H.; Liu, T.-A.; Chen, J.-H.; Chang, C.-M.J.; Shieh, C.-J. Response surface methodology and artificial neural network optimized synthesis of enzymatic 2-phenylethyl acetate in a solvent-free system. Biocatal. Agric. Biotechnol. 2014, 3, 1–6. [Google Scholar] [CrossRef]
- Javed, A.; Naznin, M.; Alam, M.B.; Fanar, A.; Song, B.-R.; Kim, S.; Lee, S.-H. Metabolite Profiling of Microwave-Assisted Sargassum fusiforme Extracts with Improved Antioxidant Activity Using Hybrid Response Surface Methodology and Artificial Neural Networking-Genetic Algorithm. Antioxidants 2022, 11, 2246. [Google Scholar] [CrossRef]
- Aklilu, E.G.; Adem, A.; Kasirajan, R.; Ahmed, Y. Artificial neural network and response surface methodology for modeling and optimization of activation of lactoperoxidase system. South Afr. J. Chem. Eng. 2021, 37, 12–22. [Google Scholar] [CrossRef]
- Xi, J.; Wang, B. Optimization of Ultrahigh-Pressure Extraction of Polyphenolic Antioxidants from Green Tea by Response Surface Methodology. Food Bioprocess Technol. 2013, 6, 2538–2546. [Google Scholar] [CrossRef]
- Do, Q.D.; Angkawijaya, A.E.; Tran-Nguyen, P.L.; Huynh, L.H.; Soetaredjo, F.E.; Ismadji, S.; Ju, Y.H. Effect of extraction solvent on total phenol content, total flavonoid content, and antioxidant activity of Limnophila aromatica. J. Food Drug Anal. 2014, 22, 296–302. [Google Scholar] [CrossRef] [PubMed]
- Zhu, K.-X.; Lian, C.-X.; Guo, X.-N.; Peng, W.; Zhou, H.-M. Antioxidant activities and total phenolic contents of various extracts from defatted wheat germ. Food Chem. 2011, 126, 1122–1126. [Google Scholar] [CrossRef]
- Derrien, M.; Badr, A.; Gosselin, A.; Desjardins, Y.; Angers, P. Optimization of a green process for the extraction of lutein and chlorophyll from spinach by-products using response surface methodology (RSM). LWT—Food Sci. Technol. 2017, 79, 170–177. [Google Scholar] [CrossRef]
- Schymanski, E.L.; Jeon, J.; Gulde, R.; Fenner, K.; Ruff, M.; Singer, H.P.; Hollender, J. Identifying small molecules via high resolution mass spectrometry: Communicating confidence. Environ. Sci. Technol. 2014, 48, 2097–2098. [Google Scholar] [CrossRef] [PubMed]
- Ostrowski, W.; Wojakowska, A.; Grajzer, M.; Stobiecki, M. Mass spectrometric behavior of phenolic acids standards and their analysis in the plant samples with LC/ESI/MS system. J. Chromatogr. B Anal. Technol. Biomed. Life Sci. 2014, 967, 21–27. [Google Scholar] [CrossRef]
- Najm, O.A.; Addnan, F.H.; Mohd-Manzor, N.F.; Elkadi, M.A.; Abdullah, W.O.; Ismail, A.; Mansur, F.A.F. Identification of Phytochemicals of Phoenix dactylifera L. Cv Ajwa with UHPLC-ESI-QTOF-MS/MS. Int. J. Fruit Sci. 2021, 21, 848–867. [Google Scholar] [CrossRef]
- Zeng, X.; Wang, Y.; Qiu, Q.; Jiang, C.; Jing, Y.; Qiu, G.; He, X. Bioactive phenolics from the fruits of Livistona chinensis. Fitoterapia 2012, 83, 104–109. [Google Scholar] [CrossRef]
- Li, F.; Yan, T.T.; Fu, Y.Y.; Zhang, N.L.; Wang, L.; Zhang, Y.B.; Du, J.; Liu, J.F. New phenylpropanoid glycosides from Illicium majus and their radical scavenging activities. Chem. Biodivers. 2021, 18, e2001012. [Google Scholar] [CrossRef] [PubMed]
- Nam, S.-H.; Kim, Y.-M.; Walsh, M.K.; Wee, Y.-J.; Yang, K.-Y.; Ko, J.-A.; Han, S.; Thanh Hanh Nguyen, T.; Kim, J.Y.; Kim, D. Synthesis and functional characterization of caffeic acid glucoside using Leuconostoc mesenteroides dextransucrase. J. Agric. Food Chem. 2017, 65, 2743–2750. [Google Scholar] [CrossRef] [PubMed]
- Tsagkarakou, A.S.; Chasapi, S.A.; Koulas, S.M.; Tsialtas, I.; Kyriakis, E.; Drakou, C.E.; Kun, S.; Somsák, L.; Spyroulias, G.A.; Psarra, A.-M.G.; et al. Structure activity relationship of the binding of p-coumaroyl glucose to glycogen phosphorylase and its effect on hepatic cell metabolic pathways. Eur. J. Med. Chem. Rep. 2021, 3, 100011. [Google Scholar] [CrossRef]
- Błaszczak, W.; Jeż, M.; Szwengiel, A. Polyphenols and inhibitory effects of crude and purified extracts from tomato varieties on the formation of advanced glycation end products and the activity of angiotensin-converting and acetylcholinesterase enzymes. Food Chem. 2020, 314, 126181. [Google Scholar] [CrossRef]
- Wang, H.; Zhao, W.; Choomuenwai, V.; Andrews, K.T.; Quinn, R.J.; Feng, Y. Chemical investigation of an antimalarial Chinese medicinal herb Picrorhiza scrophulariiflora. Bioorganic Med. Chem. Lett. 2013, 23, 5915–5918. [Google Scholar] [CrossRef]
- Naznin, M.; Badrul Alam, M.; Alam, R.; Islam, S.; Rakhmat, S.; Lee, S.-H.; Kim, S. Metabolite profiling of Nymphaea rubra (Burm. f.) flower extracts using cyclic ion mobility–mass spectrometry and their associated biological activities. Food Chem. 2023, 404, 134544. [Google Scholar] [CrossRef] [PubMed]
- Alam, M.B.; Naznin, M.; Islam, S.; Alshammari, F.H.; Choi, H.J.; Song, B.R.; Kim, S.; Lee, S.H. High Resolution Mass Spectroscopy-Based Secondary Metabolite Profiling of Nymphaea nouchali (Burm. f) Stem Attenuates Oxidative Stress via Regulation of MAPK/Nrf2/HO-1/ROS Pathway. Antioxidants 2021, 10, 719. [Google Scholar] [CrossRef]
- Salehi, B.; Machin, L.; Monzote, L.; Sharifi-Rad, J.; Ezzat, S.M.; Salem, M.A.; Merghany, R.M.; El Mahdy, N.M.; Kılıç, C.S.; Sytar, O.; et al. Therapeutic Potential of Quercetin: New Insights and Perspectives for Human Health. ACS Omega 2020, 5, 11849–11872. [Google Scholar] [CrossRef]
- Aboulaghras, S.; Sahib, N.; Bakrim, S.; Benali, T.; Charfi, S.; Guaouguaou, F.E.; Omari, N.E.; Gallo, M.; Montesano, D.; Zengin, G.; et al. Health Benefits and Pharmacological Aspects of Chrysoeriol. Pharmaceuticals 2022, 15, 973. [Google Scholar] [CrossRef]
- Kachlicki, P.; Piasecka, A.; Stobiecki, M.; Marczak, Ł. Structural Characterization of Flavonoid Glycoconjugates and Their Derivatives with Mass Spectrometric Techniques. Molecules 2016, 21, 1494. [Google Scholar] [CrossRef]
- Vukics, V.; Guttman, A. Structural characterization of flavonoid glycosides by multi-stage mass spectrometry. Mass Spectrom. Rev. 2010, 29, 1–16. [Google Scholar] [CrossRef] [PubMed]
- Li, X.; Jiang, Q.; Wang, T.; Liu, J.; Chen, D. Comparison of the Antioxidant Effects of Quercitrin and Isoquercitrin: Understanding the Role of the 6″-OH Group. Molecules 2016, 21, 1246. [Google Scholar] [CrossRef] [PubMed]
- Choi, J.S.; Jung, M.J.; Park, H.J.; Chung, H.Y.; Kang, S.S. Further isolation of peroxynitrite and 1,1-diphenyl-2-picrylhydrazyl radical scavenging isorhamnetin 7-O-glucoside from the leaves of Brassica juncea L. Arch. Pharmacal Res. 2002, 25, 625–627. [Google Scholar] [CrossRef] [PubMed]
- Delazar, A.; Sabzevari, A.; Mojarrab, M.; Nazemiyeh, H.; Esnaashari, S.; Nahar, L.; Razavi, S.M.; Sarker, S.D. Free-radical-scavenging principles from Phlomis caucasica. J. Nat. Med. 2008, 62, 464–466. [Google Scholar] [CrossRef]
- Hyun, S.K.; Jung, Y.J.; Chung, H.Y.; Jung, H.A.; Choi, J.S. Isorhamnetin glycosides with free radical and ONOO-scavenging activities from the stamens of Nelumbo nucifera. Arch. Pharmacal Res. 2006, 29, 287–292. [Google Scholar] [CrossRef]
- Nakamura, Y.; Watanabe, S.; Miyake, N.; Kohno, H.; Osawa, T. Dihydrochalcones: Evaluation as novel radical scavenging antioxidants. J. Agric. Food Chem. 2003, 51, 3309–3312. [Google Scholar] [CrossRef]
- Nguyen, T.H.H.; Woo, S.-M.; Nguyen, N.A.; Cha, G.-S.; Yeom, S.-J.; Kang, H.-S.; Yun, C.-H. Regioselective Hydroxylation of Naringin Dihydrochalcone to Produce Neoeriocitrin Dihydrochalcone by CYP102A1 (BM3) Mutants. Catalysts 2020, 10, 823. [Google Scholar] [CrossRef]
- Kim, S.; Lee, E.Y.; Hillman, P.F.; Ko, J.; Yang, I.; Nam, S.J. Chemical Structure and Biological Activities of Secondary Metabolites from Salicornia europaea L. Molecules 2021, 26, 2252. [Google Scholar] [CrossRef]
- Limongelli, F.; Crupi, P.; Clodoveo, M.L.; Corbo, F.; Muraglia, M. Overview of the Polyphenols in Salicornia: From Recovery to Health-Promoting Effect. Molecules 2022, 27, 7954. [Google Scholar] [CrossRef]
- Minami, A.; Fujita, Y.; Shimba, S.; Shiratori, M.; Kaneko, Y.K.; Sawatani, T.; Otsubo, T.; Ikeda, K.; Kanazawa, H.; Mikami, Y.; et al. The sialidase inhibitor 2,3-dehydro-2-deoxy-N-acetylneuraminic acid is a glucose-dependent potentiator of insulin secretion. Sci. Rep. 2020, 10, 5198. [Google Scholar] [CrossRef]
- Kang, L.-J.; Oh, E.; Cho, C.; Kwon, H.; Lee, C.-G.; Jeon, J.; Lee, H.; Choi, S.; Han, S.J.; Nam, J.; et al. 3′-Sialyllactose prebiotics prevents skin inflammation via regulatory T cell differentiation in atopic dermatitis mouse models. Sci. Rep. 2020, 10, 5603. [Google Scholar] [CrossRef] [PubMed]
- Perdijk, O.; Van Baarlen, P.; Fernandez-Gutierrez, M.M.; Van den Brink, E.; Schuren, F.H.; Brugman, S.; Savelkoul, H.F.; Kleerebezem, M.; Van Neerven, R.J. Sialyllactose and galactooligosaccharides promote epithelial barrier functioning and distinctly modulate microbiota composition and short chain fatty acid production in vitro. Front. Immunol. 2019, 10, 94. [Google Scholar] [CrossRef] [PubMed]
- Jeon, J.; Kang, L.J.; Lee, K.M.; Cho, C.; Song, E.K.; Kim, W.; Park, T.J.; Yang, S. 3′-Sialyllactose protects against osteoarthritic development by facilitating cartilage homeostasis. J. Cell. Mol. Med. 2018, 22, 57–66. [Google Scholar] [CrossRef] [PubMed]
- Domingo-Almenara, X.; Guijas, C.; Billings, E.; Montenegro-Burke, J.R.; Uritboonthai, W.; Aisporna, A.E.; Chen, E.; Benton, H.P.; Siuzdak, G. The METLIN small molecule dataset for machine learning-based retention time prediction. Nat. Commun. 2019, 10, 5811. [Google Scholar] [CrossRef] [PubMed]
- Wang, F.; Liigand, J.; Tian, S.; Arndt, D.; Greiner, R.; Wishart, D.S. CFM-ID 4.0: More Accurate ESI-MS/MS Spectral Prediction and Compound Identification. Anal. Chem. 2021, 93, 11692–11700. [Google Scholar] [CrossRef]
- Naveja, J.J.; Rico-Hidalgo, M.P.; Medina-Franco, J.L. Analysis of a large food chemical database: Chemical space, diversity, and complexity. F1000Research 2018, 7, 993. [Google Scholar] [CrossRef]
- Šudomová, M.; Hassan, S.T.S.; Khan, H.; Rasekhian, M.; Nabavi, S.M. A Multi-Biochemical and In Silico Study on Anti-Enzymatic Actions of Pyroglutamic Acid against PDE-5, ACE, and Urease Using Various Analytical Techniques: Unexplored Pharmacological Properties and Cytotoxicity Evaluation. Biomolecules 2019, 9, 392. [Google Scholar] [CrossRef]
- Alam, M.B.; Ahmed, A.; Islam, S.; Choi, H.J.; Motin, M.A.; Kim, S.; Lee, S.H. Phytochemical Characterization of Dillenia indica L. Bark by Paper Spray Ionization-Mass Spectrometry and Evaluation of Its Antioxidant Potential Against t-BHP-Induced Oxidative Stress in RAW 264.7 Cells. Antioxidants 2020, 9, 1099. [Google Scholar] [CrossRef]
- Swapana, N.; Noji, M.; Nishiuma, R.; Izumi, M.; Imagawa, H.; Kasai, Y.; Okamoto, Y.; Iseki, K.; Singh, C.B.; Asakawa, Y.; et al. A New Diphenyl Ether Glycoside from Xylosma longifolium Collected from North-East India. Nat. Prod. Commun. 2017, 12, 1934578X1701200832. [Google Scholar] [CrossRef]
- Haewpetch, P.; Rudeekulthamrong, P.; Kaulpiboon, J. Enzymatic Synthesis of Maltitol and Its Inhibitory Effect on the Growth of Streptococcus mutans DMST 18777. Biomolecules 2022, 12, 167. [Google Scholar] [CrossRef]
- Gao, K.; Zheng, C.; Wang, T.; Zhao, H.; Wang, J.; Wang, Z.; Zhai, X.; Jia, Z.; Chen, J.; Zhou, Y.; et al. 1-Deoxynojirimycin: Occurrence, Extraction, Chemistry, Oral Pharmacokinetics, Biological Activities and In Silico Target Fishing. Molecules 2016, 21, 1600. [Google Scholar] [CrossRef] [PubMed]
Disclaimer/Publisher’s Note: The statements, opinions and data contained in all publications are solely those of the individual author(s) and contributor(s) and not of MDPI and/or the editor(s). MDPI and/or the editor(s) disclaim responsibility for any injury to people or property resulting from any ideas, methods, instructions or products referred to in the content. |
© 2023 by the authors. Licensee MDPI, Basel, Switzerland. This article is an open access article distributed under the terms and conditions of the Creative Commons Attribution (CC BY) license (https://creativecommons.org/licenses/by/4.0/).