
Impact of Vitamin D Supplementation on the Clinical Outcomes and Epigenetic Markers in Patients with Acute Coronary Syndrome


Abstract
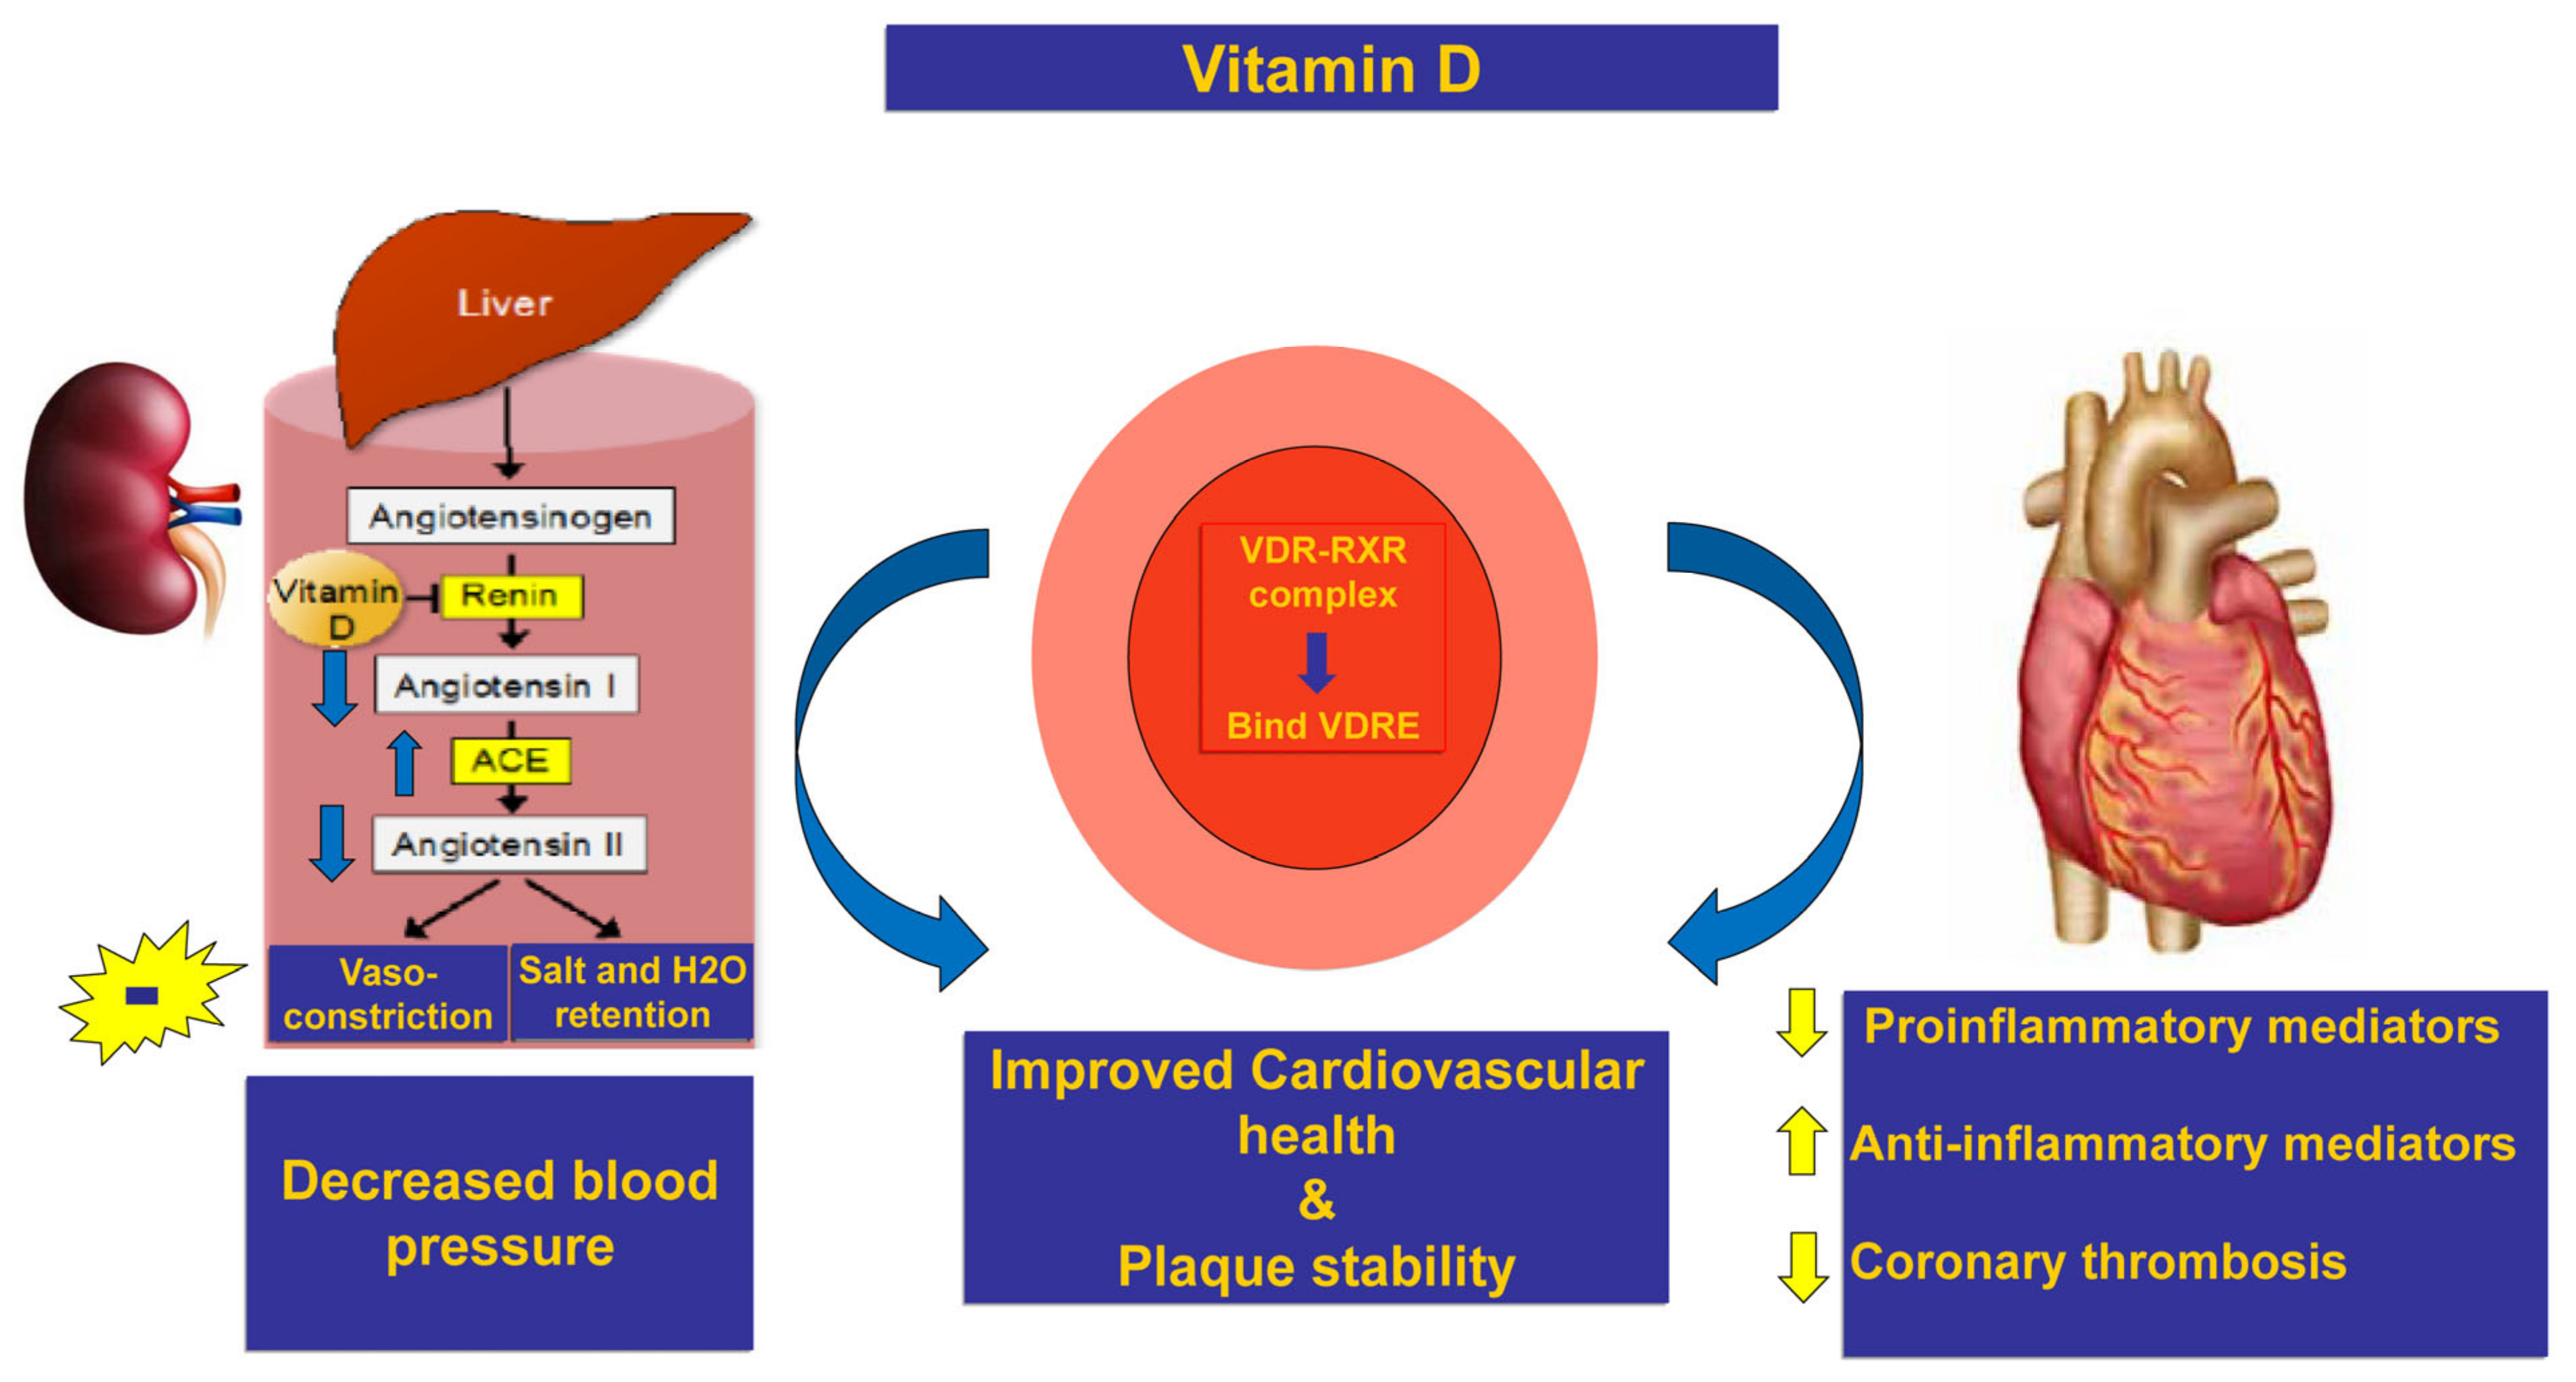
1. Introduction
2. Results
2.1. Change in Biochemical Parameters, Cardiac Markers, and Non-Coding RNA between Both Groups
2.2. Change in Echocardiographic Findings and HF and MACE Occurrence between Both Groups
2.3. Patterns of Prevalence of the Tested Polymorphisms in the Study Population and among Both Groups
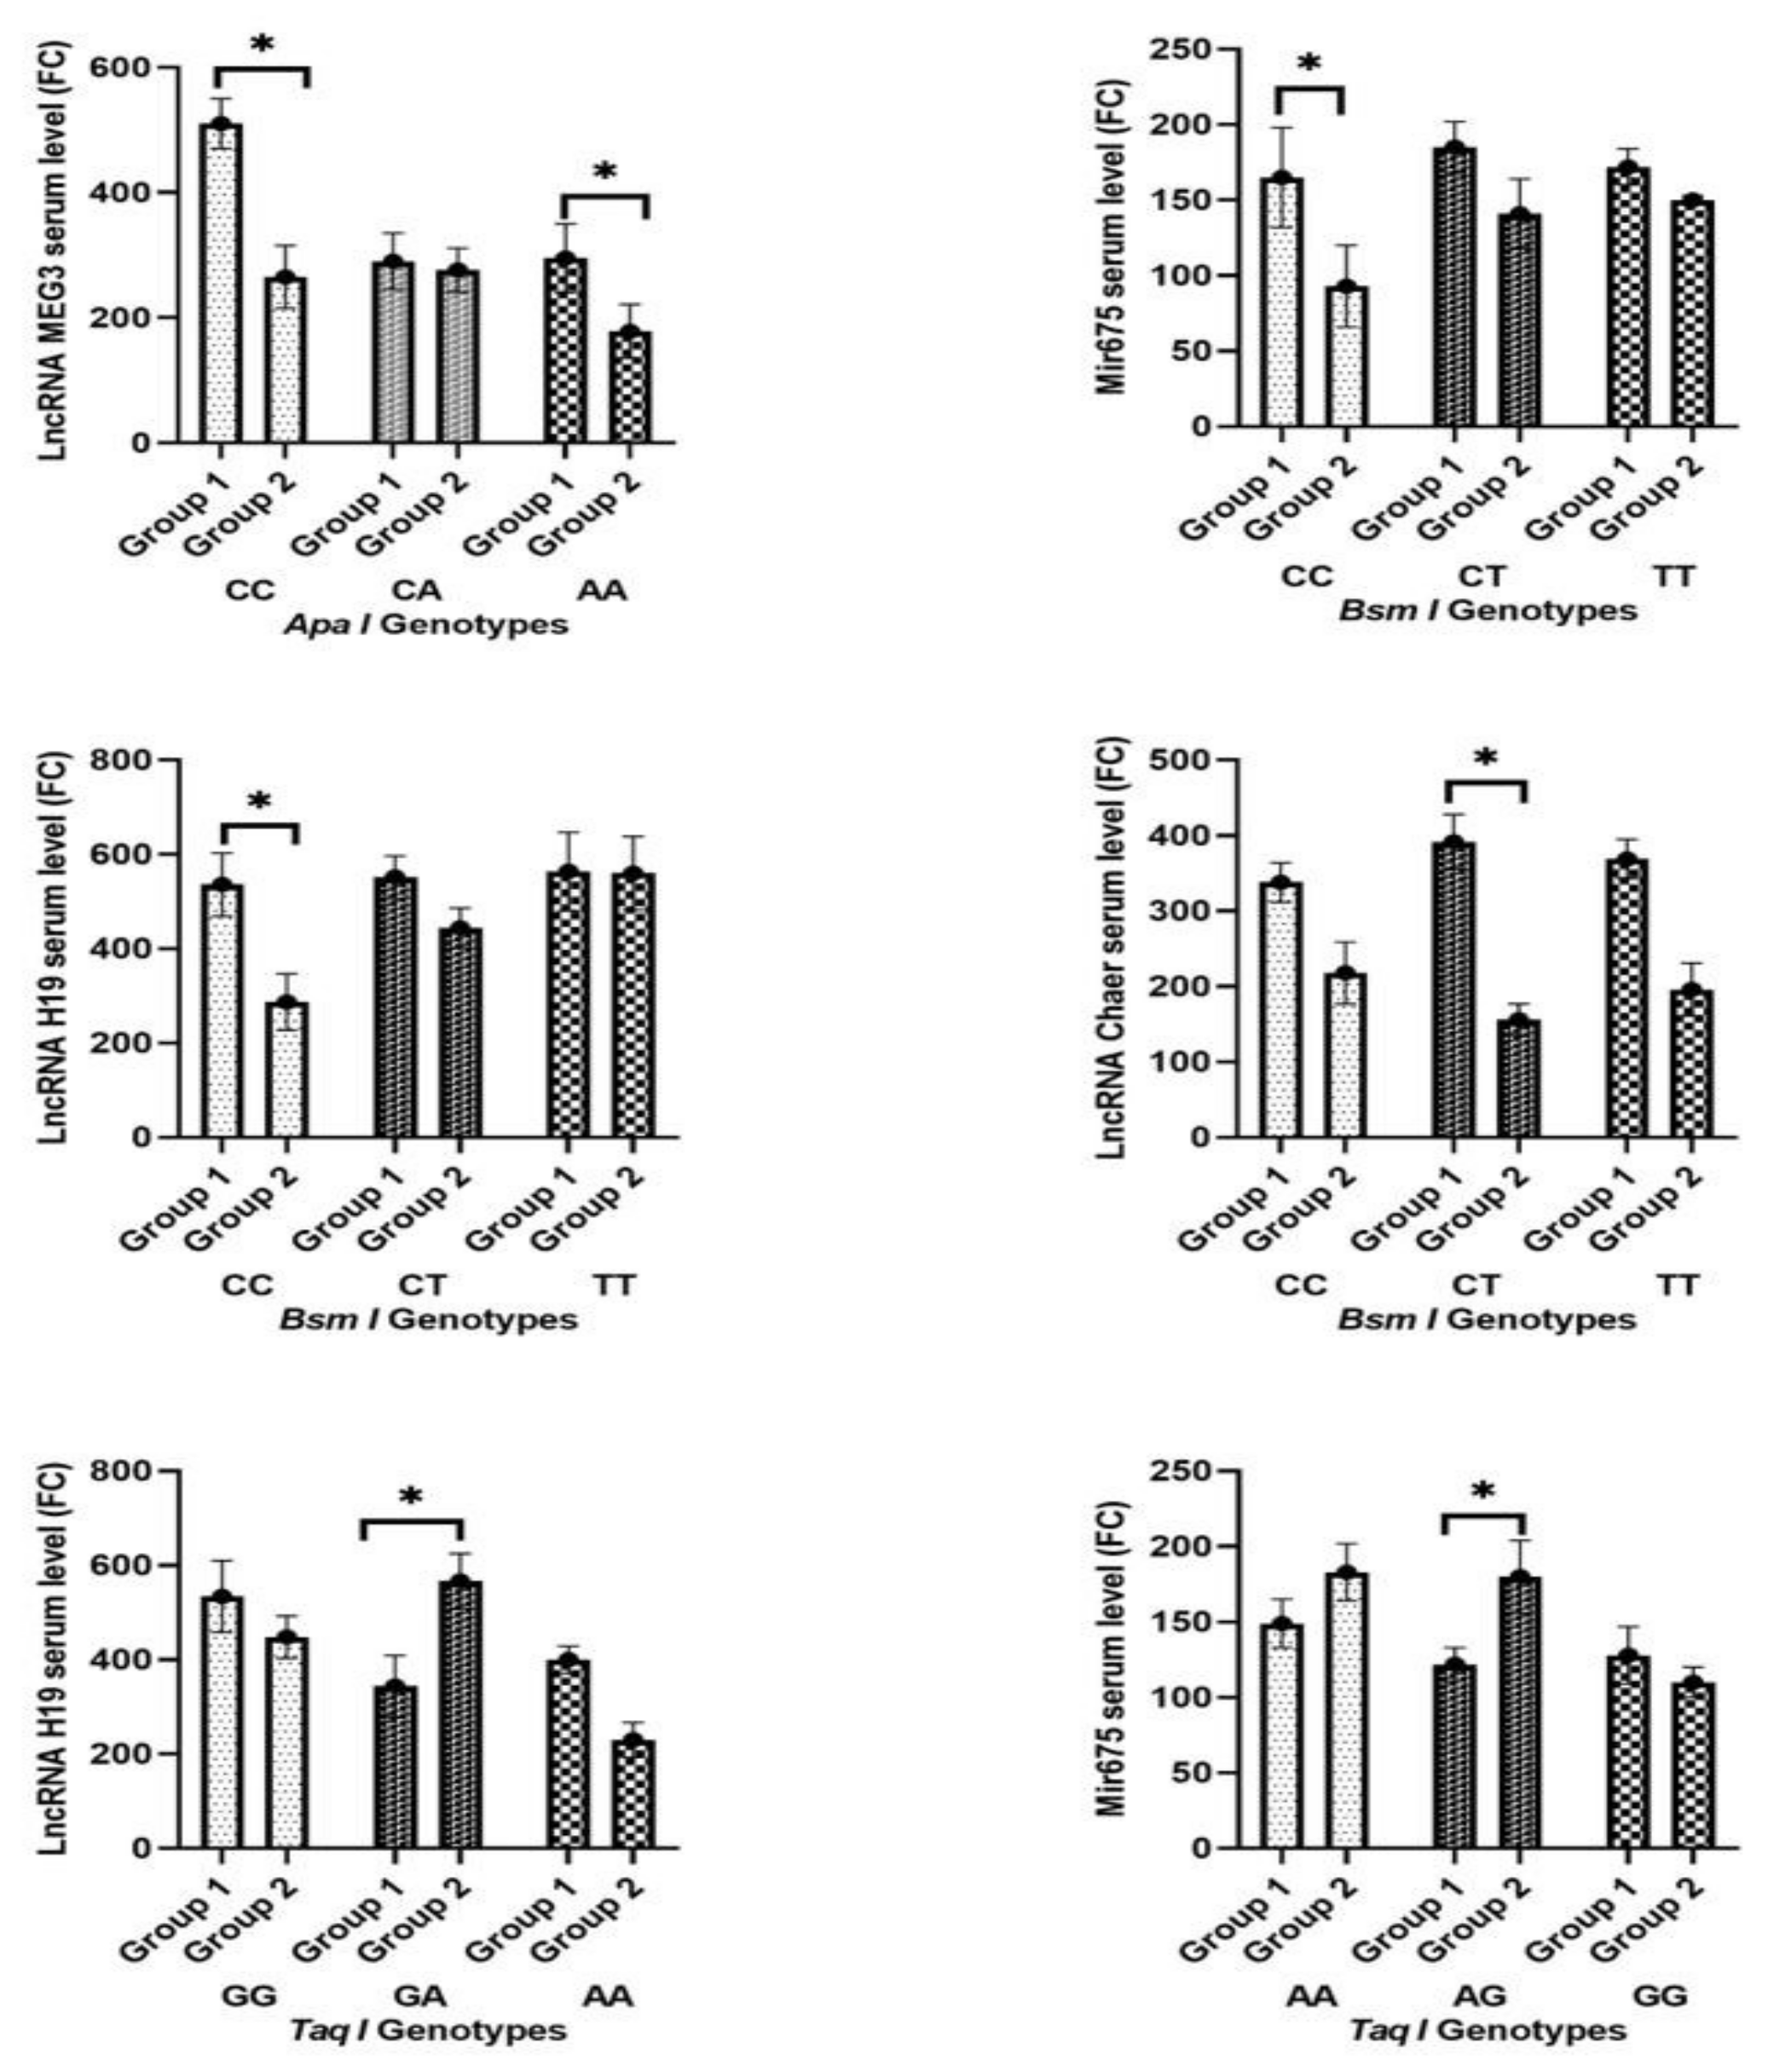
2.4. Impact of Tested Single-Nucleotide Polymorphisms on Susceptibility to Heart Failure and MACE
2.5. Correlation Analysis among Cardiac Markers and Non-Coding RNA Serum Levels (Pearson Correlation)
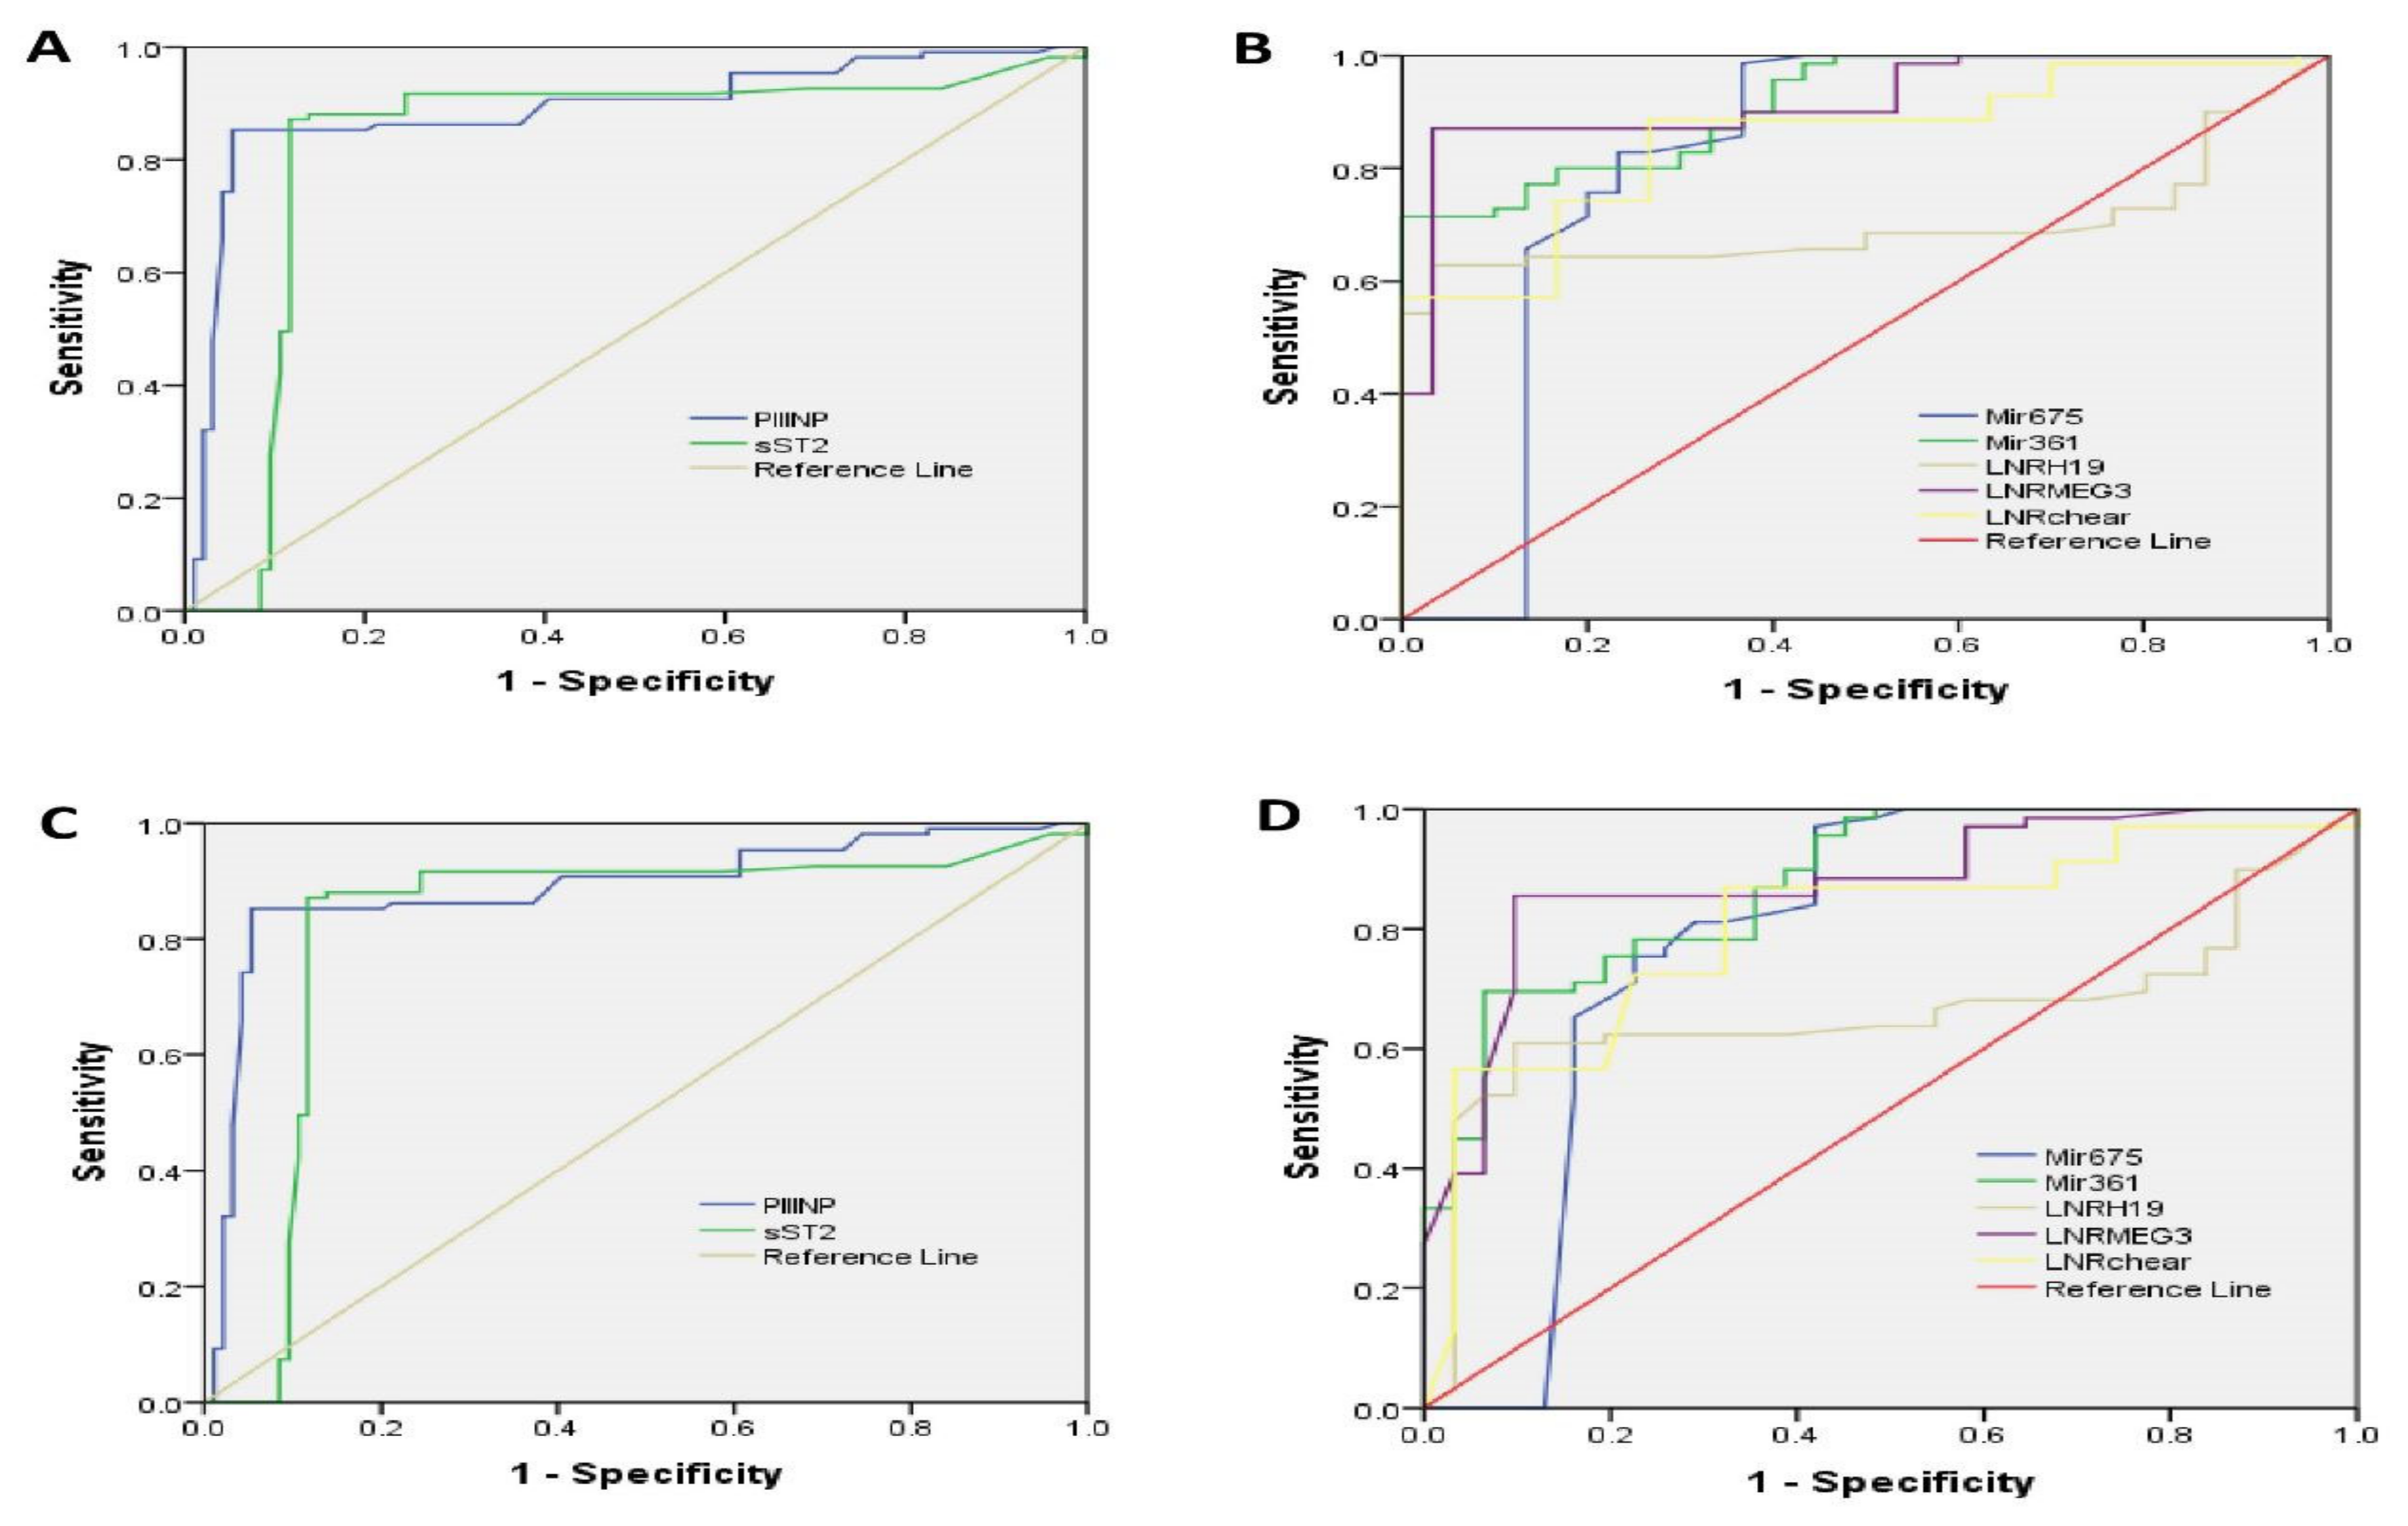
2.6. ROC Curve Analysis
2.7. Multiple Regression Analysis to Detect Clinical and Genetic Predictor Variables of Vitamin D Response among ACS Patients
3. Discussion
4. Materials and Methods
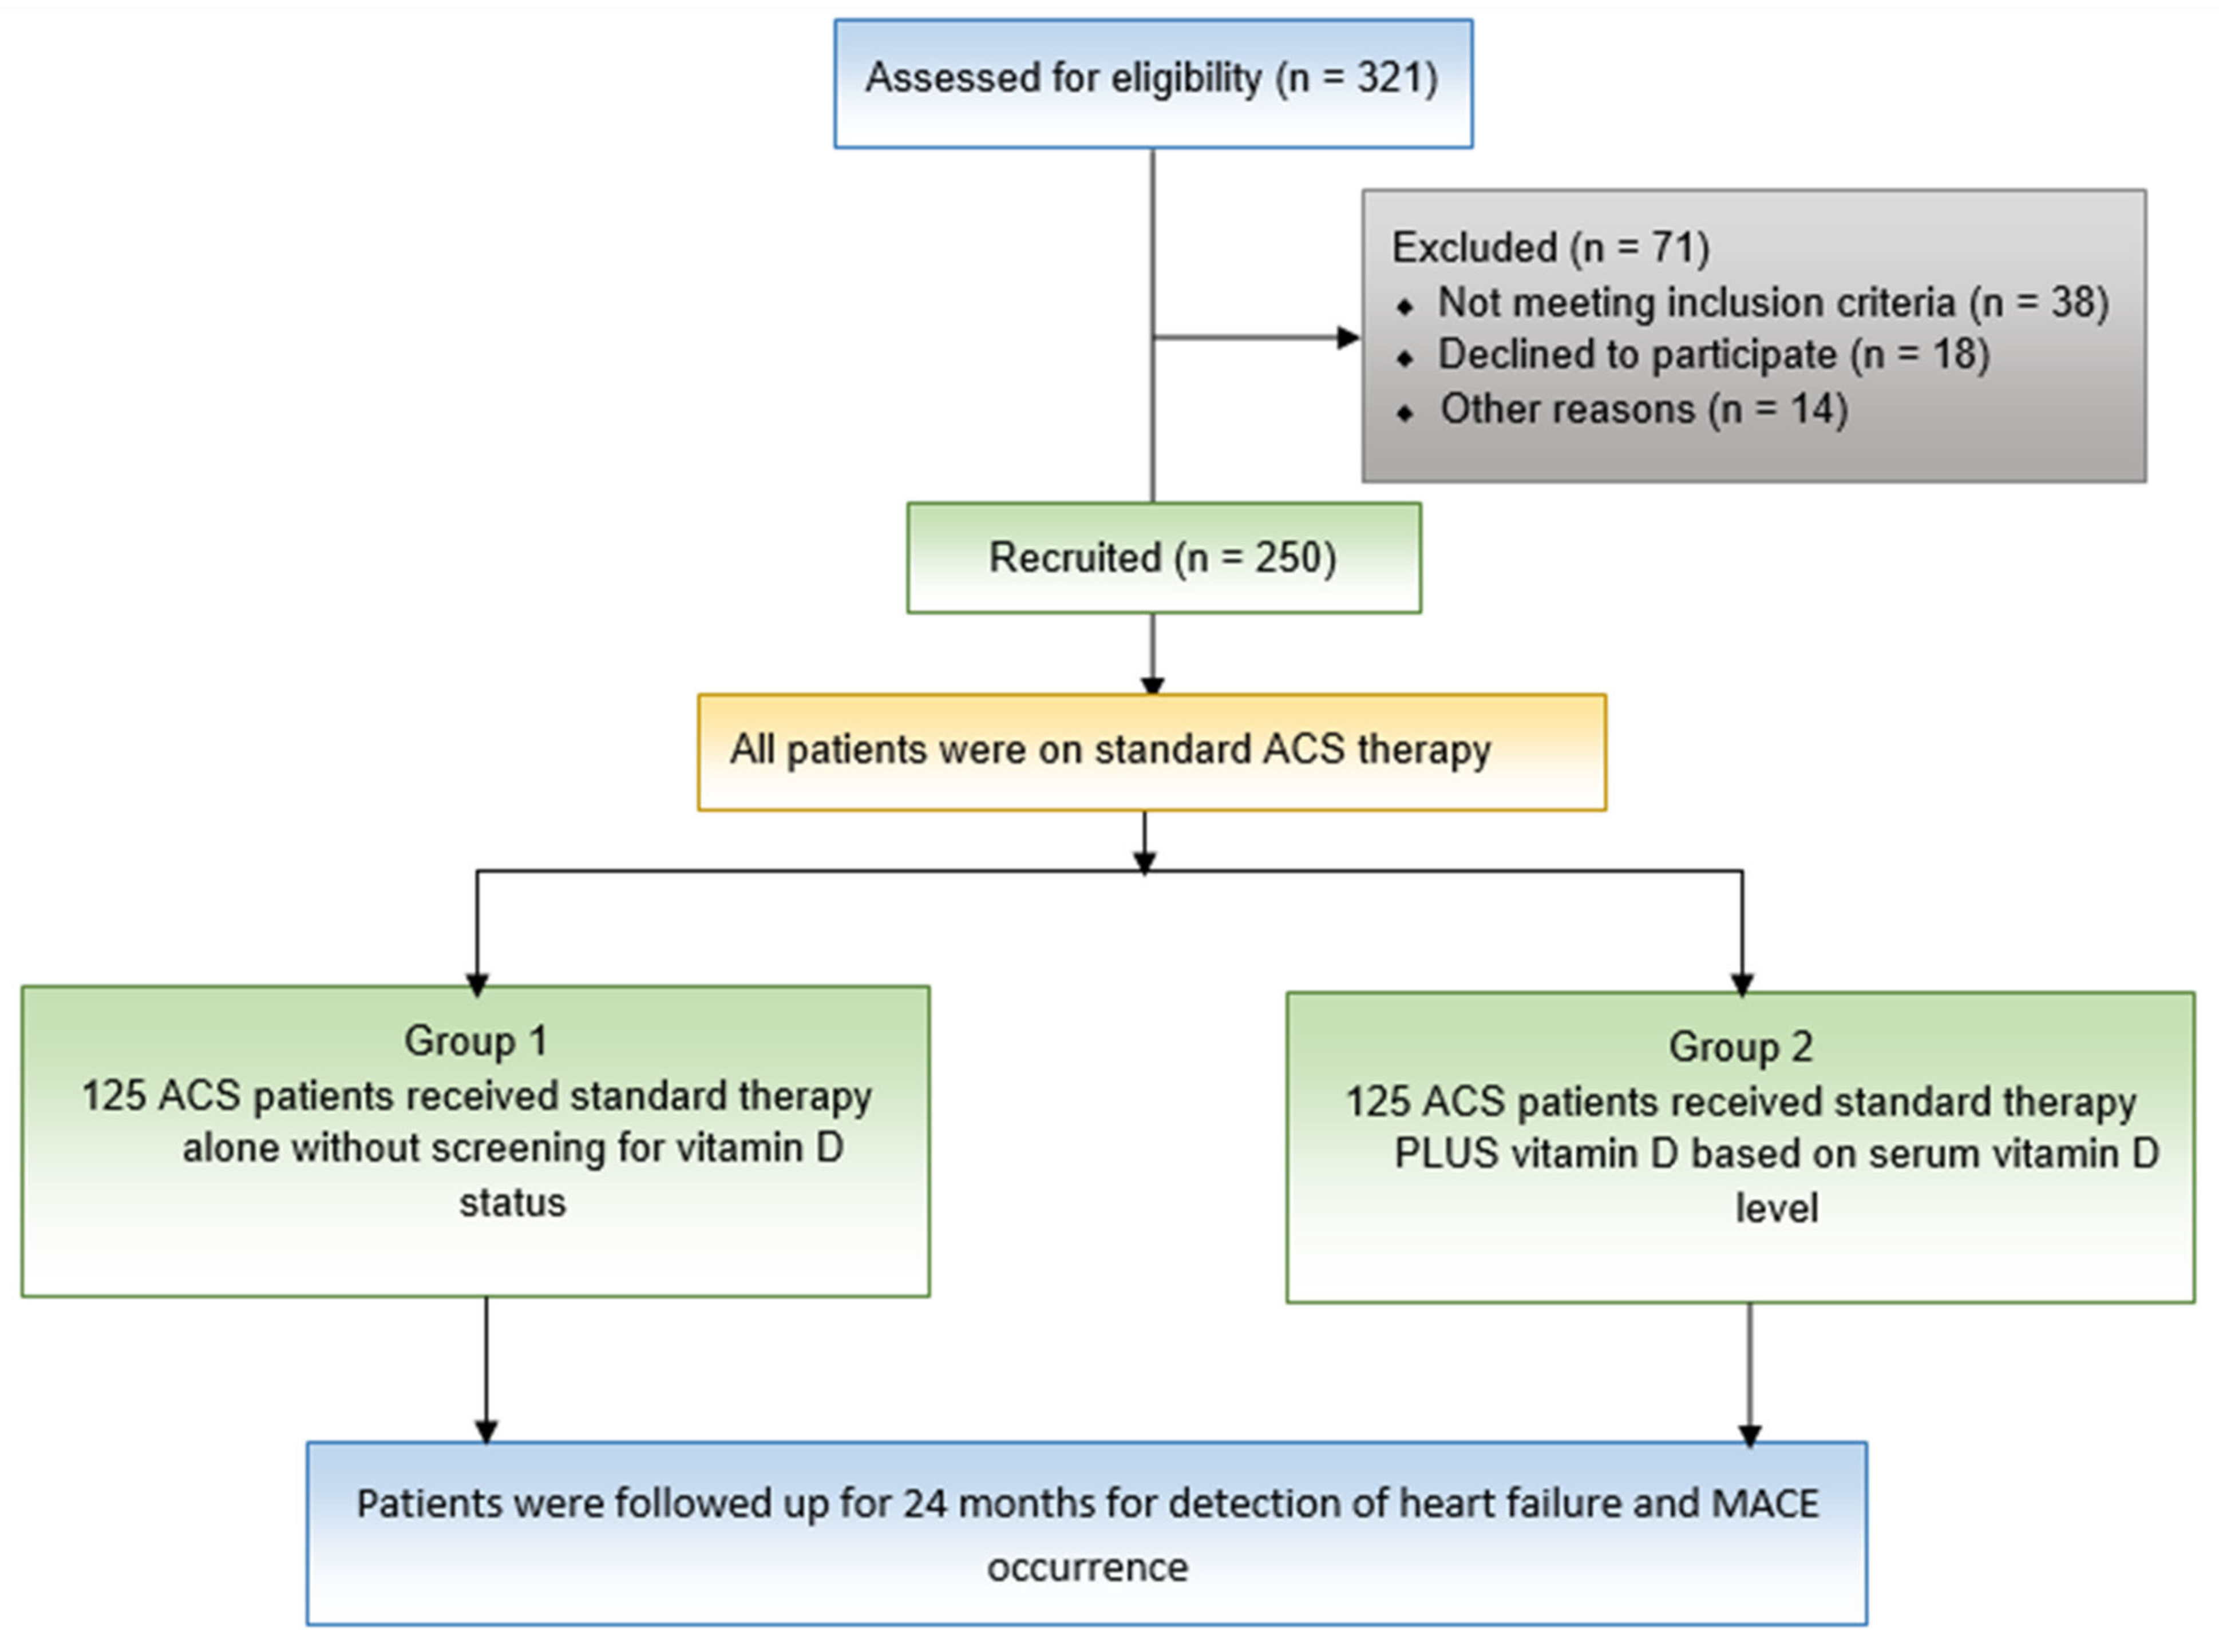
4.1. Study Design and Patients
4.2. Procedures
4.3. Serum Total RNA Extraction Including miRNAs and lncRNAs
4.4. Genotyping Procedure
4.5. Statistical Analysis
5. Conclusions
Supplementary Materials
Author Contributions
Funding
Institutional Review Board Statement
Informed Consent Statement
Data Availability Statement
Conflicts of Interest
References
- Thygesen, K.; Alpert, J.S.; Jaffe, A.S.; Chaitman, B.R.; Bax, J.J.; Morrow, D.A.; White, H.D.; Executive Group on behalf of the Joint European Society of Cardiology (ESC)/American College of Cardiology (ACC)/American Heart Association (AHA)/World Heart Federation (WHF) Task Force for the Universal Definition of Myocardial Infarction, 2018. Fourth universal definition of myocardial infarction. J. Am. Coll. Cardiol. 2018, 72, 2231–2264. [Google Scholar] [CrossRef]
- Basit, H.; Malik, A.; Huecker, M.R. Non ST segment elevation myocardial infarction. In InStatPearls; StatPearls Publishing: Tampa, FL, USA, 2022. [Google Scholar]
- Tsao, C.W.; Aday, A.W.; Almarzooq, Z.I.; Alonso, A.; Beaton, A.Z.; Bittencourt, M.S.; Boehme, A.K.; Buxton, A.E.; Carson, A.P.; Commodore-Mensah, Y.; et al. Heart disease and stroke statistics—2022 update: A report from the American Heart Association. Circulation 2022, 145, e153–e639. [Google Scholar] [CrossRef] [PubMed]
- Santoro, D.; Caccamo, D.; Lucisano, S.; Buemi, M.; Sebekova, K.; Teta, D.; De Nicola, L. Interplay of vitamin D, erythropoiesis, and the renin-angiotensin system. BioMed Res. Int. 2015, 2015, 145828. [Google Scholar] [CrossRef] [PubMed]
- Condoleo, V.; Pelaia, C.; Armentaro, G.; Severini, G.; Clausi, E.; Cassano, V.; Miceli, S.; Fiorentino, T.V.; Succurro, E.; Arturi, F.; et al. Role of Vitamin D in Cardiovascular Diseases. Endocrines 2021, 2, 417–426. [Google Scholar] [CrossRef]
- Cosentino, N.; Campodonico, J.; Milazzo, V.; De Metrio, M.; Brambilla, M.; Camera, M.; Marenzi, G. Vitamin D and cardiovascular disease: Current evidence and future perspectives. Nutrients 2021, 13, 3603. [Google Scholar] [CrossRef] [PubMed]
- Li, Y.C. Molecular mechanism of vitamin D in the cardiovascular system. J. Investig. Med. 2011, 59, 868–871. [Google Scholar] [CrossRef]
- Li, Y.C.; Kong, J.; Wei, M.; Chen, Z.F.; Liu, S.Q.; Cao, L.P. 1, 25-Dihydroxyvitamin D 3 is a negative endocrine regulator of the renin-angiotensin system. J. Clin. Investig. 2002, 110, 229–238. [Google Scholar] [CrossRef] [PubMed]
- Uitterlinden, A.G.; Fang, Y.; Van Meurs, J.B.; Pols, H.A.; Van Leeuwen, J.P. Genetics and biology of vitamin D receptor polymorphisms. Gene 2004, 338, 143–156. [Google Scholar] [CrossRef]
- Yang, C.; Li, J.; Li, Y.; Wu, D.; Sui, C.; Jiang, Y.; Meng, F. The vitamin D receptor gene ApaI polymorphism is associated with increased risk of renal cell carcinoma in Chinese population. Sci. Rep. 2016, 6, 25987. [Google Scholar] [CrossRef]
- Batista, P.J.; Chang, H.Y. Long noncoding RNAs: Cellular address codes in development and disease. Cell 2013, 152, 1298–1307. [Google Scholar] [CrossRef]
- Kumarswamy, R.; Thum, T. Non-coding RNAs in cardiac remodeling and heart failure. Circ. Res. 2013, 113, 676–689. [Google Scholar] [CrossRef] [PubMed]
- Verdoia, M.; Nardin, M.; Rolla, R.; Negro, F.; Gioscia, R.; Afifeh, A.M.; Viglione, F.; Suryapranata, H.; Marcolongo, M.; De Luca, G.; et al. Vitamin D levels condition the outcome benefits of renin-angiotensin system inhibitors (RASI) among patients undergoing percutaneous coronary intervention. Pharmacol. Res. 2020, 160, 105158. [Google Scholar] [CrossRef] [PubMed]
- Hobuß, L.; Bär, C.; Thum, T. Long Non-coding RNAs: At the Heart of Cardiac Dysfunction? Front. Physiol. 2019, 10, 30. [Google Scholar] [CrossRef] [PubMed]
- Nair, R.; Maseeh, A. Vitamin D: The “sunshine” vitamin. J. Pharmacol. Pharmacother. 2012, 3, 118–126. [Google Scholar] [PubMed]
- Castro, L.C. O sistema endocrinológico vitamina D [The vitamin D endocrine system]. Arq. Bras. De Endocrinol. E Metabol. 2011, 55, 566–575. [Google Scholar] [CrossRef]
- Carlberg, C. Vitamin D: A Micronutrient Regulating Genes. Curr. Pharm. Des. 2019, 25, 1740–1746. [Google Scholar] [CrossRef]
- Carlberg, C. Nutrigenomics of Vitamin D. Nutrients 2019, 11, 676. [Google Scholar] [CrossRef]
- Han, J.; Zhang, X.; Saraf, S.L.; Gowhari, M.; Molokie, R.E.; Hassan, J.; Jain, S.; Shah, B.N.; Abbasi, T.; Machado, R.F.; et al. Risk factors for vitamin D deficiency in sickle cell disease. Br. J. Haematol. 2018, 181, 828–835. [Google Scholar] [CrossRef]
- Lee, G.Y.; Park, C.Y.; Cha, K.S.; Lee, S.E.; Pae, M.; Han, S.N. Differential effect of dietary vitamin D supplementation on natural killer cell activity in lean and obese mice. J. Nutr. Biochem. 2018, 55, 178–184. [Google Scholar] [CrossRef]
- Anand, A.; Singh, S.; Sonkar, A.A.; Husain, N.; Singh, K.R.; Singh, S.; Kushwaha, J.K. Expression of vitamin D receptor and vitamin D status in patients with oral neoplasms and effect of vitamin D supplementation on quality of life in advanced cancer treatment. Contemp. Oncol. 2017, 21, 145–151. [Google Scholar] [CrossRef]
- Alomair, B.M.; Al-Kuraishy, H.M.; Al-Gareeb, A.I.; Al-Hamash, S.M.; De Waard, M.; Sabatier, J.M.; Saad, H.M.; El-Saber Batiha, G. Montelukast and Acute Coronary Syndrome: The Endowed Drug. Pharmaceuticals 2022, 15, 1147. [Google Scholar] [CrossRef] [PubMed]
- Al-Kuraishy, H.M.; Al-Gareeb, A.I.; Al-Buhadilly, A.K. Rosuvastatin Improves Vaspin Serum Levels in Obese Patients with Acute Coronary Syndrome. Diseases 2018, 6, 9. [Google Scholar] [CrossRef] [PubMed]
- Navarro-Valverde, C.; Quesada-Gómez, J.M.; Pérez-Cano, R.; Fernández-Palacín, A.; Pastor-Torres, L.F. Effect of calcifediol treatment on cardiovascular outcomes in patients with acute coronary syndrome and percutaneous revascularization. Med. Clín. 2018, 151, 345–352. [Google Scholar] [CrossRef]
- Judd, S.E.; Tangpricha, V. Vitamin D deficiency and risk for cardiovascular disease. Am. J. Med. Sci. 2009, 338, 40–44. [Google Scholar] [CrossRef]
- Kamal, Y.M.; Hasanin, H.A.; Abdel-All, Z. Study of vitamin D level in acute coronary syndrome. SVU-Int. J. Med. Sci. 2022, 5, 470–483. [Google Scholar] [CrossRef]
- Jabeen, S.; Khan, H.F.; Sarwar, S.; Ashfaq, M.; Zafar, A.; Aslam, U.; Hamid, S. Protective Effect of Vitamin-D Supplementation in Patients of Acute Coronary Syndrome During COVID-19 Pandemic. Pak. J. Med. Health Sci. 2022, 16, 1053. [Google Scholar]
- Jithesh, P.V.; Abuhaliqa, M.; Syed, N.; Ahmed, I.; El Anbari, M.; Bastaki, K.; Sherif, S.; Umlai, U.K.; Jan, Z.; Gandhi, G.; et al. A population study of clinically actionable genetic variation affecting drug response from the Middle East. NPJ Genom. Med. 2022, 7, 10. [Google Scholar] [CrossRef]
- Raljević, D.; Peršić, V.; Markova-Car, E.; Cindrić, L.; Miškulin, R.; Žuvić, M.; Kraljević Pavelić, S. Study of vitamin D receptor gene polymorphisms in a cohort of myocardial infarction patients with coronary artery disease. BMC Cardiovasc. Disord. 2021, 21, 188. [Google Scholar] [CrossRef]
- Schroeder, J.; Hamada, S.; Gründlinger, N.; Rubeau, T.; Altiok, E.; Ulbrich, K.; Keszei, A.; Marx, N.; Becker, M. Myocardial deformation by strain echocardiography identifies patients with acute coronary syndrome and non-diagnostic ECG presenting in a chest pain unit: A prospective study of diagnostic accuracy. Clin. Res. Cardiol. 2016, 1053, 248–256. [Google Scholar] [CrossRef]
- Jaffe, A.S.; Ravkilde, J.; Roberts, R.; Naslund, U.; Apple, F.S.; Galvani, M.; Katus, H. It’s time for a change to a troponin standard. Circulation 2000, 102, 1216–1220. [Google Scholar] [CrossRef]
- Zhong, Z.; Wu, H.; Zhong, W.; Zhang, Q.; Yu, Z. Expression profiling and bioinformatics analysis of circulating microRNAs in patients with acute myocardial infarction. J. Clin. Lab. Anal. 2020, 34, e23099. [Google Scholar] [CrossRef]
- Kasiske, B.L.; Israni, A.K.; Snyder, J.J.; Camarena, A. COST Investigators. Design considerations and feasibility for a clinical trial to examine coronary screening before kidney transplantation (COST). Am. J. Kidney Dis. 2011, 57, 908–916. [Google Scholar] [CrossRef] [PubMed]
- Du, Z.; Fei, T.; Verhaak, R.G.; Su, Z.; Zhang, Y.; Brown, M.; Chen, Y.; Liu, X.S. Integrative genomic analyses reveal clinically relevant long noncoding RNAs in human cancer. Nat. Struct. Mol. Biol. 2013, 20, 908–913. [Google Scholar] [CrossRef] [PubMed]
- Askarian-Amiri, M.E.; Crawford, J.; French, J.D.; Smart, C.E.; Smith, M.A.; Clark, M.B.; Ru, K.; Mercer, T.R.; Thompson, E.R.; Lakhani, S.R.; et al. SNORD-host RNA Zfas1 is a regulator of mammary development and a potential marker for breast cancer. RNA 2011, 17, 878–891. [Google Scholar] [CrossRef]
- Kim, K.; Jutooru, I.; Chadalapaka, G.; Johnson, G.; Frank, J.; Burghardt, R.; Kim, S.; Safe, S. HOTAIR is a negative prognostic factor and exhibits pro-oncogenic activity in pancreatic cancer. Oncogene 2013, 32, 1616–1625. [Google Scholar] [CrossRef] [PubMed]
- Wang, K.; Long, B.; Zhou, L.Y.; Liu, F.; Zhou, Q.Y.; Liu, C.Y.; Fan, Y.Y.; Li, P.F. CARL lncRNA inhibits anoxia-induced mitochondrial fission and apoptosis in cardiomyocytes by impairing miR-539-dependent PHB2 downregulation. Nat. Commun. 2014, 5, 3596. [Google Scholar] [CrossRef]
- Wang, K.; Sun, T.; Li, N.; Wang, Y.; Wang, J.X.; Zhou, L.Y.; Long, B.; Liu, C.Y.; Liu, F.; Li, P.F. MDRL lncRNA regulates the processing of miR-484 primary transcript by targeting miR-361. PLoS Genet. 2014, 10, e1004467. [Google Scholar] [CrossRef] [PubMed]
- Liu, B.; Wang, B.; Zhang, X.; Lock, R.; Nash, T.; Vunjak-Novakovic, G. Cell type–specific microRNA therapies for myocardial infarction. Sci. Transl. Med. 2021, 13, eabd0914. [Google Scholar] [CrossRef]
- Micheletti, R.; Plaisance, I.; Abraham, B.J.; Sarre, A.; Ting, C.C.; Alexanian, M.; Maric, D.; Maison, D.; Nemir, M.; Young, R.A.; et al. The long noncoding RNA Wisper controls cardiac fibrosis and remodeling. Sci. Transl. Med. 2017, 9, eaai9118. [Google Scholar] [CrossRef]
- Piccoli, M.T.; Gupta, S.K.; Viereck, J.; Foinquinos, A.; Samolovac, S.; Kramer, F.L.; Garg, A.; Remke, J.; Zimmer, K.; Batkai, S.; et al. Inhibition of the cardiac fibroblast–enriched lncRNA Meg3 prevents cardiac fibrosis and diastolic dysfunction. Circ. Res. 2017, 121, 575–583. [Google Scholar] [CrossRef]
- Wu, H.; Zhao, Z.A.; Liu, J.; Hao, K.; Yu, Y.; Han, X.; Li, J.; Wang, Y.; Lei, W.; Dong, N.; et al. Long noncoding RNA Meg3 regulates cardiomyocyte apoptosis in myocardial infarction. Gene Ther. 2018, 25, 511–523. [Google Scholar] [CrossRef] [PubMed]
- Zhu, J.; Liu, S.; Ye, F.; Shen, Y.; Tie, Y.; Zhu, J.; Wei, L.; Jin, Y.; Fu, H.; Wu, Y.; et al. Long noncoding RNA MEG3 interacts with p53 protein and regulates partial p53 target genes in hepatoma cells. PLoS ONE 2015, 10, e0139790. [Google Scholar] [CrossRef] [PubMed]
- Lv, L.; Li, T.; Li, X.; Xu, C.; Liu, Q.; Jiang, H.; Li, Y.; Liu, Y.; Yan, H.; Huang, Q.; et al. The lncRNA Plscr4 controls cardiac hypertrophy by regulating miR-214. Mol. Ther. Nucleic Acids 2018, 10, 387–397. [Google Scholar] [CrossRef]
- Zhang, J.; Liang, Y.; Huang, X.; Guo, X.; Liu, Y.; Zhong, J.; Yuan, J. STAT3-induced upregulation of lncRNA MEG3 regulates the growth of cardiac hypertrophy through miR-361-5p/HDAC9 axis. Sci. Rep. 2019, 9, 460. [Google Scholar] [CrossRef]
- Zhang, M.; Jiang, Y.; Guo, X.; Zhang, B.; Wu, J.; Sun, J.; Liang, H.; Shan, H.; Zhang, Y.; Liu, J.; et al. Long non-coding RNA cardiac hypertrophy-associated regulator governs cardiac hypertrophy via regulating miR-20b and the downstream PTEN/AKT pathway. J. Cell. Mol. Med. 2019, 23, 7685–7698. [Google Scholar] [CrossRef]
- Sun, Y.; Fan, W.; Xue, R.; Dong, B.; Liang, Z.; Chen, C.; Li, J.; Wang, Y.; Zhao, J.; Huang, H.; et al. Transcribed ultraconserved regions, Uc.323, ameliorates cardiac hypertrophy by regulating the transcription of CPT1b (carnitine palmitoyl transferase 1b). Hypertension 2020, 75, 79–90. [Google Scholar] [CrossRef]
- Liu, L.; An, X.; Li, Z.; Song, Y.; Li, L.; Zuo, S.; Liu, N.; Yang, G.; Wang, H.; Cheng, X.; et al. The H19 long noncoding RNA is a novel negative regulator of cardiomyocyte hypertrophy. Cardiovasc. Res. 2016, 111, 56–65. [Google Scholar] [CrossRef]
- Yan, S.M.; Li, H.; Shu, Q.; Wu, W.J.; Luo, X.M.; Lu, L. LncRNA SNHG1 exerts a protective role in cardiomyocytes hypertrophy via targeting miR15a-5p/HMGA1 axis. Cell Biol. Int. 2020, 44, 1009–1019. [Google Scholar] [CrossRef] [PubMed]
- Li, D.Y.; Busch, A.; Jin, H.; Chernogubova, E.; Pelisek, J.; Karlsson, J.; Sennblad, B.; Liu, S.; Lao, S.; Hofmann, P.; et al. H19 induces abdominal aortic aneurysm development and progression. Circulation 2018, 138, 1551–1568. [Google Scholar] [CrossRef] [PubMed]
- Busscher, D.; Boon, R.A.; Juni, R.P. The multifaceted actions of the lncRNA H19 in cardiovascular biology and diseases. Clini. Sci. 2022, 136, 1157–1178. [Google Scholar] [CrossRef]
- Viereck, J.; Bührke, A.; Foinquinos, A.; Chatterjee, S.; Kleeberger, J.A.; Xiao, K.; Janssen-Peters, H.; Batkai, S.; Ramanujam, D.; Kraft, T.; et al. Targeting muscle-enriched long non-coding RNA H19 reverses pathological cardiac hypertrophy. Eur. Heart J. 2020, 41, 3462–3474. [Google Scholar] [CrossRef] [PubMed]
- Wang, Z.; Zhang, X.J.; Ji, Y.X.; Zhang, P.; Deng, K.Q.; Gong, J.; Ren, S.; Wang, X.; Chen, I.; Wang, H.E.; et al. The long noncoding RNA Chaer defines an epigenetic checkpoint in cardiac hypertrophy. Nat. Med. 2016, 22, 1131–1139. [Google Scholar] [CrossRef] [PubMed]
- Vigil-Garcia, M.; Demkes, C.J.; Eding, J.E.; Versteeg, D.; de Ruiter, H.; Perini, I.; Kooijman, L.; Gladka, M.M.; Asselbergs, F.W.; Vink, A.; et al. Gene expression profiling of hypertrophic cardiomyocytes identifies new players in pathological remodelling. Cardiovasc. Res. 2021, 117, 1532–1545. [Google Scholar] [CrossRef]
- Liu, L.; Zhang, D.; Li, Y. LncRNAs in cardiac hypertrophy: From basic science to clinical application. J. Cell. Mol. Med. 2020, 20, 11638–11645. [Google Scholar] [CrossRef]
- Marian, A.J.; Braunwald, E. Hypertrophic cardiomyopathy: Genetics, pathogenesis, clinical manifestations, diagnosis, and therapy. Circ. Res. 2017, 121, 749–770. [Google Scholar] [CrossRef]
- Poller, W.; Dimmeler, S.; Heymans, S.; Zeller, T.; Haas, J.; Karakas, M.; Leistner, D.M.; Jakob, P.; Nakagawa, S.; Blankenberg, S.; et al. Non-coding RNAs in cardiovascular diseases: Diagnostic and therapeutic perspectives. Eur. Heart J. 2018, 39, 2704–2716. [Google Scholar] [CrossRef]
- James, S.; Åkerblom, A.; Cannon, C.P.; Emanuelsson, H.; Husted, S.; Katus, H.; Skene, A.; Steg, P.G.; Storey, R.F.; Harrington, R.; et al. Comparison of ticagrelor, the first reversible oral P2Y12 receptor antagonist, with clopidogrel in patients with acute coronary syndromes: Rationale, design, and baseline characteristics of the PLATelet inhibition and patient Outcomes (PLATO) trial. Am. Heart J. 2009, 157, 599–605. [Google Scholar] [CrossRef]
- Doig, G.S.; Simpson, F. Randomization and allocation concealment: A practical guide for researchers. J. Crit. Care 2005, 20, 187–191. [Google Scholar] [CrossRef] [PubMed]
- Singh, A.; Museedi, A.S.; Grossman, S.A. Acute Coronary Syndrome; StatPearls Publishing: Treasure Island, FL, USA, 2017. [Google Scholar]
- Writing Committee Members Lawton, J.S.; Tamis-Holland, J.E.; Bangalore, S.; Bates, E.R.; Beckie, T.M.; Bischoff, J.M.; Bittl, J.A.; Cohen, M.G.; DiMaio, J.M.; Don, C.W. 2021 ACC/AHA/SCAI guideline for coronary artery revascularization: Executive summary: A report of the American College of Cardiology/American Heart Association Joint Committee on Clinical Practice Guidelines. J. Am. Coll. Cardiol. 2022, 79, 197–215. [Google Scholar]


| Characteristics | Group 1 (n = 125) | Group 2 (n = 125) | (p-Value) |
|---|---|---|---|
| Age (yrs.); mean ± SD | 52.58 ± 13.12 | 50.4 ± 10.37 | 0.47 |
| Gender | |||
| Male, n (%) | 26 (20.8%) | 29 (23.2%) | 0.38 |
| Female, n (%) | 99 (79.2%) | 96 (76.8%) | |
| Smokers, n (%) | 61 (48.8%) | 60 (48%) | 0.493 |
| Diabetes mellitus; n (%) | 72 (57.6%) | 74 (59.2%) | 0.412 |
| Hypertension; n (%) | 88 (70.4%) | 91 (72.8%) | 0.318 |
| Ever Smoked; n (%) | 41 (32.8%) | 43 (34.4%) | 0.19 |
| CBC; mean ± SD | |||
| RBCs (106 cells/µL) | 4.57 ± 0.532 | 4.79 ± 0.586 | 0.105 |
| Haemoglobin (gm/dL) | 12.42 ± 1.787 | 13.00 ± 1.897 | 0.193 |
| WBCs (103 cells/µL) | 10.00 ± 2.54 | 10.79 ± 2.78 | 0.126 |
| Platelets (103 cells/µL) | 257 ± 69 | 280 ± 74 | 0.196 |
| Liver function Tests; mean ± SD | |||
| AST (U/L) | 24.70 ± 10.63 | 29.58 ± 13.82 | 0.211 |
| ALT (U/L) | 25.88 ± 14.27 | 29.48 ± 11.08 | 0.318 |
| Kidney function Tests; mean ± SD | |||
| BUN (mg/dL) | 19.85 ± 10.46 | 21.10 ± 12.60 | 0.667 |
| Serum creatinine (mg/dL) | 1.12 ± 0.32 | 1.10 ± 0.25 | 0.784 |
| Serum K (mEq/L); mean ± SD | 3.69 ± 0.29 | 3.57 ± 0.25 | 0.09 |
| Baseline echocardiographic parameters | |||
| EF (%) | 59.83 ± 6.92 | 61.90 ± 6.05 | 0.16 |
| ESV (mL) | 75.33 ± 5.2 | 67.28 ± 4.1 | 0.18 |
| EDV (mL) | 106.73 ± 6.53 | 114.18 ± 8.21 | 0.204 |
| Comorbid diseases | |||
| Hypertension; n (%) | 67 (53.6%) | 73 (58.4%) | 0.375 |
| Diabetes; n (%) | 52 (41.6%) | 59 (47.2%) | 0.248 |
| Hyperlipidemia; n (%) | 45 (36%) | 63 (50.4%) | 0.102 |
| Characteristics | Group 1 (n = 125) | Group 2 (n = 125) | (p-Value) |
|---|---|---|---|
| CBC; mean ± SD | |||
| RBCs (106 cells/µL) | 4.6 ± 0.5 | 4.8 ± 0.4 | 0.153 |
| Hemoglobin (gm/dL) | 12.5 ± 1.7 | 12.9 ± 1.6 | 0.342 |
| WBCs (103 cells/µL) | 10 ± 2.3 | 10.7 ± 2.1 | 0.154 |
| Platelets (103 cells/µL) | 263 ± 58 | 283 ± 81 | 0.25 |
| Liver function Tests; mean ± SD | |||
| AST (U/L) | 20.2 ± 9.4 | 22.5 ± 10.8 | 0.285 |
| ALT (U/L) | 20.4 ± 6.5 | 23.4 ± 9.1 | 0.105 |
| Kidney function Tests; mean ± SD | |||
| BUN (mg/dL) | 18.2 ± 6.7 | 18.3 ± 9.8 | 0.972 |
| Serum creatinine (mg/dL) | 1.1 ± 0.2 | 1.2 ± 0.19 | 0.606 |
| Serum K (mEq/L); mean ± SD | 4.6 ± 0.5 | 4.8 ± 0.3 | 0.18 |
| Echocardiographic parameters after 6 months | |||
| EF (%) | 36.4 ± 8.1 | 66.8 ± 5.9 | 1.1 × 10⁻⁴ * |
| ESV (mL) | 90.5 ± 25.6 | 74.4 ± 16.2 | 0.0075 * |
| EDV (mL) | 141.2 ± 16.6 | 122.8 ± 9.5 | 0.002 * |
| Cardiac fibrosis marker; mean ± SD | |||
| PIIINP (ng/mL) | 12.6 ± 3.8 | 4.7 ± 2.2 | 0.007 * |
| Soluble ST2 (ng/mL) | 63.6 ± 10.6 | 25.7 ± 8.4 | 0.0004 * |
| Mir675 | 118.9 ± 28.2 | 153.7 ± 20.7 | 0.422 |
| Mir361-5p | 273.8 ± 40.6 | 139.1 ± 56.1 | 2.9 × 10⁻⁴ * |
| Lnc-H19 | 263.4 ± 45.2 | 319.7 ± 23.9 | 0.165 |
| Lnc-MEG3 | 492.5 ± 55.8 | 226.2 ± 64.2 | 2.2 × 10⁻⁶ * |
| Lnc-Chaer | 334.6 ± 27.8 | 200.5 ± 38.9 | 1.2 × 10⁻⁵ * |
| Vitamin D status | |||
| Vitamin D level (ng/mL) | 8.5 ± 2.6 | 31.4 ± 4.3 | 0.0008 * |
| Clinical Outcomes | |||
| Heart Failure occurrence, n (%) | 55 (44%) | 30 (24%) | 0.001 * |
| MACE occurrence, n (%) | 56 (44.8%) | 34 (27.2%) | 0.009 * |
| Number of MACE One event, n (%) Two events or more, n (%) | 43 (34.4%) 13 (10.4%) | 29 (23.2%) 5 (4%) | 0.043 * |
| SNP | Minor Allele Frequency | Genotype | Number of Patients | Genotype Frequency | HWE ‡ |
|---|---|---|---|---|---|
| CC | 93 | 37.60% | |||
| Apa I | CA | 119 | 47.60% | ||
| rs7975232 | 0.4 | AA | 36 | 14.80% | 0.96 |
| CC | 88 | 35.20% | |||
| Bsm I | CT | 122 | 48.80% | ||
| rs1544410 | 0.37 | TT | 38 | 16% | 0.9 |
| GG | 94 | 37.60% | |||
| Taq I | GA | 110 | 44% | ||
| rs731236 | 0.42 | AA | 45 | 18% | 0.74 |
| AA | 85 | 34% | |||
| Fok I | AG | 123 | 49.20% | ||
| rs2228570 | 0.33 | GG | 41 | 16.80% | 0.31 |
| Group | Apa I rs7975232 | Bsm I rs1544410 | Taq I rs731236 | Fok I rs2228570 | ||||||||
|---|---|---|---|---|---|---|---|---|---|---|---|---|
| CC n (%) | CA n (%) | AA n (%) | CC n (%) | CT n (%) | TT n (%) | GG n (%) | GA n (%) | AA n (%) | AA n (%) | AG n (%) | GG n (%) | |
| Group 1 | 49 (39) | 59 (47) | 17 (14) | 47 (38) | 60 (48) | 17 (14) | 46 (37) | 57 (46) | 21 (17) | 42 (34) | 62 (49) | 21 (17) |
| Group 2 | 44 (33) | 60 (50) | 21 (17) | 41 (34) | 62 (49) | 21 (17) | 48 (38) | 53 (42) | 24 (20) | 43 (34) | 61 (49) | 20 (17) |
| Statistics | χ2: 1.26, p = 0.53 | χ2: 0.86, p = 0.65 | χ2: 0.38, p = 0.73 | χ2: 0.09, p = 0.89 | ||||||||
| Group | Apa I rs7975232 | Bsm I rs1544410 | Taq I rs731236 | Fok I rs2228570 | ||||||||
|---|---|---|---|---|---|---|---|---|---|---|---|---|
| CC n (%) | CA n (%) | AA n (%) | CC n (%) | CT n (%) | TT n (%) | GG n (%) | GA n (%) | AA n (%) | AA n (%) | AG n (%) | GG n (%) | |
| No Heart Failure | 65 (40) | 75 (46) | 24 (14) | 60 (37) | 80 (49) | 23 (14) | 75 (46) | 74 (45) | 15 (9) | 51 (31) | 86 (53) | 26 (16) |
| Heart Failure | 28 (33) | 44 (52) | 21 (15) | 28 (33) | 42 (49) | 15 (18) | 19 (22) | 36 (42) | 30 (36) | 34 (40) | 37 (43) | 15 (17) |
| Statistics | χ2: 1.11, p = 0.58 | χ2: 0.73, p = 0.71 | χ2: 29.4, p = 4.2 × 10⁻⁷ * | χ2: 2.28, p = 0.32 | ||||||||
| Group | Apa I rs7975232 | Bsm I rs1544410 | Taq I rs731236 | Fok I rs2228570 | ||||||||
|---|---|---|---|---|---|---|---|---|---|---|---|---|
| CC n (%) | CA n (%) | AA n (%) | CC n (%) | CT n (%) | TT n (%) | GG n (%) | GA n (%) | AA n (%) | AA n (%) | AG n (%) | GG n (%) | |
| No MACE | 63 (40) | 77 (49) | 18 (11) | 14 (9) | 111 (70) | 33 (21) | 46 (37) | 57 (46) | 21 (17) | 62 (39) | 77 (48) | 20 (13) |
| MACE | 30 (33) | 42 (47) | 18 (20) | 74 (82) | 11 (12) | 5 (6) | 48 (38) | 53 (42) | 24 (20) | 23 (25) | 44 (49) | 23 (26) |
| Statistics | χ2: 3.63, p = 0.16 | χ2: 1.52, p = 4.8 × 10⁻⁴ * | χ2: 0.38, p = 0.73 | χ2: 7.1, p = 0.003 * | ||||||||
| Group | Apa I rs7975232 | Bsm I rs1544410 | Taq I rs731236 | Fok I rs2228570 | ||||||||
|---|---|---|---|---|---|---|---|---|---|---|---|---|
| CC n (%) | CA n (%) | AA n (%) | CC n (%) | CT n (%) | TT n (%) | GG n (%) | GA n (%) | AA n (%) | AA n (%) | AG n (%) | GG n (%) | |
| One MACE | 21 (29) | 38 (53) | 13 (18) | 35 (49) | 21 (29) | 16 (22) | 21 (29) | 34 (47) | 17 (24) | 20 (28) | 35 (49) | 17 (24) |
| More than one MACE | 9 (50) | 4 (22) | 5 (28) | 11 (61) | 6 (33) | 1 (6) | 8 (44) | 5 (28) | 5 (28) | 3 (17) | 11 (61) | 4 (22) |
| Statistics | χ2: 5.43, p = 0.067 | χ2: 6.8, p = 0.002 * | χ2: 2.42, p = 0.301 | χ2: 1.15, p = 0.56 | ||||||||
| Risk Factor | β0 | p-Value | Odd Ratio | 95%CI for Exp(B) |
|---|---|---|---|---|
| Heart Failure risk factor | ||||
| Taql mutant/wild | −1.75 | 3.9 × 10⁻⁴ | 2.74 | 1.28–3.41 |
| MACE risk factor | ||||
| Bsm I wild/mutant | −0.362 | 1.26 × 10⁻⁴ | 6.4 | 2.45–8.12 |
| Fok I wild/mutant | 1.01 | 0.001 | 0.67 | 0.52–0.94 |
| More than one MACE risk factor | ||||
| Bsm I mutant/wild | −1.39 | 0.007 | 0.25 | 0.13–0.68 |
| PIIINP (ng/mL) | sST2 (ng/mL) | Mir675 (FC) | Mir361-5p (FC) | Lnc-H19 (FC) | Lnc-MEG3 (FC) | Lnc-Chaer (FC) | |
|---|---|---|---|---|---|---|---|
| PIIINP (ng/mL) | 0.097 | 0.038 | −0.062 | 0.066 | −0.130 | −0.150 | |
| p = 0.373 | p = 0.728 | p = 0.572 | p = 0.546 | p = 0.233 | p = 0.169 | ||
| sST2 (ng/mL) | 0.097 | −0.135 | 0.096 | −0.098 | −0.155 | −0.118 | |
| p = 0.373 | p = 0.217 | p = 0.378 | p = 0.368 | p = 0.155 | p = 0.278 | ||
| Mir675 (FC) | 0.038 | −0.135 | −0.338 | 0.146 | −0.337 | −0.303 | |
| p = 0.728 | p = 0.217 | p = 0.001 * | p = 0.181 | p = 0.002 * | 0.005 * | ||
| Mir361-5p (FC) | −0.062 | 0.096 | −0.338 | 0.111 | 0.717 | 0.728 | |
| p = 0.572 | p = 0.378 | p = 0.001 * | p = 0.308 | p = 8.1 × 10⁻⁹ * | p = 2.2 × 10⁻⁸ * | ||
| Lnc-H19 (FC) | 0.066 | −0.098 | 0.146 | 0.111 | 0.078 | 0.019 | |
| p = 0.546 | p = 0.368 | p = 0.181 | p = 0.308 | p = 0.477 | p = 0.863 | ||
| Lnc-MEG3 (FC) | −0.130 | −0.155 | −0.337 | 0.717 | 0.078 | 0.764 | |
| p = 0.233 | p = 0.155 | p = 0.002 * | p = 8.1 × 10⁻⁹ * | p = 0.477 | p = 1.3 × 10⁻¹⁰ * | ||
| Lnc-Chaer (FC) | −0.150 | −0.118 | −0.303 | 0.728 | 0.019 | 0.764 | |
| p = 0.169 | p = 0.278 | p = 0.005 * | p = 2.2 × 10⁻⁸ * | p = 0.863 | p = 1.3 × 10⁻¹⁰ * |
| PIIINP (ng/mL) | sST2 (ng/mL) | Mir675 (FC) | Mir361-5p (FC) | Lnc-H19 (FC) | Lnc-MEG3 (FC) | Lnc-Chaer (FC) | |
|---|---|---|---|---|---|---|---|
| PIIINP (ng/mL) | −0.079 | −0.052 | 0.047 | 0.145 | −0.039 | 0.078 | |
| p = 0.459 | p = 0.627 | p = 0.658 | p = 0.172 | p = 0.715 | p = 0.466 | ||
| sST2 (ng/mL) | −0.079 | −0.160 | 0.311 | −0.067 | −0.114 | −0.0211 | |
| p = 0.459 | p = 0.131 | p = 0.003 * | p = 0.527 | p = 0.285 | p = 0.046 * | ||
| Mir675 (FC) | −0.052 | −0.160 | −0.332 | 0.306 | −0.312 | −0.204 | |
| p = 0.627 | p = 0.131 | p = 0.001 * | p = 0.003 * | p = 0.003 * | p = 0.054 | ||
| Mir361-5p (FC) | 0.047 | 0.311 | −0.332 | −0.166 | 0.458 | 0.344 | |
| p = 0.658 | p = 0.003 * | p = 0.001 * | p = 0.119 | p = 5.7 × 10⁻⁵ * | p = 0.001 * | ||
| Lnc-H19 (FC) | 0.145 | −0.067 | 0.306 | −0.166 | −0.203 | −0.082 | |
| p = 0.172 | p = 0.527 | p = 0.003 * | p = 0.119 | p = 0.054 | p = 0.442 | ||
| Lnc-MEG3 (FC) | −0.039 | −0.114 | −0.312 | 0.458 | −0.203 | 0.419 | |
| p = 0.715 | 0.285 | p = 0.003 * | p = 5.7 × 10⁻⁵ * | p = 0.054 | p = 3.9 × 10⁻⁴ * | ||
| Lnc-Chaer (FC) | 0.078 | −0.211 * | −0.204 | 0.344 | −0.082 | 0.419 | |
| p = 0.466 | p = 0.046 * | p = 0.054 | p = 0.001 * | p = 0.442 | p = 3.9 × 10⁻⁴ * |
| Predictors | Model 1 Change in EF | Model 2 PIIINP | Model 3 Soluble ST2 | |||
|---|---|---|---|---|---|---|
| β (S.E) | p-Value | β (S.E) | p-Value | β (S.E) | p-Value | |
| Bsml | 3.98 (0.57) | 0.0001 * | −0.58 (0.25) | 0.023 * | ------ | ------ |
| Fokl | 2.57 (0.55) | 0.002 * | ------ | ------ | ------ | ------ |
| Taql | −3.4 (0.53) | 0.0003 * | 9.5 (3.6) | 0.0002 * | ------ | ------ |
| Age | −0.47 (1.8) | 0.19 | −1.4 (0.24) | 1.1 × 10⁻⁴ | ------ | ------ |
| Baseline EDV | 0.189 (0.26) | 0.0002 * | ------ | ------ | ------ | ------ |
| Baseline ESV | −0.287 (0.34) | 0.0001 * | ------ | ------ | ------ | ------ |
| PIIINP | ------ | ------ | ------ | ------ | 55.5 (11.9) | 0.006 * |
| Mir675 | ------ | ------ | ------ | ------ | −1.25 (0.6) | 0.037 * |
| Mir155 | ------ | ------ | 0.05 (0.02) | 0.008 * | ------ | ------ |
| Heart failure | −12.6 (0.87) | 0.0005 * | 1.3 (0.38) | 0.001 * | 27.4 (14.2) | 0.02 * |
| MACE | 2.28 (0.85) | 0.007 * | ------ | ------ | ------ | ------ |
| Hypertension | ------ | ------ | −0.74 (0.36) | 0.045 * | ------ | ------ |
| Smoking | 1.5 (0.74) | 0.04 * | −20.6 (5.7) | 0.006 * | ------ | ------ |
| Intercept | 36.2 | 1.9 × 10⁻⁵ | 24.1 | 0.0001 * | 47.4 | 0.01 * |
| R2 | 0.552 | 0.05 | 0.103 | |||
| Predictors | Model 4 Mir675 | Model 5 Mir155 | Model 6 LnRNA H19 | Model 7 LnRNA MEG3 | Model 8 LnRNA Chaer | |||||
|---|---|---|---|---|---|---|---|---|---|---|
| β (S.E) | p-Value | β (S.E) | p-Value | β (S.E) | p-Value | β (S.E) | p-Value | β (S.E) | p-Value | |
| Soluble ST2 | −0.08 (0.04) | 0.043 * | ------ | ------ | ------ | ------ | ------ | ------ | ------ | ------ |
| PIIINP | ------ | ------ | 1.59 (0.48) | 0.001 * | −15.6 (5.3) | 0.004 * | ------ | ------ | −3.35 (1.7) | 0.05 |
| Mir675 | ------ | ------ | −0.5 (0.02) | 0.005 * | 1.19 (0.18) | 0.0004 * | −0.62 (0.02) | 0.002 * | 0.17 (0.06) | 0.005 * |
| Mir155 | ------ | ------ | ------ | ------ | 6.1 (0.38) | 0.0008 * | 0.69 (0.042) | 0.002 * | 1.59 (0.173) | 0.0001 * |
| LnRNA H19 | 0.6 (0.12) | 0.001 | 0.05 (0.004) | 0.007 * | ------ | ------ | ------ | ------ | −0.16 (0.015) | 0.0007 * |
| LnRNA MEG3 | −0.48 (0.04) | 0.0003 * | 0.46 (0.037) | 0.0002 * | ------ | ------ | ------ | ------ | 1.11 (0.14) | 0.0006 * |
| LnRNA chaer | ------ | ------ | 0.132 (0.014) | 0.0001 * | −1.71 (0.13) | 0.0005 * | 0.148 (0.014) | 0.0003 * | ------ | ------ |
| Sex | ------ | ------ | ------ | ------ | ------ | ------ | −12.2 (94.6) | 0.009 * | ------ | ------ |
| Heart failure | ------ | ------ | −9.4 (3.4) | 0.006 * | ------ | ------ | ------ | ------ | 29.7 (7.1) | 0.013 * |
| Hypertension | 23.4 (2.3) | 0.023 * | ------ | ------ | −19.6 (3.5) | 0.007 * | ------ | ------ | ------ | ------ |
| Intercept | 27.6 | 2.1 × 10⁻⁴ | 7.3 | 0.22 | 79.2 | 0.24 | 38.1 | 0.0004 * | −41.6 | 0.049 * |
| R2 | 0.322 | 0.926 | 0.466 | 0.92 | 0.89 | |||||
Disclaimer/Publisher’s Note: The statements, opinions and data contained in all publications are solely those of the individual author(s) and contributor(s) and not of MDPI and/or the editor(s). MDPI and/or the editor(s) disclaim responsibility for any injury to people or property resulting from any ideas, methods, instructions or products referred to in the content. |
© 2023 by the authors. Licensee MDPI, Basel, Switzerland. This article is an open access article distributed under the terms and conditions of the Creative Commons Attribution (CC BY) license (https://creativecommons.org/licenses/by/4.0/).
Share and Cite
Sarhan, N.; Essam Abou Warda, A.; Alsahali, S.; Alanazi, A.S. Impact of Vitamin D Supplementation on the Clinical Outcomes and Epigenetic Markers in Patients with Acute Coronary Syndrome. Pharmaceuticals 2023, 16, 262. https://doi.org/10.3390/ph16020262
Sarhan N, Essam Abou Warda A, Alsahali S, Alanazi AS. Impact of Vitamin D Supplementation on the Clinical Outcomes and Epigenetic Markers in Patients with Acute Coronary Syndrome. Pharmaceuticals. 2023; 16(2):262. https://doi.org/10.3390/ph16020262
Chicago/Turabian StyleSarhan, Neven, Ahmed Essam Abou Warda, Saud Alsahali, and Abdalla Salah Alanazi. 2023. "Impact of Vitamin D Supplementation on the Clinical Outcomes and Epigenetic Markers in Patients with Acute Coronary Syndrome" Pharmaceuticals 16, no. 2: 262. https://doi.org/10.3390/ph16020262
APA StyleSarhan, N., Essam Abou Warda, A., Alsahali, S., & Alanazi, A. S. (2023). Impact of Vitamin D Supplementation on the Clinical Outcomes and Epigenetic Markers in Patients with Acute Coronary Syndrome. Pharmaceuticals, 16(2), 262. https://doi.org/10.3390/ph16020262