
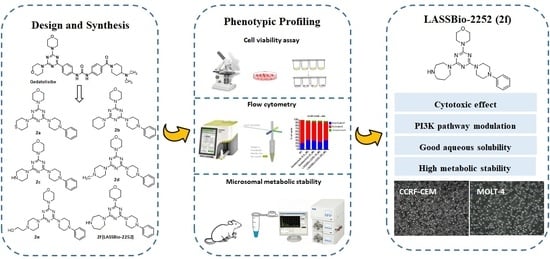
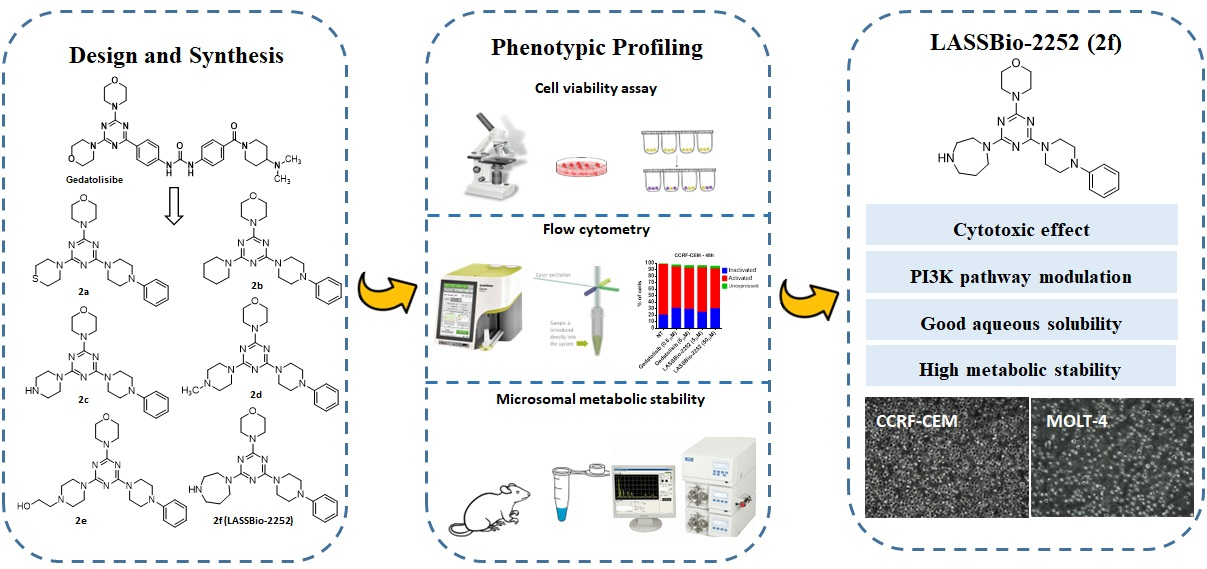
Design, Synthesis and Phenotypic Profiling of Simplified Gedatolisib Analogues

 , , , , , , and
Abstract
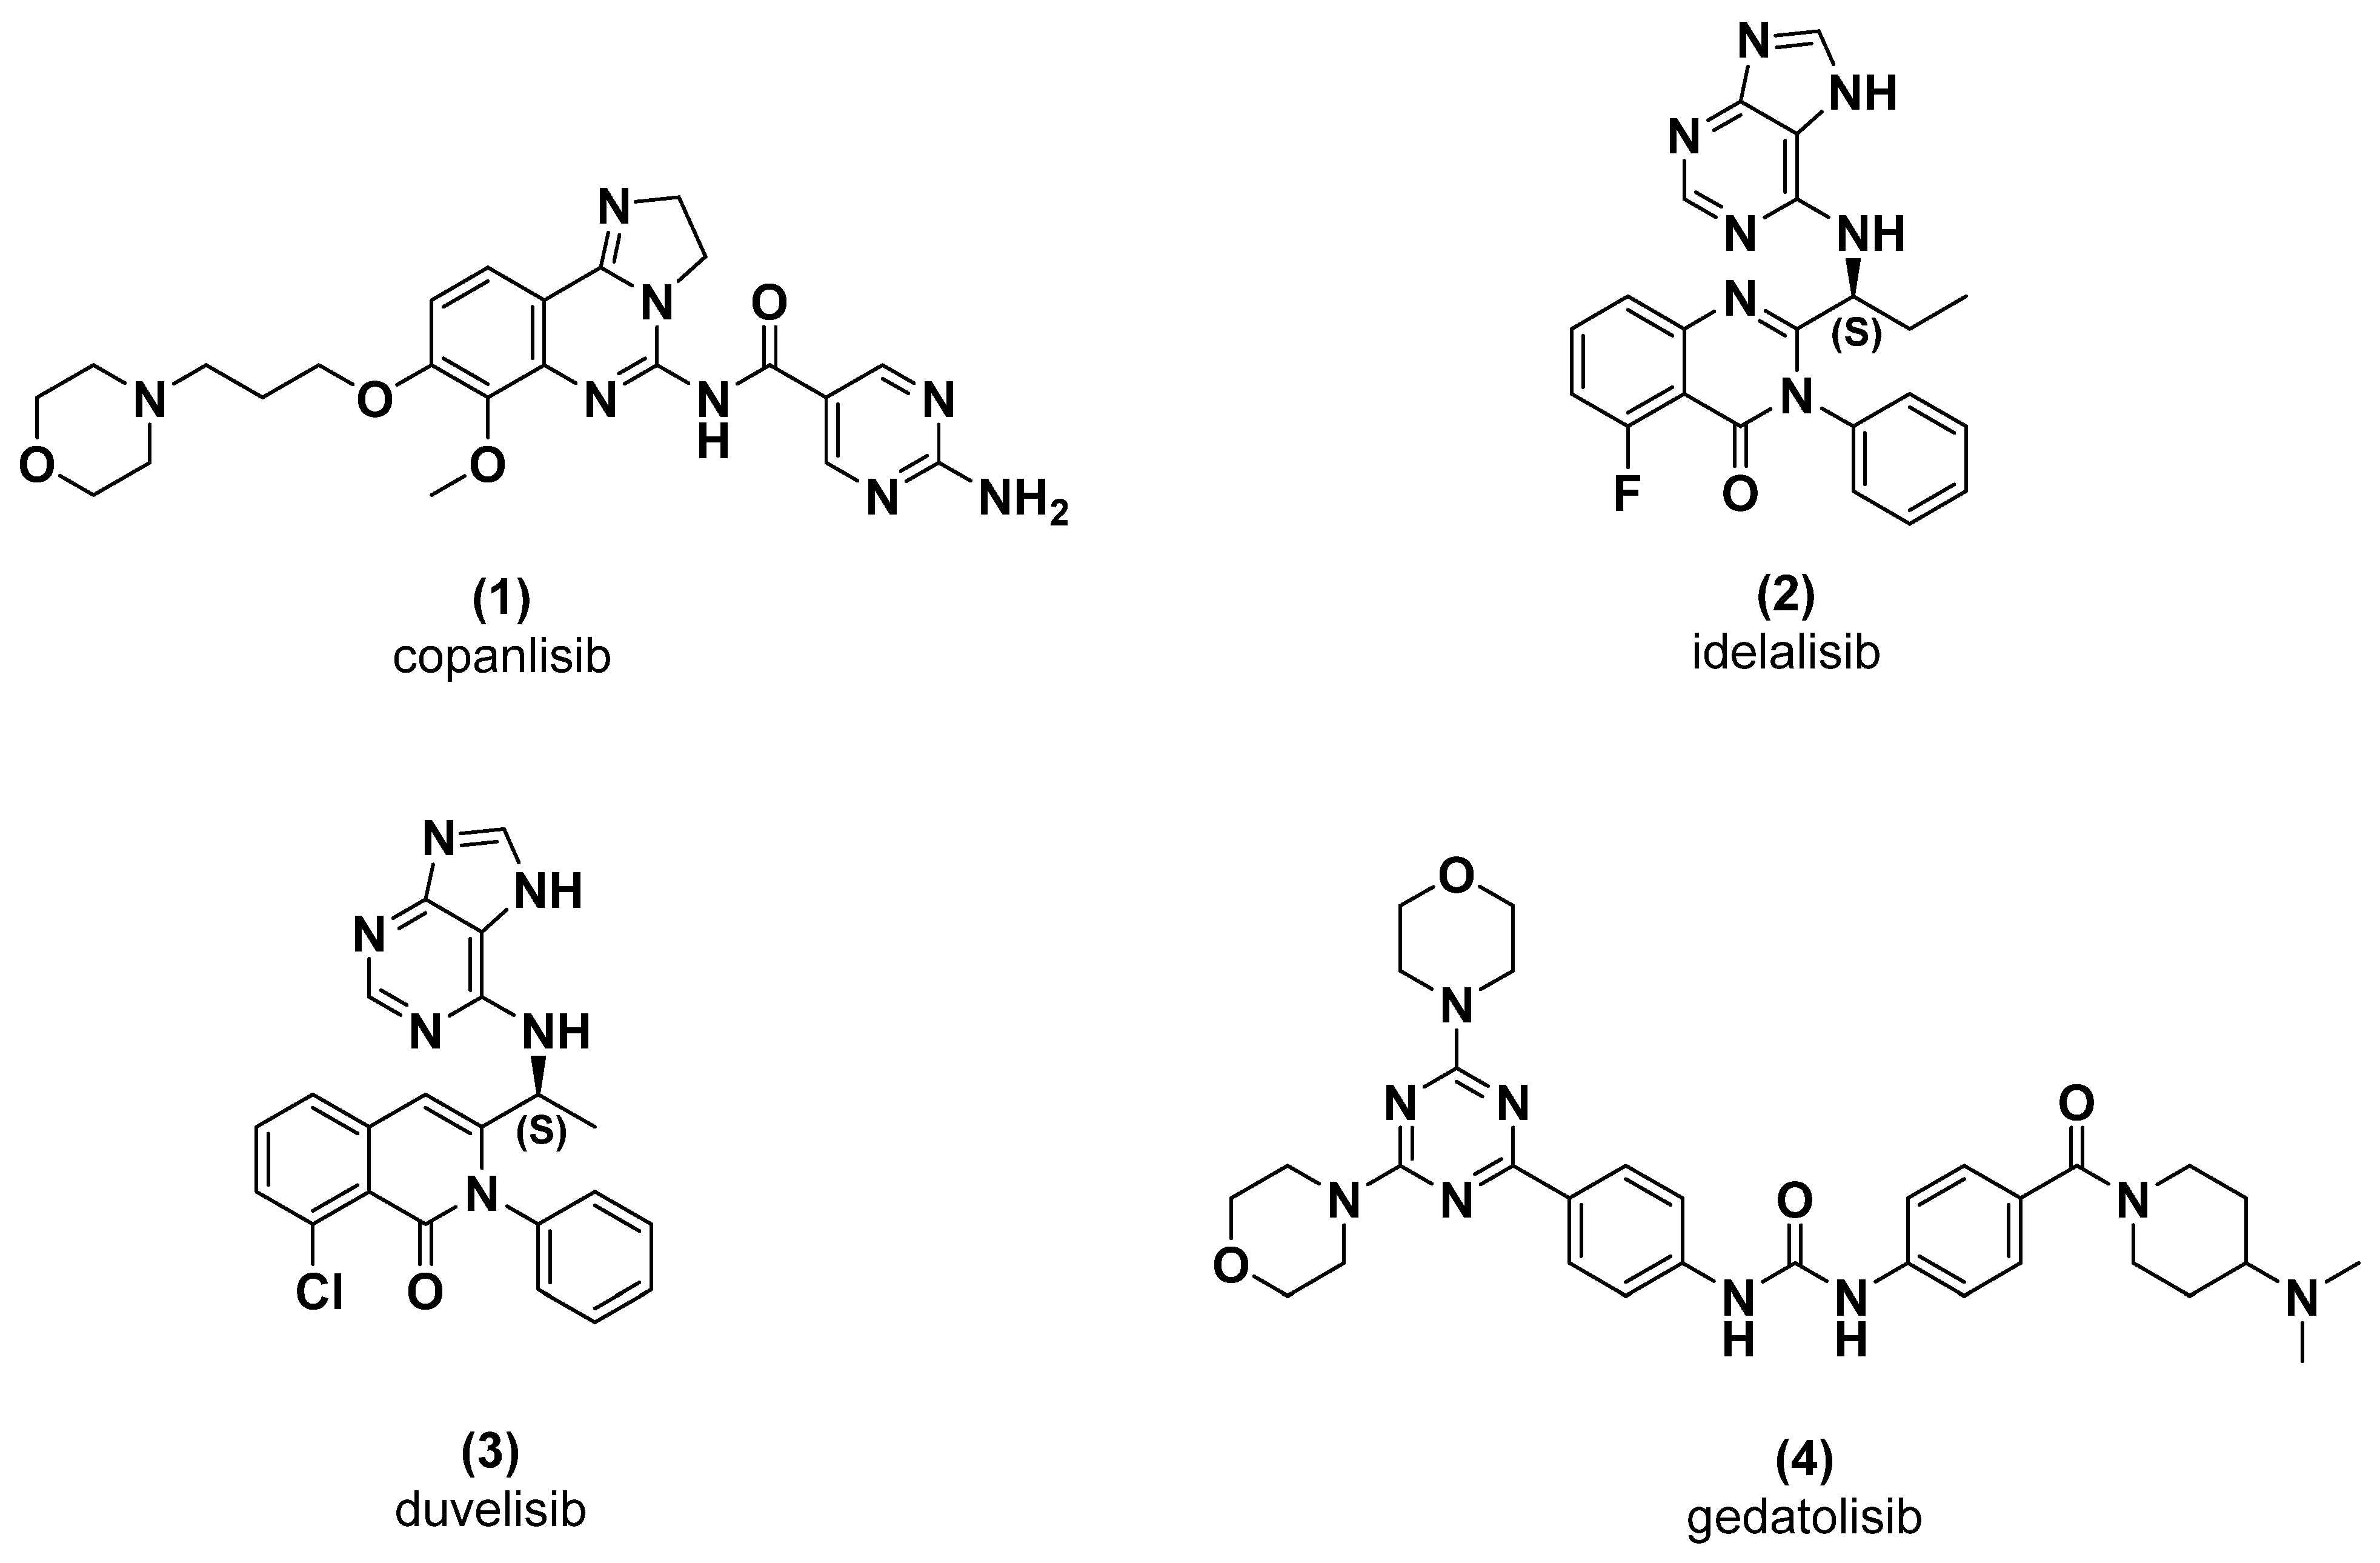
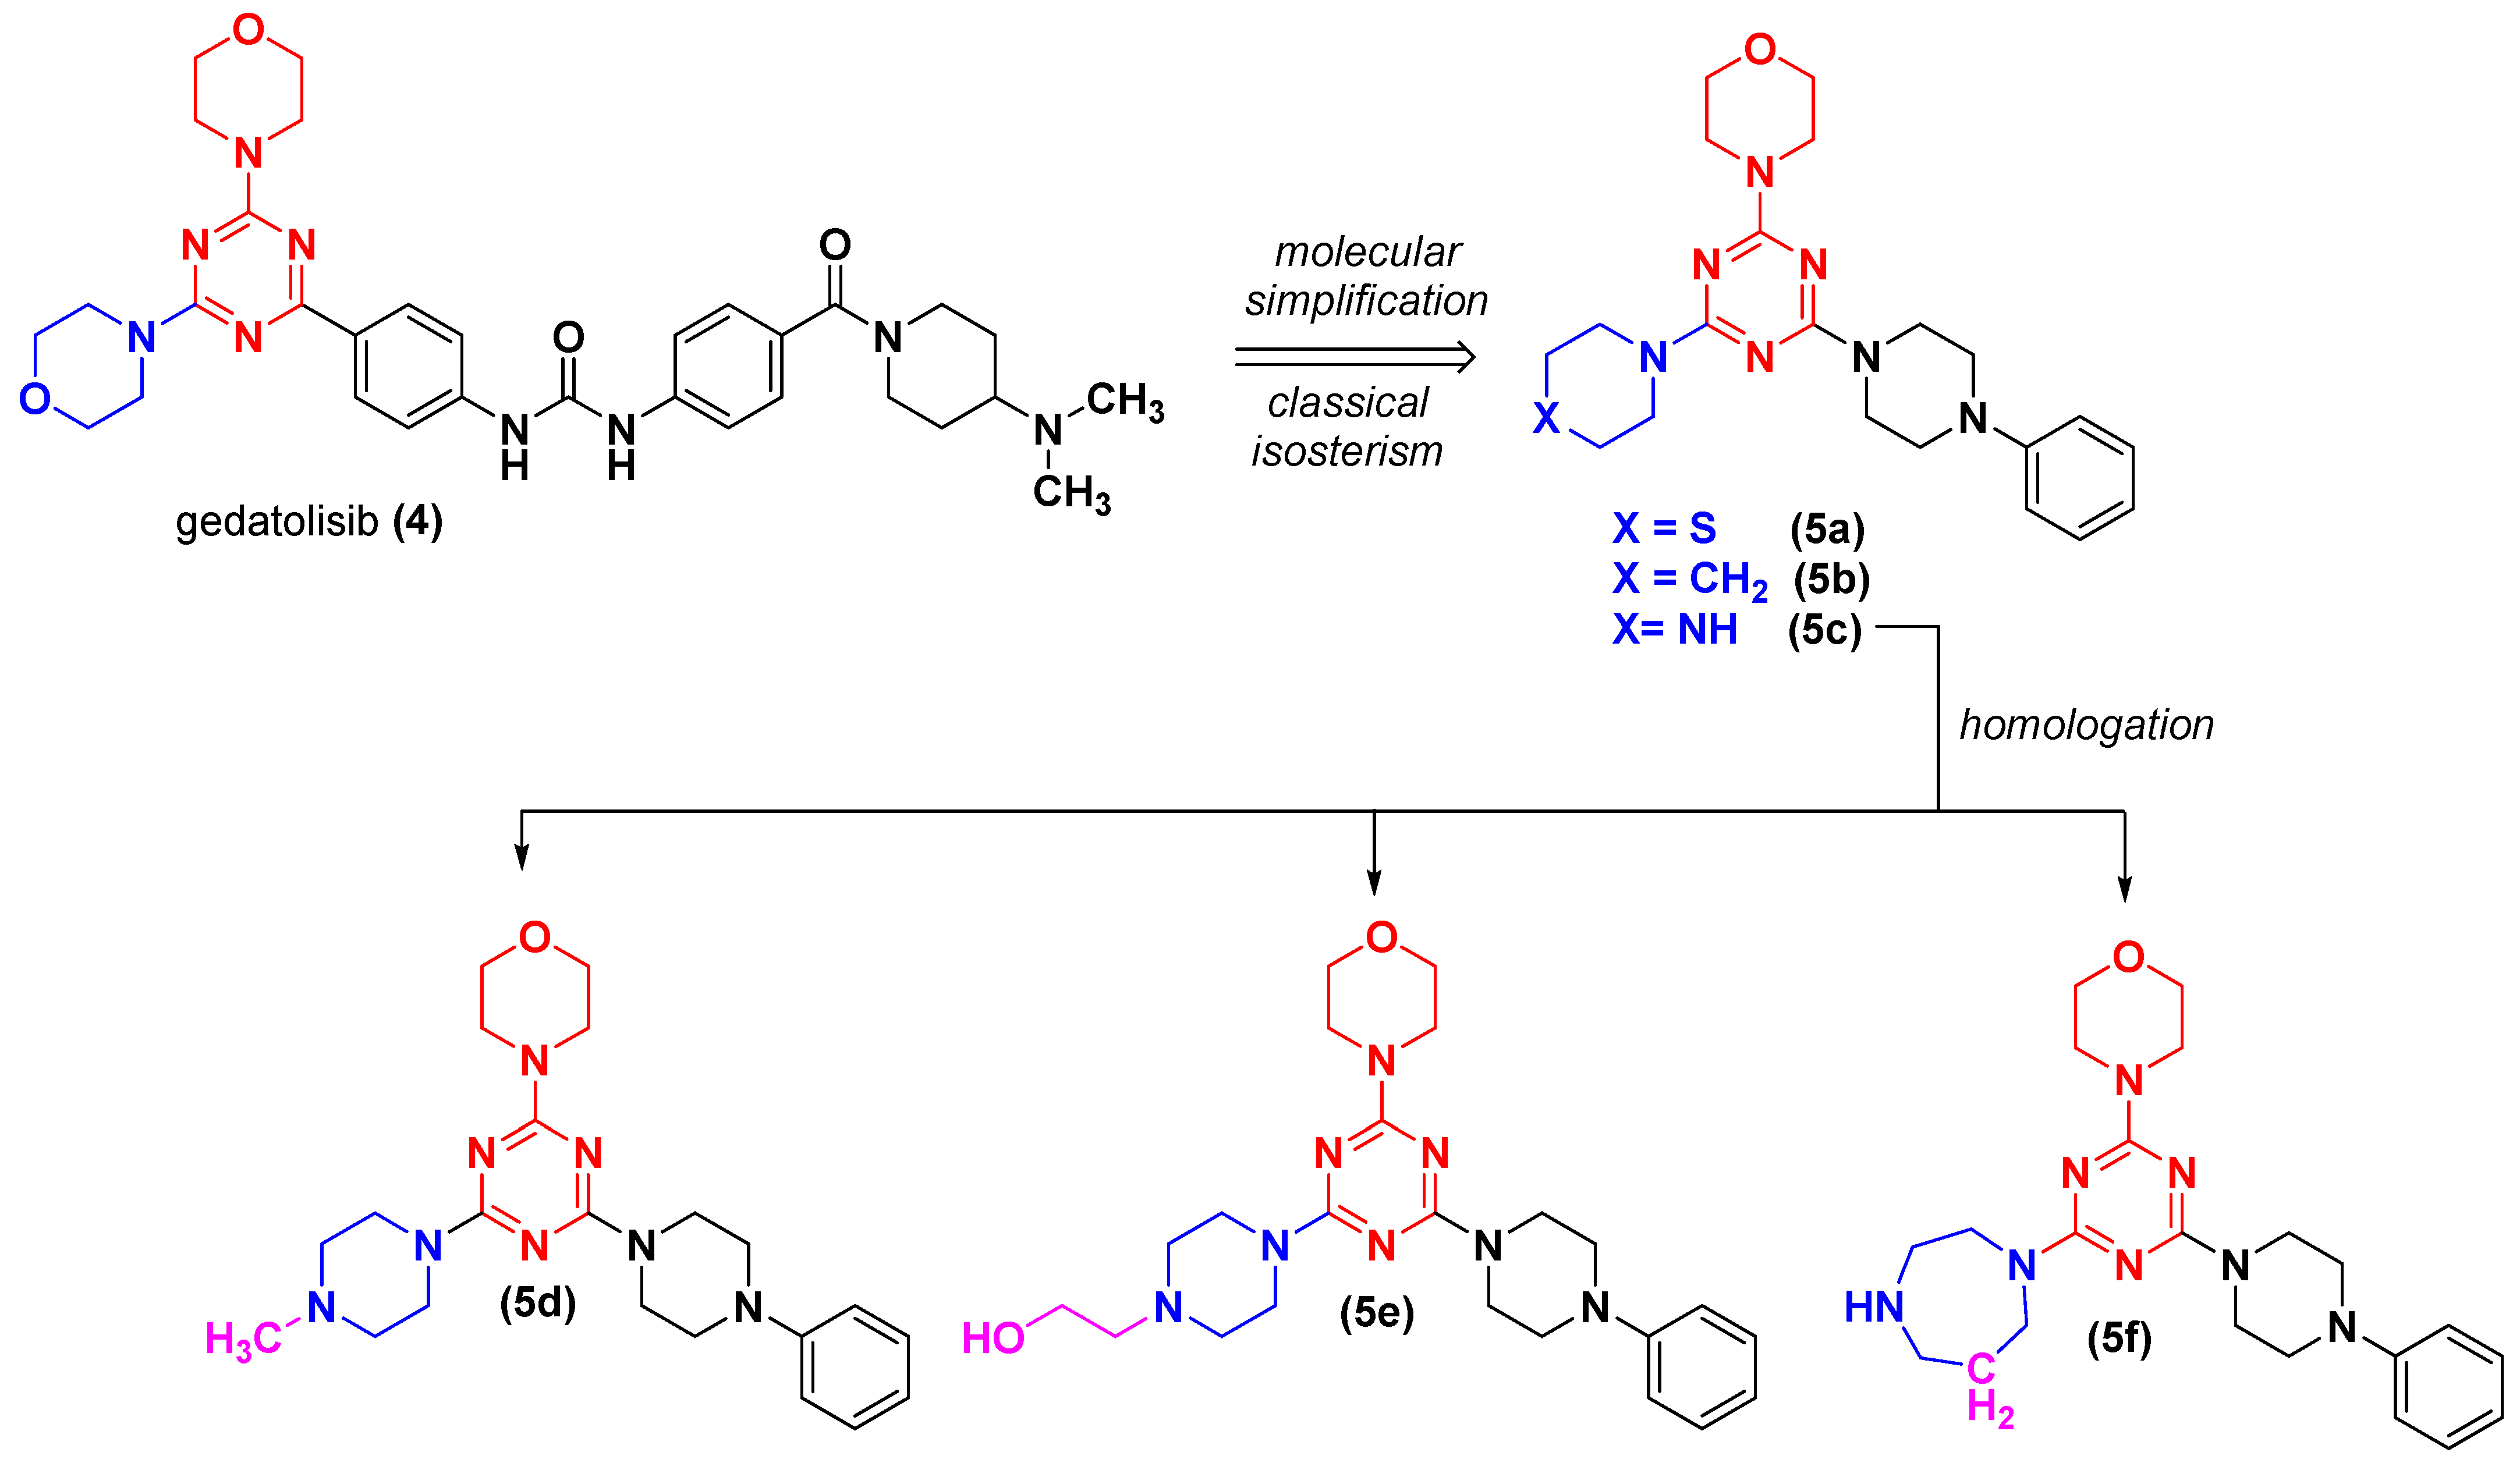
1. Introduction
2. Results and Discussion
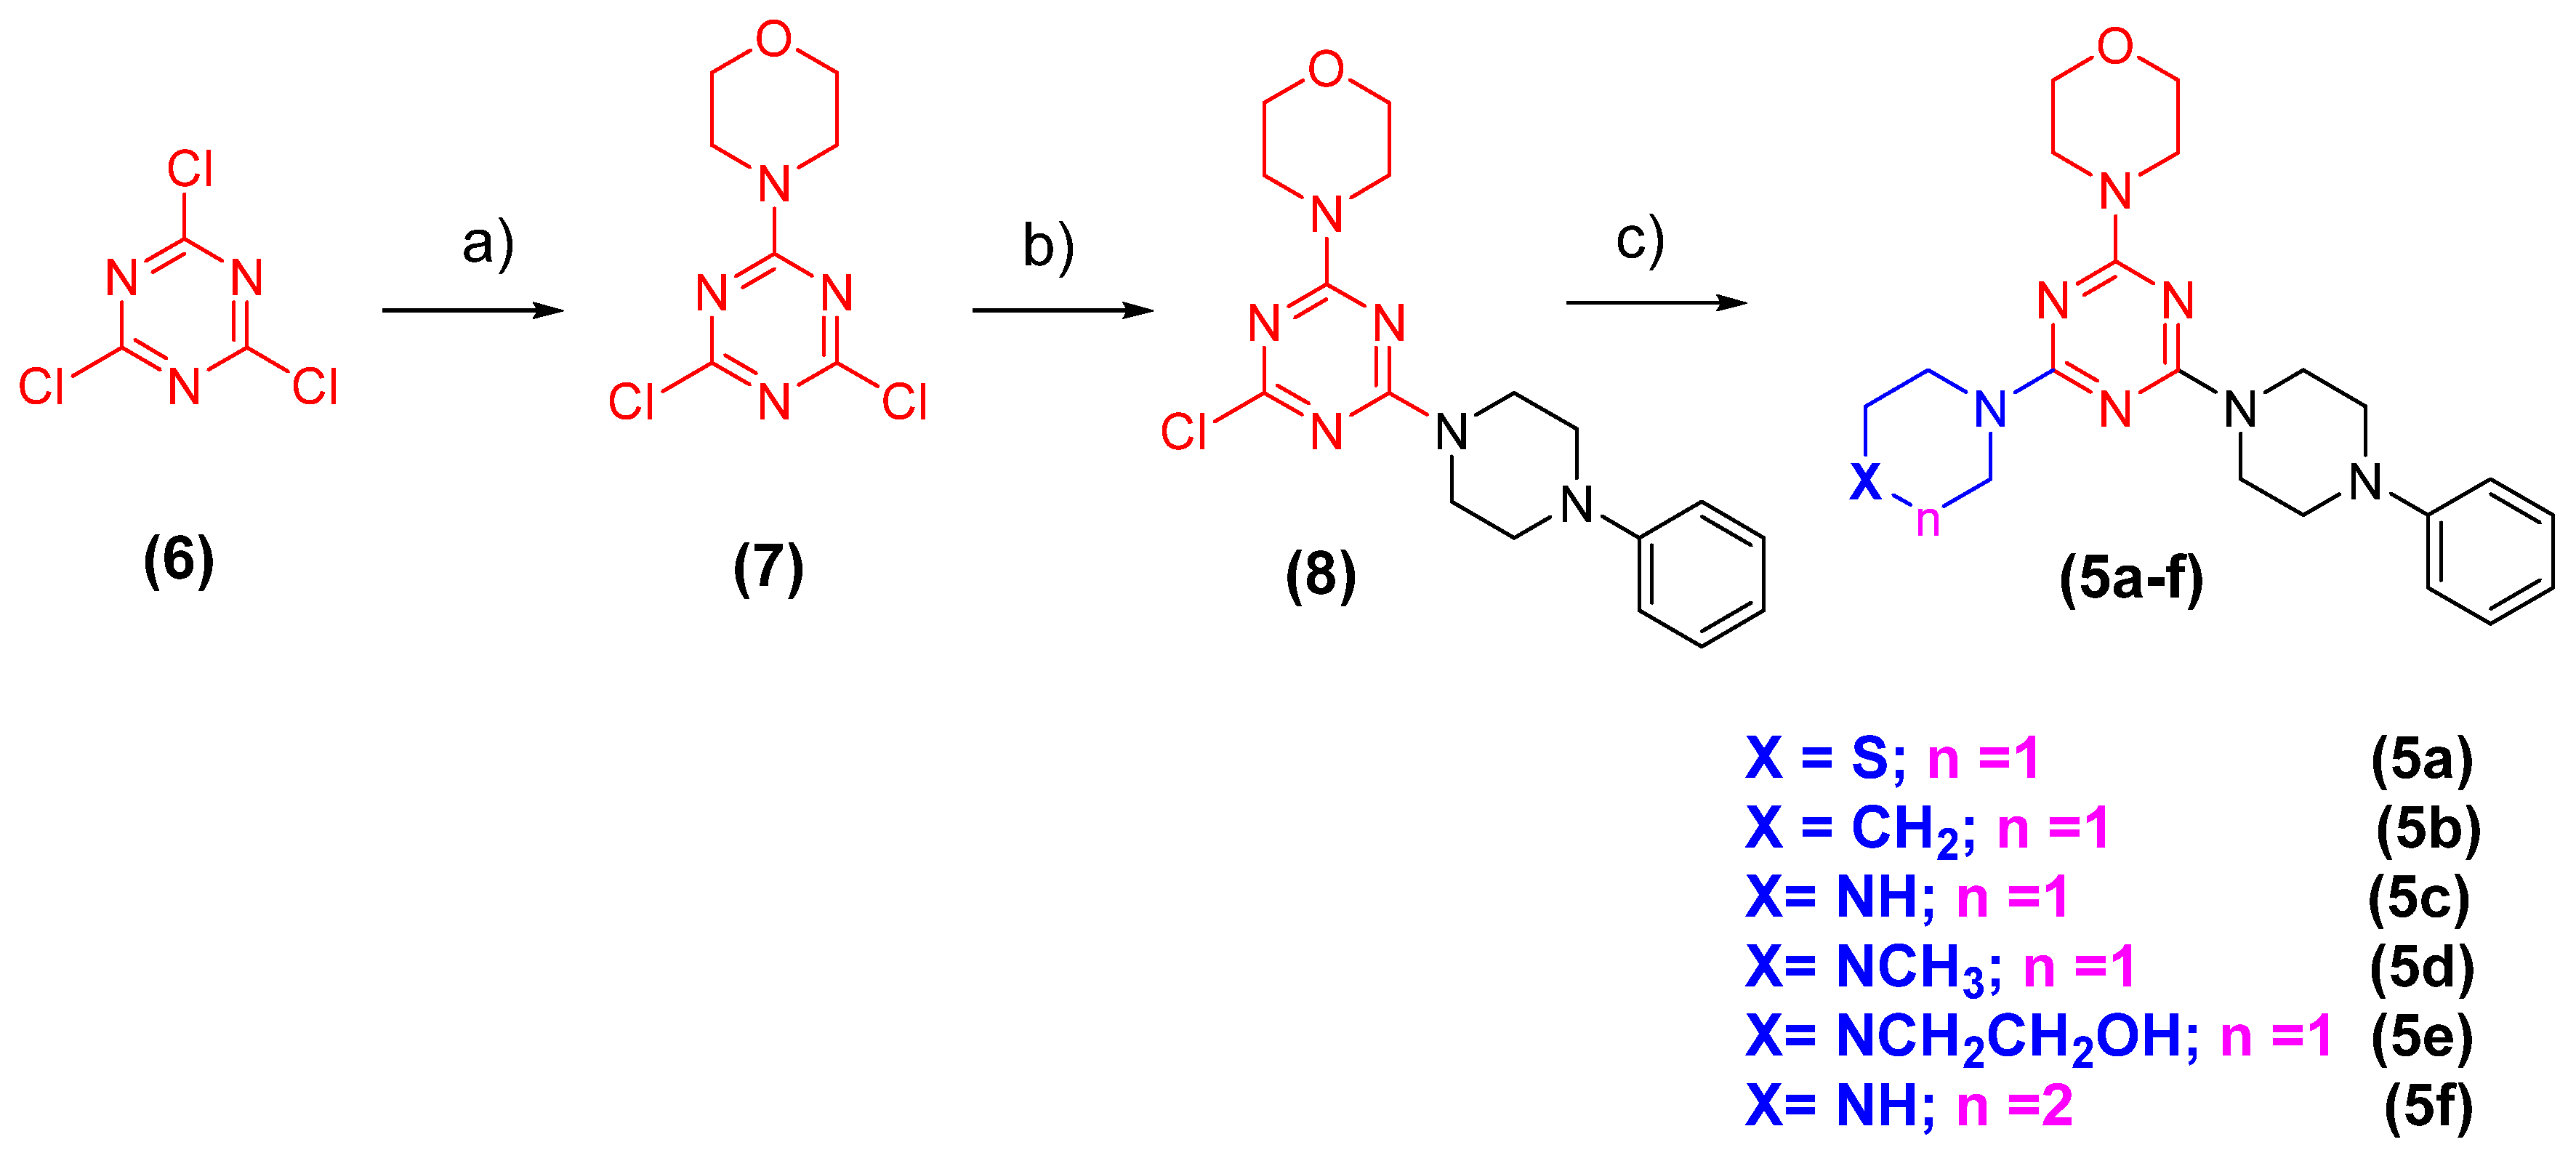
2.1. Chemistry
2.2. Pharmacological Experiments
2.2.1. Cell Viability by MTT and CC50 Determination
2.2.2. Evaluation of the Cytotoxic Selectivity Index
2.2.3. Analysis of Cell Viability by Flow Cytometry at 48 and 72 h
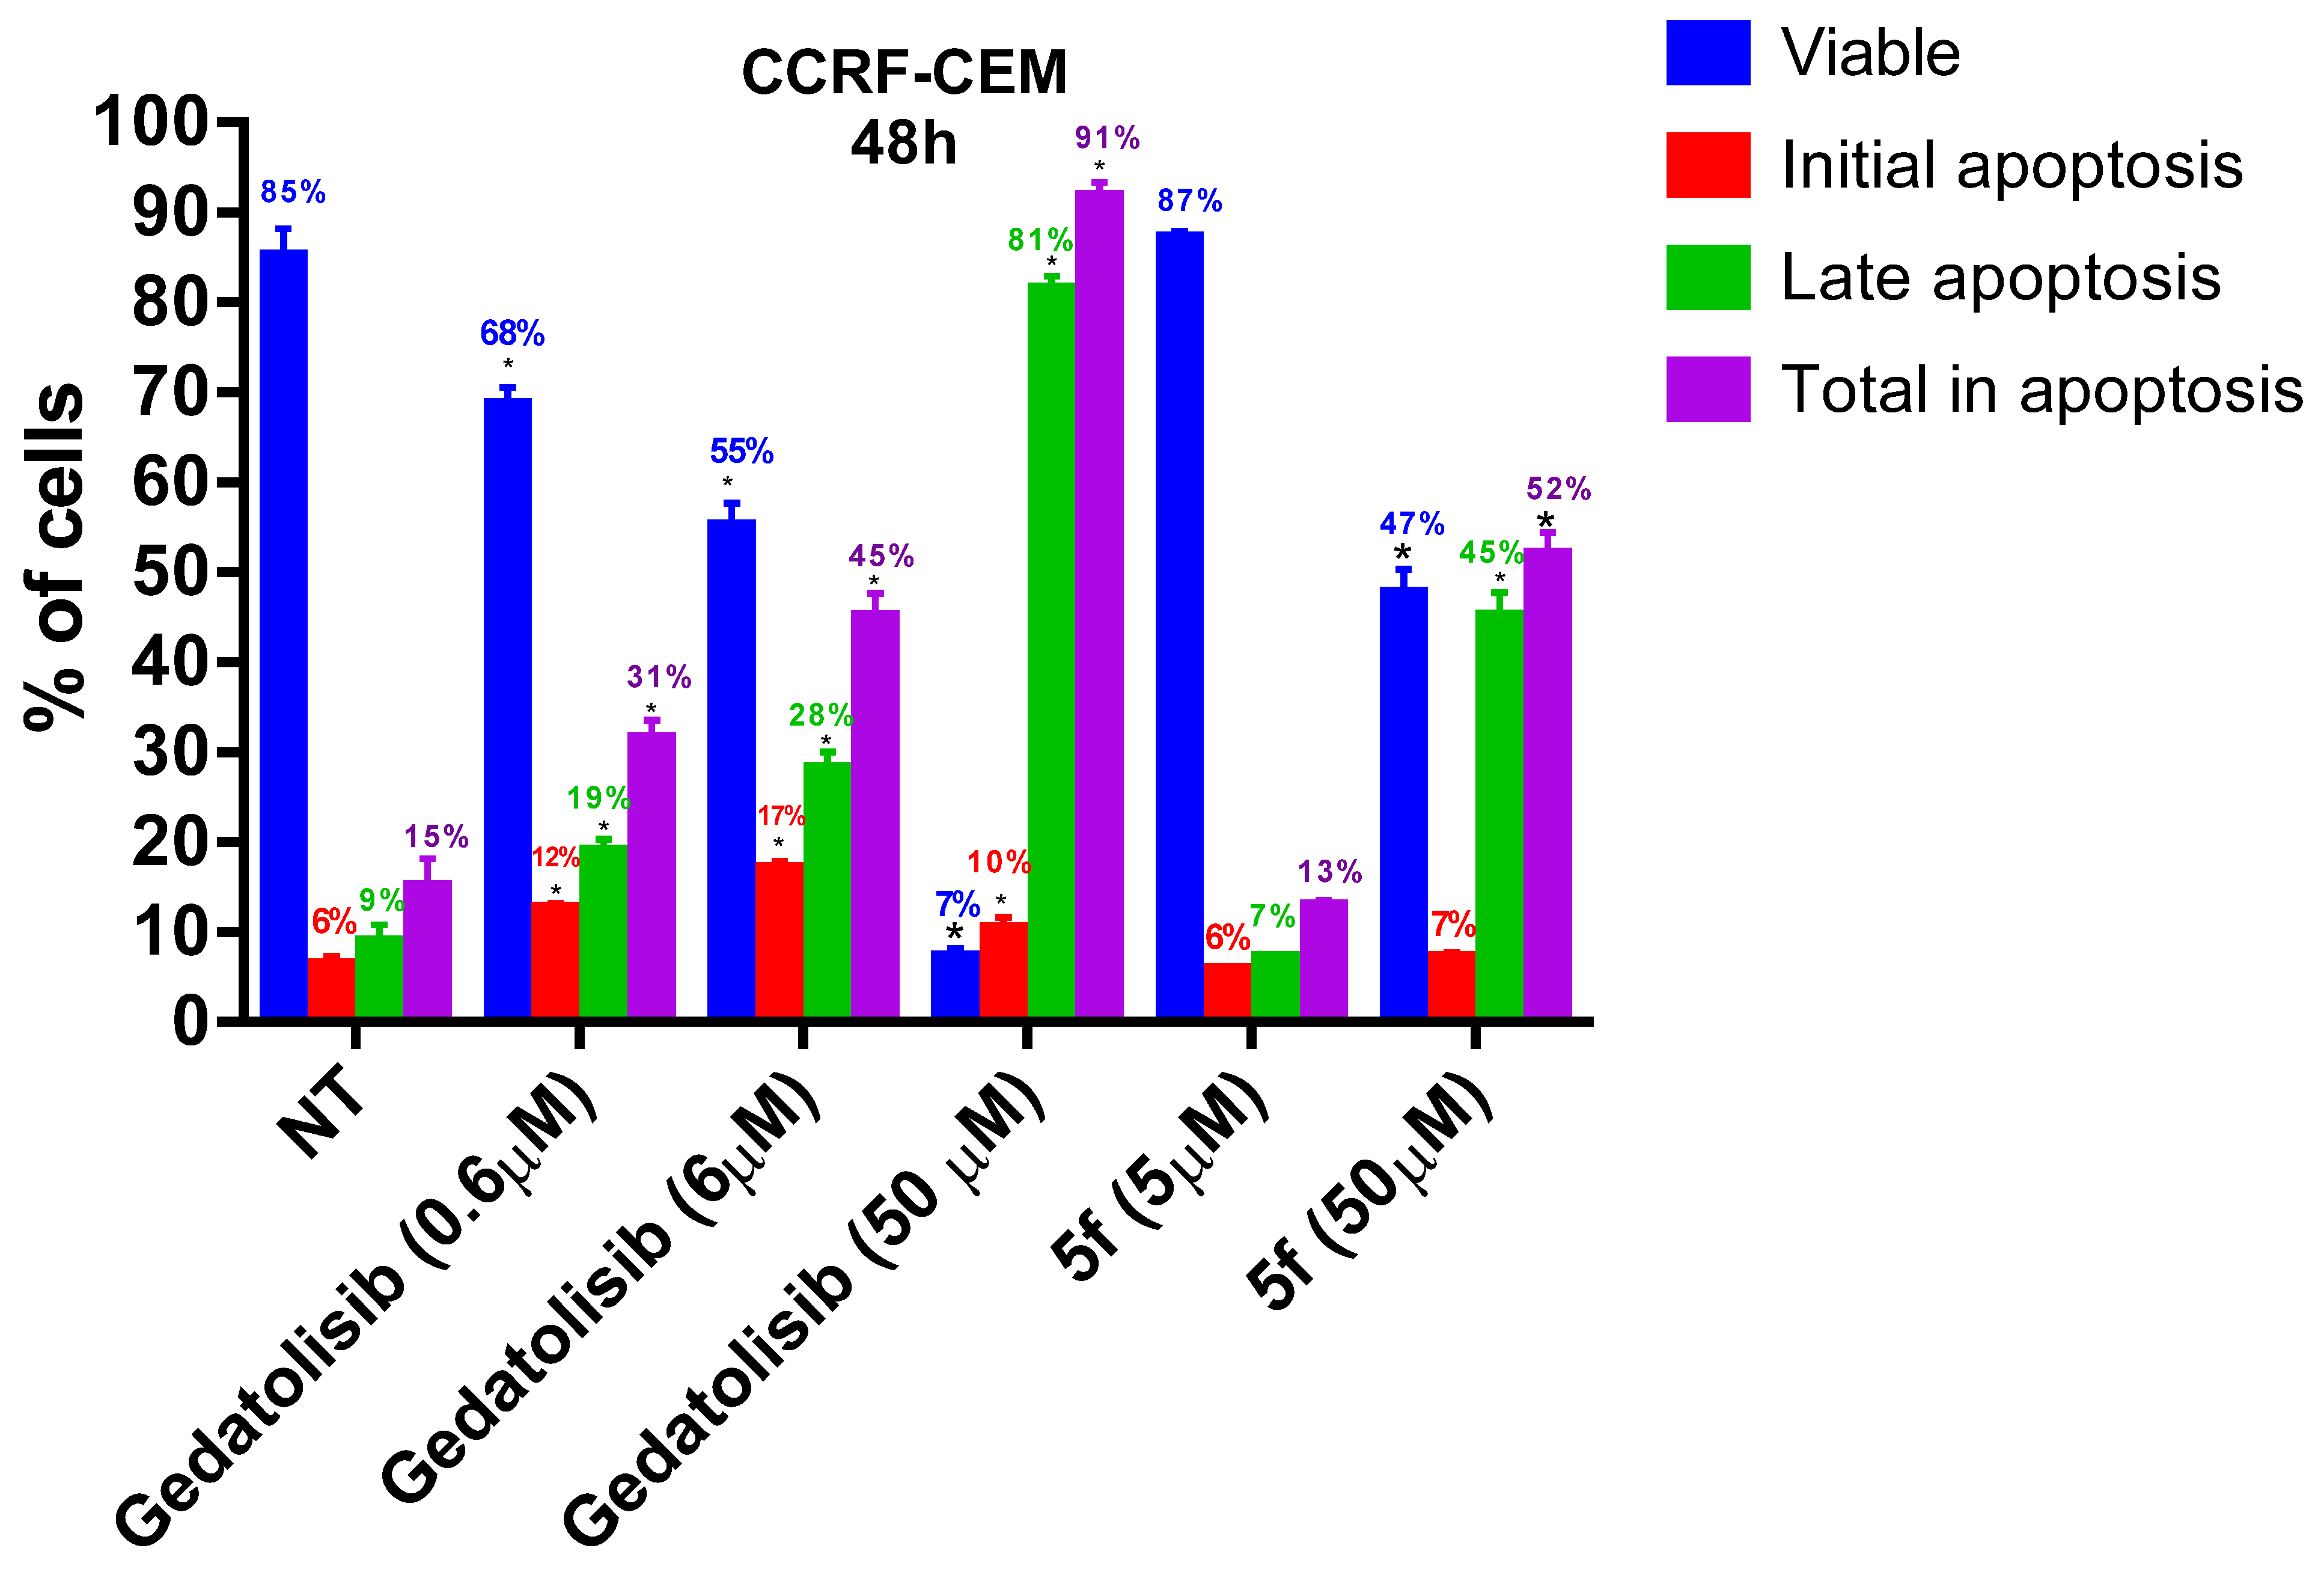
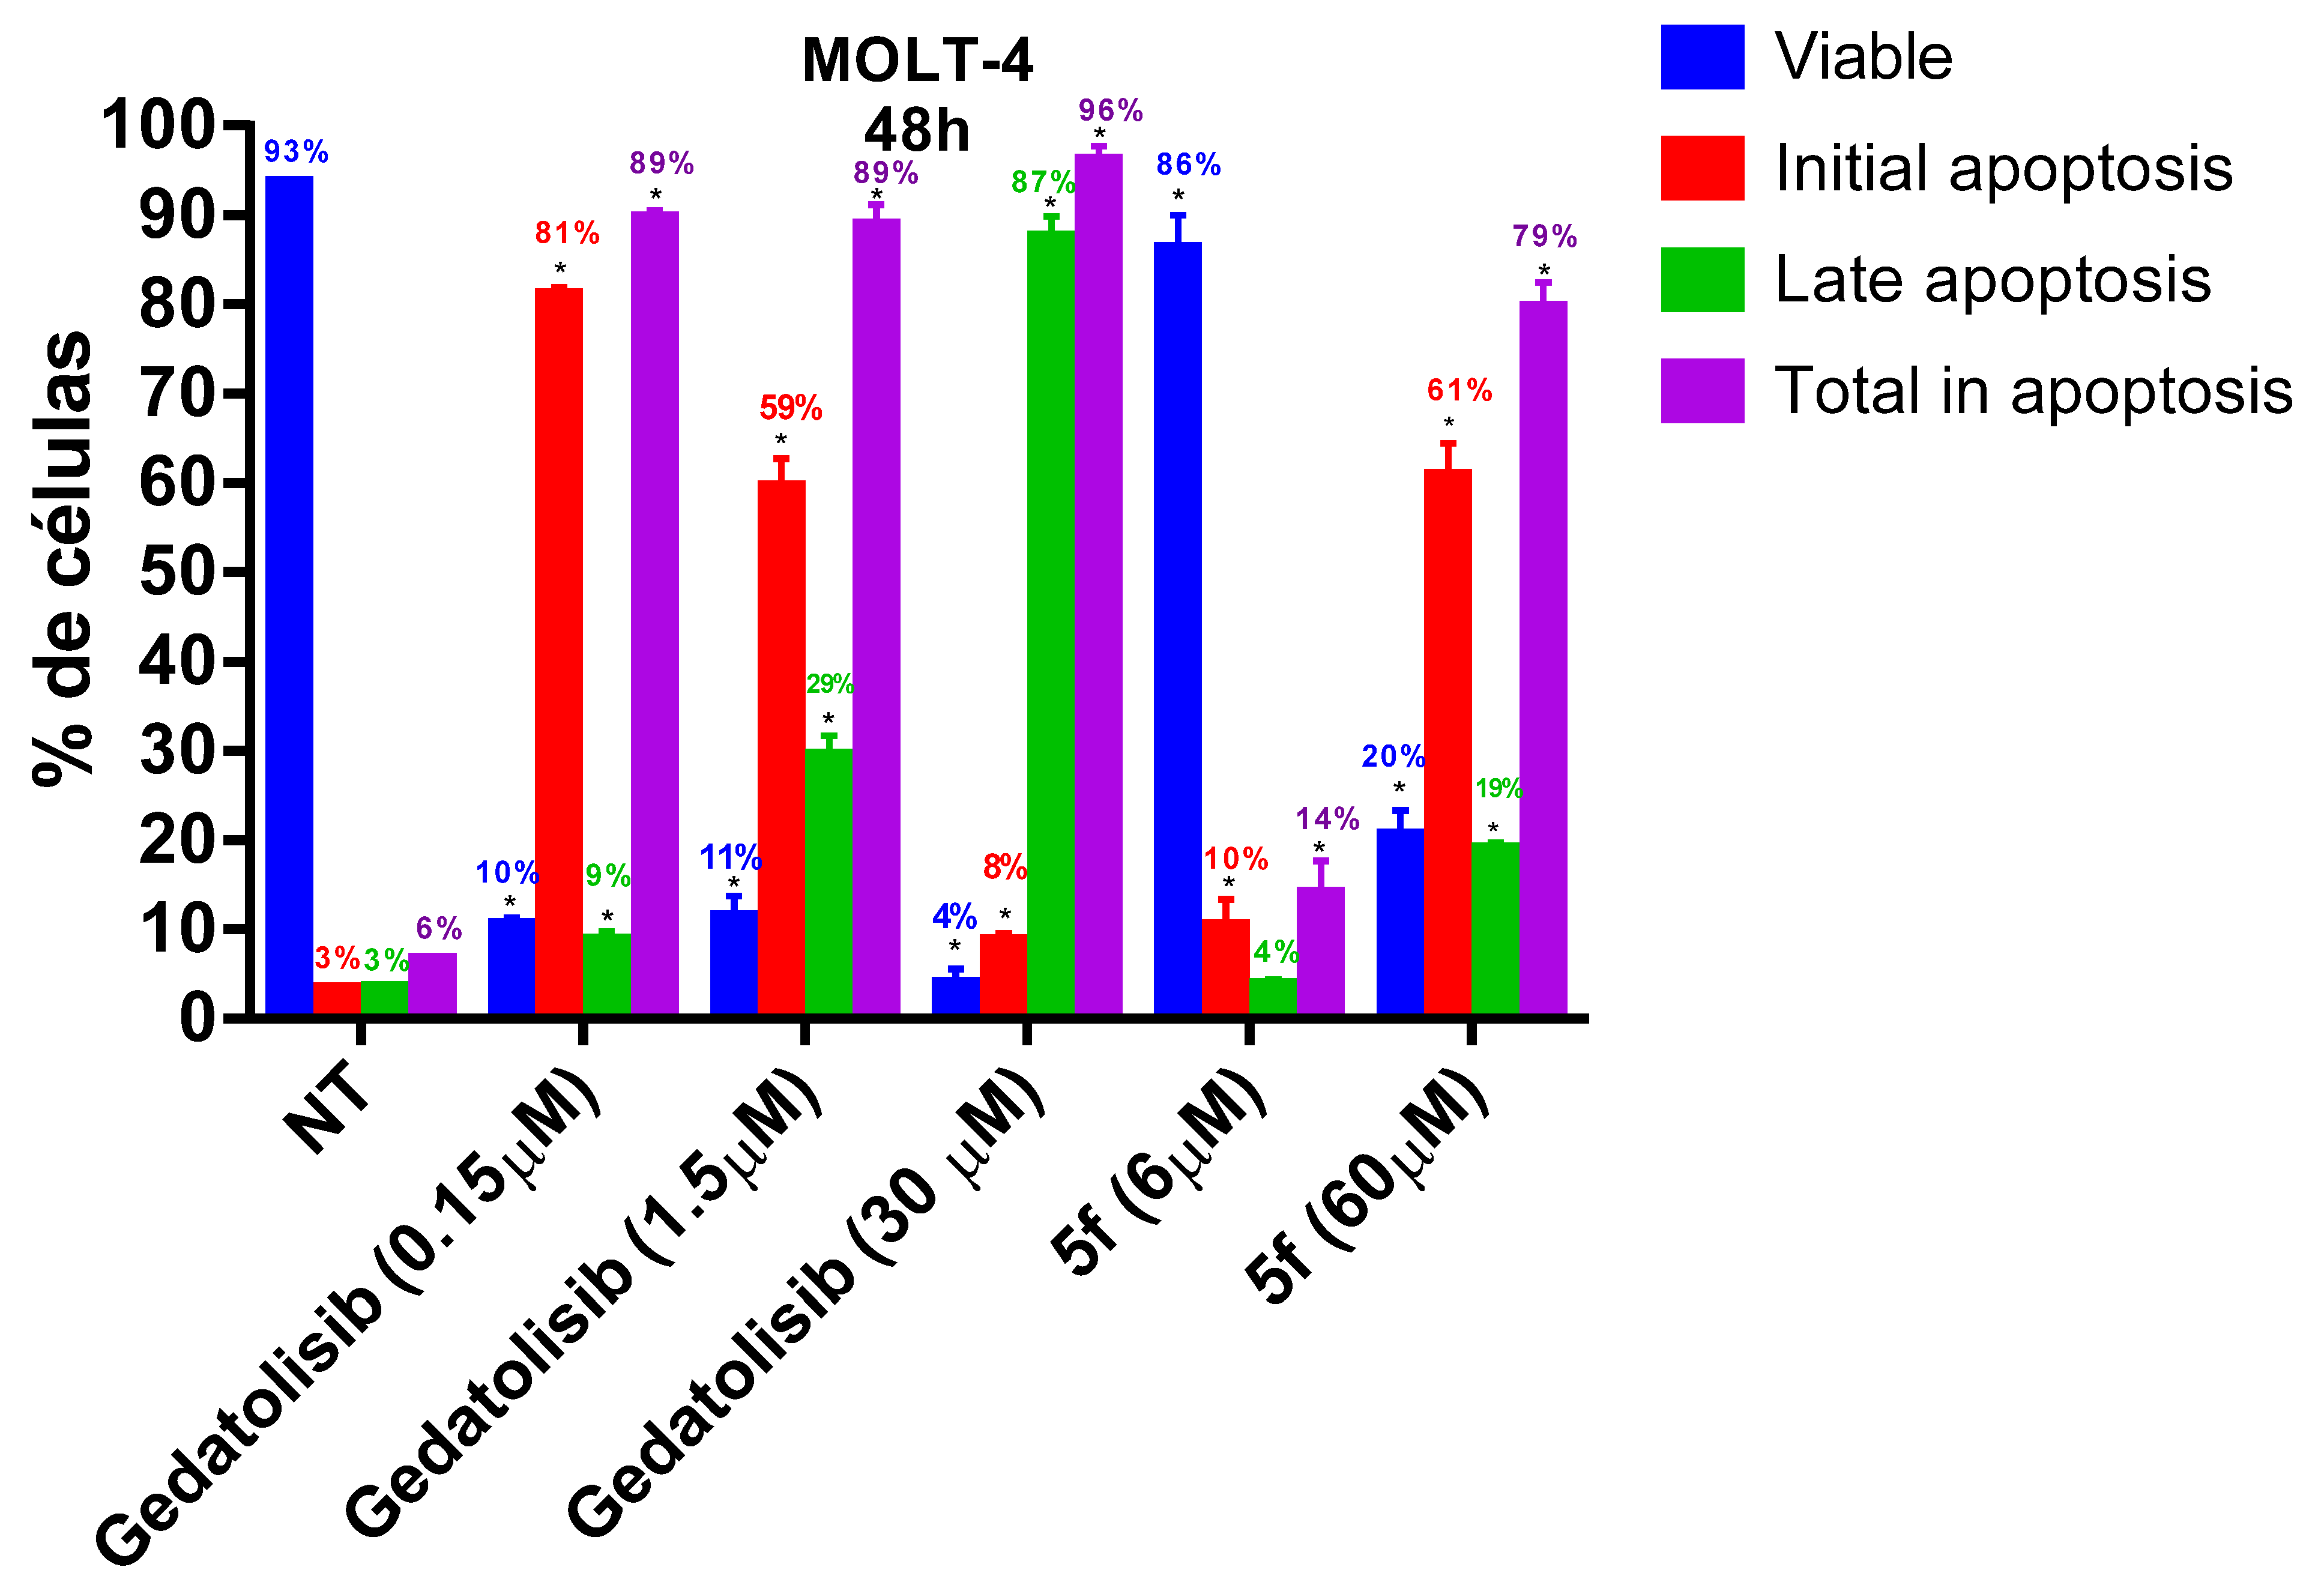
2.2.4. Analysis of Phosphatidylserine Externalization and Cell Membrane Integrity
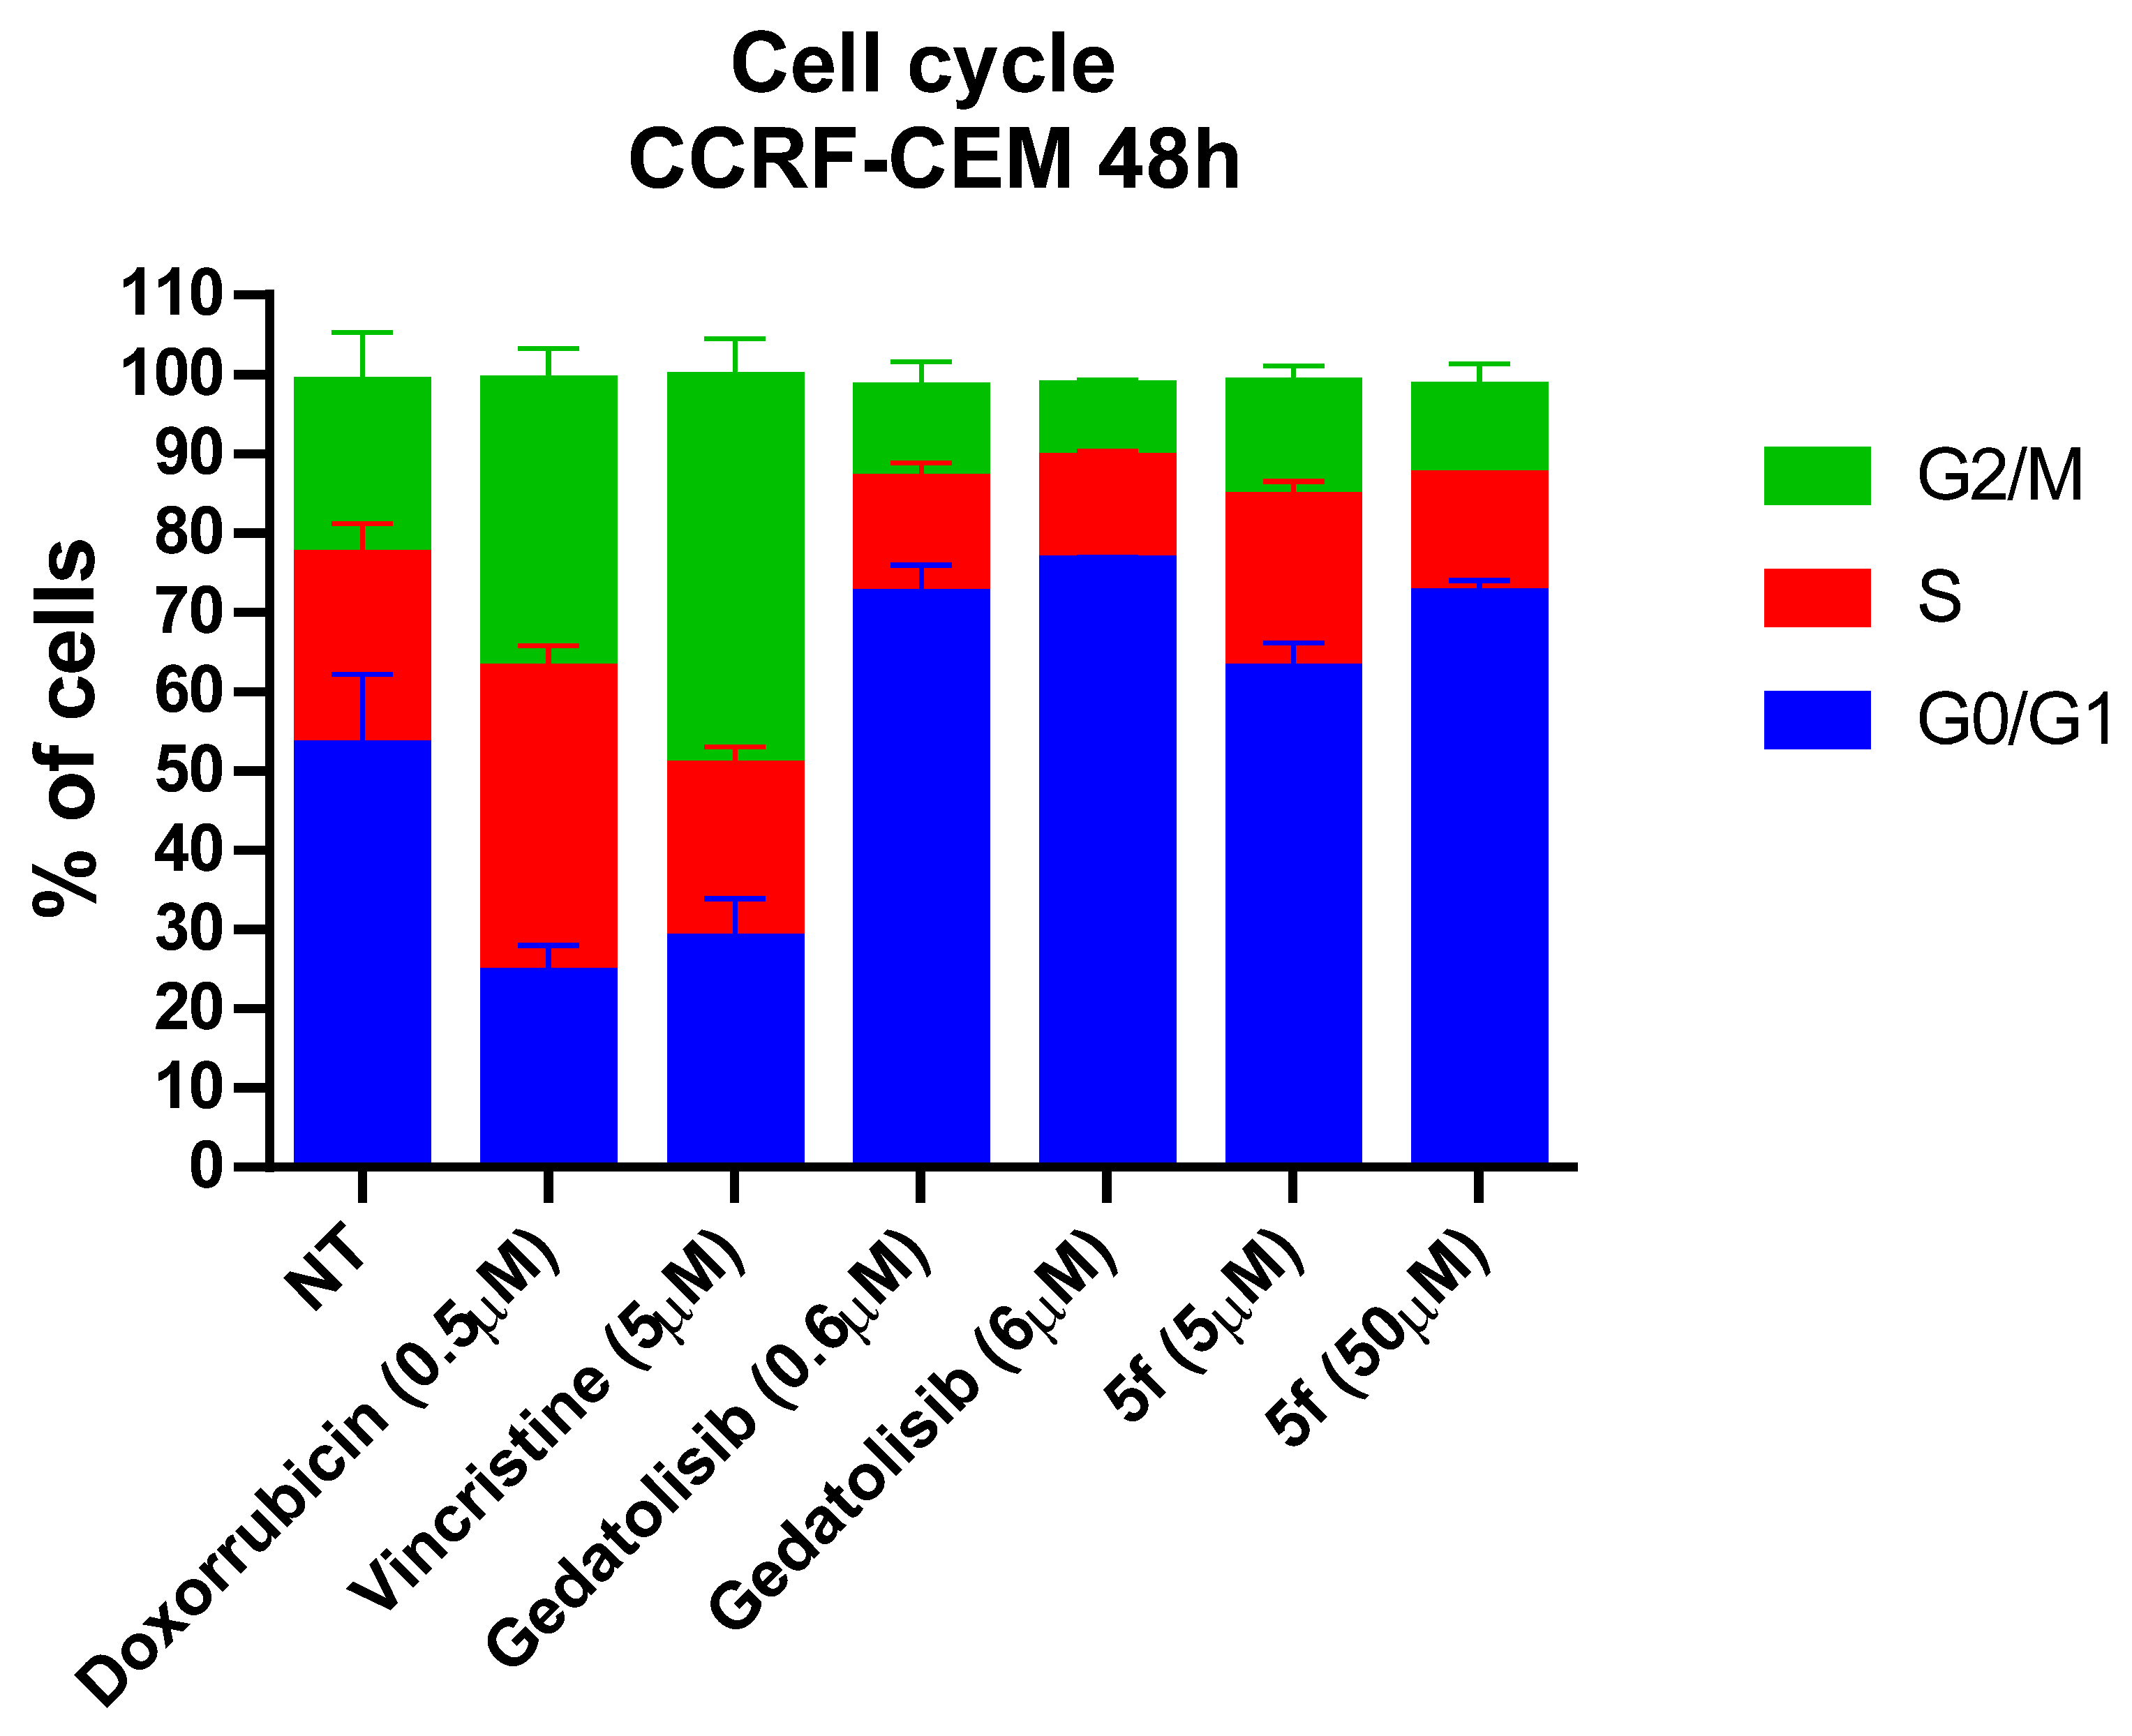
2.2.5. Cell Cycle Assessment
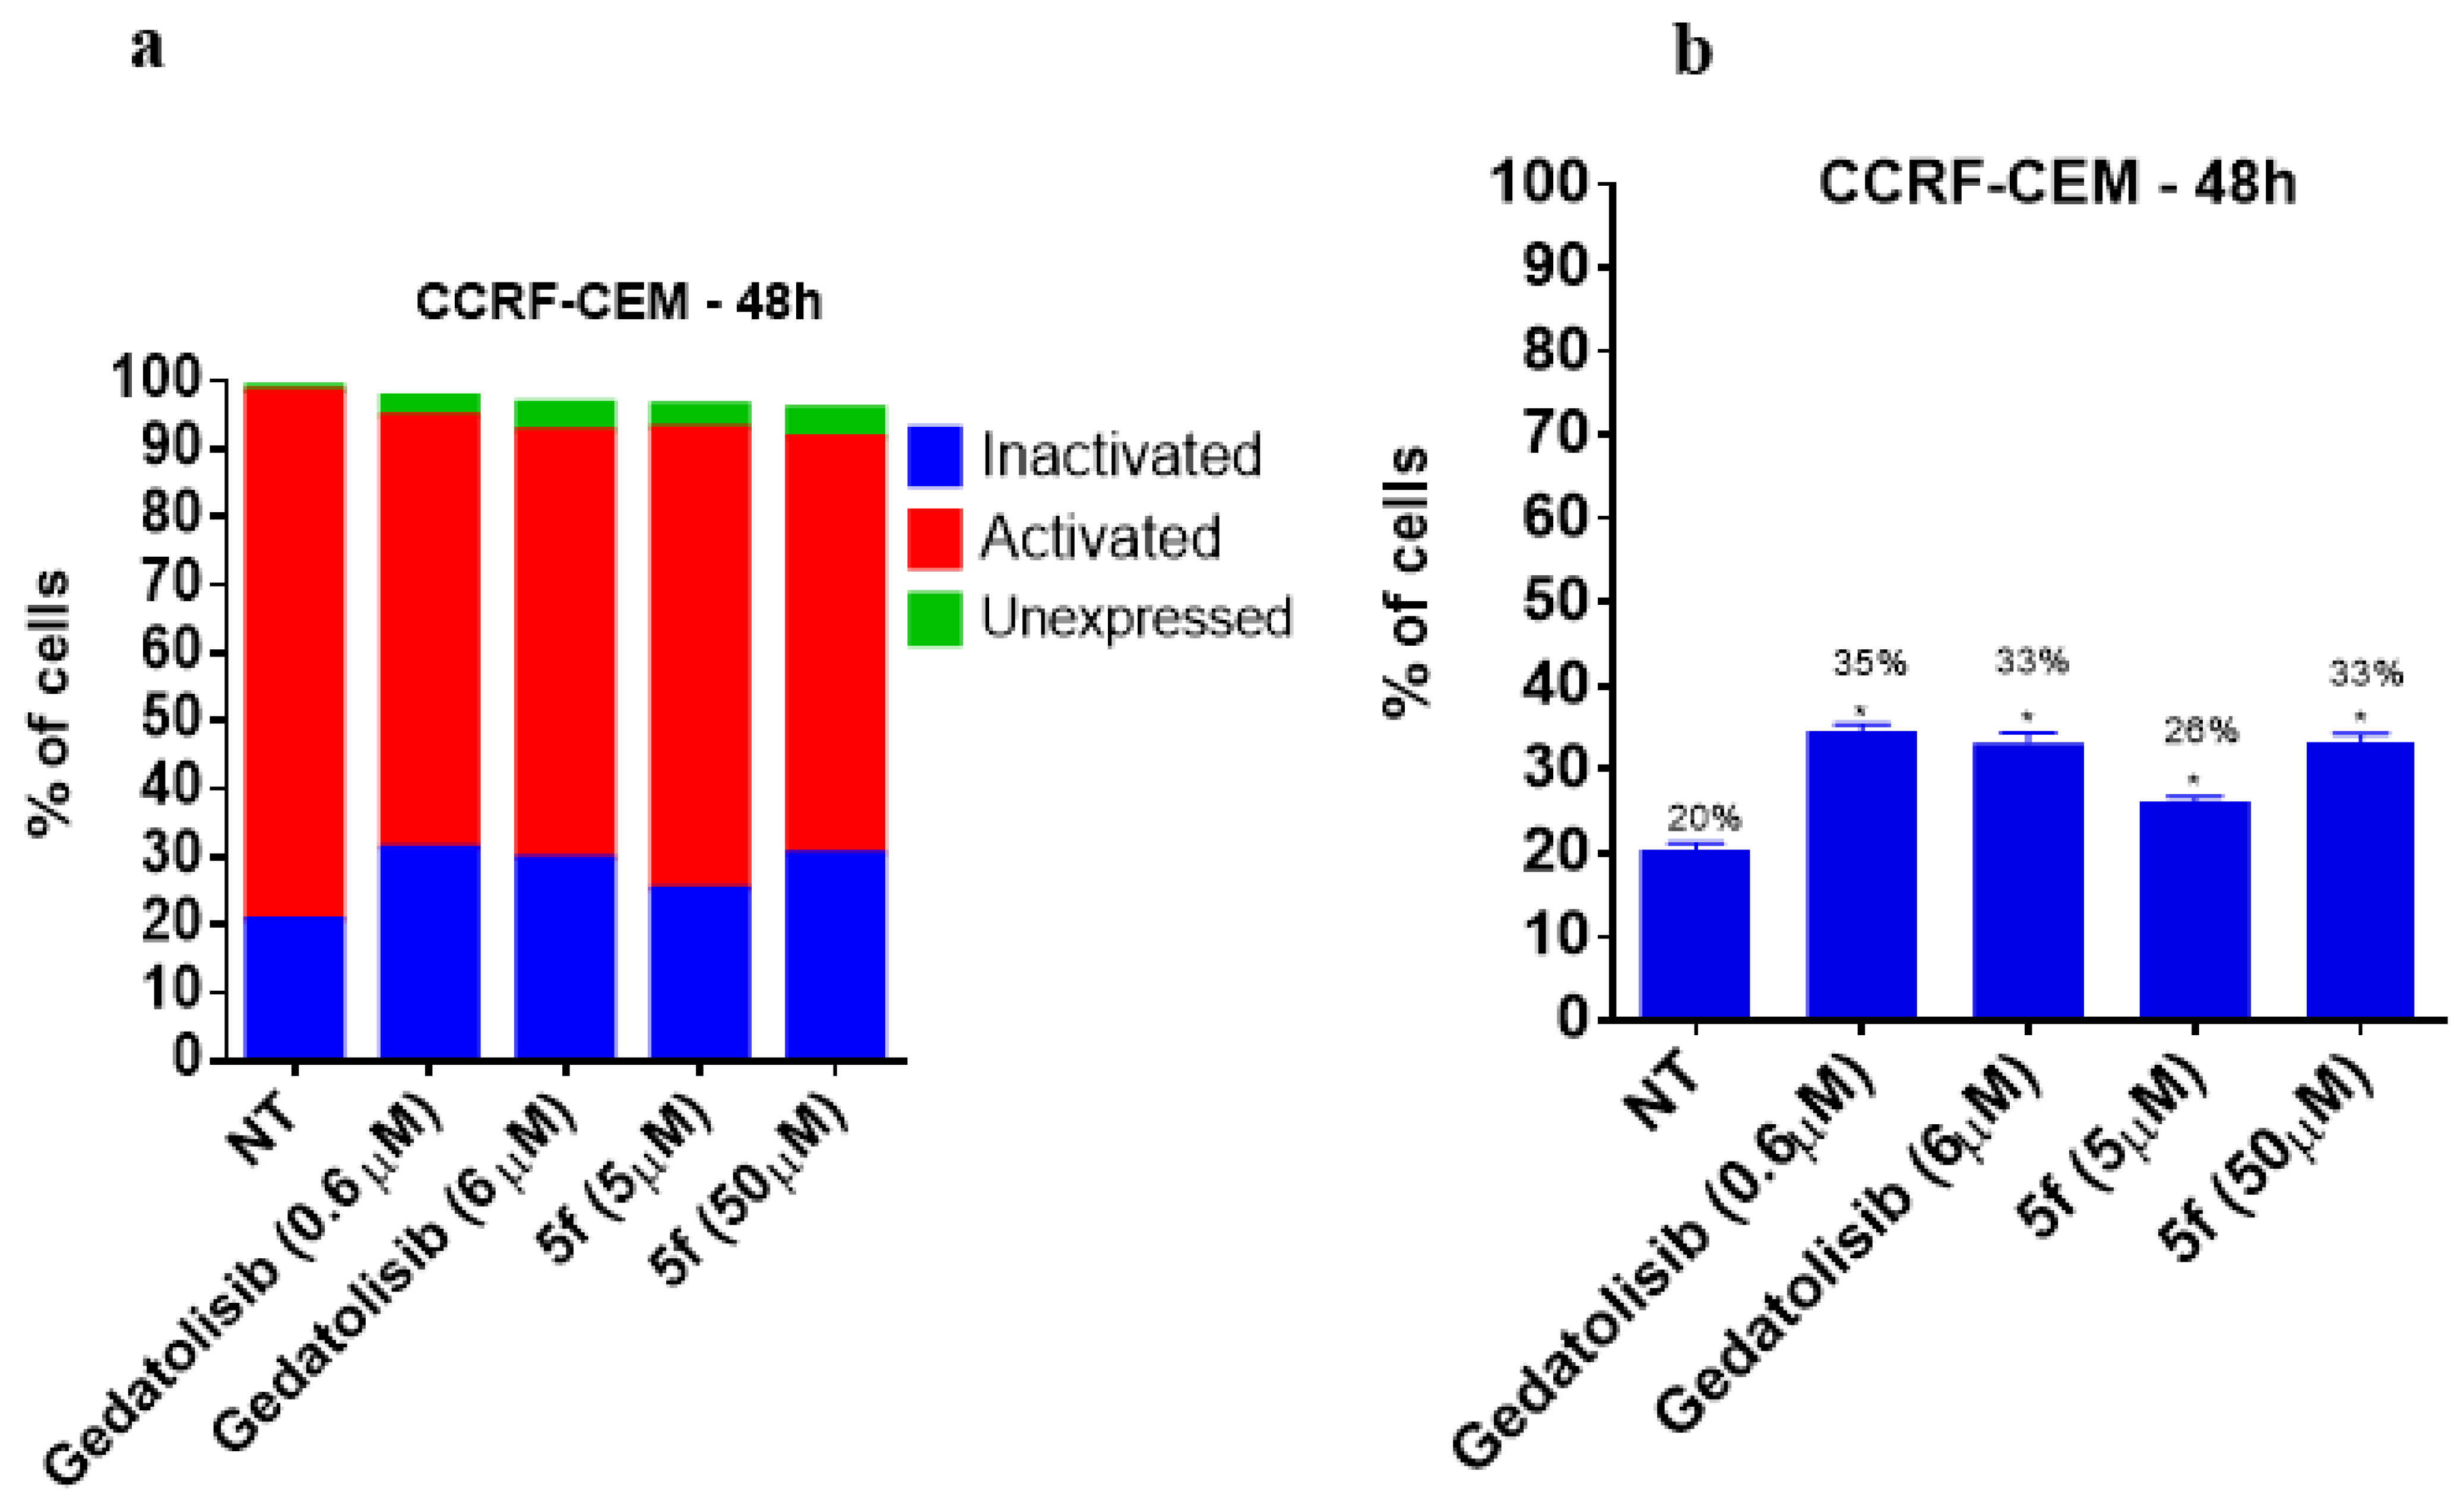
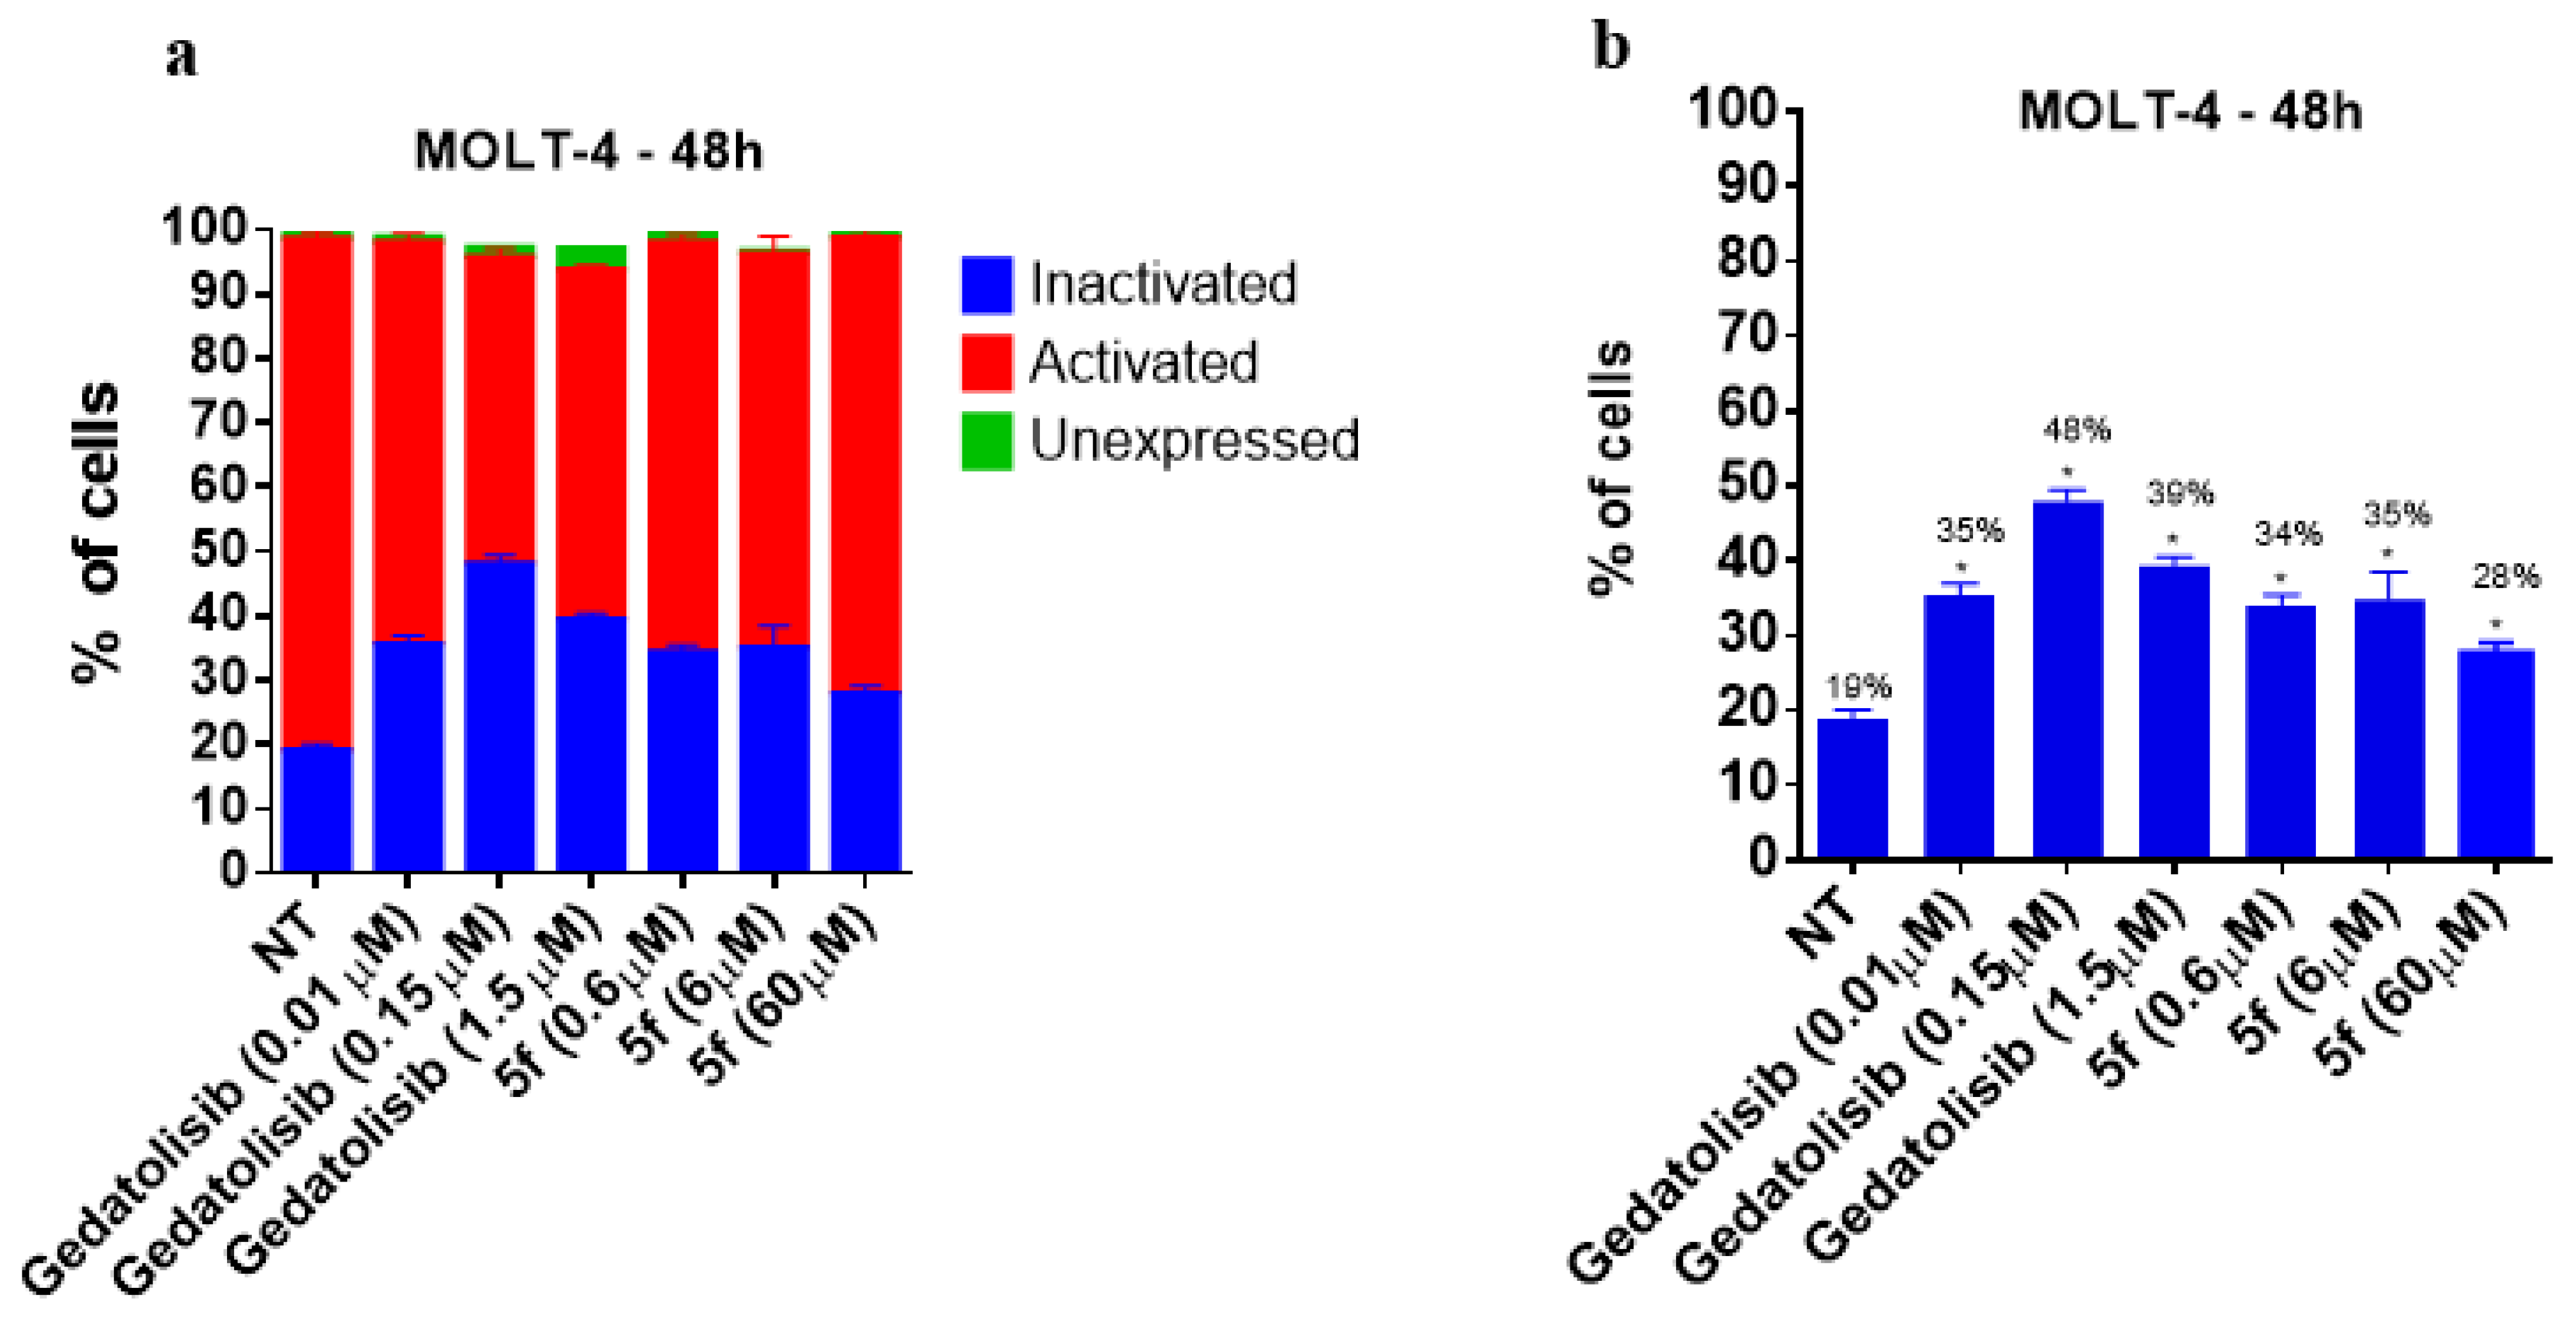
2.2.6. Analysis of PI3K Activation and Phosphorylation
2.2.7. Microsomal Metabolic Stability
3. Material and Methods
3.1. Synthesis and Characterization
3.1.1. Procedure of the Preparation of 4-(4,6-Dichloro-1,3,5-triazin-2-yl)morpholine (7) (Adapted from Reference [22])
3.1.2. Procedure of the Preparation of 4-(4-Chloro-6-(4-Phenylpiperazin-1-yl)-1,3,5-triazin-2-yl)morpholine (8) (Adapted from Reference [22])
3.1.3. General Procedure for the Preparation of N-Substituted Triazines (5a-f) (Adapted from Reference [22])
4-(4-(4-Phenylpiperazin-1-yl)-6-(piperidin-1-yl)-1,3,5-triazin-2-yl)morpholine (LASSBio-2247, 5a)
4-(4-(4-Methylpiperazin-1-yl)-6-(4-phenylpiperazin-1-yl)-1,3,5-triazin-2-yl)morpholine (LASSBio-2248, 5b)
2-(4-(4-Morpholino-6-(4-phenylpiperazin-1-yl)-1,3,5-triazin-2-yl)piperazin-1-yl)ethan-1-ol (LASSBio-2249, 5c)
4-(4-(4-Phenylpiperazin-1-yl)-6-thiomorpholino-1,3,5-triazin-2-yl)morpholine (LASSBio-2250, 5d)
4-(4-(4-Phenylpiperazin-1-yl)-6-(piperidin-1-yl)-1,3,5-triazin-2-yl)morpholine (LASSBio-2251, 5e)
4-(4-(1,4-Diazepan-1-yl)-6-(4-phenylpiperazin-1-yl)-1,3,5-triazin-2-yl)morpholine (LASSBio-2252, 5f)
3.2. pH-Dependent Aqueous Solubility
3.3. Cell Culture
3.4. Cancer Cell Viability Assay
3.5. PBMC Viability Assay
3.6. Flow Cytometry Analysis
3.6.1. Count and Viability Test
3.6.2. Analysis of Apoptosis by Annexin V
3.6.3. Cell Cycle Arrest
3.6.4. Evaluation of PI3K Activation and Phosphorylation
3.7. Microsomal Metabolic Stability
4. Conclusions
Supplementary Materials
Author Contributions
Funding
Institutional Review Board Statement
Informed Consent Statement
Data Availability Statement
Acknowledgments
Conflicts of Interest
References
- Andrs, M.; Korabecny, J.; Jun, D.; Hodny, Z.; Bartek, J.; Kuca, K. Phosphatidylinositol 3-kinase (PI3K) and Phosphatidylinositol 3-kinase-related kinase (PIKK) Inhibitors: Importance of the Morpholine ring. J. Med. Chem. 2015, 58, 41–71. [Google Scholar] [CrossRef]
- Kawada, H.; Ebiike, H.; Tsukazaki, M.; Nakamura, M.; Morikami, K.; Yoshinari, K.; Yoshida, M.; Ogawa, K.; Shimma, N.; Tsukuda, T.; et al. Lead optimization of a dihydropyrrolopyrimidine inhibitor against phosphoinositide 3-kinase (PI3K) to improve the phenol glucutonic acid conjugation. Bioorg. Med. Chem. Lett. 2013, 23, 673–678. [Google Scholar] [CrossRef]
- Kawada, H.; Ebiike, H.; Tsukazaki, M.; Yamamoto, S.; Koyama, K.; Nakamura, M.; Morikami, K.; Yoshinari, K.; Yoshida, M.; Ogawa, K.; et al. Modification of a dihydropyrrolopyrimidine phosphoinositide 3-kinase (PI3K) inhibitor to improve oral bioavailability. Bioorg. Med. Chem. 2015, 23, 7650–7660. [Google Scholar] [CrossRef] [PubMed]
- Vanhaesebroeck, B.; Perry, M.W.; Brown, J.R.; André, F.; Okkenhaug, K. PI3K inhibitors are finally coming of age. Nat. Rev. Drug Discov. 2021, 20, 741–769. [Google Scholar] [CrossRef]
- Zhang, M.; Jang, H.; Nussinov, R. PI3K inhibitors: Review and new strategies. Chem. Sci. 2020, 11, 5855. [Google Scholar] [CrossRef]
- Meng, D.; Ele, W.; Zhang, Y.; Liang, Z.; Zheng, J.; Zhang, X.; Zheng, X.; Zhan, P.; Chen, H.; Li, W.; et al. Development of PI3K inhibitors: Advances in clinical trials and new strategies (Review). Pharmacol. Res. 2021, 173, 105900. [Google Scholar] [CrossRef]
- Tarantelli, C.; Lupia, A.; Stathis, A.; Bertoni, F. Is there a role for dual PI3K/mTOR Inhibitors for patients Affected with Lymphoma? Int. J. Mol. Sci. 2020, 21, 1060. [Google Scholar] [CrossRef]
- Mahajan, D.; Sen, S.; Kuila, B.; Sharma, A.; Arora, R.; Sagar, M.; Mahapatra, A.R.; Gawade, L.B.; Dugar, S. Discovery and Development of SPR519 as a Potent, Selective, and Orally Bioavailable Inhibitor of PI3Kα and mTOR Kinases for the Treatment of Solid Tumors. J. Med. Chem. 2020, 63, 11121–11130. [Google Scholar] [CrossRef]
- Ohwada, J.; Ebiike, H.; Kawada, H.; Tsukazaki, M.; Nakamura, M.; Miyazaki, T.; Morikami, K.; Yoshinari, K.; Yoshida, M.; Kondoh, O.; et al. Discovery and biological activity of a novel class I PI3K inhibitor, CH5132799. Bioorg. Med. Chem. Lett. 2011, 21, 1767–1772. [Google Scholar] [CrossRef] [PubMed]
- Venkatesan, A.M.; Dehnhardt, C.M.; Santos, E.D.; Chen, Z.; Santos, O.; Ayral-Kaloustian, S.; Khafizova, G.; Brooijmans, N.; Mallon, R.; Hollander, I.; et al. Bis (morpholino-1, 3, 5-triazine) derivatives: Potent adenosine 5′-triphosphate competitive phosphatidylinositol-3-kinase/mammalian target of rapamycin inhibitors: Discovery of compound 26 (PKI-587), a highly efficacious dual inhibitor. J. Med. Chem. 2010, 53, 2636–2645. [Google Scholar] [CrossRef] [PubMed]
- Lima, L.M.; Barreiro, E.J. Bioisosterism: A Useful Strategy for Molecular Modification and Drug Design. Curr. Med.Chem. 2005, 12, 23–49. [Google Scholar] [CrossRef]
- Lima, L.M.; Barreiro, E.J. Beyond Bioisosterism: New Concepts in Drug Discovery. In Reference Module in Chemistry, Molecular Sciences and Chemical Engineering; Elsevier: Amsterdam, The Netherlands, 2017; pp. 186–210. [Google Scholar] [CrossRef]
- Lima, L.M.; Alves, M.A.; Amaral, D.N. Homologation: A Versatile Molecular Modification Strategy to Drug Discovery. Curr. Top. Med. Chem. 2019, 19, 1–17. [Google Scholar] [CrossRef] [PubMed]
- Gazi, M.; Moharram, S.A.; Marhall, A.; Kazi, J.U. The dual specificity PI3K/mTOR inhibitor PKI-587 displays efficacy Q7 against T-cell acute lymphoblastic leukemia (T-ALL). Cancer Lett. 2017, 392, 9–16. [Google Scholar] [CrossRef] [PubMed]
- Mallon, R.; Feldberg, L.R.; Lucas, J.; Chaudhary, I.; Dehnhardt, C.; Santos, E.D.; Chen, Z.; dos Santos, O.; Ayral-Kaloustian, S.; Venkatesan, A.; et al. Antitumor Efficacy of PKI-587, a Highly Potent Dual PI3K/mTOR Kinase Inhibitor. Clin. Cancer Res. 2011, 17, 3193–3203. [Google Scholar] [CrossRef]
- Catalingam, K.; Abas, F.; Lajis, N.H.; Othman, I.; Naidu, R. Anti-Proliferative Effect and Induction of Apoptosis in Androgen-Independent Human Prostate Cancer Cells By 1,5-Bis(2-Hydroxyphenyl)-1,4-Pentadiene-3-One. Molecules 2015, 20, 3406–3430. [Google Scholar] [CrossRef]
- HuangFu, W.C.; Chao, M.W.; Cheng, C.C.; Wei, Y.C.; Wu, Y.W.; Liou, J.P.; Yang, C.R. Anti-leukemia effects of the novel synthetic 1-benzylindole derivative 21-900 in vitro and in vivo. Sci. Rep. 2017, 7, 1–12. [Google Scholar] [CrossRef]
- Svensson, S.; Lindgren, S.; Powell, W.; Green, H. Melanin inhibits cytotoxic effects of doxorubicin and daunorubicin in MOLT 4 cells. Pigment Cell Res. 2003, 16, 351–354. [Google Scholar] [CrossRef]
- Giacomo, S.D.; Sotto, A.D.; El-Read, M.Z.; Mazzant, G.; Wink, M. α-Hexylcinnamaldehyde synergistically increases doxorubicin cytotoxicity towards human cancer cell lines. Anticancer. Res. 2016, 36, 3347–3351. [Google Scholar]
- Mozaffari, S.; Salehi, D.; Mahdipoor, P.; Beuttler, R.; Tiwari, R.; Aliabadi, H.M.; Parang, K. Design and application of hybrid cyclic-linear peptide-doxorubicin conjugates as a strategy to overcome doxorubicin resistance and toxicity. Eur. J. Med. Chem. 2021, 226, 113836. [Google Scholar] [CrossRef]
- Fekete, M.; Santiskulvong, C.; Eng, C.; Dorigo, O. Effect of PI3K/Akt pathway inhibition-mediated G1 arrest on chemosensitization in ovarian cancer cells. Anticancer. Res. 2012, 32, 445–452. [Google Scholar]
- Zaydi, K.M.; Khalil, H.H.; El-Faham, A.; Khattab, S.N. Synthesis, characterization and evaluation of 1,3,5 triazine aminobenzoic acid derivatives for their antimicrobial activity. Chem. Cent. J. 2017, 1, 1–12. [Google Scholar] [CrossRef]
- Dugar, S.; Hollinger, F.P.; Mahajan, D.; Sen, S.; Kuila, B.; Arora, R.; Pawar, Y.; Shinde, V.; Rahinj, M.; Kapoor, K.K.; et al. Discovery of Novel and Orally Bioavailable Inhibitors of PI3 Kinase Based on Indazole Substituted Morpholino-Triazines. Med. Chem. Lett. 2015, 6, 1190–1194. [Google Scholar] [CrossRef]
- Schneider, P.; Hosseiny, S.S.; Szczotka, M.; Jordan, V.; Schlitter, K. Rapid solubility determination of the triterpenes oleanolic acid and ursolic acid by UV-spectroscopy in different solvents. Phytochem. Lett. 2009, 2, 85–87. [Google Scholar] [CrossRef]
- Nunes, I.K.C.; de Souza, E.T.; Roseno Martins, I.R.R.; Barbosa, G.; de Moraes Junior, M.O.; Medeiros, M.M.; Silva, S.W.D.; Balliano, T.L.; da Silva, B.A.; Silva, P.M.R.; et al. Discovery of sulfonyl hydrazone derivative as a new selective PDE4A and PDE4D inhibitor by lead-optimization approach on the prototype LASSBio-448: In vitro and in vivo preclinical studies. Eur. J. Med. Chem. 2020, 204, 112492. [Google Scholar] [CrossRef] [PubMed]
- Mosmann, T. Rapid colorimetric assay for cellular growth and survival: Application to proliferation and cytotoxic assay. J. Immunol. Methods 1983, 65, 55–63. [Google Scholar] [CrossRef]
- Liu, Y.; Peterson, D.A.; Kimura, H.; Schubert, D. Mechanism of cellular 3-(4, 5-dimethylthiazol-2-yl)-2, 5-diphenyltetrazolium bromide (MTT) reduction. J. Neurochem. 1997, 69, 581–593. [Google Scholar] [CrossRef] [PubMed]
- Koyanagi, M.; Kawakabe, S.; Arimura, Y. A comparative study of colorimetric cell proliferation assays in immune cells. Cytotechnology 2016, 68, 1489–1498. [Google Scholar] [CrossRef] [PubMed]
- Amorim, C.S.; Moraes, J.A.; Magdalena, I.J.; López, S.G.; Carneiro, A.C.D.; Nunes, I.K.C.; Pizzatti, L.; Sardela, V.F.; Neto, F.R.A.; Mitotti, L.C.; et al. Extracellular vesicles vrom stored red blood cells convey ceme and induce spic expression on human monocytes. Front. Immunol. 2022, 13, 833286. [Google Scholar] [CrossRef] [PubMed]
- de Queiroz, A.C.; Barbosa, G.; de Oliveira, V.R.T.; de Mattos Alves, H.; Alves, M.A.; Carregaro, V.; Santana da Silva, J.; Barreiro, E.J.; Alexandre-Moreira, M.S.; Lima, L.M.; et al. Pre-clinical evaluation of LASSBio-1491: From in vitro pharmacokinetic study to in vivo leishmanicidal activity. PLoS ONE 2022, 17, e0269447. [Google Scholar] [CrossRef]
- Obach, R.S.; Baxter, J.G.; Liston, T.E.; Silber, B.S.; Jones, B.C. The Prediction of Human Pharmacokinetic Parameters fromPreclinical and In Vitro metabolism Data. THE J. Pharmacol. Exp. Ther. 1997, 283, 46–58. [Google Scholar]


 | ||||||
| Compounds | R | Solubility pH 7.4 (µM) | Solubility pH 5.8 (µM) | cLogP | cLogD7.4 | cLogD5.8 |
| 5a | Thiomorpholine | 2.88 | 0.52 | 3.42 | 2.65 | 0.84 |
| 5b | Piperidine | 0.51 | 2.84 | 4.08 | 3.08 | 1.48 |
| 5c | Piperazine | 59.13 | 43.35 | 2.58 | 1.08 | −1.61 |
| 5d | N-methylpiperazine | 50.92 | 30.69 | 2.97 | 1.81 | −0.67 |
| 5e | Hydroxyethylpiperazine | 49.15 | 31.19 | 2.7 | 1.84 | −0.67 |
| 5f | Homopiperazine | 42.38 | 39.33 | 2.96 | 0.09 | 1.25 |
| 9 (CAS−942789959) | Morpholine | 6.03 | 3.92 | 2.54 | −1.77 | −1.25 |
| Cell Line | Gedatolisib CC50 72 h (µM) | GSK-1059615 CC50 (µM) |
|---|---|---|
| PC-3 | 0.54 (0.27–1.08) Emax = 80% | 6.78 (3.46–13.26) Emax: 67% |
| MCF7 | 0.07 (0.03–0.20) Emax = 87% | 0.55 (0.27–1.12) Emax: 80% |
| K562 | 24.09 (15.84–36.63) Emax = 64% | 1.82 (1.24–2.68) Emax = 84% |
| CCRF-CEM | 0.03 (0.01–0.05) Emax = 90% | 0.43 (0.09–1.95) Emax = 93% |
| MOLT-4 | 0.02 (0.01–0.03) Emax = 93% | 0.63 (0.13–3.07) Emax = 92% |
| Cell Line | 5c (LASSBio-2247) CC50 (µM) | 5d (LASSBio-2248) CC50 (µM) | 5f (LASSBio-2252) CC50 (µM) |
|---|---|---|---|
| PC-3 | 92.29 (39.92–213.40) Emax = 58% | 91.31 (60.23–138.40) Emax = 72% | 62.15 (55.72–69.33) Emax = 84% |
| MCF7 | >100 Emax: 57% | >100 Emax = 77% | 37.04 (31.82–43.12) Emax = 91% |
| K562 | 25.63 (18.83–33.13) Emax = 85% | 50.22 (40.23–62.69) Emax = 80% | 23.41 (16.31–33.59) Emax = 84% |
| CCRF-CEM | 37.33 (28.61–48.71) Emax = 94% | 66.50 (61.35–72.09) Emax = 95% | 6.25 (4.10–9.54) Emax = 93% |
| MOLT-4 | 31.84 (23.48–43.17) Emax = 93% | 64.07 (57.45–71.45) Emax = 91% | 9.76 (5.44–17.53) Emax = 93% |
| Cell Line | Gedatolisib CC50 (µM) | 5f (LASSBio-2252) CC50 (µM) |
|---|---|---|
| CCRF-CEM | 0.14 (0.07–0.28) Emax = 94% | 11.1 µM (5.53–22.29) Emax = 69% |
| MOLT-4 | 0.15 (0.06–0.31) Emax = 92% | 36.48 (27.33–49.76) Emax = 80% |
| Cell Line | Gedatolisib CC50 (µM) 72 h | Gedatolisib CC50 (µM) 48 h | 5f CC50 (µM) 72 h | 5f CC50 (µM) 48 h |
|---|---|---|---|---|
| CCRF-CEM | 6.15 (4.60–8.24) Emax: 94% | 5.88 (4.16–8.32) Emax: 94% | 53.15 (50.30–56.17) Emax: 96% | 48.96 (45.71–52.45) Emax: 95% |
| MOLT-4 | 1.15 (0.85–1.56) Emax: 86% | 1.65 (1.24–2.20) Emax: 82% | 60.78 (58.02–63.66) Emax: 92% | 51.01 (47.89–58.67) Emax: 90% |
| NADPH-Generating System | Metabolization Rates (%) | Elimination Rate Constant (k) | t1/2 (min) | Clapp (mL/min/g) | Recovery (%) |
|---|---|---|---|---|---|
| Present | 2.90 | 0.0015 | 462.00 | 0.058 | 101,0903 |
| Absent | 9.09 | 0.0017 | 407.65 | 0.066 | 100,4186 |
Disclaimer/Publisher’s Note: The statements, opinions and data contained in all publications are solely those of the individual author(s) and contributor(s) and not of MDPI and/or the editor(s). MDPI and/or the editor(s) disclaim responsibility for any injury to people or property resulting from any ideas, methods, instructions or products referred to in the content. |
© 2023 by the authors. Licensee MDPI, Basel, Switzerland. This article is an open access article distributed under the terms and conditions of the Creative Commons Attribution (CC BY) license (https://creativecommons.org/licenses/by/4.0/).
Share and Cite
Costa, C.M.X.; Aparecida-Silva, C.; Gamba, L.E.R.; de Melo, T.N.; Barbosa, G.; Moraes Junior, M.O.d.; de Oliveira, V.R.T.; de Amorim, C.S.; Moraes, J.A.; Barreiro, E.J.; et al. Design, Synthesis and Phenotypic Profiling of Simplified Gedatolisib Analogues. Pharmaceuticals 2023, 16, 209. https://doi.org/10.3390/ph16020209
Costa CMX, Aparecida-Silva C, Gamba LER, de Melo TN, Barbosa G, Moraes Junior MOd, de Oliveira VRT, de Amorim CS, Moraes JA, Barreiro EJ, et al. Design, Synthesis and Phenotypic Profiling of Simplified Gedatolisib Analogues. Pharmaceuticals. 2023; 16(2):209. https://doi.org/10.3390/ph16020209
Chicago/Turabian StyleCosta, Caroline Marques Xavier, Cristiane Aparecida-Silva, Luis Eduardo Reina Gamba, Thalita Neves de Melo, Gisele Barbosa, Manoel Oliveira de Moraes Junior, Victoria Regina Thomaz de Oliveira, Carolinne Souza de Amorim, João A. Moraes, Eliezer Jesus Barreiro, and et al. 2023. "Design, Synthesis and Phenotypic Profiling of Simplified Gedatolisib Analogues" Pharmaceuticals 16, no. 2: 209. https://doi.org/10.3390/ph16020209
APA StyleCosta, C. M. X., Aparecida-Silva, C., Gamba, L. E. R., de Melo, T. N., Barbosa, G., Moraes Junior, M. O. d., de Oliveira, V. R. T., de Amorim, C. S., Moraes, J. A., Barreiro, E. J., & Lima, L. M. (2023). Design, Synthesis and Phenotypic Profiling of Simplified Gedatolisib Analogues. Pharmaceuticals, 16(2), 209. https://doi.org/10.3390/ph16020209