
Plant Alkylbenzenes and Terpenoids in the Form of Cyclodextrin Inclusion Complexes as Antibacterial Agents and Levofloxacin Synergists

 , ,
, , 
Abstract
:1. Introduction
2. Results
2.1. Determination of Inclusion Complex Formation between HPCD and Eugenol, Apiol
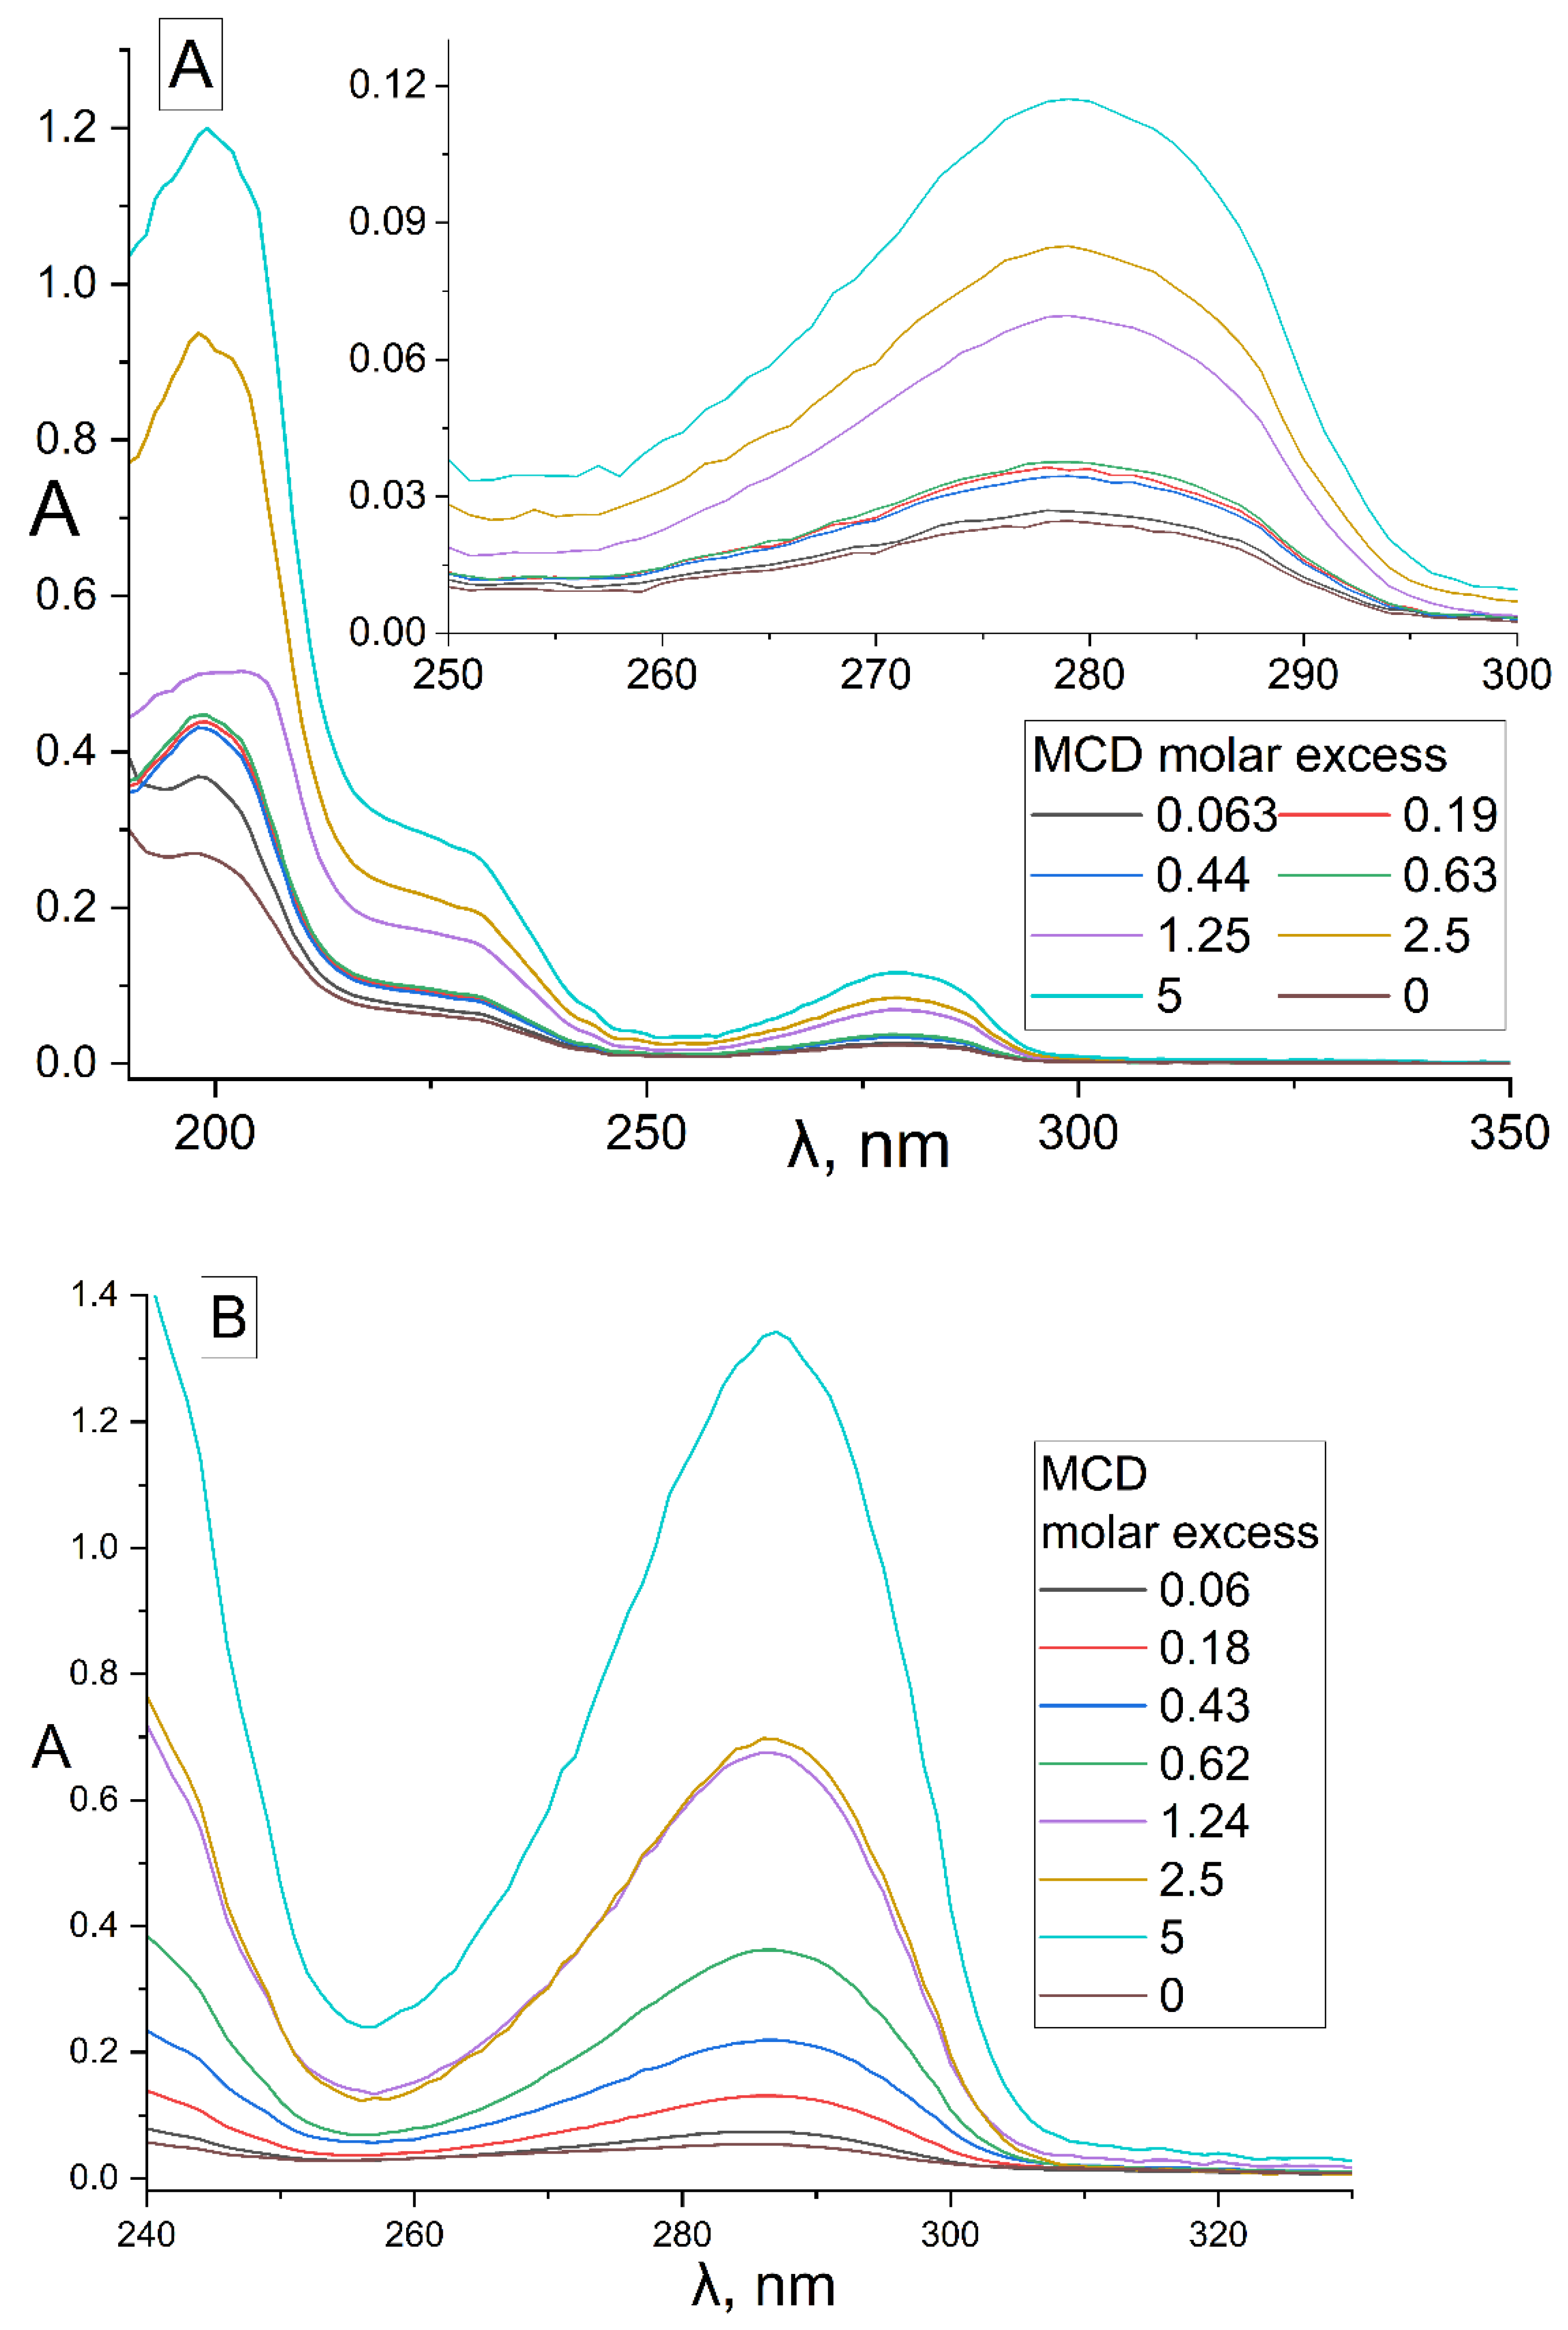
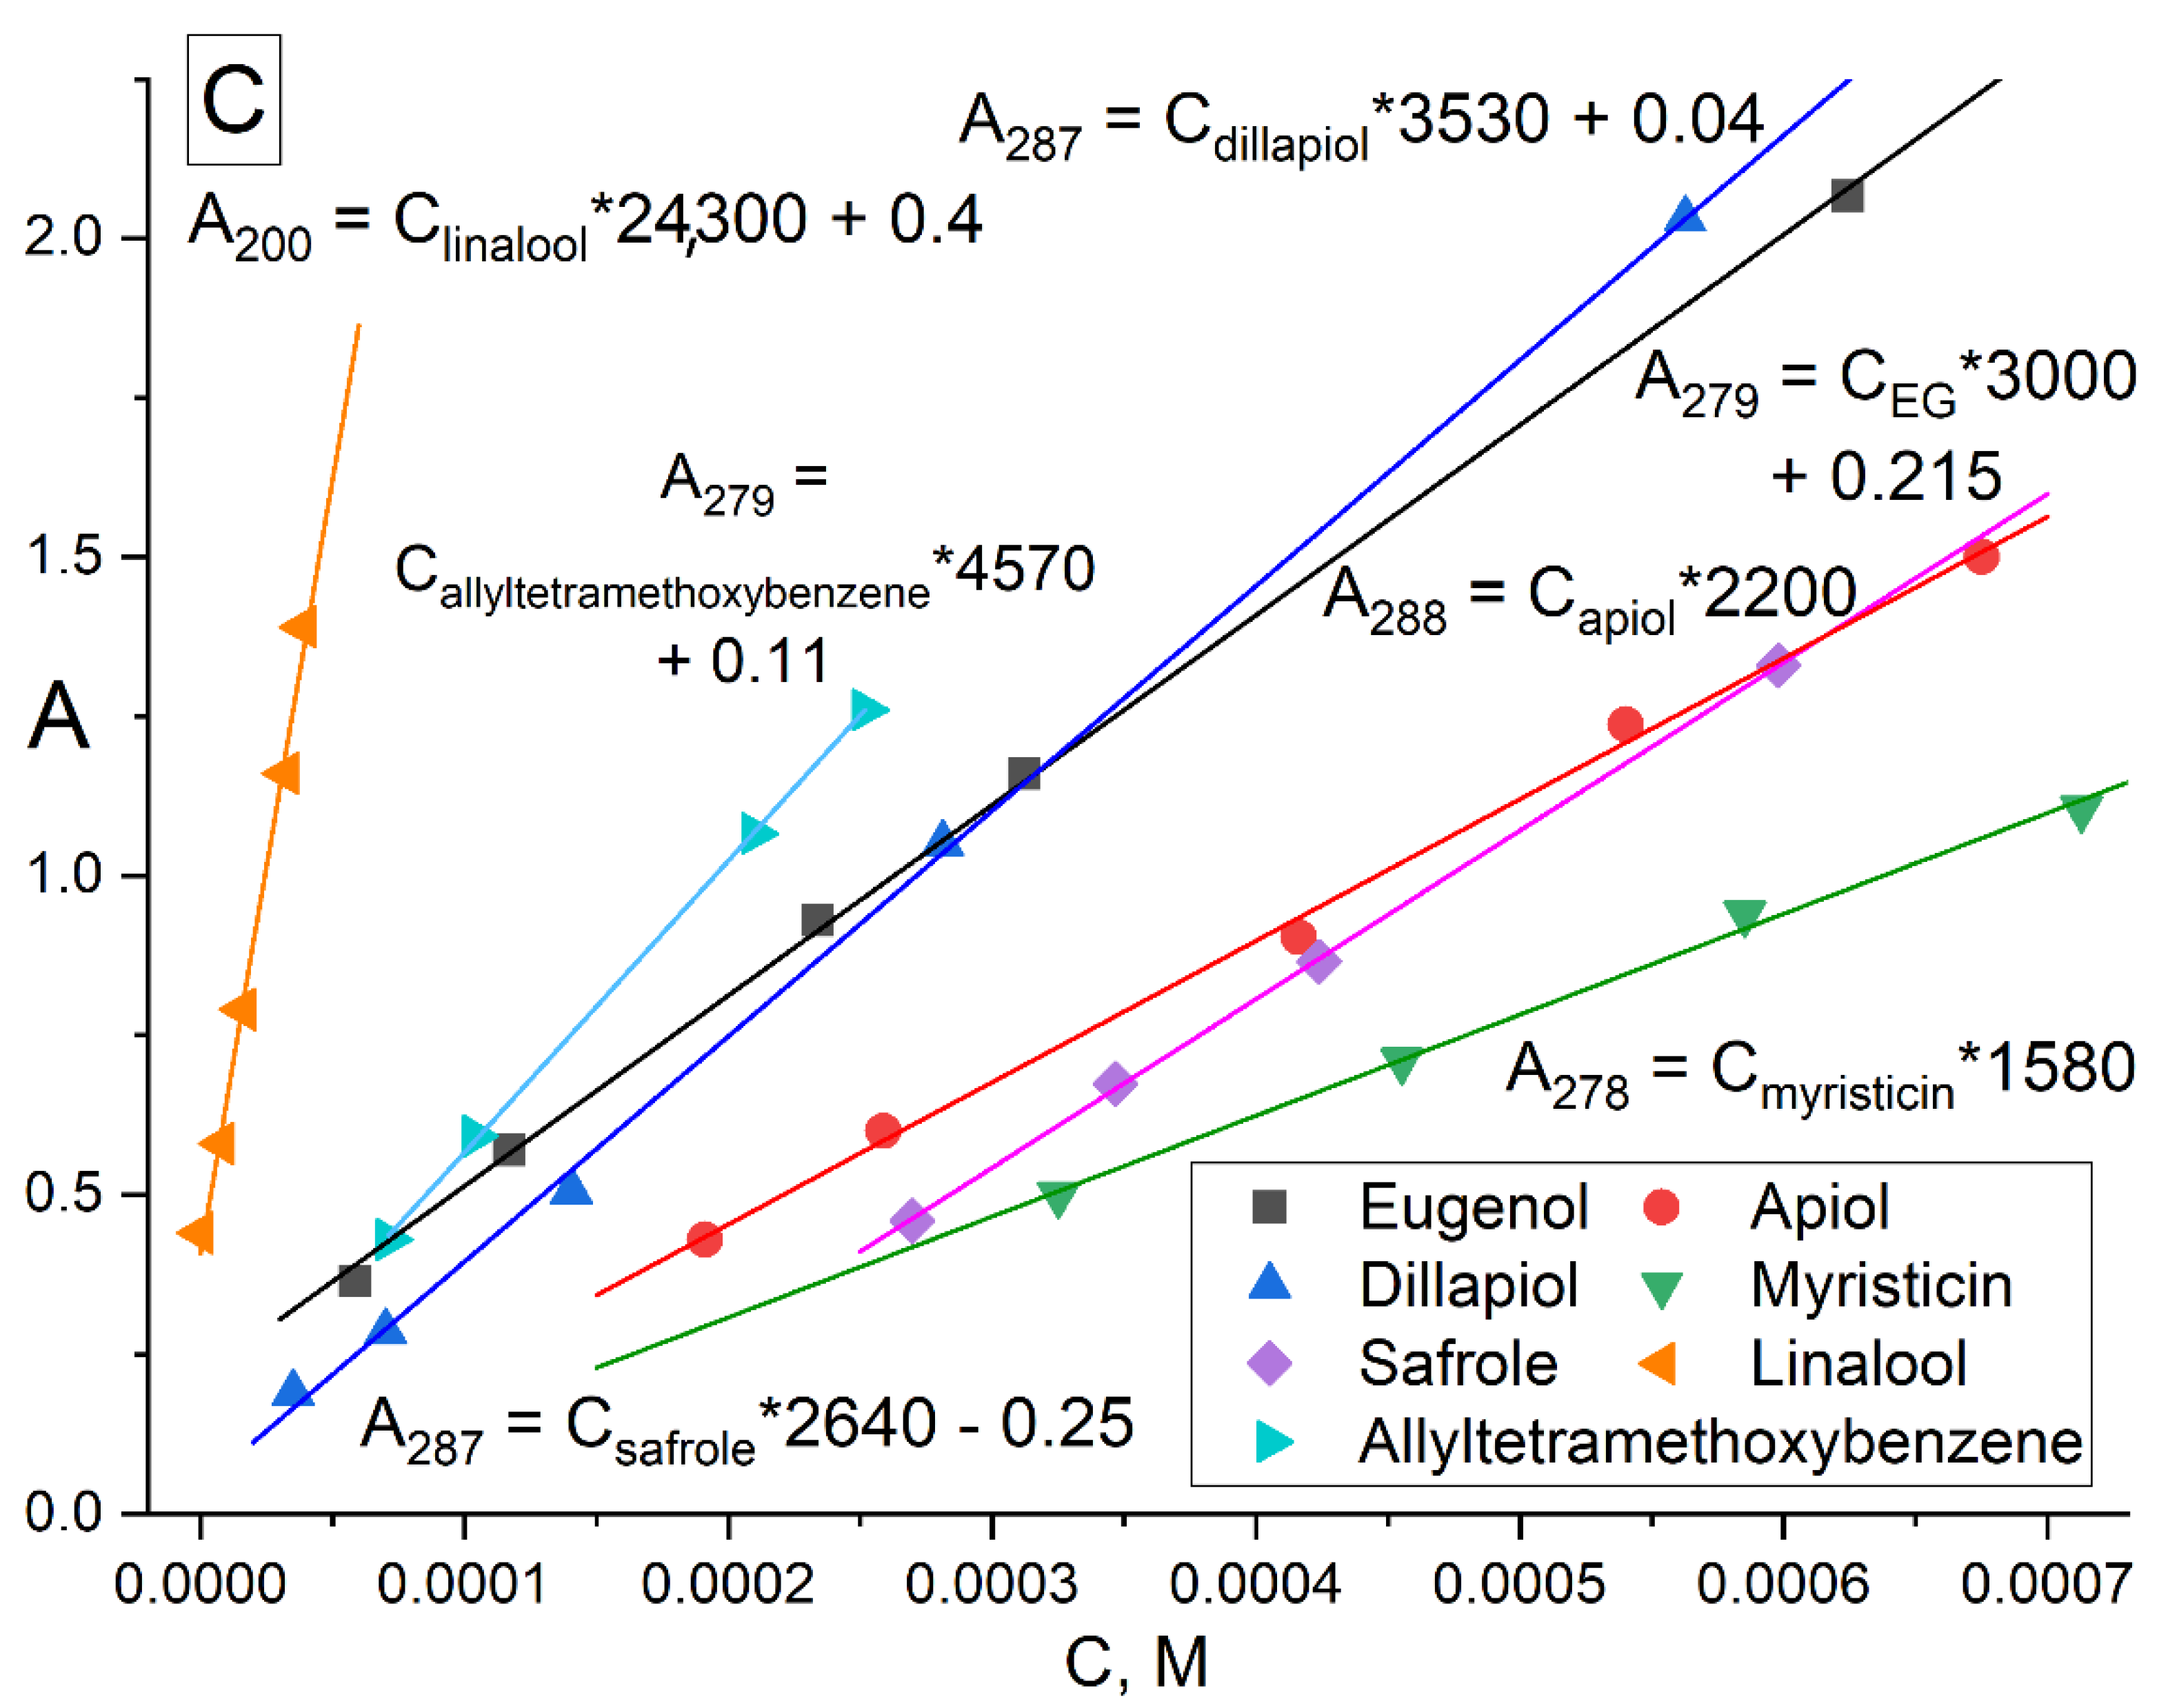
2.1.1. UV Spectroscopy Approach
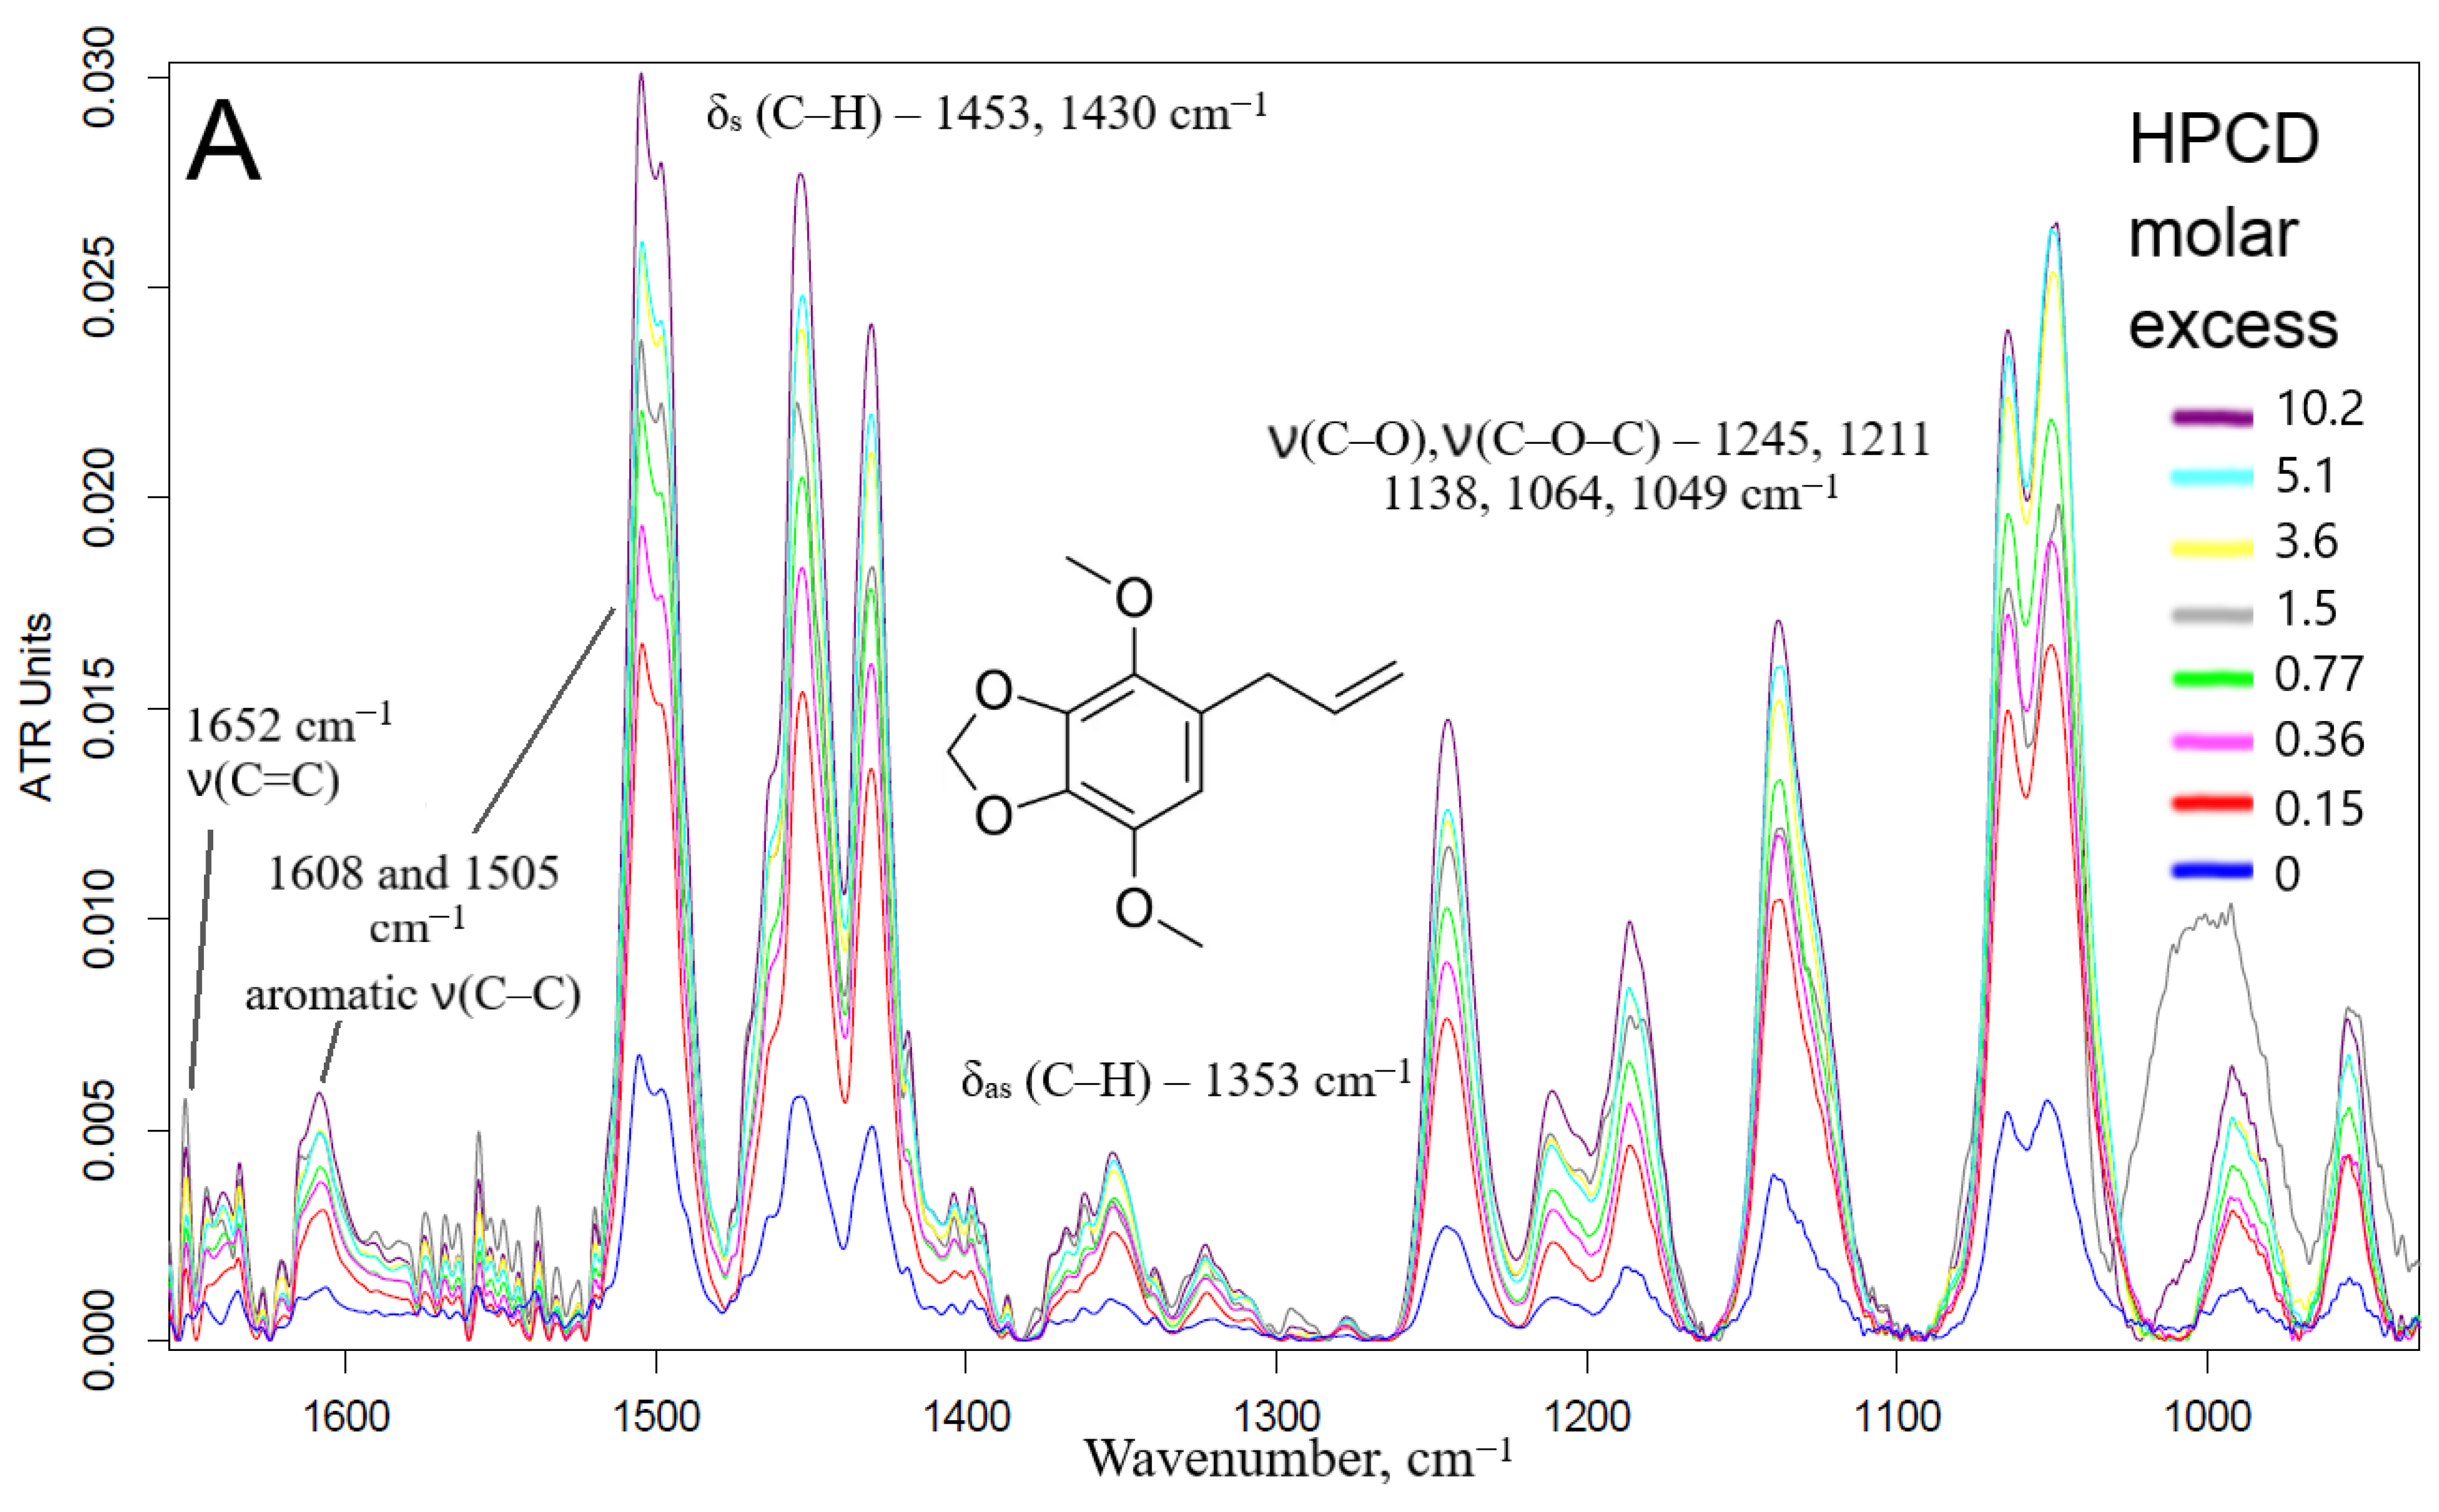
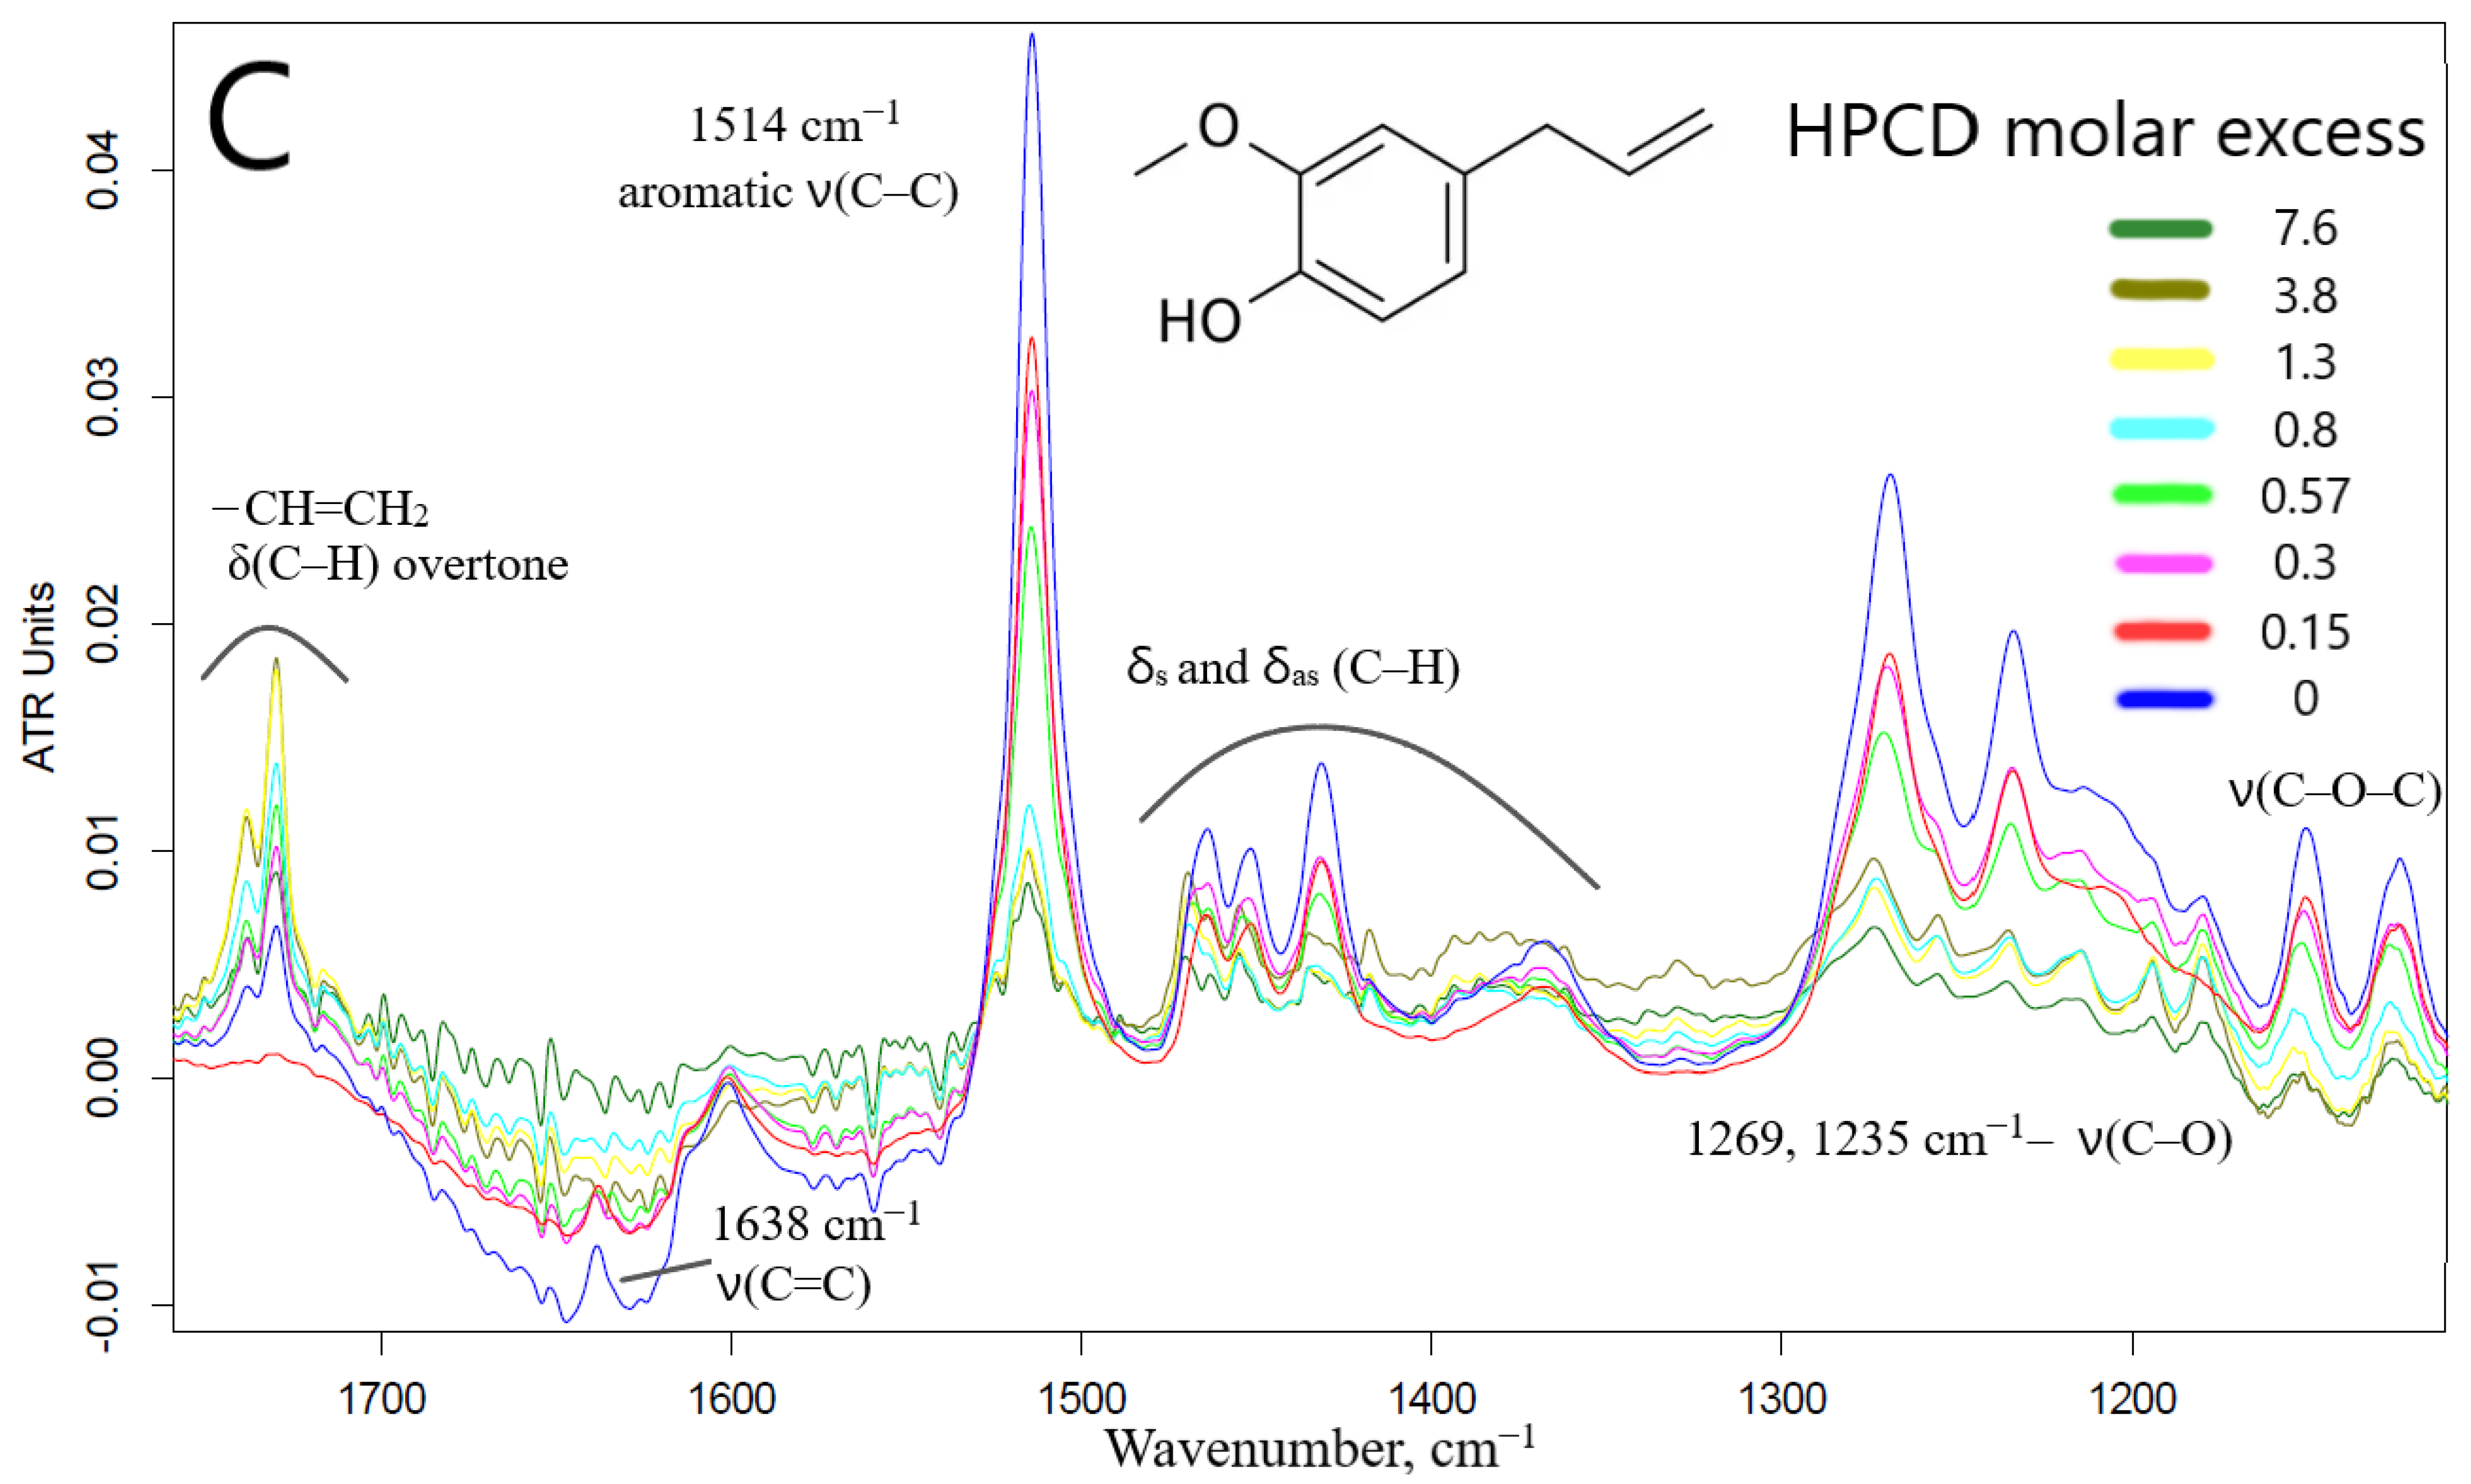
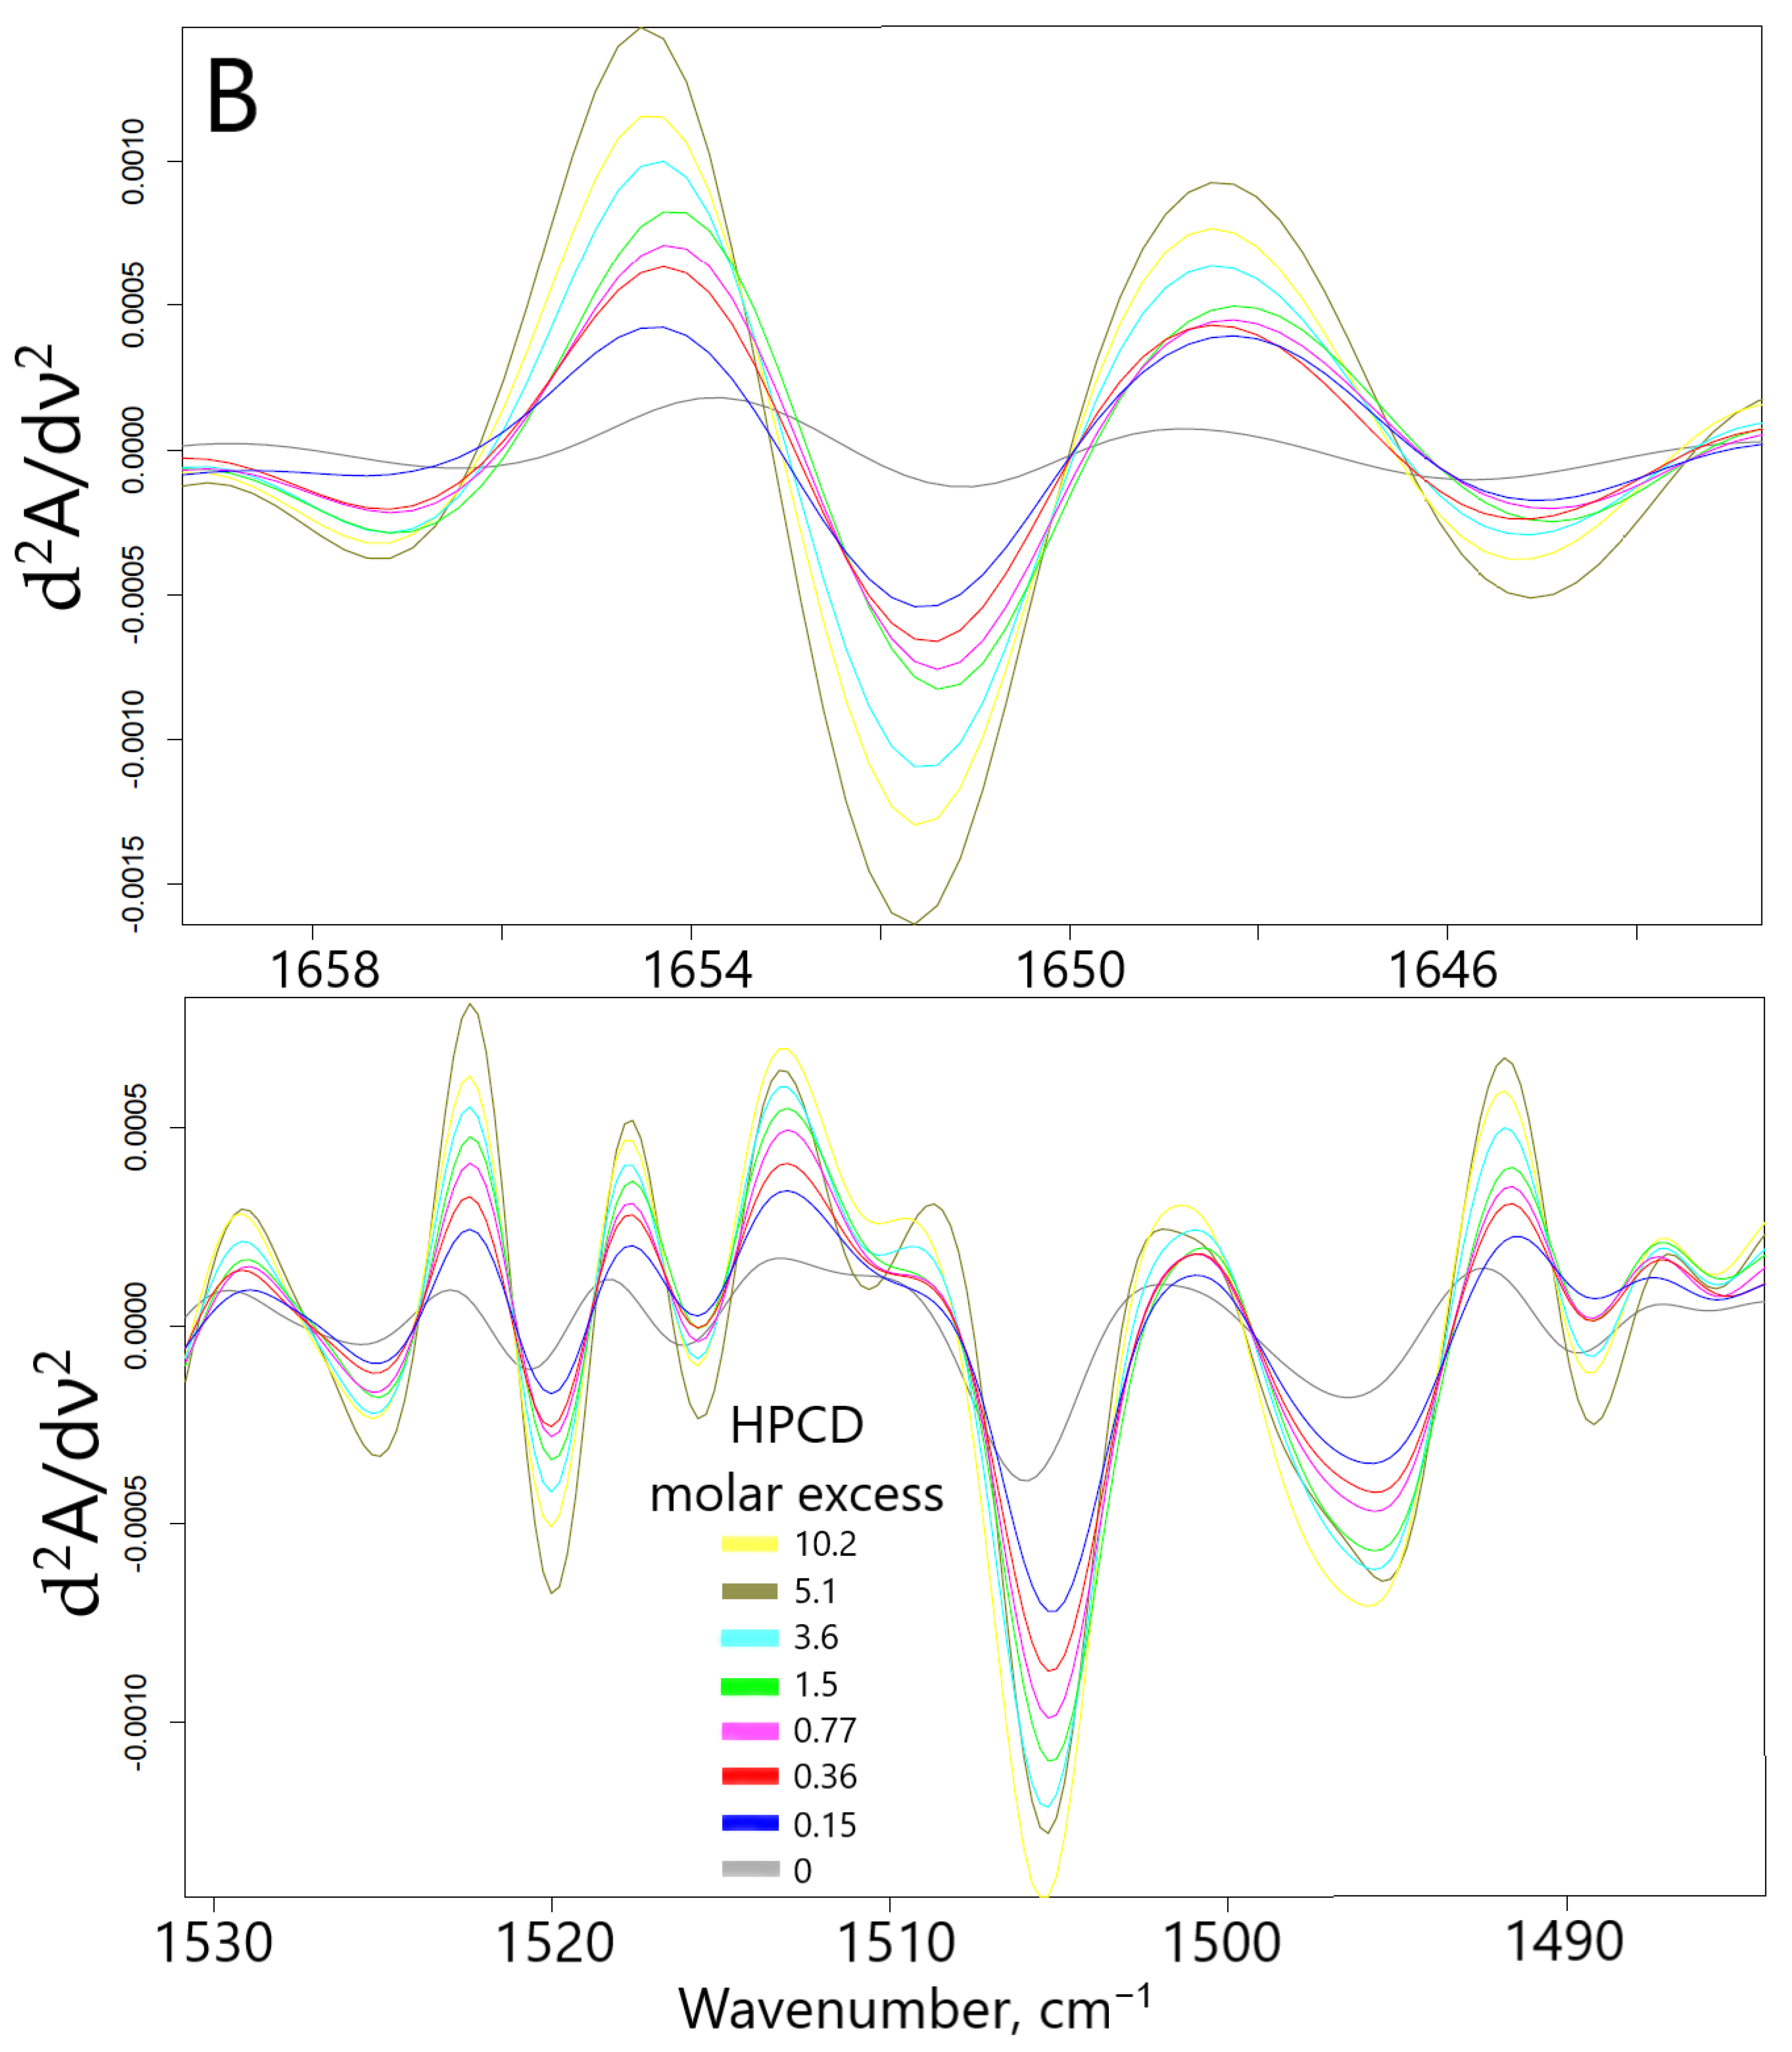
2.1.2. FTIR Spectroscopy Approach
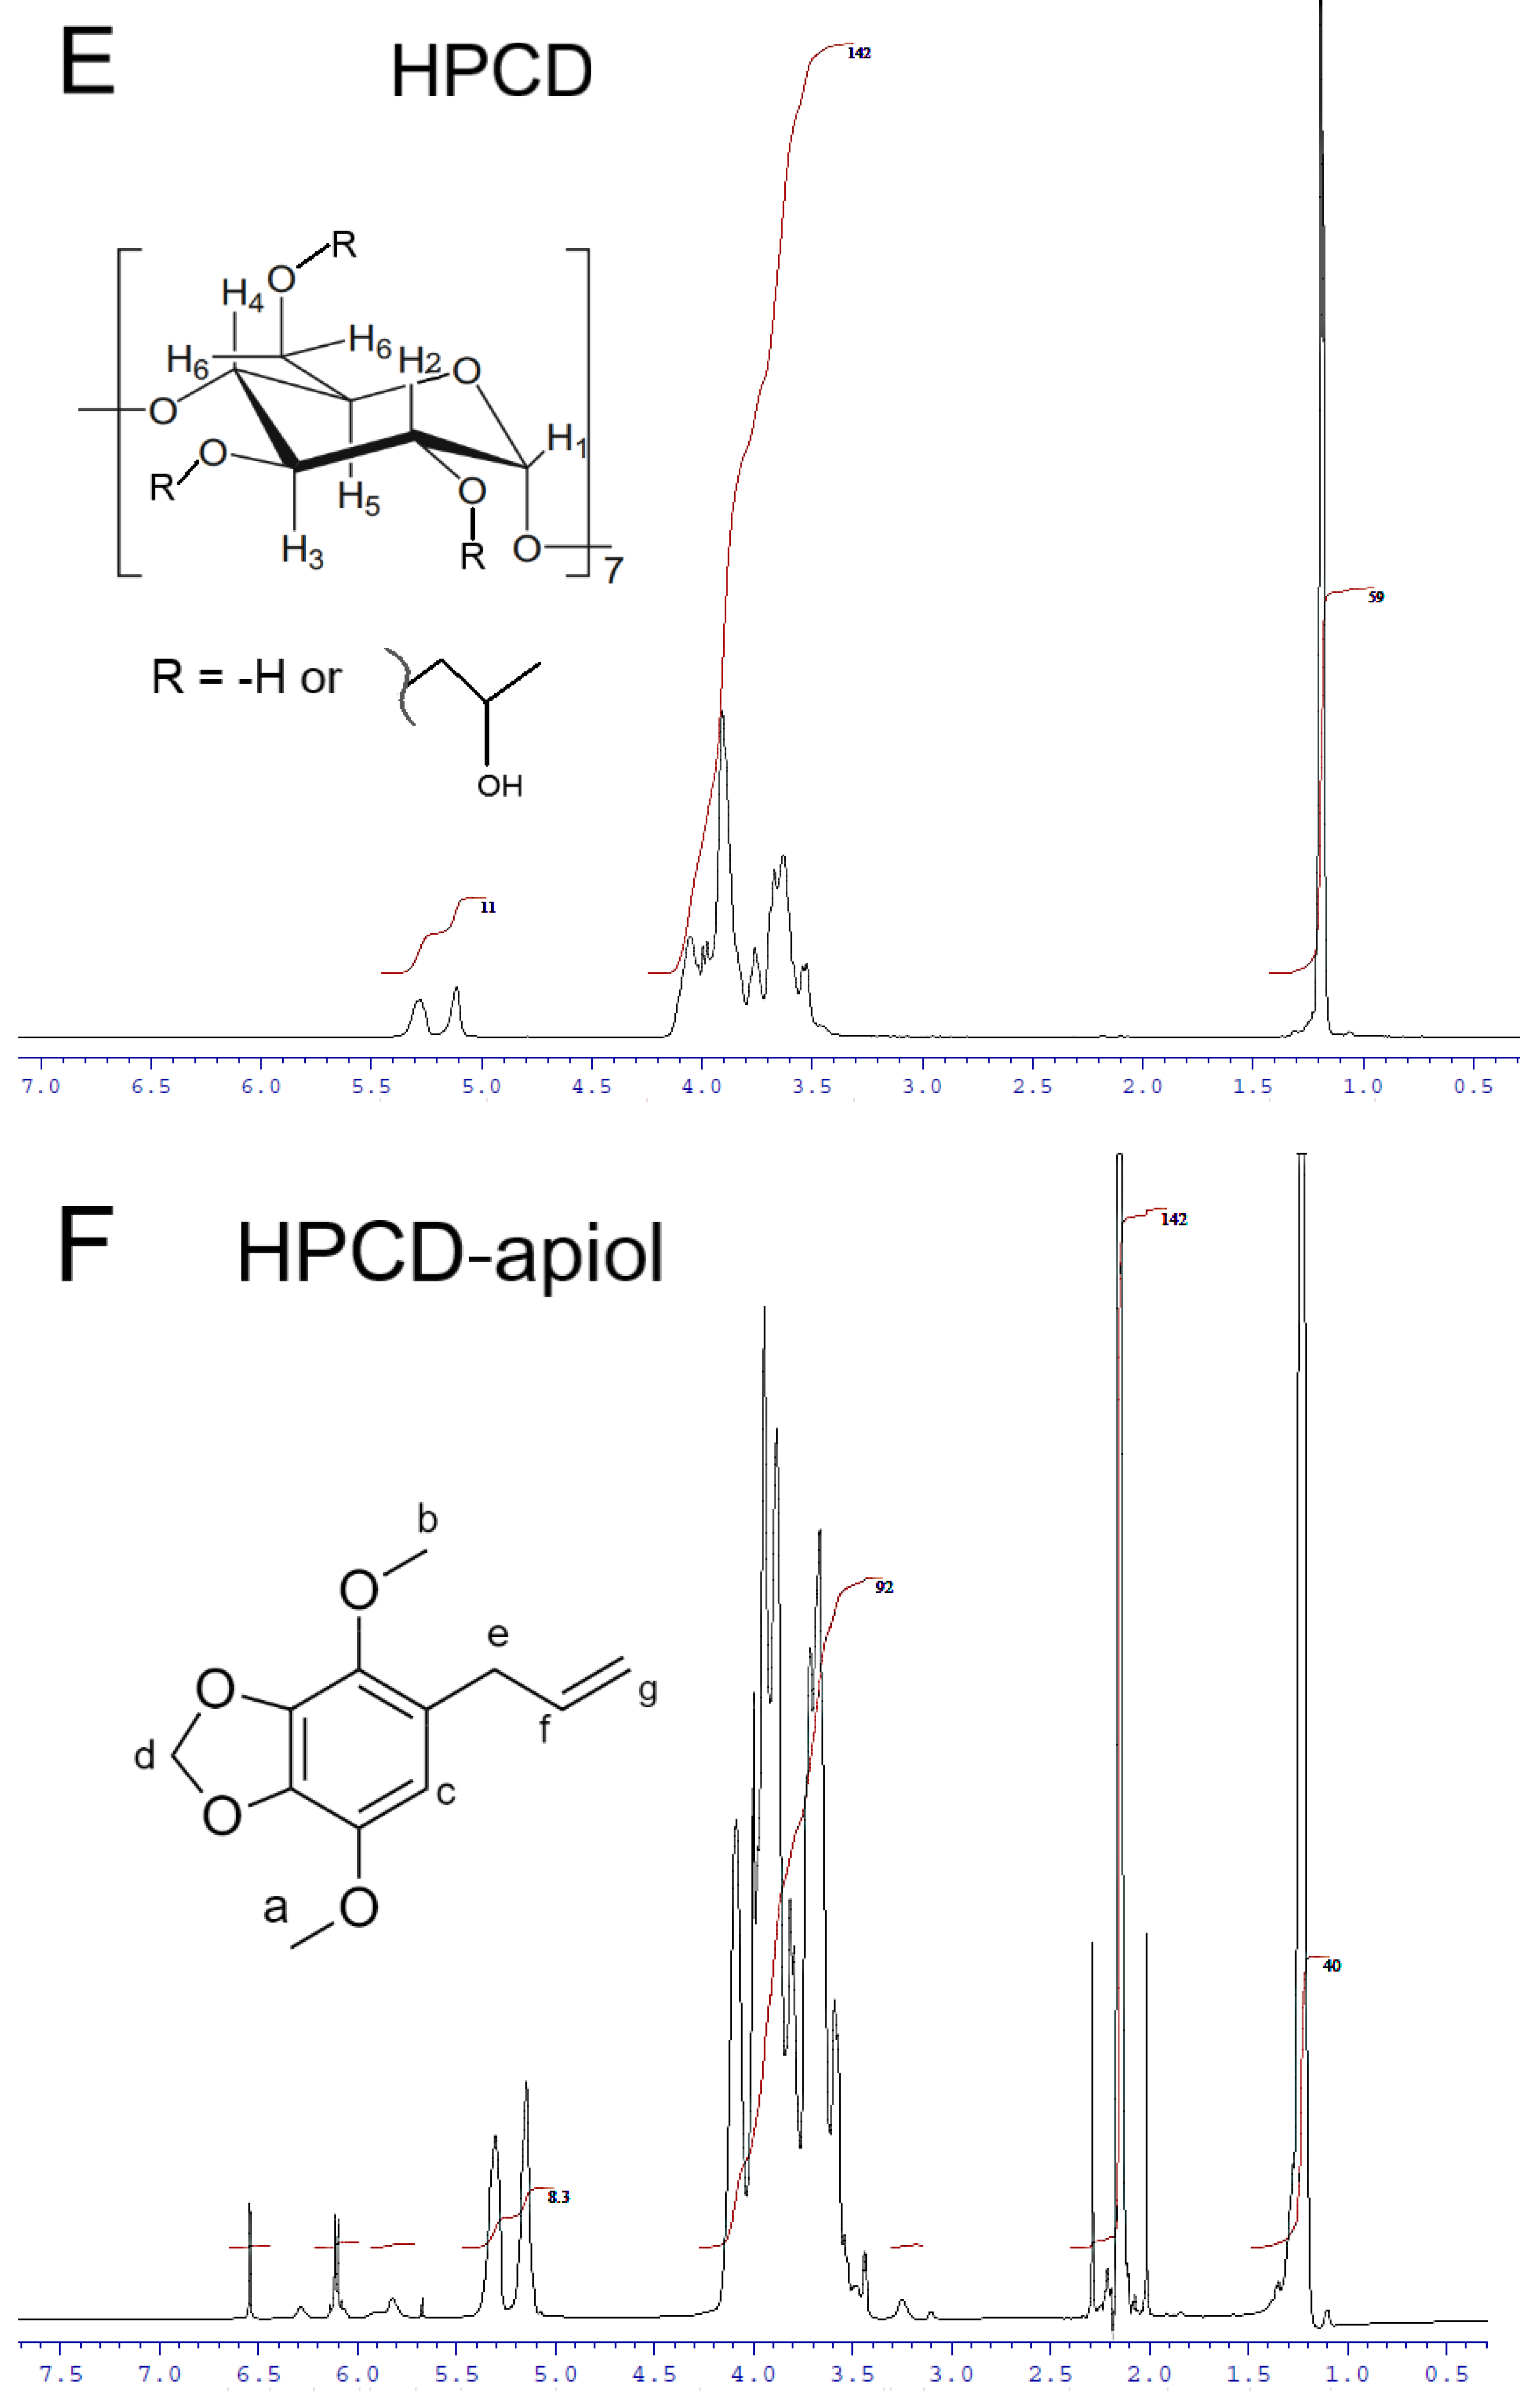
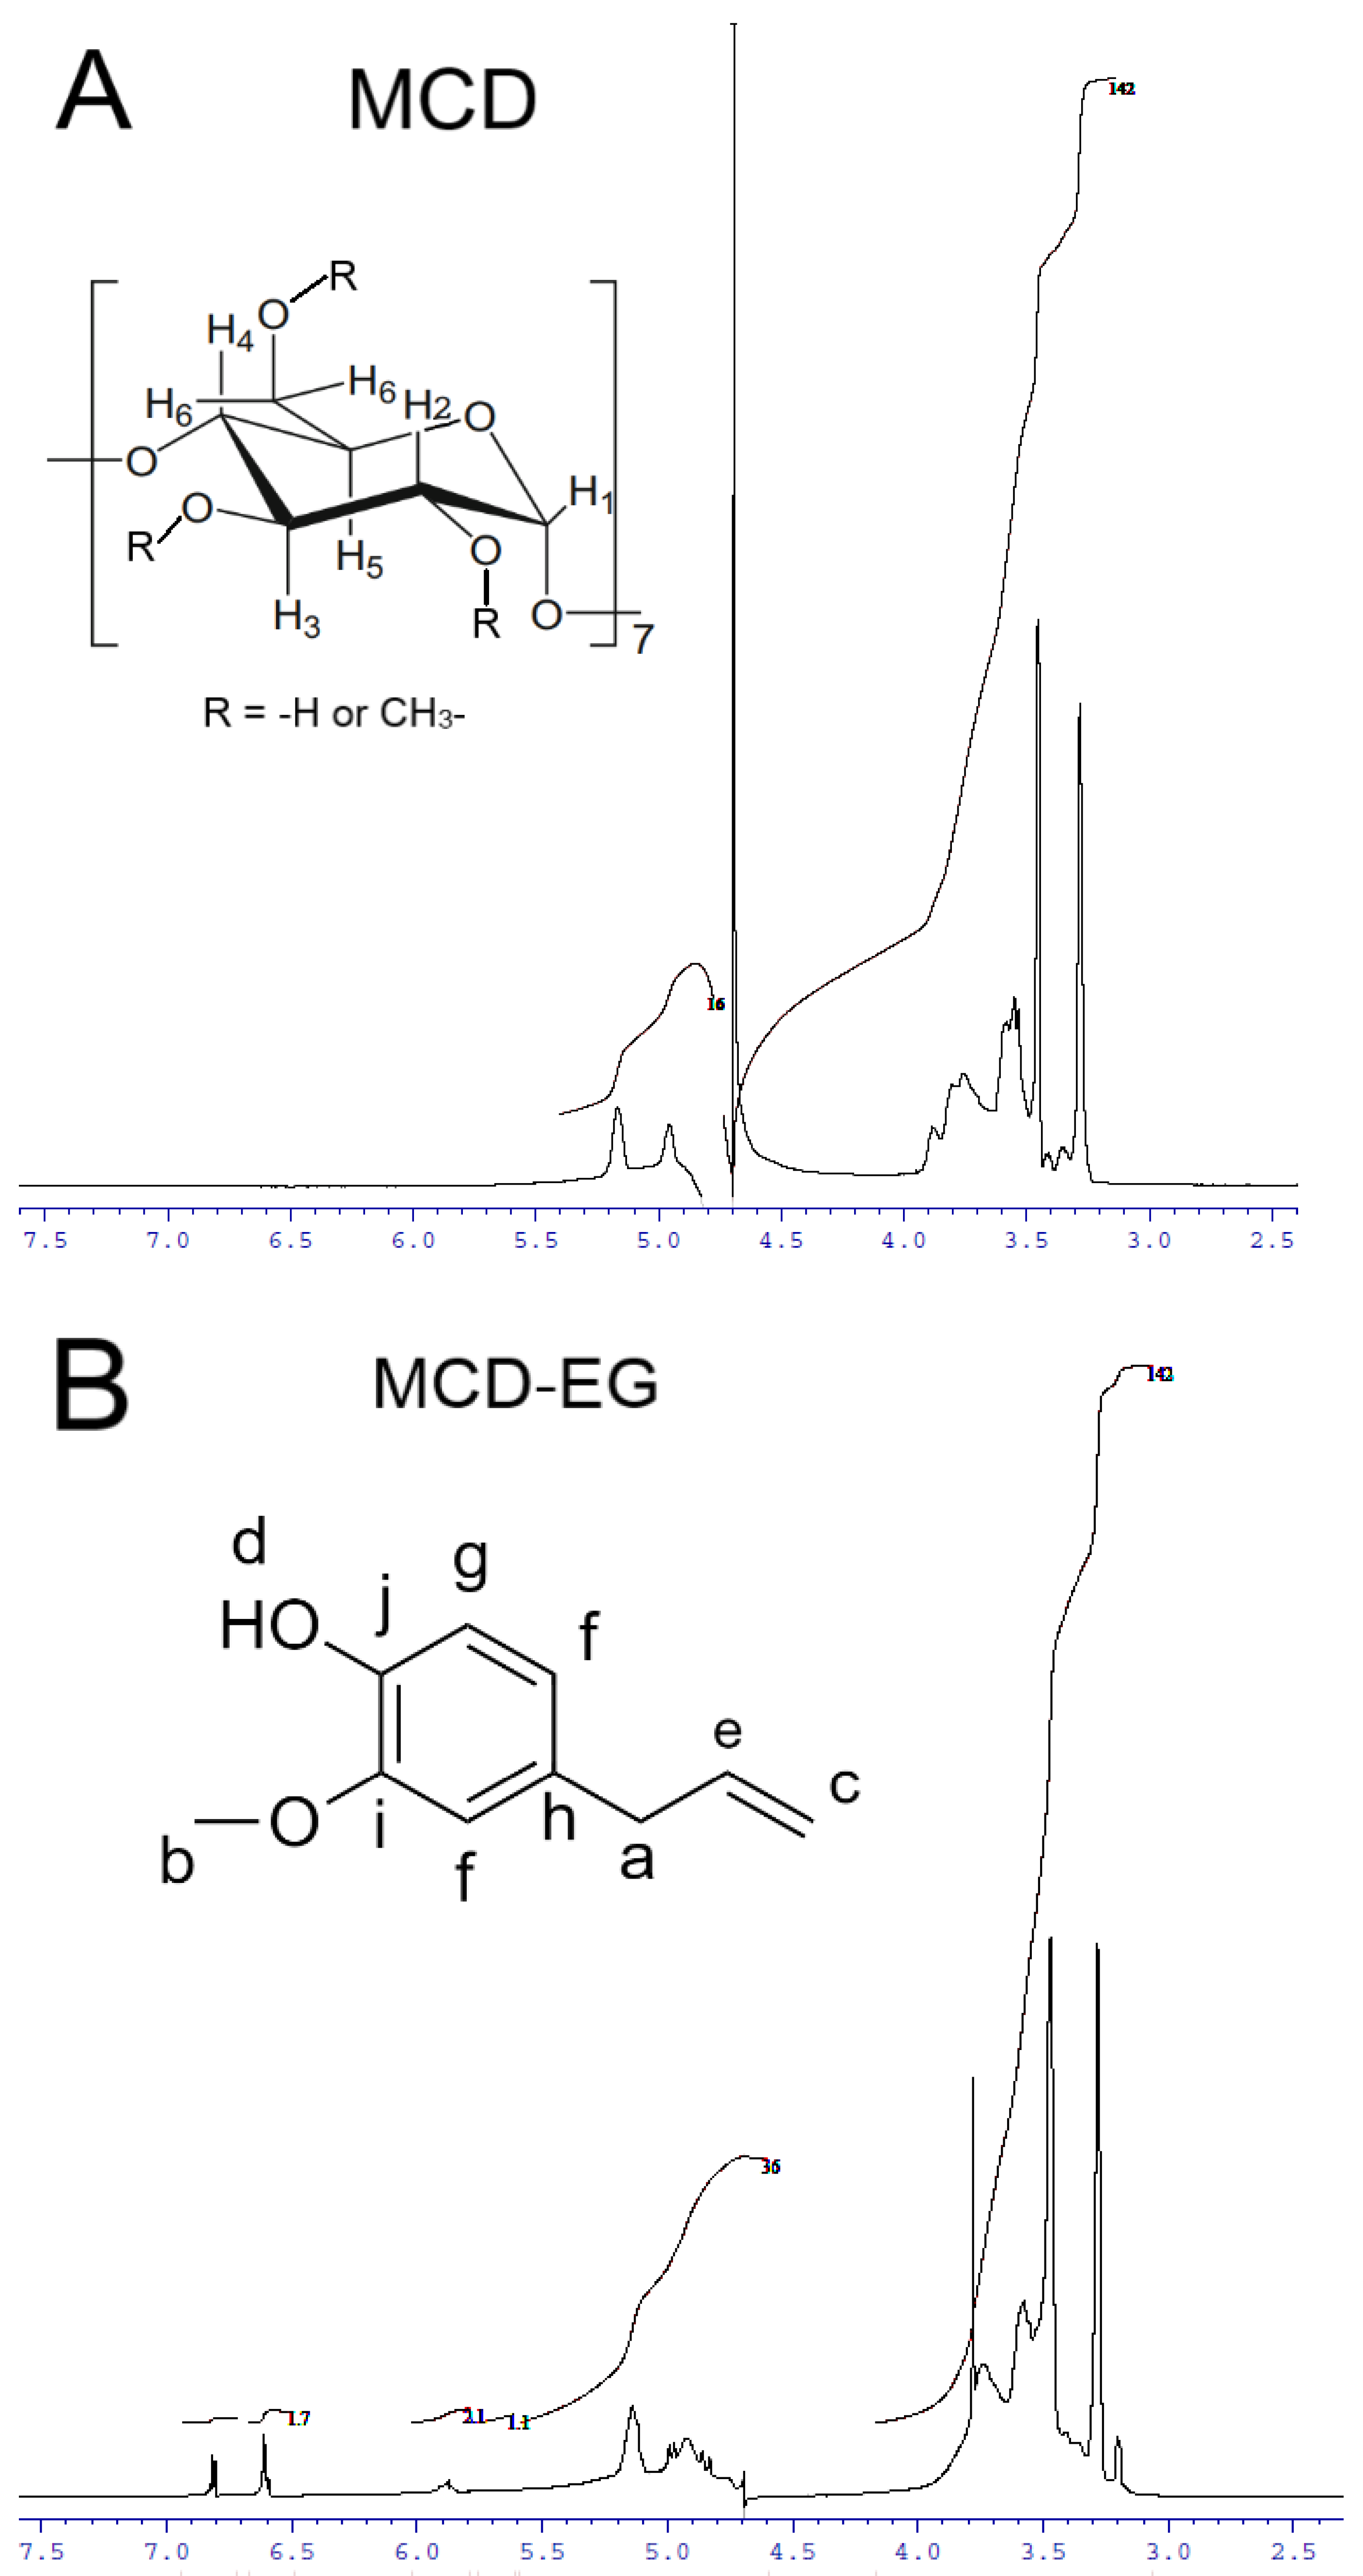
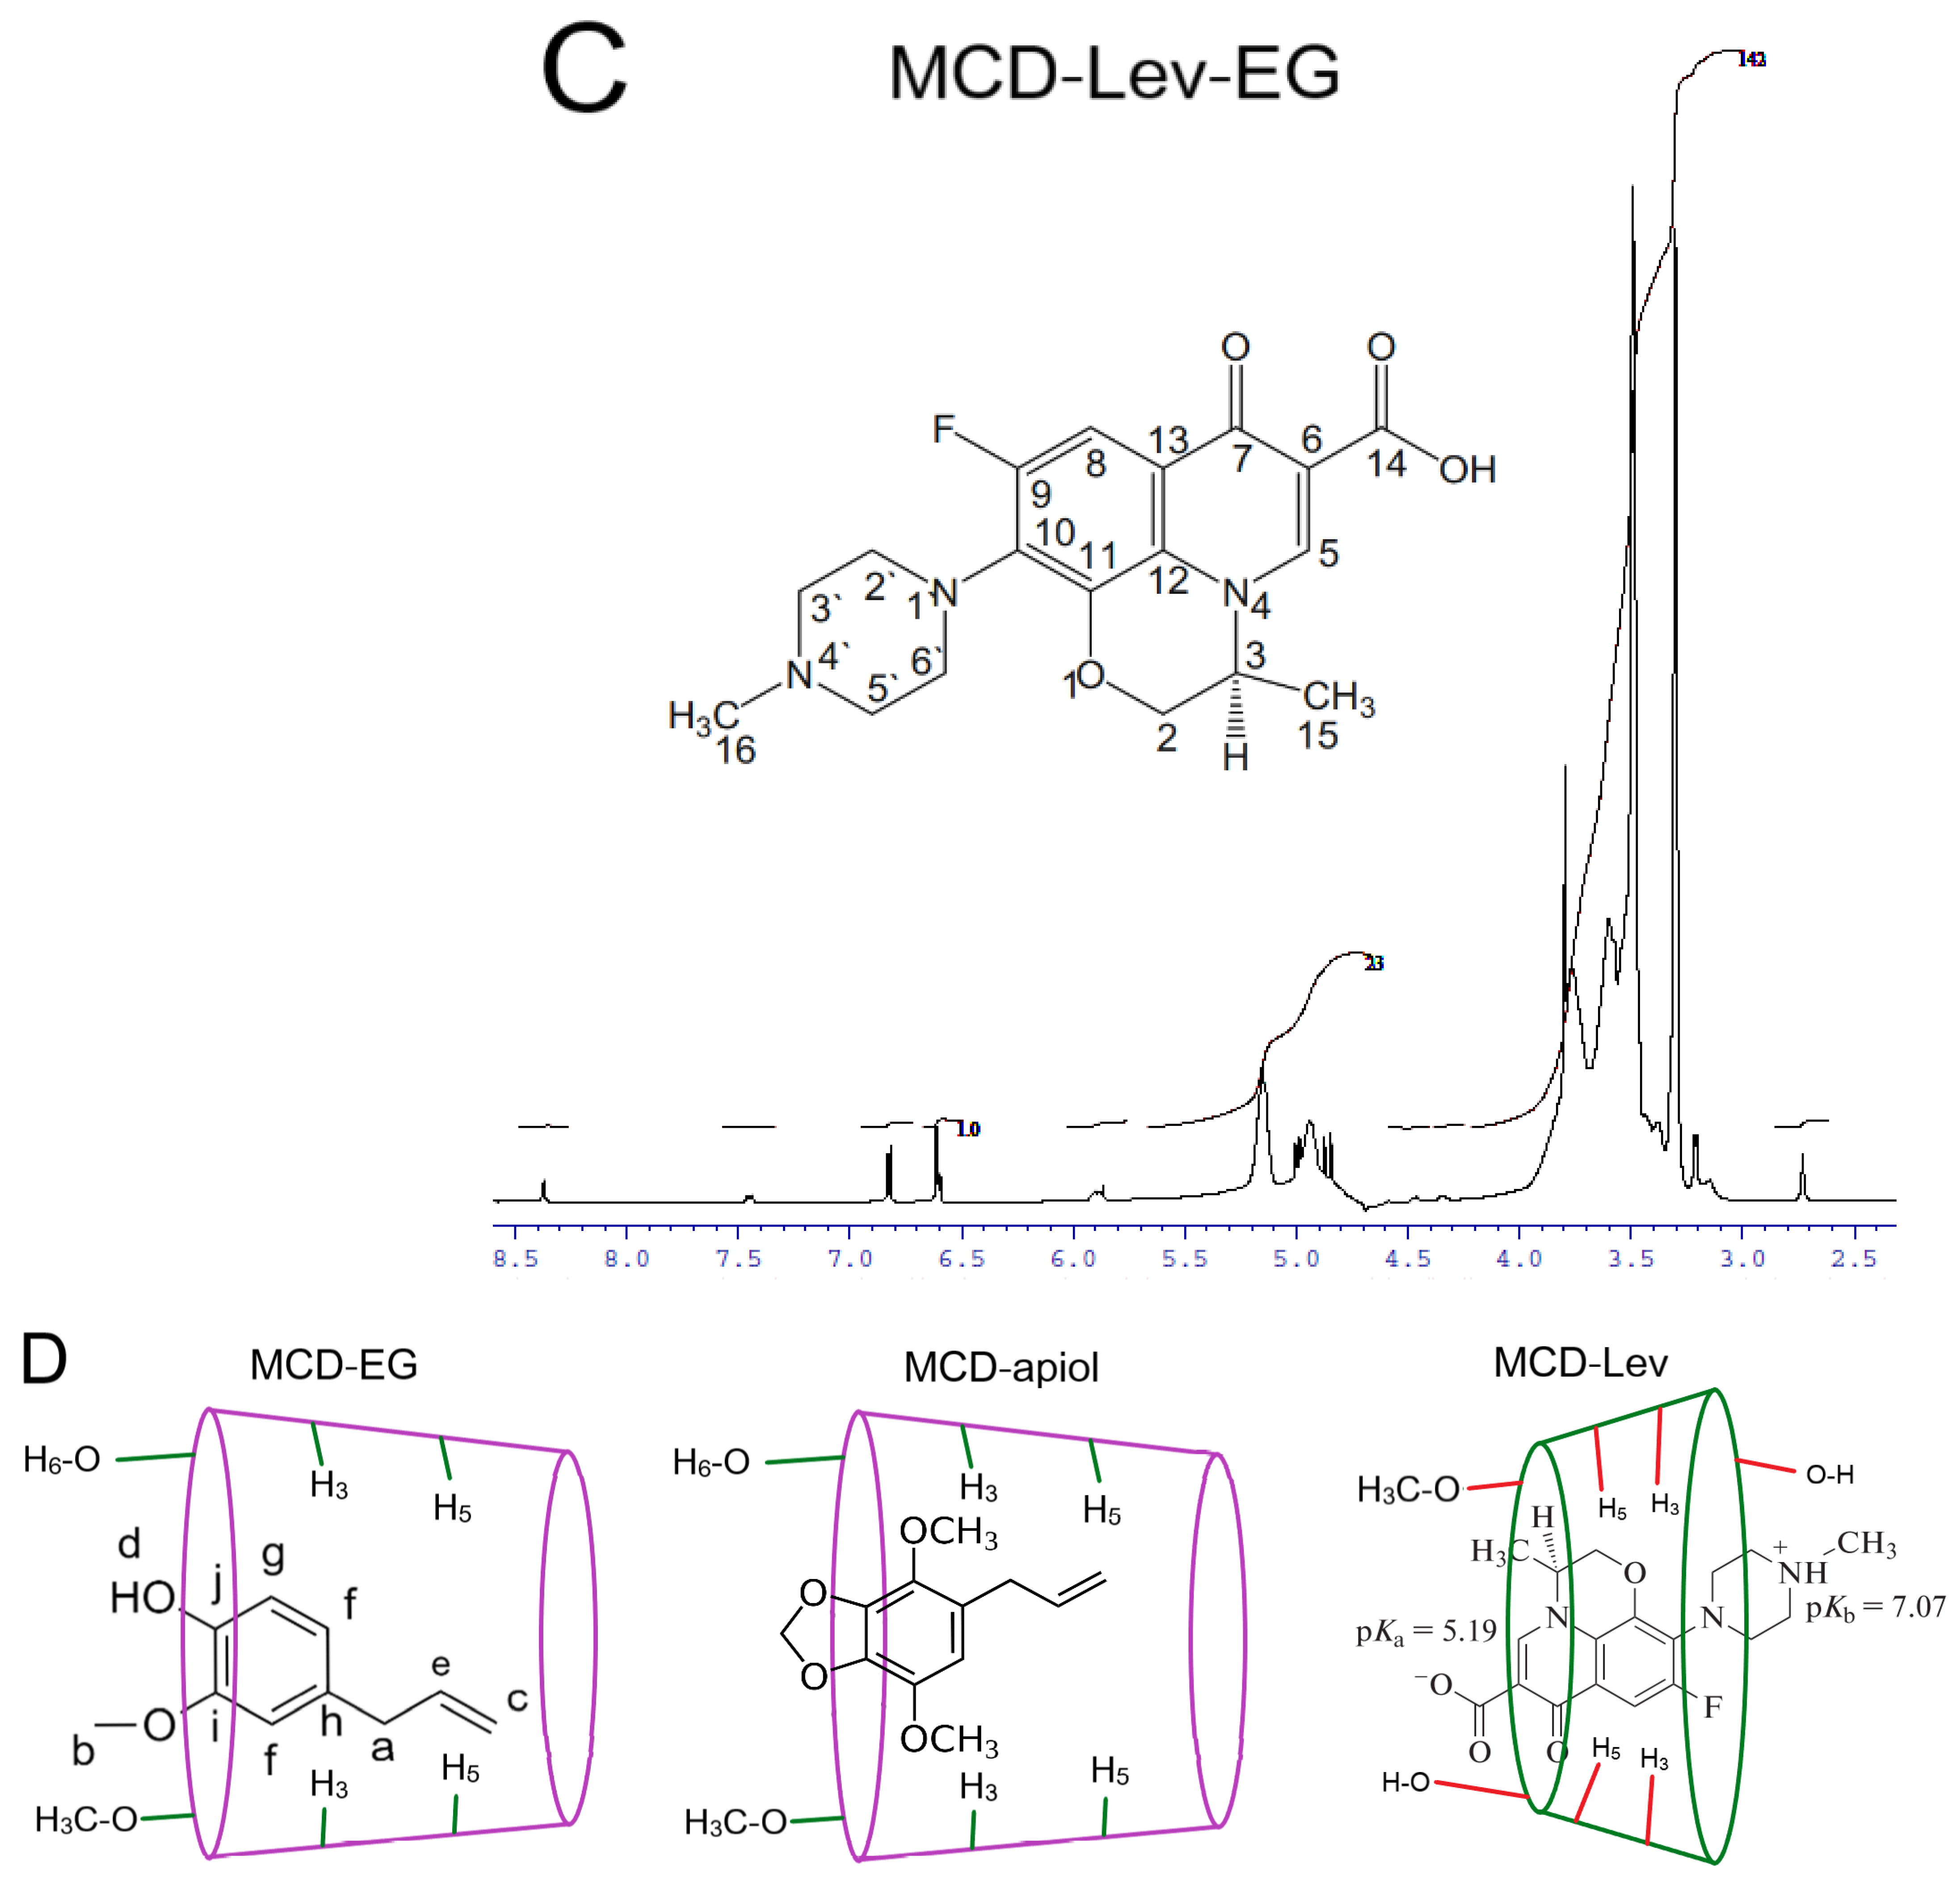
2.1.3. NMR Spectroscopy

| MCD Proton Chemical Shifts (Insert of Figure 3A) | |||||
| MCD proton | δ (MCD) | δ (MCD-EG) | δ (MCD-apiol) | δ (MCD-Lev-EG) | |
| H1 | 4.957 | 4.918 | 4.942 | 4.941 | |
| H2 * | 3.553 | 3.557 | 3.545 | 3.603 or 3.577 (overlapped) | |
| H3 * | 3.886 | 3.843 | 3.868 | 3.852 | |
| H4 | 3.454 | 3.472 | 3.454 | 3.492 | |
| H5 | 3.763 | 3.736 (overlapped) | 3.755 | 3.797 | |
| H6 * | 3.805 | 3.78 | 3.787 | 3.767 | |
| HPCD Proton Chemical Shifts (Insert of Figure 3E) | |||||
| HPCD proton | δ (HPCD) | δ (HPCD-EG) | δ (HPCD-apiol) | δ (HPCD-Lev-EG) | |
| H1 | 5.279 | 5.369 | 5.303 | 5.287 | |
| H1′ | 5.113 | 5.236 | 5.147 | 5.126 | |
| H2 * | 3.544 | overlapped | 3.593 (overlapped) | overlapped | |
| H3 * | 3.908 | 3.918 | 3.948 (overlapped) | 3.921 | |
| H4 | 3.526 | 3.504 | 3.543 (overlapped) | 3.568 (overlapped) | |
| H5 | 3.633 | 3.691 | 3.667 | 3.641 | |
| H6 * | 3.673 | 3.714 | 3.689 | ||
| CH3 | 1.193 | 1.331 | 1.225; 1.238 | 1.20; 1.212 | |
| EG Proton Chemical Shifts (Insert of Figure 3B) | |||||
| EG proton | δ (free EG) [41] | δ (MCD-EG) | δ (HPCD-EG) | δ (MCD-Lev-EG) | δ (HPCD-Lev-EG) |
| Ha | 3.305 | 3.406 | overlapped | overlapped | 3.359 |
| Hb | 3.871 | 3.829 | 3.765 | 3.853 | 3.857 |
| Hc | 5.034 | 4.993 | overlapped | 4.986–4.988 | overlapped |
| Hd | 5.47 | 5.527 | overlapped | ||
| He | 5.902 | 5.887 | 6.175; 6.188 | 5.897–5.886 | 6.047; 6.059 |
| Hf | 6.683 | 6.611 | 6.903; 6.993; 6.979 | 6.614 | 6.763; 6.779 |
| Hg | 6.824 | 6.821 | 7.074; 7.081; 7.089 | 6.821 | 6.975; 6.995 |
| Lev Protons Chemical Shifts (Insert of Figure 3C) | |||||
| Lev proton | δ (free Lev) [38] | δ (MCD-Lev-EG) | δ (HPCD-Lev-EG) | ||
| H5 | 8.342 | 8.374 | 8.513 | ||
| H8 | 7.240 | 7.44 | 7.649 | ||
| H3′, H5′ | 3.384 | 3.381 (overlapped) | 3.359 and 3.371 (overlapped) | ||
| H2′, H6′ | 3.49 | 3.577–3.603 (overlapped) | 3.5172 | ||
| H15 | 1.446 | 1.452 | 1.582 and 1.595 | ||
| H16 | 2.946 | overlapped | 2.952 | ||
| Apiol Proton Chemical Shifts (Insert of Figure 3F) | |||||
| Apiol proton | δ (free apiol) [12] | δ (MCD- apiol) | δ (HPCD- apiol) | ||
| Ha | 3.87 | 3.868 | 3.886 | ||
| Hb | 3.84 | 3.787 | 3.817 | ||
| Hc | 6.3 | 6.32 | 6.544 | ||
| Hd | 5.94 | overlapped | 6.099 | ||
| He | 3.31 | 3.28 | 3.433; 3.444 | ||
| Hf | 5.95 | overlapped | 6.114 | ||
| Hg | 5.09 | 5.15 | 5.147 | ||
2.2. Antibacterial and Synergistic Effects of APABs and Monoterpene Adjuvants
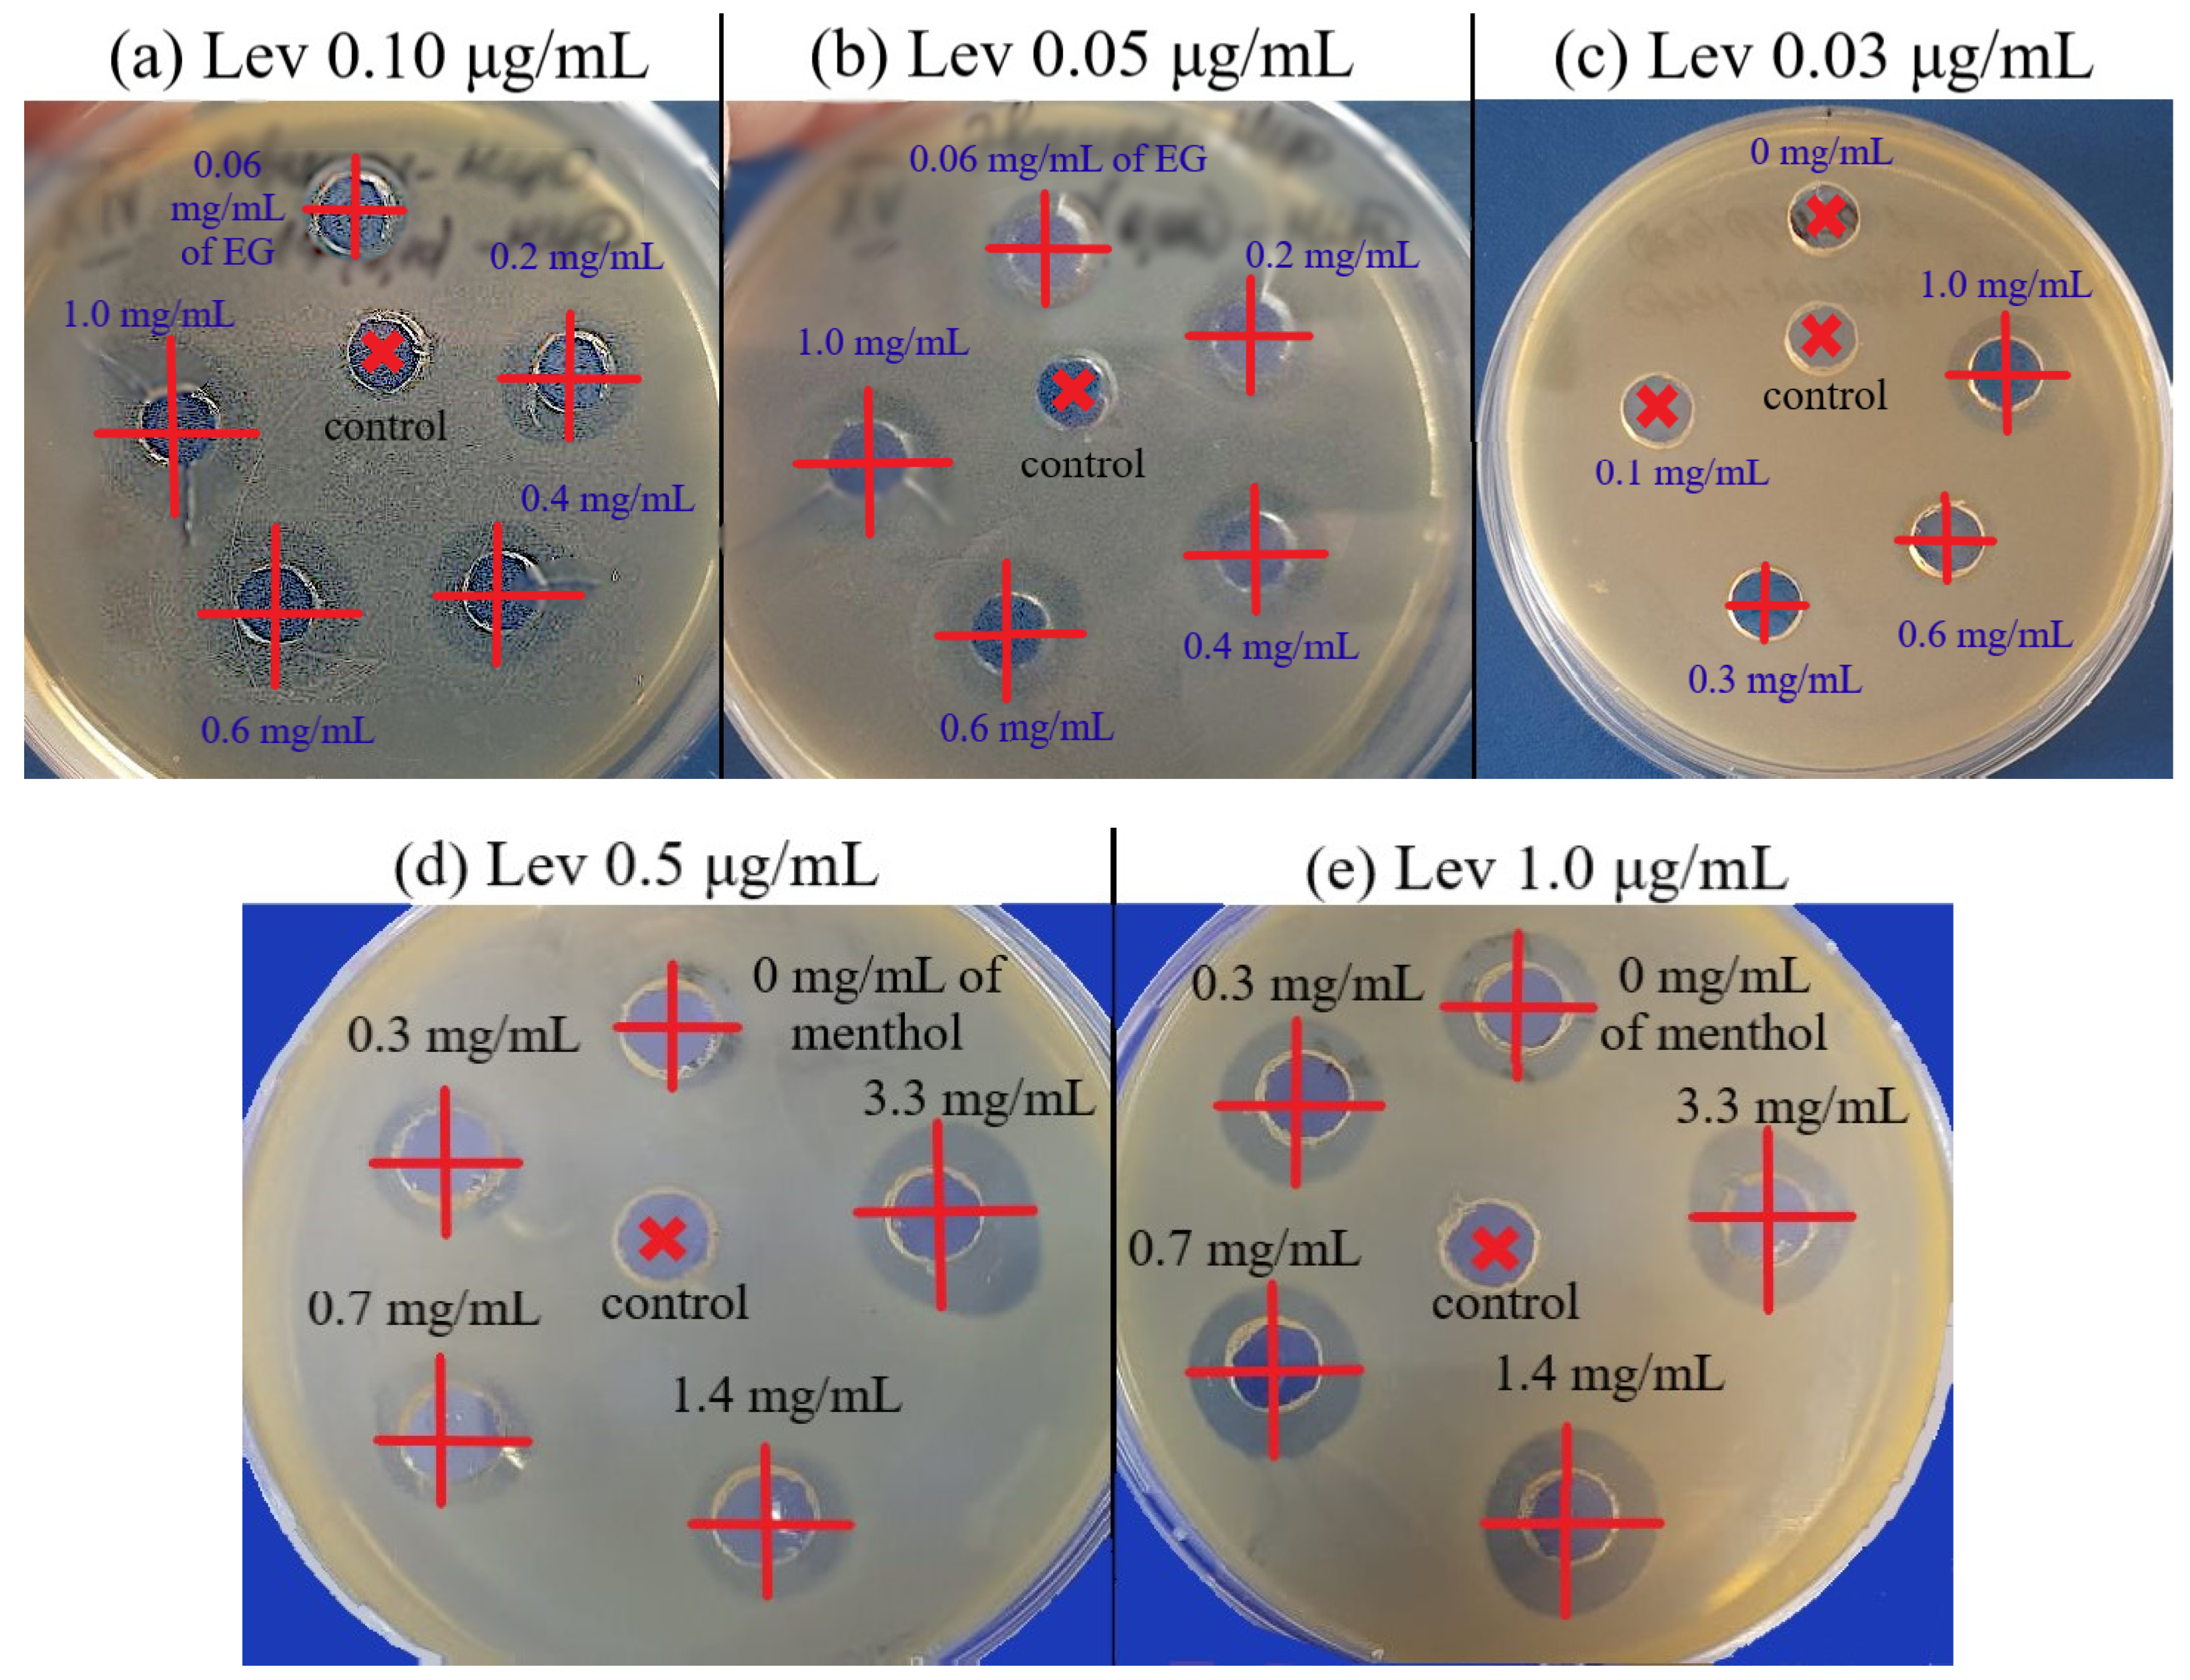
2.2.1. Antibacterial Effect of Lev, Lev–MCD and Adjuvants–MCD
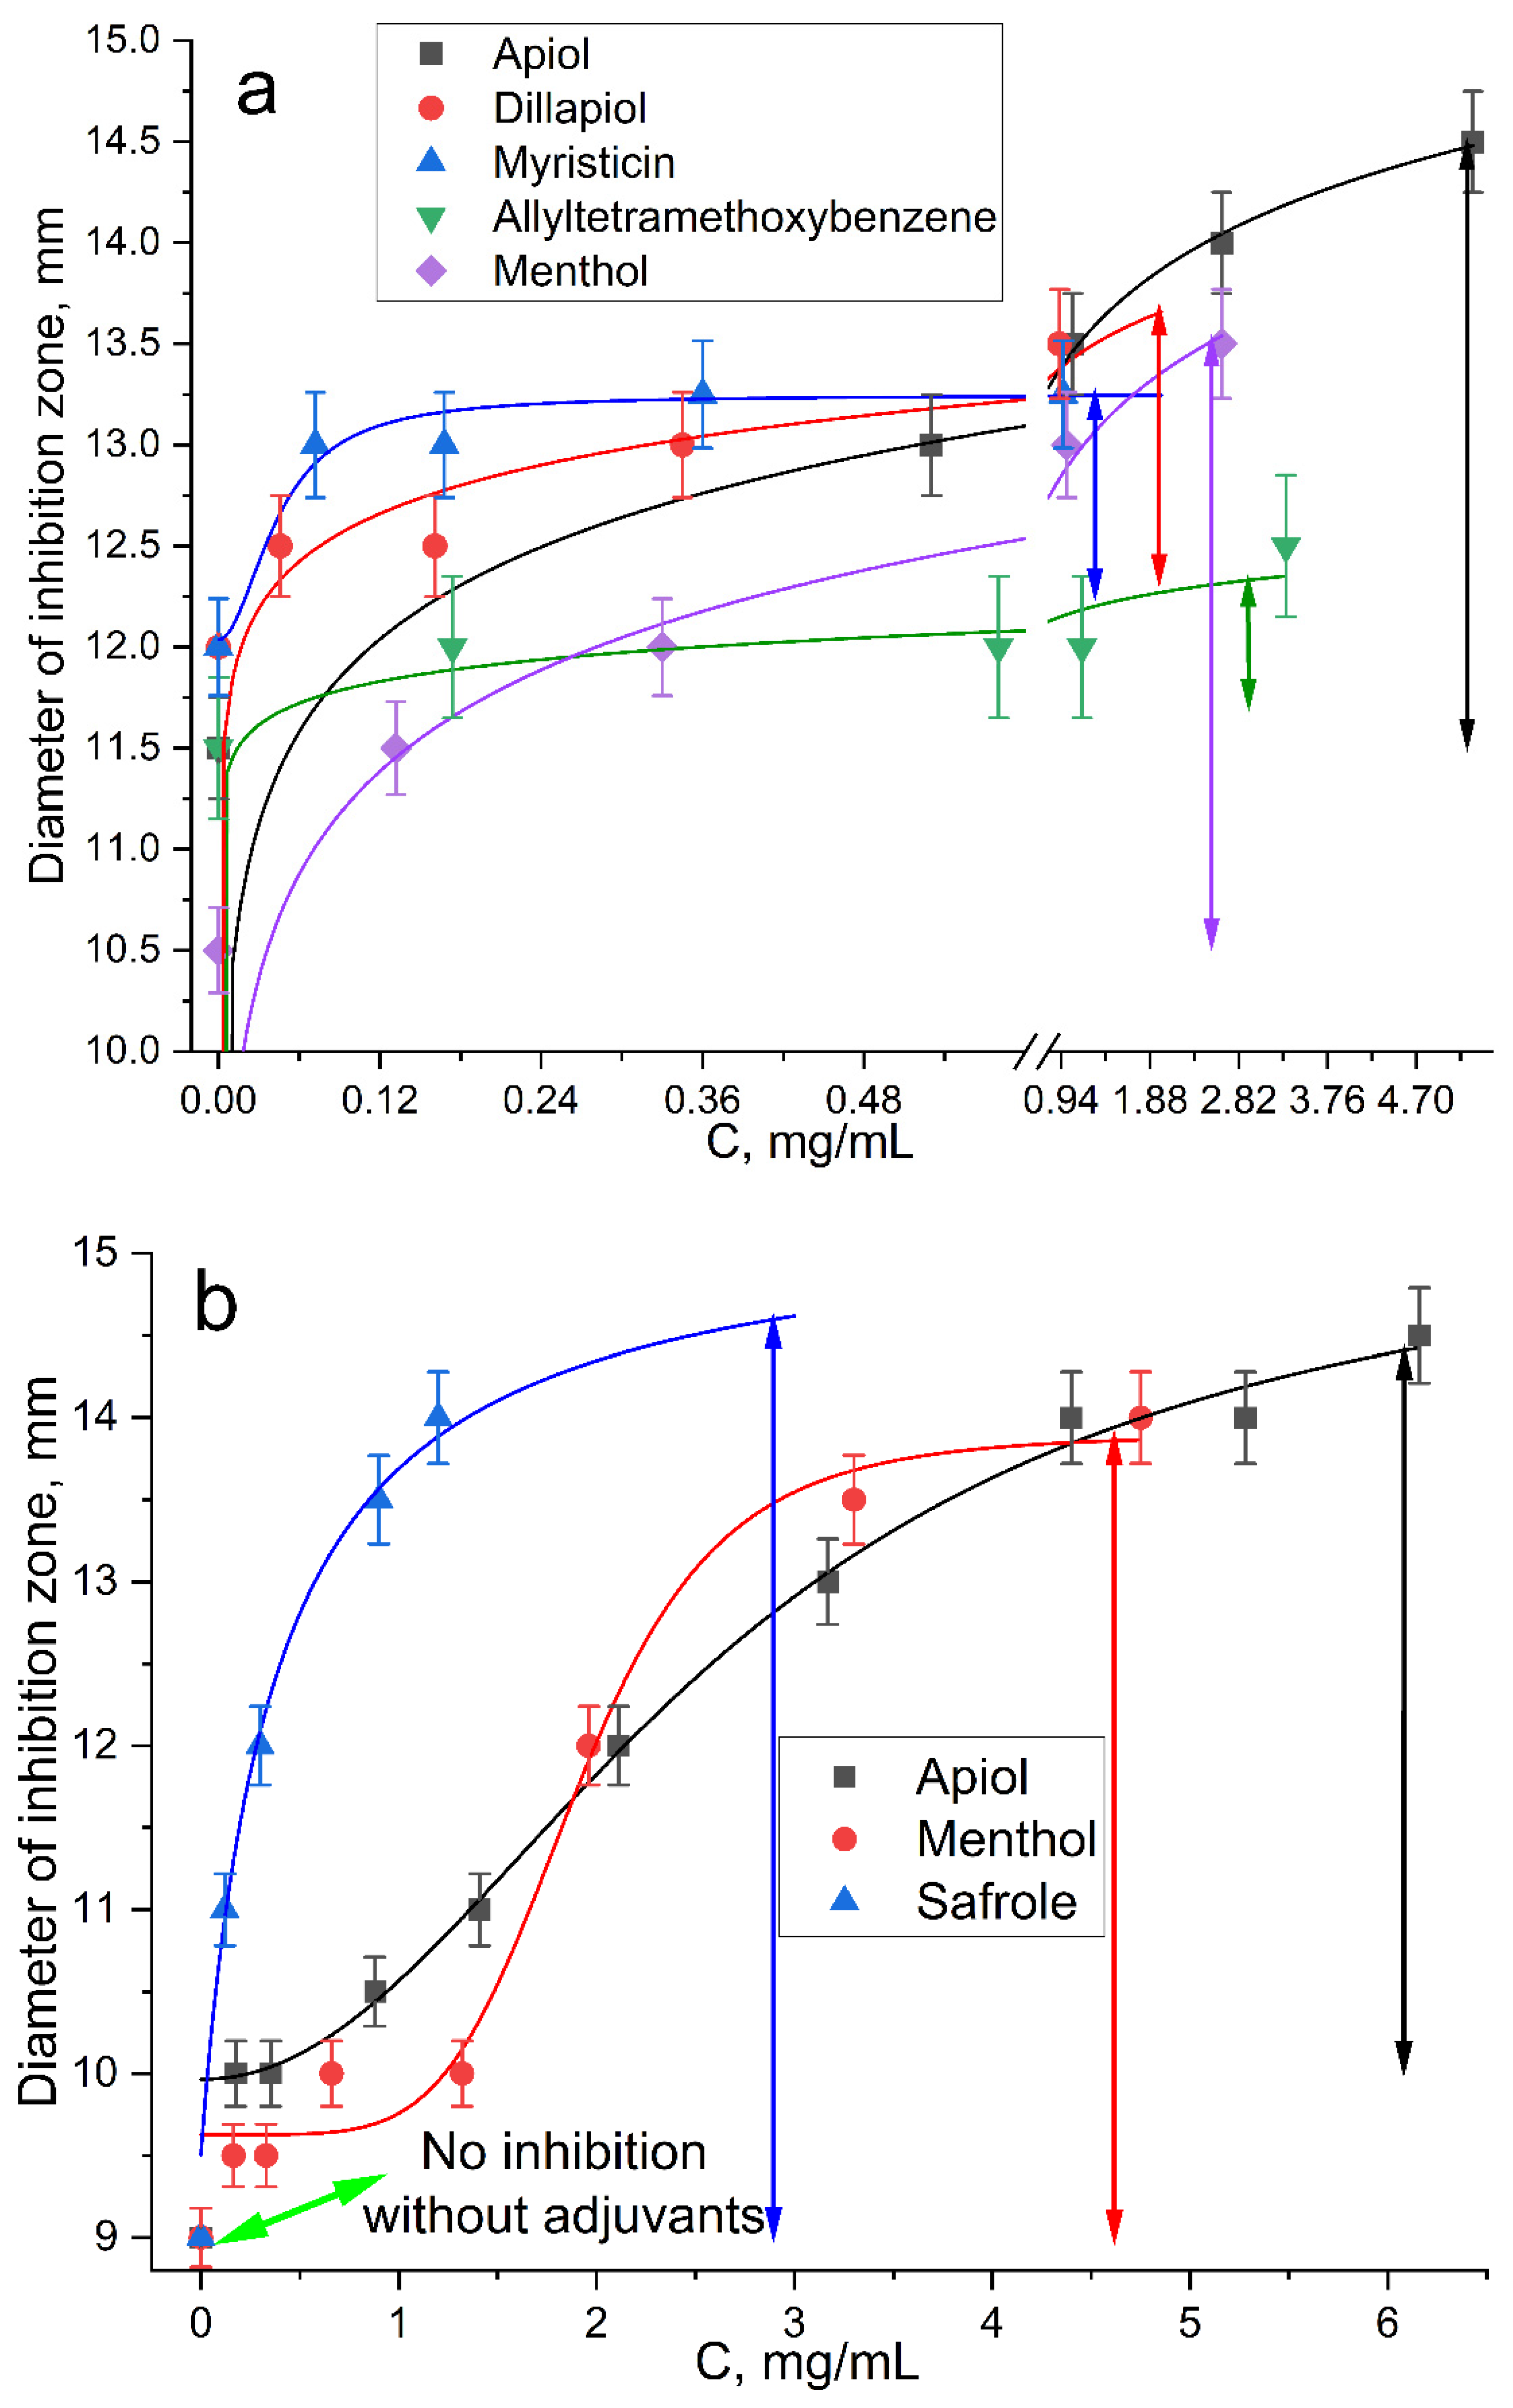
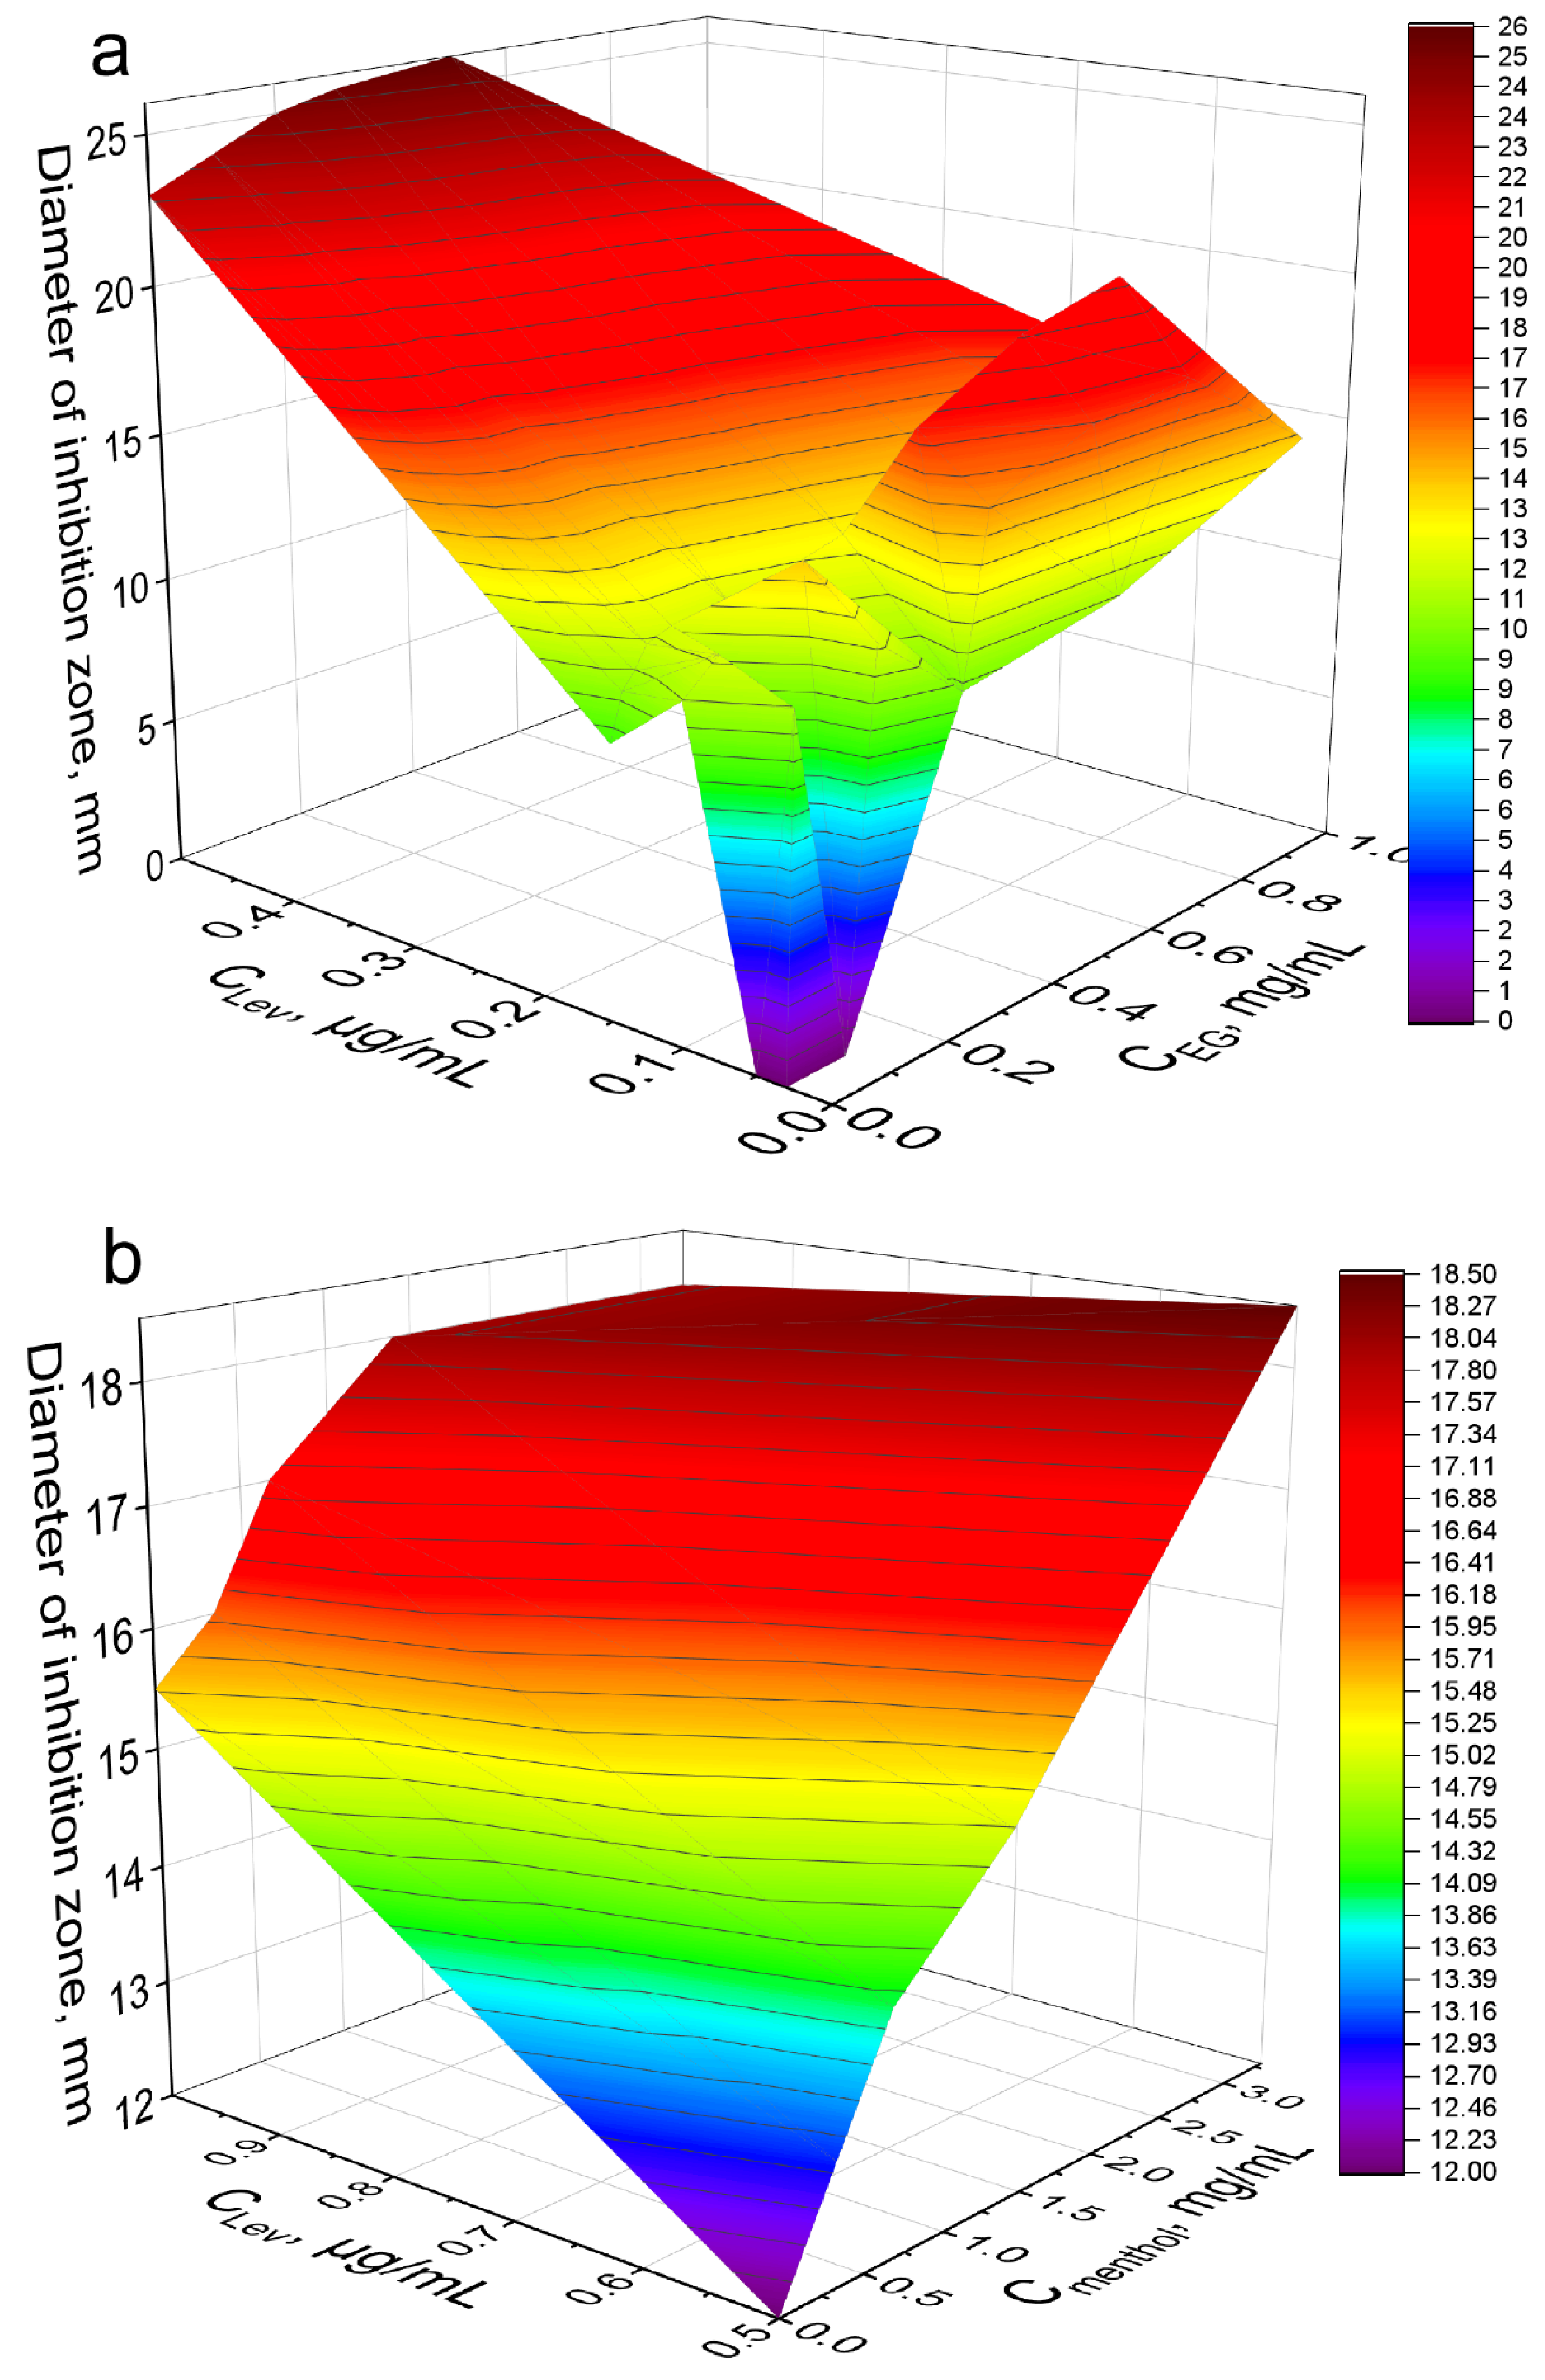
2.2.2. Synergy of Adjuvants with Lev
3. Materials and Methods
3.1. Chemicals
3.2. Obtaining, Isolation of APAB
3.3. Preparation of β-Cyclodextrin Inclusion Complexes
3.4. UV Spectroscopy
3.5. FTIR Spectroscopy
3.6. Antibacterial Activity of Lev and Adjuvants
3.7. Mathematical Calculations and Equations
3.8. NMR Spectroscopy
4. Conclusions
Supplementary Materials
Author Contributions
Funding
Institutional Review Board Statement
Informed Consent Statement
Data Availability Statement
Acknowledgments
Conflicts of Interest
Abbreviations
| APAB | allylpolyalkoxybenzenes |
| CD | cyclodextrin |
| EE | entrapment efficiency |
| EG | eugenol |
| HPCD | (2-hydroxypropyl)-β-cyclodextrin |
| FICI | fractional inhibitory concentration index |
| LC | loading capacity |
| Lev | levofloxacin |
| MCD | methyl-β-cyclodextrin |
| MIC | minimum inhibitory concentration |
| SE | solubility efficiency |
References
- Samet, A.V.; Shevchenko, O.G.; Rusak, V.V.; Chartov, E.M.; Myshlyavtsev, A.B.; Rusanov, D.A.; Semenova, M.N.; Semenov, V.V. Antioxidant Activity of Natural Allylpolyalkoxybenzene Plant Essential Oil Constituents. J. Nat. Prod. 2019, 82, 1451–1458. [Google Scholar] [CrossRef] [PubMed]
- Valdivieso-Ugarte, M.; Gomez-Llorente, C.; Plaza-Díaz, J.; Gil, Á. Antimicrobial, antioxidant, and immunomodulatory properties of essential oils: A systematic review. Nutrients 2019, 11, 2786. [Google Scholar] [CrossRef] [PubMed] [Green Version]
- Pramod, K.; Ansari, S.H.; Ali, J. Eugenol: A natural compound with versatile pharmacological actions. Nat. Prod. Commun. 2010, 5, 1999–2006. [Google Scholar] [CrossRef] [PubMed] [Green Version]
- Baskaran, Y.; Periyasamy, V.; Venkatraman, A.C. Corrigendum to “Investigation of antioxidant, anti-inflammatory and DNA-protective properties of eugenol in thioacetamide-induced liver injury in rats” [Toxicology 268 (3) 204–212]. Toxicology 2021, 456, 152781. [Google Scholar] [CrossRef] [PubMed]
- Ito, M.; Murakami, K.; Yoshino, M. Antioxidant action of eugenol compounds: Role of metal ion in the inhibition of lipid peroxidation. Food Chem. Toxicol. 2005, 43, 461–466. [Google Scholar] [CrossRef]
- Arikado, H. NII-Electronic Library Service. Chem. Pharm. Bull. 2002, 27, 2091. [Google Scholar]
- Singh, G.; Maurya, S.; deLampasona, M.P.; Catalan, C.A.N. A comparison of chemical, antioxidant and antimicrobial studies of cinnamon leaf and bark volatile oils, oleoresins and their constituents. Food Chem. Toxicol. 2007, 45, 1650–1661. [Google Scholar] [CrossRef]
- Ali, S.M.; Khan, A.A.; Ahmed, I.; Musaddiq, M.; Ahmed, K.S.; Polasa, H.; Rao, L.V.; Habibullah, C.M.; Sechi, L.A.; Ahmed, N. Antimicrobial activities of Eugenol and Cinnamaldehyde against the human gastric pathogen Helicobacter pylori. Ann. Clin. Microbiol. Antimicrob. 2005, 4, 20. [Google Scholar] [CrossRef] [Green Version]
- Leite, A.M.; Lima, E.D.O.; De Souza, E.L.; Diniz, M.D.F.F.M.; Trajano, V.N.; De Medeiros, I.A. Inhibitory effect of β-pinene, α-pinene and eugenol on the growth of potential infectious endocarditis causing Gram-positive bacteria. Rev. Bras. Cienc. Farm. J. Pharm. Sci. 2007, 43, 121–126. [Google Scholar] [CrossRef] [Green Version]
- Hemaiswarya, S.; Doble, M. Synergistic interaction of eugenol with antibiotics against Gram negative bacteria. Phytomedicine 2009, 16, 997–1005. [Google Scholar] [CrossRef]
- Cotmore, J.M.; Burke, A.; Lee, N.H.; Shapiro, I.M. Respiratory inhibition of isolated rat liver mitochondria by eugenol. Arch. Oral Biol. 1979, 24, 565–568. [Google Scholar] [CrossRef]
- Lichtenstein, E.P.; Liang, T.T.; Schulz, K.R.; Schnoes, H.K.; Carter, G.T. Insecticidal and synergistic components isolated from dill plants. J. Agric. Food Chem. 1974, 22, 658–664. [Google Scholar] [CrossRef] [PubMed]
- Pereira de Lira, M.H.; Fernandes Queiroga Moraes, G.; Macena Santos, G.; Patrício de Andrade Júnior, F.; De Oliveira Pereira, F.; Oliveira Lima, I. Synergistic antibacterial activity of monoterpenes in combination with conventional antimicrobials against Gram-positive and Gram-negative bacteria. Rev. Ciências Médicas E Biológicas 2020, 19, 258. [Google Scholar] [CrossRef]
- Woranuch, S.; Yoksan, R. Eugenol-loaded chitosan nanoparticles: I. Thermal stability improvement of eugenol through encapsulation. Carbohydr. Polym. 2013, 96, 578–585. [Google Scholar] [CrossRef]
- Cortés-Rojas, D.F.; Souza, C.R.F.; Oliveira, W.P. Encapsulation of eugenol rich clove extract in solid lipid carriers. J. Food Eng. 2014, 127, 34–42. [Google Scholar] [CrossRef]
- Saokham, P.; Muankaew, C.; Jansook, P.; Loftsson, T. Solubility of cyclodextrins and drug/cyclodextrin complexes. Molecules 2018, 23, 1161. [Google Scholar] [CrossRef] [Green Version]
- Davis, M.E.; Brewster, M.E. Cyclodextrin-based pharmaceutics: Past, present and future. Nat. Rev. Drug Discov. 2004, 3, 1023–1035. [Google Scholar] [CrossRef]
- Skuredina, A.A.; Tychinina, A.S.; Le-Deygen, I.M.; Belogurova, N.G.; Kudryashova, E.V. Regulation of Properties of Lipid Membranes by Interaction with 2-Hydroxypropyl β-Cyclodextrin: Molecular Details. Russ. J. Bioorg. Chem. 2020, 46, 692–701. [Google Scholar] [CrossRef]
- Wang, T.; Li, B.; Si, H.; Lin, L.; Chen, L. Release characteristics and antibacterial activity of solid state eugenol/β-cyclodextrin inclusion complex. J. Incl. Phenom. Macrocycl. Chem. 2011, 71, 207–213. [Google Scholar] [CrossRef]
- Gong, L.; Li, T.; Chen, F.; Duan, X.; Yuan, Y.; Zhang, D.; Jiang, Y. An inclusion complex of eugenol into β-cyclodextrin: Preparation, and physicochemical and antifungal characterization. Food Chem. 2016, 196, 324–330. [Google Scholar] [CrossRef]
- Kayaci, F.; Ertas, Y.; Uyar, T. Enhanced thermal stability of eugenol by cyclodextrin inclusion complex encapsulated in electrospun polymeric nanofibers. J. Agric. Food Chem. 2013, 61, 8156–8165. [Google Scholar] [CrossRef] [PubMed]
- Nuchuchua, O.; Saesoo, S.; Sramala, I.; Puttipipatkhachorn, S.; Soottitantawat, A.; Ruktanonchai, U. Physicochemical investigation and molecular modeling of cyclodextrin complexation mechanism with eugenol. Food Res. Int. 2009, 42, 1178–1185. [Google Scholar] [CrossRef]
- Seo, E.J.; Min, S.G.; Choi, M.J. Release characteristics of freeze-dried eugenol encapsulated with β-cyclodextrin by molecular inclusion method. J. Microencapsul. 2010, 27, 496–505. [Google Scholar] [CrossRef] [PubMed]
- Hill, L.E.; Gomes, C.; Taylor, T.M. Characterization of beta-cyclodextrin inclusion complexes containing essential oils (trans-cinnamaldehyde, eugenol, cinnamon bark, and clove bud extracts) for antimicrobial delivery applications. LWT-Food Sci. Technol. 2013, 51, 86–93. [Google Scholar] [CrossRef]
- Tadtong, S.; Watthanachaiyingcharoen, R.; Kamkaen, N. Antimicrobial constituents and synergism effect of the essential oils from Cymbopogon citratus and Alpinia galanga. Nat. Prod. Commun. 2014, 9, 277–280. [Google Scholar] [CrossRef] [PubMed] [Green Version]
- Cardoso, N.N.R.; Alviano, C.S.; Blank, A.F.; Romanos, M.T.V.; Fonseca, B.B.; Rozental, S.; Rodrigues, I.A.; Alviano, D.S. Synergism Effect of the Essential Oil from Ocimum basilicum var. Maria Bonita and Its Major Components with Fluconazole and Its Influence on Ergosterol Biosynthesis. Evid.-Based Complement. Altern. Med. 2016, 2016, 5647182. [Google Scholar] [CrossRef] [Green Version]
- El-Kemary, M.; Sobhy, S.; El-Daly, S.; Abdel-Shafi, A. Inclusion of Paracetamol into β-cyclodextrin nanocavities in solution and in the solid state. Spectrochim. Acta Part A Mol. Biomol. Spectrosc. 2011, 79, 1904–1908. [Google Scholar] [CrossRef]
- Le-Deygen, I.M.; Skuredina, A.A.; Uporov, I.V.; Kudryashova, E.V. Thermodynamics and molecular insight in guest–host complexes of fluoroquinolones with β-cyclodextrin derivatives, as revealed by ATR-FTIR spectroscopy and molecular modeling experiments. Anal. Bioanal. Chem. 2017, 409, 6451–6462. [Google Scholar] [CrossRef]
- Zlotnikov, I.D.; Kudryashova, E.V. Spectroscopy Approach for Highly-Efficient Screening of Lectin-Ligand Interactions in Application for Mannose Receptor and Molecular Containers for Antibacterial Drugs. Pharmaceuticals 2022, 15, 625. [Google Scholar] [CrossRef]
- Abarca, R.L.; Rodríguez, F.J.; Guarda, A.; Galotto, M.J.; Bruna, J.E. Characterization of beta-cyclodextrin inclusion complexes containing an essential oil component. Food Chem. 2016, 196, 968–975. [Google Scholar] [CrossRef]
- Lu, Y.; Zhang, X.; Lai, J.; Yin, Z.; Wu, W. Physical characterization of meloxicam-β-cyclodextrin inclusion complex pellets prepared by a fluid-bed coating method. Particuology 2009, 7, 1–8. [Google Scholar] [CrossRef]
- Seo, S.J.; Kim, S.H.; Sasagawa, T.; Choi, Y.J.; Akaike, T.; Cho, C.S. Delivery of all trans-retinoic acid (RA) to hepatocyte cell line from RA/galactosyl α-cyclodextrin inclusion complex. Eur. J. Pharm. Biopharm. 2004, 58, 681–687. [Google Scholar] [CrossRef] [PubMed]
- Sampaio, C.; Moriwaki, C.; Claudia, A.; Sato, F.; Luciano, M.; Medina, A.; Matioli, G. Curcumin—β-cyclodextrin inclusion complex: Stability, solubility, characterisation by FT-IR, FT-Raman, X-ray diffraction and photoacoustic spectroscopy, and food application. Food Chem. 2014, 153, 361–370. [Google Scholar] [CrossRef] [Green Version]
- Skuredina, A.A.; Le-Deygen, I.M.; Uporov, I.V.; Kudryashova, E.V. A study of the physicochemical properties and structure of moxifloxacin complex with methyl-β-cyclodextrin. Colloid J. 2017, 79, 668–676. [Google Scholar] [CrossRef]
- Jelić, R.; Tomović, M.; Stojanović, S.; Joksović, L.; Jakovljević, I.; Djurdjević, P. Study of inclusion complex of β-cyclodextrin and levofloxacin and its effect on the solution equilibria between gadolinium(III) ion and levofloxacin. Mon. Fur. Chem. 2015, 146, 1621–1630. [Google Scholar] [CrossRef]
- Chen, M.; Diao, G.; Zhang, E. Study of inclusion complex of β-cyclodextrin and nitrobenzene. Chemosphere 2006, 63, 522–529. [Google Scholar] [CrossRef]
- Banjare, M.K.; Behera, K.; Banjare, R.K.; Pandey, S.; Ghosh, K.K. Inclusion complexation of imidazolium-based ionic liquid and β-cyclodextrin: A detailed spectroscopic investigation. J. Mol. Liq. 2020, 302, 112530. [Google Scholar] [CrossRef]
- Fernandes, C.M.; Carvalho, R.A.; Pereira da Costa, S.; Veiga, F.J.B. Multimodal molecular encapsulation of nicardipine hydrochloride by β-cyclodextrin, hydroxypropyl-β-cyclodextrin and triacetyl-β-cyclodextrin in solution. Structural studies by 1H NMR and ROESY experiments. Eur. J. Pharm. Sci. 2003, 18, 285–296. [Google Scholar] [CrossRef]
- Kost, B.; Brzeziński, M.; Zimnicka, M.; Socka, M.; Wielgus, E.; Słowianek, M.; Biela, T. PLA Stereocomplexed Microspheres Modified with Methyl-β-Cyclodextrin as an Atropine Delivery System. Synthesis and Characterization. Mater. Today Commun. 2020, 25, 101605. [Google Scholar] [CrossRef]
- Otero-Espinar, F.J.; Anguiano-Igea, S.; García-González, N.; Vila-Jato, J.L.; Blanco-Méndez, J. Interaction of naproxen with β-cyclodextrin in solution and in the solid state. Int. J. Pharm. 1992, 79, 149–157. [Google Scholar] [CrossRef]
- Garg, A.; Gupta, B.; Prakash, R.; Singh, S. Preparation and characterization of hydroxypropyl-β-cyclodextrin inclusion complex of eugenol: Differential pulse voltammetry and 1H-NMR. Chem. Pharm. Bull. 2010, 58, 1313–1319. [Google Scholar] [CrossRef] [PubMed] [Green Version]
- Glöckner, P.; Schollmeyer, D.; Ritter, H. X-ray diffraction analysis of butyl- and isobornyl acrylate/heptakis(2,6-di-O-methyl)-β-cyclodextrin complexes and correlation to 1H NMR-spectra. Des. Monomers Polym. 2002, 5, 163–172. [Google Scholar] [CrossRef] [Green Version]
- Locci, E.; Lai, S.; Piras, A.; Marongiu, B.; Lai, A. 13C-CPMAS and 1H-NMR study of the inclusion complexes of β-cyclodextrin with carvacrol, thymol, and eugenol prepared in supercritical carbon dioxide. Chem. Biodivers. 2004, 1, 1354–1366. [Google Scholar] [CrossRef] [PubMed]
- Jafri, H.; Banerjee, G.; Khan, M.S.A.; Ahmad, I.; Abulreesh, H.H.; Althubiani, A.S. Synergistic interaction of eugenol and antimicrobial drugs in eradication of single and mixed biofilms of Candida albicans and Streptococcus mutans. AMB Express 2020, 10, 185. [Google Scholar] [CrossRef] [PubMed]
- Herman, A.; Tambor, K.; Herman, A. Linalool Affects the Antimicrobial Efficacy of Essential Oils. Curr. Microbiol. 2016, 72, 165–172. [Google Scholar] [CrossRef]
- Tychinina, A.S.; Skuredina, A.A.; Le-Deygen, I.M.; Kudryashova, E.V. Influence of Substituents in β-Cyclodextrin on the Interaction of Levofloxacin–β-Cyclodextrin Complexes with Liposomal Membrane. Colloid J. 2021, 83, 794–801. [Google Scholar] [CrossRef]
- Hall, M.J.; Middleton, R.F.; Westmacott, D. The fractional inhibitory concentration (FIC) index as a measure of synergy. J. Antimicrob. Chemother. 1983, 11, 427–433. [Google Scholar] [CrossRef]
- Boire, N.A.; Riedel, S.; Parrish, N.M. Essential Oils and Future Antibiotics: New Weapons against Emerging ’Superbugs’? J. Anc. Dis. Prev. Rem. 2013, 1, 105. [Google Scholar] [CrossRef] [Green Version]
- Jiso, A.; Khemawoot, P.; Techapichetvanich, P.; Soopairin, S.; Phoemsap, K.; Damrongsakul, P.; Wongwiwatthananukit, S.; Vivithanaporn, P. Drug-Herb Interactions among Thai Herbs and Anticancer Drugs: A Scoping Review. Pharmaceuticals 2022, 15, 146. [Google Scholar] [CrossRef]
- Ulanowska, M.; Olas, B. Biological properties and prospects for the application of eugenol—A review. Int. J. Mol. Sci. 2021, 22, 3671. [Google Scholar] [CrossRef]
- Neyfakh, A.A.; Bidnenko, V.E.; Chen, L.B. Efflux-mediated multidrug resistance in Bacillus subtilis: Similarities and dissimilarities with the mammalian system. Proc. Natl. Acad. Sci. USA 1991, 88, 4781–4785. [Google Scholar] [CrossRef] [PubMed] [Green Version]
- De Lima, C.A.; De Souza Bueno, I.L.; Vasconcelos, S.N.S.; Sciani, J.M.; Gois Ruiz, A.L.T.; Foglio, M.A.; De Carvalho, J.E.; Longato, G.B. Reversal of ovarian cancer cell lines multidrug resistance phenotype by the association of apiole with chemotherapies. Pharmaceuticals 2020, 13, 327. [Google Scholar] [CrossRef] [PubMed]
- Semenov, V.V.; Rusak, V.V.; Chartov, E.M.; Zaretskii, M.I.; Konyushkin, L.D.; Firgang, S.I.; Chizhov, A.O.; Elkin, V.V.; Latin, N.N.; Bonashek, V.M.; et al. Polyalkoxybenzenes from plant raw materials 1. Isolation of polyalkoxybenzenes from CO2 extracts of Umbelliferae plant seeds. Russ. Chem. Bull. 2007, 56, 2448–2455. [Google Scholar] [CrossRef]
- Tsyganov, D.V.; Yakubov, A.P.; Konyushkin, L.D.; Firgang, S.I.; Semenov, V.V. Polyalkoxybenzenes from plant sources 2. Synthesis of isoxazoline analogs of combretastatin from natural allyl(methylenedioxy)methoxybenzenes. Russ. Chem. Bull. 2007, 56, 2460–2465. [Google Scholar] [CrossRef]
- Semenov, V.V.; Kiselyov, A.S.; Titov, I.Y.; Sagamanova, I.K.; Ikizalp, N.N.; Chernysheva, N.B.; Tsyganov, D.V.; Konyushkin, L.D.; Firgang, S.I.; Semenov, R.V.; et al. Synthesis of antimitotic polyalkoxyphenyl derivatives of combretastatin using plant allylpolyalkoxybenzenes (1). J. Nat. Prod. 2010, 73, 1796–1802. [Google Scholar] [CrossRef]
- Deygen, I.M.; Kudryashova, E.V. New versatile approach for analysis of PEG content in conjugates and complexes with biomacromolecules based on FTIR spectroscopy. Colloids Surf. B Biointerfaces 2016, 141, 36–43. [Google Scholar] [CrossRef]


| Compound X | Structure of X | n | −lg Kd | EE, % | LC, % | C0, mM | Cmax in the Presence of 2 mM MCD/HPCD *, mM | Cmax in the Presence of 10 mM MCD/HPCD *, mM |
|---|---|---|---|---|---|---|---|---|
| Levofloxacin [28] | 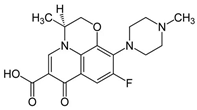 | 1 | 4.0 ± 0.5 (MCD), 3.0 ± 0.5 (HPCD) | 99 ± 12 (MCD), 91 ± 15 (HPCD) | 28.3 ± 0.4 (MCD), 24.1 ± 0.5 (HPCD) | 67 ± 1 | 69 ± 1 (MCD), 68 ± 1 (HPCD) | 77 ± 3 (MCD), 76 ± 4 (HPCD) |
| Eugenol | 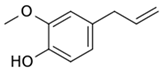 | 1.32 ± 0.08 (MCD), 1.2 ± 0.1 (HPCD) | 2.44 ± 0.20 (MCD), 2.5 ± 0.3 (HPCD) | 39 ± 3 (MCD), 56 ± 7 (HPCD) | 10 ± 1 (MCD), 9 ± 1 (HPCD) | 8.2 ± 0.2 | 8.3 ± 0.2 (MCD), 8.5 ± 0.1 (HPCD) | 11 ± 1 (MCD), 13 ± 1 (HPCD) |
| Apiol | 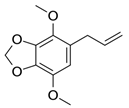 | 1.6 ± 0.2 (MCD), 1.56 ± 0.25 (HPCD) | 2.6 ± 0.3 (MCD), 2.0 ± 0.4 (HPCD) | 20 ± 2 (MCD), 7 ± 1 (HPCD) | 11 ± 1 (MCD), 9 ± 1 (HPCD) | 0.13 ± 0.01 | 1.3 ± 0.1 (MCD, HPCD) | 2.6 ± 0.3 (MCD), 1.8 ± 0.3 (HPCD) |
| Dillapiol | 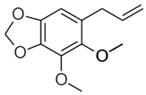 | 1.3 ± 0.2 | 2.7 ± 0.5 | 56 ± 10 | 13 ± 1 | 0.24 ± 0.05 | 0.45 ± 0.07 | 4.5 ± 0.7 |
| Myristicin |  | 0.67 ± 0.06 | 3.52 ± 0.16 | 99 ± 5 | 22 ± 2 | 0.030 ± 0.007 | 3.0 ± 0.2 | 15 ± 1 |
| Safrole | 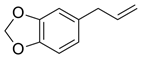 | 1.5 ± 0.2 | 4.3 ± 0.4 | 95 ± 4 | 8 ± 1 | 0.8 ± 0.1 | 1.7 ± 0.1 | 7.1 ± 0.9 |
| Allyltetramethoxybenzene | 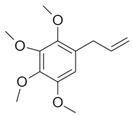 | 1.74 ± 0.11 | 3.4 ± 0.3 | 45 ± 4 | 11 ± 1 | 0.16 ± 0.02 | 0.22 ± 0.03 | 2.8 ± 0.4 |
| Linalool | 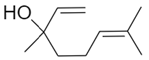 | 1.2 ± 0.2 | 3.0 ± 0.4 | 80 ± 7 | 10 ± 1 | 0.30 ± 0.05 | 0.91 ± 0.07 | 7 ± 1 |
| Menthol |  | 1.1 ± 0.1 | 3.2 ± 0.3 | 91 ± 6 | 11 ± 1 | 0.23 ± 0.04 | 1.4 ± 0.2 | 8.5 ± 0.8 |
| Compound | E. coli (NCIB 12210) | B. subtilis (NCIB 8054) | ||||
|---|---|---|---|---|---|---|
| MIC *, mg/mL | MIC50 **, mg/mL | MIC90 **, mg/mL | MIC *, mg/mL | MIC50 **, mg/mL | MIC90 **, mg/mL | |
| Lev | 0.10 ± 0.01 μg/mL | 0.010 ± 0.002 μg/mL | 0.025 ± 0.004 μg/mL | 0.45 ± 0.05 μg/mL | 0.03 ± 0.01 μg/mL | 0.08 ± 0.02 μg/mL |
| Lev-MCD | 0.06 ± 0.01 μg/mL | 0.007 ± 0.002 μg/mL | 0.022 ± 0.003 μg/mL | 0.25 ± 0.02 μg/mL | 0.016 ± 0.005 μg/mL | 0.05 ± 0.01 μg/mL |
| EG-MCD | 0.30 ± 0.05 | 0.04 ± 0.02 | 0.13 ± 0.03 | 1.0 ± 0.1 | 0.07 ± 0.02 | 0.15 ± 0.05 |
| Apiol-MCD | 2.6 ± 0.2 | 1.2 ± 0.3 | >2 | 5.3 ± 0.4 | >2 | |
| Dillapiol-MCD | 2.4 ± 0.3 | 1.0 ± 0.1 | >2 | >5 | >2 | |
| Myristicin-MCD | >3 | 1.9 ± 0.5 | >2 | >5 | 0.20 ± 0.04 | >2 |
| Safrole-MCD | 1 ± 0.1 | 0.15 ± 0.04 | 0.8 ± 0.1 | 3.9 ± 0.3 | 0.10 ± 0.01 | >2 |
| Allyltetramethoxybenzene-MCD | >3 | >2 | >5 | >2 | ||
| Linalool-MCD | >3 | >2 | >5 | >2 | ||
| Menthol-MCD | >3 | >2 | 2.6 ± 0.3 | 0.15 ± 0.03 | >2 | |
| Compound X-MCD | CLev, μg/mL | DLev, mm (±0.5) | D, mm (±0.5) | ϕLev = (D/DLev)2 (±0.1) | FICadjuvant *, mg/mL | FICI ** (±15%) | Type of Interaction between Lev and X |
|---|---|---|---|---|---|---|---|
| E. coli | |||||||
| Eugenol | 0.03 | NI | 14 | 2.0 | 0.30 ± 0.005 | 0.30 | Synergism |
| 0.05 | NI | 17 | 2.9 | 0.05 ± 0.01 | 0.08 | ||
| 0.1 | 11 | 20 | 3.3 | 0.030 ± 0.005 | 0.10 | ||
| 0.15 | 10 | 15 | 2.3 | 0.010 ± 0.002 | 0.05 | ||
| 0.5 | 22.5 | 26 | 1.3 | 0.08 ± 0.01 | 1.3 | Indifference | |
| Apiol | 0.1 | 11.5 | 14.5 | 1.6 | 0.9 ± 0.1 | 0.35 | Additivity |
| 0.15 | NI | 14 | 2.0 | 0.35 ± 0.05 | 0.20 | Synergism | |
| Dillapiol | 0.1 | 12 | 13.75 | 1.3 | 0.115 ± 0.015 | 0.04 | |
| Myristicin | 0.1 | 12 | 13.25 | 1.2 | 0.12 ± 0.02 | 0.04 | |
| Allyltetramethoxybenzene | 0.1 | 11.5 | 12 | 1.1 | 2.0 ± 0.2 | 0.50 | Additivity |
| Linalool | 0.1 | NI | NI *** | NI | NI | NI | Indifference |
| Menthol | 0.1 | 10.5 | 13.5 | 1.7 | 0.06 ± 0.01 | 0.02 | Synergism |
| 0.15 | NI | 14 | 2.0 | 0.40 ± 0.05 | 0.15 | ||
| Safrole | 0.15 | 10 | 14.5 | 2.1 | 0.06 ± 0.01 | 0.09 | |
| B. subtilis | |||||||
| Eugenol | 0.4 | 12 | 14.5 | 1.5 | 0.10 ± 0.01 | 0.16 | Synergism |
| 0.7 | 14.5 | 16 | 1.2 | 0.2 ± 0.02 | 0.56 | Additivity | |
| 1.5 | 17 | 19 | 1.2 | 0.10 ± 0.01 | 0.60 | ||
| Safrole | 0.4 | 12 | 14 | 1.4 | 0.17 ± 0.02 | 0.08 | Synergism |
| 0.7 | 15 | 16 | 1.1 | 0.33 ± 0.03 | 0.28 | ||
| 1.5 | 17 | 20 | 1.4 | 0.15 ± 0.02 | 0.27 | ||
| Menthol | 0.5 | 12 | 18.5 | 2.4 | 0.17 ± 0.01 | 0.11 | |
| 1 | 15.5 | 18 | 1.3 | 0.17 ± 0.01 | 0.23 | ||
Publisher’s Note: MDPI stays neutral with regard to jurisdictional claims in published maps and institutional affiliations. |
© 2022 by the authors. Licensee MDPI, Basel, Switzerland. This article is an open access article distributed under the terms and conditions of the Creative Commons Attribution (CC BY) license (https://creativecommons.org/licenses/by/4.0/).
Share and Cite
Zlotnikov, I.D.; Belogurova, N.G.; Krylov, S.S.; Semenova, M.N.; Semenov, V.V.; Kudryashova, E.V. Plant Alkylbenzenes and Terpenoids in the Form of Cyclodextrin Inclusion Complexes as Antibacterial Agents and Levofloxacin Synergists. Pharmaceuticals 2022, 15, 861. https://doi.org/10.3390/ph15070861
Zlotnikov ID, Belogurova NG, Krylov SS, Semenova MN, Semenov VV, Kudryashova EV. Plant Alkylbenzenes and Terpenoids in the Form of Cyclodextrin Inclusion Complexes as Antibacterial Agents and Levofloxacin Synergists. Pharmaceuticals. 2022; 15(7):861. https://doi.org/10.3390/ph15070861
Chicago/Turabian StyleZlotnikov, Igor D., Natalya G. Belogurova, Sergey S. Krylov, Marina N. Semenova, Victor V. Semenov, and Elena V. Kudryashova. 2022. "Plant Alkylbenzenes and Terpenoids in the Form of Cyclodextrin Inclusion Complexes as Antibacterial Agents and Levofloxacin Synergists" Pharmaceuticals 15, no. 7: 861. https://doi.org/10.3390/ph15070861
APA StyleZlotnikov, I. D., Belogurova, N. G., Krylov, S. S., Semenova, M. N., Semenov, V. V., & Kudryashova, E. V. (2022). Plant Alkylbenzenes and Terpenoids in the Form of Cyclodextrin Inclusion Complexes as Antibacterial Agents and Levofloxacin Synergists. Pharmaceuticals, 15(7), 861. https://doi.org/10.3390/ph15070861