Article

Curcumin-Based β-Diketo Ligands for Ga3+: Thermodynamic Investigation of Potential Metal-Based Drugs

1
Department of Chemical and Geological Sciences, University of Modena and Reggio Emilia, Via G. Campi 103, 41125 Modena, Italy
2
Department of Chemical and Pharmaceutical Sciences, University of Trieste, Via L. Giorgieri 1, 34127 Trieste, Italy
3
Radiopharmaceutical Chemistry Section, Nuclear Medicine Unit, Azienda USL-IRCCS Reggio Emilia, Via Amendola 2, 42122 Reggio Emilia, Italy
4
Department of Life Sciences, University of Modena and Reggio Emilia, Via G. Campi 183, 41125 Modena, Italy
*
Author to whom correspondence should be addressed.
Pharmaceuticals 2022, 15(7), 854; https://doi.org/10.3390/ph15070854
Submission received: 2 June 2022 / Revised: 5 July 2022 / Accepted: 7 July 2022 / Published: 12 July 2022

Abstract

:
Curcumin is known for its therapeutic properties; among these, antioxidant, anti-inflammatory and anti-cancer ones stand out. Besides, curcumin metal complexes have shown widespread application in medicine and can be exploited as lead structures for developing metal-based drugs. Unfortunately, curcumin is poorly bioavailable, mainly due to its instability in physiological conditions; this weakness is tightly connected to the presence of the β-diketo moiety undergoing tautomeric equilibrium. Stability and metal-chelating ability can be tuned by modulating the electronic effects and steric hindrance close to the β-diketo moiety; in addition, formation of a metal complex shifts the tautomeric equilibrium towards the β-keto–enol form and increases stability in biological media. Among the metals used in clinical therapy, gallium nitrate has shown to have significant antitumor activity against non-Hodgkin lymphoma and bladder cancer, thus indicating that gallium-based drugs have potential for further development as antineoplastic agents with improved therapeutic activity. Curcuminoids have demonstrated high affinity for gallium(III), allowing the formation of stable positively charged M:L 1:2 β-diketonate complexes that benefit from the therapeutic activity of both the metal and the ligand. Seven new curcumin derivatives were synthesized and completely characterized. The new derivatives retain the solvent-dependent keto–enol tautomerism, with the prevalence of the diketo form in aqueous solution. Enhanced stability in simulated physiological conditions was observed in comparison to the lead compound curcumin. The presence of Ga3+ anticipates the dissociation of the enolic proton, allowing chelate complex formation, and simultaneously it shifts the tautomeric equilibrium towards the keto–enol form. A complete 1H/13C NMR and UV–Vis study was performed to define the metal-to-ligand stoichiometry ratio and the overall stability constants. In addition, we demonstrated that some of the derivatives have increased antiproliferative activity on colon cancer cells compared to curcumin and antioxidant properties. On the whole, the synthesized curcumin-based molecules may act as new gallium(III) chelators with improved stability with respect to curcumin and could open interesting perspectives for the development of novel therapeutic agents for cancer.

1. Introduction

Curcumin (CUR) is known for its therapeutic properties; among these, antioxidant, anti-inflammatory and anti-cancer ones stand out [1,2]. Unfortunately, curcumin is poorly water-soluble and bioavailable [3]; these are the drawbacks that hamper its great therapeutic properties and hold back its use in biomedical applications. This limit could be overcome by designing new methods of administration or synthesizing novel daughter compounds with modified chemical structures. The first strategy allows stabilizing the molecule and increases its bioavailability by reducing its metabolism and increasing the retention time in the bloodstream; recently, many studies have reported on the encapsulation of CUR into nanocarriers (i.e., liposomes, engineered nanoparticles or exosomes, EXOs) with promising preclinical results [4] even for neurological pathologies [5].
The second approach is based on a sort of SWOT analysis that points out particularly the weaknesses in the molecular structure related to the high instability in physiological media and the molecular moieties responsible for therapeutic activities. As the backside of the coin, huge efforts may easily account for failure or terrific success, since in silico investigations have the limit of theoretical models. To date, many SAR (structure–activity–relationship) studies have been performed to design different families of curcuminoids, as lately reviewed by Noureddin et al. [6]. Accordingly, the keto–enol structure is tentatively the main one responsible for fast CUR degradation in physiological conditions and poor bioavailability; this weakness is tightly connected to the presence of the β-diketo moiety undergoing tautomeric equilibrium, although the two tautomeric forms may also account for different biological properties [7].
Due to its C2V symmetry, CUR is characterized by only two tautomers: the keto–enol one (the average of the two equivalent keto–enol forms) and the diketo one. A more intricate situation is instead observed for asymmetric curcuminoids in which the two keto–enol tautomers are not equivalent and are entangled in complex equilibria [8,9]. The keto–enol tautomerism of CUR was investigated in depth, pointing out the prevalence of the keto–enol form in the solid state [10] and in apolar aprotic solvents, while the diketo form is more favored in polar/protic media, particularly in water [11]. Investigations of CUR in aqueous media are further complicated by its extremely low water solubility and by the fact that if spectroscopic techniques are employed, it is challenging to discriminate between the diketo form and the keto–enol form. In fact, mother CUR solutions are commonly prepared in a suitable organic solvent, typically methanol, ethanol or DMSO, that provides a solvation sphere around CUR enabling its dissolution in water but the organic solvation layer stabilizes the keto–enol form despite the polar/protic surrounding environment. Additionally, the structural modification of the keto–enol group by the insertion of a branching arm in the middle of it affects strongly the tautomeric equilibrium; typically, the equilibrium is shifted in favor of the diketo form as the bulkiness of the substituent is increased. In addition to thermodynamic features, recently, it was observed that the rate for reaching the tautomeric equilibrium is highly temperature-dependent, ranging from 700 s at 294 K to 200 s at 314 K [12].
CUR behaves as a weak triprotic acid due to the presence of the keto–enol moiety and the two phenol groups [13], hence, in a solution, proton dissociation equilibria occur. Particularly, the β-keto–enol moiety, due to its weak acid character and the presence of two oxygen atoms, can bind hard metal ions through the formation of a six-membered chelate ring. CUR has been demonstrated to form thermodynamically stable complexes with copper(II) [14,15,16], iron(III) and gallium(III), and other hard Lewis acids, as summarized by Wanninger et al. [13]. Formation of CUR metal complexes shifts the tautomeric equilibrium towards the β-keto–enol form and increases stability in biological media [14]. Furthermore, the stability in physiological conditions and the metal-chelating ability can be tuned by modulating the electronic effects and steric hindrance close to the β-diketo moiety.
Besides, CUR metal complexes have shown widespread application in medicine [13,17] and can be exploited as lead structures for developing metal-based drugs. Among the metals used in clinical therapy, gallium nitrate has been shown to have significant antitumor activity against non-Hodgkin lymphoma and bladder cancer [18], thus indicating that gallium-based drugs have potential for further development as antineoplastic agents with improved therapeutic activity [19,20,21,22,23,24]. Curcuminoids demonstrated high affinity for gallium(III), allowing the formation of stable positively charged M:L 1:2 β-diketonate complexes that benefit from the therapeutic activities of both the metal and the ligand [25].
In this landscape, seven new curcumin derivatives were synthesized (Figure 1) and completely characterized. Two of them, compounds 1 and 2, are asymmetric low-molecular-weight hemi-curcuminoids.
The addition of a substituent in the center of the keto–enol moiety strongly affects the tautomeric equilibrium as well as acidity, stability and polarity, features woven with bioavailability and the related biological properties that can be tuned accordingly. Compounds 3, 4 and 5 are symmetric substituted curcuminoids with an alkyl chain ending with a phthalimide group attached in the center of the keto–enol group. Phthalimide derivatives have recently shown similar activity to CUR in the inhibition of prostate cancer (PC) cell growth and migration, as well as in the modulation of the key molecular pathways involved in tumor progression and survival, opening the opportunity to develop new therapeutic drugs in aggressive PC tumors [26].
Finally, the carboxylic group in compounds 6 and 7 increases the solubility in aqueous media and provides an additional metal-binding group, as previously observed for K2A series [27].
The keto–enol tautomerism is hereafter investigated for all the new derivatives by means of UV–Vis and NMR spectroscopy, and stability in simulated physiological conditions in comparison to the lead compound CUR is estimated as well. The different ligands were compared for their gallium(III)-chelating ability to suggest a potential candidate for further in vitro investigations.

2. Results and Discussion

2.1. Synthesis

Syntheses of all the CUR derivatives were performed using a modified procedure of the Pabon reaction [28]. Differently from the condition applied according to Pabon, DMF was used as a solvent instead of ethyl acetate because the higher reaction temperature, 120 °C vs. 80 °C, increases the reactants’ and products’ solubility. The use of DMF increases the reaction yield and facilitates the work-up.
The insertion of the chain in the keto–enol moiety was directly carried out in acetylacetone, the methylene group was activated in slightly basic conditions allowing the nucleophilic substitution to the Br derivative. All the curcuminoids were obtained with an average yield of around 50% except for compounds 2 and 5 that were obtained with 35% yield.

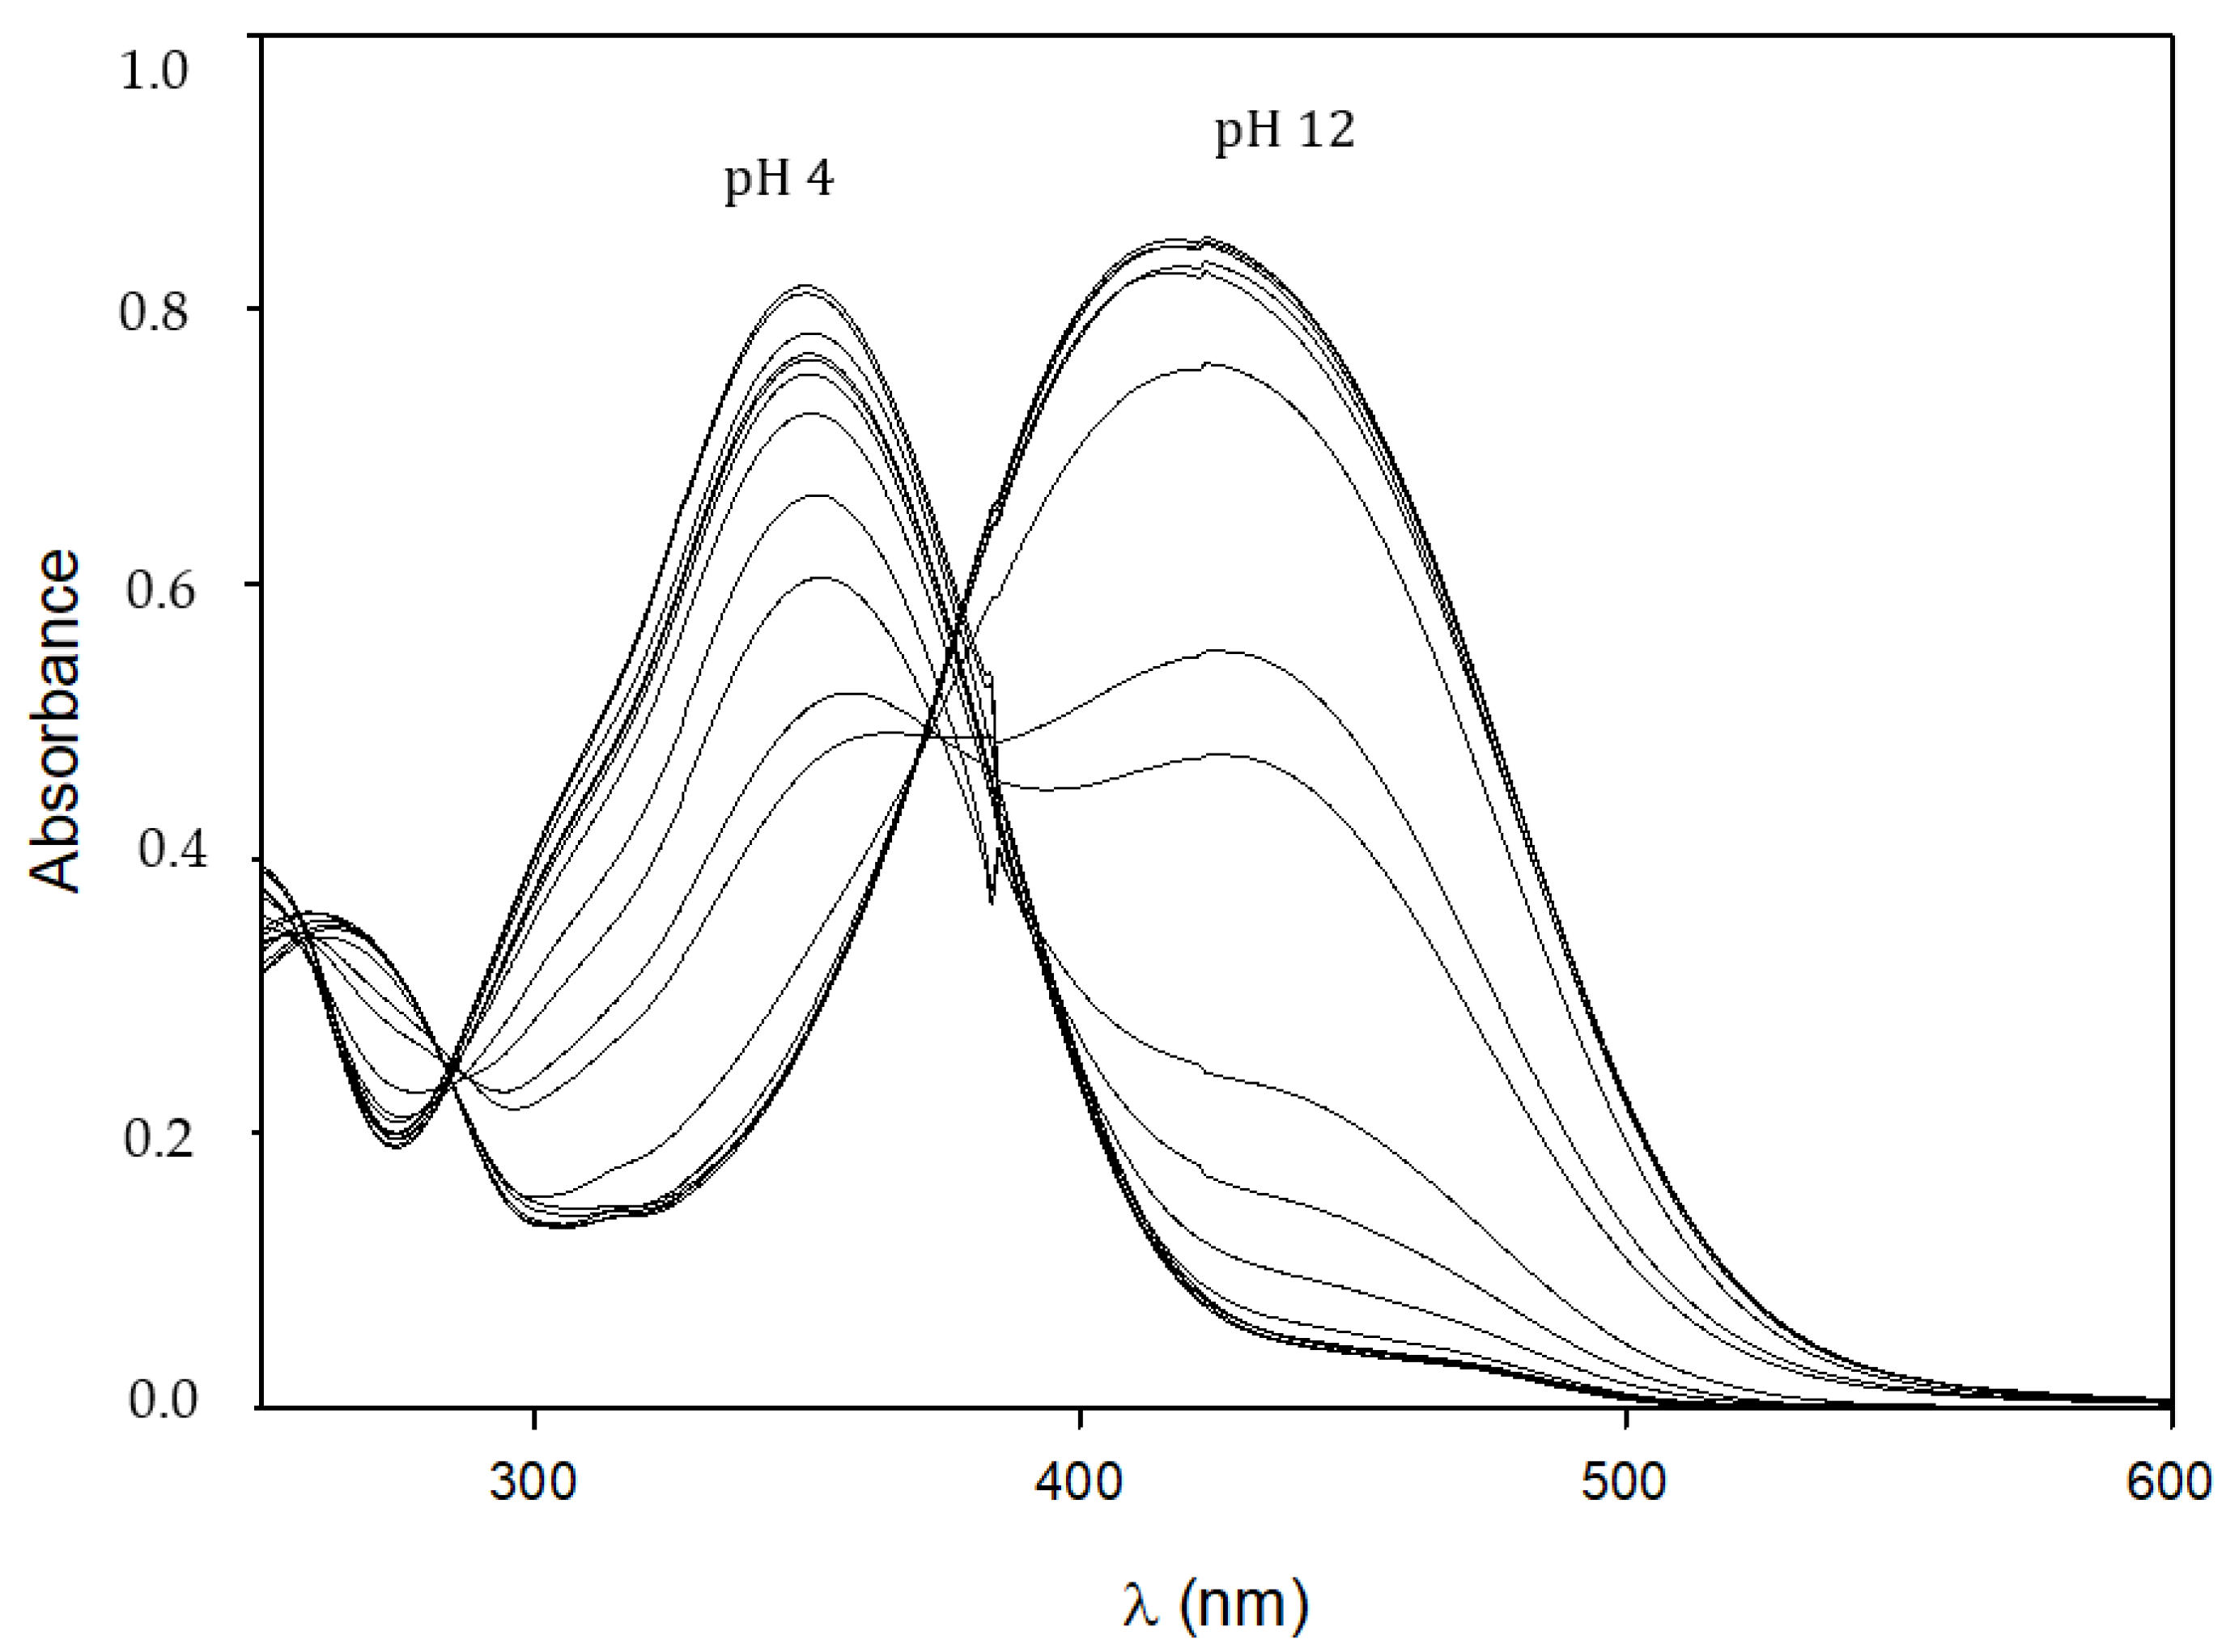
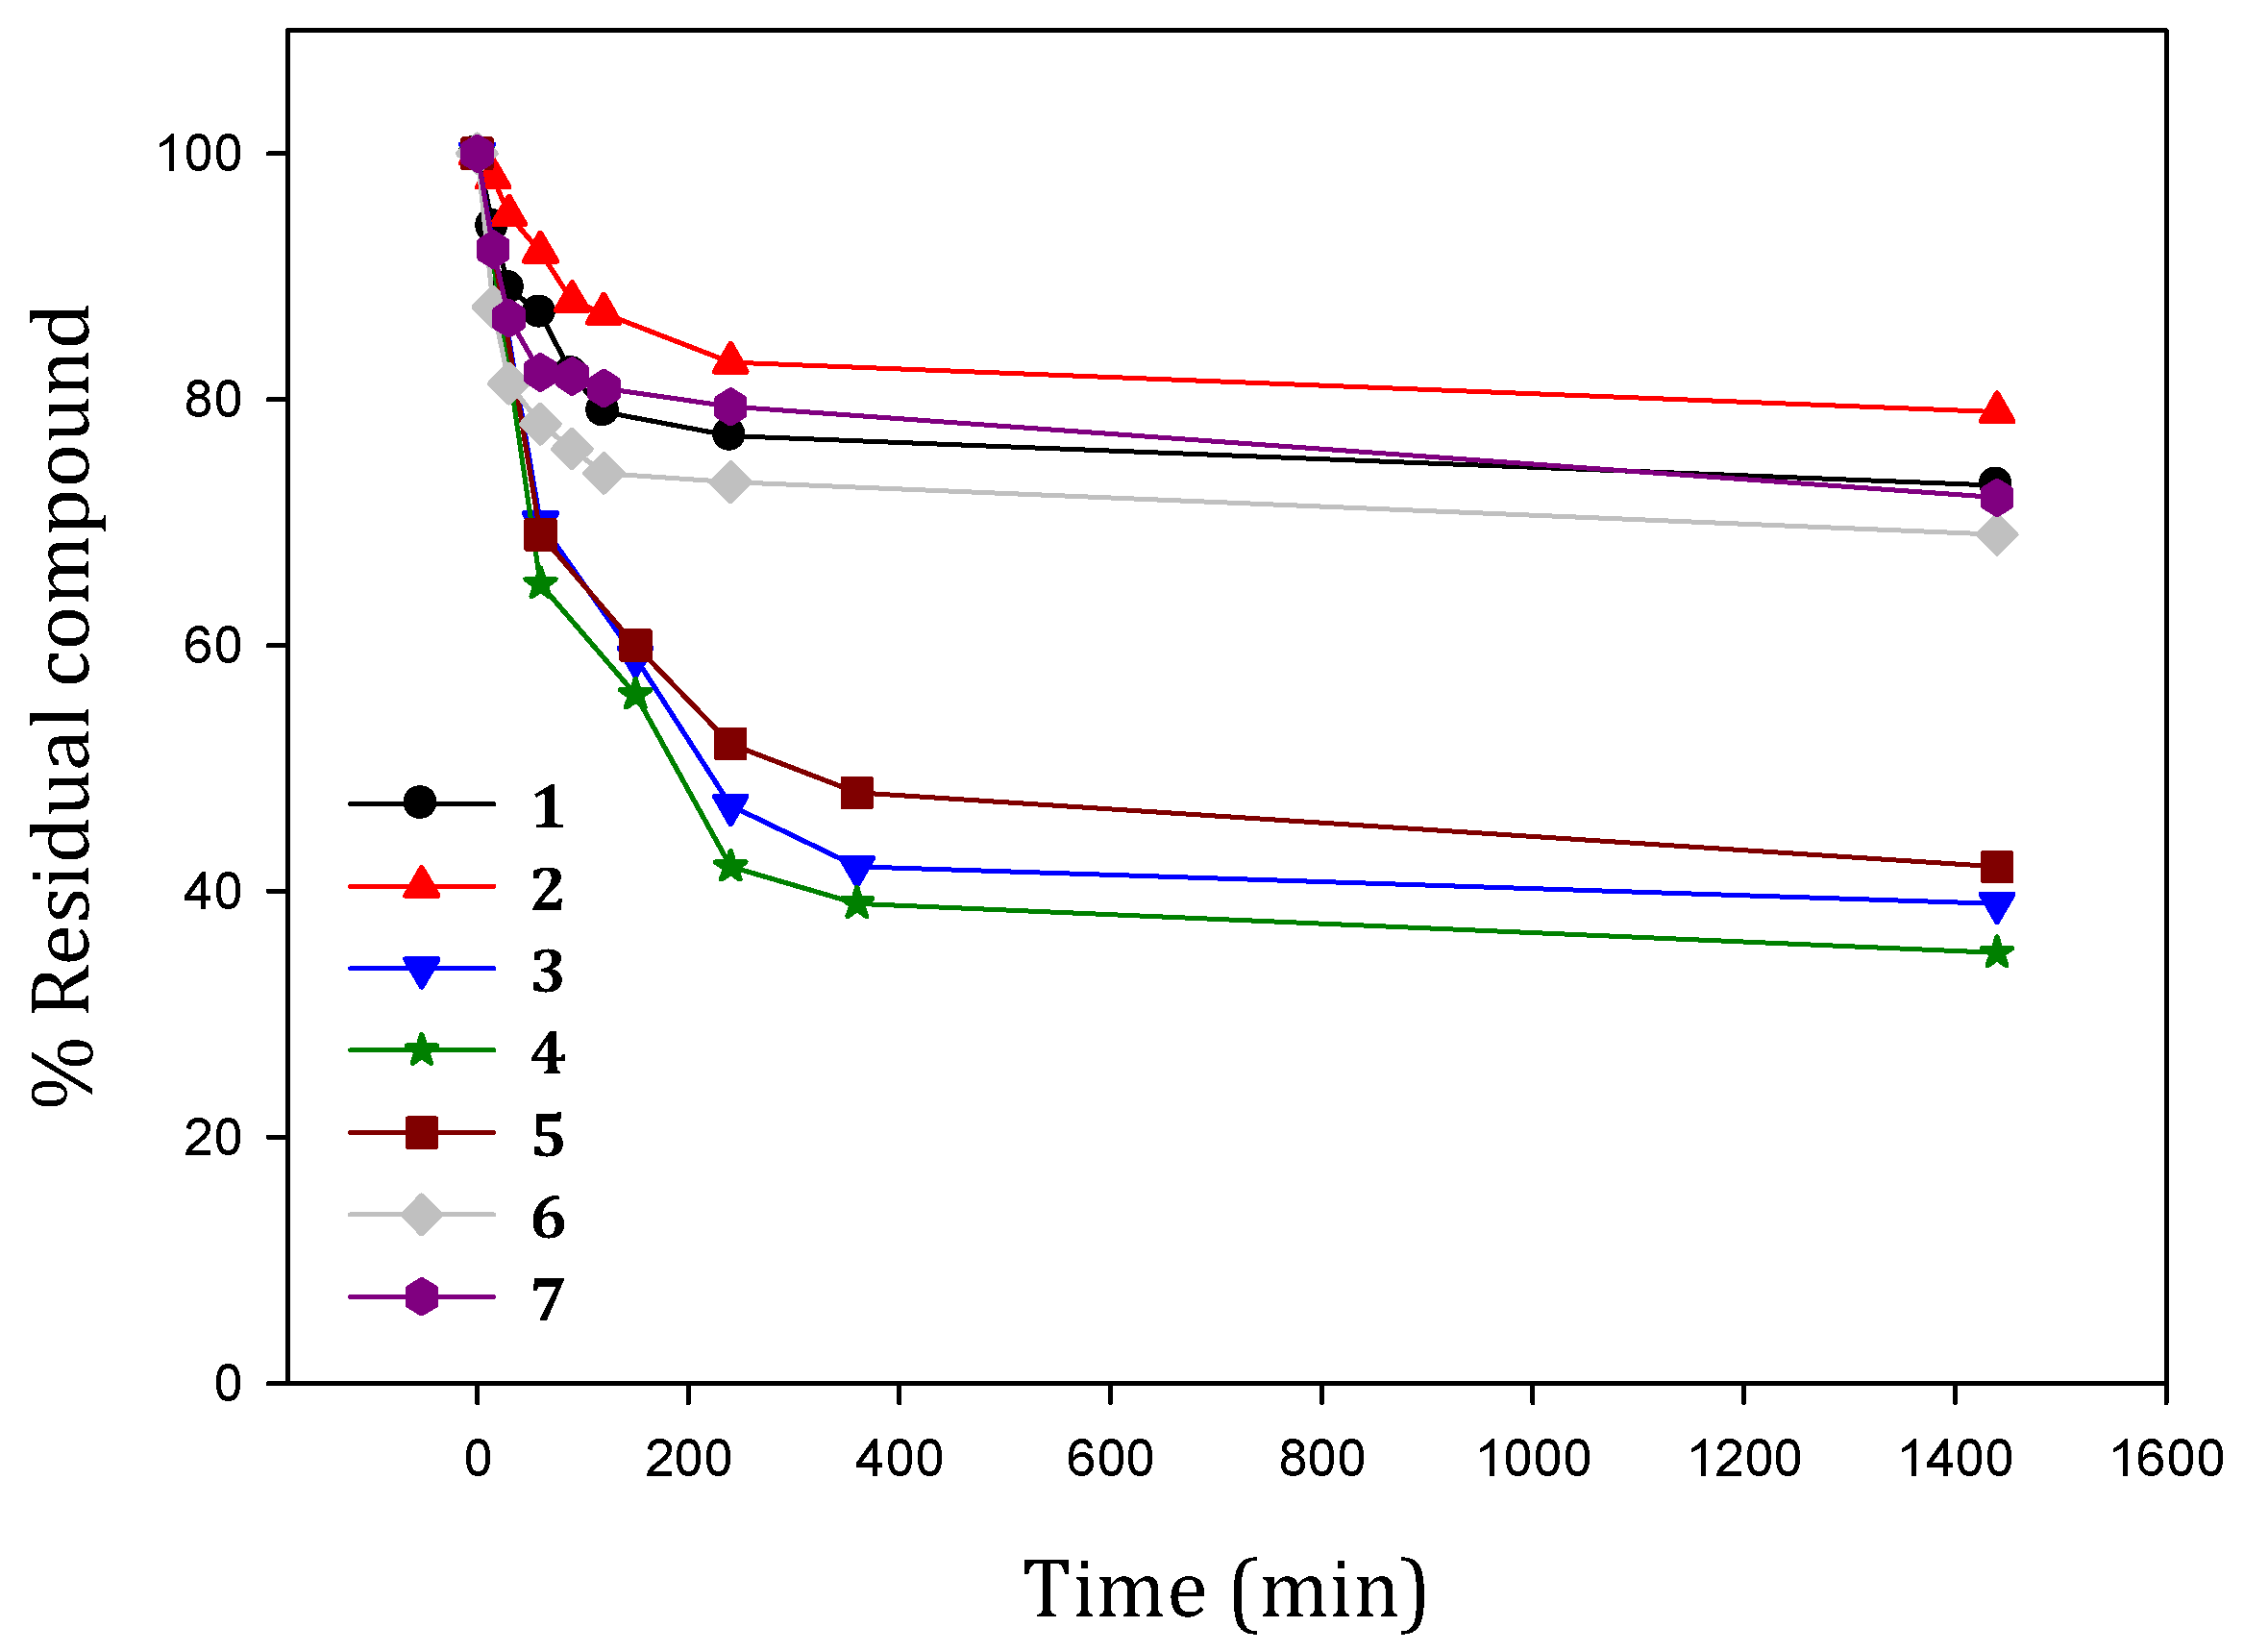
2.2. Stability in Physiological Conditions

All the investigated compounds showed greater stability than the lead compound curcumin in physiological conditions [29], although ligands 1, 2, 6 and 7 are more stable than 3, 4 and 5 (Figure 2). The reduction in conjugation for 1 and 2 and particularly the protection of the phenol group provides an improvement in stability of the physiological condition, a pillar feature for clinical applications. Carboxylic ligands 6 and 7 are found in their mono-dissociated negatively charged form at pH 7.4, able to form strong interactions with water molecules that probably prevent degradation equilibria. Considering the residual compound’s percentage after 4 h, the order of stability is as follows:
2 > 7 > 1 > 6 > 5 > 3 > 4

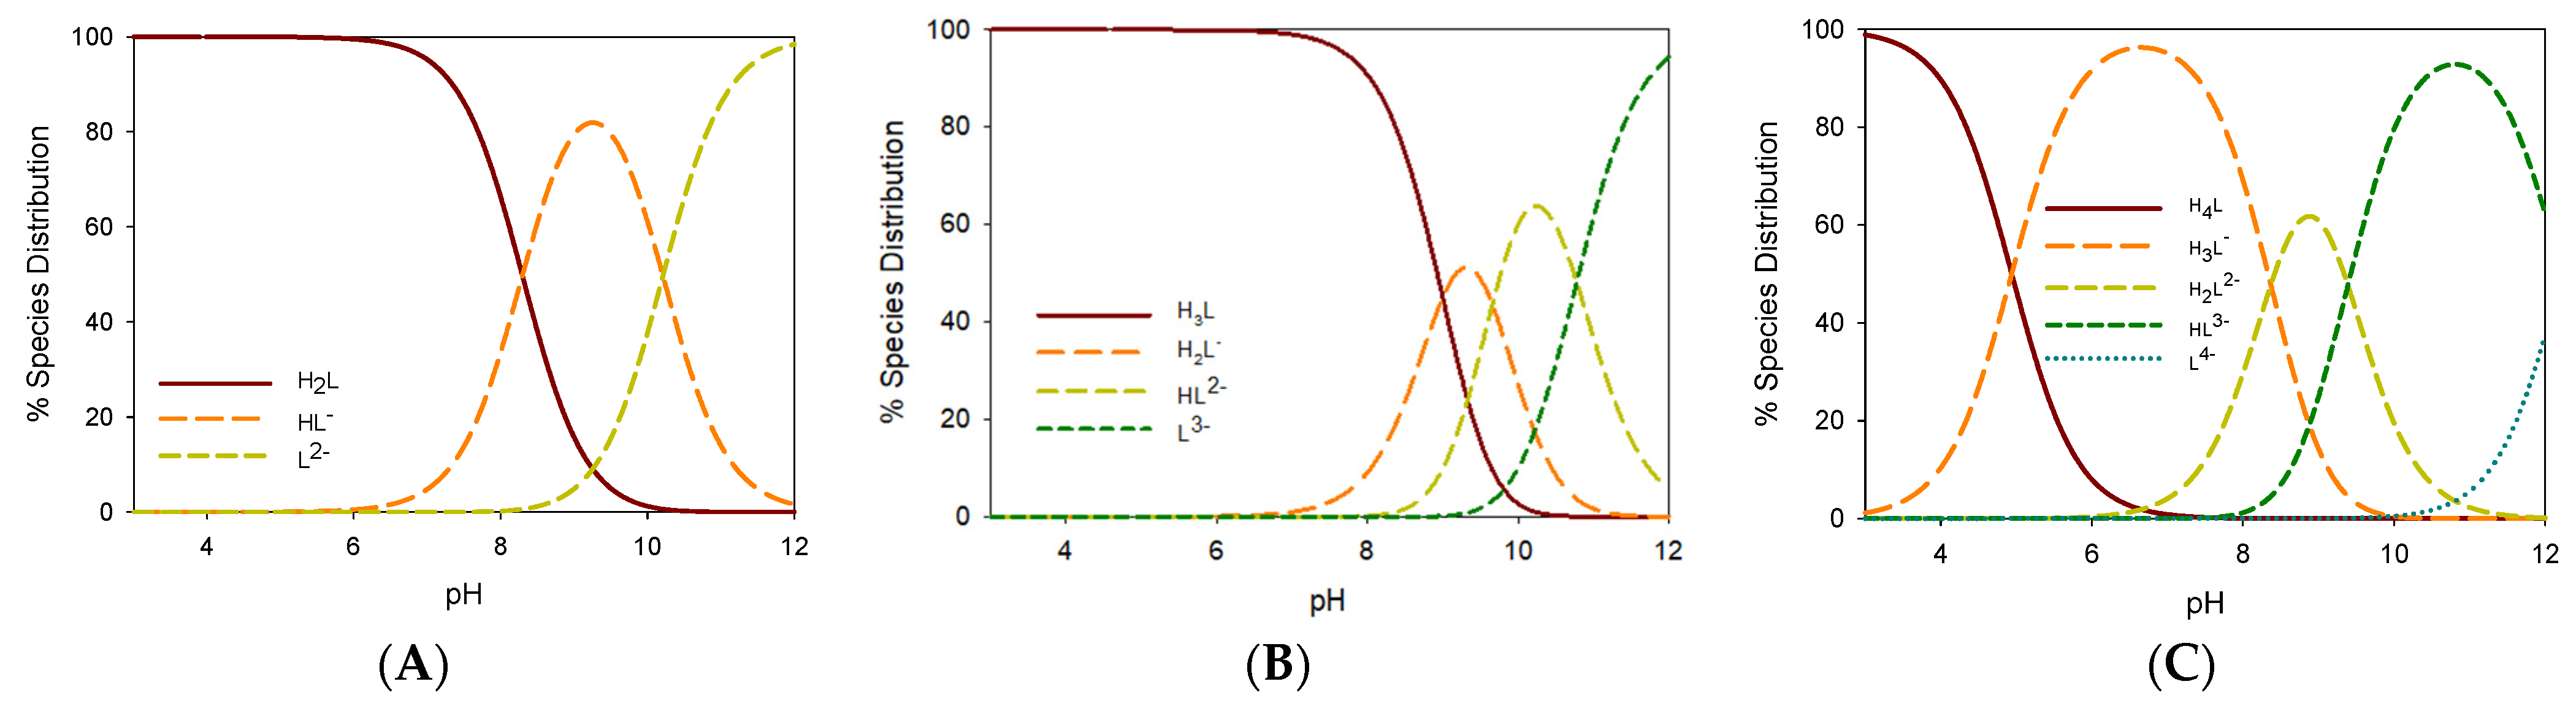
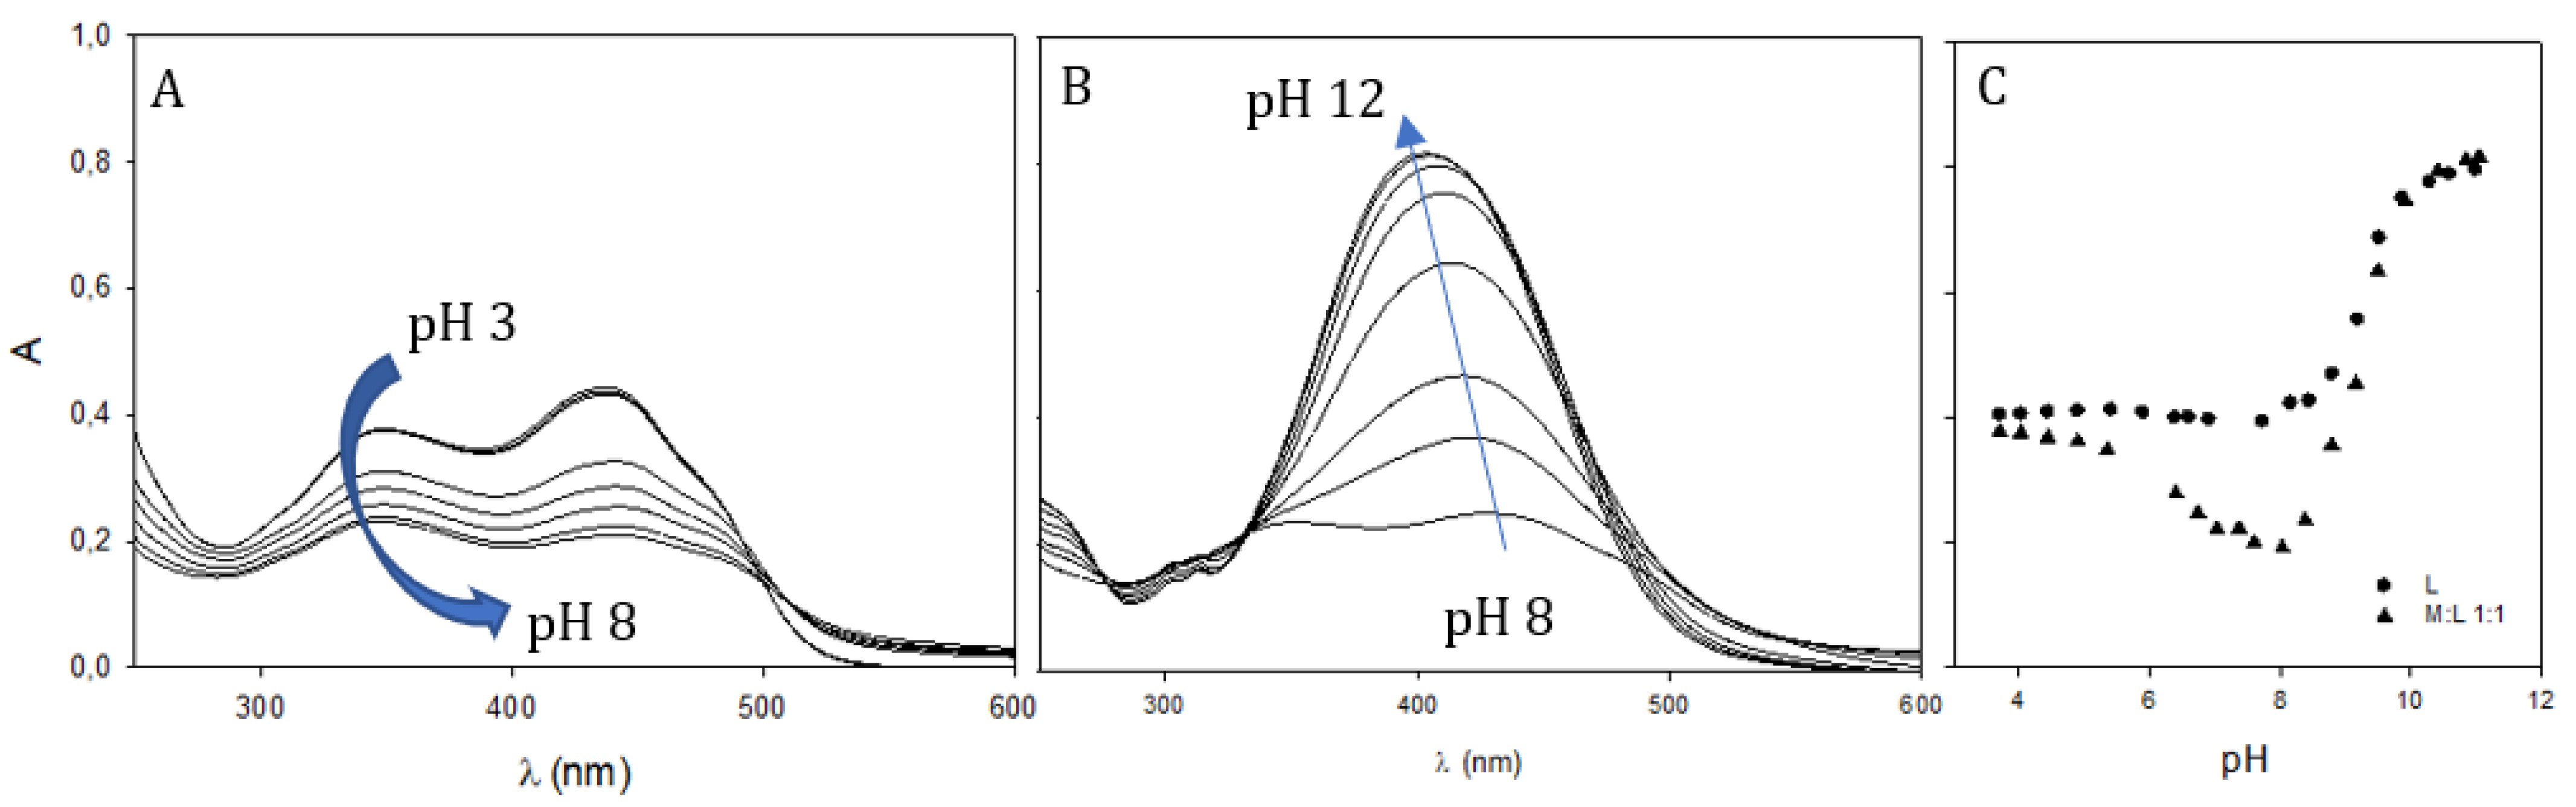
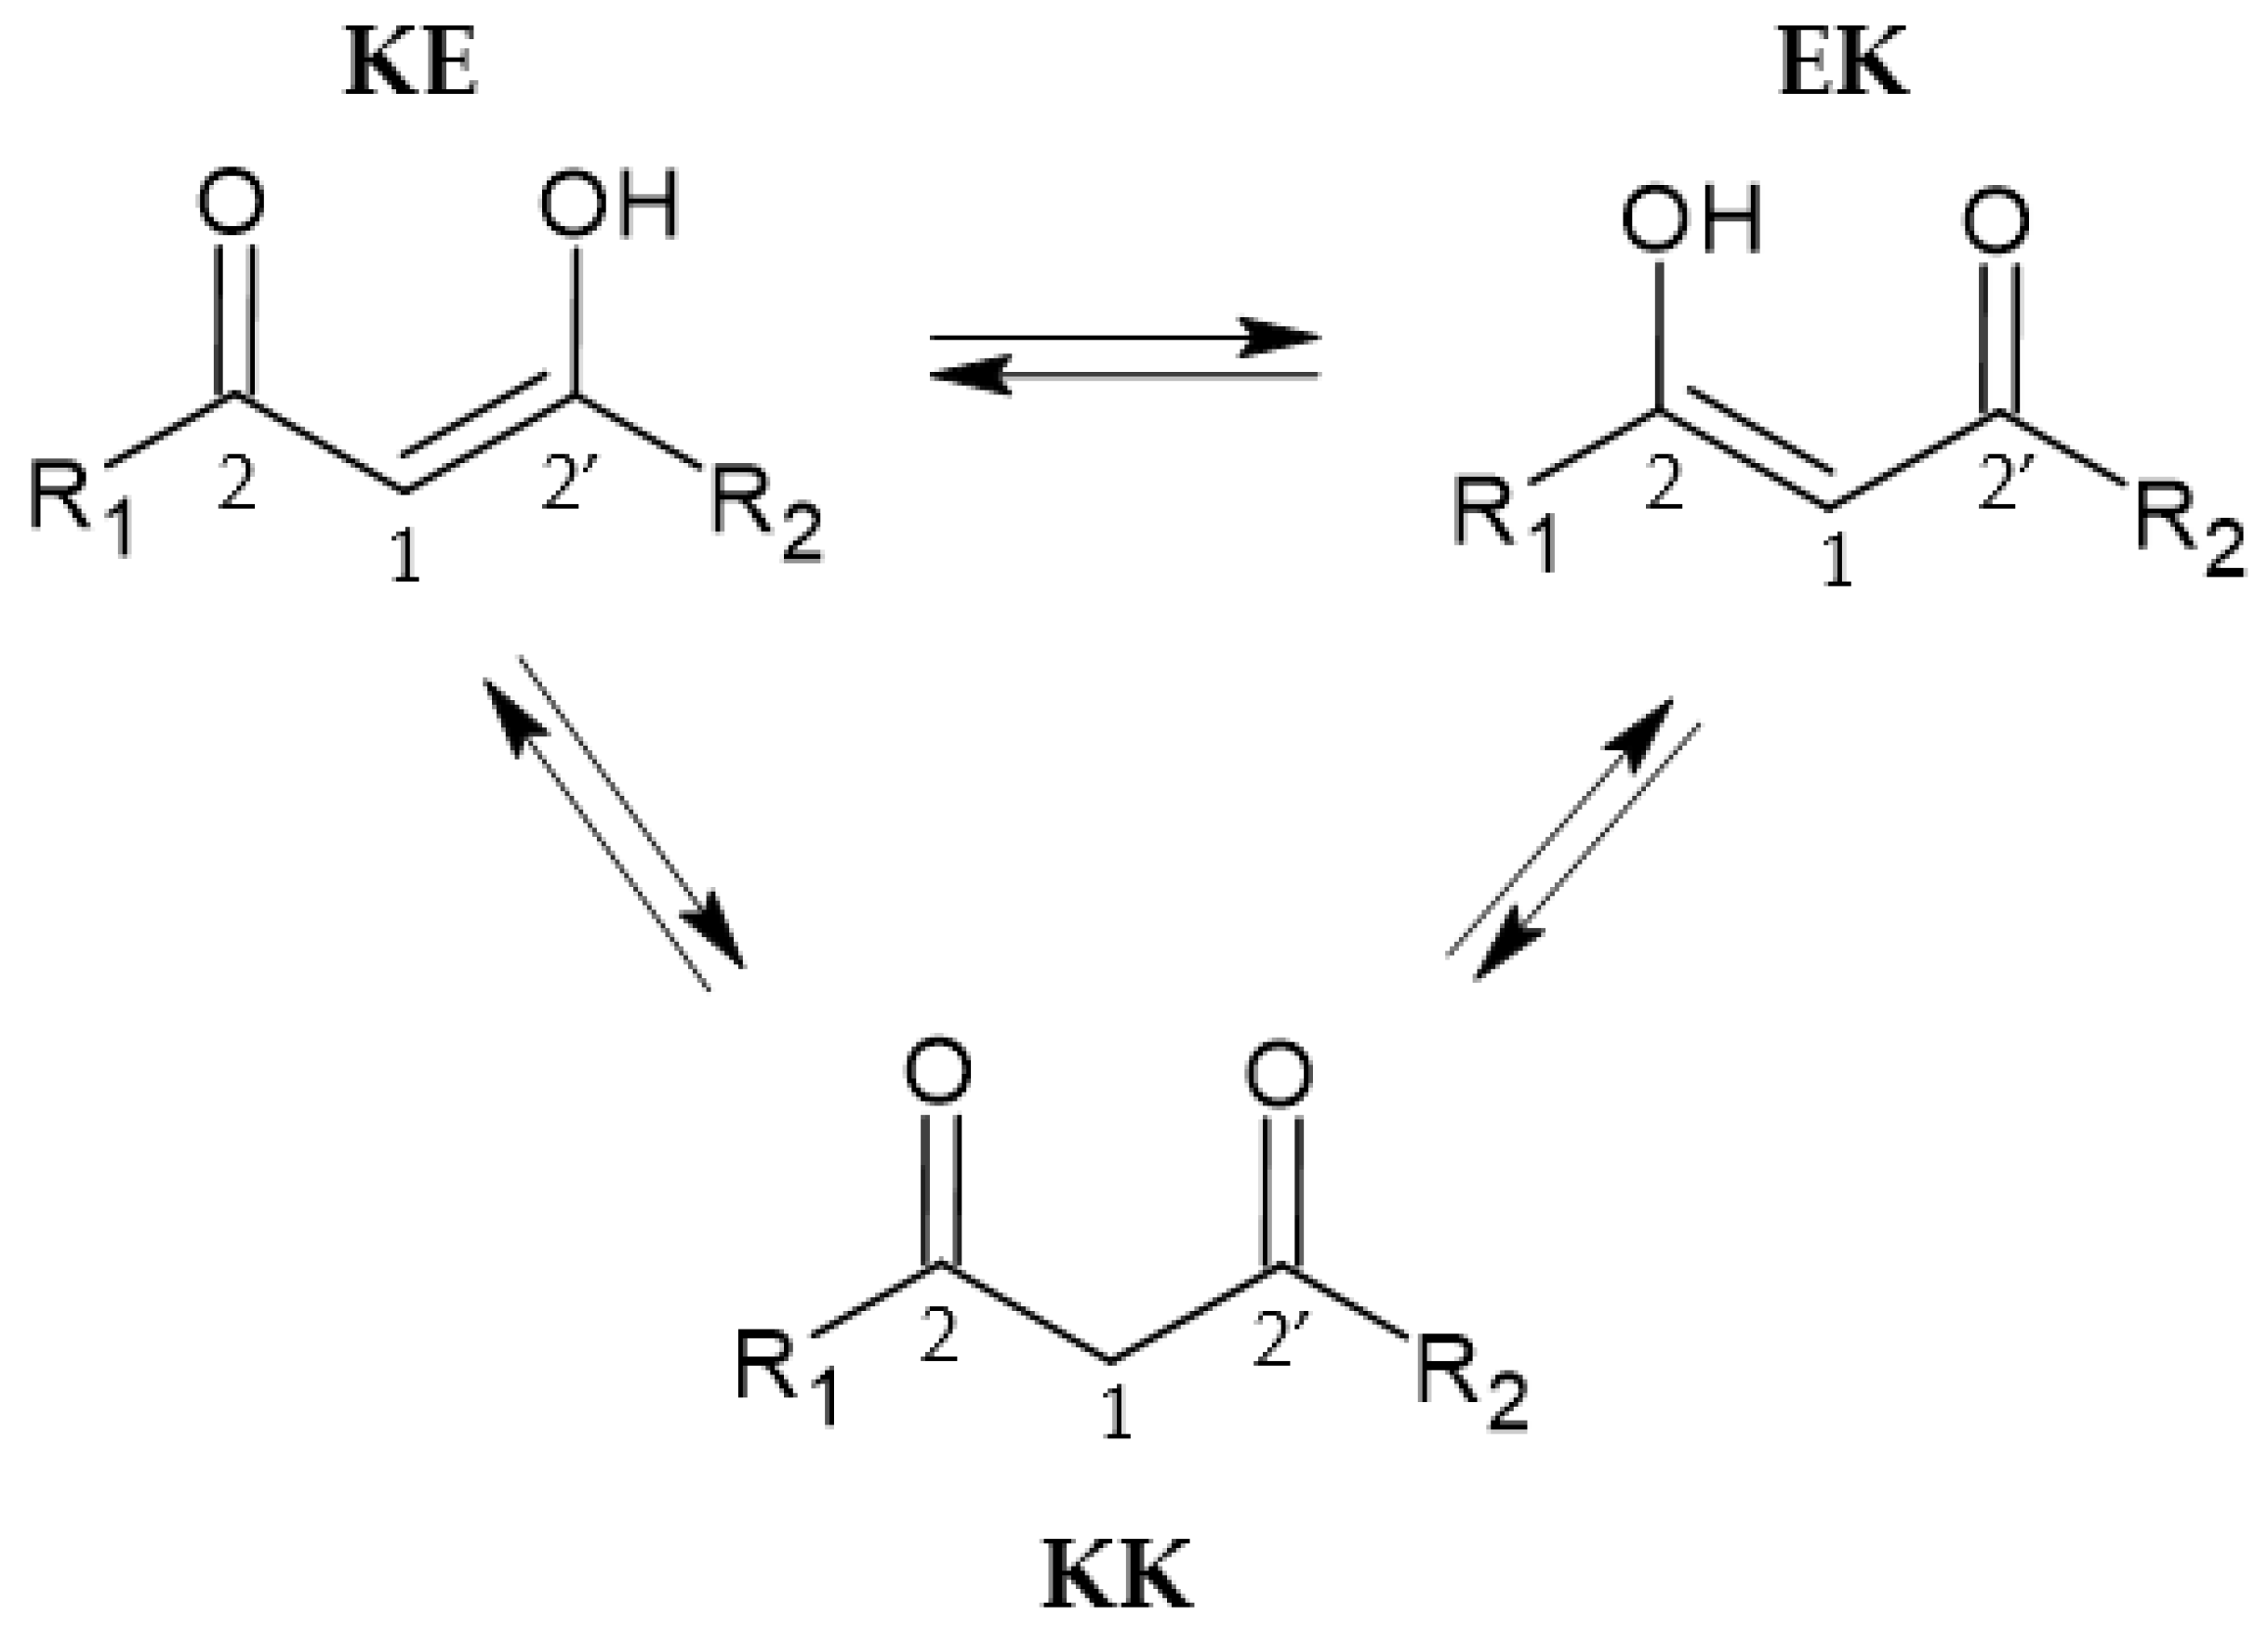
2.3. Tautomeric Equilibria in a Solution and Acid–Base Behavior of Ligands

Nuclear magnetic resonance provides valuable information on keto–enol tautomerism, although the main issue of this technique is the required concentration that should be around the mM range to gain quantitative data. All the investigated curcuminoids showed poor water solubility; hence, NMR analysis was performed in MeOD-d4 or DMSO-d6 solutions.
Bearing in mind the chemical structure of curcuminoids, two keto–enol forms (KE and EK) are in equilibrium with each other and with the diketo form (KK), as reported in Figure 3. Although the equilibrium between the two keto–enol forms (KE and EK) is too fast to be detected by NMR, in symmetrical structures (R1 = R2), such as curcumin, the two forms KE and EK are equivalent, and it is not possible to distinguish one from the other. In fact, the populations of the two tautomers (KE and EK) are equal, so the 13C chemical shift of C-2/C-2′ (~180 ppm) is an average of the carbonyl (~190 ppm) and enol (~170 ppm) carbons. For asymmetrical derivatives (R1 ≠ R2, R2 = CH3, i.e., compounds 1 and 2, Figure 1), the KE and EK forms are not equally populated and the equilibrium shifts strongly in favor of the EK form. 13C chemical shits of carbon 2 and 2′ are still an average of the chemical shifts of the two forms (KE and EK) in fast exchange with respect to the NMR timescale. However, in this situation, since the EK form is the prevailing species, the chemical shift of C-2 will be close to that of an enolic carbon while the chemical shift of C-2′ has a value typical of a carbonyl group. This hypothesis is verified by 1H,13C HMBC NMR experiments; in fact, the terminal methyl protons show long-range coupling with carbon C-2′ (~197 ppm) but not with C-2 (~178 ppm).
In a solution, with respect to the diketo moiety, the keto–enolic forms are usually stabilized by a strong intramolecular hydrogen bond (∆E, ~4 kcal/mol), this energy barrier diminishes as long as the s-trans diketo form interacts with a protic environment as an H-bond acceptor. In MeOD-d4 and DMSO-d6, the predominant form for CUR is the keto–enol one [30]; differently, all the new derivatives in methanol show the presence of both the KE and KK forms, with a high prevalence of the KE form according to the degree of π-conjugation and the bulkiness of the substituent in the middle of the keto–enol group, as summarized in Table 1. The addition of a bulky substituent within the keto–enol moiety accounts for an increase in the KK species, especially for compounds 6 and 7 that are mainly in the KK form.
The most informative NMR signal to investigate the keto–enol tautomerism should be the enol vinyl one, as reported in Figure 4 for compound 1. However, for highly conjugated structures such as curcuminoids, this proton undergoes fast exchange with deuterium of MeOD-d4; as a consequence, a disappearance of the enol vinyl proton is observed after little time from the sample preparation. It is possible to detect the presence of the tautomers through the protons on the double bond that are strongly affected by the tautomeric equilibrium. The integrated areas of this spin system were used to estimate the relative percentage of the tautomeric forms as reported in Table 1 and described in Experimental Section 3.5.
For asymmetrical curcumin derivatives, in addition to the enol equilibria, it is also possible to observe in a solution the equilibrium between two structural isomers with respect to the double bond: E and Z isomers [31]. The energy gap between the E and Z forms is quite small (4/6 kcal/mol), and isomerization is possible. Although the E/Z equilibrium is shifted in favor of the E isomer, these two isomeric forms can easily be discriminated by 1H NMR on the basis of the scalar coupling constant 3JHH between the two vinyl protons: 16 Hz for the E isomer and 12 Hz for the Z one. Since the two structural isomers exchange slowly in comparison to the NMR timescale, it is possible to observe two separate species corresponding to the E and Z forms, not an average of the two.
UV–Vis spectroscopy can be particularly suitable to overcome NMR limitations caused by poor water solubility of CUR. In fact, curcuminoids, due to their extremely high molar extinction coefficient (ε0), can be analyzed in aqueous media (methanol <2%) despite their low solubility. CUR being a weak triprotic acid characterized by a keto–enol group, its spectroscopic properties are particularly dependent on the solvent and the pH conditions [32]. The enolic form is predominant in most of the solvents if CUR powder is dissolved in alcohol or DMSO before dilution in water. This species is the main one responsible for strong absorption with the maximum wavelength (λmax) ranging from 410 to 430 nm and weak absorption between 260 and 280 nm due to π→π* transitions [33]. Additionally, CUR presents a weaker transition n-π* (at ca. 375 nm) due to the KK form that increases when CUR is directly suspended in water. Keto–enol tautomerism is strongly affected by the presence of water molecules due to the different hydrogen bond interactions the keto and enol group can form as pointed out by Manolova et al. [8]. Compounds 1 and 2 show an intense absorption peak at 360 nm corresponding to the KE form; the blue shift compared to CUR is due to the reduced π-π conjugation. Derivatives 35 are characterized by a mixture of the KE (350–370 nm) and KK (420–450 nm) forms while 6 and 7 are mostly found in their KK form (330–350 nm) (Figure S1).
Spectrophotometric pH titrations were performed to evaluate the pH effect on the ligands for all the investigated compounds. According to the number of acid sites it is possible to group the ligands as HL (2), H2L (1), H3L (3,4,5) and H4L (6,7). As long as the pH is increased, a new absorption band is observed in the 450–500 nm range, as shown in Figure 5 for 7, due to the dissociated form.
Many equilibria occur as pointed out by the woven structure close to the isosbestic point, particularly dissociation reactions. Elaboration of the data allows estimating the overall protonation constants (logβMLH) and pKa values for all the compounds, as reported in Table 2.
Spectrophotometric titrations confirm, as recently suggested [29], that the phenol group in para position to the aliphatic chain is more acidic than the keto–enol moiety. Compound 2 is a monoprotic weak acid with a pKa value of 10.903; likewise, compound 1 shows a similar value for the second dissociation (pKa2) that can only be attributed to the keto–enol group. For all the compounds, the proton dissociation of the first phenol group responsible for the main UV–Vis absorption around 450 nm, occurs within the pKa range of 8.3–9.1. The pKa values for keto–enol group are all in the range of 9.4–10.9 (Table 2), consistently with the previously reported keto–enol derivatives [29,35]. The second phenol group dissociates at extremely high pH; in fact, pKa values range from 10.4 to 12.2. Compounds 6 and 7 have an additional acid group, the carboxylic one, that undergoes proton dissociation with a pKa value close to 5. The species distribution curves for 1, 4 and 7 are reported in Figure 6. All the compounds are mainly in their neutral form at physiological pH (7.4), except for 6 and 7 which are negatively charged as carboxylate anions.

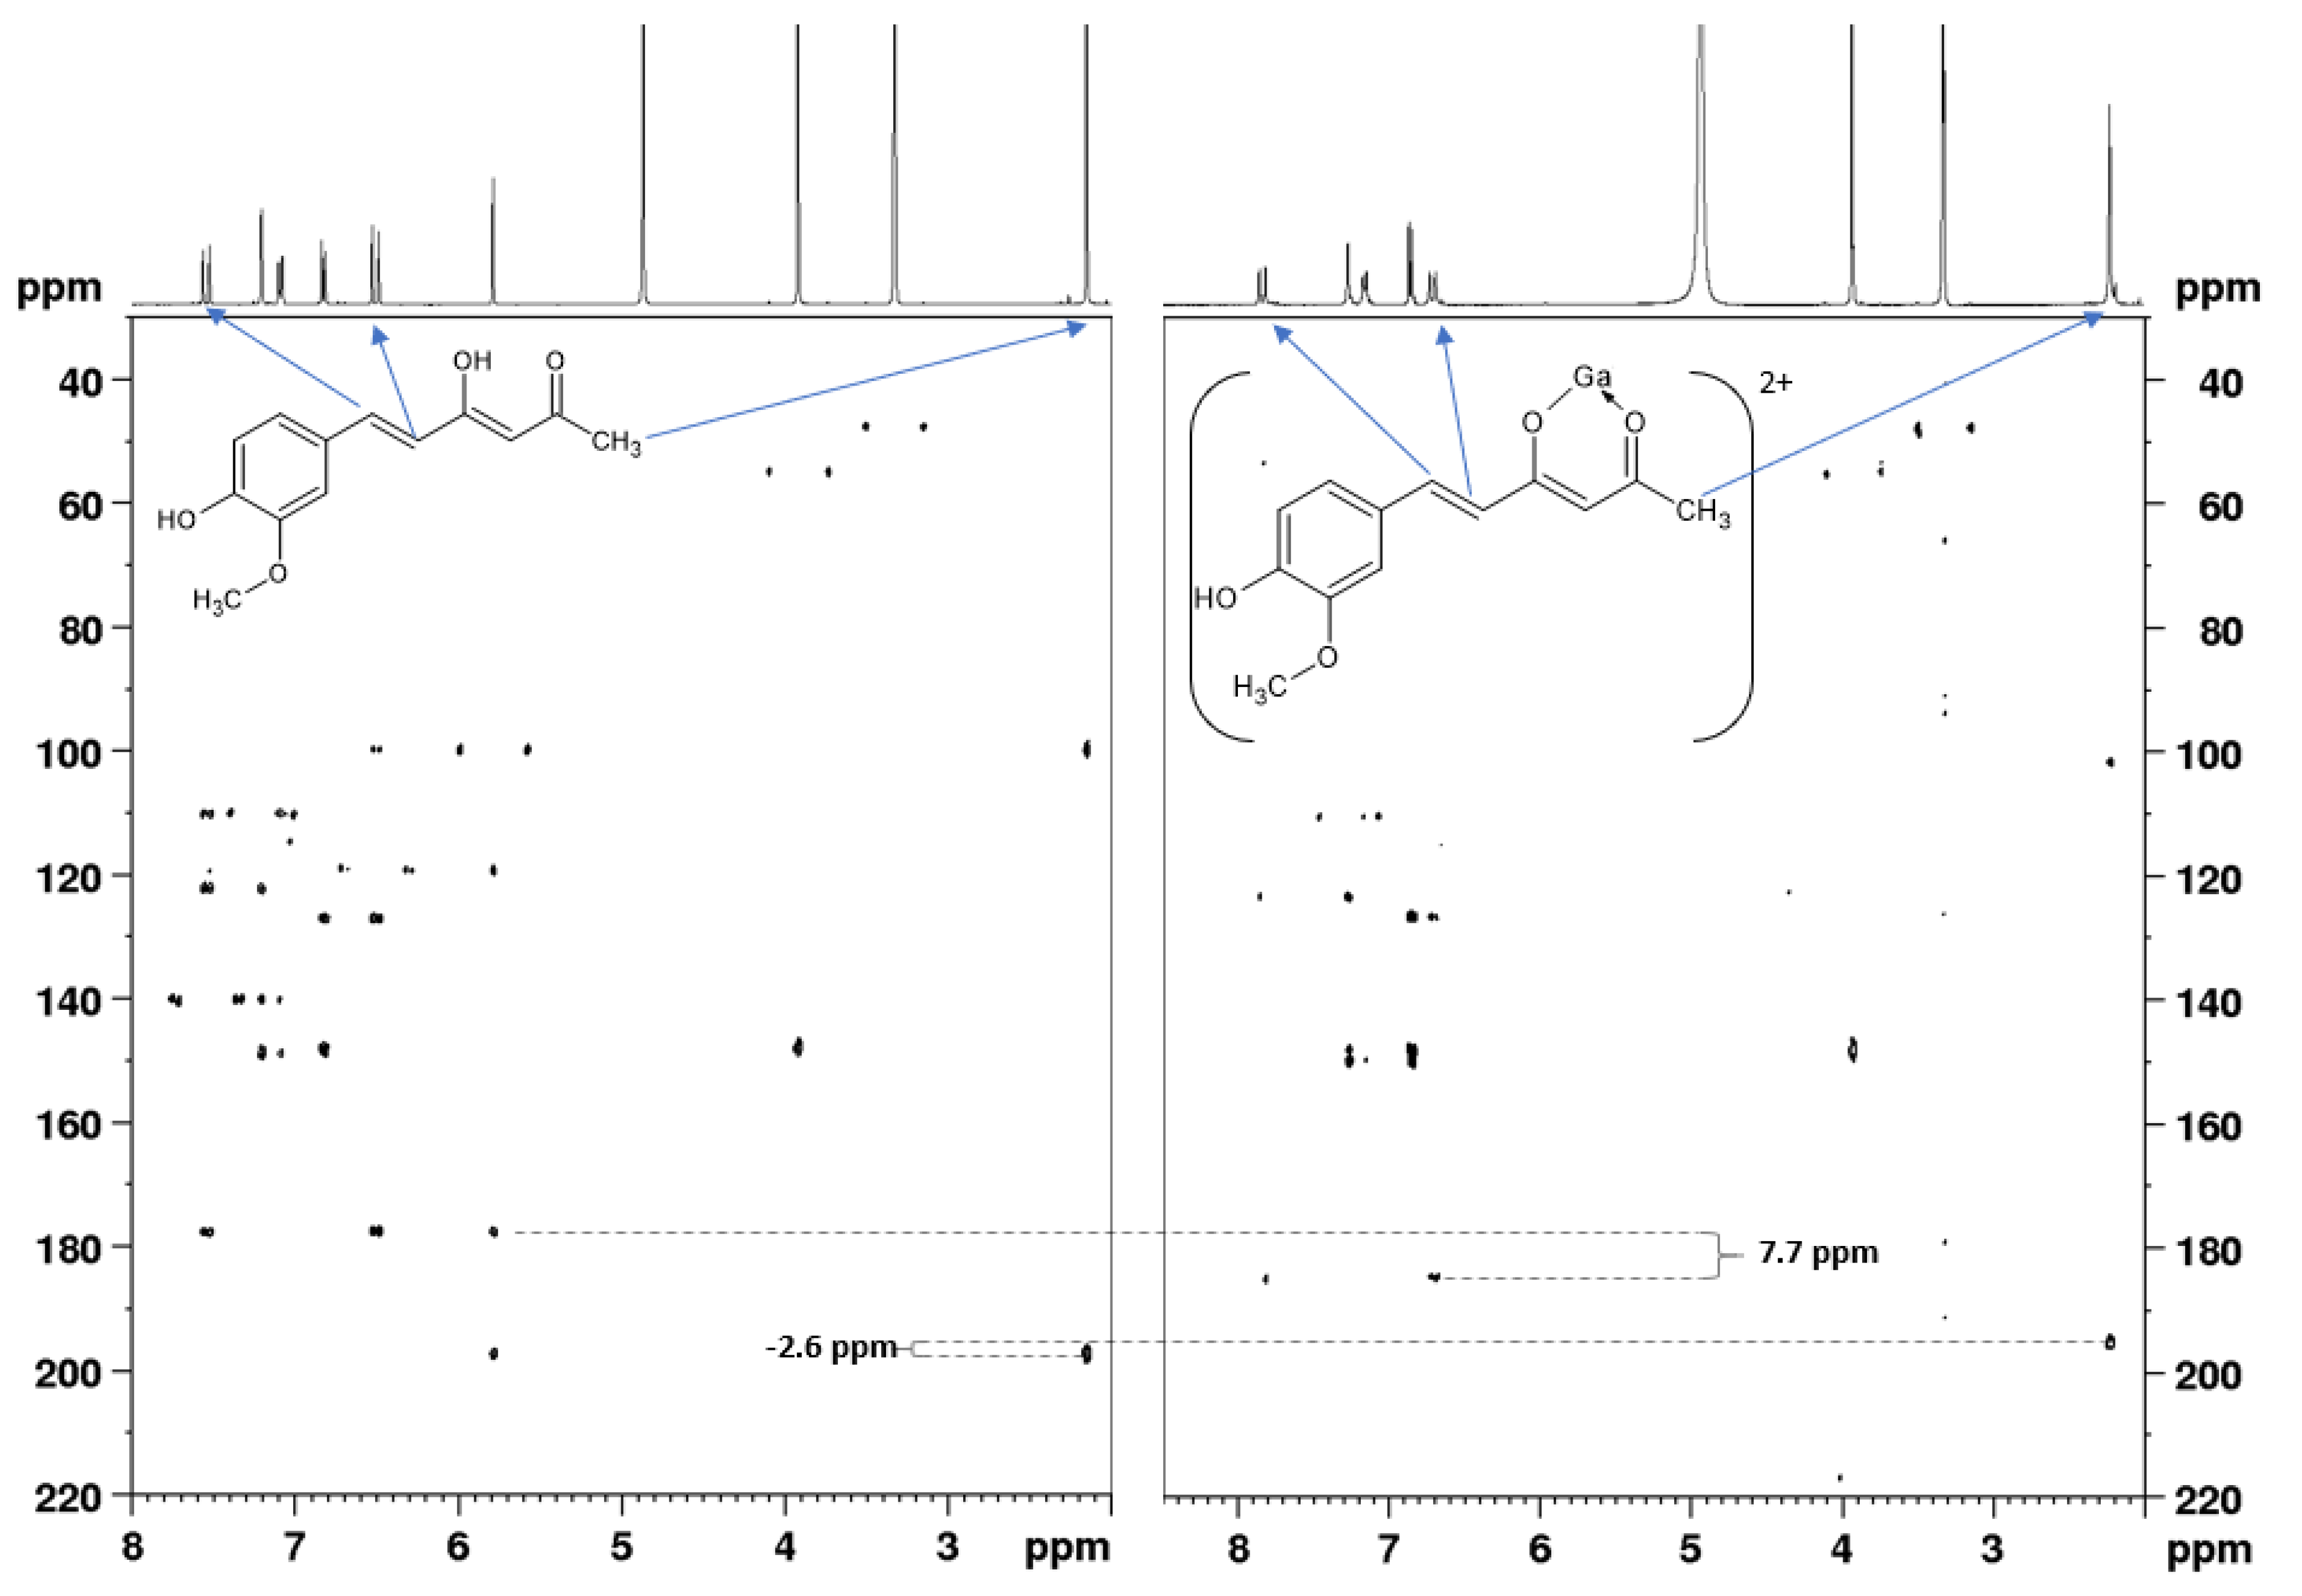
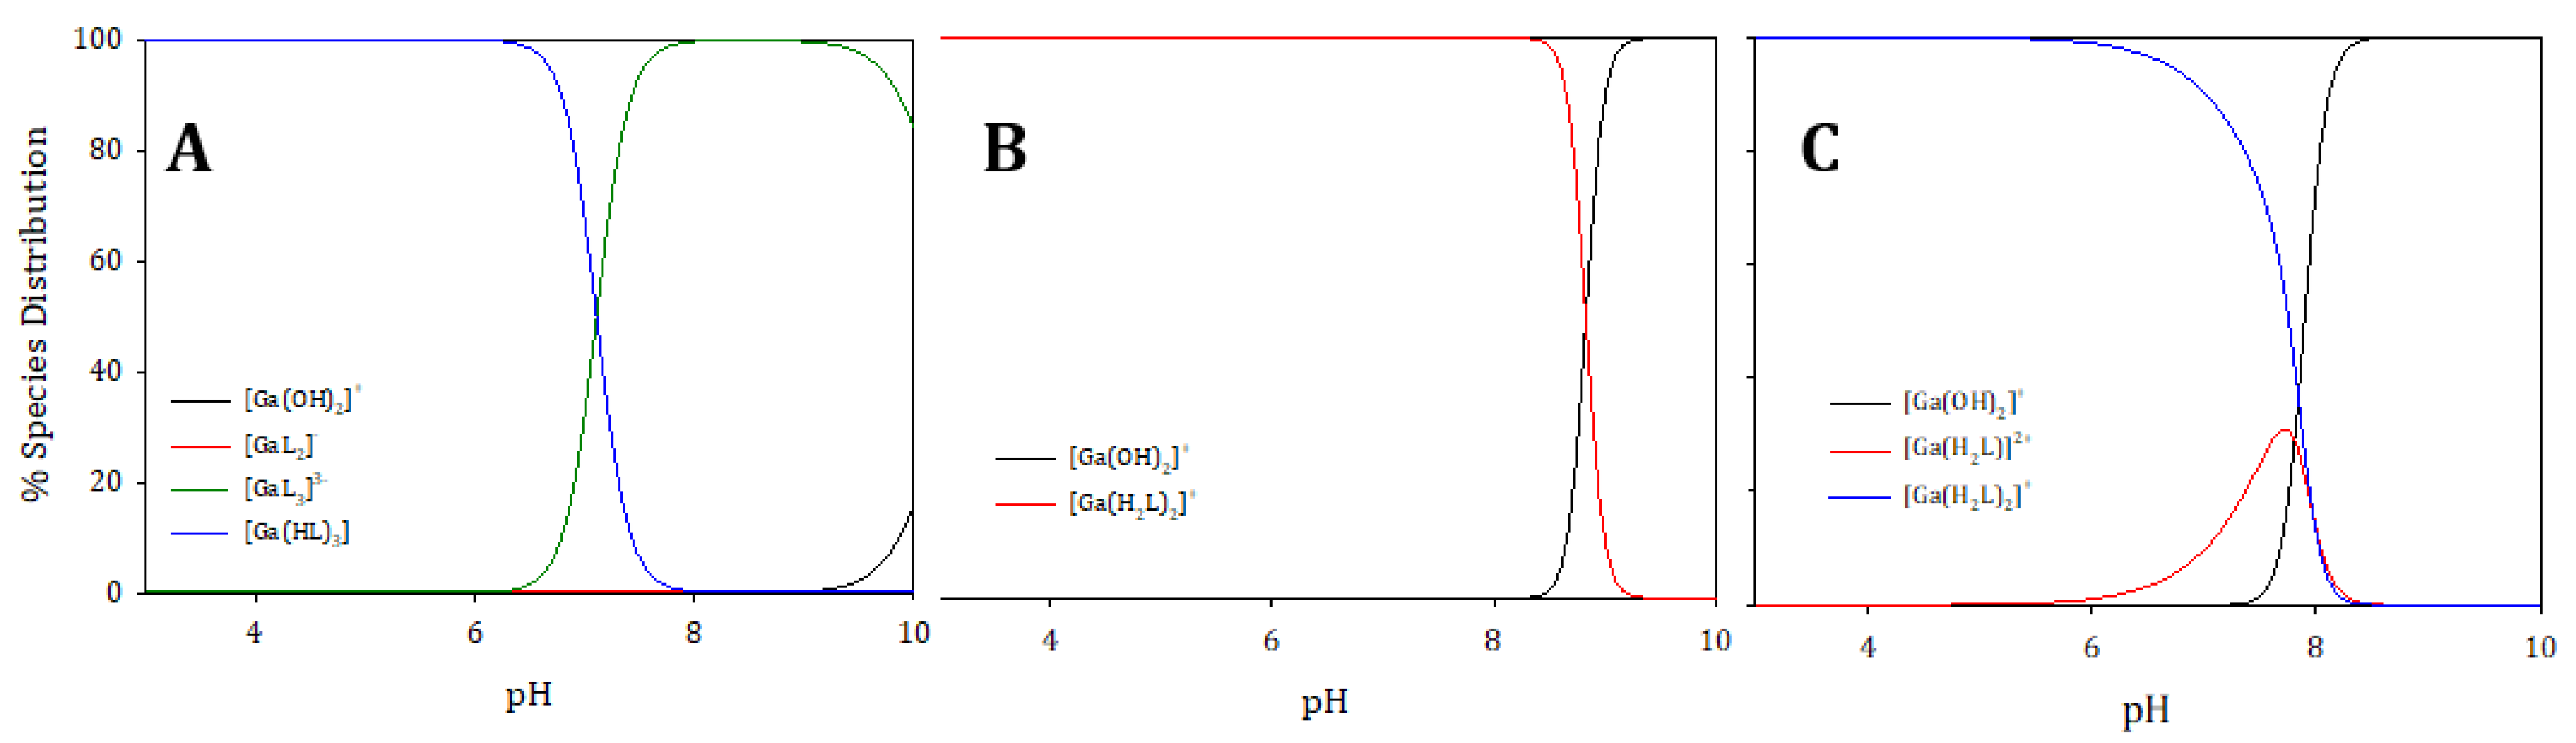
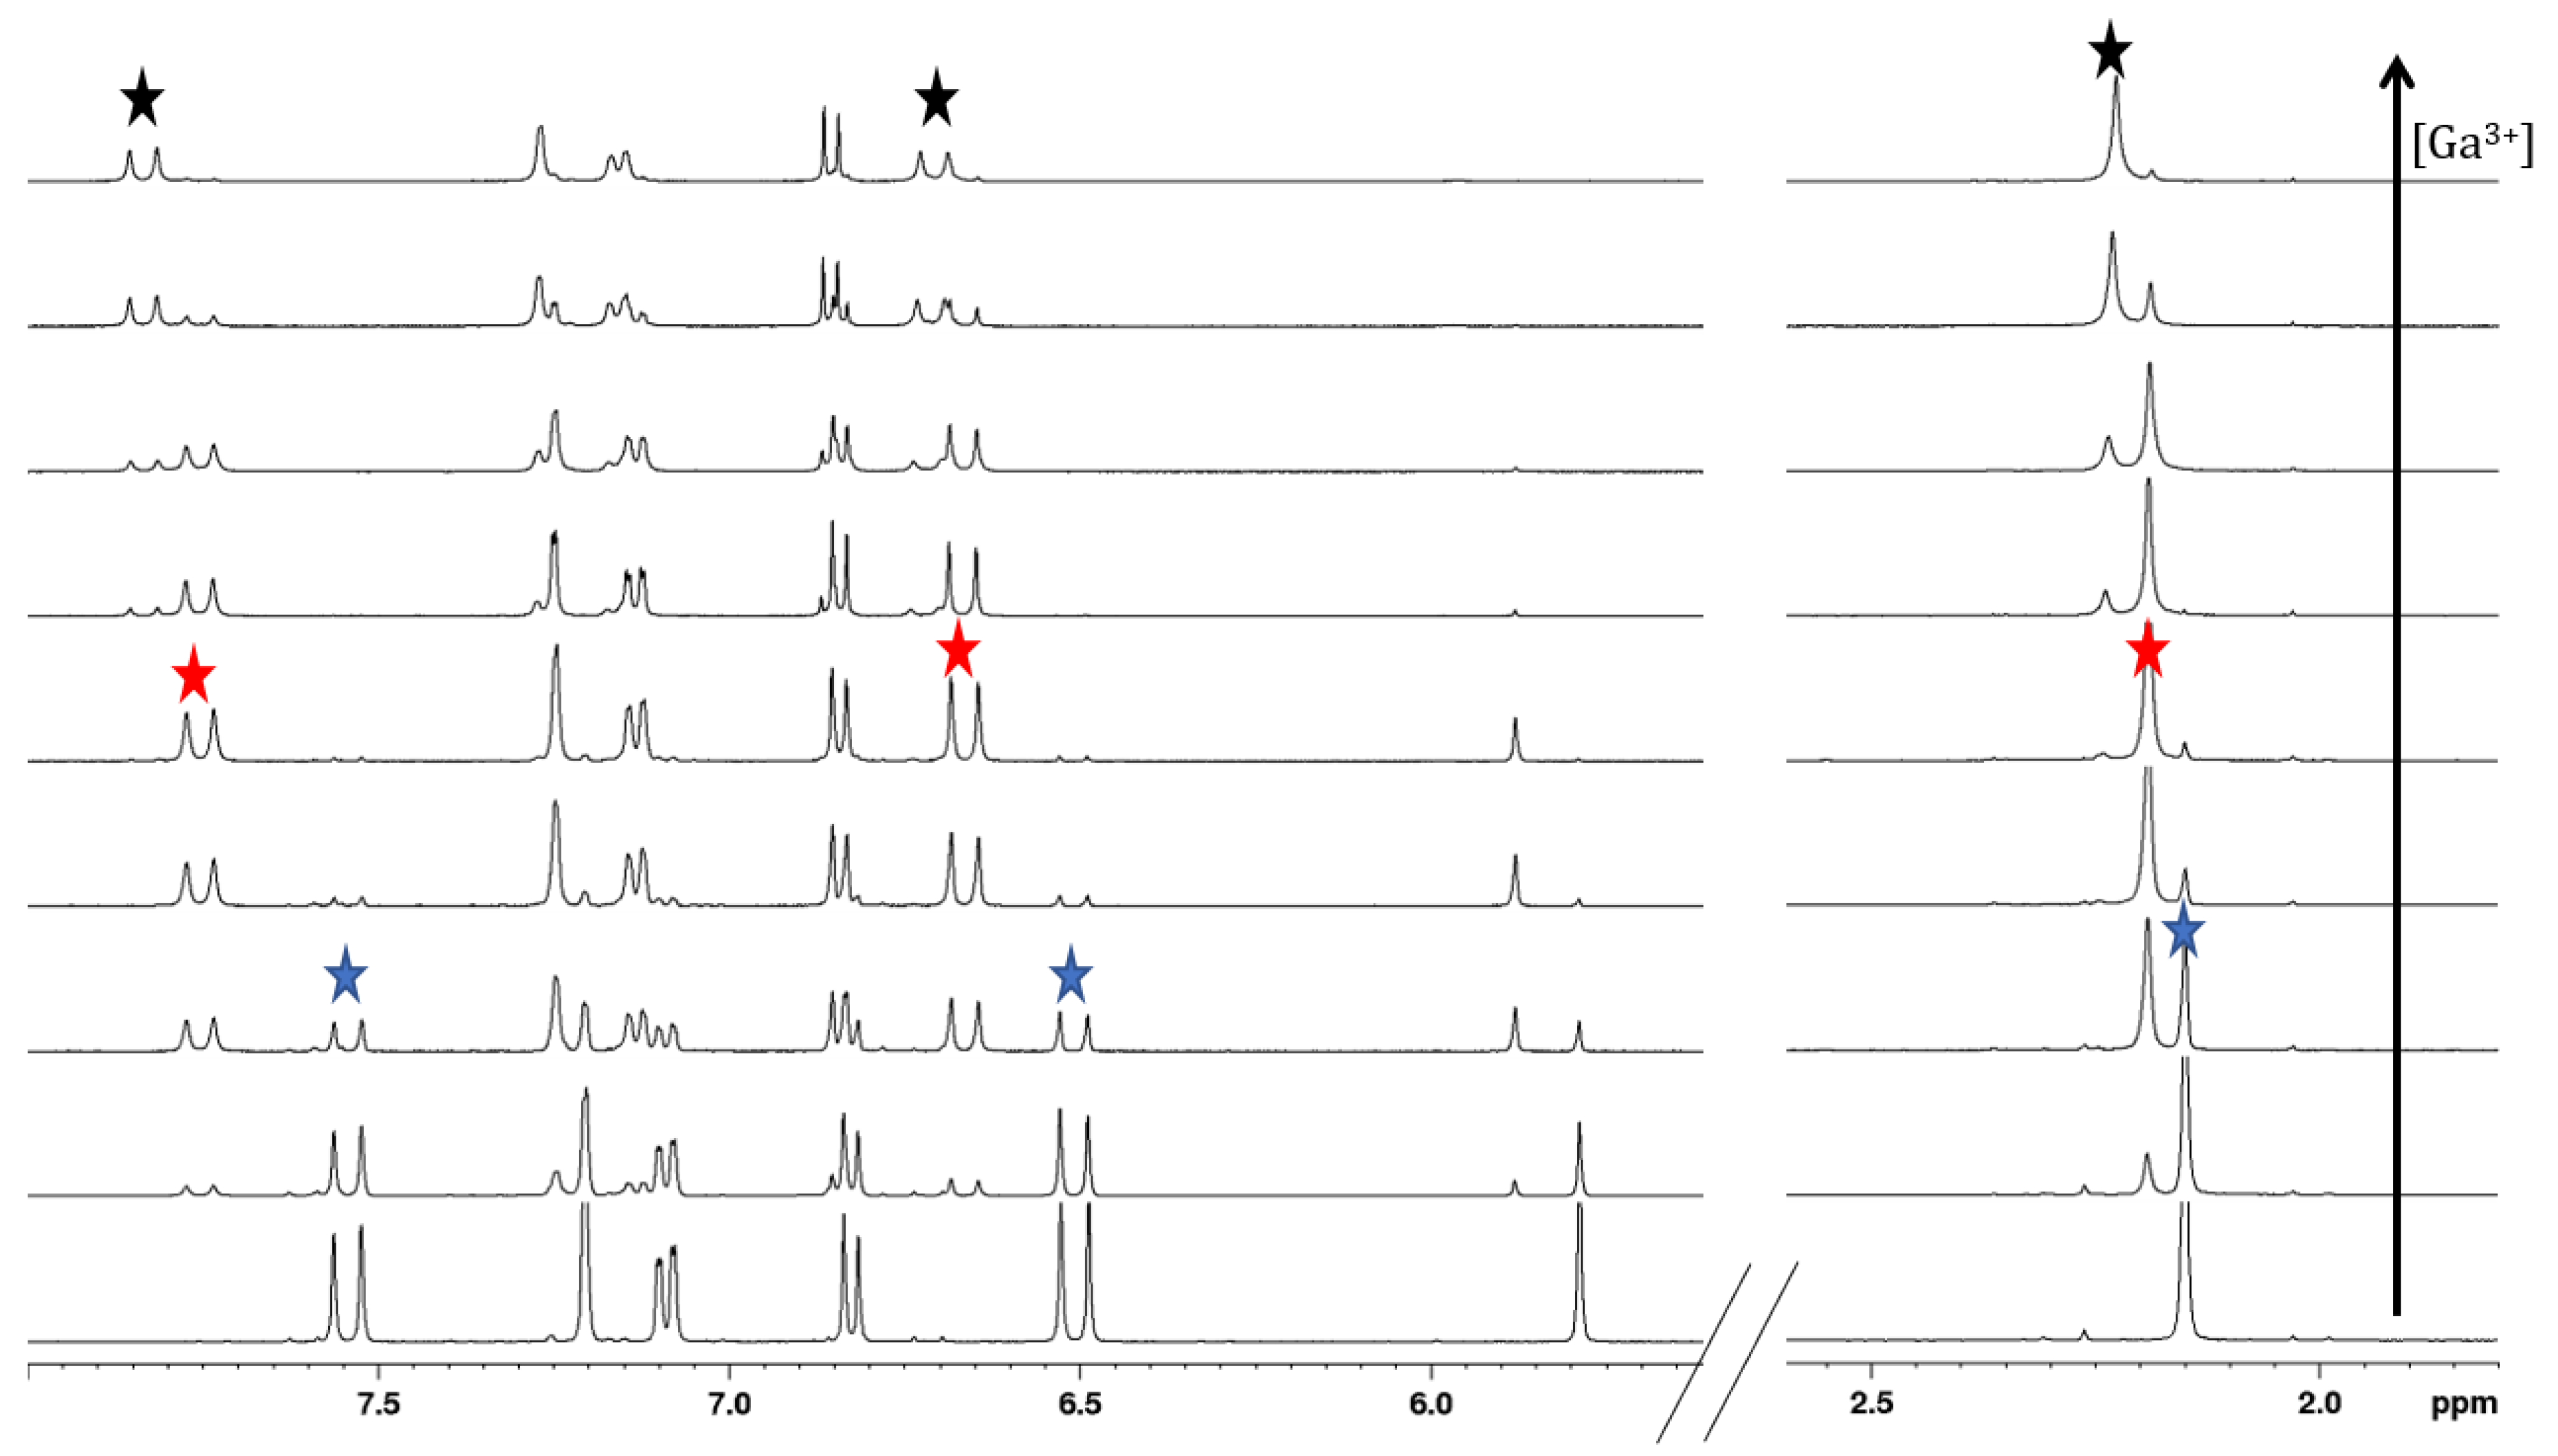
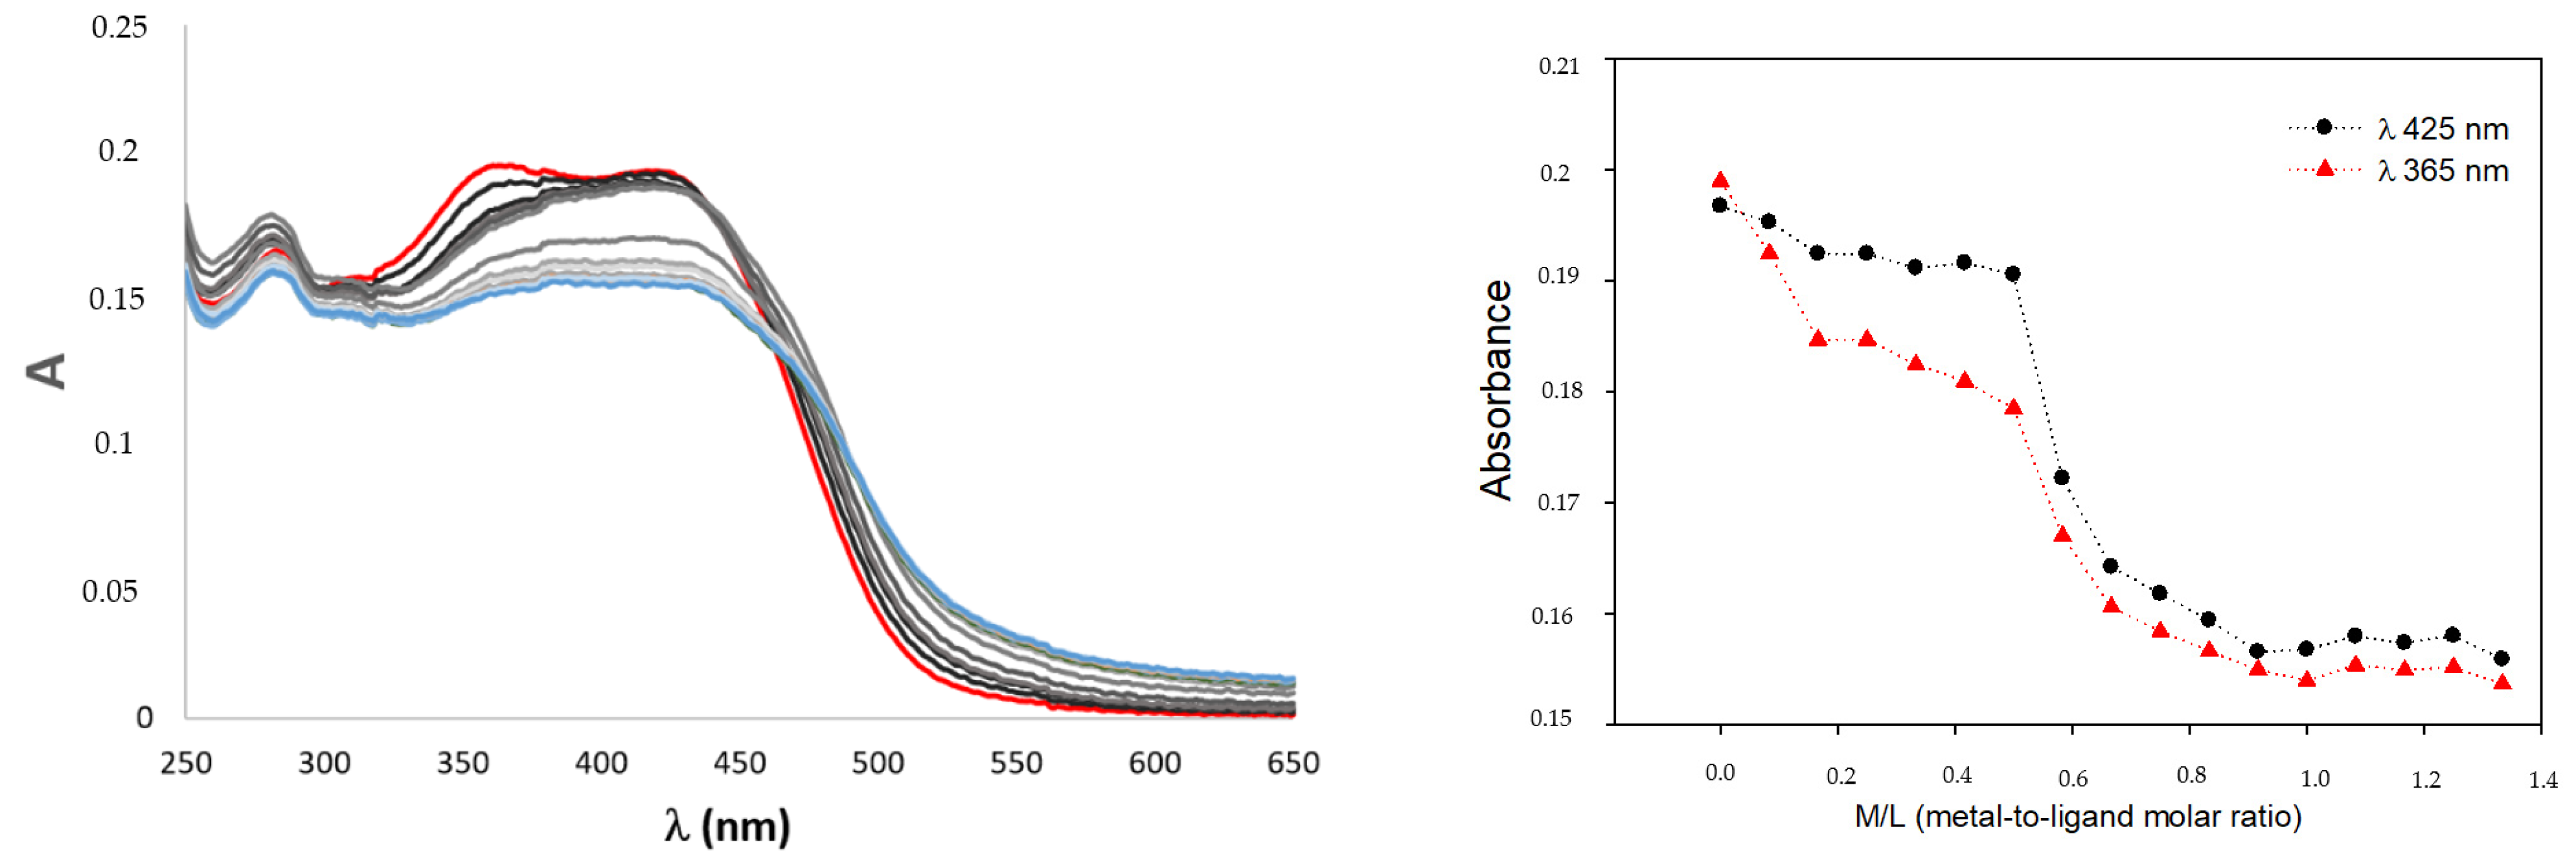
2.4. Gallium Complexing Ability

NMR can shed light on the metal–ligand interactions; particularly, these data allow not only defining the binding site and the metal-to-ligand molar ratio, but also investigating the actual equilibria in a solution, given that they are compatible with the NMR timescale. For all the free ligands, the enol proton of the keto–enol form was confirmed by the presence of a broad signal at 15–17 ppm (DMSO-d6/MeOD-d4) that disappears when the metal ion (Ga3+) is added to the solution. Apparently, this could be a proof of the proton dissociation of the ligand; indeed, the enol proton is extremely mobile and exchanges with the deuterated solvent after little time from sample preparation even in the absence of the metal ion. Hence, these data cannot be used as a solid proof of proton dissociation. Indeed, NMR titrations with Ga3+ quite clearly support the removal of the proton in favor of a trivalent metal ion; in fact, a downfield shift is observed for the protons close to the keto–enol moiety. However, for all the examined curcuminoids, the addition of Ga3+ at acidic pH (~5) instantly turns into the formation of a new set of downfield-shifted signals in a slow chemical exchange with respect to the NMR timescale. The high affinity of the keto–enol moiety for hard Lewis acid gallium(III) triggers an anticipated proton dissociation that enables the formation of an M:L 1:2 complex of the KE tautomer, the only one capable of binding the metal ion, as confirmed by the downfield shift of both allyl protons (H-3 and H-4, Figure 2) and 13C chemical shifts of the keto–enol group. The keto–enol group is an O,O bidentate chelator that allows the formation of a highly stable six-membered ring with the metal ion. The reaction is fast, and the formation of the metal complex is observed immediately after the addition of the metal ion. As long as the KE form reacts with the metal, the tautomeric equilibrium is shifted towards the depletion of the KK form in favor of the KE one. The complete disappearance of KK is observed within 24 h for all the ligands. An increase in Ga3+ concentration till the 1:1 M:L molar ratio allows the formation of a complex species with metal-to-ligand molar ratio 1:1 as suggested by new downfield-shifted signals and the concurrent disappearance of the 1:2 M:L complex. Figure 7 reports the titration with Ga3+ in MeOD-d4 for compound 1 (compound 7 is reported in Figure S2).
The downfield shifts for protons H-3 and H-4 in the M:L 1:1 complex range between 0.15 and 0.3 ppm (90–180 Hz at 600 MHz) for all ligands, C-3 and C-4 are downfield-shifted (around 3–4 ppm). The shift observed for C-2 is close to 1 ppm for all the compounds except for 1 and 2. In these compounds, carbons C-2 and C-2′ are not chemical shift-equivalent since only one of the two keto–enol forms is observed in the solution, the EK form, in which the keto group is in the α position to the methyl one, as confirmed by 1H,13C HMBC spectra (Figure 8—left). The EK tautomer is favored by higher π–π conjugation that is gained when the enol group is directly attached to the vinyl chain. When Ga3+ is bound to the keto–enol group (Figure 8—right), C-2 is upfield-shifted by the exchange of the proton with the metal ion, ∆δ(13C) = 6.9 ppm from 177.8 to 184.7 ppm and ∆δ(13C) = 7.7 from 177.0 to 184.7 ppm for compounds 1 and 2, respectively. C-2′ is less affected by the insertion of the metal ion, and it results in downfield shifting, ∆δ(13C) = −2.6 ppm from 197.9 to 195.3 ppm and ∆δ(13C) = −2.1 ppm from 197.9 to 195.8 ppm for 1 and 2, respectively.
Finally, NMR data suggest that the carboxylic group of 6 and 7 is probably not involved in metal coordination; in fact, we observed a higher downfield shift for the proton closer to the KE group (H-11) than the farther one (H-12), ∆δ(1H) = 24 Hz and 50 Hz vs. 11 Hz and 38 Hz for M:L 1:2 and M:L 1:1, respectively (Figure S2). The weak interaction of the carboxylic group with the metal ion could be explained by the absence of a beneficial chelate effect connected to the long length of the aliphatic chain itself.
As reported above, curcuminoids have characteristic UV–Vis absorption spectra; hence, formation of metal complexes can be investigated using this technique. When Ga3+ is added to the ligand aqueous solution under acidic conditions (pH ~5), the absorbance decreases and a red shift of the KE maximum is observed, suggesting the formation of the metal complex (Figure 9). By plotting the absorbance vs. the metal-to-ligand molar ratio, the formation of M:L 1:2 and 1:1 complexes can be suggested, confirming the outcomes of NMR titrations. The so-formed metal complexes are extremely stable (residual compound’s percentage (8 h) >90% for all the ligands), suggesting that fixing the keto–enol moiety into the KE form in the formation of coordination bonds highly enhances the kinetic stability of the ligand itself.
In order to assess the metal-to-ligand molar ratio, LC/MS experiments were carried out supporting the formation of M:L 1:2 complexes for compounds 15 and of M:L 1:1 species for compounds 6 and 7 (Table S1).
A complete investigation of the thermodynamic stability of metal complexes in an aqueous medium was then carried out through pH-metric UV–Vis titrations.
The increase in pH in M:L 1:1 systems causes an initial decrease in the intensity of the maximum band, followed by the appearance of a new intense absorption of deprotonated systems around 420–430 nm (Figure S3). The presence of the metal ion in the solution anticipates the dissociation of the keto–enol group of 3–4 pKa units, as suggested by the plot of absorbance at λmax vs. pH for compound 6 as an example (Figure 10). On increasing pH starting from extremely acidic conditions (pH 3), a decrease in absorbance at 405 nm is observed until pH reaches a value around 8 (Figure 10A). In this pH interval, the spectral profile remains unchanged, with the coexistence of both KE and KK forms suggesting that the conversion of the KK form into the KE form, due to metal chelation, is slow and probably hampered by the formation of a strong network of hydrogen bonds between keto groups and water molecules. When pH is raised above 8 (Figure 10B), the absorbance band of dissociated phenol appears at 420 nm and increases in intensity until pH 12. It is possible to observe a slight blue shift of λmax within this pH range.
The stability constants of the complexes were calculated taking into account the possible complexes at the M:L 1:1, 1:2 and 1:3 molar ratios, but only for compounds 1 and 2 the refinements converged completely. For bulky ligands (3,4,5,6,7), it was necessary to exclude M:L 1:3 to reach convergence due to their steric hindrance that prevents the rearrangement of three ligands in the octahedral coordination sphere of Ga3+.
To compare ligands with different proticity, logK11, logK12 and logK13 were calculated according to the equations reported in the caption of Table 3.
The species distribution curves for 1, 4 and 7 are reported in Figure 11.
Compounds 15 have similar logK values, while ligands 6 and 7, probably due to their steric hindrance, are unable to form metal complexes with a smaller M:L molar ratio and show lower K values. This decreased affinity for the metal ion is highlighted by the species distribution curves (Figure 11C); indeed, formation of Ga(III) hydroxide species is observed slightly above the physiological pH (>7.5).
To consistently compare the chelating abilities for Ga(III), pGa values (Table 3) were calculated as −log[Ga3+]free. The use of pM dates back to the paper of Harris et al. [37], in which it was used for the first time to express and relate the iron(III)-sequestering ability of siderophores. Among the investigated chelators, only the phthalimide derivatives (3, 4 and 5) showed interesting pGa values, quite close to those of renowned gallium chelators such as DFOB (pGa = 21.6) [38] or the recently developed PrP9, a triazacyclononane-based phosphinate ligand (pGa = 23.1) [39], and the hydroxamate chelators lately reported by Toporivska et al. [40] (pGa 21.9 (min)–25.4 (max)). The difference of two orders of magnitude between compounds 3/4 and 5 reflects the steric hindrance provided by the phthalimide group. In fact, when this bulky moiety is separated from the keto–enol moiety by a longer spacer (butyl vs. propyl chain), metal chelation is more effective and logK12 is greatly increased (16.1 vs. 14.05/14.45), suggesting the formation of a more stable M:L 1:2 complex species.
Finally, the kinetic stability of metal complexes at the M:L 1:1 molar ratio were investigated by UV–Vis spectroscopy in physiological conditions (PBS pH 7.4). Formation of coordination bonds to the metal strongly stabilizes the ligand, and for all the metal complexes, the percentage of the residual compound was greater than 85% within 8 h (data not shown).

2.5. Transmetalation Reactions of Selected Curcumin Derivatives 4 and 5

Compounds 4 and 5 were selected to evaluate iron-chelating ability by spectrophotometric analysis in the same conditions as the ones applied to carry out investigations on Ga3+ systems. The calculated logβ124(Fe) values were 56.2 (2) and 58.6 (4) for 4 and 5, respectively. From the difference between the logβ values of the complexes with two metal ions, it is possible to calculate the apparent stability constant K (logK = logβ124(Fe) − logβ124(Ga)) associated with the transmetalation reaction (Equation (1)).
Fe 3 + + [ Ga ( H 2 L ) 2 ] +     Ca 3 + + [ Fe ( H 2 L ) 2 ] +
LogK values are small for 4 and 5 (0.9(3) and 1.2(7), respectively), confirming a similar sequestering ability towards Ga3+ and Fe3+.

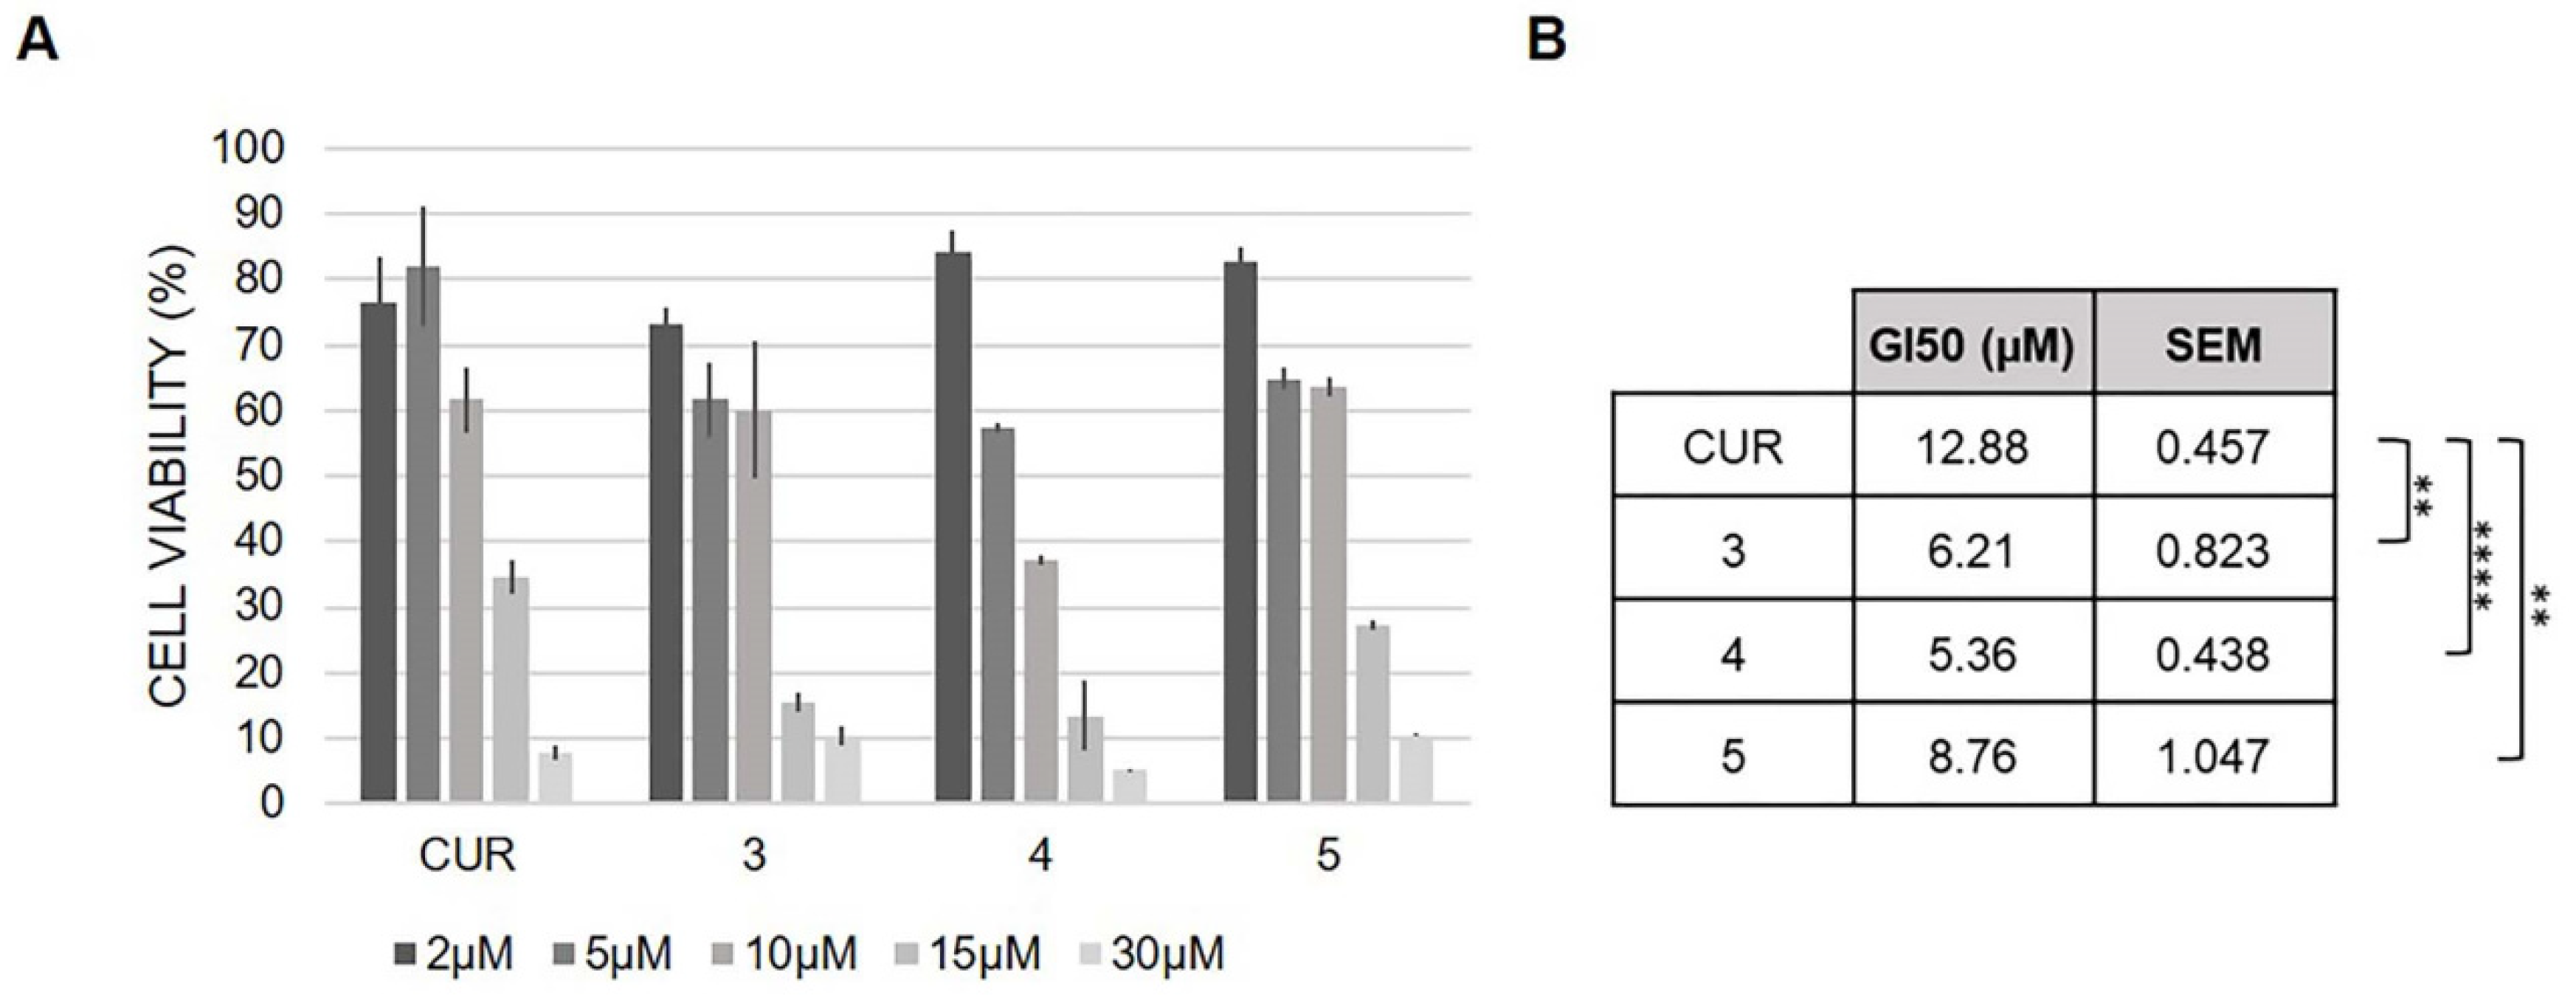
2.6. Antioxidant Activity and Cell Viability Assays

Compounds 4 and 5 are characterized by the presence of two phenolic groups that could be responsible for additional antioxidant properties, so the DPPH radical-scavenging assay was carried out for the free ligands 4 and 5 and their Ga3+ complexes (Figure S4). Both compounds showed similar IC50 values (20 μM and 32 μM for 4 and 5, respectively) and close to that reported for curcumin (13 μM [14]).
To establish the potential antitumor activity of compounds 3, 4 and 5, we evaluated their effects on the proliferation of HCT116 colon carcinoma cells, a cellular tumor model previously used for the characterization of curcumin derivatives [41]. We performed dose response experiments (Figure 12A) and calculated GI50 values as the concentration of molecules that induces 50% growth inhibition after 48 h of treatment (Figure 12B). Curcumin and compound 4 were used as reference drugs since we had previously reported their antiproliferative activity in HCT116 cells [26]. Comparing curcumin with the synthesized derivatives revealed that the conjugation of phthalimide significantly increases their antiproliferative activity in HCT116 cells (Figure 12). Besides, 5 showed a major efficacy in terms of growth inhibitory activity (GI50) compared to curcumin.

3. Materials and Methods

3.1. General Procedures

All the chemicals and solvents were purchased with the highest purity grade available and used without further purification unless otherwise specified; pH measurements were carried out using a calibrated pH-meter (Mettler-Toledo). Liquid chromatography/mass spectrometry (LC/MS) was performed on an Agilent 6300 Ion Trap LC/MS System equipped with an electrospray ionization (ESI) interface. Elemental analysis was performed on a Thermo Scientific™ FLASH 2000 CHNS Analyzer.
All the reaction intermediates were purified as specified in the following procedures and their purity (≥95%) was checked by a combination of LC/MS, NMR and elemental analysis.
Atom numbering of the NMR data refers to Figure 1.

3.2. Synthesis

  • 4-(3-bromopropyl)-3-methoxybenzaldehyde
1,3-dibromopropane (3 mL) is slowly added to a suspension of vanillin (1.5 g) and K2CO3 (1.9 g) in 15 mL of dimethylformamide (DMF). The mixture is kept under stirring at 75 °C overnight, then the temperature is cooled down, the solid is filtered off and the solution is neutralized by adding 10% CH3COOH aqueous solution. The product is extracted in ethyl acetate (EtOAc), the organic phases are then collected, washed with NaHCO3 and brine and finally dried over Na2SO4. After filtering off the salts, the solvent is removed under reduced pressure. The raw product is purified by flash column chromatography (silica, gradient (v/v) petroleum ether (EtPet): ethyl acetate (EtOAc) 100:0→70:30). Light yellow solid, 27% yield. Elemental analysis for C11H13O3Br (267.08 g/mol): calc. C, 50.19%; H, 5.27%; exp. C, 50.02%, H, 5.49%. LC/MS (ESI): m/z 287.0 [M + H]+. 1H NMR (δ (ppm), CDCl3): 9.87 (1H), 7.43 (d, 1H), 6.99 (d, 1H), 7.46 (dd, 1H), 4.16 (t, 2H), 2.10 (m, 2H), 3.53 (t, 2H), 3.94 (OCH3, s, 3H).
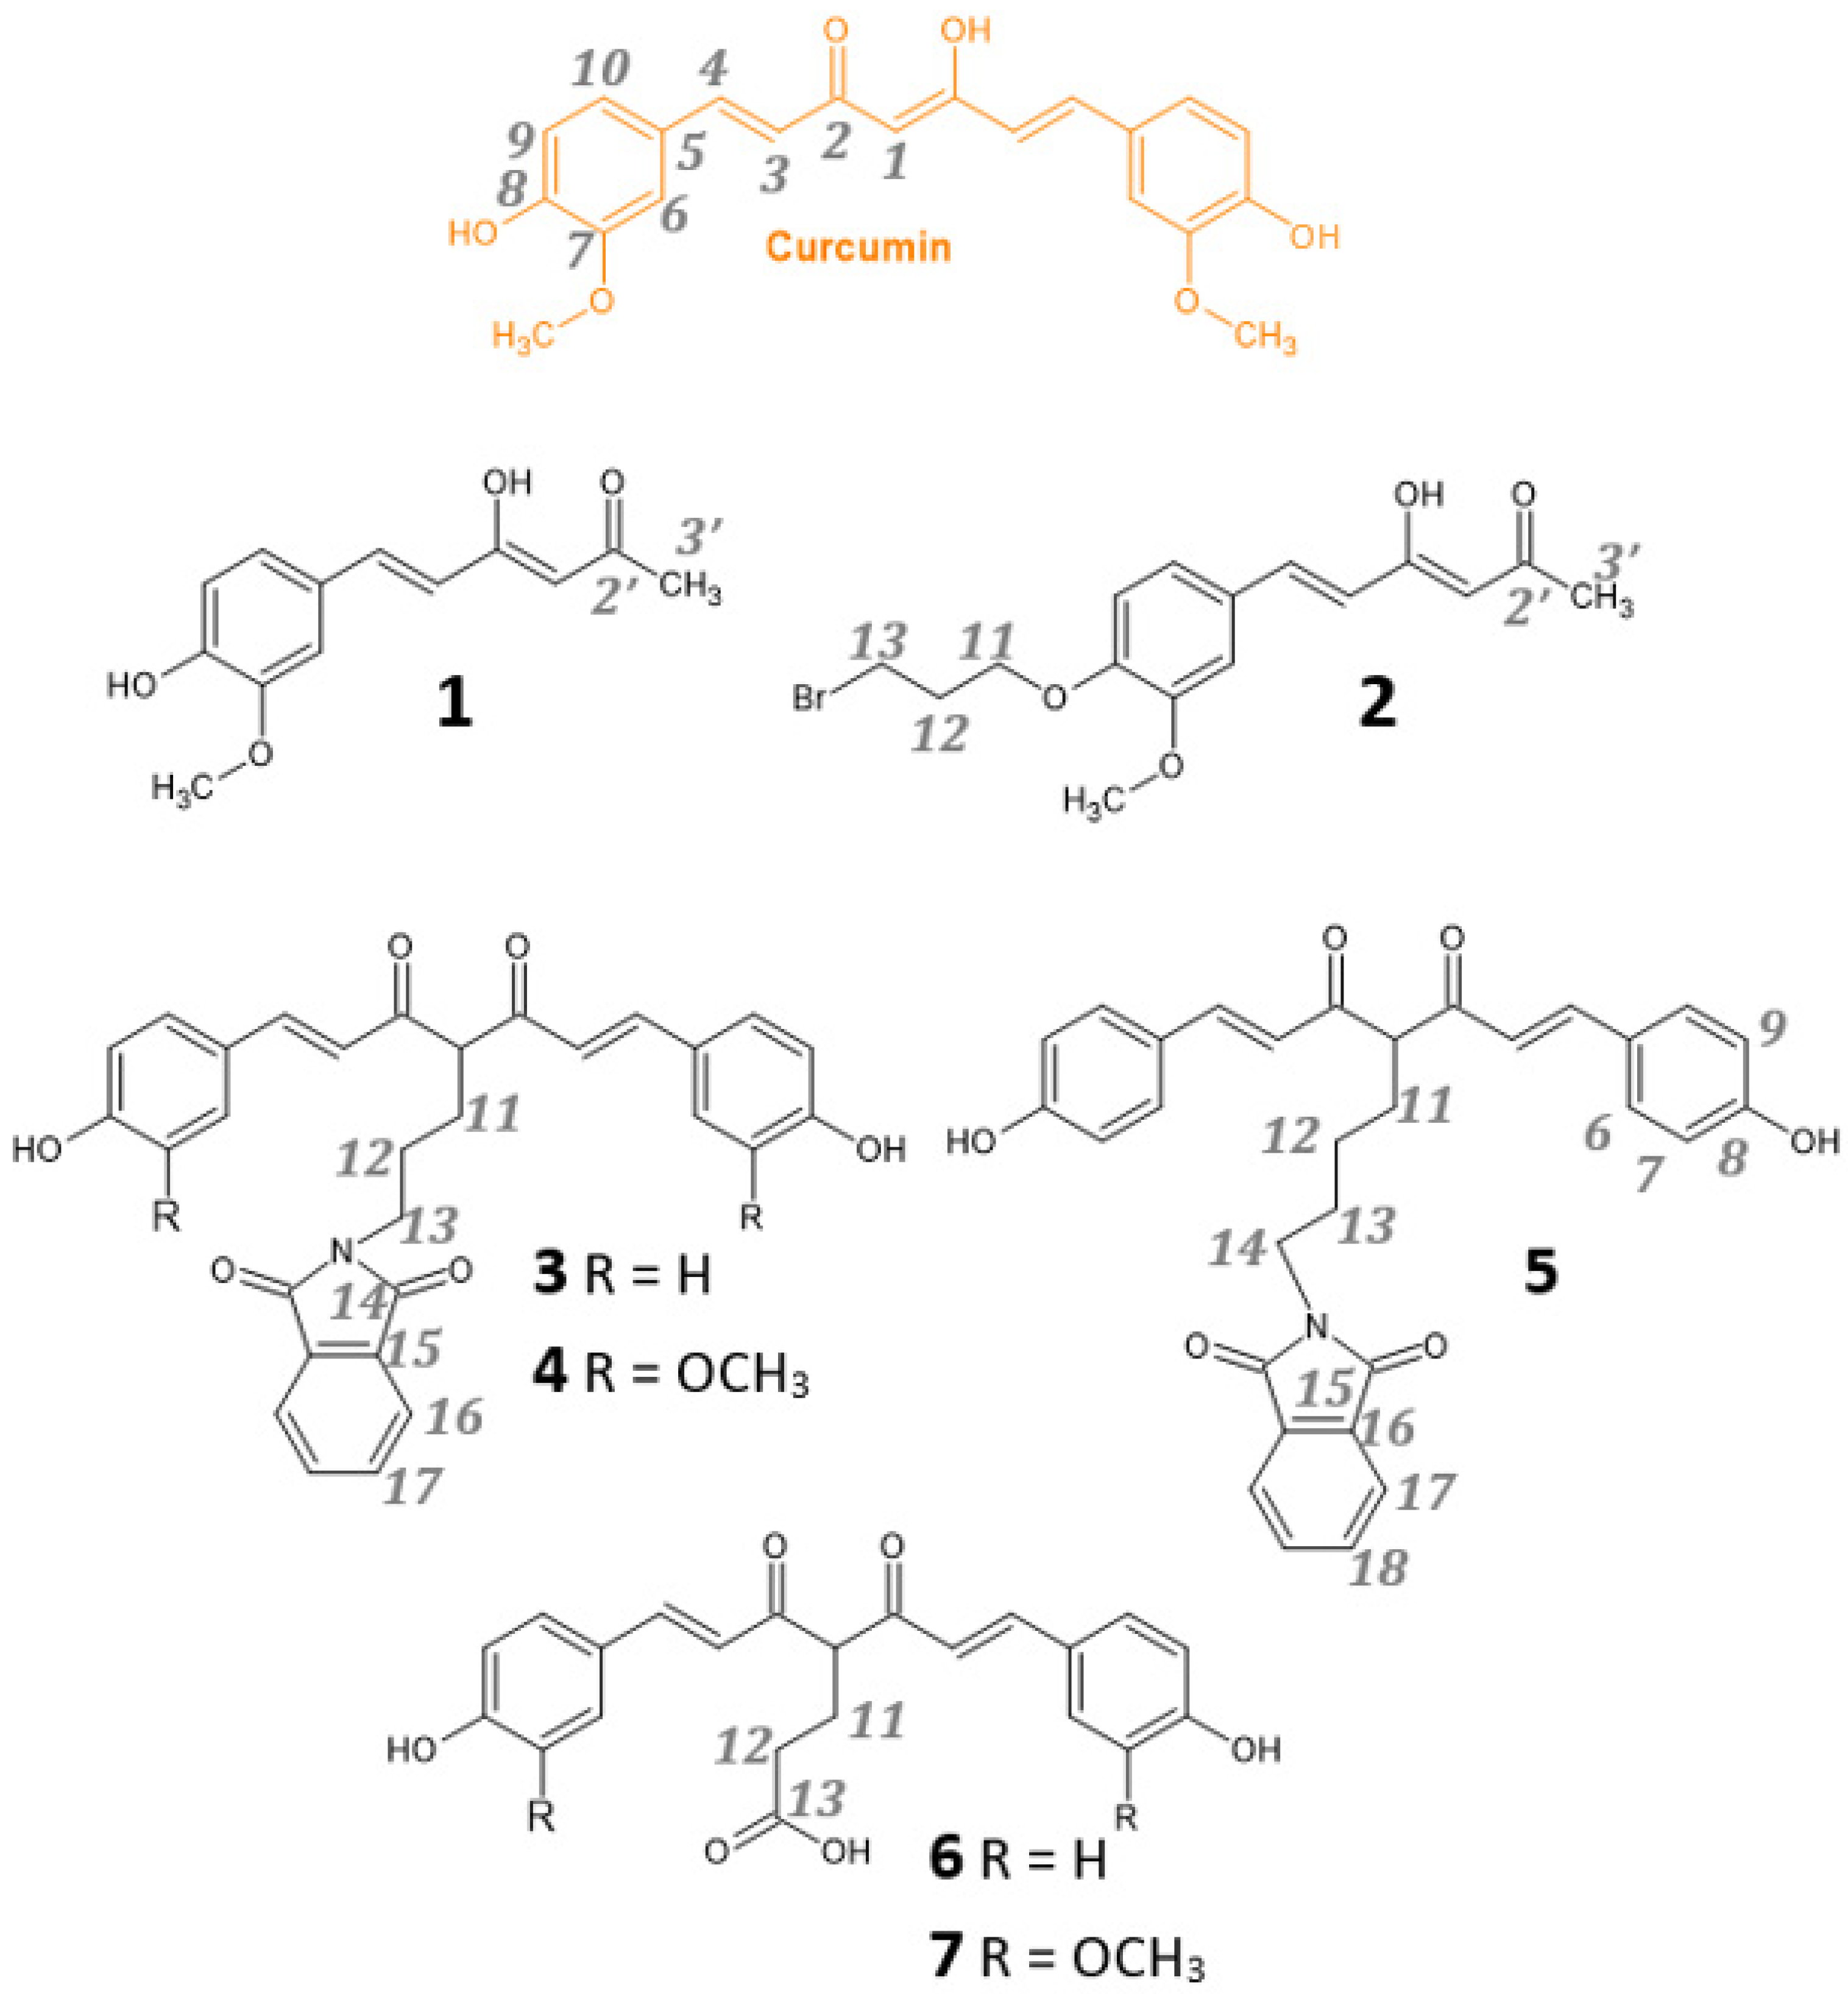
  • (3Z,5E)-4-hydroxy-6-(3-methoxy-4-methylphenyl)hexa-3,5-dien-2-one (1)
The procedure was adapted from Pabon’s CUR synthesis [28]; actually, boron acetylacetonate is obtained by reacting B2O3 (0.72 g) and 1.1 mL of acetylacetone (acac) in DMF (11 mL). The mixture is kept under reflux at 80 °C for 30 min, then 11 mL tributyl borate is added, and the mixture is kept under stirring at 80 °C overnight. After 16 h, the suspension turns orange–red and becomes dark red when vanillin is added (0.265 g). n-butylamine (145 µL in 0.5 mL of DMF) is slowly dropped over 1 h. The reaction batch is maintained under heating and stirring for 6 more hours, then the system is cooled down to r.t., acidified by adding 40 mL of 0.5 M HCl and kept under stirring for 1 h. The aqueous phase is extracted with EtOAc three times, the organic phases are collected, washed with NaHCO3, brine and eventually dried under Na2SO4. After filtering off the salts, the solvent is removed under reduced pressure. The raw product is purified by flash column chromatography (silica, gradient (v/v) EtPet: EtOAc 100:0→70:30). Yellow powder, 45% yield. Elemental analysis for C13H14O4 (234.25 g/mol): calc. C, 66.66%, H, 6.02%; exp. C, 66.52%, H, 6.18. LC/MS (ESI): m/z 235.1 [M + H]+. 1H NMR (δ (ppm), MeOD-d4): 7.55 (H-4, d, 1H), 7.20 (H-6, d, 1H), 7.09 (H-10, dd, 1H), 6.82 (H-9, dd, 1H), 6.51 (H-3, d, 1H), 5.79 (H-1, s, 1H), 3.92 (OCH3, s, 3H), 2.15 (H-3′, s, 3H).
  • (3Z,5E)-6-[4-(3-bromopropoxy)-3-methoxyphenyl]-4-hydroxyhexa-3,5-dien-2-one (2)
Compound 2 was obtained similarly to 1, but 4-(3-bromopropyl)-3-methoxybenzaldehyde was used instead of vanillin. Yellow powder, 35% yield. Elemental analysis for C16H19BrO4 (355.22 g/mol): calc. C, 54.10%, H, 5.39%; exp. C, 53.89%, H, 5.48%. LC/MS (ESI): m/z 355.1 [M + H]+. 1H NMR (δ (ppm), MeOD-d4): 2.16 (H-3′, s, 3H), 5.81 (H-1, s, 1H), 6.56 (H-3, d, 1H), 7.56 (H-4, d, 1H), 7.25 (H-7, dd, 1H), 7.00 (H-9, dd, 1H), 7.17 (H-10, dd, 1H), 4.18 (H-11, t, 2H), 2.34 (H-12, m, 2H), 3.67 (H-13, t, 2H), 3.91 (OCH3, s, 3H).
  • (2-((4Z,6E)-5-hydroxy-7-(4-hydroxyphenyl)-4-((E)-3-(4-hydroxy-3-ethoxyphenyl) acryloyl) hepta-4,6-dien-1-yl)isoindoline-1,3-dione (3)
Compound 3 was synthesized as previously reported [21]. Orange powder, 40% yield. Elemental analysis for C30H25NO6: calc. C, 72.72%, H, 5.09%, N, 2.83%; exp. C, 73.06%, H, 5.21%, N, 2.75%. LC/MS-IT: m/z 496.6 (M + H)+. 1H NMR (DMSO-d6): 7.00 (H-3, d, 2H), 7.58 (H-4, d, 2H), 7.54 (H-6/H-10, d, 4H), 6.79 (H-7/H-9, d, 4H), 2.65 (H-11, t, 2H), 1.83 (H-12, m, 2H), 3.77 (H-13, t (broad), 2H), 7.88 (H-16, m, 2H), 7.85 (H-17, m, 2H).
  • (2-((4Z,6E)-5-hydroxy-7-(3-methoxy-4-hydroxyphenyl)-4-((E)-3-(4-hydroxy-3-ethoxyphenyl) acryloyl) hepta-4,6-dien-1-yl)isoindoline-1,3-dione (4)
Compound 4 was synthesized as previously reported [26]. Light-orange powder, 50% yield. Elemental analysis for C32H29NO8 (555.57 g/mol): calc. C, 69.18%, H, 5.26%, N, 2.52%; exp. C, 69.02%, H, 5.39%, N, 2.83%. LC/MS-IT: m/z 556.2 (M + H)+. 1H NMR (δ (ppm), DMSO-d6): 7.00 (H-3, d, 2H), 7.58 (H-4, d, 2H), 7.54 (H-6/H-10, d, 4H), 6.79 (H-7/H-9, d, 4H), 2.65 (H-11, t, 2H), 1.83 (H-12, m, 2H), 3.77 (H-13, t (broad), 2H), 7.88 (H-16, m, 2H), 7.85 (H-17, m, 2H).
  • 2-((4Z,6E)-5-hydroxy-7-(4-hydroxyphenyl)-4-((E)-3-(4-hydroxy-3-ethoxyphenyl) acryloyl) hepta-4,6-dien-1-yl)isoindoline-1,3-dione (5)
Compound 5 was synthesized following a procedure previously reported [26]. 2,4-pentandione (25 mmol) is added to a suspension of K2CO3/KI (50/3 mmol) in dry acetone (15 mL) at 80 °C and kept under stirring for 1 h. Then, a solution of 2-(4-bromobutyl)-1H-isoindole-1,3(2H)-dione (25 mmol) in dry acetone (5 mL) is added dropwise and kept under magnetic stirring overnight at 80 °C. The solution is then cooled down to r.t., diluted with aqueous NH4Cl and extracted twice with DCM. The organic phases are washed with brine and dried over Na2SO4. After solvent removal under reduced pressure, a yellow sticky product is obtained that requires further purification by flash column chromatography. Orange powder, 34% yield. Elemental analysis for C31H27NO6 (509.55 g/mol): calc. C, 73.07%, H, 5.34%, N, 2.75%; exp. C, 73.25%, H, 5.44%, N, 2.85%. LC/MS-IT: m/z 510.2 (M + H)+. 1H NMR (δ (ppm), CDCl3): 7.72 (H-18, m, 2H), 7.81 (H-17, dd, 2H), 3.83 (H-14, m (broad), 2H), 1.92 (H-13, m, 2H), 1.62 (H-12, m, 2H), 2.67 (H-11, t, 2H), 6.98 (H-3, d, 2H), 7.73 (H-4, d, 2H), 7.22 (H-10, dd, 2H), 7.18 (H-9, d, 2H), 6.99 (H-6, d, 2H), 4.03 (OCH3, s, 6H).
  • (6E)-7-(4-hydroxyphenyl)-4-[(2E)-3-(4-hydroxyphenyl)prop-2-enoyl]-5-oxohept-6-enoic acid (6)
Compound 6 was synthesized following the procedure reported by Ferrari et al. starting from 4-acetyl-5-oxohexanoic acid obtained as previously reported [27]. Light orange powder, 47% yield. Elemental analysis for C22H20O6 (380.39 g/mol): calc. C, 69.46%, H, 5.30%; exp. C, 69.31%, H, 5.60%. LC/MS-IT: m/z 381.1 (M + H)+. 1H NMR (δ (ppm), MeOD-d4): 2.35 (H-12, t, 2H), 2.20 (H-11, m, 2H), 6.79 (H-3, d, 2H), 7.69 (H-4, d, 2H), 7.43–760 (H-6/10, m, 4H), 6.60–6.88 (H-7/9, m, 4H).
  • (6E)-7-(3-methoxy-4-hydroxyphenyl)-4-[(2E)-3-(3-methoxy-4-hydroxyphenyl)prop-2-enoyl]-5-oxohept-6-enoic acid (7)
Compound 7 was synthesized following the procedure reported by Ferrari et al. [22] starting from 4-acetyl-5-oxohexanoic acid obtained as previously reported [24]. Orange-red powder, 58% yield. Elemental analysis for C24H24O8 (440.44 g/mol): calc. C, 65.45%, H, 5.49%; exp. C, 65.26%, H, 5.74%. LC/MS-IT: m/z 441.2 (M + H)+. 1H NMR (δ (ppm), CDCl3): 7,72 (H-3, d, 2H), 6.82 (H-4, d, 2H), 7.25 (H-6, dd, 2H), 6.84 (H-9, dd, 2H), 7.16 (H-10, dd, 2H), 2.24 (H-11, t, 2H), 2.38 (H-12, t, 2H), 3.90 (OCH3, s, 6H).

3.3. Kinetic Stability of Ligands in Physiological Conditions

The chemical stability of ligands and metal complexes at the M:L 1:L molar ratio at 37 °C in darkness was evaluated by UV−Vis spectroscopy as a change in absorbance in the 250−600 nm range over an overall period of 8 h. Solutions (5.0 × 10⁻⁵ mol L–1) of the ligands were prepared in 0.1 mol L–1 phosphate-buffered solution (PBS) at pH 7.4. Spectra were recorded every 30 min. All profiles were linearized as the hyperbolic function defined by Equation (2), which represents an empirical model that describes drug decomposition or release well [42]:
t f % = a t + b
where f% is the percentage of the residual compound at time t (min) referred to the starting concentration at time zero determined by reading the absorbance at λmax.

3.4. UV–Visible Spectroscopy

UV–visible spectra were recorded with a JASCO V-570 UV/Vis/NIR spectrophotometer at 298 K in the 250–600 nm spectral range employing quartz cells (1 cm optical path). To perform spectrophotometric titrations, ligands (denoted generally as L in the following) were dissolved in methanol to give a mother solution (2.50 mM), that was then diluted in water in order to obtain a final concentration of 50 μM. The metal/ligand (M:L) solutions were obtained by adding appropriate quantities of Ga(NO3)3 as methanol solutions (5–10 mM) in order to obtain the metal-to-ligand 1:1 molar ratio (L = 50 μM and V = 25 mL). For both L and M:L systems, pH (initial value of about 5) was varied by adding small amounts (<1 μL) of concentrated NaOH (4 M) up to ca. pH 11, thus to consider volume variations negligible. To evaluate the complexation ratio, constant additions of the M solution (10 µL each time, M = 10–2 M) were dropped into the ligand solution (V = 25 mL, L = 50 μM) using a micropipette in order to reach different M:L molar ratios. A constant ionic strength (NaNO3, 0.1 M) was maintained in all experiments. Spectrophotometric investigations of iron(III) systems were performed in the same conditions; the Fe3+ solution was freshly prepared in methanol starting from Fe(NO3)3·9H2O. The overall protonation constants (logβqr) and the overall stability constants of metal complexes (logβpqr) were evaluated from spectrophotometric data. The stability constants (βpqr), defined by the following equations:
p M m + + q L l + r H + M p L q H r ( m p l q + r )
β p q r = [ M p L q H r ( m p l q + r ) ] [ M m + ] p · [ L l ] q · [ H + ] r
where L is the ligand in the completely dissociated form and H is proton, were refined using least-squares calculation in HypSpec [36]. The results of least-squares calculation include the standard deviations and correlation coefficients of the refined parameters. The quantities are obtained by performing error propagation calculation from the experimental errors onto the parameters. The stability constant refinement furnishes least-squares estimates of the standard deviation, σ, of the stability constant β. The error on logβ is calculated as follows: σ(logβ) = [log(β + σ) − log(β − σ)]/2.
Hydroxide species, such as [Ga(OH)2]+, were taken into account for calculations. The hydrolysis constants for Ga3+ are as follows: logβ1,1,0 = −3.93; logβ2,1,0 = −7.73; logβ3,1,0 = −12.38; logβ4,1,0 = −15.96; logβ32,13,0 = −66.3; logβ3,1,0(s) = −3.54 [43]; pGa is defined as (−log[Ga3+]free) and is calculated at specific conditions (Ga3+total = 1 μM, Ltotal = 10 μM, pH 7.4, 25 °C). For the calculation of the iron(III) overall stability constants, the presence of [Fe(OH)]2+, [Fe(OH)2]+ and [Fe(OH)3] species was taken into account [44].

3.5. Nuclear Magnetic Resonance

NMR spectra were recorded by means of a Bruker Biospin FT-NMR AVANCE III HD (600 MHz) spectrometer equipped with a CryoProbe BBO H&F 5 mm in inverse detection. The nominal frequencies were 150.90 MHz for 13C and 600.13 MHz for 1H, respectively. For each sample, 1–5 mg were weighed and diluted up to 0.6 mL with a proper solvent in a 5 mm NMR tube; 90° pulse was calibrated for each sample, and standard NMR parameters were used to achieve quantitative results (relaxation delay, 10 s). Proton and carbon chemical shifts are given in parts per million (ppm) versus external TMS and were determined by reference to the solvent residual signals. Typical 2D homo- and heteronuclear techniques were used for assignment, i.e., 1H,1H COSY, 1H,13C HSQC, 1H,13C HMBC. NMR investigations of Ga3+:L systems were performed in MeOD-d4 by adding small amounts of a Ga(NO3)3 solution (10 μL each) to 1 mM ligand solution (0.6 mL) until reaching the desired metal-to-ligand molar ratio. The complexation reaction is fast, and spectra were registered few minutes after the addition. Two-dimensional 1H,13C heteronuclear multiple bond correlation (HMBC) experiments (hmbcgpndqf in Bruker library) were performed via heteronuclear zero and double quantum coherence, optimized on long-range couplings (3/4JHC = 8 Hz), with no decoupling during acquisition, and gradient pulses were used for selection. The relative percentages of the isomeric forms were estimated on the basis of the NMR data. Particularly, 1H NMR spectra were acquired in quantitative conditions being D1 (relaxation delay) at least five times the T1 of the slowest relaxing signal of interest. The raw data were Fourier-transformed, and then the processing was performed by zero filling (SI = TD), line broadening (lb 0.3 Hz), accurate phasing and correcting the baseline. The most isolated signals were selected for integration, i.e., the vinyl protons (H-3 and H-4), and an average of the integrated area (A) of H-3 and H-4 was used for relative quantitation, according to the following equation:
% T a u t o m e r i = ( A ( H 3 ) i + ( A ( H 4 ) i ) / 2 i ( A ( H 3 ) i + ( A ( H 4 ) i ) / 2 × 100

3.6. Antioxidant Activity (DPPH Assay)

The antioxidant activity of compounds 4 and 5 and their Ga3+ metal complexes at the M:L 1:1 and 1:2 molar ratio was evaluated in terms of hydrogen-donating or radical scavenging ability using a stable DPPH radical, 1,1-diphenyl-2-picrylhydrazyl radical, following the procedure previously reported [26]. The percentage of inhibition (%In) of the DPPH radical by each sample was calculated according to the following formula:
% I n = A 0 A t A 0 × 100
where A0 represents the absorbance of the control (DPPH radical) at time 0, while At refers to the absorbance of the mixture antioxidant/DPPH at time t (120 min). Values of absorbance were corrected considering volume dilution. All the determinations were performed in duplicate.

3.7. Cell Viability Assay

Human colorectal carcinoma HCT116 cells (#91091005, ECACC) were grown in an IMDM medium (Biowest) supplemented with 2 mM glutamine, 100 IU/mL penicillin, 100 μg/mL streptomycin and 10% FBS (Gibco). The cell lines were grown at 37 °C in a humidified incubator containing 5% CO2. The cells were verified to be mycoplasma-free and passaged < 3 months. The inhibition of cell proliferation was measured by colorimetric 3-(4,5-dimethylthiazol-2-yl)-2,5-diphenyltetrazolium bromide (MTT) assay [45]. GI50 concentrations were determined using the CompuSyn software version 1.0 (ComboSyn, Inc., Paramus, NJ USA) (free download via www.combosyn.com, accessed on 30 May 2022), and statistical analyses were performed using the GraphPad PRISM software (version 6.01 for Windows, GraphPad Software, San Diego, California USA GraphPad Prism) using unpaired t-test. Data were considered to be statistically significant if p < 0.05 (*), p < 0.01 (**), p < 0.001(***) and p < 0.0001 (****).

4. Conclusions

With the lead compound curcumin, all the investigated ligands were characterized by a β-keto–enol group, suitable to bind hard Lewis acids such as Ga3+. Since one of the main drawbacks of curcumin is its high instability in physiological conditions, tightly related to its poor bioavailability, we synthesized seven new derivatives with improved stability in physiological environment (PBS pH 7.4, 37 °C). Estimating the stability under cell culture conditions would be remarkable to also predict potential therapeutic applications of the gallium complexes. In previous studies, the stability of gallium complexes with the lead compound curcumin was investigated in plasma and cellular cultures, demonstrating an increased stability of the metal complexes over the free ligand in these media and their ability to enter into the cells in vitro, as supported by confocal microscopy and ICP-MS analysis [46,47]. As it concerns the stability in a slightly acidic environment (pH 5–6) such as inside tumor cells [48], all gallium complexes are formed in acidic conditions (pH 4–6) and demonstrated to be stable in acid media, as suggested by the species distribution curves. However, it is not possible to exclude transchelation reactions; indeed, Ga3+ could be bound to the two metal-binding domains of transferrin with binding constants almost comparable to those of Fe3+ (log K1 = 20.3 (Ga3+), 22.8 (Fe3+) and log K2 = 19.3 (Ga3+), 21.7 (Fe3+)) at the normal plasma bicarbonate concentrations [21].
Additional issues in predicting the chemical stability and behavior in vivo are transmetalation reactions with endogenous metal ions. The high affinity of oxygen for strong Lewis acids such as Ga3+ reduces the incidence of transmetalation with bivalent metal ions such as Ca2+, Mg2+, Zn2+, while the exchange with Fe3+ cannot be excluded and should be estimated. Interestingly, iron is an essential nutrient the demand wherefore highly increases in cancer cells; consequently, limiting its availability can reduce cell proliferation, so iron chelators seem to have a high potential in cancer treatment [49,50]. The affinity for iron(III) of compounds 4 and 5 was comparable to that for gallium(III). Although we may not exclude transmetalation reactions with Fe(III), Ga3+ complexes of compounds 4 and 5 appear to be stable, given that iron homeostasis is finely regulated and the labile iron pool is negligible [51].
The main chemical features of the investigated ligands and their Ga3+ complexes are outlined in Table 4. The outcomes suggest that compounds 5 and, to a minor extent, 4 stand out as the most promising ones for potential therapeutic applications. In fact, the free ligand is more stable than curcumin, and a further increased stability is gained when Ga3+ complexes are formed. Compounds 4 and 5 are the strongest Ga3+-chelating agents, with pGa values similar to those of clinically established chelators (i.e., DFOA). In addition, the prevailing metal complex species are positively charged and remain unchanged with the switch in pH from physiological conditions (pH 7.4) to pathological ones, such as in tumor cells (pH 5–6), possibly favoring cellular uptake. Furthermore, upon the DPPH assay, compounds 4 and 5 and their Ga3+ complexes showed interesting antioxidant properties, with the IC50 values close to those of curcumin. As for similar compounds, the presence of a methoxy group in the ortho position to the phenolic one reduces the radical scavenging ability increasing the IC50 value [14]. The radical scavenging ability remains unaffected in the formation of Ga3+ complexes since the phenolic group remains untouched by metal coordination as previously observed for other derivatives [52].
According to the chemical characterization of these newly synthesized Ga(III) derivatives, molecules 3, 4 and 5 were selected for MTT assays. The preliminary results pointed out that the conjugation of phthalimide significantly increases the antiproliferative activity in HCT116 cells, and among all, compound 5 showed major efficacy in terms of growth inhibitory activity (GI50) compared to curcumin. Further investigation would allow better characterizing this molecule as a potential therapeutic anticancer drug and could ascertain if its Ga(III) derivative can inhibit cancer-related cellular processes, such as clonal growth and migration, similarly to what we recently reported for compound 4 [26]. It is also conceivable that gallium complexes might exert antimicrobial effects, as suggested by Seoung Choi et al. [53].
Finally, we demonstrated that compounds 6 and 7 can bind Ga3+ through the keto–enol moiety while the carboxylic group is not involved due to its spatial distance from the metal ion. The chemical structure of these compounds affects the overall stability constants of gallium complexes, reducing the Ga3+-sequestering ability. Nonetheless, this apparent flaw could be turned into an additional therapeutic property since the free carboxylate moiety could be exploited as a targeting vector for monocarboxylate transporters (MCTs), especially MCT1 that is overexpressed in several cancer cells, for instance, breast, lung and ovarian cancer cells [54,55].

Supplementary Materials

The following supporting information can be downloaded at: https://www.mdpi.com/article/10.3390/ph15070854/s1, Figure S1: UV–Vis spectra of the investigated compounds at 25 °C in an aqueous solution (L = 50 μM). Figure S2: 1H NMR spectra of compound 7 in MeOD-d4 at 298 K (at 600 MHz) at the increasing addition of Ga3+. Figure S3: pH-metric spectrophotometric titration of the Ga3+:1 1:1 system in an aqueous solution (L = 50 μM; NaNO3 = 0.1 M, 298 K). Figure S4: Radical scavenging ability of derivatives 4 and 5 together with their Ga3+ metal complexes. Table S1: Liquid chromatography/mass spectrometry (LC/MS) results (m/z) for gallium(III) complexes.

Author Contributions

Conceptualization, E.F. and M.A.; Methodology, D.C. and M.M.; Investigation, M.M., G.A., E.V. and S.B.; Resources, E.F. and G.M.; Data curation, E.F.; Writing—original draft preparation, E.F. and M.M.; Writing—review and editing, E.F., M.M., P.C.C., M.I. and S.R.; Visualization, D.C.; Supervision, E.F.; Project administration, E.F.; Funding acquisition, E.F. All authors have read and agreed to the published version of the manuscript.

Funding

This research received no external funding.

Institutional Review Board Statement

Not applicable.

Informed Consent Statement

Not applicable.

Data Availability Statement

Data is contained within the article and supplementary material.

Acknowledgments

The authors want to thank the C.I.G.S. (Centro Interdipartimentale Grandi Strumenti) of UNIMORE for technical support and the Network for Equilibria and Chemical Thermodynamics Advanced Research (NECTAR) COST ACTION CA18202.

Conflicts of Interest

The authors declare no conflict of interest.

References

  1. Razavi, B.M.; Ghasemzadeh Rahbardar, M.; Hosseinzadeh, H. A review of therapeutic potentials of turmeric (Curcuma longa) and its active constituent, curcumin, on inflammatory disorders, pain, and their related patents. Phyther. Res. 2021, 35, 6489–6513. [Google Scholar] [CrossRef] [PubMed]
  2. Ojo, O.A.; Adeyemo, T.R.; Rotimi, D.; Batiha, G.E.-S.; Mostafa-Hedeab, G.; Iyobhebhe, M.E.; Elebiyo, T.C.; Atunwa, B.; Ojo, A.B.; Lima, C.M.G.; et al. Anticancer Properties of Curcumin Against Colorectal Cancer: A Review. Front. Oncol. 2022, 12, 1–13. [Google Scholar] [CrossRef] [PubMed]
  3. Kharat, M.; Du, Z.; Zhang, G.; McClements, D.J. Physical and Chemical Stability of Curcumin in Aqueous Solutions and Emulsions: Impact of pH, Temperature, and Molecular Environment. J. Agric. Food Chem. 2017, 65, 1525–1532. [Google Scholar] [CrossRef] [PubMed]
  4. Ramesh, G.; Kaviyil, J.E.; Paul, W.; Sasi, R.; Joseph, R. Gallium-Curcumin Nanoparticle Conjugates as an Antibacterial Agent against Pseudomonas aeruginosa: Synthesis and Characterization. ACS Omega 2022, 7, 6795–6809. [Google Scholar] [CrossRef] [PubMed]
  5. Panzarini, E.; Mariano, S.; Tacconi, S.; Carata, E.; Tata, A.M.; Dini, L. Novel therapeutic delivery of nanocurcumin in central nervous system related disorders. Nanomaterials 2021, 11, 2. [Google Scholar] [CrossRef]
  6. Noureddin, S.A.; El-Shishtawy, R.M.; Al-Footy, K.O. Curcumin analogues and their hybrid molecules as multifunctional drugs. Eur. J. Med. Chem. 2019, 182, 111631. [Google Scholar] [CrossRef]
  7. Yanagisawa, D.; Kato, T.; Taguchi, H.; Shirai, N.; Hirao, K.; Sogabe, T.; Tomiyama, T.; Gamo, K.; Hirahara, Y.; Kitada, M.; et al. Keto form of curcumin derivatives strongly binds to Aβ oligomers but not fibrils. Biomaterials 2021, 270, 120686. [Google Scholar] [CrossRef]
  8. Manolova, Y.; Deneva, V.; Antonov, L.; Drakalska, E.; Momekova, D.; Lambov, N. The effect of the water on the curcumin tautomerism: A quantitative approach. Spectrochim. Acta Part A Mol. Biomol. Spectrosc. 2014, 132, 815–820. [Google Scholar] [CrossRef]
  9. Puglisi, A.; Giovannini, T.; Antonov, L.; Cappelli, C. Interplay between conformational and solvent effects in UV-visible absorption spectra: Curcumin tautomers as a case study. Phys. Chem. Chem. Phys. 2019, 21, 15504–15514. [Google Scholar] [CrossRef]
  10. Parimita, S.P.; Ramshankar, Y.V.; Suresh, S.; Row, T.N.G. Redetermination of curcumin: (1E,4Z,6E)-5-hydroxy-1,7-bis(4-hydroxy-3-methoxy-phenyl)hepta-1,4,6-trien-3-one. Acta Crystallogr. Sect. E Struct. Rep. Online 2007, 63, 860–862. [Google Scholar] [CrossRef]
  11. Prasad, D.; Praveen, A.; Mahapatra, S.; Mogurampelly, S.; Chaudhari, S.R. Existence of β-diketone form of curcuminoids revealed by NMR spectroscopy. Food Chem. 2021, 360, 130000. [Google Scholar] [CrossRef] [PubMed]
  12. Enumo, A.; Irineu, C.; Pereira, D.; Parize, A.L. Temperature Evaluation of Curcumin Keto−Enolic Kinetics and Its Interaction with Two Pluronic Copolymers. J. Phys. Chem. B 2019, 123, 5641–5650. [Google Scholar] [CrossRef] [PubMed]
  13. Wanninger, S.; Lorenz, V.; Subhan, A.; Edelmann, F.T. Metal complexes of curcumin—Synthetic strategies, structures and medicinal applications. Chem. Soc. Rev. 2015, 44, 4986–5002. [Google Scholar] [CrossRef] [PubMed] [Green Version]
  14. Ferrari, E.; Benassi, R.; Saladini, M.; Orteca, G.; Gazova, Z.; Siposova, K. In vitro study on potential pharmacological activity of curcumin analogues and their copper complexes. Chem. Biol. Drug Des. 2017, 89, 411–419. [Google Scholar] [CrossRef]
  15. Balasubramanian, K. Quantum chemical insights into Alzheimer’s disease: Curcumin’s chelation with Cu(II), Zn(II), and Pd(II) as a mechanism for its prevention. Int. J. Quantum Chem. 2016, 116, 1107–1119. [Google Scholar] [CrossRef]
  16. Halevas, E.; Pekou, A.; Papi, R.; Mavroidi, B.; Hatzidimitriou, A.G.; Zahariou, G.; Litsardakis, G.; Sagnou, M.; Pelecanou, M.; Pantazaki, A.A. Synthesis, physicochemical characterization and biological properties of two novel Cu(II) complexes based on natural products curcumin and quercetin. J. Inorg. Biochem. 2020, 208, 111083. [Google Scholar] [CrossRef]
  17. Prasad, S.; Dubourdieu, D.; Srivastava, A.; Kumar, P.; Lall, R.; Bachmeier, E. Molecular Sciences Metal-Curcumin Complexes in Therapeutics: An Approach to Enhance Pharmacological Effects of Curcumin. Int. J. Mole. Sci. 2021, 22, 7094. [Google Scholar] [CrossRef]
  18. dos, S.S.; Firmino, G.; André, S.C.; Hastenreiter, Z.; Campos, V.K.; Abdel-Salam, M.A.L.; de Souza-Fagundes, E.M.; Lessa, J.A. In vitro assessment of the cytotoxicity of gallium(III) complexes with Isoniazid-Derived Hydrazones: Effects on clonogenic survival of HCT-116 cells. Inorg. Chim. Acta 2019, 497, 119079. [Google Scholar] [CrossRef]
  19. Qi, J.; Liu, T.; Zhao, W.; Zheng, X.; Wang, Y. Synthesis, crystal structure and antiproliferative mechanisms of gallium(III) complexes with benzoylpyridine thiosemicarbazones. RSC Adv. 2020, 10, 18553–18559. [Google Scholar] [CrossRef]
  20. Chitambar, C.R.; Purpi, D.P.; Woodliff, J.; Yang, M.; Wereley, J.P. Development of Gallium Compounds for Treatment of Lymphoma: Gallium Maltolate, a Novel Hydroxypyrone Gallium Compound, Induces Apoptosis and Circumvents Lymphoma Cell Resistance to Gallium Nitrate. J. Pharmacol. Exp. Ther. 2007, 322, 1228–1236. [Google Scholar] [CrossRef] [Green Version]
  21. Chitambar, C.R. Gallium-containing anticancer compounds. Future Med. Chem. 2012, 4, 1257–1272. [Google Scholar] [CrossRef] [PubMed] [Green Version]
  22. Ellahioui, Y.; Prashar, S.; Gómez-Ruiz, S. Anticancer applications and recent investigations of metallodrugs based on gallium, tin and titanium. Inorganics 2017, 5, 4. [Google Scholar] [CrossRef] [Green Version]
  23. Lessa, J.A.; Parrilha, G.L.; Beraldo, H. Gallium complexes as new promising metallodrug candidates. Inorg. Chim. Acta 2012, 393, 53–63. [Google Scholar] [CrossRef]
  24. Collery, P.; Keppler, B.; Madoulet, C.; Desoize, B. Gallium in cancer treatment. Crit. Rev. Oncol. Hematol. 2002, 42, 283–296. [Google Scholar] [CrossRef]
  25. Jahangoshaei, P.; Hassani, L.; Mohammadi, F.; Hamidi, A.; Mohammadi, K. Investigating the effect of gallium curcumin and gallium diacetylcurcumin complexes on the structure, function and oxidative stability of the peroxidase enzyme and their anticancer and antibacterial activities. J. Biol. Inorg. Chem. 2015, 20, 1135–1146. [Google Scholar] [CrossRef]
  26. Belluti, S.; Orteca, G.; Semeghini, V.; Rigillo, G.; Parenti, F.; Ferrari, E.; Imbriano, C. Potent anti-cancer properties of phthalimide-based curcumin derivatives on prostate tumor cells. Int. J. Mol. Sci. 2019, 20, 28. [Google Scholar] [CrossRef] [Green Version]
  27. Ferrari, E.; Pignedoli, F.; Imbriano, C.; Marverti, G.; Basile, V.; Venturi, E.; Saladini, M. Newly synthesized curcumin derivatives: Crosstalk between chemico-physical properties and biological activity. J. Med. Chem. 2011, 54, 8066–8077. [Google Scholar] [CrossRef]
  28. Pabon, H.J.J. A synthesis of curcumin and related compounds. Recl. Trav. Chim. Pays Bas 2010, 83, 379–386. [Google Scholar] [CrossRef]
  29. Ferrari, E.; Benassi, R.; Sacchi, S.; Pignedoli, F.; Asti, M.; Saladini, M. Curcumin derivatives as metal-chelating agents with potential multifunctional activity for pharmaceutical applications. J. Inorg. Biochem. 2014, 139, 38–48. [Google Scholar] [CrossRef]
  30. Payton, F.; Sandusky, P.; Alworth, W.L. NMR study of the solution structure of curcumin. J. Nat. Prod. 2007, 70, 143–146. [Google Scholar] [CrossRef]
  31. Benassi, R.; Ferrari, E.; Grandi, R.; Lazzari, S.; Saladini, M. Synthesis and characterization of new β-diketo derivatives with iron chelating ability. J. Inorg. Biochem. 2007, 101, 203–213. [Google Scholar] [CrossRef] [PubMed]
  32. Rapalli, V.K.; Kaul, V.; Gorantla, S.; Waghule, T.; Dubey, S.K.; Pandey, M.M.; Singhvi, G. UV Spectrophotometric method for characterization of curcumin loaded nanostructured lipid nanocarriers in simulated conditions: Method development, in-vitro and ex-vivo applications in topical delivery. Spectrochim. Acta Part A Mol. Biomol. Spectrosc. 2020, 224, 117392. [Google Scholar] [CrossRef] [PubMed]
  33. Dias Pereira, C.I.; Fabiano de Freitas, C.; Braga, T.L.; Braga, G.; Gonçalves, R.S.; Tessaro, A.L.; Graton Mikcha, J.M.; Hioka, N.; Caetano, W. Concise behavior of Curcumin in water-ethanol: Critical Water Aggregation Percentage and multivariate analysis of protolytic equilibria. Dyes Pigment. 2022, 197, 143–7208. [Google Scholar] [CrossRef]
  34. Gans, P.; Sabatini, A.; Vacca, A. To improve accuracy of the calculated pKa values. Ann. Chim. 1999, 89, 45–49. [Google Scholar]
  35. Rigamonti, L.; Orteca, G.; Asti, M.; Basile, V.; Imbriano, C.; Saladini, M.; Ferrari, E. New curcumin-derived ligands and their affinity towards Ga3+, Fe3+ and Cu2+: Spectroscopic studies on complex formation and stability in solution. New J. Chem. 2018, 42, 7680–7690. [Google Scholar] [CrossRef]
  36. Gans, P.; Sabatini, A.; Vacca, A. Investigation of equilibria in solution. Determination of equilibrium constants with the HYPERQUAD suite of programs. Talanta 1996, 43, 1739–1753. [Google Scholar] [CrossRef]
  37. Harris, W.R.; Carrano, C.J.; Raymond, K.N. Coordination Chemistry of Microbial Iron Transport Compounds. 16. Isolation, Characterization, and Formation Constants of Ferric Aerobactin. J. Am. Chem. Soc. 1979, 101, 2722–2727. [Google Scholar] [CrossRef]
  38. Borgias, B.; Hugi, A.D.; Raymond, K.N. Isomerization and Solution Structures of Desferrioxamine B Complexes of Al3+ and Ga3+. Inorg. Chem. 1989, 28, 3538–3545. [Google Scholar] [CrossRef]
  39. Notni, J.; Hermann, P.; Havlíčková, J.; Kotek, J.; Kubíček, V.; Plutnar, J.; Loktionova, N.; Riss, P.J.; Rösch, F.; Lukeš, I. A triazacyclononane-based bifunctional phosphinate ligand for the preparation of multimeric 68Ga tracers for positron emission tomography. Chemistry 2010, 16, 7174–7185. [Google Scholar] [CrossRef]
  40. Toporivska, Y.; Mular, A.; Piasta, K.; Ostrowska, M.; Illuminati, D.; Baldi, A.; Albanese, V.; Pacifico, S.; Fritsky, I.O.; Remelli, M.; et al. Thermodynamic Stability and Speciation of Ga(III) and Zr(IV) Complexes with High-Denticity Hydroxamate Chelators. Inorg. Chem. 2021, 60, 13332–13347. [Google Scholar] [CrossRef]
  41. Asti, M.; Ferrari, E.; Croci, S.; Atti, G.; Rubagotti, S.; Iori, M.; Capponi, P.C.; Zerbini, A.; Saladini, M.; Versari, A. Synthesis and Characterization of 68 Ga-Labeled Curcumin and Curcuminoid Complexes as Potential Radiotracers for Imaging of Cancer and Alzheimer’s Disease. Inorg. Chem. 2014, 53, 4922–4933. [Google Scholar] [CrossRef] [PubMed]
  42. Rubagotti, S.; Croci, S.; Ferrari, E.; Orteca, G.; Iori, M.; Capponi, P.C.; Versari, A.; Asti, M. Uptake of Ga-curcumin derivatives in different cancer cell lines: Toward the development of new potential 68Ga-labelled curcuminoids-based radiotracers for tumour imaging. J. Inorg. Biochem. 2017, 173, 113–119. [Google Scholar] [CrossRef] [PubMed]
  43. El Deeb, S.; Ma, B.N.; Baecker, D.; Gust, R. Studies on the stability of the anticancer-active [N,N’-bis(salicylidene)-1,2-phenylenediamine]chloridoiron(III) complex under pharmacological-like conditions. Inorg. Chim. Acta 2019, 487, 76–80. [Google Scholar] [CrossRef]
  44. Zacchi, P.; Schioppa, T.; Stein, J.; Farrag, K.; Aksan, A.; Aksan, S.; Schroeder, O. Flipside of the Coin: Iron Deficiency and Colorectal Cancer. Front. Immunol. 2021, 12, 635899. [Google Scholar] [CrossRef]
  45. Pandrangi, S.L.; Chittineedi, P.; Chikati, R.; Lingareddy, J.R.; Nagoor, M.; Ponnada, S.K. Role of dietary iron revisited: In metabolism, ferroptosis and pathophysiology of cancer. Am. J. Cancer Res. 2022, 12, 974. [Google Scholar]
  46. Anderson, G.J.; Frazer, D.M. Current understanding of iron homeostasis. Am. J. Clin. Nutr. 2017, 106, 1559S–1566S. [Google Scholar] [CrossRef] [Green Version]
  47. Ferrari, E.; Asti, M.; Benassi, R.; Pignedoli, F.; Saladini, M. Metal binding ability of curcumin derivatives: A theoretical vs. experimental approach. Dalt. Trans. 2013, 42, 5304–5313. [Google Scholar] [CrossRef]
  48. Belluti, S.; Basile, V.; Benatti, P.; Ferrari, E.; Marverti, G.; Imbriano, C. Concurrent inhibition of enzymatic activity and NF-Y-mediated transcription of Topoisomerase-IIa by bis-DemethoxyCurcumin in cancer cells. Cell Death Dis. 2013, 4, e756-11. [Google Scholar] [CrossRef] [Green Version]
  49. Choi, S.R.; Britigan, B.E.; Narayanasamy, P. Dual Inhibition of Klebsiella pneumoniae and Pseudomonas aeruginosa Iron Metabolism Using Gallium Porphyrin and Gallium Nitrate. ACS Infect. Dis. 2019, 5, 1559–1569. [Google Scholar] [CrossRef]
  50. Payen, V.L.; Mina, E.; Van Hée, V.F.; Porporato, P.E.; Sonveaux, P. Monocarboxylate transporters in cancer. Mol. Metab. 2020, 33, 48–66. [Google Scholar] [CrossRef]
  51. Lee, J.Y.; Lee, I.K.; Chang, W.J.; Ahn, S.M.; Lim, S.H.; Kim, H.S.; Yoo, K.H.; Jung, K.S.; Song, H.N.; Cho, J.H.; et al. MCT4 as a potential therapeutic target for metastatic gastric cancer with peritoneal carcinomatosis. Oncotarget 2016, 7, 43492–43503. [Google Scholar] [CrossRef] [PubMed] [Green Version]
  52. Paolino, D.; Tudose, A.; Celia, C.; Di Marzio, L.; Cilurzo, F.; Mircioiu, C. Mathematical Models as Tools to Predict the Release Kinetic of Fluorescein from Lyotropic Colloidal Liquid Crystals. Material 2019, 12, 693. [Google Scholar] [CrossRef] [PubMed] [Green Version]
  53. Hakobyan, S.; Boily, J.F.; Ramstedt, M. Proton and gallium(III) binding properties of a biologically active salicylidene acylhydrazide. J. Inorg. Biochem. 2014, 138, 9–15. [Google Scholar] [CrossRef] [PubMed] [Green Version]
  54. Gama, S.; Frontauria, M.; Ueberschaar, N.; Brancato, G.; Milea, D.; Sammartano, S.; Plass, W. Cite this. New J. Chem. 2018, 42, 8062. [Google Scholar] [CrossRef]
  55. Belluti, S.; Semeghini, V.; Rigillo, G.; Ronzio, M.; Benati, D.; Torricelli, F.; Reggiani Bonetti, L.; Carnevale, G.; Grisendi, G.; Ciarrocchi, A.; et al. Alternative splicing of NF-YA promotes prostate cancer aggressiveness and represents a new molecular marker for clinical stratification of patients. J. Exp. Clin. Cancer Res. 2021, 40, 362. [Google Scholar] [CrossRef]
Figure 1. Chemical structures of curcuminoids and atom numbering for NMR signals’ assignment.
Pharmaceuticals 15 00854 g001
Figure 2. Stability profiles of the curcumin derivatives in simulated physiological conditions (PBS, 0.01 M; NaCl, 0.1 M; pH = 7.4; 37 °C in darkness). Residual percentage was calculated as At × 100/A0, where At and A0 stand for absorbance at λmax at time t and time zero, respectively.
Pharmaceuticals 15 00854 g002
Figure 3. Schematic representation of tautomeric equilibria.
Pharmaceuticals 15 00854 g003
Figure 4. 1H NMR spectrum of compound 1 in MeOD-d4 at 298 K (at 600 MHz). Blue and red arrows highlight the KK end KE tautomeric forms, respectively. * Enol vinyl signal.
Pharmaceuticals 15 00854 g004
Figure 5. UV–Vis spectra of 7 at 25 °C in an aqueous solution (L = 50 μM) with increasing pH.
Pharmaceuticals 15 00854 g005
Figure 6. Species distribution curves for 1 (panel A), 4 (panel B) and 7 (panel C) at 25 °C ([L]total = 10−4 mol L−1). The data were calculated on the basis of the logβMLH values reported in Table 2.
Pharmaceuticals 15 00854 g006
Figure 7. 1H NMR spectra of compound 1 in MeOD-d4 at 298 K (at 600 MHz) at increasing addition of a Ga3+ MeOD-d4 solution up to the metal-to-ligand 1:1.5 molar ratio. The stars highlight resonances of protons H-1, H-3 and H-4 in the free ligand (blue), M:L 1:2 complex (red) and M:L 1:1 complex (black).
Pharmaceuticals 15 00854 g007
Figure 8. 1H,13C HMBC NMR spectra in MeOD-d4 at 298 K (at 600 MHz) of compound 1 (left) and its gallium(III) complex with the metal-to-ligand 1:1 molar ratio (right).
Pharmaceuticals 15 00854 g008
Figure 9. Spectrophotometric titration of 4 with a Ga3+ solution in acidic conditions (pH ~5) up until the M/L 1:1.3 is reached (left) and plots of absorbance at different λmax vs. M/L (right) at 25 °C ([L] = 50 μM).
Pharmaceuticals 15 00854 g009
Figure 10. UV–Vis spectra of the Ga3+: 6 1:1 molar ratio at 25 °C (L = 50 μM) on increasing pH. Panel (A)—pH range of 3–8; panel (B)—pH range of 8–12; panel (C)—plot of absorbance at 405 nm vs. pH for the free ligand (circles) and the metal-ligand system (triangles).
Pharmaceuticals 15 00854 g010
Figure 11. Species distribution curves for 1 (panel A), 4 (panel B) and 7 (panel C) at 25 °C (Ltotal = 10 μM; Ga3+total = 1 μM). The data were calculated based on the logβ values reported in Table 3.
Pharmaceuticals 15 00854 g011
Figure 12. Biological activity of the selected curcumin derivatives on human colorectal HCT116 cancer cells. Panel (A): dose-dependent effect of curcumin derivatives administration for 48 h on the cell growth of HCT116 cancer cells as assessed by the MTT assay. Panel (B): GI50 values and statistical significance compared to curcumin are indicated as the means ± SEM (unpaired t-test: ** p < 0.01, **** p < 0.0001).
Pharmaceuticals 15 00854 g012
Table 1. Amount (molar percentage, %) of the keto–enol (KE) and diketo (KK) forms estimated based on the 1H NMR data acquired in MeOD-d4 at 298 K as reported in Experimental Section 3.5. * Percentage of KE includes the KE form of the Z isomer (6%).
CompoundKE (%)KK (%)
1964
288 *12
34555
44753
57030
62575
72575
Table 2. Overall protonation constants calculated from spectrophotometric data at 298 K using HypSpec software [34]; pKa values were calculated from logβ values as follows: (HL) pKa1 = logβ011; (H2L) pKa1 = logβ012 − logβ011, pKa2 = logβ011; (H3L) pKa1 = logβ013 − logβ12; pKa2 = logβ012 − logβ011, pKa3 = logβ011; (H4L) pKa1 = logβ14 − logβ13, pKa2 = logβ13 − logβ12, pKa3 = logβ12 − logβ12, pKa4 = logβ11. * Refers to the keto–enol moiety dissociation.
logβMLH1234567
logβ01110.212 (2)10.903 (8)10.88 (2)10.78 (4)10.44 (3)11.42 (2)12.22 (2)
logβ01218.509 (3) 20.29 (2)20.44 (6)20.45 (2)21.12 (6)21.61 (5)
logβ013 28.84 (4)29.44 (6)29.58 (4)29.76 (7)29.98 (4)
logβ014 34.62 (5)34.92 (9)
pKa18.297 (5)10.903 (8) *8.55 (4)9.00 (10)9.13 (6)4.86 (12)4.92 (13)
pKa210.212 (2) * 9.41 (4) *9.66 (12) *10.01 (5)8.64 (13)8.37 (9)
pKa3 10.88 (2)10.78 (4)10.44 (3)9.70 (8) *9.39 (7) *
pKa4 11.42 (2)12.22 (2)
Table 3. Overall stability constants (β) and apparent formation constants (K) calculated from spectrophotometric data at 298 K using HypSpec software [36]. LogK values were estimated starting from the logβMLH ones according to the different number of acid groups as follows: (HL) logK11 = logβ110, logK12 = logβ120, logK13 = logβ130; (H2L) logK11 = logβ111 − logβ11, logK12 = logβ122 − 2logβ11, logK13 = logβ133 − 3logβ11; (H3L) logK11 = logβ112 − logβ12, logK12 = logβ124 − 2logβ12; (H4L) logK11 = logβ112 − logβ12; pGa (−log[Ga3+]free) was calculated at specific conditions ([Ga3+]total = 1 μM, [L]total = 10 μM, pH 7.4 at 25 °C).
1234567
HxLH2LHLH3LH3LH3LH4LH4L
logβ11011.78 (4)8.129 (9)
logβ11117.59 (3)
logβ112 28.28 (3)28.48 (5)28.54 (3)27.79 (5)28.29 (5)
logβ113 34.09 (5)36.51 (6)
logβ12020.30 (5)15.185 (4)
logβ12234.77(3)
logβ124 54.63 (5)55.33 (5)57.00 (1)
logβ13028.37 (7)20.45 (3)
logβ13349.7 (4)
logK117.38 (3)8.129 (9)7.998.048.096.676.68
logK1214.35 (3)15.18514.0514.4516.1
logK1319.1 (4)20.45
pGa19.013.120.821.523.214.015.3
Table 4. Summary of chemical features. * Percentage of the residual ligand after 4 h (ranking). ** Possible formation of gallium hydroxide species.
LigandPrevailing Tautomer
(MeOD-d4)
Stability *pGaPrevailing Species
(pH 5.5)
Prevailing Species
(pH 7.4)
1KE77% (3)19.0[Ga(HL)3][Ga(L)3]3−
2KE83% (1)13.1[Ga(L)3][Ga(L)3]
3KK47% (6)20.8[Ga(H2L)2]+[Ga(H2L)2]+
4KK42% (7)21.5[Ga(H2L)2]+[Ga(H2L)2]+
5KE52% (5)23.4[Ga(H2L)2]+[Ga(H2L)2]+
6KK73% (4)14.0[Ga(H2L)2]+[Ga(H2L)2]+ **
7KK79% (2)15.3[Ga(H2L)2]+[Ga(H2L)2]+ **
Publisher’s Note: MDPI stays neutral with regard to jurisdictional claims in published maps and institutional affiliations.

