
Development and Validation of a Novel LC-MS/MS Method for the Simultaneous Determination of Abemaciclib, Palbociclib, Ribociclib, Anastrozole, Letrozole, and Fulvestrant in Plasma Samples: A Prerequisite for Personalized Breast Cancer Treatment

 , , , and
Abstract
:1. Introduction
2. Results
2.1. Method Development
2.1.1. Optimization of the Sample Preparation Procedure
2.1.2. Optimization of the Chromatographic Conditions
2.1.3. Optimization of the Detection Conditions
2.2. Method Validation
2.2.1. Selectivity
2.2.2. Carry-Over
2.2.3. Matrix Effect
2.2.4. Stability
2.2.5. Linearity and Calibration Range
2.2.6. Precision and Accuracy
2.3. Method Application
2.3.1. Clinical Application to Therapeutic Drug Monitoring
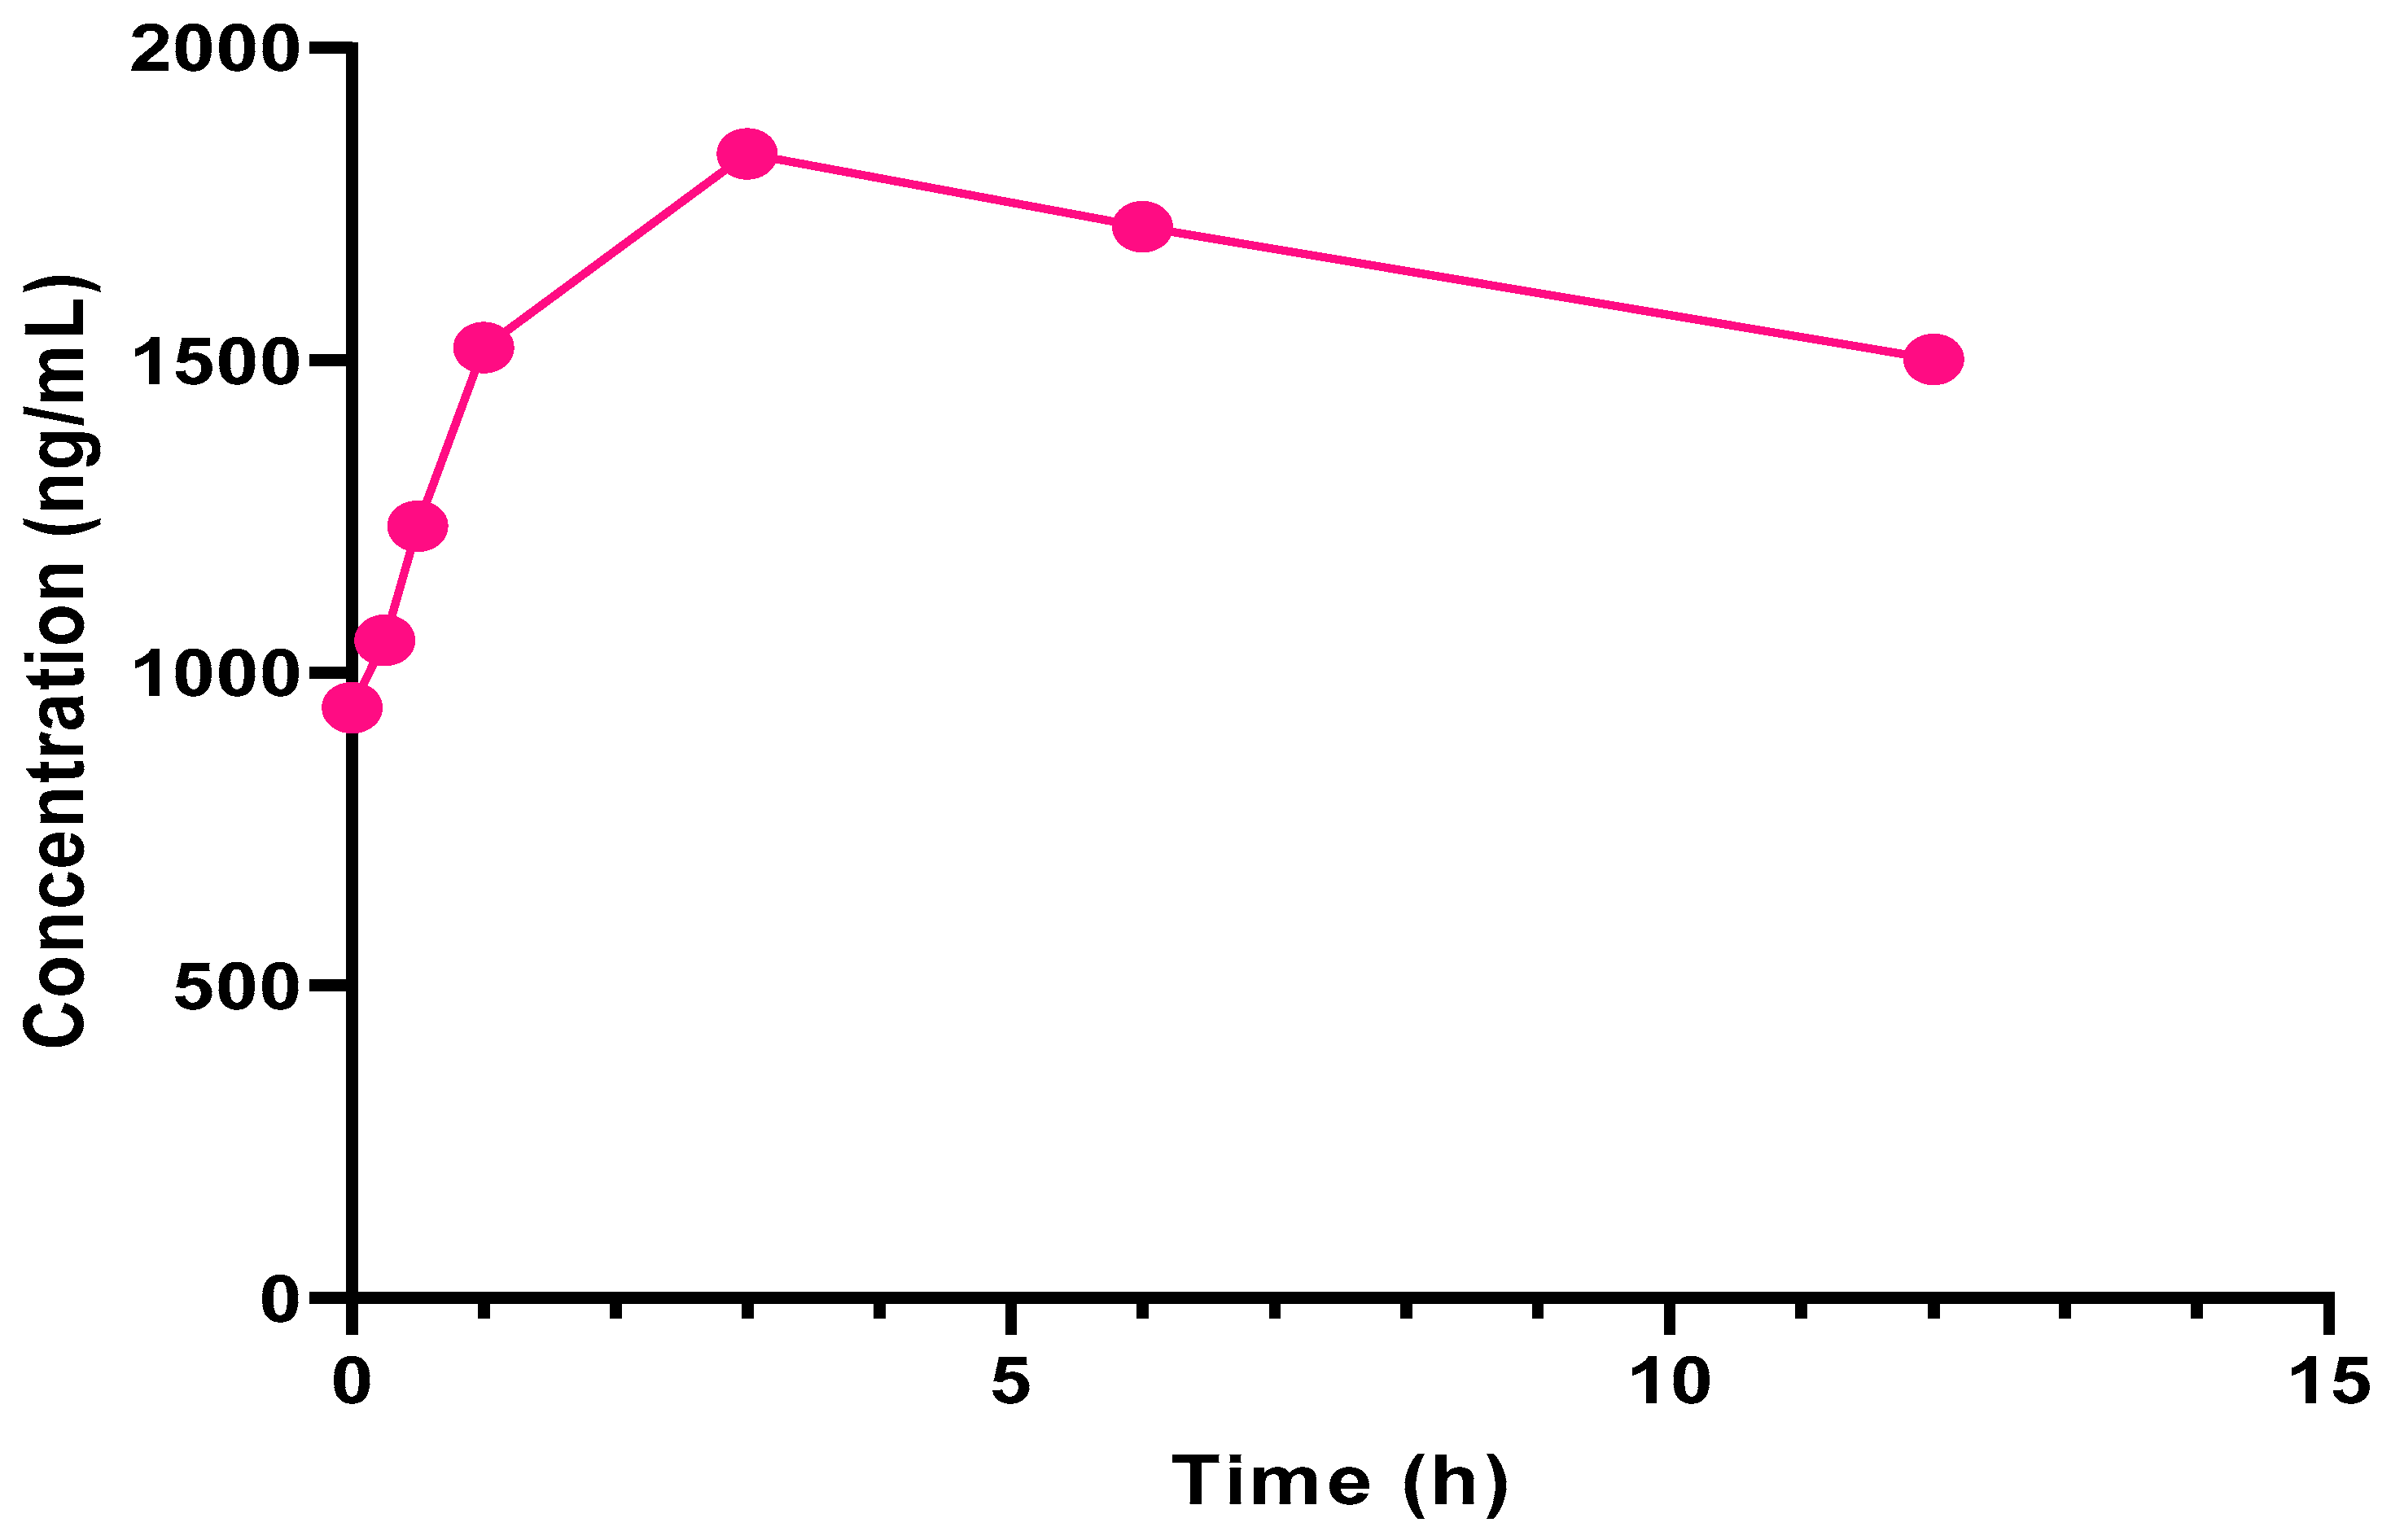
2.3.2. Application to Clinical Pharmacokinetic Evaluation
3. Materials and Methods
3.1. Chemicals and Reagents
3.2. Stock and Working Solutions
3.3. Blank and Patient Plasma
3.4. Sample Preparation Procedure
3.5. Instruments and Software
4. Conclusions
Supplementary Materials
Author Contributions
Funding
Institutional Review Board Statement
Informed Consent Statement
Data Availability Statement
Acknowledgments
Conflicts of Interest
References
- Noone, A.M.; Howlander, N.; Krapcho, M.; Miller, D.; Brest, A.; Yu, M.; Ruhl, J.; Tatalovich, Z.; Mariotto, A.; Lewis, D.R.; et al. SEER Cancer Statistics Review, 1975–2015. 2018. Available online: https://seer.cancer.gov/csr/1975_2015/ (accessed on 17 February 2022).
- Barrios, C.H.; Cardoso, F.; Costa, A.; Norton, L.; Senkus, E.; Aapro, M.; Andr, F.; Bergh, J.; Biganzoli, L.; Blackwell, K.L.; et al. ESO-ESMO 2nd international consensus guidelines for advanced breast cancer (ABC2). Breast 2014, 23, 489–502. [Google Scholar] [CrossRef]
- Cardoso, F.; Spence, D.; Mertz, S.; Corneliussen-James, D.; Sabelko, K.; Gralow, J.; Cardoso, M.-J.; Peccatori, F.; Paonessa, D.; Benares, A.; et al. Global analysis of advanced/metastatic breast cancer: Decade report (2005–2015). Breast 2018, 39, 131–138. [Google Scholar] [CrossRef]
- Shah, A.N.; Metzger, O.; Bartlett, C.H.; Liu, Y.; Huang, X.; Cristofanilli, M. Hormone Receptor-Positive/Human Epidermal Growth Receptor 2-Negative Metastatic Breast Cancer in Young Women: Emerging Data in the Era of Molecularly Targeted Agents. Oncologist 2020, 25, e900–e908. [Google Scholar] [CrossRef] [PubMed] [Green Version]
- O’Shaughnessy, J.; Petrakova, K.; Sonke, G.S.; Conte, P.; Arteaga, C.L.; Cameron, D.A.; Hart, L.L.; Villanueva, C.; Jakobsen, E.; Beck, J.T.; et al. Ribociclib plus letrozole versus letrozole alone in patients with de novo HR+, HER2− advanced breast cancer in the randomized MONALEESA-2 trial. Breast Cancer Res. Treat. 2018, 168, 127–134. [Google Scholar] [CrossRef] [Green Version]
- Iwata, H.; Im, S.-A.; Masuda, N.; Im, Y.-H.; Inoue, K.; Rai, Y.; Nakamura, R.; Kim, J.H.; Hoffman, J.T.; Zhang, K.; et al. PALOMA-3: Phase III Trial of Fulvestrant with or Without Palbociclib in Premenopausal and Postmenopausal Women With Hormone Receptor–Positive, Human Epidermal Growth Factor Receptor 2–Negative Metastatic Breast Cancer That Progressed on Prior Endocrine Th. J. Glob. Oncol. 2017, 3, 289–303. [Google Scholar] [CrossRef] [PubMed]
- Dickler, M.N.; Tolaney, S.M.; Rugo, H.S.; Cortes, J.; Dieras, V.; Patt, D.; Wildiers, H.; Hudis, C.A.; O’Shaughnessy, J.; Zamora, E.; et al. MONARCH 1, a phase II study of abemaciclib, a CDK4 and CDK6 inhibitor, as a single agent, n patients with refractory HR+/HER2− metastatic breast cancer. Clin. Cancer Res. 2017, 23, 5218–5224. [Google Scholar] [CrossRef] [Green Version]
- Braal, C.L.; Jongbloed, E.M.; Wilting, S.M.; Mathijssen, R.H.J.; Koolen, S.L.W.; Jager, A. Inhibiting CDK4/6 in Breast Cancer with Palbociclib, Ribociclib, and Abemaciclib: Similarities and Differences. Drugs 2021, 81, 317–331. [Google Scholar] [CrossRef]
- Jazieh, K.A.; Budd, G.T.; Dalpiaz, N.; Abraham, J.; Budd, G.T. Can CDK4/6 inhibitors cause fatal lung injury? Expert Rev. Anticancer. Ther. 2019, 19, 917–919. [Google Scholar] [CrossRef]
- Pernas, S.; Tolaney, S.M.; Winer, E.P.; Goel, S. CDK4/6 Inhibition in Breast Cancer: Current Practice and Future Directions. Ther. Adv. Med. Oncol. 2018, 10, 1–15. [Google Scholar] [CrossRef] [Green Version]
- Thill, M.; Schmidt, M. Management of adverse events during cyclin-dependent kinase 4/6 (CDK4/6) inhibitor-based treatment in breast cancer. Ther. Adv. Med. Oncol. 2018, 10, 1–12. [Google Scholar] [CrossRef] [Green Version]
- Zuidema, S.; Desar, I.M.E.; Erp, N.P.; Kievit, W. Optimizing the dose in patients treated with imatinib as first line treatment for gastrointestinal stromal tumors: A cost-effectiveness study. Br. J. Clin. Pharmacol. 2019, 85, 1994–2001. [Google Scholar] [CrossRef] [PubMed]
- Sato, Y.; Shigeta, K.; Hirasawa, T.; Sato, T.; Ogura, J.; Maekawa, M.; Ebata, A.; Hamanaka, Y.; Tada, H.; Ishida, T.; et al. Establishment of an analytical method for simultaneous quantitation of CDK4/6 inhibitors, aromatase inhibitors, and an estrogen receptor antagonist in human plasma using LC-ESI-MS/MS. J. Chromatogr. B Anal. Technol. Biomed. Life Sci. 2021, 1173, 122655. [Google Scholar] [CrossRef]
- Mueller-Schoell, A.; Groenland, S.L.; Scherf-Clavel, O.; van Dyk, M.; Huisinga, W.; Michelet, R.; Jaehde, U.; Steeghs, N.; Huitema, A.D.R.; Kloft, C. Therapeutic drug monitoring of oral targeted antineoplastic drugs. Eur. J. Clin. Pharmacol. 2021, 77, 441–464. [Google Scholar] [CrossRef] [PubMed]
- Al-Shehri, M.; Hefnawy, M.; Abuelizz, H.; Alzamil, A. Evaluation of the Pharmacokinetics of the Simultaneous Quantification of Letrozole and Palbociclib in Rat Plasma by a Developed and Validated HPLC-PDA. Acta Chromatogr. 2020, 32, 170–178. [Google Scholar] [CrossRef]
- Dange, Y.; Bhinge, S.; Salunkhe, V. Optimization and validation of RP-HPLC method for simultaneous estimation of palbociclib and letrozole. Toxicol. Mech. Methods 2018, 28, 187–194. [Google Scholar] [CrossRef]
- Posocco, B.; Buzzo, M.; Poetto, A.S.; Orleni, M.; Gagno, S.; Zanchetta, M.; Iacuzzi, V.; Guardascione, M.; Puglisi, F.; Basile, D.; et al. Simultaneous quantification of palbociclib, ribociclib and letrozole in human plasma by a new LC-MS/MS method for clinical application. PLoS ONE 2020, 15, e0228822. [Google Scholar] [CrossRef] [PubMed] [Green Version]
- Poetto, A.S.; Posocco, B.; Gagno, S.; Orleni, M.; Zanchetta, M.; Iacuzzi, V.; Canil, G.; Buzzo, M.; Montico, M.; Guardascione, M.; et al. A new dried blood spot LC-MS/MS method for therapeutic drug monitoring of palbociclib, ribociclib, and letrozole in patients with cancer. J. Chromatogr. B Anal. Technol. Biomed. Life Sci. 2021, 1185, 122985. [Google Scholar] [CrossRef]
- Martínez-Chávez, A.; Rosing, H.; Hillebrand, M.; Tibben, M.; Schinkel, A.H.; Beijnen, J.H. Development and validation of a bioanalytical method for the quantification of the CDK4/6 inhibitors abemaciclib, palbociclib, and ribociclib in human and mouse matrices using liquid chromatography-tandem mass spectrometry. Anal. Bioanal. Chem. 2019, 411, 5331–5345. [Google Scholar] [CrossRef] [Green Version]
- Nalanda, R.B.; Rao, A.S.; Sankar, D.G. Determination of palbociclib in human plasma using high performance liquid chromatography—Ultraviolet detection. Int. J. Pharm. Sci. Res. 2018, 9, 3883–3888. [Google Scholar] [CrossRef]
- Paul, D.; Chandrakala, P.; Surendran, S.; Bitla, P.; Satheeshkumar, N. Pharmacokinetic interaction study of novel combination of palbociclib and sorafenib for hepatocellular carcinoma in SD rats. J. Chromatogr. B Anal. Technol. Biomed. Life Sci. 2019, 1108, 25–31. [Google Scholar] [CrossRef]
- Kala, A.; Patel, Y.T.; Davis, A.; Stewart, C.F. Development and validation of LC–MS/MS methods for the measurement of ribociclib, a CDK4/6 inhibitor, in mouse plasma and Ringer’s solution and its application to a cerebral microdialysis study. J. Chromatogr. B Anal. Technol. Biomed. Life Sci. 2017, 1057, 110–117. [Google Scholar] [CrossRef] [PubMed]
- MarvinSketch—ChemAxon, (n.d.). Available online: https://www.chemaxon.com/products/marvin/marvinsketch/ (accessed on 14 February 2022).
- Samant, T.S.; Dhuria, S.; Lu, Y.; Laisney, M.; Yang, S.; Grandeury, A.; Mueller-Zsigmondy, M.; Umehara, K.; Huth, F.; Miller, M.; et al. Ribociclib Bioavailability Is Not Affected by Gastric pH Changes or Food Intake: In Silico and Clinical Evaluations. Clin. Pharmacol. Ther. 2018, 104, 374–383. [Google Scholar] [CrossRef] [PubMed] [Green Version]
- Fujiwara, Y.; Tamura, K.; Kondo, S.; Tanabe, Y.; Iwasa, S.; Shimomura, A.; Kitano, S.; Ogasawara, K.; Turner, P.K.; Mori, J.; et al. Phase 1 study of abemaciclib, an inhibitor of CDK 4 and 6, as a single agent for Japanese patients with advanced cancer. Cancer Chemother. Pharmacol. 2016, 78, 281–288. [Google Scholar] [CrossRef]
- Tamura, K.; Mukai, H.; Naito, Y.; Yonemori, K.; Kodaira, M.; Tanabe, Y.; Yamamoto, N.; Osera, S.; Sasaki, M.; Mori, Y.; et al. Phase I study of palbociclib, a cyclin-dependent kinase 4/6 inhibitor, in Japanese patients. Cancer Sci. 2016, 107, 755–763. [Google Scholar] [CrossRef] [PubMed] [Green Version]
- Dowsett, M.; Cuzick, J.; Howell, A.; Jackson, I. Pharmacokinetics of anastrozole and tamoxifen alone, and in combination, during adjuvant endocrine therapy for early breast cancer in postmenopausal women: A sub-protocol of the “ArimidexTM and tamoxifen alone or in combination” (ATAC) trial. Br. J. Cancer 2001, 85, 317–324. [Google Scholar] [CrossRef] [Green Version]
- Desta, Z.; Kreutz, Y.; Nguyen, A.; Li, L.; Skaar, T.; Kamdem, L.; Henry, N.; Hayes, D.; Storniolo, A.; Stearns, V.; et al. Plasma Letrozole Concentrations in Postmenopausal Women with Breast Cancer Are Associated with CYP2A6 Genetic Variants, Body Mass Index, and Age. Clin. Pharmacol. Ther. 2011, 90, 693–700. [Google Scholar] [CrossRef] [PubMed] [Green Version]
- European Medicines Agency (EMA), EPAR Product Information: Faslodex, (n.d.). Available online: https://www.ema.europa.eu/en/documents/product-information/faslodex-epar-product-information_en.pdf (accessed on 15 February 2022).
- Mendes, G.D.; Hamamoto, D.; Ilha, J.; Pereira, A.d.S.; de Nucci, G. Anastrozole quantification in human plasma by high-performance liquid chromatography coupled to photospray tandem mass spectrometry applied to pharmacokinetic studies. J. Chromatogr. B Anal. Technol. Biomed. Life Sci. 2007, 850, 553–559. [Google Scholar] [CrossRef]
- Balaram, V.M.; Parmar, D.; Teja, B.B.; Rathnam, S.; Rao, J.V.; Dasandi, B. Sensitive and rapid high-performance liquid chromatography tandem mass spectrometry method for estimation of fulvestrant in rabbit plasma. Biomed. Chromatogr. 2010, 24, 863–867. [Google Scholar] [CrossRef]
- European Medicines Agency, Guideline on Bioanalytical Method Validation. 2015. Available online: https://www.ema.europa.eu/en/documents/scientific-guideline/guideline-bioanalytical-method-validation_en.pdf (accessed on 18 February 2022).
- International Council for Harmonisation of Technical Requirements for Pharmaceuticals for Human Use, ICH Harmonised Guideline Bioanalytical Method Validation M10. 2019. Available online: https://www.ema.europa.eu/en/documents/scientific-guideline/draft-ich-guideline-m10-bioanalytical-method-validation-step-2b_en.pdf (accessed on 18 February 2022).
- Bao, X.; Wu, J.; Sanai, N.; Li, J. Determination of total and unbound ribociclib in human plasma and brain tumor tissues using liquid chromatography coupled with tandem mass spectrometry. J. Pharm. Biomed. Anal. 2019, 166, 197–204. [Google Scholar] [CrossRef]
- Williams, J.S.; Donahue, S.H.; Gao, H.; Brummel, C.L. Universal LC-MS method for minimized carryover in a discovery bioanalytical setting. Bioanalysis 2012, 4, 1025–1037. [Google Scholar] [CrossRef]
- Beer, B.; Schubert, B.; Oberguggenberger, A.; Meraner, V.; Hubalek, M.; Oberacher, H. Development and validation of a liquid chromatography-tandem mass spectrometry method for the simultaneous quantification of tamoxifen, anastrozole, and letrozole in human plasma and its application to a clinical study. Anal. Bioanal. Chem. 2010, 398, 1791–1800. [Google Scholar] [CrossRef]
- Al-Shehri, M.; Hefnawy, M.; Abuelizz, H.; Alzamil, A.; Mohammed, M.; Alsaif, N.; Almehizia, A.; Alkahtani, H.; Abounassif, M. Development and validation of an UHPLC-MS/MS method for simultaneous determination of palbociclib, letrozole and its metabolite carbinol in rat plasma and pharmacokinetic study application. Arab. J. Chem. 2020, 13, 4024–4034. [Google Scholar] [CrossRef]
- Shao, R.; Yu, L.y.; Lou, H.g.; Ruan, Z.R.; Jiang, B.; Chen, J.l. Development and validation of a rapid LC-MS/MS method to quantify letrozole in human plasma and its application to therapeutic drug monitoring. Biomed. Chromatogr. 2016, 30, 632–637. [Google Scholar] [CrossRef] [PubMed]
- Tate, S.C.; Sykes, A.K.; Kulanthaivel, P.; Chan, E.M.; Turner, P.K.; Cronier, D.M. A Population Pharmacokinetic and Pharmacodynamic Analysis of Abemaciclib in a Phase I Clinical Trial in Cancer Patients. Clin. Pharmacokinet. 2018, 57, 335–344. [Google Scholar] [CrossRef] [PubMed]
- European Medicines Agency (EMA). Assessment Report: Kisqali. 2018. Available online: www.ema.europa.eu/contact (accessed on 15 February 2022).


| Analyte | RIB | ABE | PAL | ANA | LET | FUL |
|---|---|---|---|---|---|---|
| LOD 1 DAD | 30 | 40 | 120 | 1600 | 140 | 6190 |
| LOD FLD | ND | ND | ND | 900 | 220 | 600 |
| LOD MS | 20 | 8 | 1 | <0.5 2 | 1 | 1.5 |
| Expected literature range Cmin–Cmax | 711–3500 [24] | 102.65–1381 [25] | 72.8–185.5 [26] | 22–52.6 [27] | 28.4–349.2 [28] | 16–25 [29] |
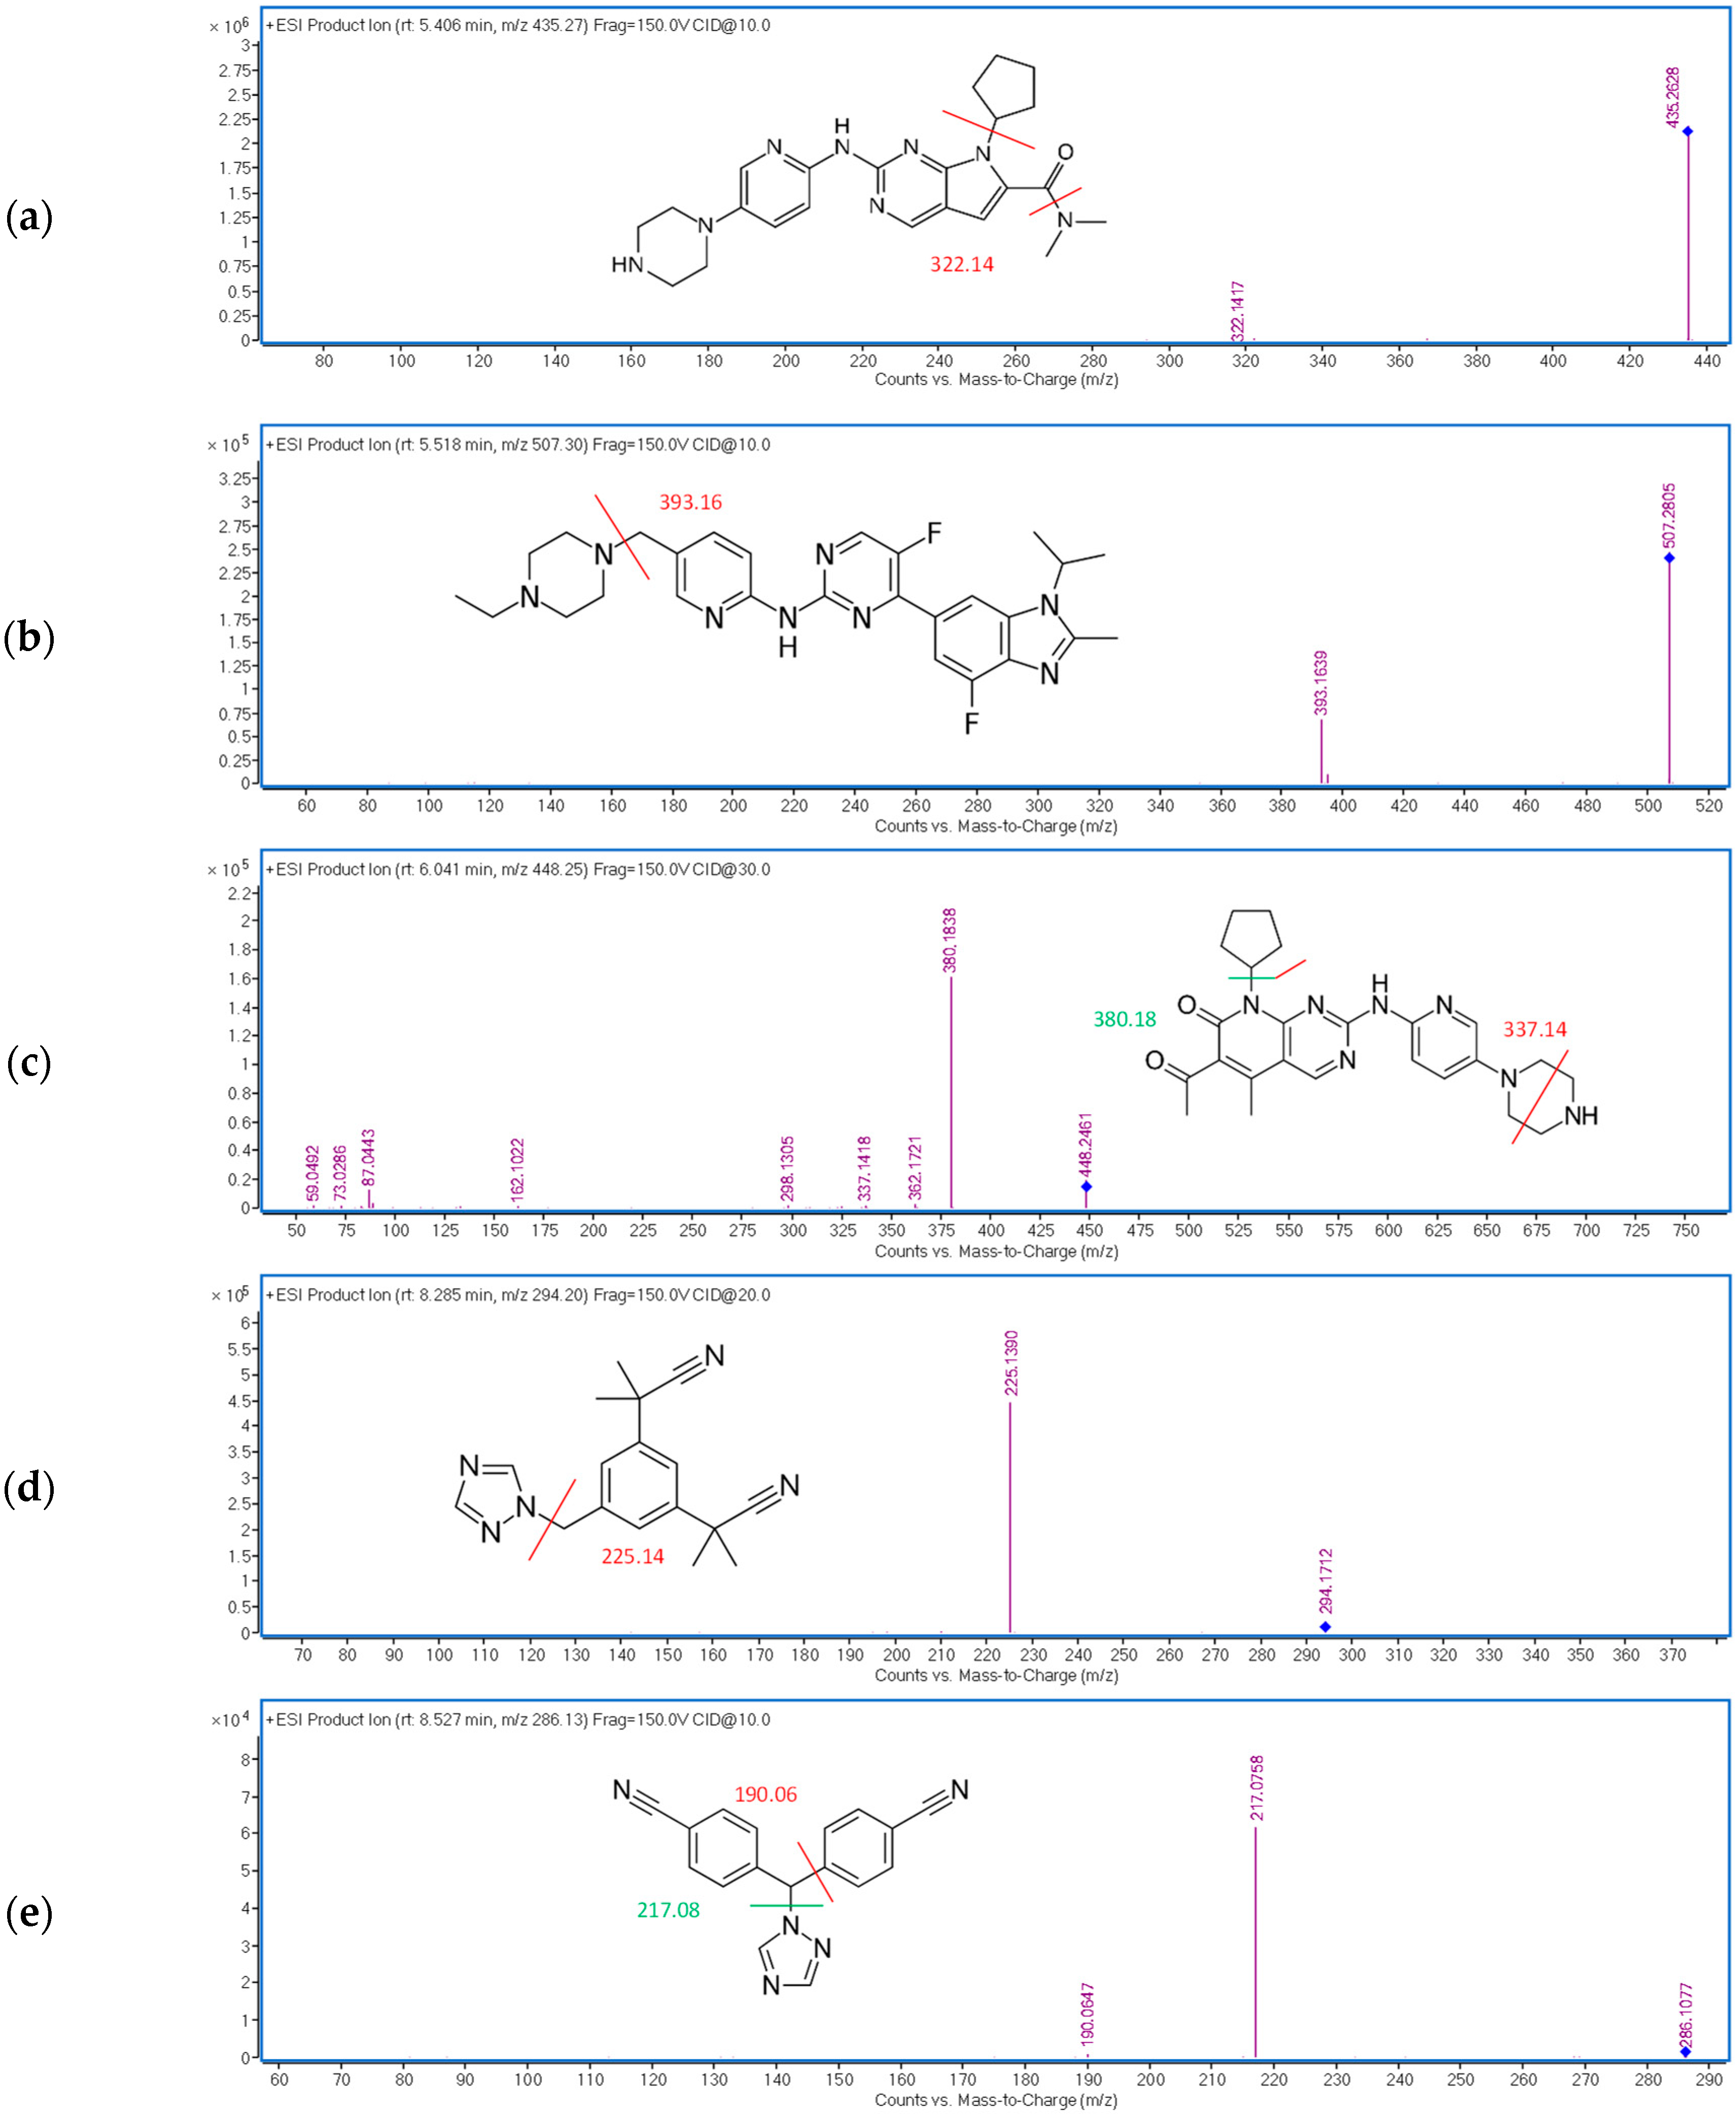
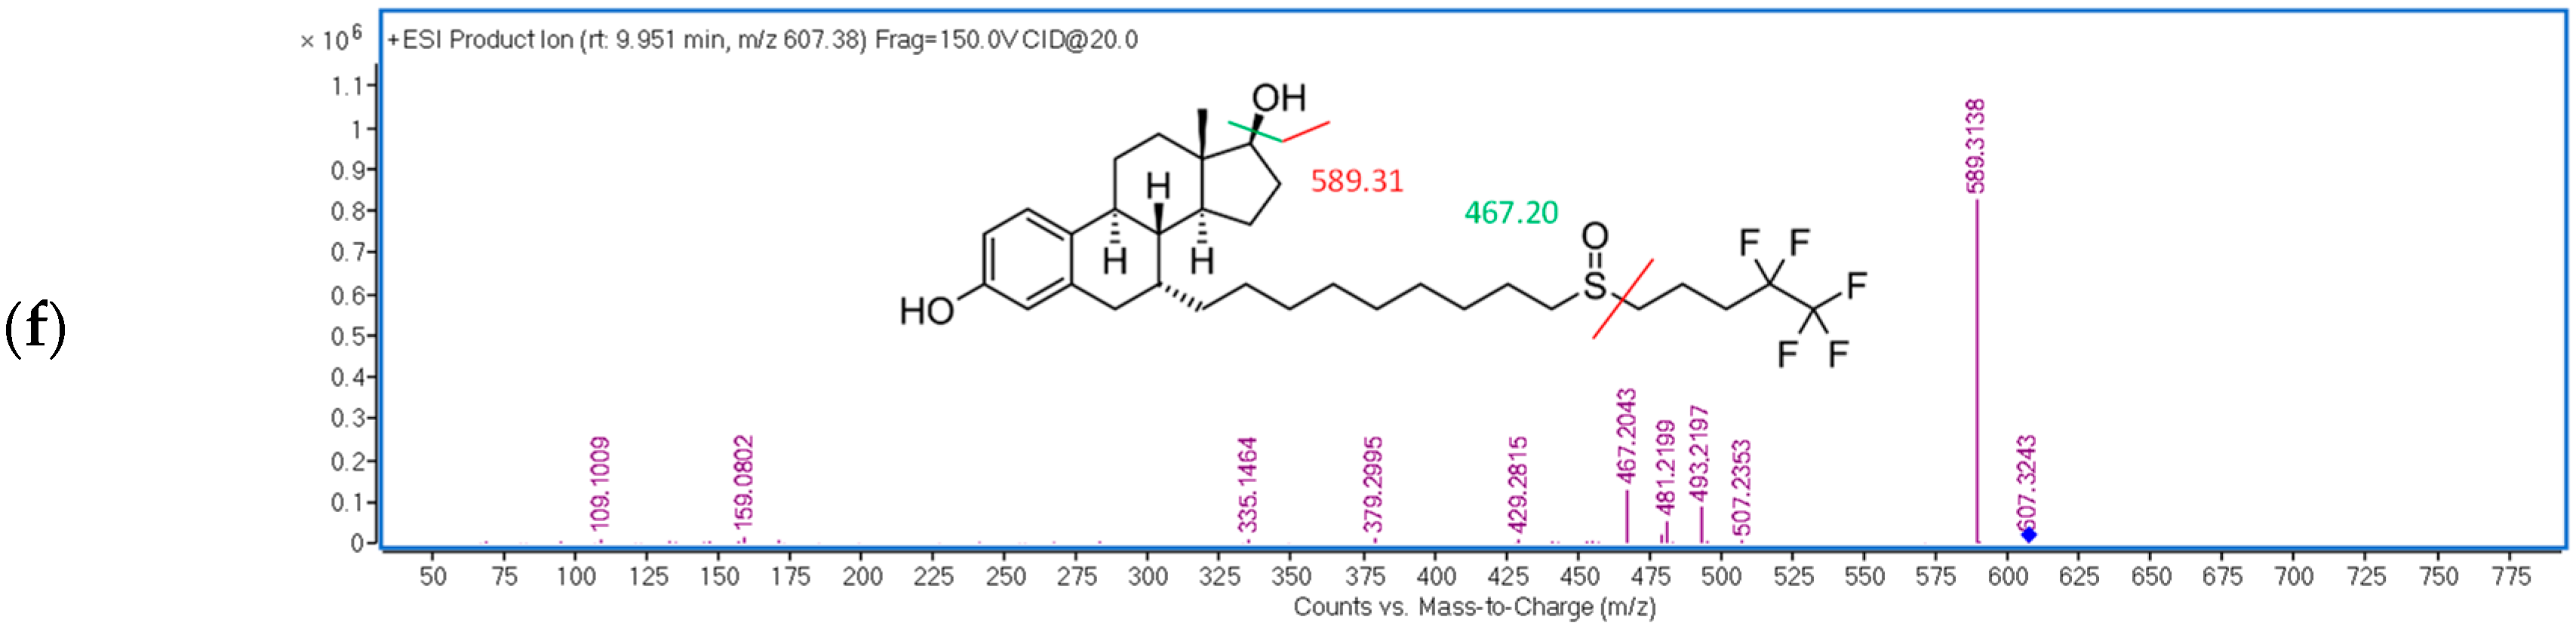
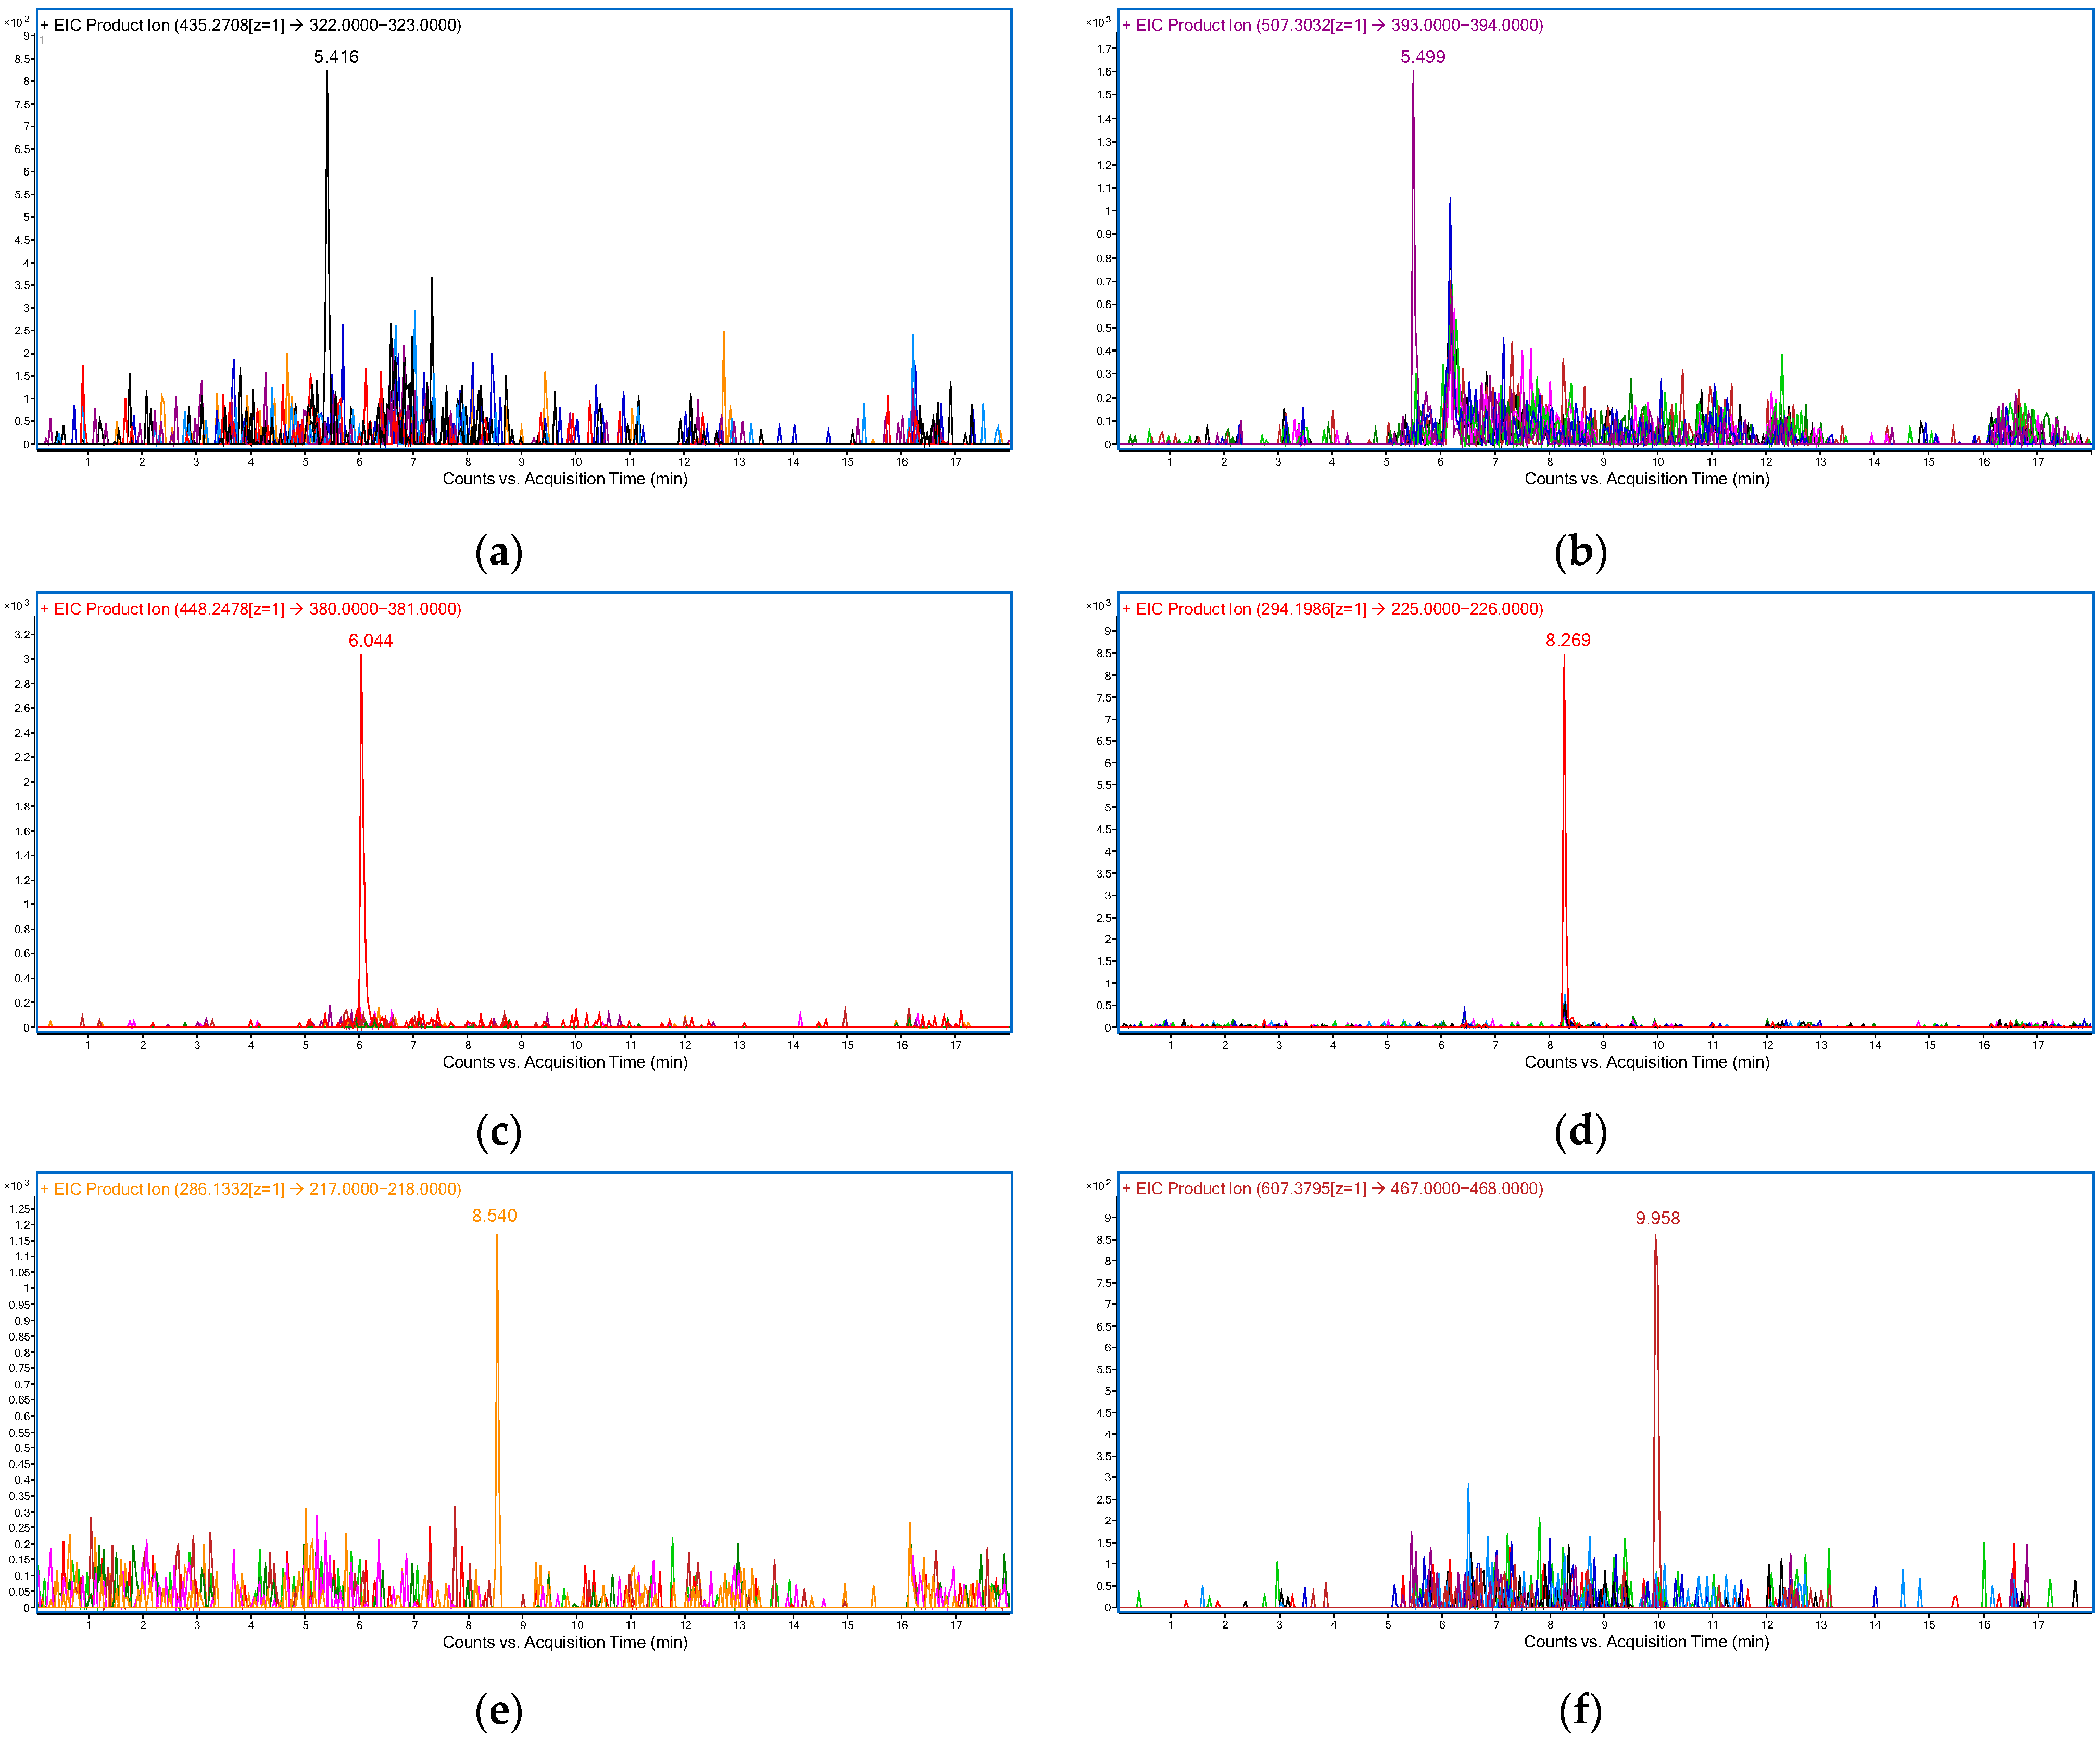
| Analyte | tR (min) | CE (eV) | m/z Transition |
|---|---|---|---|
| RIB | 5.4 | 10 | 435.27 → 322.14 |
| ABE | 5.5 | 10 | 507.30 → 393.16 |
| PAL | 6.2 | 30 | 448.25 → 380.18 |
| ANA | 8.2 | 20 | 294.20 → 225.14 |
| LET | 8.5 | 10 | 286.13 → 217.08 |
| FUL | 9.9 | 20 | 607.38 → 467.20 |
| Analyte | Concentration (ng/mL) | Matrix Effect (%) | CV (%) | Analyte | Concentration (ng/mL) | Matrix Effect (%) | CV (%) |
|---|---|---|---|---|---|---|---|
| RIB | 62.5 | 108.34 | 3.15 | ANA | 2.5 | 90.36 | 6.85 |
| 2500 | 102.26 | 2.14 | 100 | 106.78 | 3.69 | ||
| ABE | 37.5 | 77.80 | 6.69 | LET | 6.25 | 83.81 | 9.94 |
| 1500 | 73.10 | 2.47 | 250 | 101.67 | 6.97 | ||
| PAL | 6.25 | 115.74 | 5.70 | FUL | 12.5 | 92.78 | 8.92 |
| 250 | 106.74 | 4.08 | 500 | 101.08 | 6.90 |
| Analyte | Concentration (ng/mL) | Bench Top (2 h, 25 °C) | Auto- Sampler (10 h, 10 °C) | 1 FT Cycle (30 min, −18–25 °C) | 2 FT Cycles (30 min, −18–25 °C) | 3 FT Cycles (30 min, −18–25 °C) | Long-Term (2 Weeks, −18 °C) | |
|---|---|---|---|---|---|---|---|---|
| RIB | 62.5 | Bias (%) | 6.01 | 8.95 | 7.88 | 1.69 | 6.00 | 13.89 |
| CV (%) | 5.07 | 9.50 | 12.89 | 11.16 | 5.02 | 14.77 | ||
| 2500 | Bias (%) | 4.96 | −6.47 | 11.10 | −1.66 | −4.69 | −10.69 | |
| CV (%) | 1.69 | 5.18 | 7.05 | 7.05 | 1.61 | 4.45 | ||
| ABE | 37.5 | Bias (%) | 9.09 | 11.51 | 13.23 | −7.43 | 14.07 | 7.60 |
| CV (%) | 8.04 | 7.41 | 3.47 | 6.89 | 2.55 | 7.84 | ||
| 1500 | Bias (%) | −0.10 | 14.88 | 9.37 | 5.68 | 1.13 | 3.09 | |
| CV (%) | 3.82 | 4.25 | 1.56 | 1.56 | 6.93 | 5.21 | ||
| PAL | 6.2 | Bias (%) | 3.08 | 13.69 | 14.97 | 1.86 | 2.81 | 12.29 |
| CV (%) | 10.27 | 1.35 | 4.99 | 6.62 | 4.84 | 9.95 | ||
| 250 | Bias (%) | −4.37 | 14.95 | 6.35 | −1.65 | −7.90 | −3.08 | |
| CV (%) | 3.35 | 5.32 | 5.95 | 5.95 | 3.84 | 10.44 | ||
| ANA | 2.5 | Bias (%) | −10.33 | 2.27 | −7.88 | −2.80 | −3.98 | 3.09 |
| CV (%) | 5.01 | 11.15 | 1.93 | 4.74 | 5.32 | 3.87 | ||
| 100 | Bias (%) | −0.62 | 4.89 | 6.65 | 8.39 | −0.69 | −0.40 | |
| CV (%) | 2.13 | 2.60 | 2.78 | 2.78 | 6.48 | 8.54 | ||
| LET | 6.25 | Bias (%) | −6.81 | 6.11 | −0.06 | −6.52 | −3.50 | −10.44 |
| CV (%) | 8.64 | 7.01 | 14.71 | 5.53 | 6.79 | 2.90 | ||
| 250 | Bias (%) | 6.16 | −0.29 | 2.07 | −0.26 | −7.61 | −7.75 | |
| CV (%) | 1.66 | 2.95 | 2.80 | 2.80 | 9.51 | 8.45 | ||
| FUL | 12.5 | Bias (%) | −9.36 | 7.38 | −14.59 | −13.24 | −8.90 | −5.01 |
| CV (%) | 14.83 | −3.68 | 10.68 | 14.99 | 4.62 | 9.00 | ||
| 500 | Bias (%) | 2.32 | −8.06 | 2.23 | 4.49 | −7.51 | −1.62 | |
| CV (%) | 1.74 | 1.37 | 8.71 | 8.71 | 7.33 | 4.46 |
| Analyte | RIB | ABE | PAL | ANA | LET | FUL | |
|---|---|---|---|---|---|---|---|
| Range (ng/mL) | 25–5000 | 15–3000 | 3.1–500 | 1–200 | 2.5–500 | 5–1000 | |
| Within-day 1 | Slope | 84.48 | 500.67 | 6194.67 | 27,818.67 | 1235.33 | 664.97 |
| CV (%) | 3.94 | 2.00 | 5.68 | 4.77 | 4.93 | 4.97 | |
| Intercept | 875.13 | −246.27 | −2113.33 | 1840.33 | 356.07 | 452.73 | |
| Between-day 2 | Slope | 78.44 | 459.75 | 5940.75 | 25,972.75 | 1350.25 | 513.63 |
| CV (%) | 7.52 | 40.23 | 10.49 | 15.52 | 9.75 | 27.09 | |
| Intercept | 771.03 | 2342.95 | −3629.25 | 8426.75 | 576.38 | 627.63 | |
| R | 0.9941–0.9985 | 0.9955–0.9983 | 0.9950–0.9991 | 0.9958–0.9990 | 0.9931–0.9996 | 0.9953–0.9984 |
| Intra-Day | Inter-Day | ||||
|---|---|---|---|---|---|
| Analyte | Concentration (ng/mL) | Bias (%) | CV (%) | Bias (%) | CV (%) |
| RIB | 25 | −1.8 | 11.5 | −14.7 | 19.9 |
| 50 | 6.4 | 8.9 | 7.0 | 11.7 | |
| 2000 | 8.5 | 3.7 | −0.1 | 7.9 | |
| 3750 | −1.5 | 3.7 | −7.2 | 8.0 | |
| ABE | 15 | 4.2 | 19.4 | −7.8 | 17.4 |
| 30 | 2.2 | 14.8 | −6.8 | 4.1 | |
| 1200 | 12.3 | 14.6 | 4.4 | 3.2 | |
| 2250 | 14.9 | 3.1 | −12.9 | 5.0 | |
| PAL | 3.1 | 15.4 | 7.1 | 9.5 | 7.9 |
| 6.2 | 10.3 | 6.4 | 9.2 | 8.9 | |
| 250 | 15.0 | 4.6 | 3.1 | 5.1 | |
| 468.8 | 11.1 | 6.0 | −0.3 | 4.3 | |
| ANA | 1 | 8.3 | 3.7 | −0.5 | 6.1 |
| 2 | 4.6 | 9.6 | 3.3 | 6.0 | |
| 80 | 0.1 | 14.3 | −5.4 | 3.9 | |
| 150 | 5.4 | 6.2 | −3.7 | 1.6 | |
| LET | 2.5 | 14.5 | 3.7 | −14.8 | 16.4 |
| 5 | 5.8 | 11.5 | 14.6 | 6.9 | |
| 200 | 6.8 | 7.1 | 4.0 | 7.9 | |
| 375 | 4.2 | 5.1 | −4.9 | 6.0 | |
| FUL | 5 | 3.3 | 16.2 | −2.7 | 11.9 |
| 10 | 11.6 | 14.9 | −14.3 | 13.9 | |
| 400 | 4.6 | 15.0 | −6.3 | 5.4 | |
| 750 | −1.1 | 7.2 | 2.2 | 14.9 | |
| Patient | Sampling Day 1 | CDK4/6 Inhibitor | Plasma Concentration (ng/mL) | Endocrine Agent | Plasma Concentration (ng/mL) |
|---|---|---|---|---|---|
| 1 | NA | ABE (300 mg daily) | 425.79 | LET (2.5 mg daily) | 109.99 |
| 2 | day 24 | RIB (600 mg daily) | 57.43 | LET (2.5 mg daily) | 141.11 |
| 3 | day 16 | RIB (600 mg daily) | 682.16 | LET (2.5 mg daily) | 146.21 |
| 4 | day 1 | RIB (600 mg daily) | 1519.81 | LET (2.5 mg daily) | 139.46 |
| 5 | day 12 | RIB (600 mg daily) | 1192.77 | ANA (1 mg daily) | 43.96 |
| 6 | day 28 | RIB (600 mg daily) | 27.18 | EXE (25 mg daily) | ND |
| 7 | day 27 | RIB (600 mg daily) | 40.67 | FUL (500 mg monthly) | 20.73 |
| 8 | day 27 | PAL (125 mg daily) | 7.55 | FUL (500 mg monthly) | 22.69 |
| 9 | day 28 | PAL (125 mg daily) | <LOQ | FUL (500 mg monthly) | 22.13 |
| 10 | day 23 | PAL (125 mg daily) | <LOD | FUL (500 mg monthly) | 24.56 |
| RIB | ABE | PAL | ANA | LET | FUL | |
|---|---|---|---|---|---|---|
| 1 | 25 | 15 | 2.5 | 1 | 2.5 | 5 |
| 2 | 50 | 30 | 5 | 2 | 5 | 10 |
| 3 | 125 | 75 | 12.5 | 5 | 12.5 | 25 |
| 4 | 250 | 150 | 25 | 10 | 25 | 50 |
| 5 | 750 | 450 | 75 | 30 | 75 | 150 |
| 6 | 1500 | 900 | 150 | 60 | 150 | 300 |
| 7 | 2500 | 1500 | 250 | 100 | 250 | 500 |
| 8 | 3750 | 2250 | 375 | 150 | 375 | 750 |
| 9 | 5000 | 3000 | 500 | 200 | 500 | 1000 |
| t (min) | % B | Flow Rate (mL/min) |
|---|---|---|
| 0 | 15 | 0.4 |
| 8.5 | 100 | 0.4 |
| 10 | 100 | 0.4 |
| 10.5 | 15 | 0.4 |
| 11.3 | 100 | 1 |
| 13 | 100 | 1 |
| 13.2 | 15 | 1 |
| 13.5 | 15 | 0.4 |
| 18 | 15 | 0.4 |
Publisher’s Note: MDPI stays neutral with regard to jurisdictional claims in published maps and institutional affiliations. |
© 2022 by the authors. Licensee MDPI, Basel, Switzerland. This article is an open access article distributed under the terms and conditions of the Creative Commons Attribution (CC BY) license (https://creativecommons.org/licenses/by/4.0/).
Share and Cite
Turković, L.; Bočkor, L.; Ekpenyong, O.; Silovski, T.; Lovrić, M.; Crnković, S.; Nigović, B.; Sertić, M. Development and Validation of a Novel LC-MS/MS Method for the Simultaneous Determination of Abemaciclib, Palbociclib, Ribociclib, Anastrozole, Letrozole, and Fulvestrant in Plasma Samples: A Prerequisite for Personalized Breast Cancer Treatment. Pharmaceuticals 2022, 15, 614. https://doi.org/10.3390/ph15050614
Turković L, Bočkor L, Ekpenyong O, Silovski T, Lovrić M, Crnković S, Nigović B, Sertić M. Development and Validation of a Novel LC-MS/MS Method for the Simultaneous Determination of Abemaciclib, Palbociclib, Ribociclib, Anastrozole, Letrozole, and Fulvestrant in Plasma Samples: A Prerequisite for Personalized Breast Cancer Treatment. Pharmaceuticals. 2022; 15(5):614. https://doi.org/10.3390/ph15050614
Chicago/Turabian StyleTurković, Lu, Luka Bočkor, Oscar Ekpenyong, Tajana Silovski, Mila Lovrić, Slaven Crnković, Biljana Nigović, and Miranda Sertić. 2022. "Development and Validation of a Novel LC-MS/MS Method for the Simultaneous Determination of Abemaciclib, Palbociclib, Ribociclib, Anastrozole, Letrozole, and Fulvestrant in Plasma Samples: A Prerequisite for Personalized Breast Cancer Treatment" Pharmaceuticals 15, no. 5: 614. https://doi.org/10.3390/ph15050614
APA StyleTurković, L., Bočkor, L., Ekpenyong, O., Silovski, T., Lovrić, M., Crnković, S., Nigović, B., & Sertić, M. (2022). Development and Validation of a Novel LC-MS/MS Method for the Simultaneous Determination of Abemaciclib, Palbociclib, Ribociclib, Anastrozole, Letrozole, and Fulvestrant in Plasma Samples: A Prerequisite for Personalized Breast Cancer Treatment. Pharmaceuticals, 15(5), 614. https://doi.org/10.3390/ph15050614